

TigerSoft and Peerless Daily
Hotline
www.TIGERSOFTWARE.COM/551214HL/index.htm
(C) 1985-2014
William Schmidt, Ph.D. www.tigersoft.com
All rights strictly reserved.
Tiger
Software 858-273-5900 PO Box 22784 San Diego, CA
92192
Email william_schmidt@hotmail.com
Hotline will change Sunday night.
Look for an email from us this Friday.

-----------------------------------------------------------------------------------------------------------------------
Previous Hotlines - http://tigersoftware.com/555HL555/index.htm
10/9/2014 - 11/21/2014
http://tigersoftware.com/9933Hot/ 9/2/2014 - 10/8/2014-
http://tigersoftware.com/2233HL/index.html
6/25/2013-9/1/2014
http://tigersoftware.com/112211-H/index.htm 11/22/2013-3/20/2014
http://tigersoft.com/1111-HL/index.html
10/22/2013-11/21/2013
Past Hotline Predictions http://tigersoft.com/-HL42013/index.html
http://www.tigersoft.com/-2GBL13HL/index.htm
----------------------------------------------------------------------------------------------------------------------
PLEASE...Sharing this hotline address with non-subscribers is a violation of our contract
with you and a violation of copyright laws. I work hard for you. Respect that
effort!
---> To
renew this Hotline, order
here $350 (check) - $360(Visa/MC)
www.tigersoft.com/-2GBL13HL/index.htm
--------------------------------------------------------------------------------------------------------------------
A Guide To Profitably Using The
Tiger Nightly HOTLINE
Peerless Signals: 1915-2013
New Peerless
Signals and DJI Charts - version 7/4/2013
1965 1965-6
1966
1966-7
1967
1967-8
1968
1968-9
1969
1969-70
1970
1970-1 1971
1971-2
1972
1972-3
1973
1973-4
1974
1974-5
1975
1975-6
1976
1976-7
1977 1977-1978
1978 1978-79
1979
1979-80
1980
1980-1
1981
1981-2
1982
1982-1983
1983
1983-1984
1984 1984-1985
1985 1985-1986
1986 1986-1987
1987
1987-8
1988 1988-9
1989
1989-90
1990 1990-1
1991
1991-2
1992
1992-3
1993
1993-4
1994
1994-5
1995
1995-1996
1996
1996-7
1997
1997-8
1998
1998-1999
1999
1999-2000
2000
2000-1
2001
2001-2
2002
2002-3
2003
2003-4
2004
2004-5
2005
2005-6
2006
2006-7
2007
2007-8
2008
2008-9
2009
2009-10
2010
2010-11
2011
2011-12
2012
2012-2013
Background and New Studies
------------------------
Announcements
--------------------------------
New E-Books
1 The On-Line Explosive Stocks
is finished.
2 The On-Line Killer Short
Sales book is also finished, but
will be re-edited this coming week.
I call your attention now to the many new concepts and
the considerable new research in them: For example:
1) A very good New Tiger Buy B12 for Low Priced Stocks (1)
2) After Red high volume reversal days use CP uptrend-breaks.
3) Buy the stocks the Federal Govt wants you to buy. (1)
4) 100-Day Power Rankings... (1)
5) Using Closing Power Hooks after Buy B26s and B20s. (1)
6) How A Stock Reacts to Its Earnings Report Is Very important. (1)
7) TigerSoft Major Buy Signals' Combinations
Which are most Powerful? Reliable? (1)
8) Augmented Buy B20s' Independent Success Rate. (1)
9) What factors warn a rising 65-dma will not hold? (2)
10) The classic cluster of technical characteristics that commonly appear
in the 23 stocks falling 70% or more in the deep pullback of 2011. (2)
Purchase each all new book by CC for $42.50 or send a check
for $37.50 to me: William Schmidt, 5970 Gullstrand St., San Diego, CA 92122.
Introduction to
Tiger/Peerless Buys and Sells.
new
Sept 2014 Peerless
Buy and Sell Signals
Different Types of
TigerSoft/Peerless CHARTS, Signals and Indicators
Documentation for
TigerSoft Automatic and Optimized Signals.
How reliable support is the
DJI's rising 200-day ma?
SPY Charts since 1994: Advisory Closing Power S7s, Accum. Index, 65-dma, Optimized Signals.
"The Jig Is
Up": Calling September and October Tops.
A Keynesian's Warning
Signs.
NUGT since 2012: A study of Tiger Technicals
new
Tiger Day
Traders Tool and most active Triple Leveraged ETFs
Advisory Pink Closing Power
S7s at ETF at top since 1994
1994 1996 1997 1998 1999
2000 QQQ SPY
DIA 2002
2007
2008
SPY 2011
2013-2014
Tiger Buy and Sell Signals: New 2014 Research:
These are randomly chosen groups.
but clearly we need to back-test them in more years.
You can replicate or do similar studies yourself
for other signals and/or other years.
9/1/2014 - 2014 Tiger B19s -
Steady rallying and no pullbacks below the 21-day ma.
9/2/2014 - 2014
Tiger B17s on 14As taken alphabetically
9/3/2014 - 2014 Tiger B17s on 60
Biotechs taken alphabetically
9/4/2014 - 2014 Tiger B18s on all
"R" stocks taken alphabetically
*
9/8/2014 - 2014 Tiger B20s
- Conclusion: Use Closing Power trendbreaks in aftermath.
9/8/2014 - 2014 Tiger B16s
- Conclusion: Use mostly when LA/MA under 1.05.
9/11/2014 - 2014
Tiger B15s - Conclusion: Certain conditions
improved the results dramatically.
9/12/2014 - 2014 Tiger B25s -
Conclusion: 87.5% success rate when other internals are
positive.
9/15/2014 - 2014 Tiger B25s
- Best conditions for using B25s with somewhat higher RSX
capitalization stocks.
9/16/2014 - New Tiger Closing Power Take-Off Buy Signal in 2014: 14s, QQQ,
DJI-30 and ETFs
9/17/2014 - New Tiger Closing Power Take-Off Buy Signal: 2009A-s
9/18/2014 - New Tiger Closing Power Take-Off Buy Signal: 2010A-s
9/21/2014 - New Tiger Augmented Sell
S8s: DJI-30 - 2014
Requiring S8s to show Negative CP%-Pr and IP21<+.15 produced a 70% success rate
in a rising market. for DJI-30 stocks and big ETFs.
9/24/2014 - Tiger Sell S14s: They make price breakdowns very bearish.
1/15/2014 - Tiger Day Traders' Tool Explained, More
Examples.
http://www.tigersoft.com/day-traders/index.html
http://www.tigersoft.com/Indicators/index.htm
http://www.tigersoftware.com/TigerBlogs/Aug-31-2009/index.html
The New 2014 Peerless.exe Software has now been posted on the Eli te Stock Professional
Page.
---> To Previous Hotlines
=====================================================================================
NIGHTLY HOTLINE
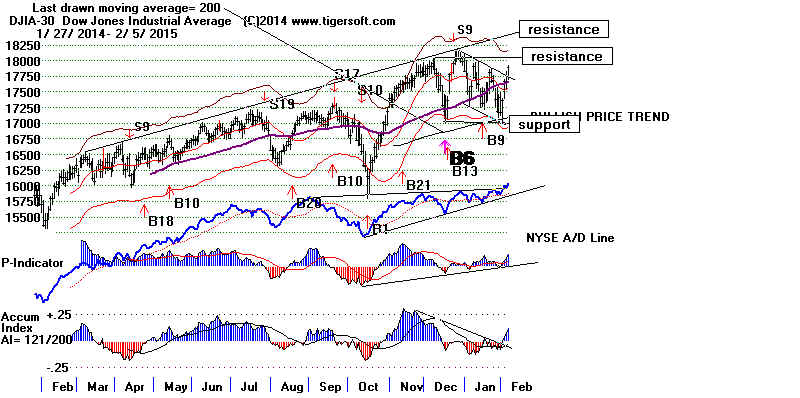
2/6/2015 Peerless Buy B9 But a
trading range between 17000
and
18000 must, I think, be assumed, until the DJI, the SP-500 and
the
NASDAQ can breakout above their well-tested flat resistance
lines. Crude Oil keeps rising, but Gold got clipped
by how the Jobs'
Report seems to have made a Fed Rate hike more likely. Gold
and
NUGT should return to favor if Greece starts to default on its
debts
and
if the Euro's future is thereby called into question.
The Dollar
has
started another surge. The Biggest importing Retailers would
seem
to be the biggest beneficiaries as long as Crude Oil does not
rise
too much.
With
the ratio of NASDAQ new highs to lows still low and the ratio lower
than
the comparable NYSE ratio, traders should consider employing the
numerous short-term Tiger trading tools. See the Documents
I posted
for Tiger Users at our San Diego meeting this weekend.
I will be posting
more
materials and some new programs for very short-term traders later
this
coming week. (For example, one of our local Tigers thought it would
be
handy to see statistics on how a stock or a group of stocks behave after an
opening,
say, one percent above or below the previous close. Great idea.)
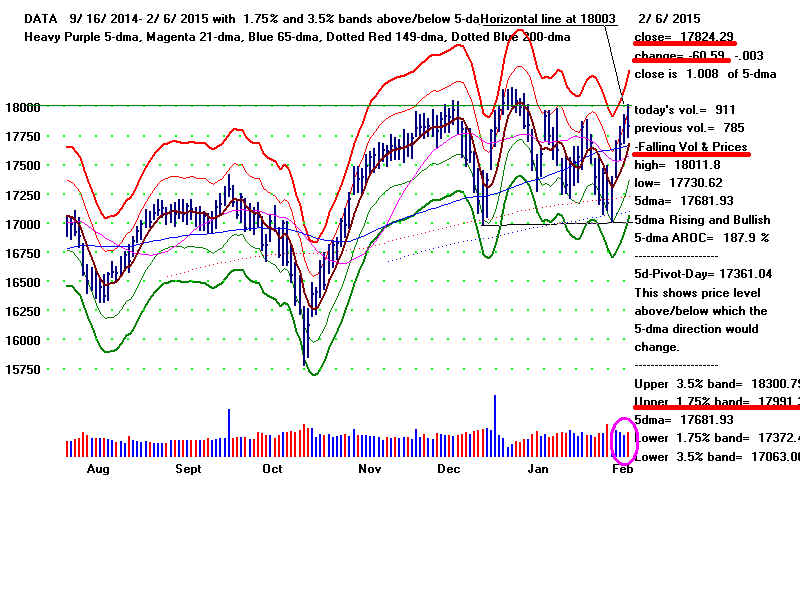
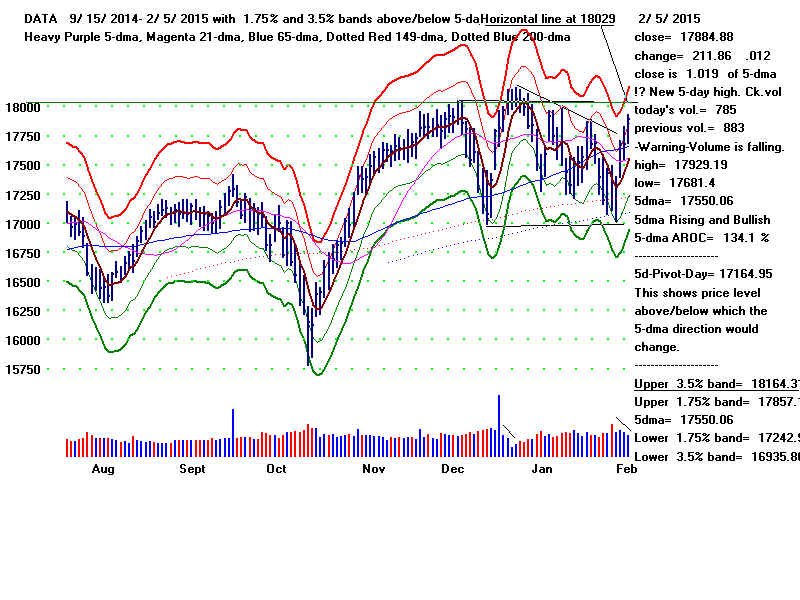
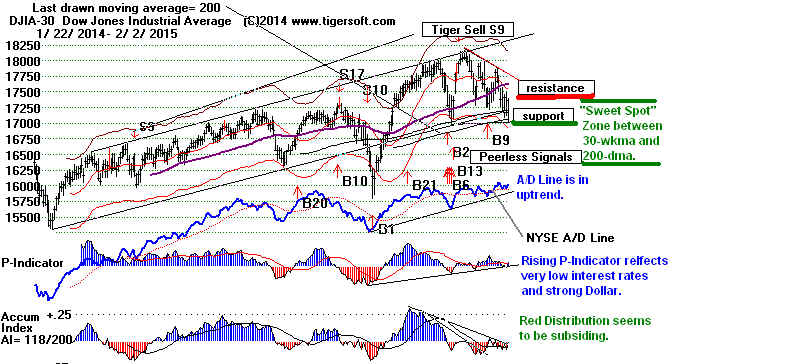
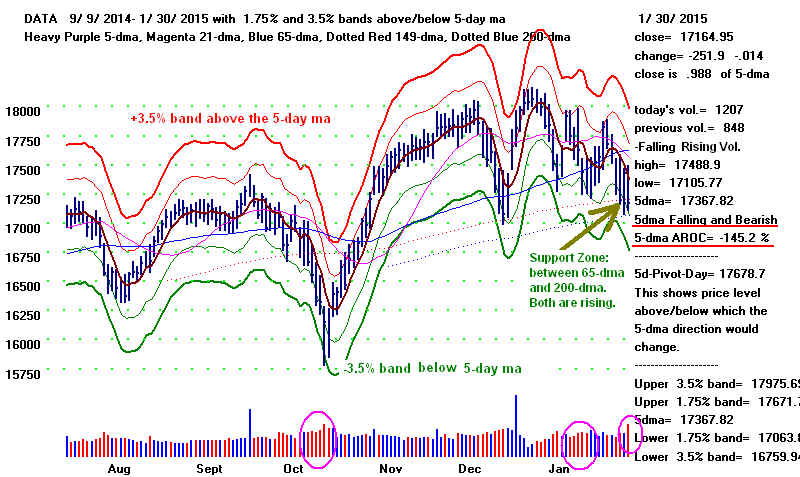
A retreat from the 17900-18000 resistance in the the DJI seems a reasonable
prediction. See below how (red) down-day volume was higher than the
(blue)
volume on its two previous up-days.
The Effects of The Jobs' Report
Just
look at how the market reacted on Friday to a really
super January Jobs
report that boosted the jobs' numbers very
significantly for last November and
December, too. I would ask if the stock market cannot go up on such very good
economic
news,
what will it do if news is not so good? How the market reacts to seemingly
very
bullish or very bearish news is often a very good clue about its futures
intentions.
The
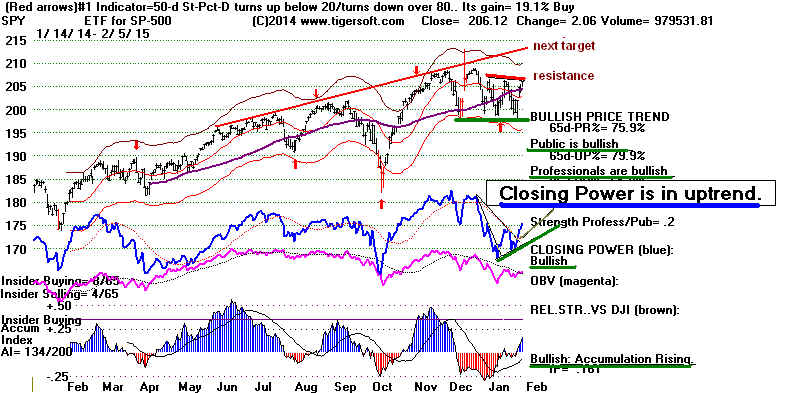
Closing Powers are still rising for DIA, SPY and QQQ. Perhaps,
Friday's
selling will not stop the DJI from reaching 18000. We must watch to
see
whether Professionals become net sellers next week. This is why we
watch
the Closing Powers.
Why would traders sell on such good economic news?
First, the DJI, NASDAQ, SP-500 have reached well-tested flat
resistance.
Flat
DJI trading ranges have often lasted 8 months. See the set of materials
I presented for the Tiger User Group meeting on Saturday.
Second, short-term trading is growing as a percentage of all volume
and
Professionals need to lock in profits when they have them.
Third, the stock market has been anticipating 5% unemployment again
for a
long time. That is why it has been rising, after all, for five years.
This
is the FED's full employment goal.
Fourth, and most important, the good Jobs' Report now gives the FED
an
excuse to raise rates, especially now that wages are starting
to
rise faster than productivity. See the TNX chart of
rates on the
10-year Treasuries. The big jump in rates on Friday spooked many
over-extended REITs. With a rate hike over-hanging the market
sometime this Summer, or maybe sooner now, many dividend stocks
will
now have a much harder time rallying. We must watch the NYSE
A/D
Line for signs of new selling in the many dividend stocks there.
Mining stocks also got clobbered at the prospects of higher interest rates
and a
stronger Dollar.
The Friends of A Strong Dollar Stocks
Liked Friday's Economic News
Not
all stock groups turned down on Friday. A very strong Dollar
is a
real boost to bank stocks. The real mission of the FED is, after all,
to
make the big banks that run the FED maximally profitable. Raising rates
lifts
the Dollar, thereby making hot foreign money seek the US as
a
haven against local falling currencies. In addition, a strong Dollar increases
the
world's dependence on US financing and US financial institutions,
much
to Wall Street's delight.
But
Big Bank stocks may not be helped as much as by the prospects
a
Stronger Dollar as Big Retail stocks are who can thereby buy foreign
goods
more cheaply for their stores. This is because the prospects of a
Greek
default on its debt raises all sorts of dangerous possibilities and
precedents for Europe and also for US banks who own the bonds of Greece,
Spain
and Italy. Higher rates would hurt consumers more if the big banks
has
passed on their own cheap borrowing costs to consumers. But they
have
not. Meanwhile, the still very low oil prices have put an estimated
$100
billion more in American consumers' pockets since last Summer.
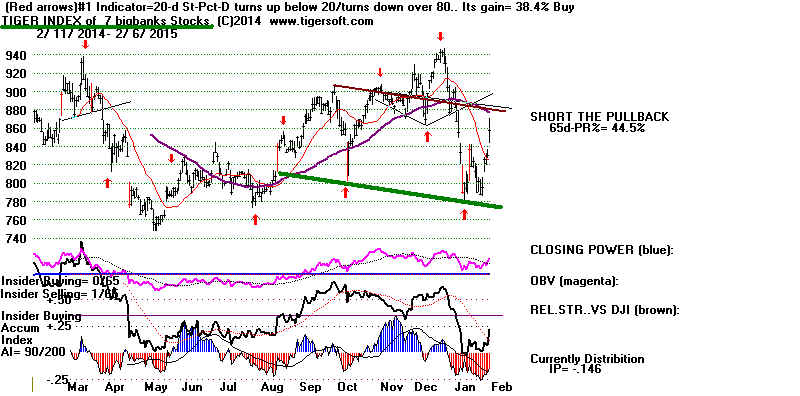
Tiger Index of Big Banks
 |
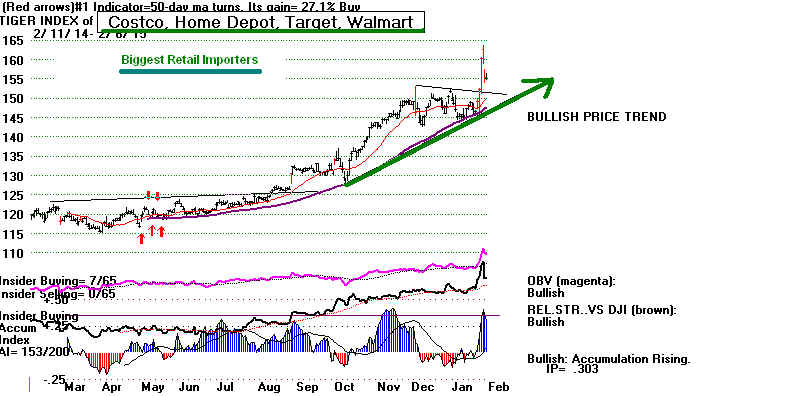
Tiger Index of Four Biggest Importing Retailers:
Wal-Mart, Target, Costco and Home Depot
 |
================================================================
OLDER HOTLINES
================================================================
2/5/2015 Peerless Buy B9 The DJI seems headed for 18000.
The
NYSE Volume has fallen for two days, so the Jobs Report tomorrow may
not
be positive enough to let the DJI get past this round number resistance.
When looking at the Jobs' numbers for January, we want to compare
the
most recent number with December's +252,200. The
most
recent 3 months have averaged 289,000. See Jobs Report A
number
lower
than 235,000 would be a sign that the economy is slowing down.
This
is something a market nearly at 18,000 cannot, I think, afford to see.
The budget battle between the austerity-minded Congress and the
pro-public works President could cause the market to reverse later in February.
But
as long as the Closing Power for SPY is rising, Professionals are
still
bullish. So, should we be.
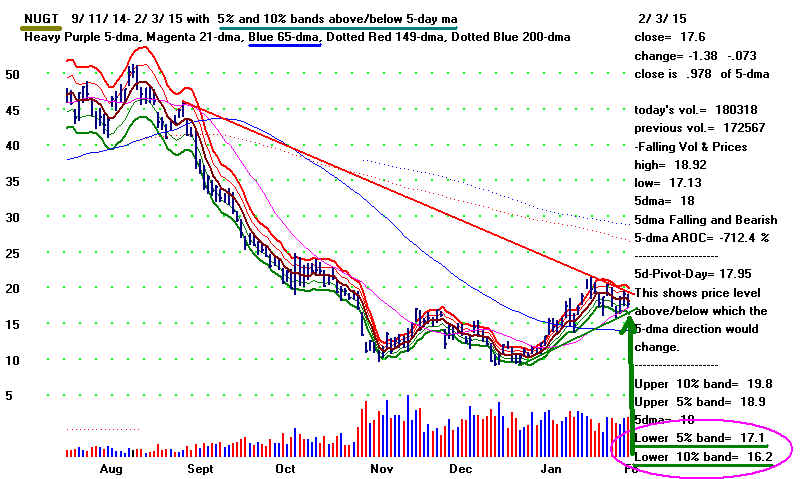
Meanwhile, I expect QQQ, Crude
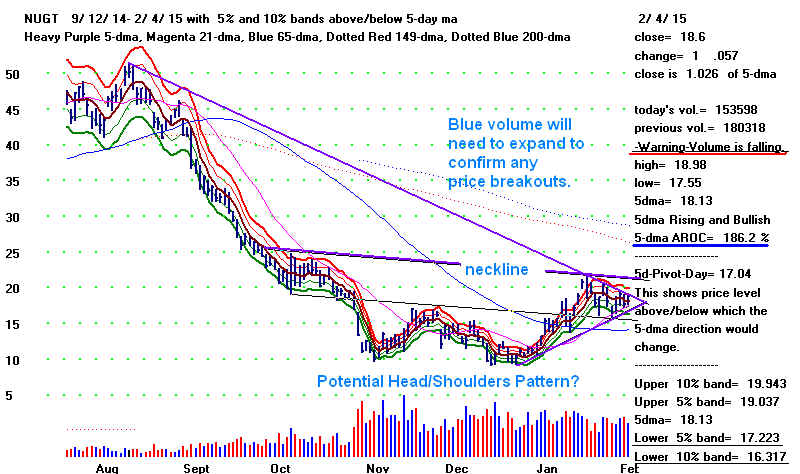
Oil and NUGT to continue to rise. NUGT
slightly broke its well-tested 6-month downtrend. Now we get to see if
if
can surpass 21 and complete a very bullish looking inverted
head/shoulders. Volume will need to pick up to accomplish this.
Breadth has been excellent. We see this in the increasing number
of
industry groups having 60% or more of their stocks above the
65-day ma: Autos 65%. Biotechs 64%. Bonds 98%. Chemicals 76%.
Computers 71%. DJI-30 50%. Mining 75%. Home-Building 80%.
Military 75%. Reits 89%. Retail 74%. Russell-1000 63%.
Semi-Conductors 65%. Software 67%. Solar 65%. SP-500 60%.
Domestic/Foreign Utilities 63%. The ratio of new highs
to new lows
remains much higher on the NYSE. So, this is far from a speculative
market.
That
should give the market considerably more upside if policy-makers in
Washington do not repeat the austerity mistakes of Europe in the
last
few years and the US in 1937 AND provided the Obama Administration
does
not keep poking the motherly Russian bear too much for
protecting Russian speaking separtists in SE Ukraine from attacks by the
Ukrainian government the US played a big role in setting up.
================================================================
OLDER HOTLINES
2/4/2015 Peerless Buy B9 The DJI seems headed for 18000.
The
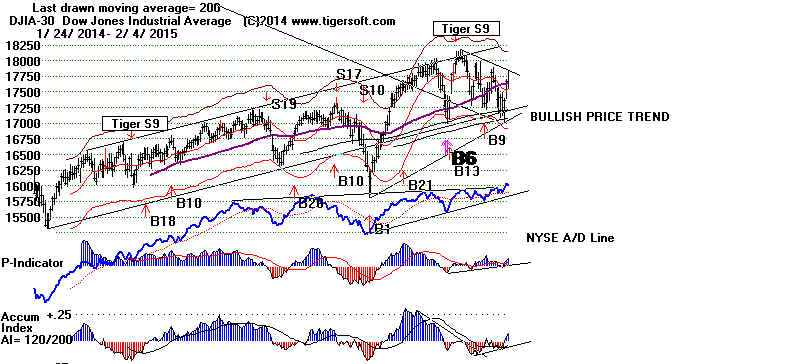
DJI got back above its rising 65-dma. We have to be
impressed
with
the new high made by the A/D Line. Our Accum. Index (IP21)
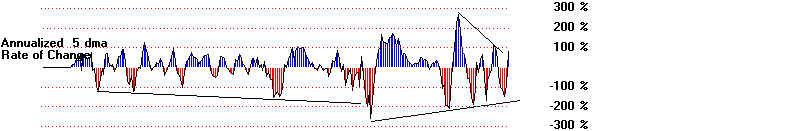
has
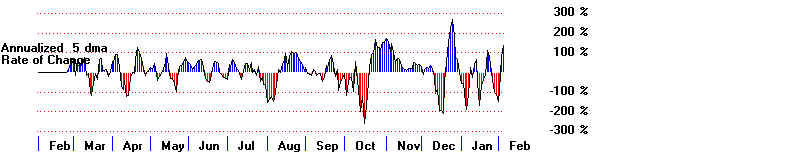
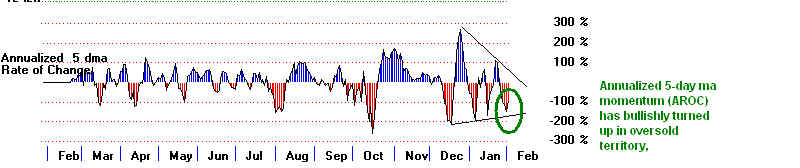
made a new recovery high. The 5-day ma ANROC momentum
indicator continues to rise. Higher prices should follow, but it's not
clear
if there is enough volume for the DJI to get past its 17850
short-term resistance at its 6 month down-trendline.
We will need a big increase in volume to eat up the over-head supply of
stock
there and at the recent peaks in the other indexes and ETFs.
DJI
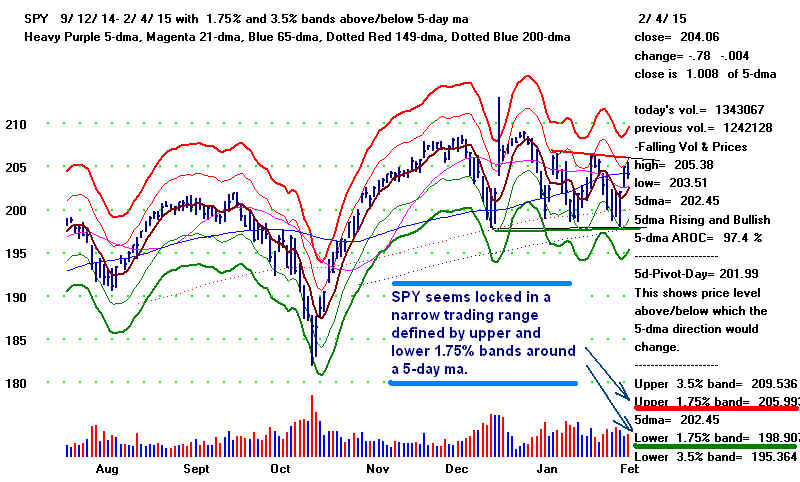
should reach 18000. SPY seems to be trapped in a range of
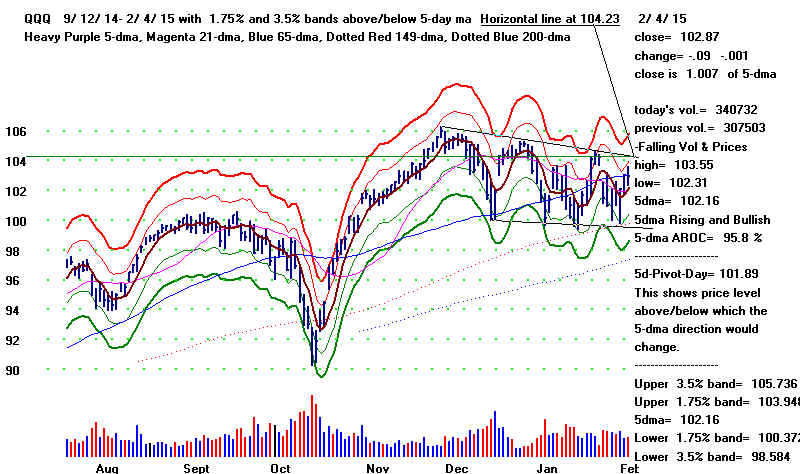
bounded by its 1.5% upper and lower bands, 199 - 206. QQQ's
range
using these parameters is 100-106.
NUGT and CRUDE OIL
We
want to watch NUGT for a possible breakout past its 6-month price
downtrendline. This will take more upside-day (blue) volume, too.
There
is a good chance here, I think, that a breakout above the 6-month
down-trendline will lead to a breaking then of the overhead neckline,
thus
completing a bullish inverted head/shoulders. This should send NUGT
much
higher. I would think that a rupture in the Greece-EURO negotiations
would
be a catalyst for this. So might more US intervention in SE Ukraine.
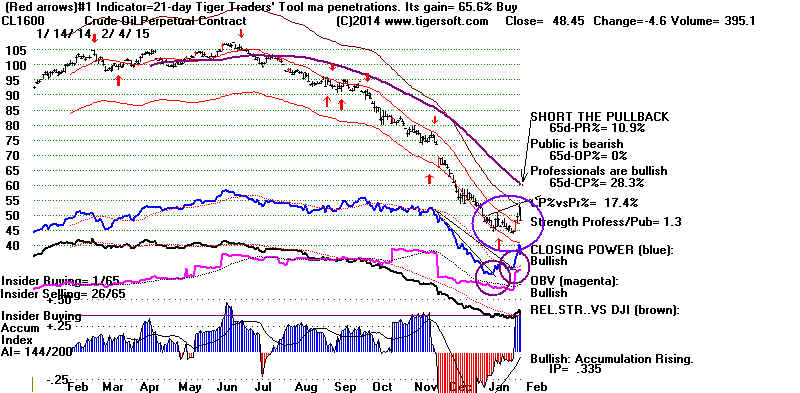
Despite Crude Oil's big drop today, I suspect we have seen the bottom.
If
you own it, you may want to see the price recoveries that were made after
other
earlier bottoms. The break by the TigerSoft Closing Power is
the
key here. It would take more of a rally and then a reversal pattern to
get
me to think we will see significantly lower prices. See our study.
-------------------------------------------------------------------------------------------------------------------------------
OLDER HOTMAIL
-------------------------------------------------------------------------------------------------------------------------------
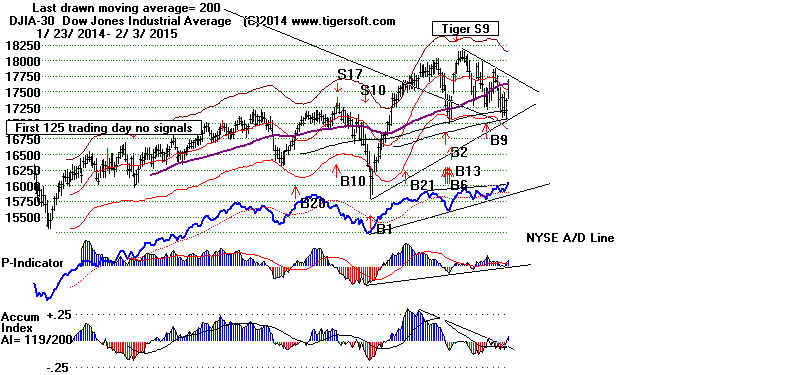
2/3/2015 Peerless Buy B9 After more backing and filling, the
DJI
should reach 18000. Since 1980, recoveries by Crude Oil like
the
one now mostly cause the DJI to go sidewise.
Today
the ratio of NYSE advances to declines rose to 3.8:1. This elevates
the
probability to 75% of a rally by the DJI back to 18000, if we trust
comparable rebounds and breadth ratios in the first two days of the
turn-arounds since 2009. (See earlier Study.) Even so, more
backing and
filling seems probable.
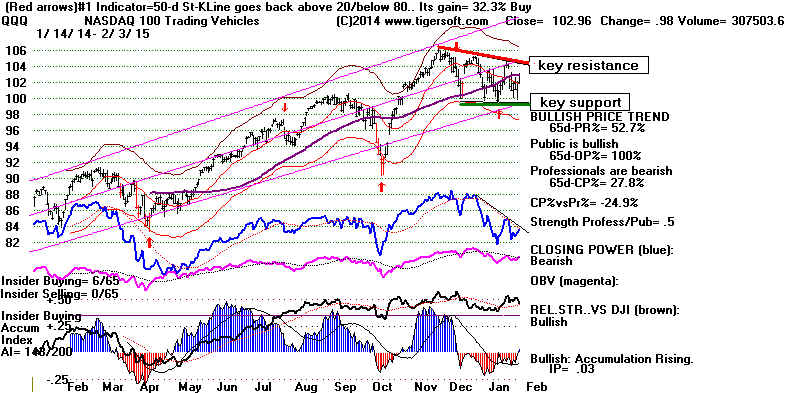
Though Biotechs were weak today, I believe QQQ is
a good play now.
It
must, however, get past two resistance lines, price and Closing Power
and,
of course, not rupture its well-tested support.
QQQ now needs to surpass its price and CP downtrendlines.
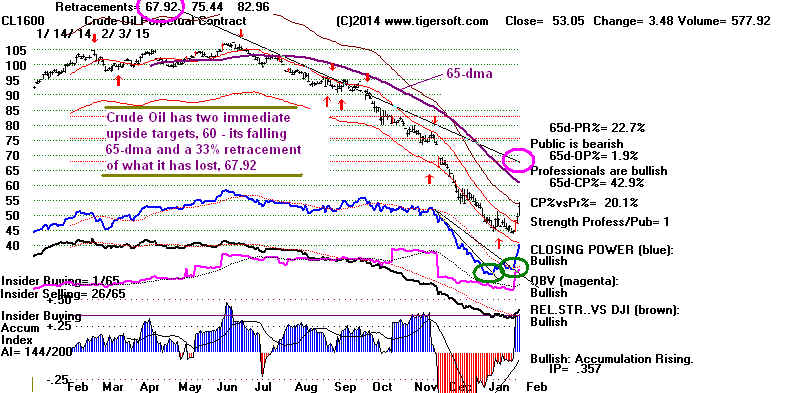
Rising Crude Oil and Hopes That
The Greek Government Will Not Default on Its Debt
Have Boosted the DJI +3.4% in The Last Two Day.
The break in the Closing Power
downtrendline has once again forewarned
of a bottom in Crude Oil. The falling 65-dma 10% higher would
seem to be
its
natural target now. That should continue to boost XOM and CVX in
the
DJI. This is the NY Times story that might be causing Oil to rise.
Saudi Oil Is Seen as Lever to Pry Russian Support From Syria's Assad
By
MARK MAZZETTI, ERIC SCHMITT and DAVID D. KIRKPATRICK
Talks have centered on persuading
President Vladimir V. Putin to stop backing the Syrian president, officials said,
in return for moves to raise the price of oil, which could bolster Russia's economy.
The Basis of The Bank Stocks' Rally Seems Uncertain
The big bank stocks in the DJI-30 have been the other
big two-day gainers.
The
news is that the European bankers and the new Greek Government are
still
talking about ways to prevent a default on Greek Government debt,
something which would be costly to big bankers in the US, too, especially
if
Greece then left the Euro zone and on it own got back on its financial feet
after
a sizeable currency devaluation. If that were to happen, Spain and
even
Italy might elect to follow Greece's course. Back
in 2008, this is path
that
Iceland took. Iceland survived and recovered without the need to follow
the
crippling austerity demands that would otherwise have been forced on it by
big
banks and the IMF.
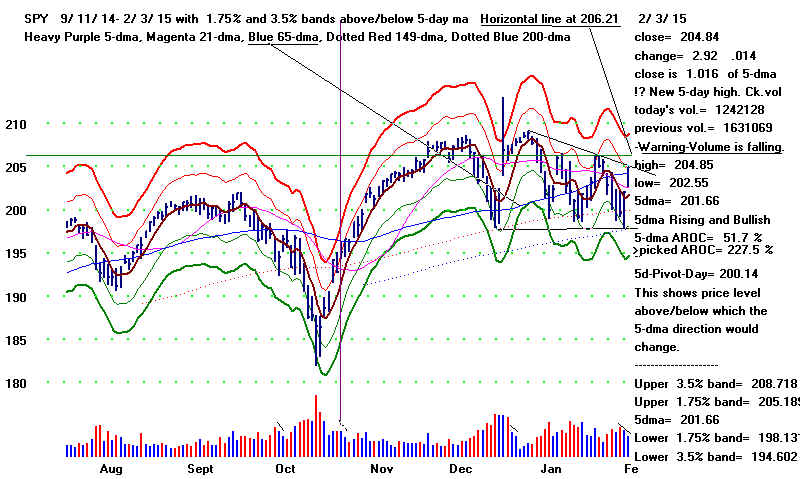
Seasonal and Technical Problems
Seasonality is not so bullish. Since 1965, the DJI has risen only 52.2%
of
the time over the next week. And despite the big jump today, volume
was
lower today than it was yesterday. It would also be more bullish if SPY
was
facing its downtrend-line resistance and the (blue) 65-dma below
with
more
short-term upward momentum. See in the chart below how the 5-day
ma is rising only at an annualized 51.7% rate. Back in
September last year
when
SPY reached the rose above it, the 5-dma AROC was four times higher.
"Clinching" Has Become Too
Expensive"
Trading General Market ETFs.
It sure seems that we
can no longer afford to wait for one or more
of our
short-term indicators to turn up to turn upto clinch a Peerless
Buy signal.
I think we'll have to buy at price support, like the "sweet
spot"
between the 30-week ma and 200-day ma, when a Peerless
signal is
operatiove or has occurred and place stop sell order 1%
or 2%
below. The +3.4% gap up between 2:00 PM EST Monday
and the
opening Tuesday just makes too expensive waiting for
indicators
like like the 5-day ma ANROC momentum, 6-day Inverters'
Traders
Index or even the Closing Power to turn up.
NUGT Trading
The
3x-leveraged ETF, NUGT, failed to get past its 6-month downtrendline.
But a
declining dollar and rising oil prices should be a boost for Gold.
NUGT
can be traded by buying it back to its lower 5% band and 10% bands
around its 5-day ma. As long as it is above its (blue) 65-dma in the 6-month
chart
below, I think this offers much more upside potential than downside risk.
================================================================
OLDER HOTLINES
================================================================
2/2/2015 Peerless
Buy B9 Buy QQQ, Crude Oil and NUGT.
The DJI bounced up 200 in the last hour after successfully testing 17000,
its rising 200-day ma and the rising 149-day ma for most of the day. Today's
ratio of NYSE advances to declines, 2.68:1, was not quite strong enough by
itself to cause us to trust the rebound.
(My study of the successful reversals since 2009 suggests a
ratio of 3:1
is the minimum needed to get a 75% degree of confidence
that the DJI
will rally up to the upper band or higher. )
More evidence of a significant reversal
from the 17000 support level
apart from the rising A/D Line would be a big help here. For that
I would trust that the 5-day AROC momentum tool has turned up.
Though only a short-term tool, you can see below that it has been
reliable this past year. So, the late rally today should continue.
(This tool is now available for
downloading on the Tiger ESP Page.)
DJI has rebounded from "Sweet Spot"
It still may not get past the downtrending
resistance now at 17750.
Tomorrow I would expect to see the
breaking of the downtrend-lines
in the Closing Power for DIA, SPY, QQQ
and FAS. They did turn up
today already. Such CP down-trend breaks would confirm the
market's turn-around. But the question would remain:
How much of a rally can we get when
the leadership consists
of bonds, REITs and ETFs, especially as recent rallies have all been
quickly snuffed out?
In this environment, we must watch the
daily volume closely for
the general market and for these key ETFs'. Volume
that rises day-
to-day and is higher than the previous down-day's volume is vital
if overhead resistance is to be eaten up. Without it, the next rally
will probably not be more than 3% and the resistance line in the DJI
chart will probably turn the DJI back downward.
I think we must play QQQ on the long
side now. We may be
pleasantly surprised. The beginning of February last year was
a good time to buy. With 17000 support holding up, we have to
play the long side now. But we can do more now than simply
"hold and hope" for a decent rally.
Our new 150-day volume charts for DIA,
SPY and QQQ (below) show
volume more clearly. We can more easily compare each day's volume
with the previous day's. In addition, we can use the 5-day ma and
its bands to set upside objectives, especially if volume seems to be
waning on a rally. On the other hand, if daily volume rises sharply
on the advance, 18000 on the DJI should again be achieved.
Note that today's up-day volume fell
compared to Friday's down-day
volume for the DJI, DIA and SPY. It did rise for the QQQ. Accordingly,
I would think that QQQ will be the best "long" play now.
Volume rose
very slightly for FAS. See this in the charts below.
Buy Crude Oil and NUGT
More interesting for bulls now
is Crude Oil and our favorite oil stock, APA.
The Gold Mining ETF, NUGT, looks quite appealing too, provided it can
continue to advance on rising volume. APA could soon rise above
its 65-dma, but its volume will need to pick up.
NUGT has a good chance of breaking out over 21 and even surpassing
the neckline in its inverted head/shoulders. So, watch its volume closely.
If that happens, NUGT would then have a target of 35, almost double
current levels.
(See last night's study of how typical the
current Crude Oil bottom
is when compared to its earlier bottoms since
1980.)
-------------------------------------------------------------------------------------------------------------------------------
OLDER HOTLINES
-------------------------------------------------------------------------------------------------------------------------------
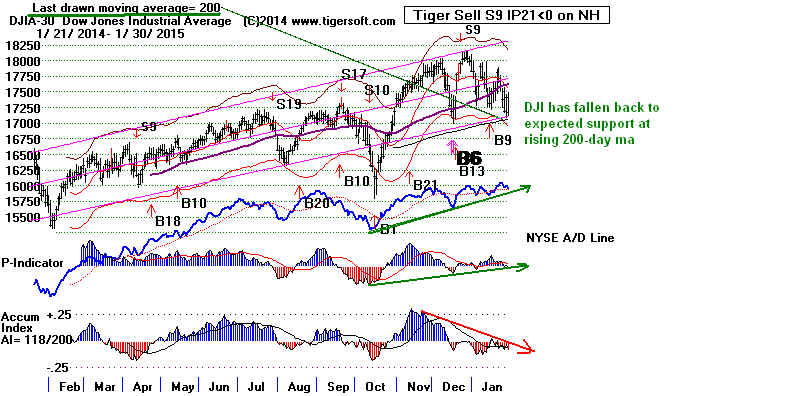
1/30/2015
Peerless Buy B9 The DJI is
testing 17000
and its rising 200-day ma. It closed in the "sweet spot" between
the rising 149-day and 200-day ma. The new 5-day ma annualized
rate of change shows the DJI to be oversold, but the momentum
with this remains quite negative, -145.2%. (See DJI chart below).
With the A/D Line still in an uptrend, we would normally expect
an upwards reversal from 17000. Breadth of better than 3:1
on the upside will be needed to make such a reversal look
credible and compelling now.
The main problem now is how each recent rally has quickly been
snuffed out. How much upside potential is there? Wouldn't
it be better to see the current price-downtrends be broken.
Another problem: the DJI has now gone almost 6 years without a
decline of more than 17%. We have to expect selling in blue chips
by long-term investors when these stocks individually break their
long uptrends.
Next problem: when rallies are led by defensive stocks, bonds,
REITs and utilities, how safe can more speculative stocks be?
Technically, there remains the problems of all the recent red Distribution,
the many Tiger Sell S9s on so many key charts and the steadily
heavy red down-day volume in DIA and SPY.
One might consider buying call options on the oversold OEX.
But its CCI is not below 150 (moderately oversold) and the flat
support may still be violated. This would set up a much bigger
decline.
So, taken altogether, I see no
reason to call a bottom until the
Closing Power downtrendlines are broken or the ratio of advances
to declines on the rebound is better than 3:1.
See the heavy red down-day volume in the new TigerSoft 6-month
trading chart of the DJI. (This is the second chart below.) I offer
a new discussion of short-term trading using the 5-day ma with
bands and daily red (down-day) and green (up-day) volume.
6 Month Short Term Trading Chart on DJI
5-day ma with bands and volume at bottom.
Crude Oil's Closing Power has broken its downtrend. Historically,
this is what it takes to make a bottom. See the new study of previous
Crude Oil bottoms and how they similar they are to what has just
occurred when we focus on the break in a long Closing Power
downtrend. See my new Crude Oil study. Some of you may find company's
offering long term options that lock in current crude oil prices. These sound
very interesting.
===============================================================
1/29/2015
Peerless Buy B9. Patience is Needed While We
Wait for the DJI to Move Decisively away from its Holding Pattern.
It Remains To Be See if Wednesday's Break below 17250 was
False. A Re-Test of The 17200 Seems Likely.
Just as I thought might happen, FED Chairwoman Janet
Yellen got busy
at mid-day today in the Senate and denied Wedneday's FOMC pronouncement
that a rate hike would soon occur. As soon as she said this, the DJI and
SP-500 turned up from their 30-wk (149-day) mvg.avgs. It jumped up 176
in the afternoon. The reversal does show that there is support at this level,
now 17188 on the DJI.

But breadth was not as good as its needs be to make
a convincing
turnaround. The ratio of NYSE advances to declines
today was only about 2:1.
For the last five years,
reliable reversals occur when this ratio is more than 3.0:1.
In addition, note that the Closing Power down-trends for DIA,
SPY, FAS and
QQQ remain intact. Professionals remain net bearish.
Thus, a re-test of 17200 seems likely. Moreover, there remains a good chance
that the DJI will lead lower the other averages and the A/D Line. After all, this
is January when a number of significant declines started. (See the list last night.)
And trying to get into the minds of other investors, we can imagine that a
continued slide in the DJI would put a lot of pressure on long-term investors
to lock in long-term profits.
In light of the NASDAQ-100, MDY
and IWM being stronger than the DJI-30,
we should probably require a much more decisive breakdown of the 17200
DJI-support before selling many smaller stocks. Meanwhile, the pro-Super
Dollar stance of the FED will also probably keep REITs, Bonds and Utilities
in their uptrends for a while longer. As we move away from the first of the
year, I expect more and more Bearish MINCP Stocks to
choose from to go
short as hedges.
===============================================================
OLDER HOTLINES
===============================================================
1/28/2015
Can The Peerless Buy B9, Low Interest
Rates and
The Fed's Strong Dollar Policy Prop
A Bull
Market That Is Nearly Six Years Old?
The 200 point sell-off today in the last two hours was due to
FED's re-activation
of its threat to start raising interest rates in June this year. But, perhaps, one
of
the FED's Governors will tomorrow deny such an interpretation of what the FOMC
said today. If you did not sell on today's close, wait for a more decisive
breakdown.
*
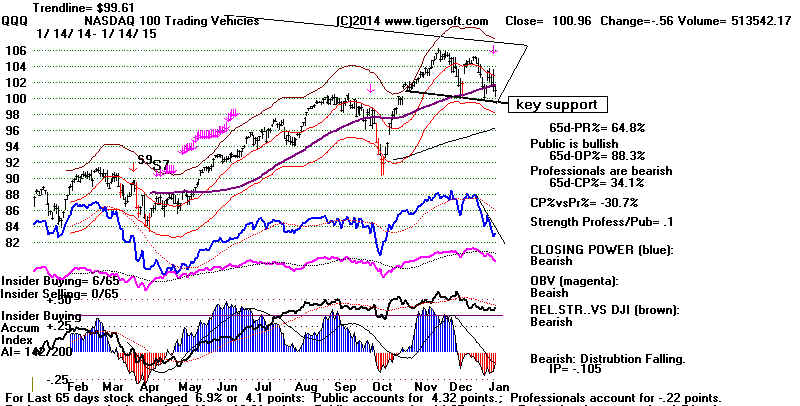
The Closing Powers for all the key ETFs, DIA,
QQQ, SPY, OEX and FAS
are all angling downward. Professionals are still heavy sellers. They did not
even use the occasion of AAPL's super earnings to be net buyers. The
candle-stick charts for today show many bearish all-encompassing red down-days.
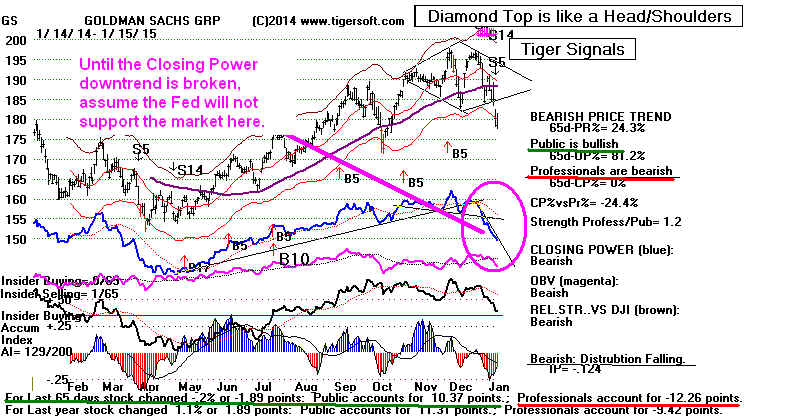
See GS for example.
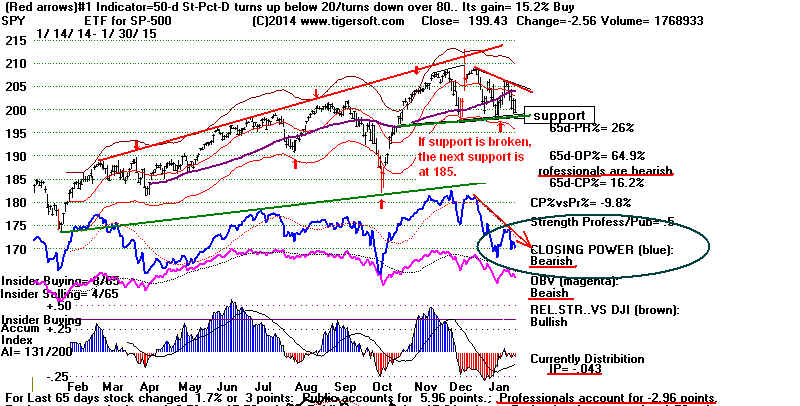
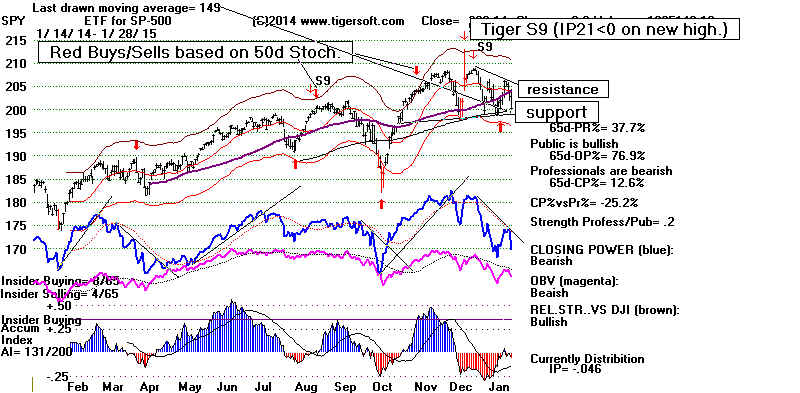
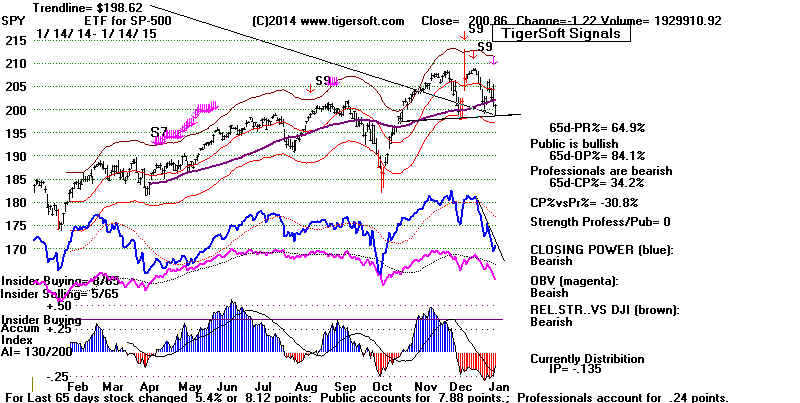
SPY has not yet broken its well-tested
support.
But until Its (Blue) Closing Power breaks above
its falling Downtrend, give SPY a chance to make
clear which way it will move from its narrowing
pattern.
We know from stock market history that Januaries have often been when
bull markets ended and deep declines began. There have been 16 cases in
the 74 years since 1939. Significant DJI support failures in January, thus,
can trigger much deeper declines.
Big January Pivots Downward since 1939
Date Peerless
Signals
DJI % Decline Date of Next Bottom
----------------------------------------------------------------------------------
1/4/1939 S16
11%
4/10/1938
1/9/1941 S12
13.5%
5/1/1941
12/31/1947 S10 a few days later
8.5%
2/11/1948
1/5/1953 S16
9.0%
6/16/1953
12/31/1956 S9/S12
8.0%
2/12/1957
1/5/1960 S12
12.0%
3/9/1960
12/28/1961 S16
Bear Market 6/26/1962
1/18/1966 S12/S4
Bear Market
1/9/1968 S12
9.0%
3/22/1968
1/11/1973 S9/S12
Bear Market
2/31/1976 S16/S4
Bear Market
1/9/1984 S12
15.0%
6/15/1984
1/2/1990 S16/S4
9.5%
1/30/1990
1/4/2000 S9/S12
16.0%
3/7/2000
1/14/2003 S12
15.0%
3/10/2003
12/31/2014 S16
7.5%
2/3/2014
|
Hedging Is Profitable, Too.
All these considerations led me to suggest last night that we should be
"hedging by shorting some bearish MINCP stocks and
closing out
long ETFs on the DIA and QQQ"
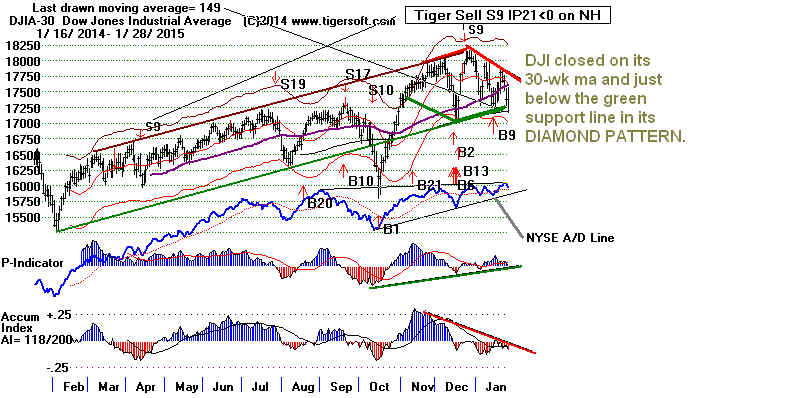
if the DJI closes below the green support
line at 17250 shown below.
The FED Shows Its Highest Prority
Is A Super-Strong Dollar.
The operative Peerless signal is still a Buy B9, but, as of
today, the FED no longer says that it will keep rates at current
levels " for a considerable time". The FOMC's official pronounce-
ments are very carefully crafter. They are telling us that
they want an even stronger Dollar. They are getting ready to
raise rates even though there is DEFLATION in commodities
and fuel prices. Also important, they are willing now to
go on record that economic conditions are getting significantly
better despite December's weak retail sales and falling US exports.
What are they up to? I said last month that they would raise
rates as soon as real avg. wages turned up. They are starting to,
In making the STRONGEST HOME CURRENCY POSSIBLE
their number one priority, as long as their is no immediate financial
crisis, they are following the most important financial orthodoxy of
nearly all central biggest banks everywhere. The FED promotes
Wall Street financial interests. They would have all the world's
financing be done in Dollars if they could. And they are delighted
to have hot foreign money flood into the US bonds and dividend
stocks.
So, until we see the FED promote a different monetary strategy,
what we have seen for the last year should continue. REITs,
BONDs and UTILITIES will be the beneficiaries. Most regular
stocks will do much less well. Some will be hurt badly. Hurt will be
American exporters, manufacturing and agricultural, as well
as companies that sell overseas for mostly local currencies.
The FED seems oblivious of this. That is the risk. And it's
a potentially very big risk. If even even huge blue chips like CAT
and MSFT are finding the FED's strong Dollar something which
hurts their profits, how many more earnings reports in the months
ahead will similarly disappont. Lower earnings' outlooks will
inevitably drop many stocks. That's the risk. Can a stock market
that has risen now for 70 months without anything more than a 17%
correction really be expected to hold up under these conditions?
And what if Congress pursues its own austerity policies? The causes
of the 1937 plunge should be required reading in Washington. But
we are probably doomed to have to relearn vital economic history lessons.
===============================================================
OLDER HOTLINES
===============================================================
1/27/2015 Peerless Buy B9
Buy B9s are reliable and the third year in the
4-year Presidential
cycle is unusually bullish. So, I think most orthodox Peerless traders
will decide just to ride the current decline out. However, hedge
by shorting some bearish MINCP stocks and closing out long
ETFs on the DIA and QQQ if the
DJI closes below the green
support line at 17250 shown below.
Why? Because there were two cases in bull
markets, January 1977
and January 1984, when comparably bullish breadth failed to prevent
significant declines in January In
January 1977, the DJI led the rest of
the stock market into a 15-month bear market after a Sell S16 and
bearish head/shoulders was completed. In January 1984, the DJI
started a 7 month decline from 1200 to 1050. See how it broken below
a well-tested price uptrendline. This reinforced the earlier Sell S12
and ruled out any possible Buy B9s. Compare the current DJI and
A/D Line with these two earlier cases. In particular, see how a breakdown
below a key well-tested support-line launched these two declines.
I consider the DJI's Diamond's support at 17250 to be similar.
As a result, our Stocks' Hotline has added more short short sales as hedges
from among the Bearish MINCPs. We are short nearly
as many stocks
as we are long at this time. Recall how at the end of 2014, I repeatedly
noted how close we came to getting a Sell S16 or a Sell S12, because
of the negative Accumulation Index with the DJI 1.8% over the 21-day
ma. (This is what the Tiger S9 warns of, too.) Had the DJI then risen
another 1/2% higher, we would have gotten a Peerless Sell S12 and this
would also have suppressed the recent Buy B9.
Dividend Plays Do Not Look Vulnerable
The recent B9 is a function of the still very positive breadth and the
still rising A/D Line. This means that big dividend stocks, REITS, BONDS
and UTILITIES are probably safe for now. Cyclical and growth stocks
are much more vulnerable.
Can APPL Save The Market?
AAPL's superb earnings after the close will try on Wednesday
to make up for the DJI's 290 point plunge and big drops today
by MSFT (-4.35), PG (-3.09) and CAT (-6.19). How the market
reacts to APPL's huge earnings will also tell us something
about whether it will now be paying more attention to good or bad
news. If it only responds to bad news, we are in trouble!
But, perhaps, the DJI sell-off today was artificially exacerbated
by the thinner than usual trading today, the result of the East's fierce
snow-storm. A lot now depends on what the Fed' Open Market
Committee reveals about its interest rate intentions and how it
appraises the rising Dollar. In that connection, it is probably
significant that Bank Stocks did not sell off
nearly as badly as the
DJI-30. Strikingly, there were only 382 more down than up on the NYSE.
This hardly matches a day when the DJI falls nearly 290. I would be
surprised if the FED does anything to make the market sell off more.
==============================================================
Older Hotlines
==============================================================
1/26/2015 Peerless Buy B9
Professionals are are cautiously bidding up
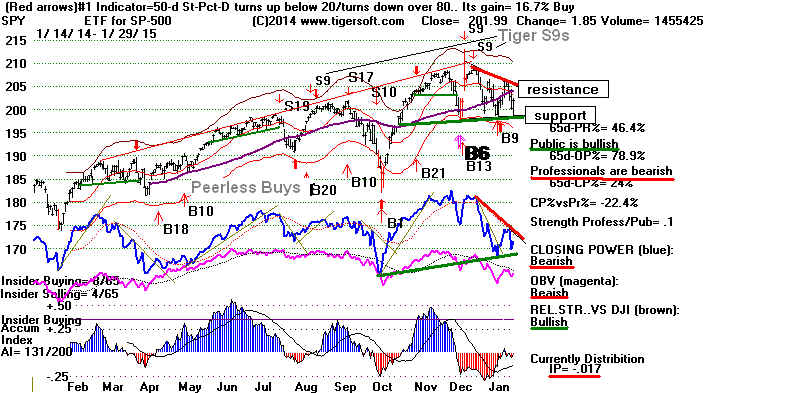
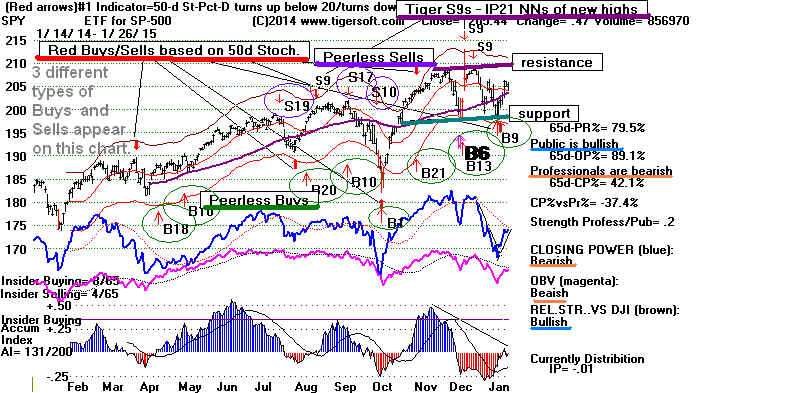
SPY. Red Distrbution is
preventing much of an advance. The recent Peerless Buy B9
was boosted by the red Optimized 50-day Stochastic-Buy.
SPY is now stronger than the DJI and shows a pattern of rising
openngs. It appears to be making its way back up to its resistance
line, having successfully tested its support.
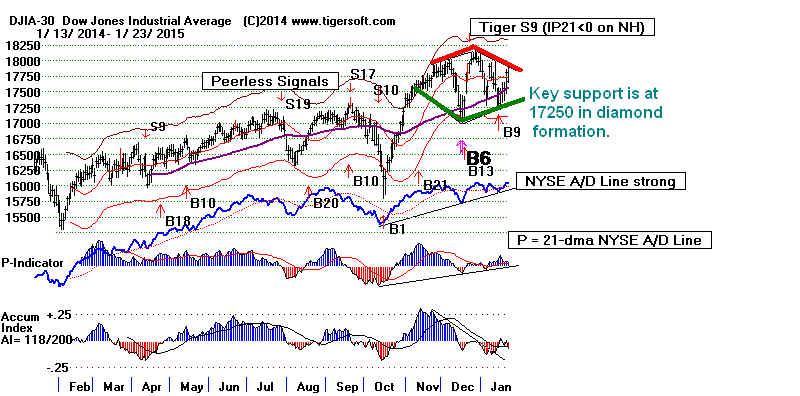
As discussed last night, the DJI is trapped in a DIAMOND
formation.
So, traders are looking for new plays. The 3x Bullish Mining Shares'
ETF NUGT rose 15% above its early morning weakness. It
should
rally back to its recent highs, at least. Biotech Indexes like IBB
and BBH made new highs today.
It may help the bulls to know that the DJI has rallied 67% of the
time since 1965 over the week following January 26th.
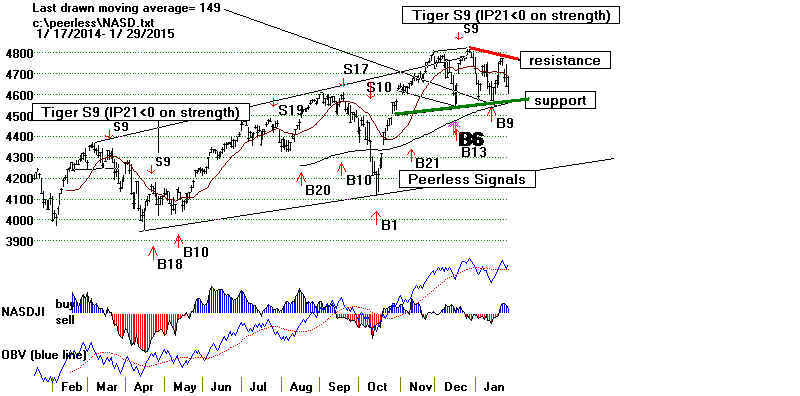
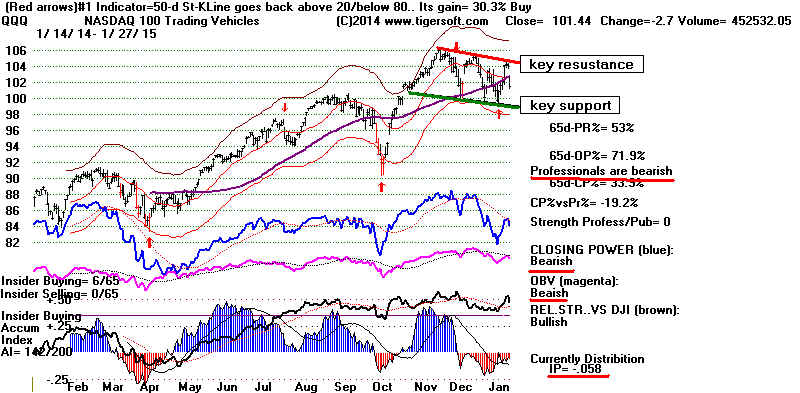
Tomorrow will be important. The QQQ threatens to
breakout above
its trading range's flat resistance. AAPL reports its
earnings late Tuesday.
Its earnings are expected to jump up sharply from the previous year. One
would think this could breakout QQQ. Without AAPL, the earnings
for the SP-500 would be almost flat. So, AAPL is very important
"APPLE
EARNINGS PREVIEW: Get Ready For The Big One"
The Dividend Plays Still Look Good.
The NYSE A/D Line made a new high today.
Biotechs, Semi-conductors
and Mining Stocks rose, but most of strength continues to be in the
dividend plays, REITS, BONDS and UTLITIES. As long as the Dollar
remains strong and interest rates stay so low, it's not clear why there
dividend plays would weaken. A few years ago, when bonds did get weak
we saw a head/shoulders pattern in the Tiger Index of Bonds and mounting
red Distribution.
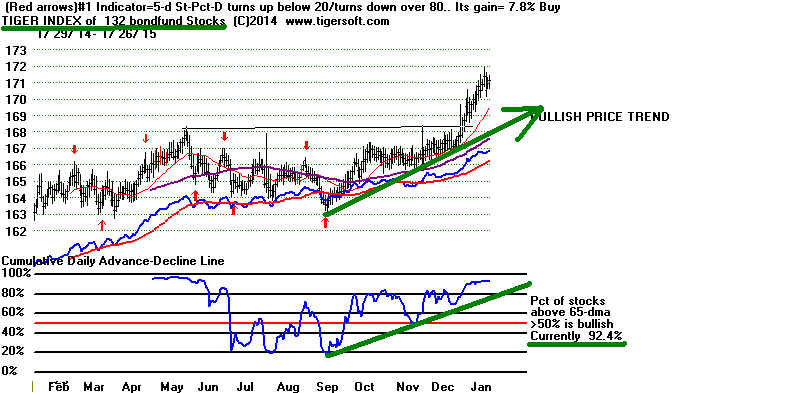
The composite Tiger Bond fund index now is rising
and shows much more
internal strength than the last time Reits, Bonds and Utilites fell 10% to 20%,
which was back in 2013. Contrast the Tiger Bond fund's chart now with the
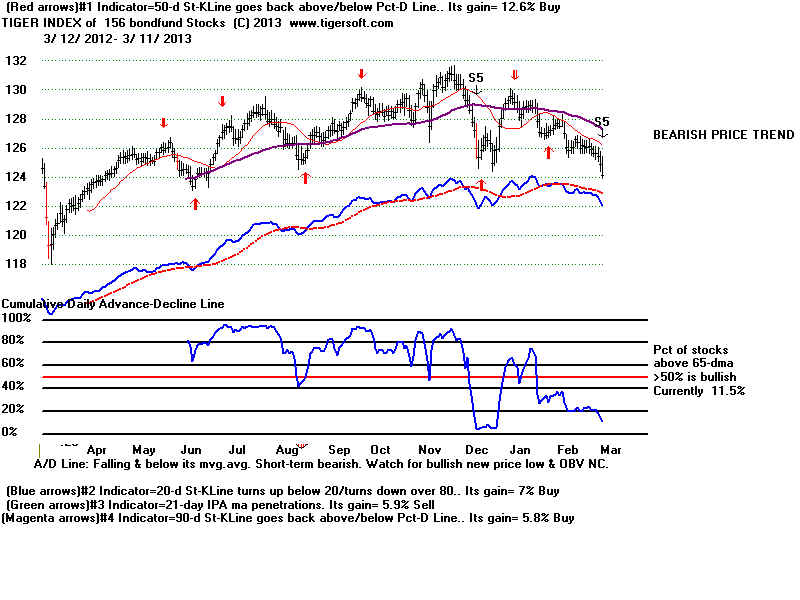
way it topped out in March 2013.
Tiger Bond Fund Index - 2014-2015
|
Tiger Bond Fund Index -
2012-2013
Just before a nig Decline in Dividend Plays
Timetable: 3/11/2013 Tiger Bond Fund completes bearish head/shoulders pattern
and shows Heavy Red Distribution.
May 2013 Municipal Bonds break down below their 65-dma and typically decline
10% over the next 4 months.
May 2013 REITs suddenly reverse swift and fall 17% over next 4 months.
|
--------------------------------------------------------------------------------------------------------------------------
OLDER HOTLINES
--------------------------------------------------------------------------------------------------------------------------
1/23/2015 Can The Peerless Buy B9, Low Interest Rates
and Very Strong Dollar Sustain A Bull Market
That is almost Six Years Old?
The NYSE A/D Line on our Peerless charts remains in
a strong
uptrend. So, US REITS, BONDS, UTLITIES are likely to remain
in their uptrends. (Of course, if these were
to start breaking their up-
trend-lines, the market's leadership would probably then be gone
and a 10%-12.5% DJI decline would then become likely. But even
then without a Peerless Sell or a DJI head/shoulders pattern, the
odds are heavily against a deeper decline.) See the Tiger composite
indexes of REITs, BONDs, Utilities here. The DJI
seems locked
in an inconclusive diamond formation.
DJI's Diamond formation is rare. I have not looked
for and studied them. But I found a link on the
internet that suggests that the odds of a breakdown
rather than a breakout are about 60%. Standard
chart analysis projects a downside objective of 16500
if the green support level is closed decisively below.
http://www.finvids.com/Chart-Pattern/Diamond-Top-Bottom
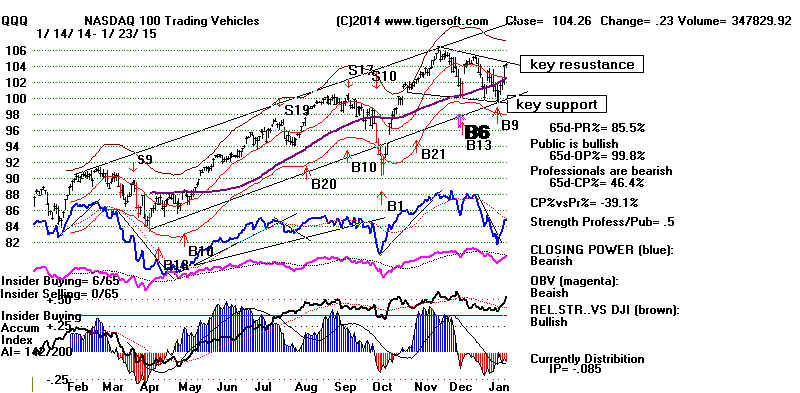
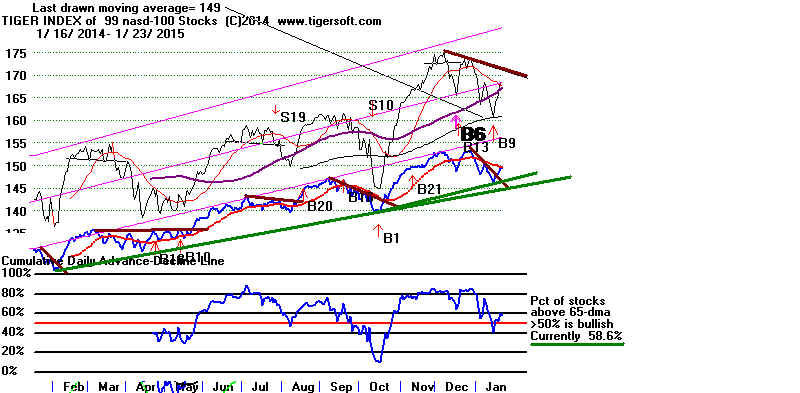
The QQQ is simply falling back from a resistance-line from its its recent
highs. This is not particularly bearish. In addition, the percentage of
Russell-1000 stocks above their 65-dma is still comfortably over 50%.
 |
 |
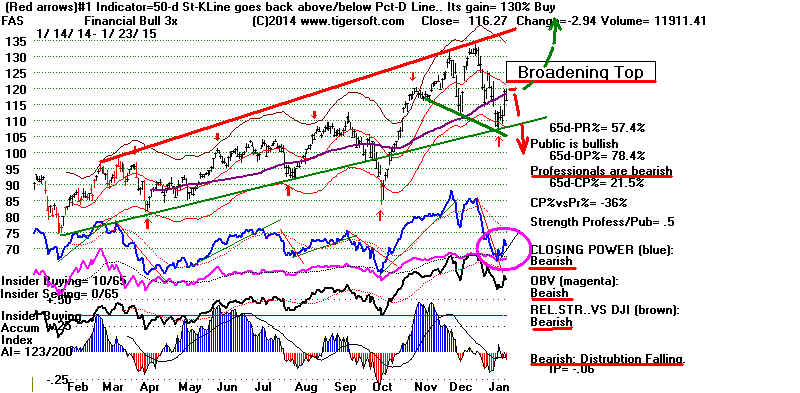
Professionals remain skittish of US big banks. Usually, until the
big bank stocks' become objects of net Professional buying, the
markets will have trouble starting a new bullish run higher. See
the chart of FAS, the financial ETF, below. What we do not want
to see is a sharp turn-downards here by FAS. That would
give the appearance of a down-sloping head/shoulders pattern
and a bearish broadening top.
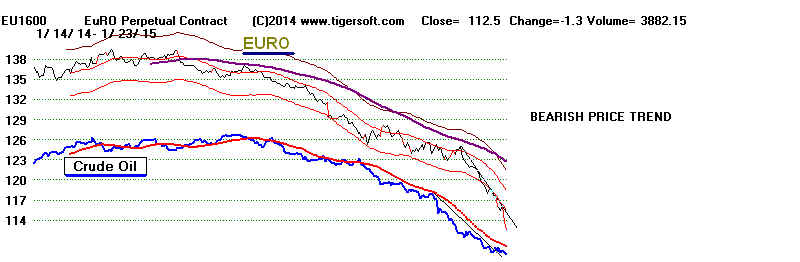
The ourcome of the Greek Election, wherein a populist-leftist coalition will
denounce the austerity demands upon Greece by Europe's central bankers
seems bound to make Greece the first Euro zone country to leave
the Euro. This is scary for central bankers. It is scary for Greek bond-
holders, in Europe and also in New York. And it could easily lead to
similar political challe nges by similar anti-central bank politicians in Italy,
Spain and Portugal. This has put a lot of pressure on the Euro. See below.
Until we see how all this plays put, I would think the Euro will stay weak and
that will boost the Dollar. The new Quantiative Easing by the European
bankers comes very late. Will it be taken as a sign of desperation and
vulnerability for the EURO. Wall Street is scared, too. They fear
"radical leftist" majority rule. They recognize that a popular
uprising
against the rule of the big banks has just gained significant momentum.
Greek
Vote Sets Up New Europe Clash Wall Street Journal
BBC
News - Greece election: Anti-austerity Syriza wins
http://www.nytimes.com/2015/01/26/opinion/paul-krugman-ending-greeces-nightmare.html?emc=edit_th_20150126&nl=todaysheadlines&nlid=58223894

70 Months Old Bull Market:
What If The Stong Dollar
Fails to Lift The DJI To New Highs?
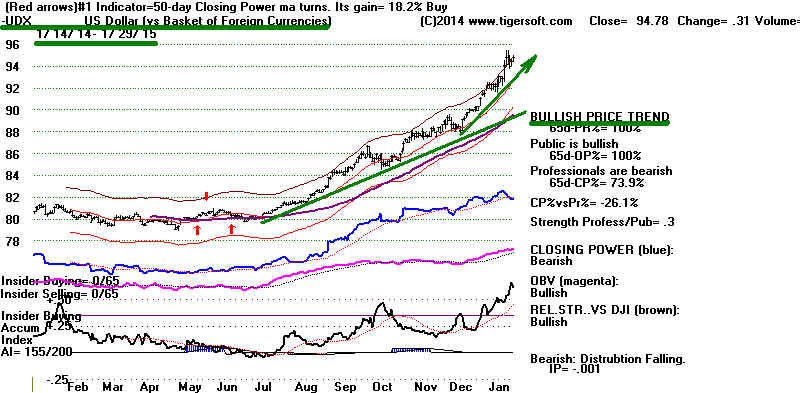
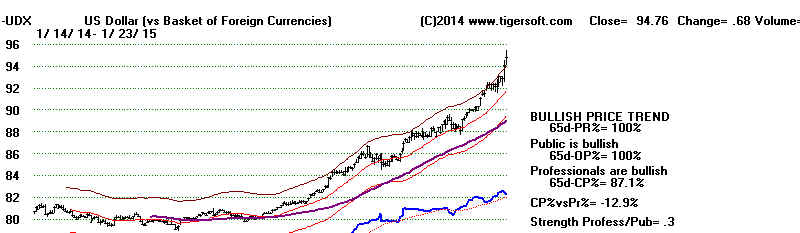
We can't help but notice that the DJI is no longer able to keep
up with the super-strong Dollar. In a new bull market, this is
not significant. But after a long bull market, a rising Dollar
that fails to lift the DJI into new high territory is a definite
warning. It means the US equities' market is getting very tired.
Here are some cases of this....
What do DJI NCs (non-confirmations)
of Dollar new high mean in 6 month uptrend?
Bull Market Cases:
1 October 2014 - DJI declined to lower band.
(July 2001 - DJI declined below lower band.)
(2000 (2) - two declines below lower band.)
2 June 1999 - Correction in DJI started a month later.
3 August 1998 - 19.5% correction followed.
See the new Tiger Study tonight of "The Dollar and The DJI".
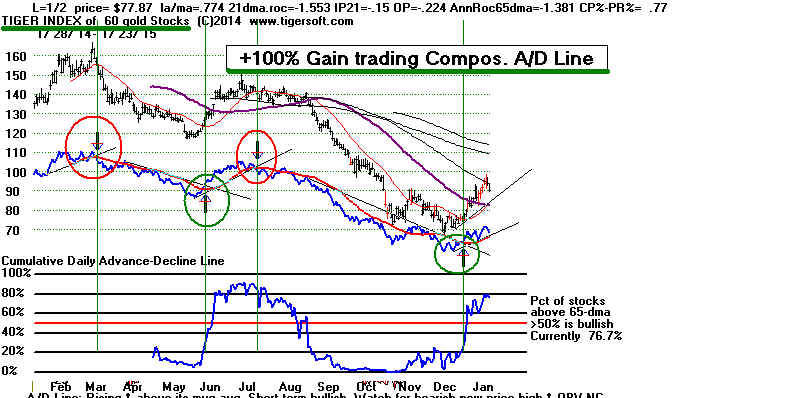
Calling Gold
and Silver Mining Shares
Intermediate-Term Reversals.
Crude Oil is trying to find a bottom. The steep
Closing Power
downtrend has been broken. But we will need to see more up-days
here. The charts of GLD (Gold ETF) and Silver futures look like they
are making a rather typical January reversal upwards. One of
the simplest approaches is to watch the Tiger chart of all the
gold and silver mining stocks, and the A/D Line here io particular.
As long as the A/D Line is in an uptrend, I would think we will
see more of a recovery.
Tiger Mining Stocks' Index
------------------------------------------------------------------------------------------------------------------------
OLDER HOTLINES
------------------------------------------------------------------------------------------------------------------------
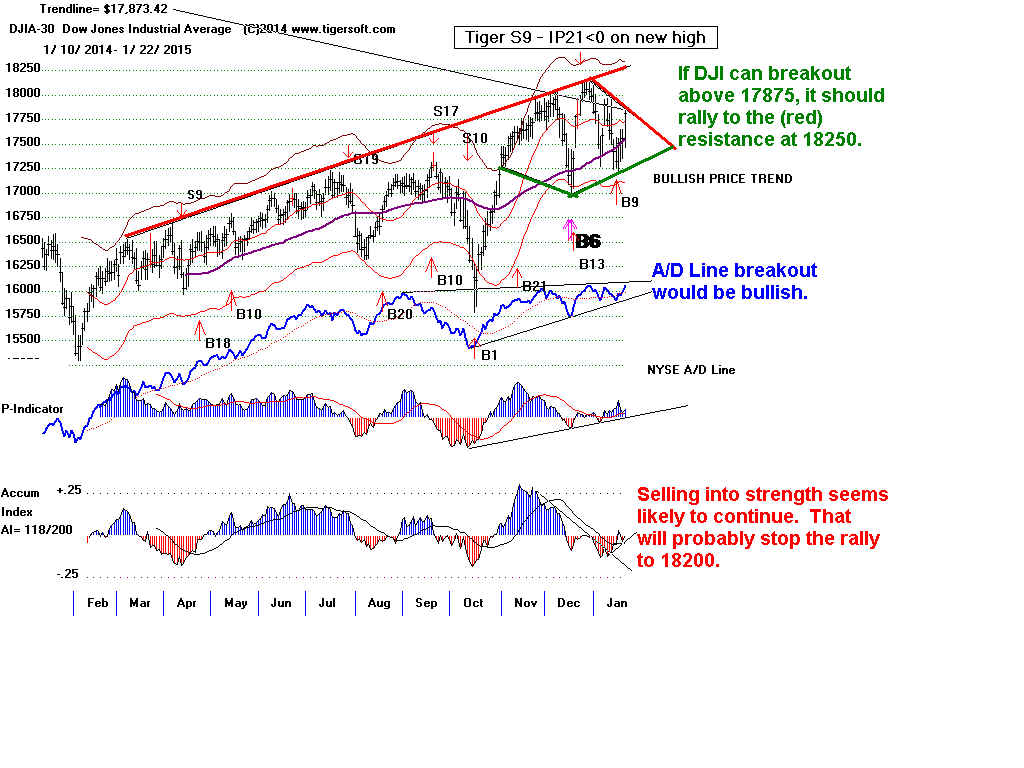
1/22/2015 Peerless BUY Buy B9 and Low Interest Rates
Flexed Their Muscles Today as the DJI Soared Nearly 300
in aftermath of Europe's Big and Bold Quantitative Easing.
America's QE-2 brought a
very good rally in 2010-2011.
Europe's should produce the same here. But it all depends on what
bankers and well-to-do Europeans choose to do with their
money. Their reaction could be very different the reaction
of bankers in the US. I suspect that will decide to buy US bonds
and US dividend plays where the currency and market are stronger.
Just as there were no strings attached to the Fed's loose money
policies for the last four years, I know of none in Europe. The
EURO's reaction was almost a panic, as it broke it easily
broke
below the 116 support of 2006. This sent the Dollar
soaring, to
to the delight of American big banks' stock holders.
The Peerless Buy B9 on
the DJI was clinched yesterday;
the Closing Power downtrend lines for DIA, SPY and QQQ were violated.
We take encouragement in the unusual power of Buy B9s in January and
in the fourth year of the Presidential cycle.
(See Buy B9
Statistics).
I have suggested
buying DIA, QQQ, APA, Crude Oil
and lots of REITs
via their extended stays on the Bullish MAXCP lists. Our Stocks'
Hotline covered most of the shorts, even though we know that some
of the Bearish MINCP stocks will decline even in a rising
general market.
A recovery back to 18250 for the blue-chip DJI-30 seem very
likely,
provided the DJI can breakout above its falling (red) resistance line in
its DIAMOND PRICE pattern. Watch to see if the A/D Line can
make a breakout to new high territory. That would be bullish for
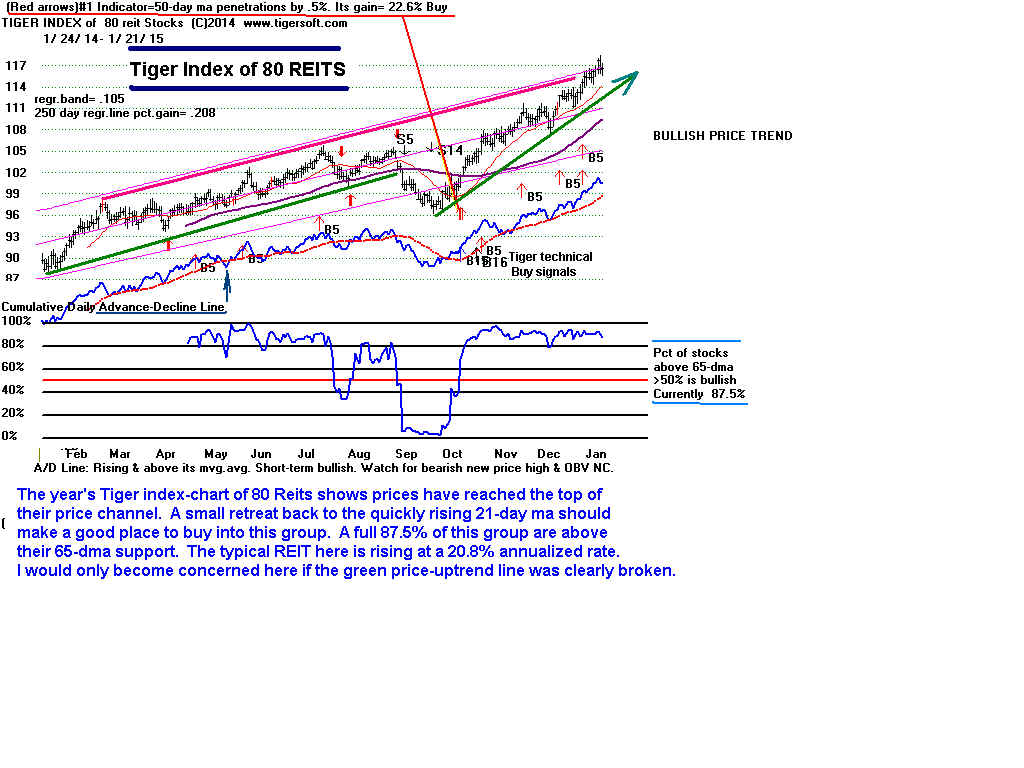
dividend players. The way REITs soared today, I would think we
will see even higher prices there. The Tiger Index of the REITs
is bullish breaking above its rising resistance line.
------------------------------------------------------------------------------------------------------------------------------------------------------------------------------------------
OLDER HOTLINES
------------------------------------------------------------------------------------------------------------------------------------------------------------------------------------------
A Dividend Stock and DJI Rally Up
to 18000
Must Now Be Expected.
1/21/2015 The
Peerless Buy B9 on the DJI was clinched today; the Closing Power
downtrend lines for DIA, SPY and
QQQ were violated. We take encouragement
in the unusual power of Buy B9s in January and in the fourth year of the
Presidential cycle. (See Buy B9 Statistics). A recovery back to 18000 for
the blue-chip DJI-30 would now seem likely, at a minumum.
But we can't escape noting now how much weaker the broader market, excluding
dividend stocks is. Here Professionals are still aggressive net sellers of more
stocks
than they are buyers. Thus, the number of MINCP stocks making Closing Power
new lows today was higher than the number of MAXCP making new highs, by 131 to 68.
Mining stocks are due for a rest. Interestingly, though they rose today, the 3x
leveraged
ETF for the group, NUGT, fell 5%. Now the futures are
down this morning for gold
and silver. This another case of the heavily traded and leveraged derivative (NUGT)
wagging the dog, the entire industry's regular stocks. I still like the technical
and
intermediate-term prospects, however for the group. Look at the bullish inverted
head/shoulders patterns in NEM and GLD
and the bullish Accumulation in Silver's
Perpetual contract, SV1620.
The ratio of new highs to new lows on the
NASDAQ remains bearish.
So, this remains a defensive market for the
most part. Dividend stocks,
particularly REITS, Bonds and Utility stocks dominate our
Bullish MAXCPs.
These should be bought now on any dips they may individually make to their
rising 21-dma.
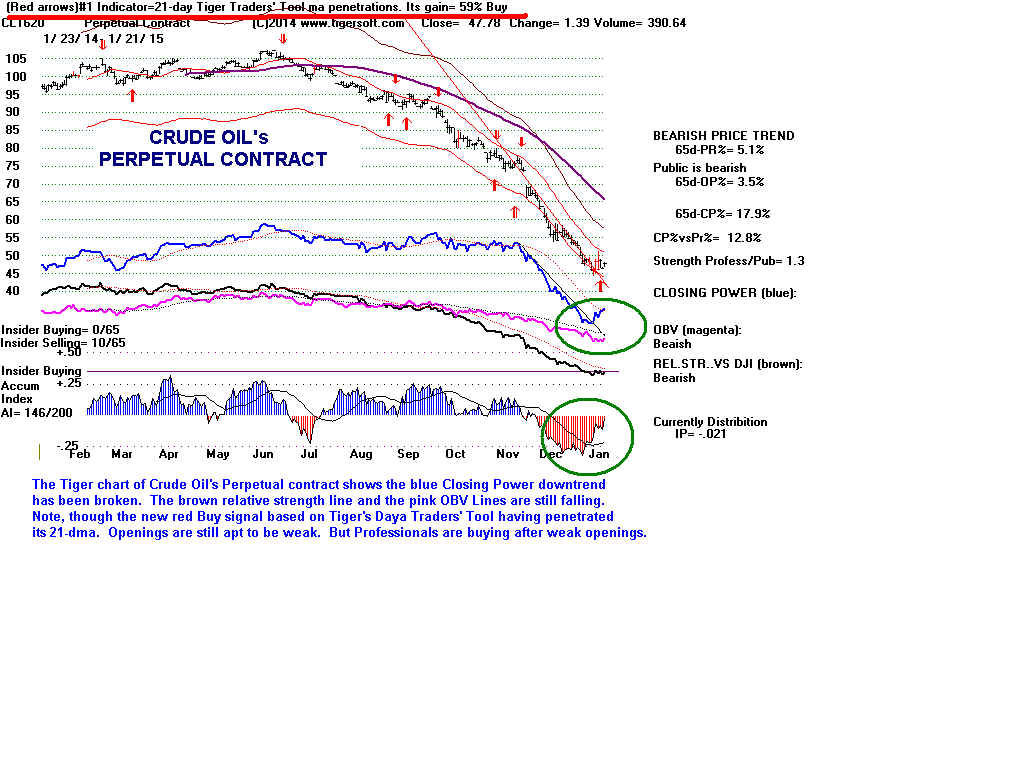
Bullishly, the Hourly DJI's
DISI-OBV Line is bullishly rising faster than the DJI.
I believe QQQ should rally well now, too. But the most
interesting play now
would seem to be the beaten down oil stocks like APA and AREX. Below is
the perpetual chart of Crude Oil. See how its Closing Power downtrend
has been violated. This is not true of its Opening Power.
 ============================================================================================================
OLDER HOTLINES
============================================================================================================
1/20/2015 The Buy B9 still stands.
But today's DJI gain was not
matched
by good breadth; there was 670 more down than up on NYSE today. A lot
more NASDAQ stocks are making new lows than new highs. The opposite is
true on the NYSE. This reflects the defensiveness of the stock market now.
In effect, the NYSE and the Federal Reserve are propping up the general
market. The Buy B9 tells us that the Fed can succeed in this for a lot longer
than most super bears can remain credible and solvent.
Utility stocks, REITs and mining
stocks are the market leaders. If you own
these stocks, you love this market. But this type of leadership is troublesome
for the rest of us. Gold, Silver, mining stocks and NUGT show special strength
very often 4-8 weeks before there is a significant top and general market decline.
See http://www.tigersoftware.com/TigerBlogs/02-21-2008/
Without more speculative interest, who will buy as more and more SP-500 stocks
break their 65-dma. Right now, about only about 51% are above their
65-dma.
For the time being though, the Hourly volume does seem recently to be heavily on the upside.
The apparent continued political stalemate in Washington, at first glance, would
seem to safeguard the special previleges and power of corporate America. But should
the economy turn down, one must wonder how would the President
and Congress ever agree on what to do.
The history of Buy B9s shows that
small 0.8%-4.6% paper losses on the DJI
are not uncommon. They occurred in 24 (36.5%) of the 66 Buy B9s since 1928.
See the next table. With the average Buy B9 gain on the DJI more than 10%
per trade when closed out on the next Peerless Sell, we should be buyers of
DIA when its Closing Power clearly breaks its downtrend.
( More statistics on Buy B9s )
The key Closing Powers are still in falling trends. So, Professionals are not
ready yet to become net buyers of the DIA, QQQ, SPY or FAS.
Buy B9s:
1928-2014
Returns by Size of Gain after B9
------------------------------------
Size of Gains No. Pct.of Total
=>.10 30
.455
=>.05 - <.10 18
.273
=>.02 - <.05 14
.212
=>0 - <.02 3
.045
<0
1 .015
--------------------------------------
Total
66 1.0 (100%)
BREAKDOWN of BUY B9 TRADES: 1929-2014
=====================================
No.  Date        Peerless    DJI      Pct      Paper
                 Signal               Gain     Loss
==========================================================
 1   19340910      B9        89.3     .038     .029
----------------------------------------------------------------------
 2   19341220      B9        99.6     .044     None
----------------------------------------------------------------------
 3   19350531      B9       110.64    .198     None
----------------------------------------------------------------------
 4   19351213      B9       140.2     .114     .009
-----------------------------------------------------------------------
 5   19431108      B9       131.7     .245     .016
-----------------------------------------------------------------------
 6   19431117      B9       130.2     .26      .004
----------------------------------------------------------------------
 7   19431126      B9       131.3     .249     .013
----------------------------------------------------------------------
 8   19440907      B9       143.6     .142     .004
----------------------------------------------------------------------
 9   19440914      B9       142.9     .148     None
----------------------------------------------------------------------
10   19450326      B8       152.3     .077     None
----------------------------------------------------------------------
11   19460225      B9       187.2     .135     .006
----------------------------------------------------------------------
12   19461009      B9       163.1     .126     None
----------------------------------------------------------------------
13   19480920      B9       177.4     .07      .007
----------------------------------------------------------------------
14   19481122      B9       176.3     .022     .029
----------------------------------------------------------------------
15   19481129      B9       172       .048     .004
----------------------------------------------------------------------
16   19481201      B9       173.2     .040     None
----------------------------------------------------------------------
17   19501205      B9       225.4     .15      .003
----------------------------------------------------------------------
18   19550117      B9       388.2     .207     None
----------------------------------------------------------------------
19   19581125      B9       540.5     .203     None
----------------------------------------------------------------------
20   19661201      B9       789.95    .124     .005
----------------------------------------------------------------------
21   19670412      B9       844.65    .051     None
----------------------------------------------------------------------
22   19670519      B9       874.55    .063     .031
----------------------------------------------------------------------
23   19740207      B9       828.46    .033     .03
----------------------------------------------------------------------
24   19741009      B9       631.02    .038     None
----------------------------------------------------------------------
25   19750528      B9       817.04    .058     .002
----------------------------------------------------------------------
26   19751209      B9       824.15    .225     None
----------------------------------------------------------------------
27   19761005      B9       966.76    .018     .046
----------------------------------------------------------------------
28   19771206      B9       806.91   -.017     .017
----------------------------------------------------------------------
29   19780223      B9       750.95    .154     None
----------------------------------------------------------------------
30   19781218      B9       787.51    .125     None
----------------------------------------------------------------------
31   19790206      B9       822.85    .077     .008
----------------------------------------------------------------------
32   19801028      B9       932.59    .058     .016
----------------------------------------------------------------------
33   19811023      B9       837.99    .04      .008
----------------------------------------------------------------------
34   19820930      B9       896.25    .179     None
---------------------------------------------------------------   -------
35   19821123      B9       990.99    .067     None
----------------------------------------------------------------------
36   19830124      B9      1030.17    .207     None
----------------------------------------------------------------------
37   19860122      B9      1502.29    .215     None
----------------------------------------------------------------------
38   19860407      B9      1735.51    .052     None
----------------------------------------------------------------------
39   19860711      B9      1821.43    .008     .029
----------------------------------------------------------------------
40   19861118      B9      1817.21    .324     None
----------------------------------------------------------------------
41   19880108      B9      1911.31    .059     None
----------------------------------------------------------------------
42   19880122      B9      1903.51    .063     None
----------------------------------------------------------------------
43   19880325      B9      1978.95    .056     None
----------------------------------------------------------------------
44   19930921      B9      3537.23    .122     None
----------------------------------------------------------------------
45   19960110      B9      5032.94    .103     None
----------------------------------------------------------------------
46   19960410      B9      5485.98    .048     None
----------------------------------------------------------------------
47   19960507      B9      5420.95    .06      None
----------------------------------------------------------------------
48   19961213      B9      6304.87    .087     .005
----------------------------------------------------------------------
49   19970911      B9      7660.98    .034     None
----------------------------------------------------------------------
50   19971219      B9      7756.29    .183     .012
----------------------------------------------------------------------
51   19981001      B9      7632.53    .459     None
----------------------------------------------------------------------
52   19990524      B9     10654.67    .045     .011
----------------------------------------------------------------------
53   20001124      B9     10470.23    .042     .014
----------------------------------------------------------------------
54   20001220      B9     10318.93    .058     None
----------------------------------------------------------------------
55   20010323      B9      9504.78    .183     None
----------------------------------------------------------------------
56   20011101      B9      9263.9     .092     None
----------------------------------------------------------------------
57   20020918      B9      8172.45    .074     .121
----------------------------------------------------------------------
58   20021209      B9      8473.41    .035     .02
----------------------------------------------------------------------
59   20021216      B9      8627.4     .017     .038
----------------------------------------------------------------------
60   20041014      B9      9894.45    .103     .014
----------------------------------------------------------------------
61   20041022      B9      9757.81    .118     None
----------------------------------------------------------------------
62   20050624      B9     10297.84    .124     .008
----------------------------------------------------------------------
63   20060718      B9     10799.23    .148     None
----------------------------------------------------------------------
64   20081223      B9      8419.49    .063     None
----------------------------------------------------------------------
65   20111121      B9     11547.31    .048     .028
----------------------------------------------------------------------
66   20131007      B9     14936.24    .105     .01
----------------------------------------------------------------------
Total                     N0.= 64     .108     .009
|
_______________________________________________________________________________________________
1/16/2015 The Buy B9 and Friday's Strong Rebound Suggest
A Weak DJI Rally to 18000 if the DJI can Stay above 17000. The
Peerless Internals for the DJI are now improving. Close out
Bearish MINCP stocks' hedges if their Closing Power downtrends
are violated. Our Stocks' Hotline recommended closing out most
shorts this week-end.
Unfortunately, another test of the recent lows is probably necessary
when this reversal and rally runs out of momentum. Professionals would
need to become much more aggressive buyers to prevent a retest
of 17400 at some point in next month.
With DIA, SPY and QQQ each still showing falling Closing Power trends,
be careful. Also watch AAPL and GS. They did not rally on Friday.
That is not a good sign.
Consider buying our Biotech favorites and also some beaten down
Oil and Gas Stocks, like APA and possibly AREX, instead of DIA or
SPY, if these oil stocks' Closing Power downtrends are clearly broken.
Gold's strongly Bullish Reversal Price Pattern is probably a warning for the
General Market. But NUGT could go to 25 just on the
basis of higher
openings. See www.tigersoftware.com/DEN
The DJI jumped upwards 190 points and got
back marginally above its rising
65-dma. Friday's ratio of
NYSE advances to declines bullishly correlates
with further gains.
Friday's +1% gain was bigger than occurred at anytime
in the aftermath of the January 1977 and January 1984 cases mentioned
in Thursday's Hotline. This means the January Buy B9 signal probably
precludes a big break in the market. But right now, only a rally back to 18000
seems possible. The support 200 points lower on the DJI has apparently been
successfuly tested. But that does mean a big rally yet. Most of Bull Market
January B9s bring rallies later in the month and not all Buy B9 are equally
powerful and modest B9 paper losses are fairly common.
Professionals Remain Skeptical
The big problem now is that the Closing Powers for the DIA, SPY and QQQ
did not clearly break their downtrends. So, the rally had a lot to do with it
being Friday, the day before a three day holiday. As a result, there will probably
need to be another dip. (If there is no dip, the markets would then have to make
most of their gains based on a string of higher openings. This seems unlikely.)
I interpret the still falling trend of the key Closing Powers to mean that market
Professionals are not yet convinced the decline is over. They are watching
for the President's State of the Union Speech, the Republicans' counter-budget
and the results of the Greek Election, not to mention signs that Moslem
extremeists' terror has ended for a while.
Europeans are aggressive buyers now. That would explain the jump in the
opening as we start the new week. Europeans expect a quantitative easing scheme
to be announced by the EURO's Central Banks later this week. This would also explain
some of the boost that Gold has gotten. The Swiss Franc's big jump
shows the World's wealthiest are ever seeking a "haven" for their money
when local currencies and governments fall.
I fear that the US domestic economic situation could turn down sharply this year.
Keep in mind how weak Austerity has made the European economy. The average rate
of national Unemployment there is over 12%. Think what domestic spending
Austerity would do in the US to the stock market unless there is
a bold Quantitative Easing - Phase 4.
The lessons of the 1937 Crash should
be required reading in Washington. The December retail figures show that
the average American had to buy lower priced gifts despite the extra $100
a month he gained from falling gasoline and fuel costs. Consumers without
much spending money and a juiced-up stock market are a dangerous combination
if Austerity comes "a-calling" and the Fed does not provide a QE-4.
AAPL, the leader of the NASDAQ was down. So was Goldman Sachs among
the bank stocks. If they do not turn up on Monday, another retest of the
recent lows will be very likely.
Breadth was excellent Friday; the low interest rates helped REITS
the most. In addition, our favorite Biotech Super Stock candidates for
2015 (AGRP, KITE and BLUE) did well.
Crude Oil is trying to reverse its slide. I reported its Closing Power's downtrend
was broken on Wednesday. The most interesting depressed oil stock I
can find are APA and AREX. They are on the verge of having their Closing
Power downtrends broken. This would make them Buys using Tiger's Closing
Power rules. Interestingly, Wall Streets pundits are belatedly becoming
super-bears on Crude Oil. See this weekend's bearish write-ups. If Oil can
rally against these bearish pronouncements, a rally to the fallign 65-dma at
a minimum would seem very likely.
Oil
To Collapse Below $40, J.P. Morgan Downs Barrons
Gold's big jump is still not believed by institutions. But its has completed
an inverted head/shoulders pattern. So has Newmont Mines, the second
biggest gold producer. Last year's mining stock rally, as
shown by NUGT,
was mainly confined to higher openings until its top in March. NUGT's
internals
are now all positive. I suspect it can rally back to 25, even if much of the buying
is short-covering by hedge funds. We probably can trade it best now
simply monitoring its simple price uptrend.
==============================================================
OLDER HOTLINES
==============================================================
1/15/2015 The DJI Broke below Its 65-dma Support.
Today's Buy B9 shows breadth is very good. But can
low interest rates alone save stocks when Professionals
and Institutions remain heavy sellers?
DJI-17000 would seem to be the best place to buy
index
call options. Closing Power trend-breaks are
needed
now to show us that Professionals are becoming net
buyers. The lessons of January 1977 and January
1984 should be reviewed now. Stay fully hedged.
The DJI closed 2.2% below its 21-day ma
with the P-Indicator (21-day ma of NYSE
advances minus declines) still positive. In fact, it stands at a +181. This is
what
produced today's Peerless Buy B9 at the close. The January track record for Buy
Buy B9s is quite bullish. See www.tigersoftware.com/PeerlessStudies/January-B9s/index.html
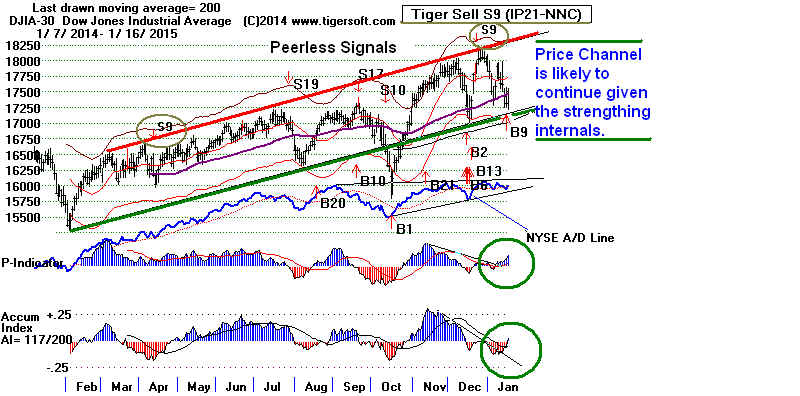
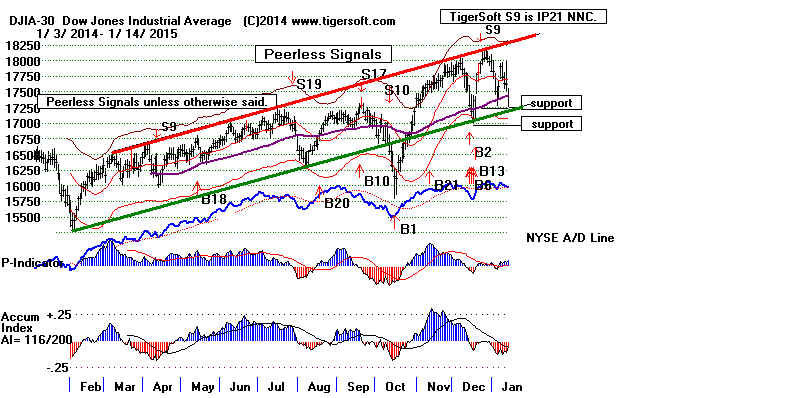
DJI, Peerless Signals and Tiger S9 (IP21 NNC)
Unfortunately. there are several problems with becoming super-bullish right now.
1) We have not reached the
lower 3.5% band yet.
With the 65-day ma broken, this
would seem to be the logical place for a reversal to take place, if there is to
be one. 17000 on the DJI would also coincide with the location of the rising
200-day ma; we can expect many institutions to place their bids there.
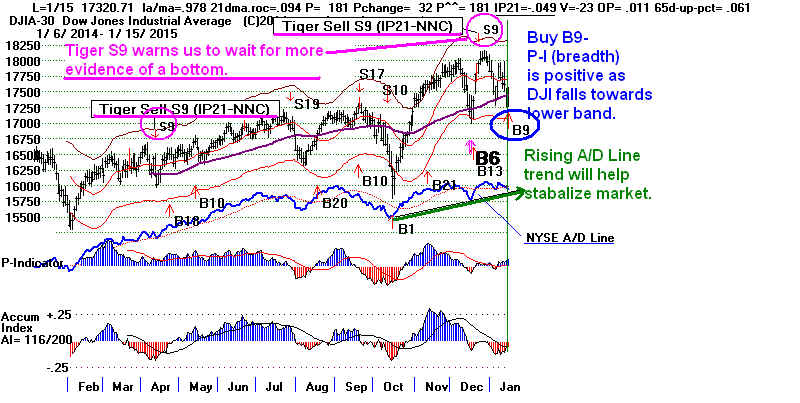
2) Professionals are still
heavy sellers. The Closing
Powers for the key ETFs fell again
today. Red Distribution still is very apparent in SPY, for example. The Tiger
S9s
are useful warnings in December for the DJI and the general market. (Tiger S9s
are produced by new price highs that are negatively (red) non-confirmed by our
Accumulation Index. They are important warnings, especially when the DJI
has just broken the 65-dma. See a
new study of Tiger S9s and the DJI since 2009.)
www.tigersoftware.com/PeerlessStudies/January-B9s/index.html
3) We know from January 1977 that a strong A/D Line does not guarantee against
a bear market when new Federal budget austerity looms over a fragile economy.
The 1920's were the exception. Then a consumer-based technological boom
changed everything. By 1926 millions of model-T were sold on easy credit. And
Even Coolodge appreciated the need for Federal highway spending.
4) After a long bull market, the appearance of a rising but very stubborn
resistance and then a false new high showing a negative Accumulation Index
can be quite bearish. In this situation, Buy B9s should probably be suppressed
for a month from the negative IP21 non-confirmation. This is important to
consider.
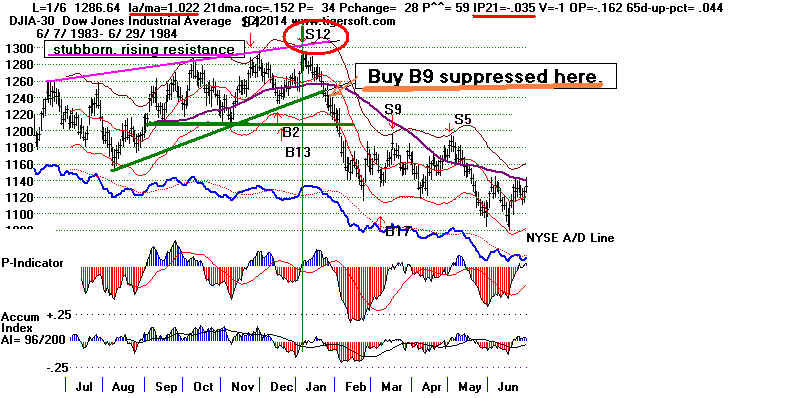
This was the case in January 1984. Such a situation - an extended bull market,
stubborn rising resistance and a new DJI that is negatively not confirmed by
our IP21-Accumulation Index - brought about a 16% DJI decline in the first
6 months of 1984. An Tiger S9 now also shows false new highs where the IP21
was negative on a new high with the DJI only 1.7% over the 21-day ma.
Compare this with Peerless S12s that are based on the same flagrantly negative
non-confirmations by the IP21 but the DJI must be farther up from the 21-day ma.
This is significant now because after Sell S12s, B9s are suppressed for a month.
Should the current B9 be suppressed because of the Tiger S9, which is such
a close relative of Peerless S12s?
What Happens
Next Probably Depends on The Fed
The charts from 2009 to 2014 repeatedly show
that the FED has the power to rescue
the market any time they choose, though it
takes much longer once a financial
panic sets in. Their standing
aside could therefore be a sign that they are still optimistic,
I suppose. But they delayed too long in 2008. They could make that mistake
again here.
See the new study of the effects of QE-1, QE-2, SE-3a, QE-3b and Fed Tapering
our charts of the DJI with Peerless and Tiger S9 signals.
www.tigersoftware.com//TigerStudies/TS9sonDJIA/QEs.html
Or perhaps, they fear the coming Austerity and want to have recourse left.
For Now, The FED Is Standing Aside.
If the Fed were about to launch a QE-4, I would think the big bank stocks would
show rising, not falling, Closing Powers. So, it's hard to be optimistic or bullish
at the moment even with the Buy B9. But this could change quickly if the big
banks' Closing Power surged upward. I think we can safely assume that they
will be the first to know if a QE-4 is to be announced.
 |
 |
==========================================================
OLDER HOTLINES
==========================================================
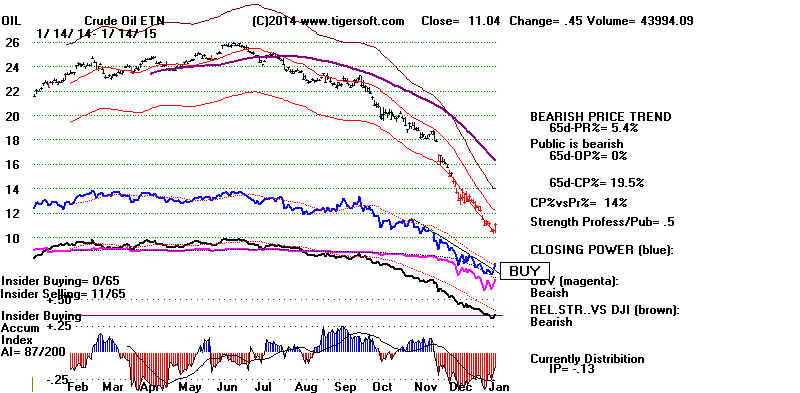
1/14/2015
DJI Breaks below and Then Closes back
at 65-dma Support. The Decline Has Set up
Key Support at Today's Lows. Now Crude Oil
and Natural Gas Are Breaking Long Closing
Power Down-trends.
Early on Wednesday the DJI broke below its 65-dma. Then it
fought back up to that level
at the
close. But now in pre-market trading, the DJI is back below this key support.
Peerless is still
on a Buy, so I would continue to stay long the surging Biotechs
and REITs. But stick with the Bearish
MINCPs, too. The rising A/D Line
is important, but
it does not guarantee against big capitalization declines,
such as in 1977,
2001 and 2002.
Wall Street 's Two Edged Swords
The abolition of the rule against selling short on down-ticks and the
heavy usage of
leveraged ETFs poses some real problems for the markets
if the key
support levels fail. Leveraged derivatives showed the damage
they could do in
2008 and 2009. In the last five years, leveraged ETFs
have helped the
DJI and SP-500 rise a lot further than they might
otherwise have.
Now leveraged short-ETFs could destroy rapidly
these gains.
Of course, the Fed will try to prevent this. But they failed
miserably in
2008. I think it will be a lot safer to hedge now rather than try to
outlast the next
bear market by stubbornly sticking to the long side.
A rupture of this
65-dma support now on a closing basis would be distinctly
bearish.
As chartists who believe in the bearish importance of breaks
in
well-tested
support with accompanying red Distribution and falling Closing Powers,
we should watch
for breaks in today's lows in the DIA, SPY and QQQ. If these
occur, consider
buying the 3x-leveraged short ETFs: SPXS, FAZ and SOXS.
If the 200-day
mvg. averages are then violated, a much bigger decline might be
just starting.
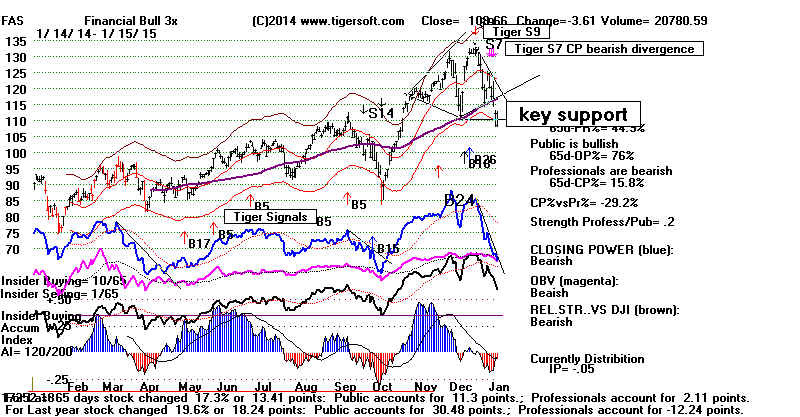
Pink Tiger Signals here: S7s warn of bearish CLosing Power
divergence from price. S9s show insider selling into price
strength.
 |
 |
Insider Selling and Tiger "S9s"
The
"S9" shown below is the Tiger Signal warning of a new price high which
occurs with
the Accumulation Index (IP21) in negative territory. This is often
a very
useful warning. It denotes "insider selling". It most frequently
occurs
in rising
stocks days before bearish news (i.e. weaker than expected December
retail
sales at Walmart, Costco, Nordstom, or Target) or poorer earnings
than
expected
are released. Insider trading, as we measure it, is just as common
with bank
stocks. Wells Fargo showed an S9s last week and today we
found
out why,
poor than expected earnings were reported. At JPMorgan
the word
of coming
lower earnings circulated two weeks ago. The stock's advance to new
highs was
widely, negatively unconfirmed then. Insiders certainly were busy
selling.
That's why its IP21 negative on the last rally. Professionals soon got
the word
and have been selling and selling short JPM on every higher opening.
These are
Wall Street's leaders. If they cannot hold up, trouble elsewhere is
almost
certain. Are they looking ahead to the bearish effects a new fiscal Austerity
in the US?
I think so.
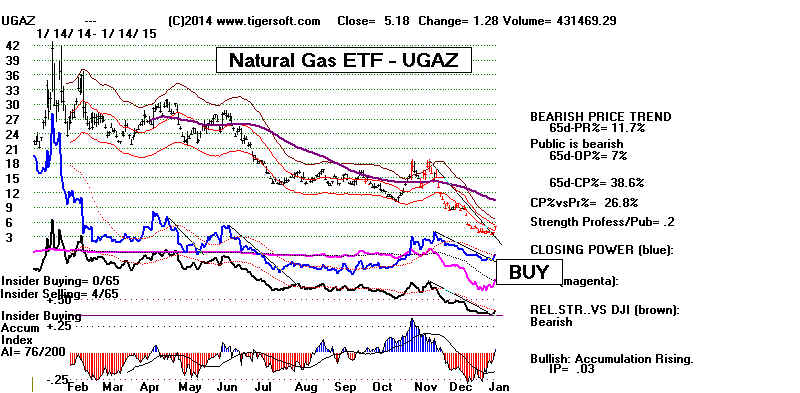
Crude Oil and Natural Gas have bullishly
broken their Closing Power Downtrends.
I would
suggest buying the OIL and UGAZ. See the way the 2008-2009
Crude
Oil bear market ended in the last Hotline. :
 |
 |
===============================================================
OLDER HOTLINES
===============================================================
1/13/2014
DJI 17000 Is Very Important
Support.
This will also become a dangerous market if the 65-dma at 17400 is closed below.
It looks very scary when the DJI loses ALL of an early 200+ point. Actually,
this does not necessarily mean that the 65-dma will be violated. But such
reversal days down just after the 65-day ma has been violated are deadly.
<1>
It's not very safe when the Big Banks' shares look as ugly and risky as they
do now. <2> Big Banks are the group that correlates most closely with
Peerless and the DJI since the mid 1980s.
And it's not certainly now safe when the leveraged ETFs take control of the
underlying equities. What will happen when Professionals and Institutions
pile all at once into these leveraged short derivatives to try to protect their
long-term gains when the 65-day or the 200-day ma is violated? <3>
(See the footnotes at bottom of this night's Hotline.)
A Rising A/D Line and
Fiscal Austerity.
Yes, the 65-day ma on the DJI has not been violated. Yes, the NYSE A/D Line
remains in an uptrend and Yes, Peerless remains on a buy signal, but why are
the big banks so weak? Why are Professionals selling stocks so aggressively,
not even allowing more than hour or two of rising prices before dumping?
One could hope it's just normal January rotation, I suppose.
But we can study history here. For example, we know from the way the market
turned down going in January 1977 that a strong A/D Line does not always prevent
a bear market, especially when Federal budget balancing becomes the
highest political priority and there is no off-setting technological and consumer
boom with easy credit like there was in the 1920s. Consider the 1976-1977
Peerless chart below. Compare it with our present chart, further below
.
A rising A/D Line did not prevent the 15-month long 1977-1978 bear market.
As President, Jimmy Carter was an unusual Democrat. This was a time of
high oil prices, inflation and he championed balancing the budget. Ours is
a time of World-wide deflation and a European recession. The US prosperity
seems more fragile and like Carter, Obama is no counter-cyclical Keynesian.
Surely, the Republicans in Congress will only pass a very tight domestic
spending budget. While the media focuses on Greece, I think it will be the
next Federal budget that is what will probably shape the US market over the
next few months. This is not to diminish the importance for the world's
big bankers of a Greek default on its Bank loans. But Greek default is
by no means as certain as big cuts in US Federal domestic spending now.
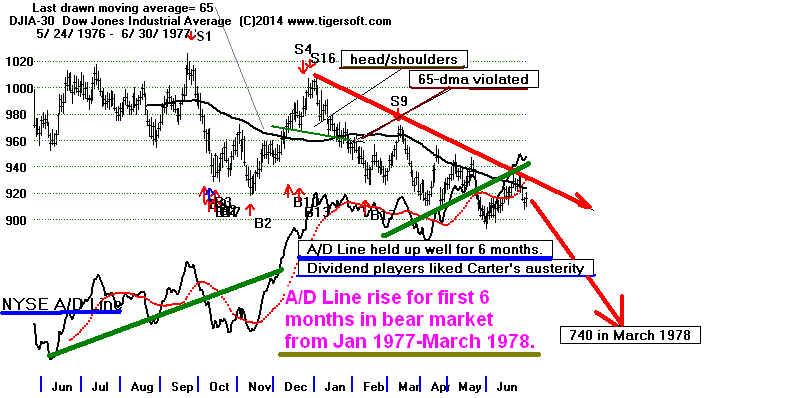
The DJI is still above its 65-dma. This and the 200-day ma at 16000 represent
critical supports given that the DJI has not had more than a 17% correction
since its bottom in March 2009. That makes the current bull market 70 months'
old!
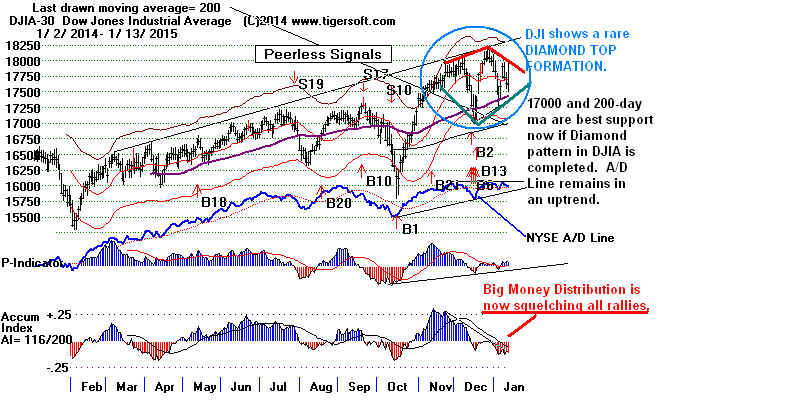
What is recommended now:
1) Hedging with leveraged short ETFs if the DJI's 65-dma is violated,
2) Taking profits when Closing Power uptrends and 65-dma are broken,
3) Going short some of our Bearish MINCP stocks,
4) Holding long only investment vehicles benefiting from very low interest rates,
like REITs and
5) Holding long only a handful of
small biotechs whose pattern of Accumulation
and high volume breakouts
resemble like the best performing stocks of 2014 showed.
Quite a few of our Bearish MINCPs fall through price trap-doors. When insiders
and Professionals start dumping, we see Tiger S14s and S17s, as well as S9s.
When the Public joins in the selling, the stock falls very quickly. A stock like
ASPS can also be used to hedge long positions effectively in a margin account.
ASPS tell nearly 40% today. It was one of our hedged shorts in the Tiger Stocks'
Hotline.
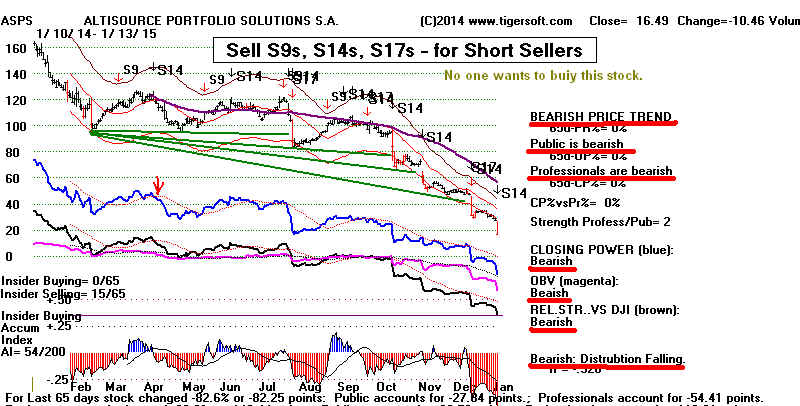
<1> Big Reversal
Days Down in DIA are much more danergous
when the DJI's 65-dma has just been broken or the DJI is
below a falling 65-dma.
10/14/2008 DJI fell far below Lower Band 93.67 to
80.26- DJI already in a deep bear market
10/9/2008 85.55 to 80.26 - DJI already in a deep bear market
9/2/2008 115.16 to 106.76 = DJI fell in 2 weeks from a
posiiton just below its 65-dma
7/14/2008 DJI fell
only one more day down and then rally back to falling 65-ms
5/19/2004 DJI
immediate rallied back to falling 65-dma
4/3/2003 This was at end
of a long bear market and does not apply. DJI - rallied a long ways up.
12/2/2002 88.87 to 82.96 DJI was considerably above its flat 65-dma.
10/28/2002 This is an important case: The
65-dma held and the DJI then rallied.
9/17/2002 82.16 to 73.12 in 3 weeks DJI was just below 65-dma when reversal took place.
9/11/2002 85.68 to 73.12 in 4 weeks DJI was not far below 65-dma.
10/31/2001 After 9/11 collapse. This was at end of a long bear market and does not apply.
DJI - rallied a long ways up
10/17/2001 After 9/11 collapse. This was at end of a long bear market and does not apply.
DJI - rallied a long ways up
4/11/2001 DJI immediately
rallied. Below 65-dma
12/8/2000 104.53 to 102.95
Santa CLaus rally limited decline
8/28/98 80.78 to 74.47 in one day. This was at end of a 19% bear market
drop and does not apply.
DJI - rallied a long ways up
10/6/1976 DJI immediately rallied. After 20% DJI decline.
<2> Big Banks' show
heavy red Distribution and very weak Closing
Power. See FAS, BAC, JPM, GS,
WFC...
<3> The volume in the
leveraged short ETFs is very high. They
do not require upticks to short and there is no need to borrow
shares first. A margin account is not even needed. More on this
tomorrow night.
==============================================================
OLDER HOTLINES
11/12/2015
Peerless
remains on a Buy. The NYSE
A/D Line remains in an uptrend.
The DJI is still above its 65-dma despite today's 97 point drop by the DJI.
57% of the DJI-30 stocks are still above their 65-day ma. 58.9% of the SP-500.
and 64.6% of the Nasdaq-100.
Our biotechs, REITs and
mining shares ETF - NUGT all did well today. But
the big Banks' ETF, FAS, got clobbered. (See the bank charts below). That
schizophrenic pattern will probably continue, perhaps for the next fortnight
until the
Greek Election is over 13 days from now.
The Hourly DISI diwntrend has been broken, This is short-term bullish.
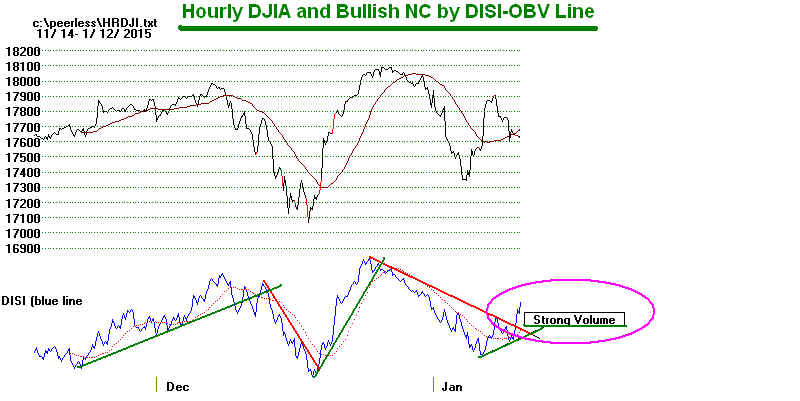
Retain a healthy distrust of higher openings in
the key ETFs and bank stocks.
We will have to sell FAS on a pop above 120 now. Contrast the weakness
in the banks' Closing Power and Day Traders' Tool with the considerable
strength now in beaten-down NUGT and mining shares.
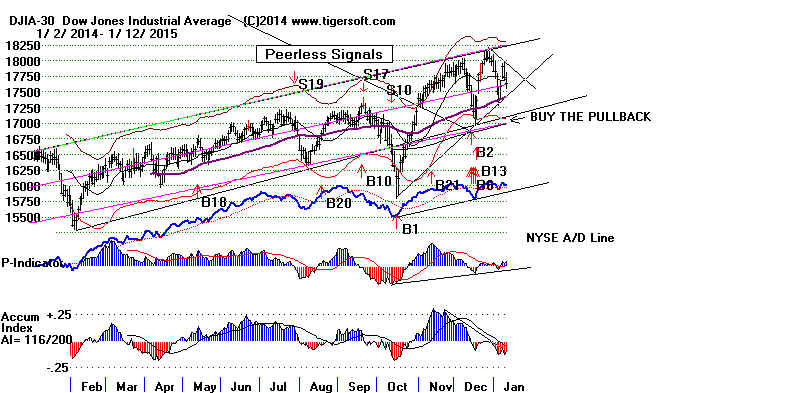
The downtrend in the Closing
Power and Tiger Day Traders' Tool is still point
the big banks and key general market ETFs downward. Respect these
downtrends for now.
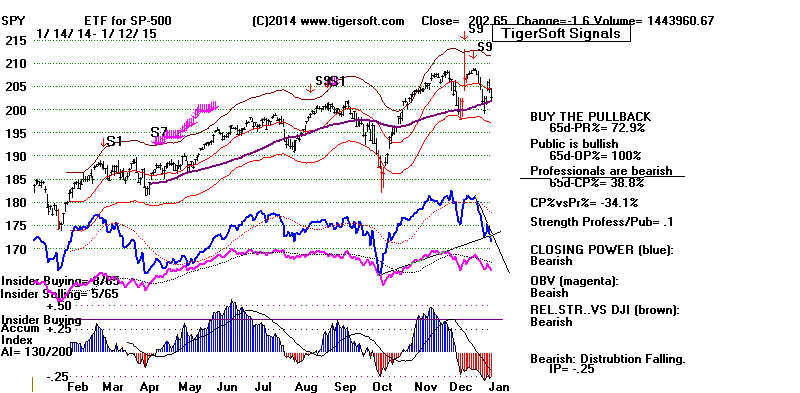
Presumably, the falling Euro, declining European stocks and the dangers of
big bank failures there are being brought to a crisis, to a panic stage,
by the likelihood that the next Greek Government will not follow the
demands for austerity made by the European Central bankers. If the
new Greek Government refuses to honor earlier debt, will this end the
Greek membership in the EEC and Greek's using the Euro? And will
the Central bankers still backstop various European banks and buy
a trillion dollars worth of low-quality, perhaps toxic, European bank debts?
Dare the Central Bankers in Brussels allow Spain's biggest bank (SAN- below)
go bankrupt? If they do this, the Euro will surely fall below 115, its low
back in 2006?
Spotting
The Next Crude Oil's Bottom
We can try to guess the answers here, but it's not necessary in our pursuit
of trading profits. Just follow the trends of price, relative strength, Closing
Power, Day Traders' Tool and the 65-dma. I think it will help now to study
how Crude Oil bottomed early in 2009. Its chart is shown just below.
How Will We Know Crude Oil Has Bottomed?
Study the 2007-2008 chart
of Crude Oil and its Bottom at 33.87
Price trend-break.
Tiger Day Traders' Tool breaks out to upside.
Prices rise above 65-dma and two weeks later 65-dma turns up.
Closing Power downtrend was broken.
Relative Strength downtrend-line was broken.
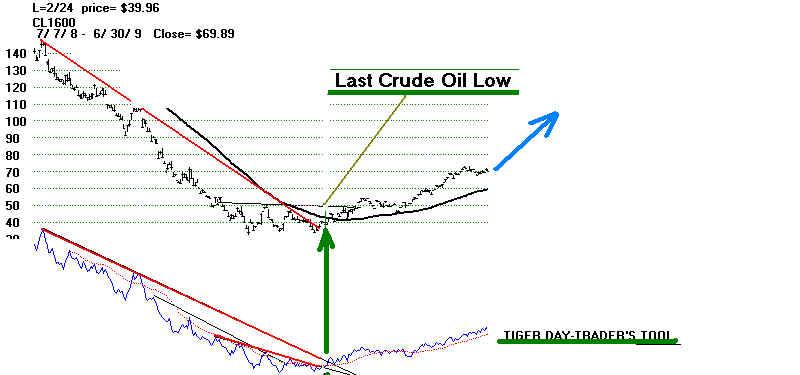
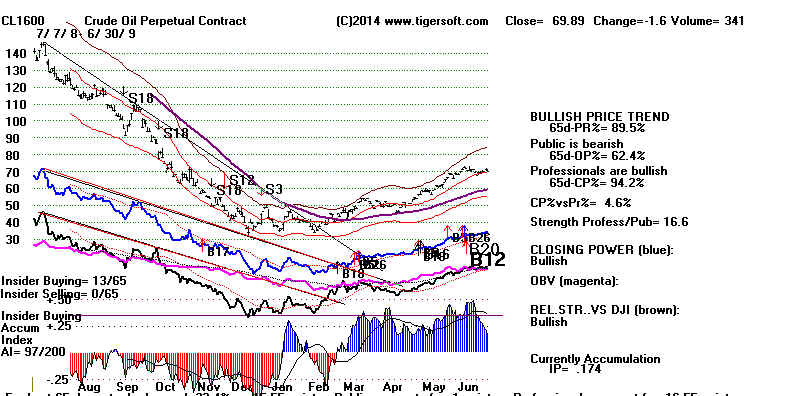 |
BIG BANKS
===============================================================
OLDER HOTLINES
===============================================================
1/9/2015
Peerless remains on a Buy. Peerless
is taking its bullish cues
from the low interest rates and the still very strong NYSE A/D Line, which
is heavily influenced by all the dividend and bond funds on the big board.
As a result, many REITs continue to rise, showing the bullish Accumulation and
Closing Power new highs that are the hallmark of our Bullish
MAXCP stocks.
Note that I've added some small biotechs to the MAXCP list, because more than
half of last year's biggest gainers were biotechs showing high Accumulation and
red high volume vreakouts. Here
is the 2014 study and the 4 biotechs that
would seem to best match the
super stocks of 2014.
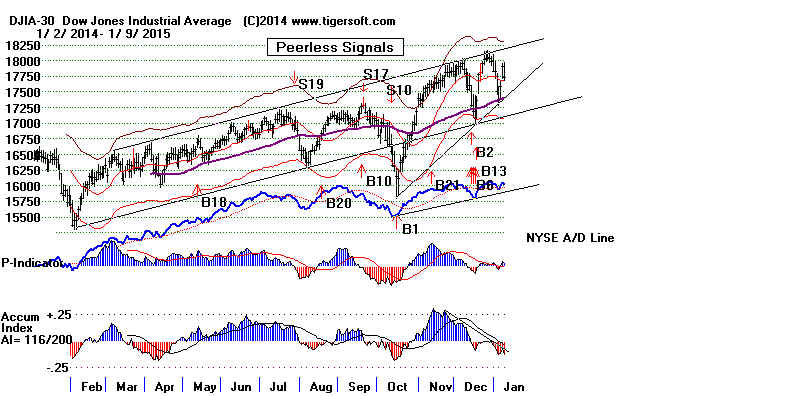
Unfortunately, most common stocks look much weaker. They are making too
much of their gains on strong openings. There is not not enough follow-through.
Because of this, I have to suggest hedging with some of out Bearish MINCPs.
What's worse? Now Gold stocks are taking a leadership rose. This is always a
a bearish sign. NUGT seems to be on the verge of
clearly breaking out above
its 65-dma. Mining Stock ring-leader, NEM, already has.
And what's worse? Rather
than a rally, an ugly profit-taking squall greeted the
Labor Department's report that the official US unemployment fell and the economy
added 252,000. This is only one day, true... But now we must ask if this is
how
good economic news is going to be treated henceforth. And also...how will bad
news be treated? Very good
profits will have to be reported this week to forestall
another market retreat.
The market's internals are much weaker than the outward appearance the
DJI shows. Look
at all the red Distribution (Tiger's IP21-Accum.
Index) in the key indexes (DJI, NASDAQ, SP-500). The key ETFs like QQQ, FAS
and BBH show heavy Red Distribution AND Professional selling. "Professional
selling" is shown on our charts when the Closing Power is below its falling 21-day
ma. The highest priced and thus most influential DJI-30 stocks overwhelmingly
show lots of bearish red Distribution and "Professional Selling". If they
break
their 65-dma, they could become quite vulnerable. The "CP%-Pr%" compares
the Closing Power within its 65-day range with Price within its 65-day range. When
the CP%-Pr% falls below -50%, Tiger gives special Sell S7s and S4s. A close
then below the 65-dma is usually quite bearish in these circumstances.
IP21
CP%-Pr%
-----------------------------------------------
DJI -.122
V 261
-.191
-9.5% Professionals are bearish.
GS 187 -.259
-60.8% Professionals are bearish. CP made 5
month low!
MMM 162 -.057 -11.3%
Professionals are bearish.
IBM 159 -.29
-28.3% Professionals are bearish.
BA 132 -.15
+13.8% Professionals are bearish. CP
close to a 12 month low.
UTX 114 -.14
-13.6% Professionals are bearish.
Head and Shooulder price pattern?
CVX 108 .04
+7.2%
Below falling 650dma.
TRV 106 -.17
-37.2% Professionals are bearish.
JNJ 105 -.26
-61.9% Professionals are bearish.
CP is testing 12 month lows.
DIA 177 -.157
-38.5% Professionals are bearish.
SPY 204 -.267
-34.9% Professionals are bearish.
QQQ 103 -.175 -26.4%
Professiomnals are bearish
FAS 120 -.187
-36.7% Professionals are bearish
BBH 119 -.278
-55.3% Professionals are bearish.
Now. even the big Banks' ETF, FAS, shows heavy red Distribution and a
Closing Power breakdown. There is still price support at its rising 65-dma.
But the internals now look quite weak. See the new study of FAS and its
Tiger Day Traders' Tool,
It will be very hard now for FAS to get past 130.
A failure there will give the appearance of a bearish head/shoulders top.
That is still our price target now.
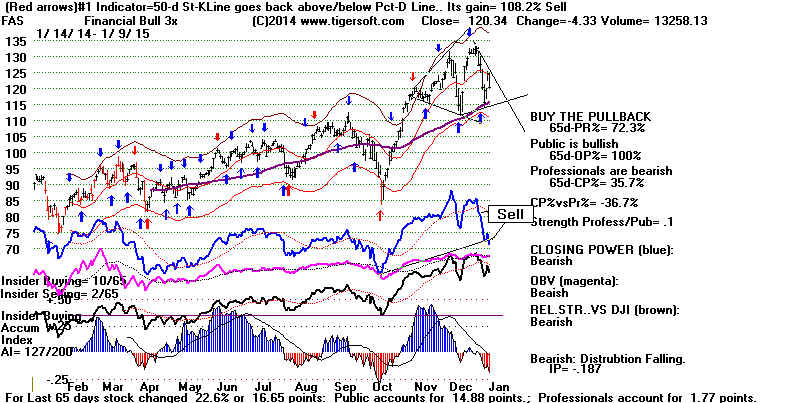
1/9/2014
Peerless DJI Chart DIA
SP-500 Chart SPY
NASDAQ Chart QQQ Chart IBB Chart IWM Chart
MDY Chart
Hourly DJI-OBV
Please report any bad links
Percent of Stocks above 65-dma - As long as the percentage is above 60%,
the 65-day ma is likely to hold up for most stocks.
DJI-30 63.3% vs 76.7% vs 66.7% vs 50% vs 56.7% vs 60% vs 70% vs 73.3%
OEX
62.6% vs 73.7% vs 59.6% vs 50.5% vs
60.6% vs 71.7% vs 76.8% vs 77.8%
QQQ
69.7% vs75.8% vs 58.6% vs 54.5% vs 66.7% vs 79.8% vs 83.8% vs
85.9%
SP-500
63.6% vs 72.4% vs
60.4% vs 51.3% vs
63.9% vs 76%
vs 80%
vs 81.9%
Russell-1000 60.3% vs 69.1% vs 57.6% vs 48.9 vs 66.7% vs 74.3 vs 77.4 vs 77.8
--> 89 -20 MAXCP
stocks Bullish MAXCP Stocks (1/9/2015)
--> 197 +65 MINCP stocks Bearish MINCP Stocks (1/9/2015)
Bearish Plurality
--> 30 -24 New Highs on NASDAQ
34 +21 new lows.
Bearish Plurality
--> 73 -74 New
Highs on NYSE
36 +27 new lows. Bullish
Plurality |
===============================================================
OLDER HOTLINES
===============================================================
1/8/2015
Peerless remains on a Buy. 18150 is
our
target for now. The FED
will not chance a bear market by
raising rates any time soon. Dividend plays and blue chips
that were boosted in 2014 will probably be most favored
in 2015. December New Jobs = +252,200 (the highest December
in a long time.)
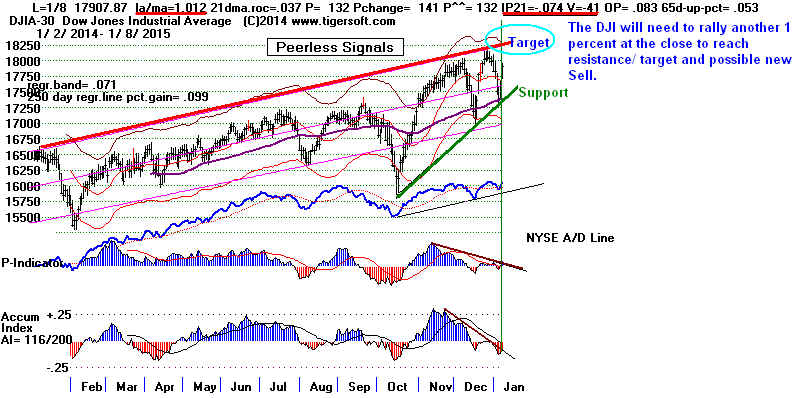
The low interest rates have
sparked another blue chip rally
emphasizing high Accumulation REITs and dividend
stocks. But Peerless Internals are not good enough to suggest
that the rising resistance line shown below will be quickly
overcome. So, quick trading profits should probably be accepted.
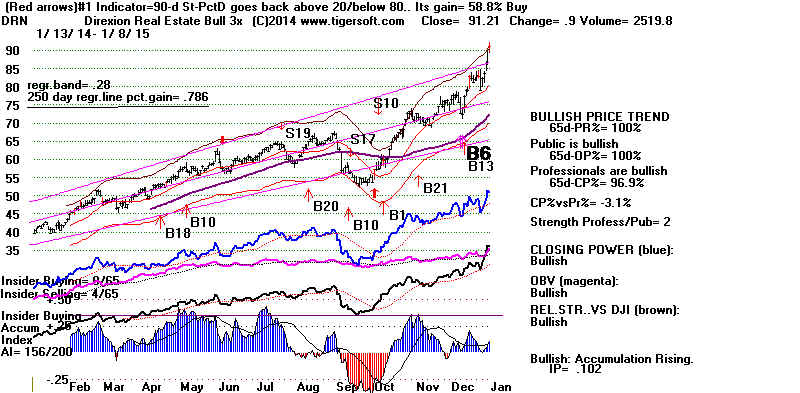
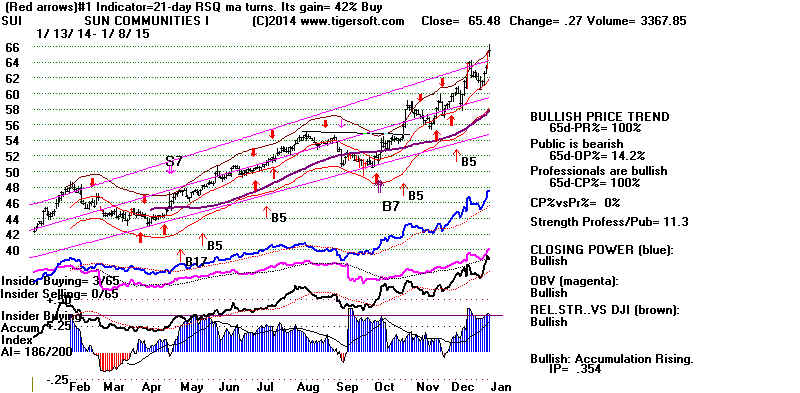
The European and World-Wide Economic Slump
Much depends, we are
told, on whether Europe's Central Banks actually
start to buy European bonds as the American Federal Reserve has.
Rumors of this have been reported for two years now and very little has
actually been done. I think we will be better served to watch the
trend of non-US ETFs as Tiger portrays them. As long as this Tiger
Index is falling, there is a big danger that the US will be drawn inescapably
into a world-wide economic slump. After all, why would buying European bonds
produce a big and dramtic surge in employment? The current unemployment
rate for the EURO's Europe is well over 11.5%. The disparities in rates between
Germany and Greece, Italy, Spain... are enormous. Each country needs its
own currency and monetary policy.
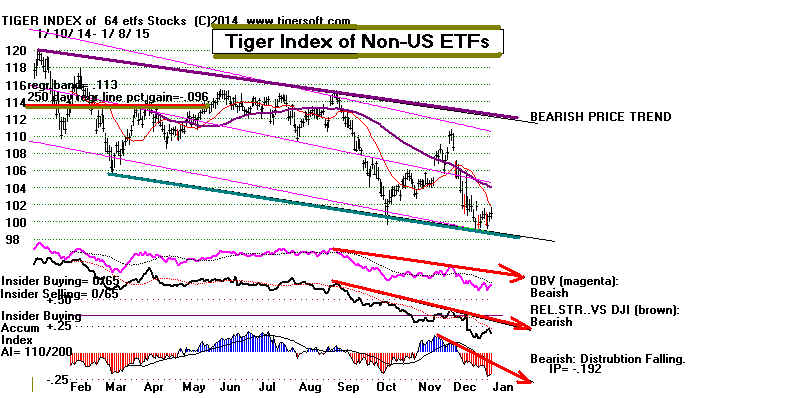
Friday's Job Numbers
Friday's Job Numbers are
important, but more important will be how the
market reacts to them. A DJI failure to surpass 18000 and a turn-downwards
will probably bring another test of the DJI's rising 65-dma. A close above
18000, on the other hand, while bullish, could still set up a Peerless Sell
if the DJI gets past the 2.0% upper band.
We should compare the new December
number that comes out just
before the opening not just with the November's 321,000 but the 2012
December 214,000 number. See the recent past data here - Jobs Report
Anything above 84,000 will increase the 2014 totals for new jobs.
But 150,000 is probably needed just to keep the economy growing fast
enough to ensure it keeps up with working age population growth. With
falling gasoline prices boosting seasonal December retail demand
and hiring, I expect the January number to be well over 200,000.
Gold and silver stocks stalled at the resistance of their 65-dma. NUGT's
65-dma is at 15. With a negative Accumulation Index, I would be happy
to sell there the second half of the long position taken a week ago at 11.7/
If it can clearly surpass the 65-dma as it did 6 months ago, we can buy it
back.
A Crude Oil Bouce Soon? Yes. Recovery? No.
Just as the mining stocks rebounded from a deeply oversold condition,
so to Crude Oil might, too. But first, we will need to see the Closing Powers
for the Crude perpetual contract and the Crude ETF break their downtrends.
And until we see a series of very weak openings, I suspect we will not have
seen a very reliable bottom. Any recovery here will likely be very short-lived.
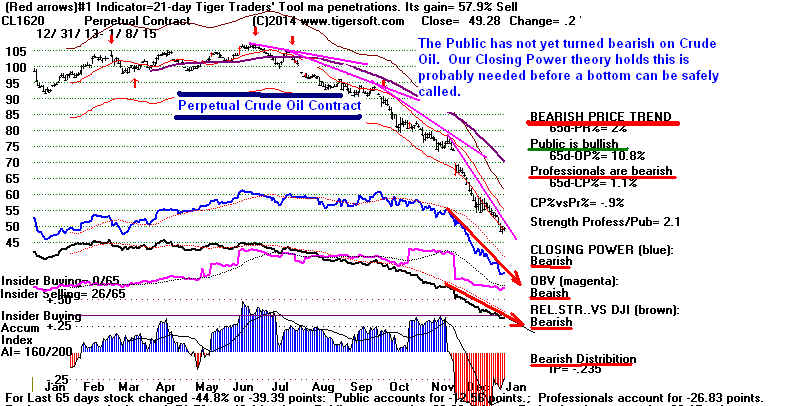
Continue to hold FAS, the leveraged ETF for the big banks. But plan to sell
it near 130. There is still too much distribution. If it does stall out near
130, a significantly bearish head/shoulders pattern will be emerging.
(More on this if this, in fact, does take shape.)
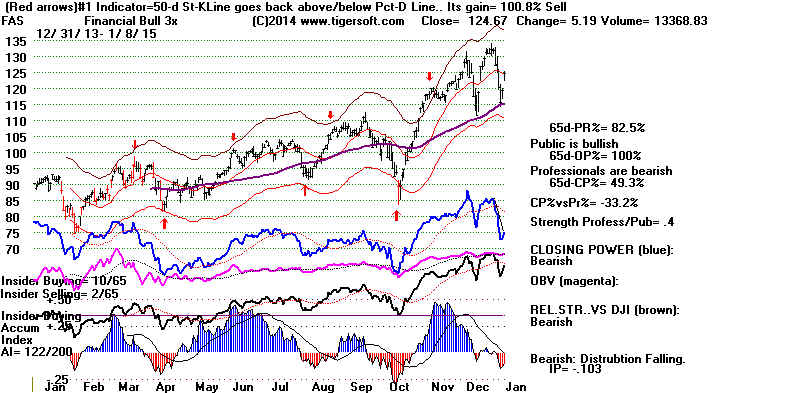
================================================================
1/7/2015
Expect A DJI
Bounce Back to 18000 just in Time
for Friday's Job Numbers...
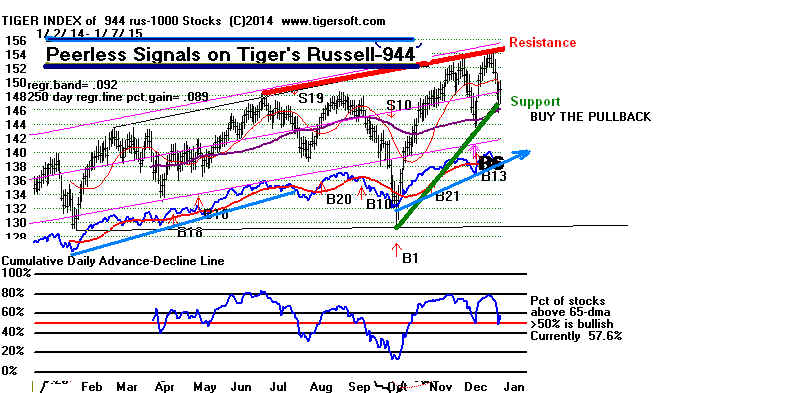
Peerless Was Right, after All.
Now we see why the Peerless system gave no Sell on the unconfirmed DJI
closing highs right after Christmas. The resultimg decline would be too limited to
give us a good re-entry Buy signal. Only a minimum-sized decline to the rising
65-dma was to follow. As it is, Peerless remains on an intermediate-term Buy.
(No new Buy signal is needed for this. It is the last major Peerless Buy or Sell
that we say is the "operative" signal.)
Friday Will Be Important
What we have now is a narrowing, rising wedge pattern in the DJI
and
a trading rally within flat and narrow trading ranges for SPY
and QQQ.
These ranges are too narrow a set of patterns to trade except simply by expecting
a bounce now back up to the resistance lines of the DIA, SPY and QQQ.
A very good Job Report on Friday seems likely. Ironically, this may be
prove bearish because it will give the buyers of today a perfect chance to
sell into strength. It would also give interest rate "hawks" reason to say
that the Fed needs to tighten up now so that it will have some ammunition
left in case the market and the economy declines next year.
This and Republican austerity could prove disastrous. It would invite
a revisiting with 1937's disastrous premature tightening by FDR
and the FED. Did you notice how weak Up-hour volume was today? We also
will need the closing on Thurday to be much above the opening to move
up the Tiger Closing Powers more convincingly. If not, Friday's Job report
could bring another short-term top with a decline that might not stop so politely
at the rising 65-day ma.
How to trade now?
(1) I like the prospects of the best performing low-priced
biotechs.
This is the beginning of the year when those that show new bulges of
institutional Accumulation (above +.40) have a good chance of being the
best performers for the rest of the year. See them at the top of the Bullish
MAXCP list tonight. Let's see if IBB's Closing Power breaks out to a
a new high. This would help confirm my suspicions that Professionals
are buying up Biotechs for 2015.
(2) The safest plays now are probably the many bullish MAXCP Reits.
The yields of 10-Year Treasuries are still falling and below
2.0%.
(3) FAS, the Big Banks' leveraged ETF I have said seems always to
be a good Buy when its Closing Power turns up on dips to the 65-day ma
or lower. That applies now.
4) Buy NUGT, the volatile 3x leveraged ETF for silver and gold mining stocks
BUY ONLY when it closes decisively back above its 65-dma,
perhaps a point
above today's close. If you trade NUGT, it is important
to become familiar with
some of the basic rules for trading this roller-coaster.
Important: For leveraged ETF traders: See Rules
for Trading NUGT's
Tops, Turns and Trends.
===============================================================
OLDER HOTLINES
===============================================================
1/6/2015
The speed of the DJI's decline is too
great to try to call
a bottom at the rising 65-dma which we have now fallen to. Better support
is expected at DJI 17000. This coincides with the DJI's 200-day ma and
the lower band. This would bealso be more consistent with the typical
declines following the type of bearish divergences of the DJI's new high
that we saw recently from our key internal strength indicators. See Table 1
below.
Better and safer would be buying the ETFs again and FAS when their
Closing Power downtrends are broken and also when the Hourly
DJI's DISI
(OBV) downtrend is broken. I notice, too that the CCI for the DJI still
has not fallen below -150 and so cannot be said to have reached oversold status.
NUGT has now jumped up from 10.5 at the opening on 1/2/2014 following its
recommendation here and reached the 65-dma with a close at 15.15. It may
go much higher. But 30% profits in 4 days is reason enough to take profits
in 1/2 the position. I believe the EURO difficulties with Greece have long been
factored into the markets. What's really concerning Wall Street. Let me
suggest it's the political change in Washington and the US Senate.
Waiting on The Republicans
The rapidly falling 10-year Fed rates and the falling Foreign
ETFs tell of serious
problems: DEFLATION and a WORLD ECONOMIC SLUMP. I hope I
am wrong, but the last thing Americans need now is a Republican Congress
fixated on the danger of a weak Dollar and adamantly opposed to productive
public works spending to create jobs and modernize America's crumbling
infrastructure. It will be very bullish if Republicans now remember how much
the big public roads' spending programs of 1925 and 1955 boosted the national
economy. I think the US markets are waiting now to see what actually will be
the Republican new economic program.
Flagrant Triple Late December Non-Confirmations
If we had accorded a December Sell S7 to the recent flagrant triple non-confirmation
of the DJI new high by these internal strength indicators,
1) P-I (down 80% from its 65-day high),
2) the negative V-I and
3) the negative IP21,
we would now be studying the Peerless track record shown in Table 1 just
below. But I would think we should only be really looking at the 4 cases that
occurred after December 25th and before January 1st. In
3 of the 4 cases
the DJI fell beyond the 2.5% lower band but not below the 3.5% lower
band. This would seem to be the lesson for us now. 17000 on the DJI
should hold.
Table 1
Flagrant Triple NCs of DJI New CLosing High in December
Date la/ma
Aroc Adj-PI IP21 VI OPct
65-d Current
Outcome
Pct Peerless
Change Reading
(Numbered signals occurred from 12/26 until 12/31.)
-------------------------------------------------------------------------------------------------------------------------------------------
12/26/2014 1.018
.160 50 -.004
-60 .217 .049
none
DJI has fallen to 1.9% lower band so far.
1
12/31/1934 1.024
.141 12 -.065
-49 .081 .149
S16
Decline only to 2.9% lower band on 1/15/1935
2
12/30 /1955 1.008 .125
12 -.137 142
-.024 .048
none
DJI fell to lower 3.5% lower band.
12/19/1958
1.024 .153 36
-.040 -219 .246 .089
none B13 on 12/23
DJI rose strongly.
3
12/30/1959 1.009 .316
-30 -.053 -231
.093 .070
S16, S12
DJI fell below lower 3.5% lower band from 677 to 599
12/17
/1963 1.023 .309 -125 -.012
-493 .235 .035
none B17 on 12/19.
DJI rose strongly.
4
12/29/1999 1.025 .571
-215 -.063 -67
.239 .114
S16, S9
DJI fell to lower 2.5% band.
12/19/2013
1.013 .158 -19
-.023 -48 .053 .032
A more timely S16 on 12/30.
DJI fell to lower 5.5% band.
|
DJI and Peerless Signals +
QQQ and Closing Power Trendlines
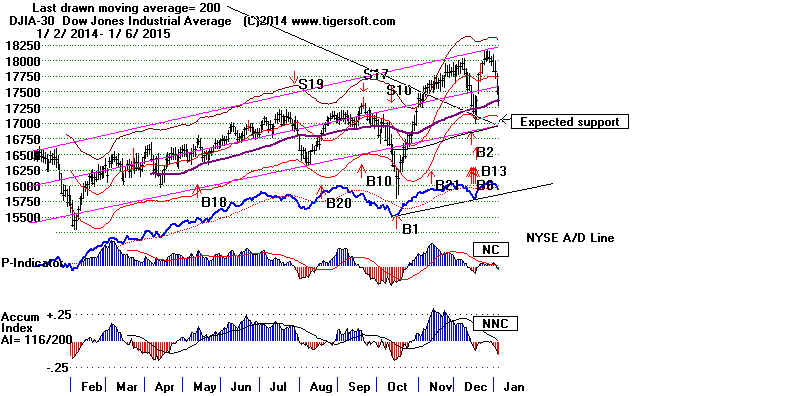 |
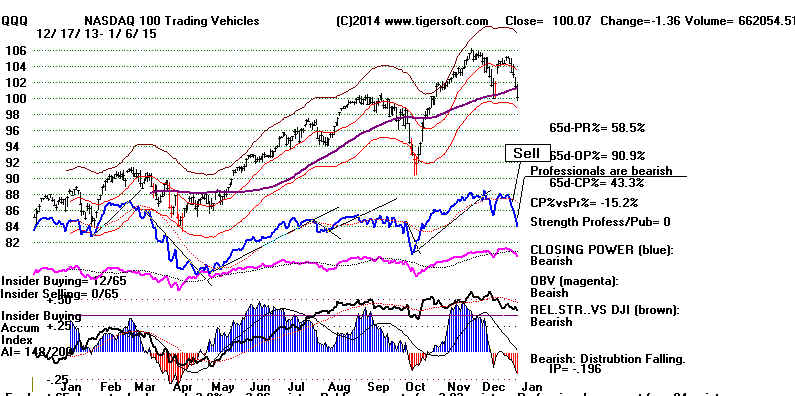 |
------------------------------------------------------------------------------------------------------------------------------
OLDER HOTLINES
------------------------------------------------------------------------------------------------------------------------------
1/5/2015
Today the DJI plunged below the short-term
support of its (red)
21-dma. in the chart below. It will now need to test
its intermediate-term
support from 17100 to 17300 (where its rising 65-dma is). The type of triple
non-confirmation of a DJI new high that we saw just after Christmas is certainly
powerful enough to bring a decline to the lower band, but this type of non-confirmation
is generally just not reliable enough looking back at the whole period since 1928 to
be treated independently as a Peerless Sell. (See Table 1 below and charts).
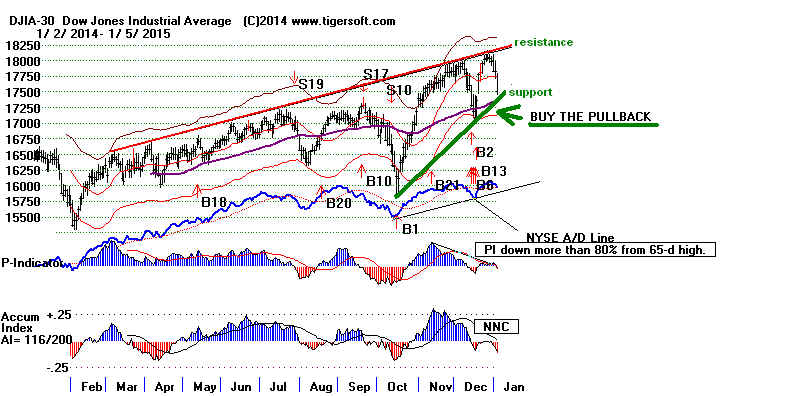
Emerging ETFs were particularly weak today, as were bank stocks. If Greek
voters decide to leave the Euro Zone, Italy may threaten to follow. Currency
devaluations would probably be very good for much of the Greek economy, but not
to creditor-big banks, including some in New York. The Greek Election which
will decide the next government there is not until January 25th. See New York Times'
article and Roubini's background report.
The rising Dollar still hold more upside for
the big US banks and the US stock market, I believe. When the FAS Closing Power
next breaks a downtrendline that looks useful, we will buy it again. After all,
there
is still no Peerless Sell.
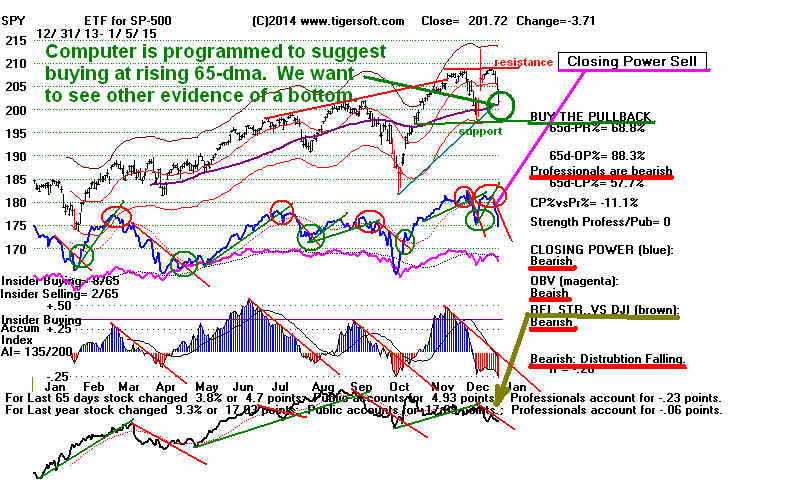
Instead, I advised taking profits in the key ETFs, DIA, SPY, QQQ, IWM
and FAS when their Closing Powers were violated. I
suggested that a good rule
to follow in cases like this when the rise in the Closing Powers is steeply up and
there is no convenient CP uptrendline to base a decision on, is to just take profits
when the Closing Power falls below its 21-dma. Adding more Bearish MINCP
stocks to a hedged portfolio also is suggested at these times. I also suggested
buying NUGT, the 3x leveraged bullish Mining Stocks ETF. This would seem
to have great upside potential, considering how over-sold it is, how January
ends the tax-loss selling, the huge climactic volume for the last two months
and now the break in its Closing Power downtrend. See the NUGT chart below.
Without A
Peerless Sell, The DJI's Lower Band Should Hold.
The best support for the DJI is expected now to come in around 17100. This
is where our lower band is. We will want to see some breaks in the current
downtrends, such as the Closing Powers and the Hourly DISI-OBV
Line.
Will Small Biotechs Next
Emerge As Leaders?
Since many very good advances begin in these third-years of the Presidential
4-year cycles after January 15th, I still think we should watch for new biotech
breakouts showing the same red high volume and intense Accumulation that was
most commonly present in last year's big winners. Interestingly, many biotechs
escaped today's 2% decline. Also interesting, Biotechs probably accounted for
35% of last year's New Issues. Some of these will surely make nice advances in 2015.
I will add soon these to the Biotech download without waiting for them to have
a full year of data.
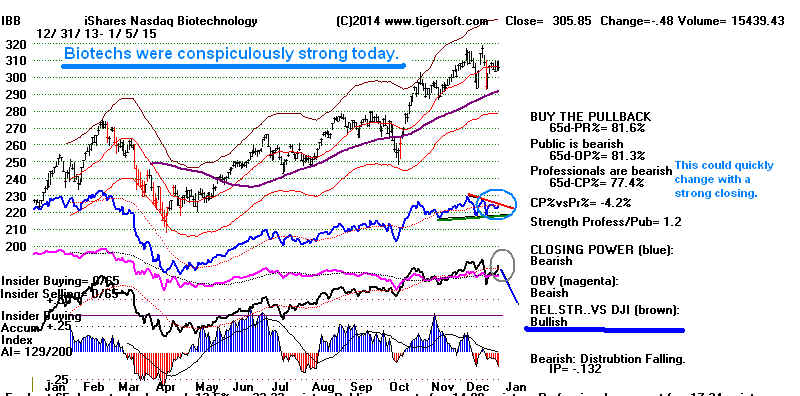
Sell Signals based upon Triple NNC of
DJI new high: 1928-2015
See charts....
Here we do not consider how far up above the 21-day ma the DJI is.
Conditions:
1) 65-day new high.
2) P-Indicator is less than 20% as high as it was on its own 65-day high.
3) IP21 (Accum. Index) must be below 0.
4) V-I must be below 0.
5) December-June only, so as to see effects of bullish seasonality.
Losses were accorded if the DJI did not fall to at least the 3% lower band
in a month, the DJI just kept rising in a bull market, the DJI rose another
5% or three weeks longer before reaching a peak.
These signals did show 5 December successes and only 2 December losses.
The 9 failures occurred in:
March 1930
December 1958
=============
April 1959
December 1963
===========
Feb 1964
April 1964
April 1965
April 1999
April 2006
Those entires made bold were not sells under
present Pererless system. |
The 16 successes occurred in:
January 1929
May 1929
December 1934
===========
March-April 1936
December 1956
===========
May 1959
December 1959
===========
April-May 1964
March 1976
Feb 1980
April 1981
May 1998
December 1999
===========
January 2000
May 2012
December 2013
=========== |
|
Follow-Up on NUGT upon Its Closing Power breaking its downtrend. 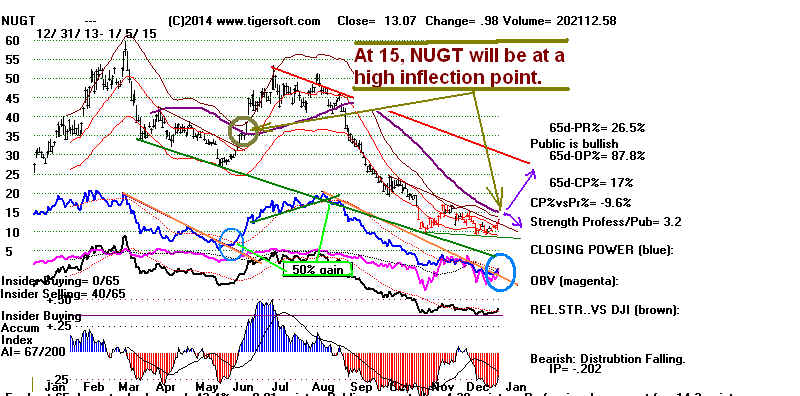
|
===============================================================
OLDER HOTLINES
===============================================================
1/2/2015 Patience is needed now. Resistance is at DJI-18200
and good support is probably at the 21-day ma at 17750. Januaries with
the internals like we now see have about equal potential to rally and to fall.
An early January retracement is most common in these third-years
of a Presidential cycle. After that, very fine rallies usually develop from bottoms
made between January 15th and February 8th.
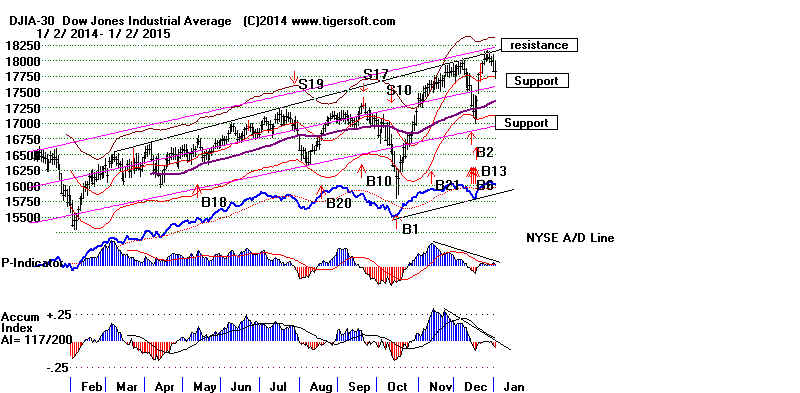
In fact, the gains are so significant then that Peerless now does not easily
produce any sell signal from February to June. I presented conclusions
to this effect at the January Tiger UserGroup meeting this past Saturday.
See the conclusions shown below and at
http://tigersoftware.com/meetup/January/one.htm
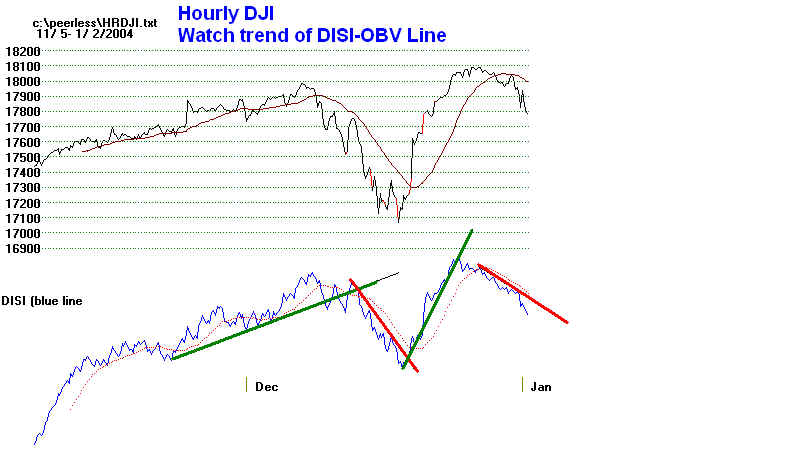
The short-term is still bearish, however. See the
Hourly DJI chart above
and the across-the-board Closing Power ruptures of the key ETFs
Closing Powers' 21-dma: DIA, SPY,
QQQ, IWM and FAS. There
are more bearish MINCP stocks than bullish MAXCP stocks.
Professionals are clearly net sellers now. But since Peerless did
not give a Sell signal, the current decline will probably bring
a retreat to the lower band.
I was asked to test the old Sell S17 back to 1928. It would have given
a Sell on December 24th. But, I do not trust it. Its history shows
5x more bad signals than good signals when compared with the current Peerless.
So, I think the decline will be shallow. It appears to be normal
profit-taking.
The best performing blue chips of 2014 were the ones that fell most the day
before New Year's Day. The NYSE A/D Line hardly noticed the DJI
decline.
Low interest rates, falling oil prices and a rising Dollar buttressed the same
defensive stocks and bonds that were last year's best performers. The dynamics
of this Strong Dollar pattern will, I think, not soon change.
This a self-perpetuating
and reinforcing mechanism, at least, until the costs of loss US manufacturing
jobs become a hot political topic.
Which Stocks Will Lead A 2015 Rally?
Even weaker internals in the first half of 1999 did not
prevent a grand blooming
of speculation in secondary tech stocks until March 2000. This should be
true enough in 2015, so that I think we should know what technical patterns
we should be searcing for this year. I think we can make more money this
year than buying and selling leveraged ETFs. Please see my study of the 18
best performing stocks of 2014. Their charts are shown at the bottom of
http://tigersoftware.com/meetup/January/two.htm
Each of these showed an IP21 bulge of at least +.375 before
or during their
breakouts. In 15 of the 18 cases there was red high volume. In 11 instances
there was a price gap. In 8 cases, there was a concurrent IP21 bulge
above +.50. In 13 cases, the company had fewer than 310 employees.
Biotechs made up the majority of these stocks, 11 of 18.
As stocks pop up this year that meet these conditions, I will highlight
them at the top of the Bullish MAXCP reports. As you know,
these often make superb purchases if you buy them on the first dip when
the Closing Power turns up. So, you want to keep a running list of these
high IP21, red-high volume breakouts above well-tested resistance and follow
their subsequent progress.
18 Best Performing Stocks in 2014 over
$8.00
(C) 2014 William Schmidt, Ph.D. All rights reserved
Biotech with sudden IP21 bulges, gaps and high volume dominated the
best performing stocks. Trade these with Closing Power trend analysis
to avoid long periods of quiet Accumulation.
Symbol 12/31    Pct        IP21   Red   Gap  Employees
                Gain       Bulge  High
                           >.375  Vol.              concurrent IP21 bulhe over .50?
-----------------------------------------------------------------
RDNT    8.53    410%       yes    yes   no    4249  Med.Lab  no
AVNR   16.95    404%       yes    yes   yes   N/A   only on second move.
       Avanit Pharm:Website: http://www.avanir.com
OVAS   44.22    383%       yes    no    no    28    concurrent IP21 bulhe over .50
       OvaScience: Website: http://www.ovascience.com
AGIO   112.04   367%       yes    yes   yes   96    no
       Agios Pharm: Website: http://www.agios.com
BLUE   91.72    337%       yes    yes   yes   124   no
       BlueBird Bio: Website: http://www.bluebirdbio.com
RCPT  122.51    322%       yes    yes   no    41    no
       Receptos Bio: Website: http://www.receptos.com (San Diego)
TGTX   15.84    306%       yes    yes   no    16    no
       TG Therapeutics: Website: http://www.tgtherapeutics.com
PTX     9.39    272%       yes    yes   yes   191   no
       Pernix Therapeutics: Website: http://www.pernixtx.com
VDSI   28.21    264%       yes    yes   yes   382   concurrent IP21 bulhe over .50
ACHN   12.25    269%       yes    yes   yes   61    concurrent IP21 bulhe over .50
       Achillon Pharm: Website: http://www.achillion.com
FOLD    8.32    254%       yes    yes   yes   92    concurrent IP21 bulhe over .50
       Amicus Therapeutics: Website: http://www.amicustherapeutics.com
ASPX   52.48    235%       yes    yes   yes   33    concurrent IP21 bulhe over .50
       Auspex Pharm:   Website: http://www.auspexpharma.com (San Diego)
CVTI   27.11    230%       yes    yes   no  4202    Trucking no
TQNT   27.55    230%       yes    yes   yes 3109    Semi-comductors  no
PLNR    8.36    229%       yes    yes   gap  308    LCDs concurrent IP21 bulhe over .50

RFMD   16.59    221%       yes    yes   gap 3482   Semi-comductors  concurrent IP21 bulhe over .50
MGPI   15.86    205%       yes    no    no   268   Processed Goods. concurrent IP21 bulhe over .50
PTCT   51.77    205%       yes    no    no   133    no
       PTC Therapeutics: Website: http://www.ptcbio.com
|
New Peerless Research-Conclusions:
See http://tigersoftware.com/meetup/January/one.htm
1 Table
1:
2015 Is A
Very Bullish 3rd Year in Presidential Election Year.
-These years
produced gains 88% of the time.
-These years
averaged 13.7% gains compared to other years' average
of 5.95%.
-Only once did
the DJI decline in this year when a Democrat sat in White House.
-The bottoms were
made at the beginning of the new year only in
1951,
1975, 1979, 1987. Bottoms were much more often made from
Jan 15th to
Feb 9th. There were 12 cases of this. March bottoms were
made only
in 4 cases.
2 Table 2 and 3
-In the 44 on-going bull markets since 1928, the DJI
was just as likely
to fall in
January as rise.
-In
on-going bull markets, whether the Accum.Index was negative or
or positive
at the beginning of the year had little bearish on whether
January
rose or fell. There were 7 January rallies when it was negative
and 6 when
it was positive.
3 Table 4
-Using the old Sell S17 in the entire period since
1928 would have
improved the track record of Peerless only twice. In 11 cases, adding
it
would have harmed the overall track record of Peerless.
4 Graphs at bottom of this page.
The
first half of 1935, 1955 and 1999 demonstrate the need to cancel most non-confirmation
Sell
signals in this period The 2006 version of Peerless did not and you can see the many
bad
Sells
that would have resulted. By suppressing such sell signals, the present version of
Peerless
gives
much better results in the first half of 1935, 1955 and 1999.
in
these three years. |
================================================================
OLDER HOTLINES
================================================================
12/31/2014 Patience is needed now. Resistance is at DJI-18200
and good support is probably at the 21-day ma at 17750. Januaries with
the internals like we now see have about equal potential to rally and to fall.
Consider buying NUGT in here. It's long Closing Power
donwtrendline was violated
slightly Tuesday. With tax-loss selling coming off, there could be a nice
rally here, especially if crude oil gets a bounce, too.
No Peerless Sell yet. The year's end brings lots of
cross-currents from tax-loss
selling, window-dressing and the new year's re-investment. So,
Tuesday's big drop cannot be trusted as being the start of a big decline.
But January is a month that can be either very sweet or very sour. So,
we want to be careful now. That the DJI has not yet gotten to
the 2.2%
upper band this month probably means there is more upside potential before the DJI
next falls to the lower band.
We need to see more of what 2015 brings, I think, especially without
a new Peerless Sell. Still Professionals did do a lot of selling on Wednesday
and red Distribution is readily apparent as the DJI kept hitting its head
on the well-tested resistance at 18000. We see this from the way the
Closing Powers for the key ETFs violated their 21-day mvg. averages
on the 31st.
Our Hotline on the 30th recommended profit-taking if this should happen.
So, perhaps, there will now be a shallow retreat to the rising 65-dma.
News
that the Republican Congress will investigate the Fed may
partly explain the sudden rush to profit-taking. On the 31st, I did not
repeat this advise, however, because I considered such declines would
have to be too great to be trusted. We can watch what happens next
to Closing Power and see if Professionals are still new sellers. In that
event, short-term profit-taking would again be suggested.
In general, when the Closing Power swings straight up, as it did in early
December, and does not give us a decent uptrendline whose violations we can
use to sell, I have suggested that we use a drop by the Closing Power below
its 21-dma to be the basis for profit-taking but not short-selling.
See the SPY and FAS charts just below.
SPY Internals are quite weak. A test of
rising 65-dma seems likely if SPY breaks below its
21-day ma at 205.

|
FAS
The 5-day Stochastic has
worked very well with FAS this past year, as have
the Peerless
signals and Closing Power trends. Without a Peerless Sell,
the next Buy by
any of these tools would seem to be good reason to buy
FAS back.
But the closer to its purple 65-dma, we can buy FAS, the safer and
better.
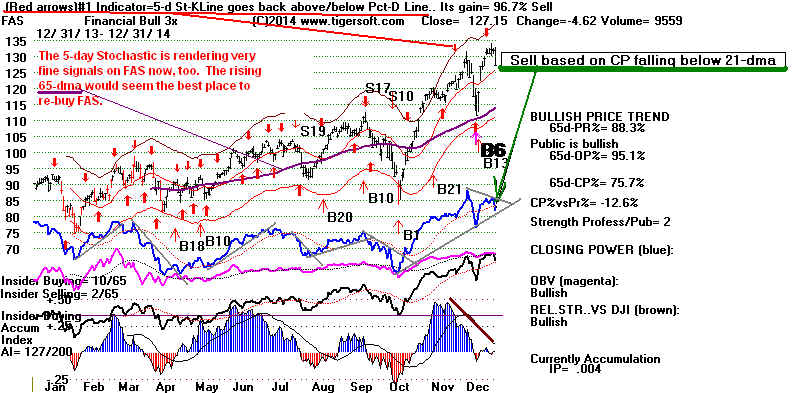
|

Still no Peerless sell signal. Seasonality is still a
very positive (67.4%) factor
here for the next three days. But January is aptly named. It is
two-faced.
There have been many January takoffs and sometimes these occurred
despite a negative OP21 Accum. Index divergence from the DJI at the
upper band.
January Rallies ( n= 32)
11 of the 31 showed negative IP21 on the year end rally. So, a negative IP21 is no
guarantee against a January rally. The distribution shown by the negative IP21
can be eaten up and then a good rally develops.
Close/21-dma IP21 Subsequent Behavior
------------------------------------------------------------------------------------
12/27/1928
1.035
-.015 DJI rose from 290.9 to 322.1 on 2/5/1929
1/10/1930
1.023 -.047 DJI rose from 250 to 294.1 on 4/17/1930
1/2/1934
1.011 -.096 DJI rose from 100.4 to 110.7 on 2/15/1934
1/9/1936
1.025 -.006 DJI rose from 145.7 to 161.9 on 4/6/1936
12/31/1936
1.000 -.125 DJI rose from 179.9 to 193.3 on 3/9/1937
1/4/1943
1.026 .145 DJI rose
steadily much higher.
1/3/1945
1.024 .245 DJI rose steaily.
12/31/1946
1.002 .076 DJI rose from
192.9 to 205.8 on 2/4/1946
12/31/1947
1.017 .197 DJI rose from
177.2 to 183,6 on 2/10/1947
1/7/1949
1.024 -.004 DJI fell from 181. to 171.1 on 2/25/1949
12/31/1950
1.01 .264 DJI
rose from 199 to 228.4 on 6/12/1950
12/29/1950
1.027 .075 DJI rose from
235.4 to 255.7 on 2/13/1951
12/29/1952
.99 .061 DJI rose
steadily a long ways.
12/30/1961
1,01 .059 DJI
rose steadily a long woy.
12/30/1962
1.02 .030 DJI
rose steadily a long woy.
12/31/1963
1.004 -.002 DJI rose a long ways.
1/10/1967
1.015 -.024 DJI rose from 814.14 to 909/63
12/31/1970
1.02 .0155 DJI rose
from 838.92 to 950.82 on 4/28/1971
12/31/1971
1.022 .064 DJI rose
from 890.2 to 968.92 on 4/16/1972
12/31/1975
1.033 -.029 DJI rose dramatically.
12/31/1976
1.015 -.023 DJI rose from
852.41 to 1009.21 on 3/24/1976
12/31/1979
1.004 .008 DJI rose
from 838.74 to 903.84 on 2/13/1980.
12/31/1985
1.019 .021 DJI rose
from 1211.57 to 1299.36 on 3/1/1985
12/31/1987
.985 .072 DJI
rose from 1895.91 to 2405.54 on 4/6/1987
12/30/1989
1.010 .04
DJI rose from 2168.57 to 2347.14 on 2/7/1990
12/31/1992
1.071 .138 DJI rose
from 3168.83 to 3413.1 on 6/1/1992
12/31/1993
1.002 .032 DJI rose
from 3754.09 to 3978.36 on 1/31/1994
12/31/1994
1.017 .061 DJI rose
steadily a long way.
1/2/1996
1.008 .043 DJI rose from
5177.45 to 5683.6 on 3/18/1996
12/31/1996
1.002 -.032 DJI rose from 6448.27 to 7079.39 on 3/10/1997
12/31/2011
1.009 .039 DJI rose from
11577.51 to 12391.25 on 2/18/2011
1/3/2012
1.025 -.09 DJI rose from 12397.38 to 13232.62 on 3/16/2012
1/2/2013
1.019 .054 DJI rose
from 13412.55 to 15387.58 on 5/21/2013
January Declines ( n=40)
But there have also been many Januaries where the market pivots down significantly.
36 of these 40 tops occurred in the new year. 29 if the 40 took place with the
DJI over
the 2% band. It may be a surprise, but only 15 of these 40 tops showed a negative
IP21.
1/7/1931
1.028 - .054 DJI fell from 171.9 to 161.5 on 1/19/1931
1/11/1932
1.041 -.025
DJI fell from 80.4 to 71.8 on 2/18/1932.
1/11/1933
1.056 -.083 DJI fell from 63.8 to 50.2 on 2/27/1933
1/7/1935
1.038 -.05
DJI fell from 105.9 to 100.2 on 2/6/1935
1/10/1938
1.067 -.036
DJI fell from 133.6 to 118.5 on 2/3/1938
1/4/1939 S16 1.028
.082 DJI fell from 154.9 to 136.5 on 1/26/1939
1/4/1940 S16 1.022
.042 DJI fell from 152.4 to 145 on 2/5/1940
1/10/1941
1.02
-.068 DJI fell from 133.6 to 117.7 on 2/14/1941
1/6/1942
1.034 .022 DJI fell from 113.9 to 92.9
on 4/28/1942
12/31/1947
1.011
.032 DJI fell from 181.2
to 165.7 on 2/10/1948
1/22/1952
1.021 .087 DJI fell from 275.4 to 258.5 on 2/20/1952
1/5/1953 S16 1.024
.118 DJI fell from 293.8 to 270.7 on 4/23/1953
1/3/1955
1.034 .095 DJI fell from 408.9 to 388.2 on 1/17/1955
1/3/1956
1.002
-.139 DJI fell from 485.2 to 462.4 on 1/23/1955
12/31/1957
1.020
.09 DJI fell from 499.5 to 454.8 on 2/12/1957
1/5/1960
1.018
-.038 DJI fell from 685.5 to 599.1 on 3/8/1960
12/28/1961 1.005
-.042 DJI fell from 731.5 to 689,9 on
1/28/1962
1/18/1966
1.02
-.028 DJI fell from 994.2 to 911.08 on 3151966
1/8/1968
1.02 -.019 DJI fell from 908.92 to 826.05 on
3/22/1968
1/5/1970
1.027 -.034
DJI fell from 811.31 to 744/06 on 1/30/1970
1/11/1973
1.024 .002 DJI fell from 1051.7 to 869.13 on 6/25/1973
1/2/1974
1.038 -.008 DJI fell from 855.32 to 803.9 on 2/11/1974
12/31/1976
1.027 .11 DJI fell from 1004.65 to 898.66 on 6/30/1977
12/30/1978 1.015 -.015 DJI fell from 831.17 to 743,33 on
3/1/1978.
1/6/1981 S16 1.059
.031 DJI fell from 1004.69 to 931.57 on 2/13/1981
1/4/1982
1.005
-.052 DJI
fell from 882.52 to 800.99 on 3/15/1982
1/9/1984
1.021 .007 DJI fell from 1286.22 to 1132.22 on 4/6/1984
1/7/1988
1.048 .22 DJI fell from 2051.89 to 1895.72 on 2/8/1988
1/2/1990
1.028 .108 DJI fell from 2810.15 to 2553.38 on 1/29/1990.
12/31/1990
1.01
.159 DJI fell from
2633.66 to 2470.30 on 1/9/1991 but then up sharply,
1/6/1998
1.01
-.018 DJI fell from
7978.99 to 7580.42 on 1/9/1998 and then up sharply.
1/8/1999
1.058 .09 DJI fell from 9643.32 to 9133.03 on 2/9/1999
1/14/2000
1.03 -.058
DJI fell from 11722.98 to 9796.03 on
3/7/20000000
1/3/2001
1.025 .022 DJI fell from 10945.75 to 9389.48 on 3/22/2001010
1/4/2002
1.024 .04 DJI fell from 10259.74 to 9618.24 on 1/29.2002
1/14/2003
1.033 .098 DJI fell from 8842.62 to 7524.06 on 3/11/2003
12/28/2004
1.021 .104 DJI fell from 10854.54 to 10368.61 on 1/24/2005
12/26/2008
1.012
.100 DJI fell from
13551.69 to 11971.19 on 1/22/2008
1/14/2009
1.017
.030 DJI fell from
10710.55 to 9908.39 on 2/28/2010
12/31/2014
1.03
.01
DJI fell from 16576.55 to 15372.80 om
2/3/2014
============================================================================================================
Should Peerless Use Narrower Bands Now?
Peerless rides on certain assumptions about volatility, internal strength
indicators and seasonality. In the past, the DJI always reached at least the
2.1% upper band in the two weeks after Christmas before there was a
significant decline. Could Peerless upper bands need to be revised downward
for trading now?
In the past, since 1928, there have always been Peerless Sells before a pivoting
down.
But, Peerless could be wrong. Perhaps the market's recent lower volatility is a
factor.
When I first invented Peerless back in 1981, we used a 4% band to bracket the DJI's
volatility
around the 21-day ma. It was in 1984, I think, that we switched to a 3.5% upper band
to bracket 95% of the DJI's theoretical highs.
Is it time to use a much narrower bands to bracket the DJI's closings? Should we use
a 1.75% upper band to bracket the DJI closings? Here are the DJI charts for the last
5
years: 2009, 2010, 2011, 2012, 2013 and 2014 .
In the 2014 chart below, I show the 1.8% upper band as well as our normal 3.5% band
with DJI closings. You can see we exactly peaked at the 1.75% upper band and
there were some very weak internals at that point.
On 12/16/2014 the DJI closed 1.8% above the 21-day ma but showed a weak
time-adjusted P-Indicator (21-day mvg.avg) reading of only 38. For a new closing
high this was a dramatic deterioration. Worse, the IP21 Accumulation Index was
a negative -.004 and the V-Indicator (Adj Up Vol-Down Vol) stood at -60.
==============================================================
OLDER HOTLINES
==============================================================
12/30/2014 Still no Peerless sell signal.
Seasonality is still
a very positive factor here. Since 1965, the DJI has risen 65.2%
of the time over five trading days following December 30th and
achieved an average gain of 0.7%. I see no reason to sell our key ETFs.
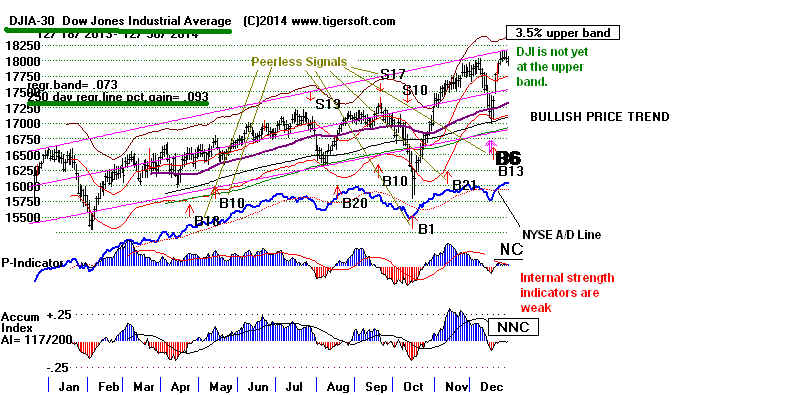
The bullish constellation of falling interest rates, rising Financials, falling oil
price, falling mining stocks and a very strong Dollar continues. This
is an inter-linked cluster that is self-perpetuating and self-reinforcing.
At the present, all the key major market ETFs appear to benefiting,
FAS the most. Such trends are not easily changed. We need much
more evidence of a reversal in these trends than we presently see.
I see no reason to sell our key ETFs yet even though they have
apparently reached resistance. This resistance may be broken above
next year if the typical bullishness of the market in the third year
of the Presidential cycle prevails. As I mentioned a couple of
nights ago, with a Democrat as President, since 1915 the DJI
has always risen in these years! Rising resistance lines also can
be broken above simply because they represent arithmetic trends
in a market that is rising on a steady percentage basis. Thus, even
the DJI's modest +7.2% rate of ascent will soon bring a penetration
of the the rising (red) resistance line in the DIA chart below.
The key ETFs Closing Powers are above their 21-day ma, so we
must assume Professionals in the US remain net buyers. This tells
us, I think, to stay long all the key ETFs. See their charts below.
DOLLAR
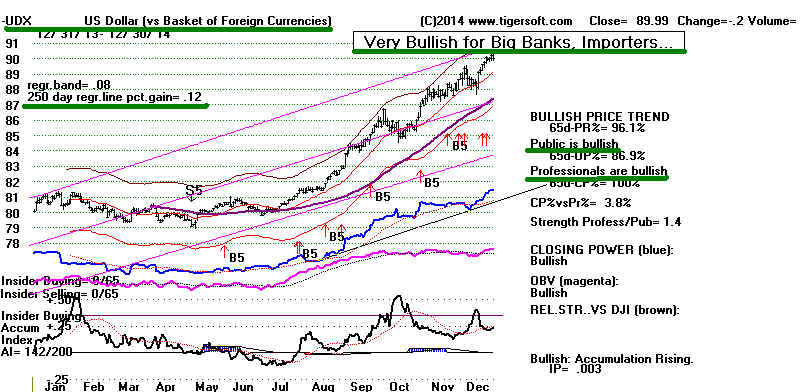 |
OIL - Crude Oil
- There is no change in the downtrend of price and all our
internal strength indicators.
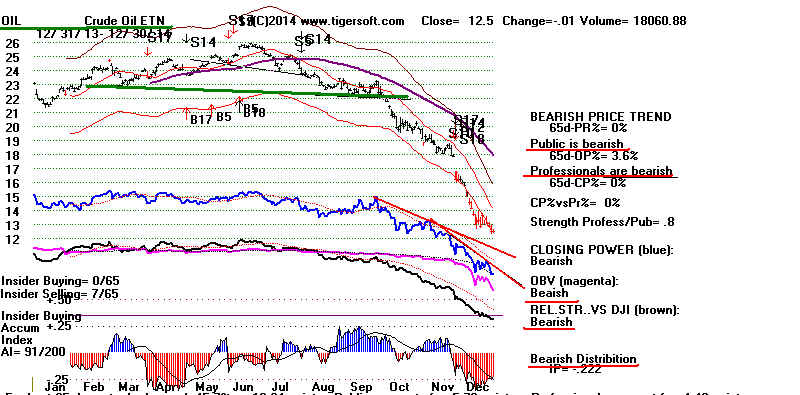 |
NUGT - Mining Shares
Bullish Leveraged ETF
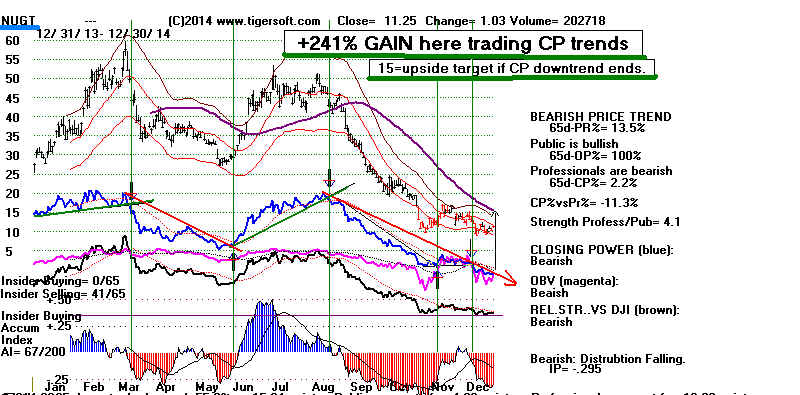 |
New Research
Why
is there no sell even though the DJI closed yesterday 1.7% over the 21-dma yesterday
with negative readings from the IP21 (Accum. Index = -.012) and the
V=Indicator (-72).
there was no sell?
It is because the relevant signal here, a Sell S16 (failure of a Santa Claus
rally), has been
calibrated with care to avoid losing trades based on selling prematurely.
If we allowed S16s
to be triggered by such negative non-confirmations below the present 2.1%
band, the record
since of Sell S16 would deteriorate significantly. Compare the mediocre
trading results
when the S16s is allowed below the 2.15% upper band with its considerable
success as it
is, with the upper banding being between 2.15% and 2.9% bands.
Test-B16s were here allowed below
the 2% upper band
DJI close/ Gain at time
its 21-dma of next Peerless
Buy
-------------------------------------------------------------T16 12/31/1935 1.017 0
T16 12/31/1959 1.011 .099
T16 12/28/1961 1.005 .263
T16 12/29/1975 1.019 -.05|
T16 12/31/1980 1.018 .033
T16 12/31/1984 1.019 -.067
T16 12/29/1994 1.018 -.009
T16 12/30/1994 1.017 -.008
T16 12/30/1996 1.017 -.027
T16 12/31/1998 1.019 -.189
-------------------------------
|
B16s here are allowed between the 2.15
and 2.95% upper bands
DJI close/ Gain at time
its 21-dma of next Peerless
Buy
------------------------------------------------------------- 12/31/1934 1.024 .038
1/3/1940 1.026 .238
1/2/1942 1.022 .132
12/30/1952 1.022 .098
1/2/1970 1.026 .056
12/29/1976 1.022 .071
1/2/1981 1.029 .042
1/2/1990 1.028 .08
12/29/1999 1.025 .129
12/30/2013 1.027 .064
-----------------------------------
|
---------------------------------------------------------------------------------------------------------------------------
OLDER HOTLINES
---------------------------------------------------------------------------------------------------------------------------
12/29/2014 Still no Peerless sell signal.
Seasonality is still
a very positive factor here. Since 1965, the DJI has risen 69.6%
of the time over five trading days following December 29th and
achieved an average gain of 0.8%. Unfortunately, the internal
strength indicators are weakening. A 100-180 point rally higher
right now will probably bring a Peerless Sell. But we do not
have a sell signal yet. In addition, wdow-dressing" and "tax
loss-selling"
can cause misleading minor market moves now. So, I would hold all
the general market ETFs a little longer.
But, to be safe, since Peerless is not perfect and it is also readily apparent
that the DJI's well-tested resistance line is blocking each rally,
let's admit that there appears right now to be more downside potential
than upside potential. Therefore, if the key ETFs'
Closing Powers fall below
their 21-day ma, expect another short-term decline, which will probably
take the DJI back down to its rising 65-dma.
What is Closing Power? It is the running sum of the differences
between daily closing and openings. You should understand from
this that a weak opening that does not bring additional subsequent
price weakness will not drop the Closing Power. In other words,
I don't think we should change course because of overnight price changes.
It is New York trading that ultimately matters.
A Rally Could Still Bring A
Sell.
DJI, Peerless signals and weakening current key values (underlined).
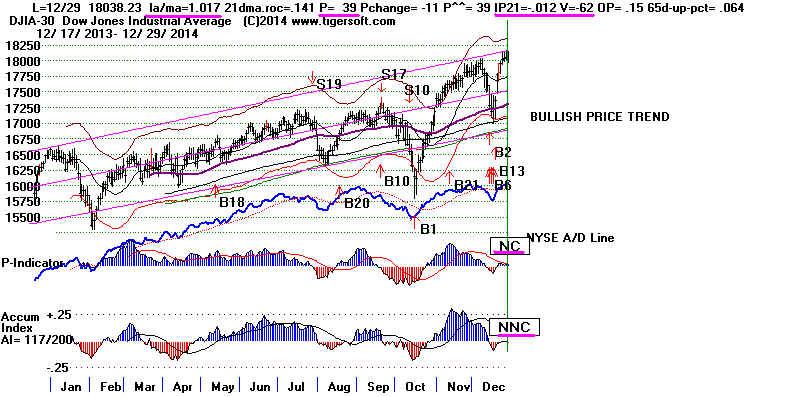
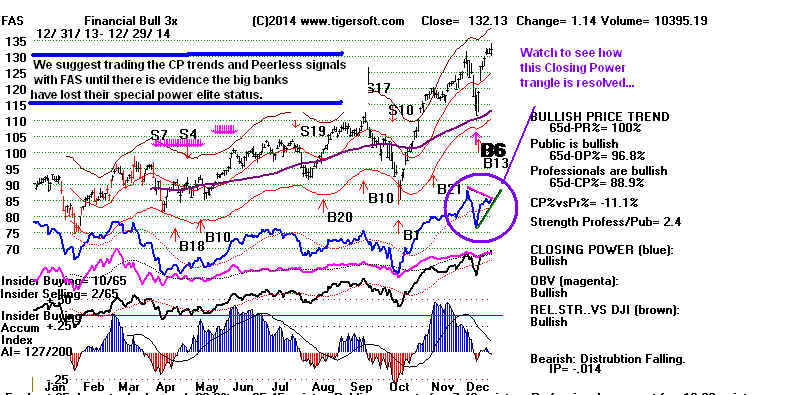
Consumers Are Catching A
Bullish Windfall.
Crude Oil broke down today from its holding pattern.
If it were not
for the bullish role that the end of tax-loss selling might play here, I would
expect another $10 drop in Crude Oil prices. Such a decline would
likely bring another sell-off in Gold and Silver, too, along with
mining stocks and the leveraged ETF - DUST. A further
decline
in Crude will add even more strength to the Dollar. The beneficiaries
of this will be Bank stocks, importers and dividend plays like REITs
and utilities (which abound among our bullish MAXCP stocks now).
Deflation should greatly reduce the need for the Fed to worry about
protecting the Dollar when it decides interest rates. See how the
10-year Treasury rates have bullishly fallen away from their
falling 65-dma
Right now we have a very defensive market and one where the
big banks' computerized trading is pushing up the major market
ETFs. There is a chance that the new year will see a broadening
of the bull market, perhaps like in January 1987.
OIL ETF
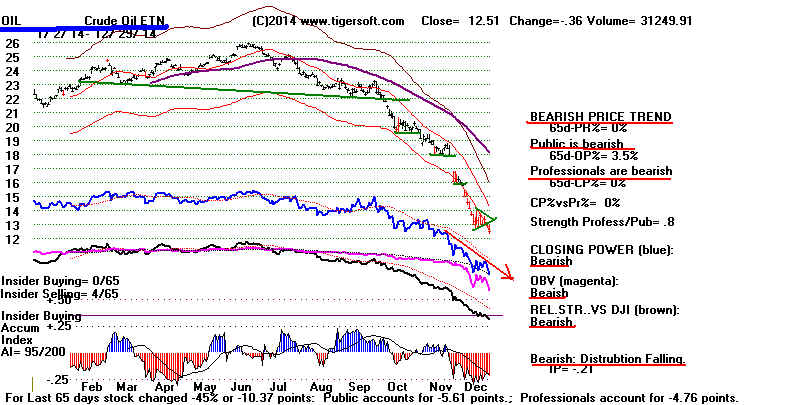 SILVER ETF
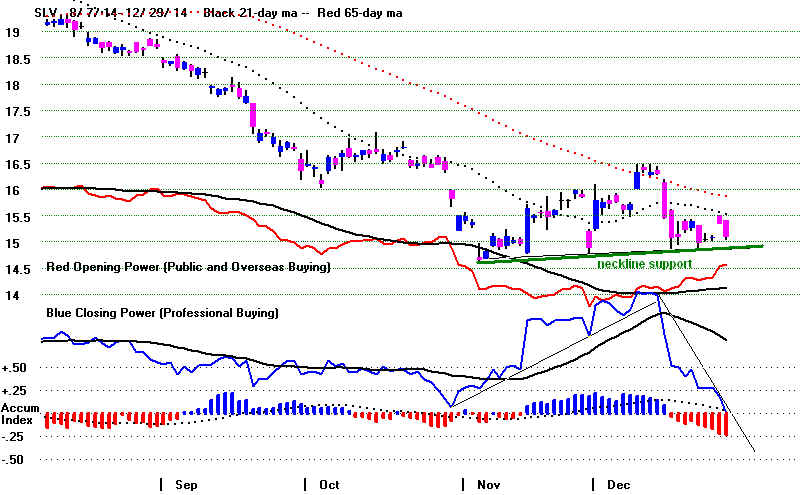
DIA It
sure looks like the rally is a wave ready to breakdown. But without
a new reversing Peerless, I think we have to wait for more weakness
from the Closing Power to justify selling ETFs like DIA. The negative (red)
Accumulation Index warns us that a lot of Distribution has been taking
place on the current rally by the DJI to new highs.
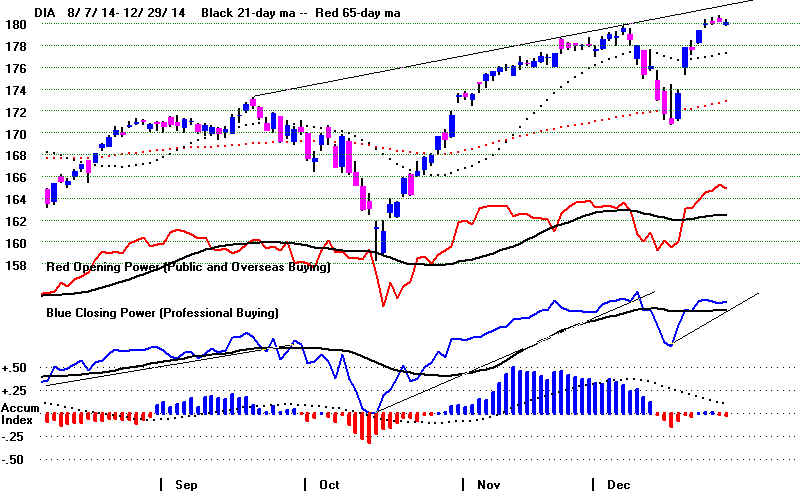
SPY
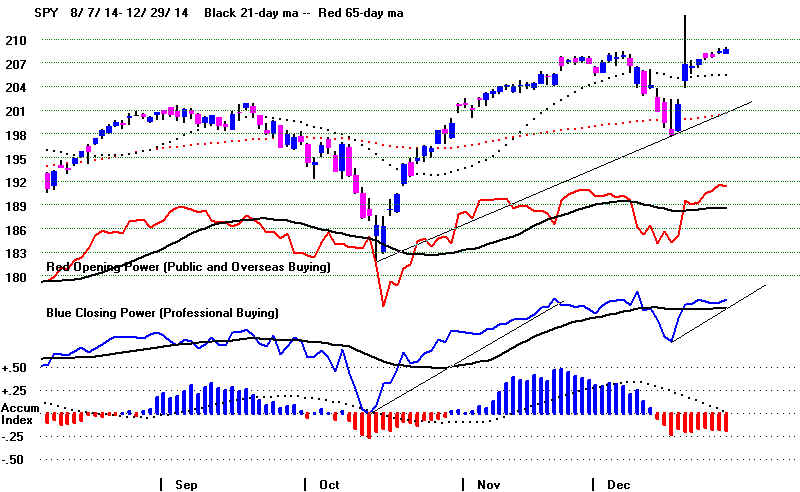
QQQ
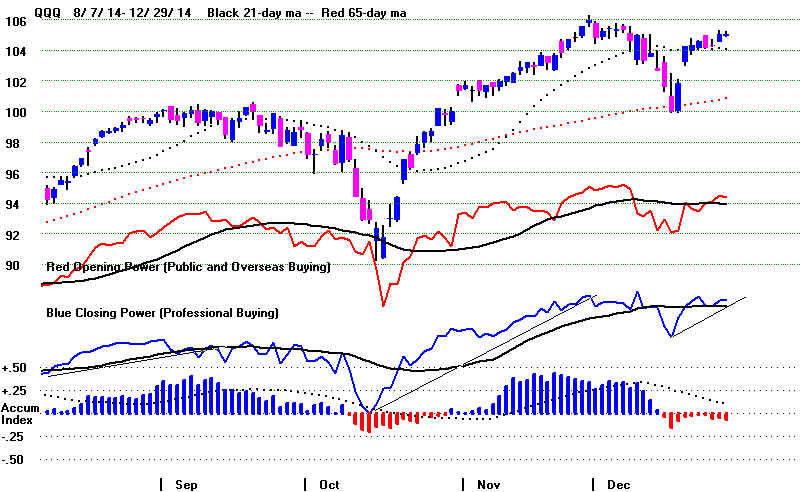
==============================================================
12/26/2014 Next Week Could Bring A Sell. But It Could
also Bring
an Acceleration of the Long Advance. Peerless Remains on a Buy.
Hold all the long general market positions. Seasonality remains
bullish.
The Closing Powers of DIA, SPY, QQQ and IWM are still above rising
21-day
mvg.averages. But they did not confirm the recent highs. This could be
setting up
a reversal back downwards if the Closing Powers break below their 21-dma.
The steep swing upward in Closing Powers does not yet present us with a
convenient Closing Power uptrend to use. Instead, I would use the 21-day ma
of Closing Power. I would not argue with anyone who wants to take some
profits in FAS, however.
FAS is a favorite long play for us, in recognition of the special power the
big banks have within the Obama Administration, Congress and the
Federal Reserve. (There is a chapter in my Explosive Stocks book
which stresses the investment value of knowing who is atop the American
Power Structure. From a cynic's point of view, the big banks have looked like
great investments ever since March 2009 when the
President told Jay Leno
that the big banks had
violated no laws in bringing about the Crash of 2008.)
One of the best strategies for making money I know of is to buy FAS
every time there is a reversing Peerless Buy or the Closing Power
for FAS breaks its downtrend. The Big Banks were to Clinton and are to
Obama what Halliburton was to Bush and Cheney.
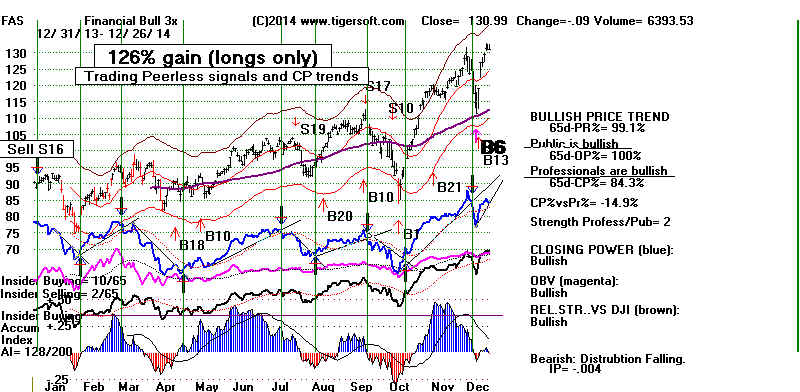
Not Much Upside Potential?
A DJI close 2.4% over the 21-day ma, about 100 points higher than where it closed Friday,
will almost certainly bring a reversing Peerless Sell S16. This will occur
because
the V-I is -60 now and cannot possibly turn positive quickly enough to avoid the Sell.
The only way we can avoid a Peerless Sell would be for the DJI not to close 2.3%
above the 21-day ma this coming week OR move up with great speed and close
above the 2.8% band. Such a move would probably mean a breakout past the rising
and very well-tested resistance line.
Based on the DJI's trading since 1965, the odds would seem to be 69.6% that
that the DJI will rise over the next five trading days. Even more bullish is the
seasonality for next year, the very bullish third-year in the four-year Presidential
Cycle.
See the table below I researched.
This you may find amazing but in the last 100 years the DJI has never fallen in the
third year of the four-year Presidential cycle when a Democrat was in the White
House.
But the DJI's worst performance of these 13 years occurred in 1947 when the
Republicans controlled the Senate. This same division of political power did not
prevent
a 25.2% gain in 1999. Still, the DJI has averaged a gain of 15.5% in these 13 cases
when a Democrat was in the Presidency.
Since 1915, or going back 100 years, the DJI has consistently performed better
in these years between the Mid-Term and Presidential Election Years. Its average
annual gain is much more than twice any of the other years. Apparently, politicians
boost the economy so that they can have a better chance of winning the White House.
To do this in 2015, the two parties will have to cooperate, something that seems
hard to believe can happen in the US. In addition, the DJI will have to break above
its rising resistance line, shown below and the volume will have to expand greatly.
This could happen, but if there is a rally from here over the next week, it is more
likely that we will see a Peerless Sell S15/ This is usually followed by a one to
two month retreat before there is another big advance. Perhaps, this decline will be
a result of cut-backs by the new Republican Congressional majority to Federal
domestic spending or ,perhaps, it will result from a turnaround in oil and gas
prices.
I think the second factor, a rise in natural resource prices, may be about to occur
as soon as tax loss selling ends. But this will require the falling CLosing Power
trends for oil, gold, silver and DUST to be broken
above.
Annual DJI's Performance
in the Four-Year Presidential Cycle
for Last 100 Years
(C) 2014
William Schmidt, Ph.D. All rights reserved.
Presidential Election Year
Following 2nd
Year Following 3rd Year Following
Year
Presidential Election Presidential Election
Presidential Election
1915
1915 +44.2% Dem
1916 +38.7%
1917 -21.7%
1918 +10.6%
1919 +30.5% Dem
1920
-32.9%
1921 +12.7%
1922
+21.7%
1923
-3.3%
1924 +26.2%
1925 +30.0%
1926
+0.3%
1927 +28.8%
1928 +48.2%
1929 -17.2%
1930 -33.8%
1931
-52.7%
1932
-23.1%
1933 +66.7%
1934
+4.1%
1935 +38.5% Dem
1936 +24.8%
1937 -32.8%
1938
+28.1%
1939 -2.9%
Dem
1940 -12.7%
1941 -15.4% 1942
+7.6%
1943 +13.8% Dem
1944 +12.1%
1945 +26.6%
1946 -8.1%
1947 +2.2% Dem
1948
-2.1%
1949 +12.9
1950
+17.6%
1951
+14.4% Dem
1952 +8.4%
1953 -3.8%
1954 +44.0%
1955
+20.8
1956 +2.3%
1957 -12.8%
1958
+34.0%
1959
+16.4%
1960
-9.3%
1961 +18.7%
1962 -10.8%
1963 +17.0% Dem
1964 +14.6%
1965 +6.3%
1966 -15.4%
1967 +15.2% Dem
1968 +4.3%
1969 -15.2%
1970 +4.8%
1971 +6.1%
1972 +14.6%
1973 -16.6%
1974
-27.6%
1975
+38.3%
1976 +17.9%
1977 -17.3%
1978
-3.2%
1979 +4.2% Dem
1980 +14.9%
1981 -9.2%
1982 +19.6%
1983
+20.3%
1984
-3.7%
1985 +27.7%
1986
+22.6%
1987 +2.3%
1988 +11.9%
1989 +27.0%
1990 -4.3%
1991 +20.3%
1992 +4.2%
1993 +13.7%
1994
+2.1%
1995 +4.2% Dem
1996 +26.0%
1997 +22.6.%
1998
+16.1%
1999 +25.2% Dem
2000
-6.2%
2001 -7.1%
2002
-16.8%
2003 +25.3%
2004 +3.2%
2005 -0.6%
2006 +16.3%
2007
+6.4%
2008
-33.8%
2009
+18.8%
2010
+11.0%
2011 +5.5% Dem
2012
+5.5%
2013
+26.5%
=============
=============
=============
=============
Avg
+6.2%
Avg.
+5.7%
Avg. +5.9%
Avg. +13.7%
n = 25
n = 25
n = 24
n=25
68% rose
52% rose
67% rose
88.0% rose
|
A Gold and Silver Stock Bounce?
When the tax-loss selling pressure comes off the falling gold and silver stocks,
they may get a worthwhile play to the upside. We will be watching NUGT to
see if it breaks its downtrend. Oil stocks should also rebound if oil prices
do not continue to fall. Any strong closing should break the downtrend,
but we probably should wait for a clear penetration.
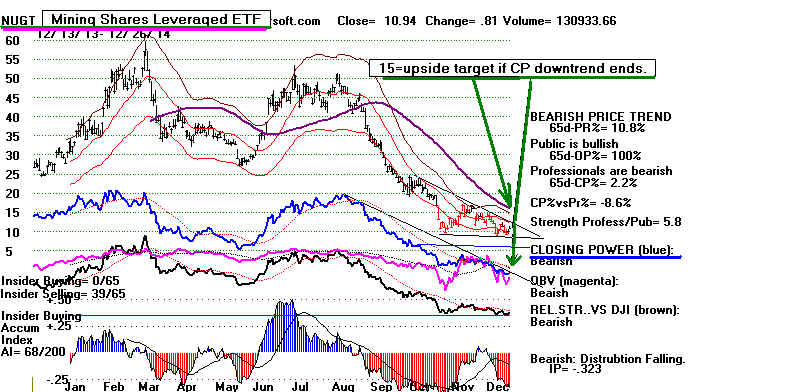

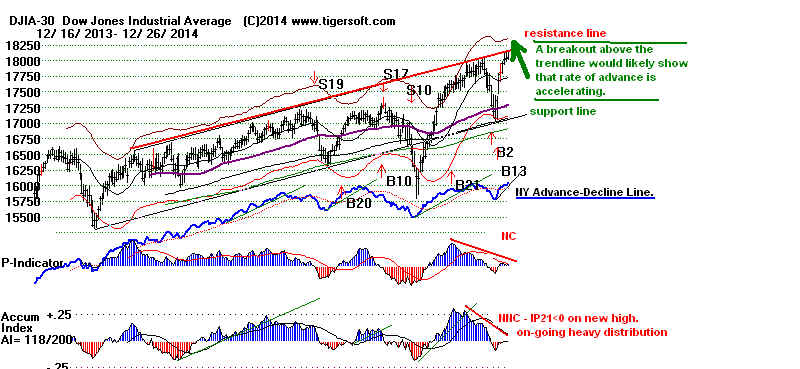
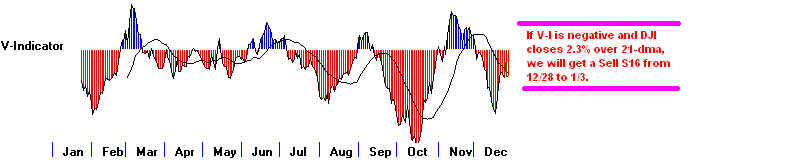
===============================================================
OLDER HOTLINES
===============================================================

12/24/2014 Next Week Could
Bring A Sell.
We remain in a bullish seasonal time, The DJI has risen
67% of the
time over the next five trading days, and avageraged a 0.9% gain
since 1965. The Peerless Buy B6 and Santa Claus Buy B13 signals
have not been reversed. But next week could easily bring a Peerless
Sell S16. These signals can occur in the year of Mid-term elections.
12/31/1934 brought a Sell S16 and a 3.8% decline and 12/30/1938's
resulted in a 10% decline before a reversing Peerless Buy signal.
The DJI has just made a nominal new closing high with many
Peerless indicators failing to confirm the new high by wide margins.
This is never constructive. Moreover, we know that the rising resistance
level has produced what could potentially become a broadening top.
Moreover, all the economic news seems too good to last. What is left
for an encore? Next week we will have to see the internal strength indicators
improve substantially to avoid an end-of-the-year Sell S16. This occurs on a
Santa Claus rally that produces only a weak rally on low volume.
Another 150 Point Rally Will Probably Bring A Peerless Sell
We almost certainly get a Peerless Sell S16 if the DJI closes between
2.2% and 2.9% over the 21-ma and the V-Indicator remains negative
between December 28th and the end of the year. The V-Indicator
now stands at -69. So, it will not be easy for the DJi to avoid this
sell if it rallies to another hundred points. Similarly, we also could
get a Sell S12 on such a rally if the market closes near its lows. In
this case the Accumulation Index will remain negative.
Will The Rise in Short-term Interest Rates Drop the Dow?
This is exactly what happened four times already in 2014.
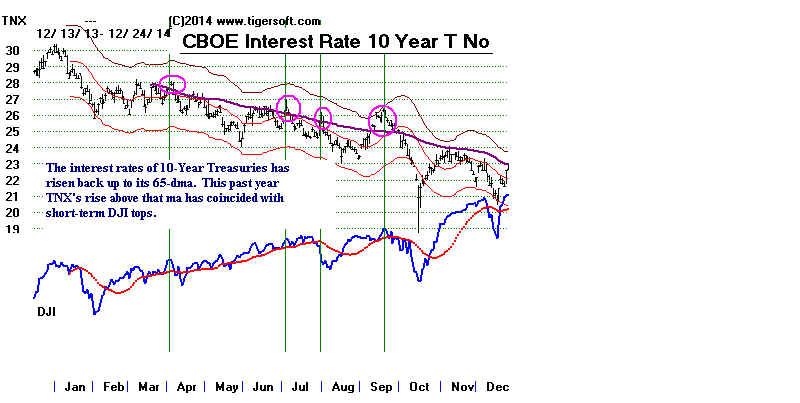
----------------------------------------------------------------------------------------------------------------------------
OLDER HOTLINES
___________________________________________________________________________________
12/23/2014
The Peerless Buy B6 and Santa Claus Buy B13 has brought
the
DJI back up to new highs just above 18000. The rising resistance
line must now be overcome. The seasonality and the news remains
so bullish, I think we may well see a decisive breakout above 18000.
This is not to say that there are not some problems. We must
continue to see the DJI close near the highs for the day. The Closing
|
Powers must not turn down and biotechs, which fell sharply
today,
need to find support at their rising 65-dma.
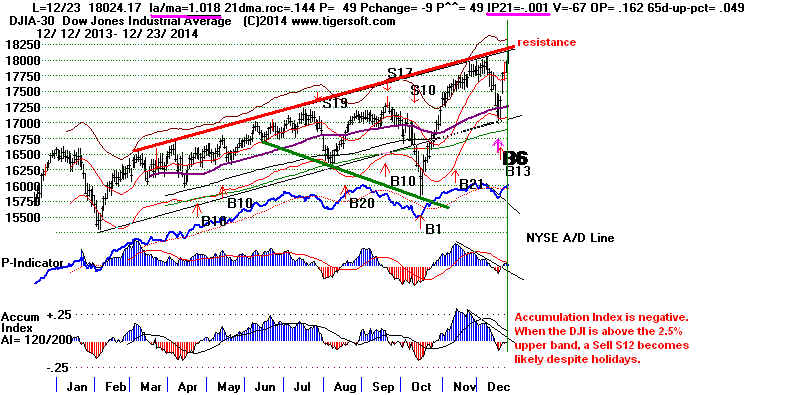
Bullish News Abounds
GNP for the 3rd qtr growth was revised upwards to +5% compared with
the same quarter a year ago. In addition, Saudi Arabia warned OPEC
that the Kingdom would not cut back its crude production if oil fell
even to $20/bar. This is extraordinarily bullish for the US economy
as a whole. The drop in gasoline prices amounts to a massive economic
stimulus, perhaps
$1,150 a year for the average American family.
Gas prices have declined for 87 straight days in the US.
This quickly translates into higher corporate profits. The big retailers
are having a banner holiday. Visa, Mastercard and American Express
"are loving it". The big banks profit from the extra commerce and
are also big beneficiaries of the strong Dollar in other ways.
The Dollar has improved its position as the main medium of exchange
in international trade. Hot money is flooding into US stocks to escape
local falling currencies. And the Fed has a better excuse to keep loaning
money to the big banks virtually for free. No wonder FAS
made
another big gain today.
Even the average wage among blue-collar and service workers is rising.
All this could give the market the power to breakout the DJI-30 above
its well-tested rising resistance. This would signify an acceleration
of the bull market's rate of advance. DJI-20000 and another bullish third
year in the four-year Presidential cycle could become the new reality
in 2015.
But We Could Also Get A Peerless Sell Next Week
The automatic Peerless
Buys and Sells, of course, know none of this bullish
economic news. What Peerless does consider important right now is whether
the DJI closes 2.5% or more above the 21-day ma with either a negative
P-Indicator (an S9) or a negative IP21 (an S12).
Presently the DJI is 1.8% over the 21-day ma and the IP21 (current
Accum. Index) is -.001. Fortunately for the bulls, in all the years since 1928,
there is not a single case of a Peerless Sell between December 23rd
and December 27th. So any Sell this week seems unlikely and probably
should not be trusted anyway because trading the day before Christmas
is much shortened. Any Sell signal tomorrow would be highly suspect.
In fact, between 1928 and 2013, there were late DecemberPeerless Sells in
only ten years. That's 10 in 86 years, seemingly make it very unlikely.
Still it can happen. This would probably take a big sell-off in biotechs to
weaken confidence in speculative stocks and a sudden surge in gold and
crude oil. These are only possibilities, not probabilities at this stage.
Gain on DJI from
Selling
---------------------------------------------------
19341231 S16 .038
19381230 S16 .100
19521230 S16 .098
19591231 S16 .099
19611228 S16 .263
19731228 S12 .028
19761229 S16 .061
19871228 S9
.016
19991228 S9
.128 19991229 S16 .128
20131230 S16 .064
DJI's Broadening Top's Rising Resistance Must Be Overcome.
Given all the good economic news, a
failure to get past the rising resistance
line will
eventually be taken as a bearish sign by traders. I think they will
give the
market the rest of this year and the much of the first week of December
to
breakout, before they turn bearish. We Tiger users should know in
a timely
way if a reversal is at hand simply by looking for a reversal back down
by the
currently rising Closing Powers in DIA, SPY, QQQ, MDY,
IWM and FAS.
At this point, Professionals are still net
buyers, Closing Powers are rising
and we
should stay long these ETFs.
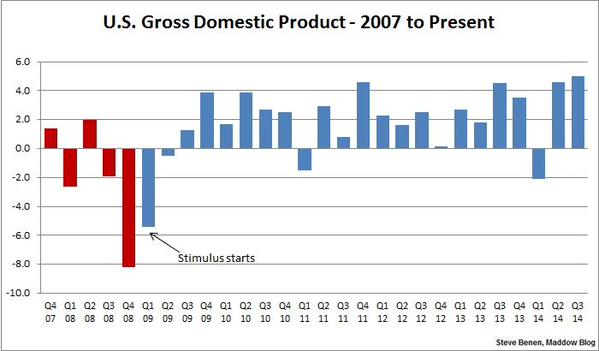
Look for a lot more insider trading in
2015.
See NY Times article: When Insider Trading Is Legal
The ruling by an appeals court to overturn two convictions is a setback in the fight
against rigged markets.
To Key Index and Leading Stock Charts, DJI, SP-500, etc...
Peerless DJI Chart DIA
SP-500 Chart SPY
NASDAQ Chart QQQ Chart IBB Chart IWM Chart
MDY Chart
Hourly DJI-OBV
Please report any bad links
Percent of Stocks above 65-dma - As long as the percentage is above 60%,
the 65-day ma is likely to hold up for most stocks.
DJI-30 76.7%
vs 76.7% vs
66.7% vs
70% vs 50% vs 43.3% vs 47.8% vs 56.7%
OEX
80.8% vs 77.8% vs 72.7% vs 72.7% vs 58.6% vs
51.5% vs 55.6 vs 63.6%
QQQ
83.8% v 83.8% v 82.8% vs 84.8% vs 69.7% vs 64.6% vs 70.7% vs 73.7%
SP-500 81.5%
v 79.7% vs 78.0% vs 76.7% vs 64.1% vs 53.7% vs 57.9% vs 62.3%
Russell-1000 76.8% vs 75.4% vs 73.5% vs 71.7% vs 61.9% vs 50.2% vs 54.6% vs 59.4%
14-a 58,1% vs 57.9% vs 55.5% vs 55.4% vs 48.4% vs 39.0% vs 42.9% vs 45.3%
14-c
62.1% v 61.6% vs 59.8% vs 60.1% vs
53,5% vs 44.9% vs 46.7% vs 50.5% vs 55.3%
14-s 56.7% vs 55.6%vs 55.9%vs 52.6% vs
48.8% vs 41.4% vs 40.5% vs 46.8%
--> 213 +13 MAXCP stocks Bullish
MAXCP Stocks (12/23/2014) Bullish Plurality
--> 59 +155 MINCP stocks Bearish MINCP Stocks (12/23/2014)
--> 70 -22 New
Highs on NASDAQ
27 +9 new lows. Bullish Plurality
--> 143
New Highs on NYSE 14 new lows.
Bullish Plurality |
================================================================
OLDER HOTLINES
================================================================
12/22/2014
As posted last night: "The Peerless Buy B6 and Santa Claus Buy B13 should
move the DJI back up to new highs just above 18000 to test the rising
resistance line. A rally this coming week is highly probable based on past
seasonality. But at the end of the year we will have to watch the internals
closely to see if they weaken and they will give us a failed-Santa-rally
(a Peerless S16). The potential broadening tops remain dangerous signs
of excessive speculation. It will be important for the indexes to
get past their rising resistance lines. Otherwise, another steep decline
could be next. "
You can see below that we are almost up to the well-tested rising
resistance line. If the DJI should stall out here, the risk:reward
ratio will be wuite unfavorable. In addition, the DJI
is now 1.5%
over the 21-dma and the Accum. Index (IP21) is a -.014. This could
easily bring a Sell S12 of the DJI rises another 180 points.
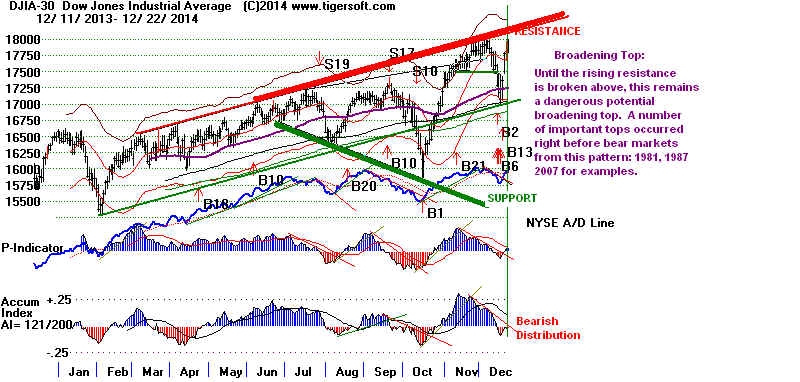
As long as the bank stocks and FAS keep rising the big major
market ETFs,
SPY, DIA and QQQ should be held too, especially in the absence of a new
Peerless Sell or the Closing Powers hooking back down.
Natural gas, crude oil, gold and silver were particularly
weak today. These,
of course, are notoriously counter-cyclical and run contrary to stock trends
much of the time. Russia and other big OPEC countries
may be selling gold.
The resulting strong Dollar keeps boosting the big banks in all sorts of ways.
I think that we may be able to catch the next reversal in the DJI downward
by watching for the reversals back up of the leveraged ETF for MINING
STOCKS (NUGT) and CRUDE OIL's PERPETUAL CONTRACT. You
can see how the decline in Crude and mining shares has coincided
with a rise in the Dollar and FAS, representing the big banks. We will
watch the Closing Power trend in the NUGT chart. It may well be we will
see it break its downtrend in a year-end rally or a January advance. This
would probably not good for the general market ETFs or FAS.
Dollar and FAS versus Crude Oil and Mining
Shares
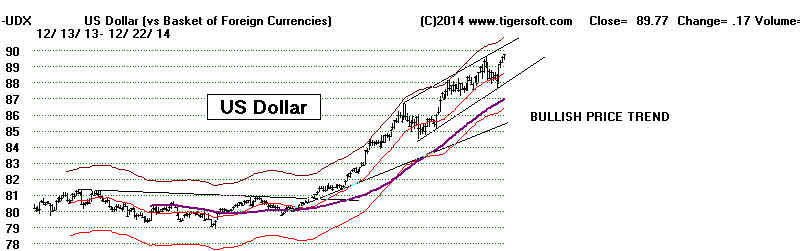
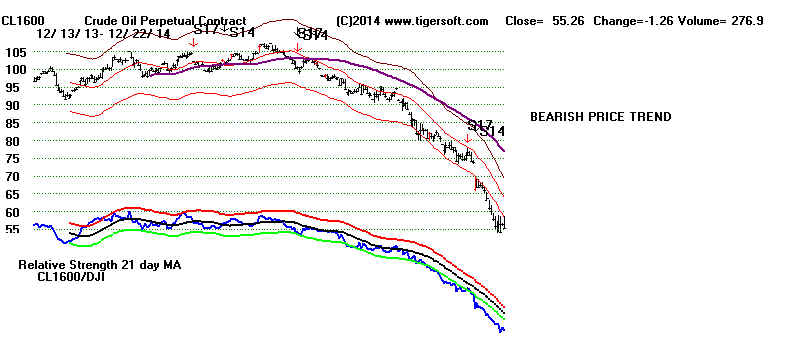 zzzzzzzzzzzzz
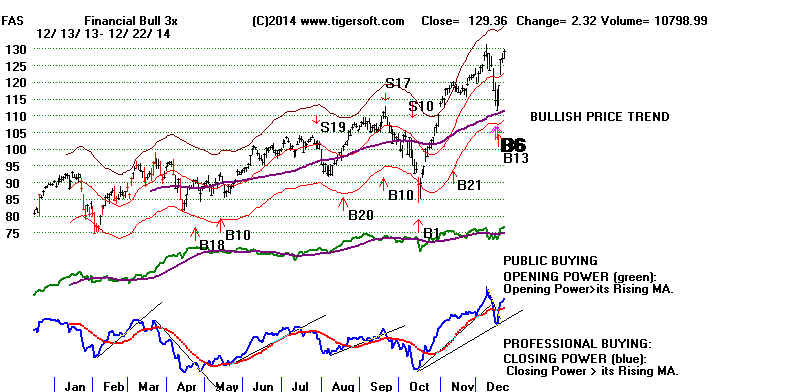
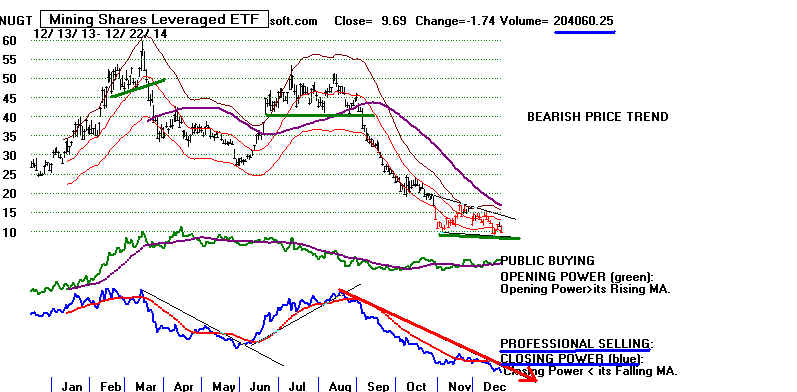
To Key Index and Leading Stock Charts, DJI, SP-500, etc...
Peerless DJI Chart DIA
SP-500 Chart SPY
NASDAQ Chart QQQ Chart IBB Chart IWM Chart
MDY Chart
Hourly DJI-OBV
Please report any bad links
Percent of Stocks above 65-dma - As long as the percentage is above 60%,
the 65-day ma is likely to hold up for most stocks.
DJI-30 76.7%
vs
66.7% vs 70% vs 50% vs 43.3% vs 47.8% vs 56.7%
vs 66.7%
OEX 77.8% vs 72.7% vs 72.7% vs 58.6% vs
51.5% vs 55.6 vs 63.6% vs 72.7%
QQQ
83.8% v 82.8% vs 84.8% vs 69.7% vs 64.6% vs 70.7% vs 73.7% vs
76.8%
SP-500 79.7% vs 78.0% vs 76.7% vs 64.1% vs 53.7% vs 57.9% vs 62.3% vs 70.5%
Russell-1000 75.4% vs 73.5% vs 71.7% vs 61.9% vs 50.2% vs 54.6% vs 59.4%
14-a 57.9% vs 55.5% vs 55.4% vs
48.4% vs 39.0% vs 42.9% vs 45.3% vs 50.6%
14-c
61.6% vs 59.8%
vs 60.1% vs 53,5% vs
44.9% vs 46.7% vs 50.5% vs
55.3% vs 53.2%
14-s 55.6%vs 55.9%vs 52.6% vs
48.8% vs 41.4% vs 40.5% vs 46.8%
vs 504%
--> 213 +13 MAXCP stocks Bullish
MAXCP Stocks (12/22/2014) Bullish Plurality
--> 59 +155 MINCP stocks Bearish MINCP Stocks (12/22/2014)
--> 92 +18 New
Highs on NASDAQ
19 -11 new lows. Bearish Plurality
--> 143
+27 New Highs on NYSE 9 new lows.
Bullish Plurality
|
===============================================================
OLDER HOTLINES
===============================================================
12/19/2014 The Peerless Buy B6 and Santa Claus Buy B13 should
move the DJI back up to new highs just above 18000 to test the rising
resistance line. A rally this coming week is highly probable based on past
seasonality. But at the end of the year we will have to watch the internals
closely to see if they weaken and they will give us a failed-Santa-rally
(a Peerless S16). The potential broadening tops remain dangerous signs
of excessive speculation. It will be important for the indexes to
get past their rising resistance lines. Otherwise, another steep decline
could be next.
Behavior of DJI after December 21st (Sunday)
1965-2013
Probability Avg Gain
of an Advance
------------------------------------------------------------------
Next 3 trading days 76.1%
0.8%
Next 10 trading days 73.9%
1.5%
Next Year?
2015 has bullish seasonal potential. Third years of the Presidential 4-year
cycle are the most bullish of the four years. Looking only at the transition
from the Second Year in the Presidential Cycle to the Third Year, we see that
the DJI rises 76.5% (13/17) of the time over the next two weeks, to January 5th.
In a bull market environment the odds of a DJI rally in this period are (6 of 8)
75%. By the end of the January, the DJI was always up in a bull market
environment in these Third Years, like ours will be. This was also true at the
end of April and May in a bull market. See the new study at
http://tigersoftware.com/PeerlessStudies/ThirdYears/index.html
Without a Peerless Sell, a move towards DJI 20000 could start next
year if the key indexes can surpass their rising resistance lines. Hard to believe,
I know, but if the internals are positive at the start of the year, we may see
January surge like the ones typical of a the third-year in a Presidential Election.
At this point. I see no reason to disturb out long positions in the key ETFs,
DIA, SPY and QQQ. Taking quick 10% profits in FAS on a closing below
the opening is suggested since the Fed's decision not to raise rates for a more
extended period should have been anticipated based on the signs of deflation.
High Volume Options' Expirations
Today' very heavy volume today, a result of the options' expiration, is by itself
not a reliable indication of "churning" or a "reversal downward" when
it occurs
in December after a general market rally. These quarterly surges in volume
have become very apparent since December 2011. In the 3 December cases,
the DJI rallied.
1 December 18, 2011 DJI rose from 11766 to 13234
on March 16th
March 16, 2012 DJI fell from 13233 to 12101 on June
4th.
September 23, 2012 DJI fell from 13559 to to 12588 on
Nov 16th.
2 December 21, 2012 DJI rose from 13191 to 15307
on May 22nd. 2013
March 18, 2013 DJI rose from 14352 to 15307 on May
22nd. 2013
September 23, 2013 DJI fell from 15401 to to 14903 on
October 9th.
3 December 20, 2013 DJI rose from 16221 to 16577 on
December 31st
and then fell to 15373 om February 3rd.
March 25th, 2014 DJI went sidewise for two months and
then rose.
June 20th, 2014 DJI went sidewise for a month and then
declined.
September 22, 2014 DJI fell from 17173 to to 16117 on
October 16th, 2014
|
To Key Index and Leading Stock Charts, DJI, SP-500, etc...
Peerless DJI Chart DIA
SP-500 Chart SPY
NASDAQ Chart QQQ Chart IBB Chart IWM Chart
MDY Chart
Hourly DJI-OBV
Please report any bad links
Percent of Stocks above 65-dma - As long as the percentage is above 60%,
the 65-day ma is likely to hold up for most stocks.
DJI-30
66.7% vs 70% vs 50% vs 43.3% vs 47.8% vs 56.7%
vs 66.7% vs 66.7%
OEX 72.7% vs 72.7% vs 58.6% vs
51.5% vs 55.6 vs 63.6% vs 72.7% vs
70.7%
QQQ
82.8% vs 84.8% vs 69.7% vs 64.6% vs 70.7% vs 73.7% vs
76.8% vs 74.7%
SP-500 78.0% vs 76.7% vs 64.1% vs 53.7% vs 57.9% vs 62.3% vs 70.5%
vs 70.8%
Russell-1000
73.5% vs 71.7% vs 61.9% vs
50.2% vs 54.6% vs 59.4% vs 62.3%
14-a 55.5% vs 55.4% vs 48.4% vs 39.0% vs 42.9% vs 45.3% vs 50.6%
14-c 59.8% vs 60.1% vs
53,5% vs 44.9% vs 46.7% vs 50.5% vs 55.3% vs 53.2%
14-s 55.9%vs 52.6% vs
48.8% vs 41.4% vs 40.5% vs 46.8%
vs 504% vs 48.8%
--> 200 +33 MAXCP stocks Bullish
MAXCP Stocks (12/19/2014) Bullish Plurality
--> 44 -3 MINCP stocks Bearish MINCP Stocks (12/19/2014)
--> 74 +18 New
Highs on NASDAQ
30 +15 new lows. Bearish Plurality
--> 106 -35 New Highs on NYSE 8
-3 new lows. Bullish
Plurality |
===============================================================
OLDER HOTLINES
===============================================================
12/18/2014 The Peerless Buy B6 and Santa Claus Buy B13 should
move the DJI back up and close just above 18000 to test the rising resistance
line there that turned the market down two weeks ago. At that point things
will get interesting! The January 1981 scenario suggests a quick decline
to the lower band would follow. The Janaury 1987 scenario shows that
a great advance is also a possibility.
For now seasonality is very bullish. Since 1965, the DJI has risen 78.3% of the
time over the ten trading days following December 18th. The DJI's average
gain of 1.8% for the next two weeks amounts to about 300 points at current
levels. The market seldom drops the week of Christmas.
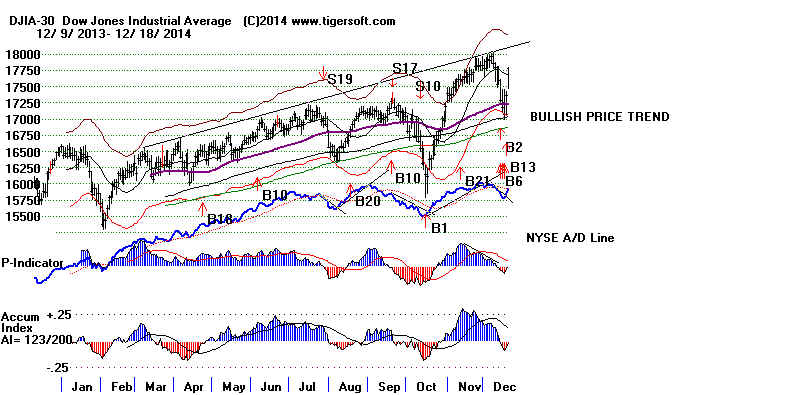
FAS
(3x Big Banks' ETF) tracks superbly with Peerless. So, as long as big banks
run Wall Street and so much
of Washington, they are a natural and very convenient
way for us to play each
market rally.
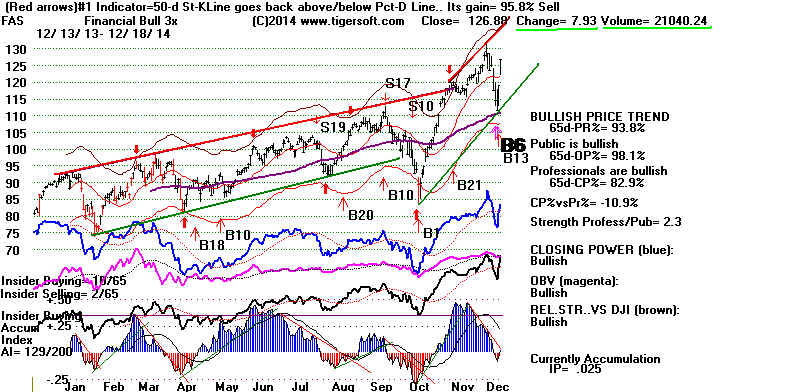
January Will Be Pivotal.
As the song says of Hotel California to the traveler, "This could
be Heaven or this could be Hell." January can be a pivotal
month or it bring a powerful take-off. Fortunately, to us we can watch
the market's ley values, the Peerless signals and the Tiger
Closing Power to see which scenario will play out. And fortunately,
the third year in the Presidential cycle is the most bullish of the
four months.
To Key Index and Leading Stock Charts, DJI, SP-500, etc...
Peerless DJI Chart DIA
SP-500 Chart SPY
NASDAQ Chart QQQ Chart IBB Chart IWM Chart
MDY Chart
Hourly DJI-OBV
Please report any bad links
Percent of Stocks above 65-dma - As long as the percentage is above 60%,
the 65-day ma is likely to hold up for most stocks.
DJI-30 70% vs 50% vs 43.3% vs
47.8% vs
56.7% vs 66.7% vs 66.7%
OEX 72.7% vs 58.6% vs 51.5% vs 55.6 vs 63.6%
vs 72.7% vs 70.7%
QQQ
84.8% vs 69.7% vs 64.6% vs 70.7% vs 73.7%
vs 76.8%
vs 74.7%
SP-500 76.7% vs 64.1% vs 53.7% vs 57.9% vs 62.3% vs 70.5%
vs 70.8%
vs
68.7%
Russell-1000 71.7% vs
61.9%
vs 50.2% vs 54.6% vs 59.4% vs 62.3%
vs 67.2%
14-a 55.4% vs
48.4% vs 39.0% vs 42.9% vs 45.3% vs 50.6% vs 48.1% vs
55.6%
14-c 60.1% vs 53,5% vs
44.9% vs 46.7% vs 50.5% vs
55.3% vs 53.2% vs 58.5% vs 55.7%
14-s 52.6% vs
48.8% vs 41.4% vs 40.5% vs 46.8%
vs 504% vs 48.8% vs 57.3% vs 52.3%
--> 167 +54 MAXCP
stocks Bullish MAXCP Stocks (12/18/2014) Bullish
Plurality
--> 47 -8
MINCP stocks
Bearish MINCP Stocks (12/18/2014)
--> 88 +54 New
Highs on NASDAQ
15 -26 new lows. Bearish Plurality
--> 141 +90 New Highs on NYSE 11 -7 new lows. Bullish Plurality |
===============================================================
Older Hotlines
===============================================================
12/17/2014 As expected, we got our Santa Claus Buy B13 today.
This is a simply a Buy signal that occurs every year
on December 17th or in the next few days when the
DJI is not more than 2% above the 21-day ma, not
more than 4% below it and there has not been a
recent S1, S9 or S12 Sell signal.
Breadth was superb today. There were 2841 up on the
NYSE and only 373 down. This is a ratio of 7.6 to 1.
This compares very favorably with the start of other
reversals back up after similar corrections in recent years.
See the study I did of this when
the market turned back up
in October.
Another very bullish aspect, was the Closing Power take-off.
When you look at TigerSoft candle-stick charts, you will often
see how the start of very good swings up after a sell-about
to be reversed feature a very big blue bar showing Professionals
are switching from being net short to being net long. As examples,
look at the candle-stick chart of FAS and DIA.
The bullish period between now and early January
should make profitable today's purchase of DIA, SPY,
QQQ and FAS. The DJI
has rallied 89% of the time
in the two weeks after December 17th since 1965 and
close to 95% of the time since 1945
if we only look
at where the next Peerless Sell signal came in and we
only consider B13s where there was a bull market.
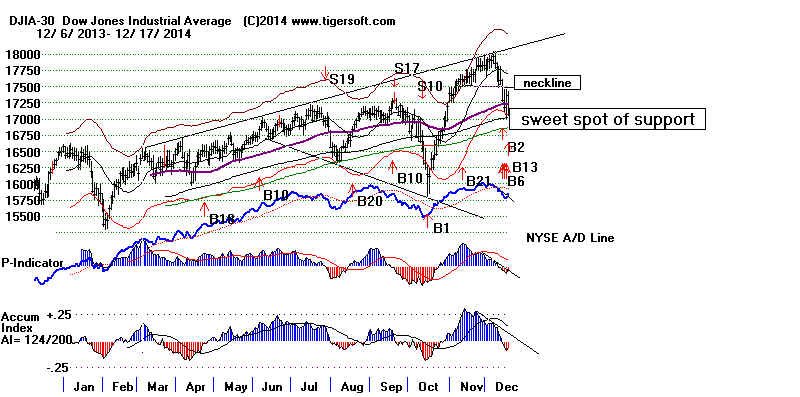
Closest Past Parallel
We always try to find the closest historical parallels to butress or
refine our conclusions. The closest past parallel to the current Buy B13
confronting a broadening top, a head/shoulders and in what looks
a tired bull market comes from December 1980. In this case, upon
getting a Buy B6 and B13, like now, the DJI shot right back up to
a new high early in January.
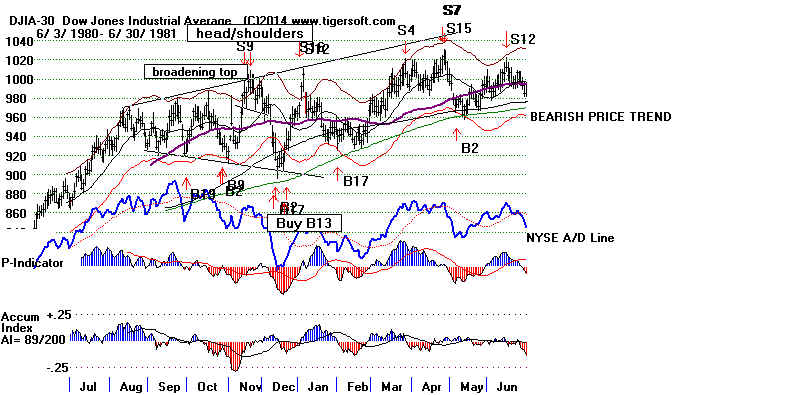
Unfortunately, back then we got a January Sell S9 at the upper band and the
DJI fell back from the rising resistance re-tested the lower band. (This
was a famous sell-off. It was said to have been triggered by a sudden
all-oy Sell recoomendation by Joe
Granville, by far, the hottest general
market predictor in the late 1970s and until 1982 when he wrote a book
about how the market would keep plunging in 1982 and beyond. His reputation
never recovered from this advise because the DJI then rose by a factor
of 12 between August 1982 and January 2000. To his credit, he had
exactly predicted the previous bottom on April 22, 1980 and I found his
work on OBV eye-opening and, for me, career-starting!
What To Buy
My Explosive Super
Stocks book recommends buying recent very high
IP21 stocks that have just pulled back to their 65-day ma and whose
Closing Power hooks back up. CSCO is now an
example. It recommends
the first stocks out of the gate, namely high relative strength stocks that
are among the first to make new highs. See the Bullish
MAXCPs tonight
to get some ideas. Ordinarily, it would recommend buying beaten down
stocks that are trading very actively and whose Closing Power has just
broken its downtrend. SLB is an example. But
right now, the amount of
year-end tax-loss selling that may still occur makes this less reliable.
I was asked to provide a ranking of top current IP21 OIL stocks. This
approach may also be taken with the SECTOR and LEVERAGE ETFs
and FINANCE stocks (this last group closely mostly correlates with Peerless
signals.)
TOP FIVE CURRENT ACCUMULATION
(IP21) STOCKS/ETFS
12/17 AI/200 IP21
OIL/GAS
TYL 110.71 119
.37
APU 47.05 153
.32
WES 49,23 178
.27 (looks good)
SECTOR
IEF 106.42 115
.45 Lehman 7-10 Year Bonds
FUD 22.83 83
.33 Food
GRU 5.48 100
.33 Grains
LEVERAGE
KRU 86/85 143
.21 Regional Banls (Looks good)
URE 104.22
155 .17 Ultra Real Estate (Looks good)
PST 24.7 78
.16
FINANCE
CME 89.94 157
.34 CME Group. (Looks good)
===============================================================
OLDER HOTLINES
12/16/2014 It's time to Buy DIA, SPY, QQQ and FAS.
But hold short the Bearish MINCP stocks. Tax
loss selling will likely
put pressure on the weakest stocks right up until the last day of the year.
I would avoid low prices stocks at this time, too. If there is a rally, it will most
likely be in blue chips and dividend paying stocks and bonds.
Peerless brought the
third straight Buy B6. These have such
a good track record,
I think that we can no longer put off buying DIA, SPY or QQQ, especially since we will
get a Buy B13 (Santa Claus buy) tomorrow. The DJI has closed right on the
lower
3.5% band and has tagged its rising 30wk ma. There might be another down
day, but there should be excellent support from 16800 to 17000.
In bull markets, where the DJI is close to its highs and the 200-day ma is rising,
the odds of the DJI rallying from the December B13 since 1965 are 95%.
We will almost certainly get a Buy B13 tomorrow. See the new study of
Santa Claus Buy B13s in bull
markets since 1945. Losses are very few.
Paper losses except in 1968 were very, very small. Even in December 1980,
the Peerless Buy B13 prevailed against a broadening top and a head/shoulders
pattern. In these respects this will be exactly our situation on tomorrow's
close.
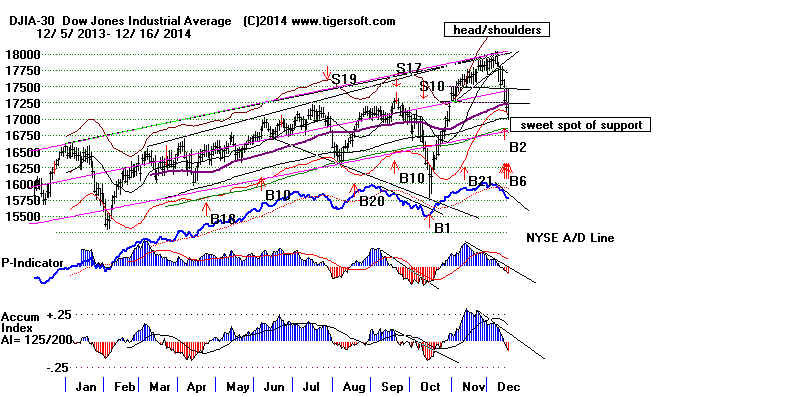
Hold something back.
The Closing Power for SPY is still falling, as is
the downtrend for its Accum. Index (aka IP21). There is still a chance that
the broadening top pattern will bring a much deeper decline it being
December.
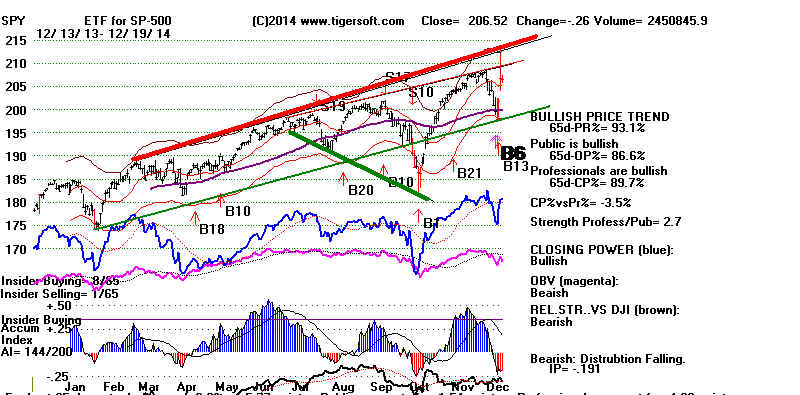
There more than 15 times more MINCPs (Closing Power new lows) than MAXCPs
(Closing Power new highs). So, there are not a lot of stocks to choose from to buy
yet. In additon, the weakest stocks most often are under pressure right until the
end
of the year. Therefore, hold the short MINCP stocks as long as their Closing Power
trendlines are not clearly violated.
=================================================================================
OLDER HOTLINES
=================================================================================
12/15/2014 Don't Buy Yet and Hold Some Bearish MINCPs Short
The DJI's rising 200-day ma at 16900 "should" act
as support but
the bearish price patterns, increasing downside volume and rapidly falling
Closing Power look quite menacing unless you are short some of
the stocks showing heavy distribution, Closing Power new lows
and Sell S14s (high volume dumping.) Shorting these Bearish MINCP
stocks has been exceedingly profitable this year. I think these short sale
profits may be even greater next year. Treat yourself to our
new
Killer Short Sales book for timely
holiday reading.
Peerless brought another purely seasonal Buy B6.
This offers a more enticing
place to buy into falling prices. The DJI is now just above its 3.5% lower
band and just below the rising 65-dma. But should we buy so soon after a
head and
shoulders pattern within a broadening
top (or alligator head) pattern?
Or when each day in this decline has seen rising volume? Should
we buy when
all our key internal strength indicators are falling? Why not wait and
see if a Santa Claus rally can be started? If a
year-end rally does not
start, then the danger is that we are in a situation like December 1968
or December 2007 and a much deeper decline could very well lie ahead
next year.
My Advise
Stay hedged another day, but switch shorts away from some of the very over-sold
oil gas stocks to others among the current Bearish MINCP stocks. These
others are apt to be under selling pressure from tax loss selling right up until
the end of the year.
Bearish Alligator Head (The top of his jaw is red and
lower jaw is
green. Now he has a big fang, too.) and Head and Shoulders Patterns
cannot be programmed. But they are important
and reliable.
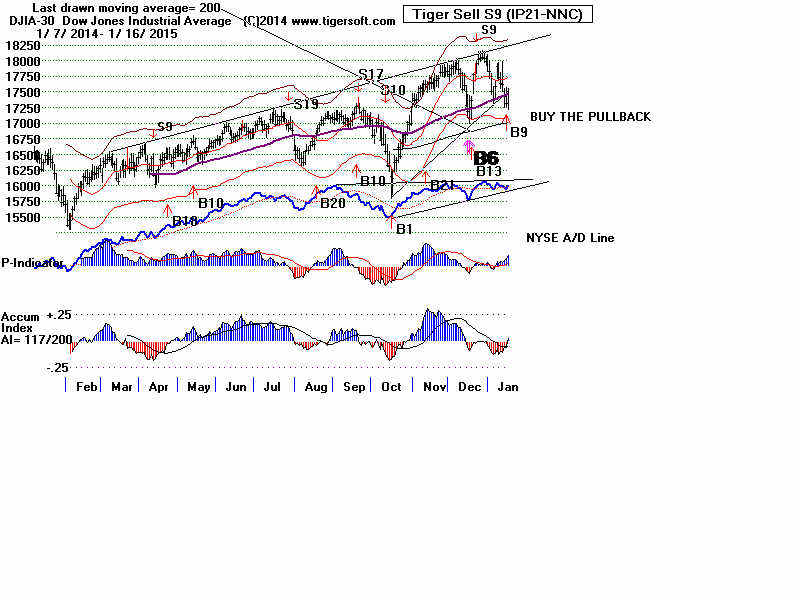
What to Buy?
The QQQ is the strongest general market ETF but AAPL's Closing Power
is still falling. Perhaps January calls one strike price up from
here...that way
the risk is strictly limited...but otherwise I would prefer to wait. I would rather
see evidence that the decline has stopped or that we have reached the bullish
seasonal period that starts on the close of December 17th and starts Thursday.
Then, based on the DJI's track record since 1965, the odds of the DJI rallying
over the following two weeks are 89.1%. December 17th will almost certainly
bring a Buy B17 and probably another Peerless B6.
Why Wait?
The market is fair enough to do very well if we don't undertake risks like
"catching a falling knife". There's plenty of money to be made by
waiting
for a more certain reversal of trend in the Closing Power, the Accumulation Index,
the NYSE A/D Line or even prices. Our charts of SPY, FAS and DUST
demonstrate.

The Black Swan Danger
Broadening top patterns show there is a dangerous amount of speculation
and that wild swings of fear and greed are dominant. See the earlier
study of broadening tops since 1945.
In addition, Head and
Shoulders patterns
are the market's way of reacting to and warning us that something very troubling
and unexpected is facing Wall Street and stocks. The breakup of OPEC would
certainly fall in that category. There are way too many too examples of valid
past head/shoulders pattern warnings to ignore. That is why we have a judged
Sell S10 which, in effect, cancels Friday's buys and warns us to be very careful
about buying even now at the lower band:
See the head/shoulders
September 1929 just before the
CRASH!
1941 (three months before Pearl
Harbor),
June 1950 as North Korea suddenly
attacked South Korea,
early 1962 months before the
Cuban missile crisis,
October 1963, a month before
JFK assassonation!
mid 1971 when Nixon suddenly
stopped backing the Dollar with Gold,
February 1980 just before the
Hunt Brothers' Silver panic,
July 1990 as Sadam invaded
Kuwait,
2001 three months before the
9/11 attack on the Twin Towers.
December 2007 and May 2008 a few months before the financial panic. (below)
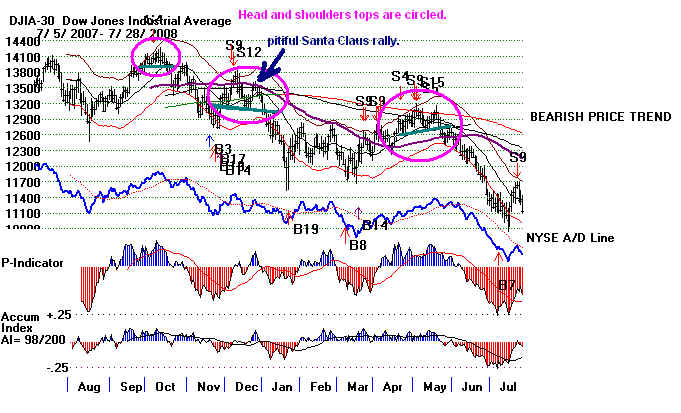
So, I suspect that the market will have its hands full trying to produce a
worthwhile year-end rally. Today's 100+ point gain at the opening was completely
lost once again when US professionals quickly flooded the market with shares to
sell. Why are all these Professionals in such an unusual hurry to get out of
long positions. They know about the traditional Santa Claus Rally. Why does
does the bull market, now almost six years old, resemble a game of "musical
chairs"?
"Is the jig up"?, as Grouchp asked his stock broker in October 1929? I
would
much prefer to buy after I see an early panic and then a late turn-around to the
upside.
Let's see if a reversal can be started after December 17th (Wednesday),
perhaps from the DJI's rising 149-day or 200-day ma, (17000-16870).
To Key Index and Leading Stock Charts, DJI,
SP-500, etc...
Peerless DJI Chart DIA
SP-500 Chart SPY
NASDAQ Chart QQQ Chart IBB Chart IWM Chart
MDY Chart
Hourly DJI-OBV
Please report any bad links
Percent of Stocks above 65-dma - As long as the percentage is above 60%,
the 65-day ma is likely to hold up for most stocks.
DJI-30 Tiger Index H/S 47.8% vs 56.7%
vs 66.7% vs 66.7% vs 70.0% vs
73.3% (NL)
OEX Tiger
Index H/S 55.6 vs 63.6%
vs 72.7% vs 70.7% vs 76.8 vs
77.8% vs 78.8%
QQQ
70.7% vs 73.7% vs 76.8% vs 74.7%
vs 83.8% vs 82.8%
vs 82.8% vs 81.8
SP-500 57.9% vs 62.3% vs 70.5% vs 70.8% vs 68.7% vs
75.6% vs 76.0%
Russell-1000 54.6% vs 59.4% vs
62.3% vs 67.2% vs
68.7% vs 73.9% vs 72.6
14-a 42.9% vs 45.3% vs 50.6% vs 48.1% vs
55.6% vs 52.7% vs
55.8% vs 56.3% vs 56.3%
14-c 46.7% vs 50.5% vs
55.3% vs 53.2% vs 58.5% vs 55.7% vs 60.5% vs 56.8% vs 59.1%
14-s 40.5% vs 46.8% vs 504% vs 48.8% vs
57.3% vs 52.3% vs 55.3% vs 54.9% vs 54.5%
--> MAXCP stocks Bullish
MAXCP Stocks (12/15/2014)
-->
MINCP stocks Bearish MINCP Stocks (12/15/2014) Bearish Plurality
--> New Highs on NASDAQ
new lows. Bearish Plurality
-->
New Highs on NYSE new lows. Bearish Plurality |
===============================================================
OLDER HOTLINES
===============================================================
12/12/2014
Officially, Peerless remains on a Buy, based only
on its automatic signal. But given the broadening top and the completed
head/shoulders pattern, I think the new Buy B2 and B6 are likely to bring only
a quick bounce back towards 17450, the broken neckline's resistance-level.
A deeper decline seems likely to test Friday's low or possibly 17000.
New Buy B2 and B6?
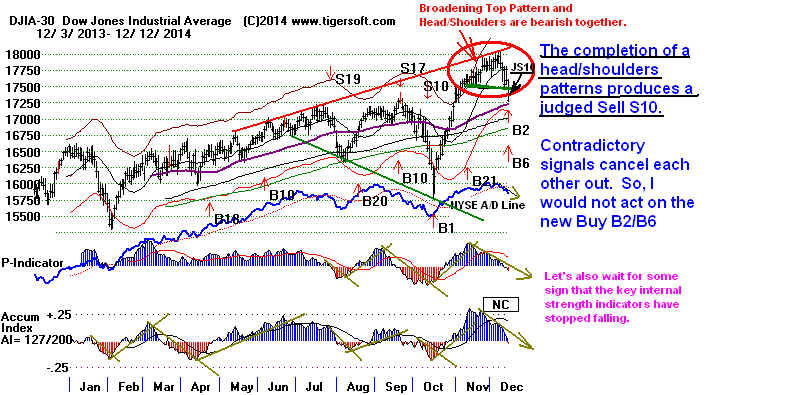
The Buy B2 is based on a DJI decline
close to the lower band. The DJI
closed 2.6% below the 21-day ma. The normal lower band support is
strongest 3.5% below the 21-day ma. Support is also apt to be most significant
in the sweet spot, the zone between the 30-wk (149-day)ma and the 200-day ma.
This would come in at 17000, about 281 points lower than Friday's close.
The Buy B6 can only occur in Decembers before
the 25th in the second year of the
Presidential cycle. The DJI needs only be below the 1.9% band. This simple
system has a great track record but its past occurrences do not include any
confrontations with broadening tops or head/shoulders patterns in extended
bull markets. Still the B6 track record is
good and paper losses are so small,
it argues against the DJI dropping below the 4.0% lower band.
I suggest waiting for December 17th
(Wednesday) and the Peerless Buy B13
to be buyers. If you still have long positions in DIA or SPY, sell them on a
recovery
by the DJI back to 12450.
By falling below 17500, the DJI has completed a Head/Shoulders pattern.
This is considered a "judged Sell S10".
("Judged" because the computer as
programmed cannot produce all the valid S10s.) Officially, it occurrence at
the same time as our new Buy B2 and B6 means that all three signals are
neutralized.
We should probably wait for more evidence of a bottom. The 1923 and Dec 1980
experiences ( charts below) show that a broadening top coupled with
a head/shoulders pattern can bring a deeper decline, one that may even
cause the DJI to test the falling support line. In additon, when the DJI falls
2% or more, I would normally wait for more evidence that the decline
has stopped to Buy SPY or DIA.
Stay hedged with Bearish MINCP short sales, including the weakest
oil and gas stocks. Their weakness is a result of how over-leveraged
they are. The rapid fall in price will cause some of the huge losses if
they have not hedged against the drop in oil prices. Do not yet buy
any of the key ETFs yet.
Head/Shoulders after a Broadning Top
Typically Brings A Bigger Decline
1980-1981 experience
1. The DJI formed a broadening top from September 1980 to January 1981.
Repeatedly the DJI failed to get past the rising resistance line.
2. When the DJI broke below its neckline- support early in December 1980,
the decline did not stop until the DJI had fallen to the declining support-line.
3. It found support in the "sweet spot", the zone of support between the
rising (green) 200-day ma and the rising (brown) 30-wk ma.
4. The DJI then enjoyed the bullishness of the Bullish period between December 17th
(Santa Claus B13) and the end of the year.
5. The December-January rally was stopped at the rising resistance and again
formed a head/shoulders pattern. The resulting decline from this H/S top
failed to take the DJI down to the rising support level, only taking it to the lower
3.5% band and the rising 200-dma.
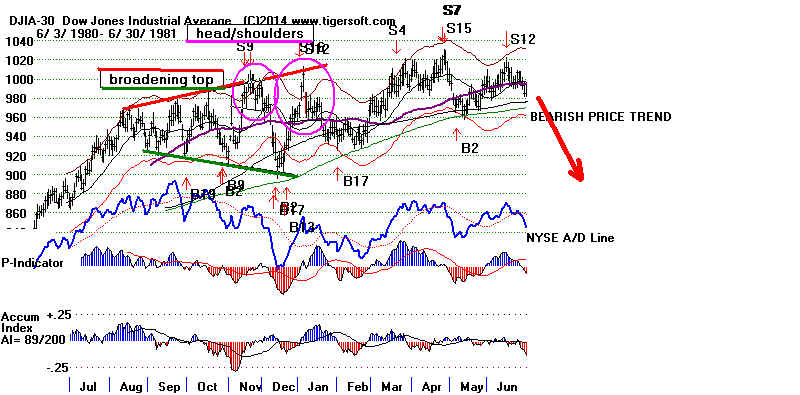
1922-1923 Experience
1. After a
substantial rally, always be on the watch for DJI head/soulders
patterns. Even small patterns like the one in October 1922 can have
significance. Usually to be really bearish, prices must aslo drop below
the (purple) 65-dma, as with the H/S pattern in Feb-March 1923.
But when the H/S pattern occurs far enough the upper band, the
breaking of the its neckline should be treated as a Sell because of
the considerable downside trading potential.
2. When the
second H/S pattern occurs along with a sustained inability
of prices to surpass a rising resistance line in a broadening pattern,
the breaking of the neckline is clearly more bearish. Prices in this
technical environment are much more likely to break the still
rising 65-dma and then have to drop all the way down to the
previous lows, or even down to the falling support-line in the
broadening top pattern.
3 The
breaking of the neckline in a head/shoulerse pattern which
breaks the 65-dma at the same time or soon after is considered
a Peerless Sell S10. If it occurs with an automatic Buy signal,
I would consider the Buy and Sell to be off-setting and mutually
nullifying.
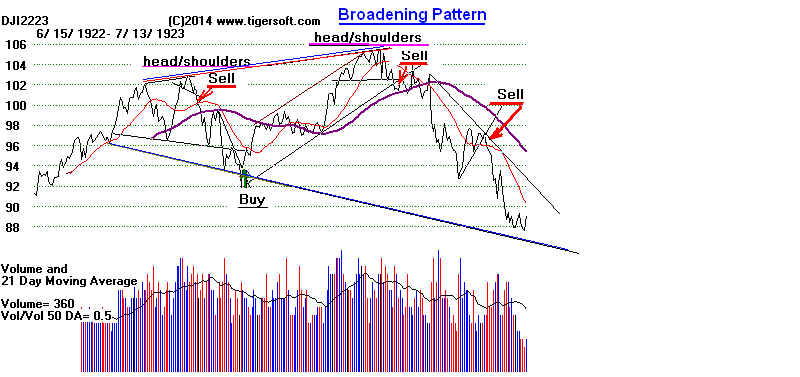

LEVERAGE IS A TWO-EDGED SWORD
The same extra leverage that allowed some small oil and gas stocks to
rise from $5 to $30 in early 2008 is now making them drop even faster.
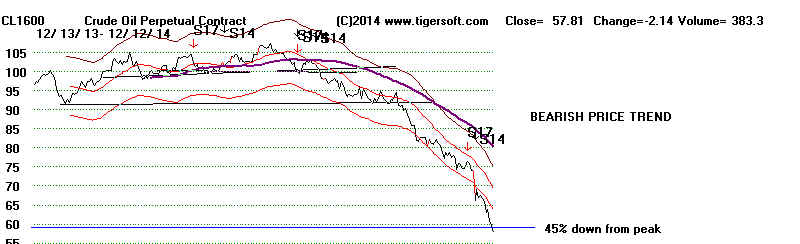
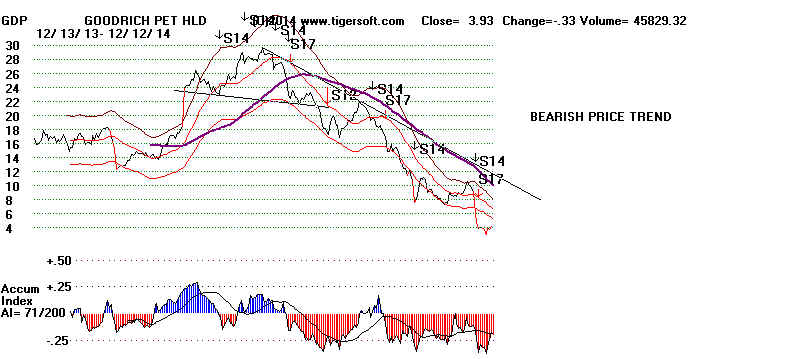
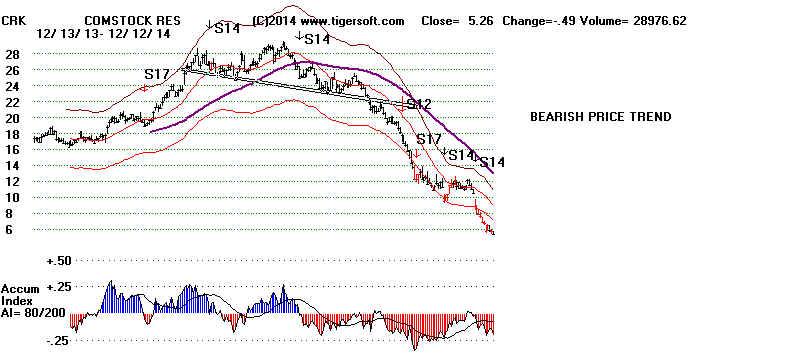
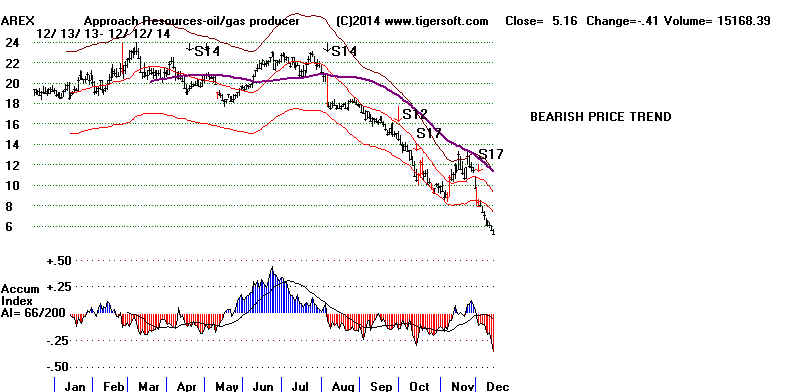
|
To Key Index and Leading Stock Charts, DJI, SP-500,
etc...
Peerless DJI Chart DIA
SP-500 Chart SPY
NASDAQ Chart QQQ Chart IBB Chart IWM Chart
MDY Chart
Hourly DJI-OBV
Please report any bad links
Percent of Stocks above 65-dma - As long as the percentage is above 60%,
the 65-day ma is likely to hold up for most stocks.
DJI-30 Tiger Index H/S
56.7% vs 66.7% vs 66.7% vs
70.0% vs 73.3% (NL) vs
80%
OEX Tiger
Index H/S 63.6% vs 72.7% vs
70.7% vs 76.8 vs 77.8% vs 78.8% vs 77.8
QQQ
73.7% vs 76.8% vs 74.7%
vs 83.8% vs 82.8%
vs 82.8% vs 81.8 vs 82.9
SP-500 62.3% vs 70.5% vs 70.8% vs 68.7% vs
75.6% vs 76.0% vs 78.0% vs 77.6
Russell-1000 59.4% vs
62.3% vs 67.2% vs
68.7% vs 73.9% vs 72.6 vs 75.7% vs 74.8
14-a 45.3% vs 50.6% vs 48.1% vs
55.6% vs 52.7% vs
55.8% vs 56.3% vs
56.3%
14-c 50.5% vs
55.3% vs 53.2% vs 58.5% vs 55.7% vs 60.5% vs 56.8% vs 59.1%
14-s 46.8% vs 504% vs 48.8% vs
57.3% vs 52.3% vs 55.3% vs 54.9% vs 54.5% vs 52.6%
--> 84 -56
MAXCP stocks Bullish MAXCP Stocks (12/12/2014)
--> 198 +35 MINCP stocks Bearish MINCP Stocks (12/12/2014) Bearish Plurality
--> 21 -12
New Highs on NASDAQ
107 +45 new lows. Bearish Plurality
--> 11 -17 New Highs on NYSE 264 +121 new lows. Bearish Plurality |
================================================================
OLDER HOTLINES
12/11/2014
Tiger's
Peerless Remains on A Buy vs the Black Swan
A DJI close below 17480 would complete a developing head and
shoulders pattern. We should consider this a judged Sell S10.
More details on this on Sunday night. At the same time, we
will likely get a Buy B13 next Wednesday (the 17th).
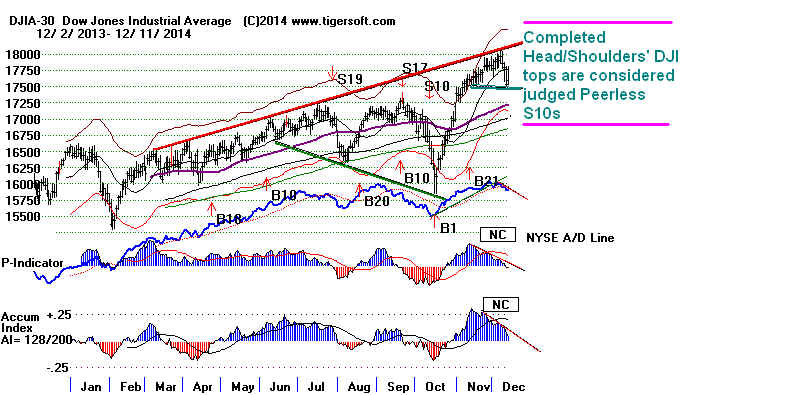
Despite the lack of a Peerless sell signal, we are seeing lots of warnings that
a
significant decline is shaping up. That's the reason I
have said to hold shorts
on the bearish MINCP stocks (which include many of the
plunging oil and gas
stocks) and it is the reason I advised last night to unload a good portion of the
key ETFs' long positions if the rally faded badly today, which it did. At one
point near the close today, the DJI managed to lose its entire 225 point early
gain. This is now a treacherous market. Professionals want out.
And they
are in a hurry to dump. When the Closing Powers turn up again and break
their downtrends, we can come back in on the long side.
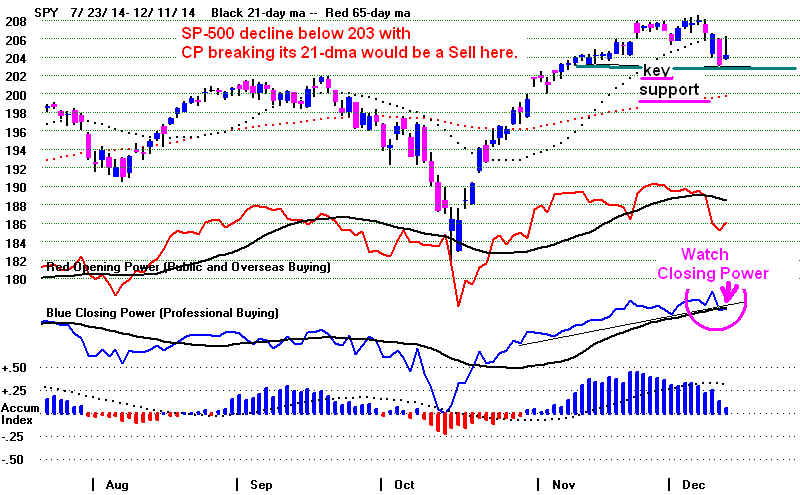
Now the Futures are down 69
points. It looks a lot like the overseas' economic
woes are worsening. The DJI's support at 17500 will now be tested. A decline
to the lower band around December 17th would give us a good re-entry point
for longs, provided history does not repeat the experience of early December 1968
and early December 2007 when the DJI largely ignored the long-standing custom for
Santa Claus to bring a rally from December 17th to sometime early next year.
The technical position now is vulnerable. The broadening patterns and sturdy
resistance overhead call for a plumbing for support. 17500 is the near-term
neckline support. The lower band at 17100 looks like better support. But
broadening patterns can bring much deeper declines.
Right now, the US economy seems sturdy and growing. But
US stocks
are now part of global economic system. Just so that we
do not become
complacent over the holidays, we should consider, I think, some of worse case
scenarios that could play out if the overseas market spiral downwards from
here.
What Could Be A Lot Worse?
It appears Crude Oil's swift decline is a result of the rapidly deteriorating world
economies outside the US. Could weak overseas' market drag down the US markets?
Definitely. Never has the global economy been so interwoven and never have
policy-makers since the 1930s shown such continuing refusal to use government
spending for infrastructure to bolster weak economies while private corporations
hoard their profits, preferring to buy their own shares, buy out competitors or
pay their CEOs vast sums.
The last time Crude Oil declined like this was in 1985-1986.
Back then the DJI rose more than 30% while Crude Oil fell 70%.
But back then, the overseas markets were not diving down
towards a Depression. Another difference: breadth was much
better then. Institutions could gloss over their crude oil losses by
taking profits in a lot more stocks than now. Because fewer
common stocks are advancing now, the selling done by institutions
elsewhere in other stocks to offset oil stock losses is now being done
in the relatively few areas where there has been strength, including
blue chips, techs and health care stocks. Thus more damage is now
being done to the DJIA than in 1985-1986.
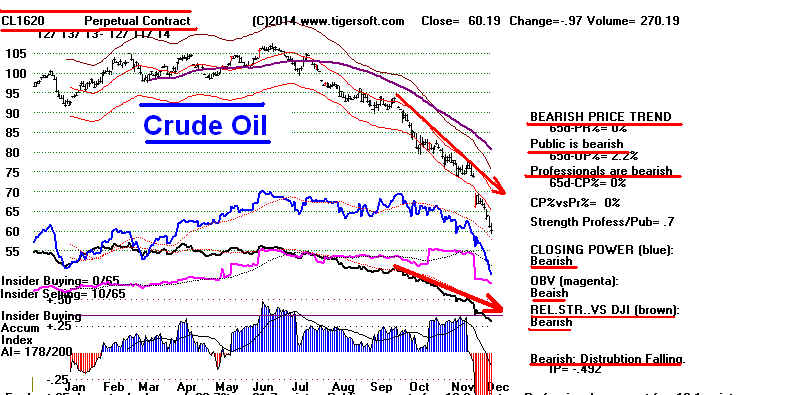
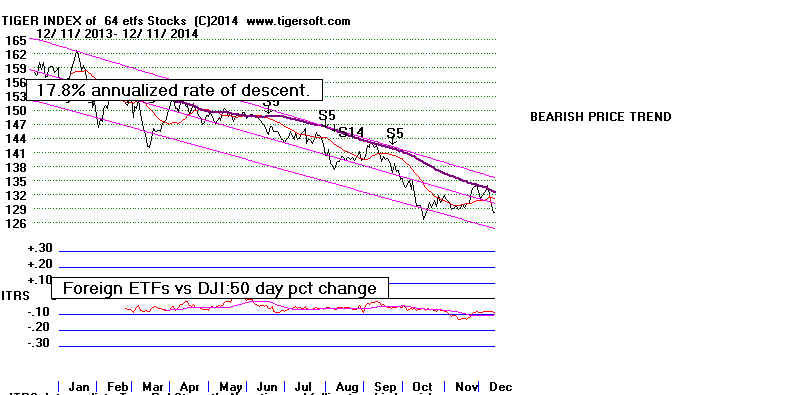
What's worse? The biggest US stocks are all
multi-nationals. They depend
on overseas markets. What's worse still? The biggest banks all have big bets
on Europeon bonds that could start to default.
And what's worse still? The US has built a
perfect system of leveraged trading
for short sellers who now may choose to drive the market down in the same way
they have driven it up. There is no prohibition on big banks shorting the US markets
with leveraged trading vehicles sponsored by cheap loans from the Fed and
protected against big trading losses by the US tax payer. If you were designing
a system to bring about a catastrophe, I defy you to come up with something better.
We have all the makings again for a perfect financial storm if the Big Banks choose
to become aggressive short sellers, all in the name of "hedging".
To
Key Index and Leading Stock Charts, DJI, SP-500, etc...
Peerless DJI Chart DIA
SP-500 Chart SPY
NASDAQ Chart QQQ Chart IBB Chart IWM Chart
MDY Chart
Hourly DJI-OBV
Please report any bad links
Percent of Stocks above 65-dma - As long as the percentage is above 60%,
the 65-day ma is likely to hold up for most stocks.
DJI-30 Tiger Index H/S
66.7% vs 66.7% vs 70.0% vs
73.3% (NL) vs 80% vs 80.0
OEX Tiger
Index H/S 72.7% vs
70.7% vs 76.8 vs 77.8% vs 78.8% vs 77.8 vs 80.8%
QQQ
76.8% vs 74.7%
vs 83.8% vs 82.8%
vs 82.8% vs 81.8 vs 82.9 vs 82.8
SP-500 70.5% vs 70.8% vs 68.7% vs
75.6% vs 76.0% vs 78.0% vs 77.6
vs 78.7
Russell-1000 67.2% vs
68.7% vs 73.9% vs 72.6 vs 75.7% vs 74.8 vs 77.6 vs 70.7
14-a 50.6% vs 48.1% vs
55.6% vs 52.7% vs
55.8% vs 56.3% vs
56.3%
14-c 55.3% vs 53.2% vs 58.5% vs 55.7% vs 60.5% vs 56.8% vs
59.1% vs 57.1%
14-s 504% vs 48.8% vs
57.3% vs 52.3% vs 55.3% vs 54.9% vs 54.5% vs 52.6% vs 49.9%
--> 84 -56
MAXCP stocks Bullish MAXCP Stocks (12/11/2014)
--> 198 +35 MINCP stocks Bearish MINCP Stocks (12/11/2014) Bearish Plurality
--> 33 +15
New Highs on NASDAQ
62 -21 new lows. Bearish Plurality
--> 28 New Highs on NYSE 143 new lows. Bearish Plurality |
=====================================================================================
OLDER HOTLINES
=====================================================================================
12/10/2014
Tiger's Peerless Remains on A Buy vs the Black
Swan
Stay hedged. The stop losses in
our many shorts of bearish MINCP oil stocks
were never touched because of today's much lower opening. Stay long the
big general market ETFs a little longer. But do some selling if they fade
badly at the close after a strong opening tomorrow. The really positive
December
seasonality starts on December 17th. Unfortunately, since 1965, the DJI
has rallied only 48.9% of the time over the next week. This period shows
only a minor 0.2% decline. We ought to be able to ride it out if we stay hedged.
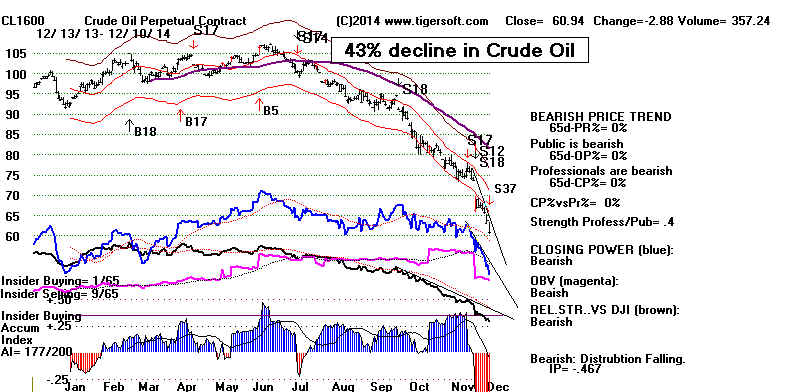
December Tops Are Rare
Peerless cannot easily give a Sell signal in here. The divergences we normally
see at an important market top for the DJI, SP-500, QQQ or NASDAQ have
not yet appeared, at least not prominently enough, to call a major top. There
have been A/D Line divergences, but they have not lasted long enough. Now
we are in December. Decembers are reliably bullish: they rallied 89% of the
time between 1965 and 2013. Even
in bear markets, buying on December 17th
succeeded very well.
While big declines have seldom started in December,
there are 6 cases to study.
Two took place before December 27th: 1968
and 2007. Both did occur
after extended periods of speculation. The 2007
instance was signalled with a Sell S9 and a Sell S12. So, its example
does not match up with our present case. The December 5, 1968 case
also showed a head/shoulders. We should watch out for that pattern. But let's
compare the key values at the top in 1968 with the recent top:
12/5/1968 12/5/2014
LA/MA
1.012 1.012
Adjusted P-I
133
159
IP21
.088
.161 (much higher at recent top)
VI
15
-20 lower
OPct
.231
.407 higher
65 day up pct
.105
.052
lower
My belief is that the current IP21 (Accum. Index) is the key here. This shows
institutional buying support is a much more important factor now. On the other
hand, if the DJI completes a head/shoulders pattern in its daily prices, I would
then heed it and consider Peerless to have rendered a judged Sell S10. At
present there is no potential head/shoulders pattern in the daily charts,
though one can be seen in the Hourly DJI shown below.
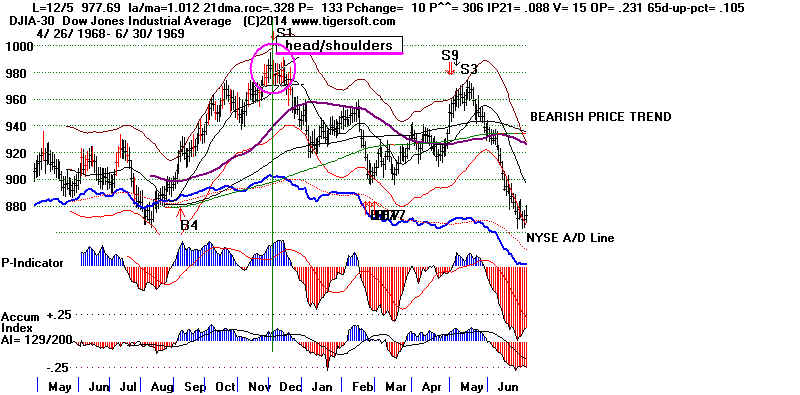
Key Charts below:
1) Watch the daily DJI to see if it forms
a head/shoulders.
a potential neckline may shape up at 17500.
2) The Hourly DJI did suddenly complete what can be
construed to be a head/shoulders. Hourly down-volume
is not confirming the decline.
3) SPY's Closing Power plunged to a point slightly below
its rising 21-dma. We now need to see a bullish rebound by
it, or it will have to be bearishly construed.
4) The Tiger Index of the OEX-100 has bearishly completed
a head/shoulders pattern. It does weight more heavily oil
stocks.
5) The Tiger Index of Foreign ETFs has
fallen back to temporary
support and shows positive Accumulation. It may try to base
here. That may allow good rebounds in the strongest US stocks.
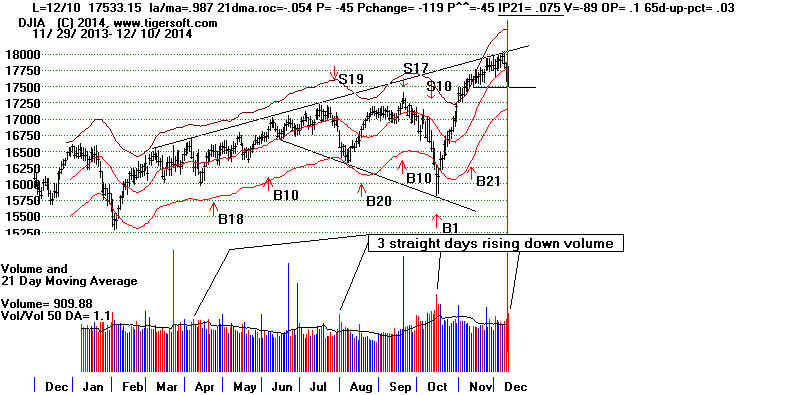 |
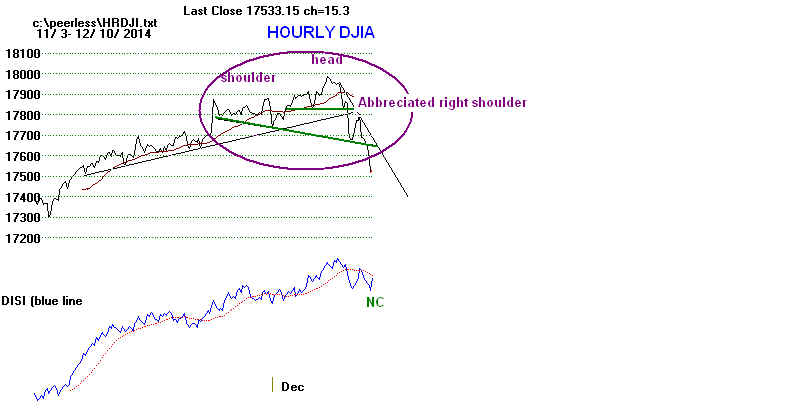 |
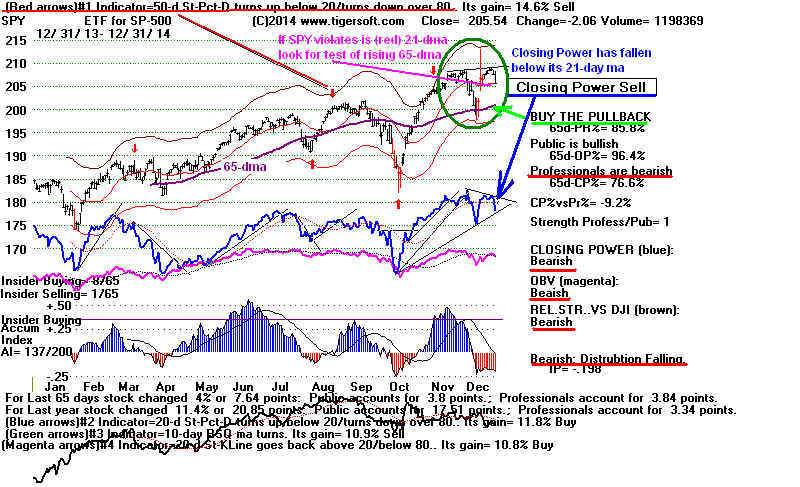 |
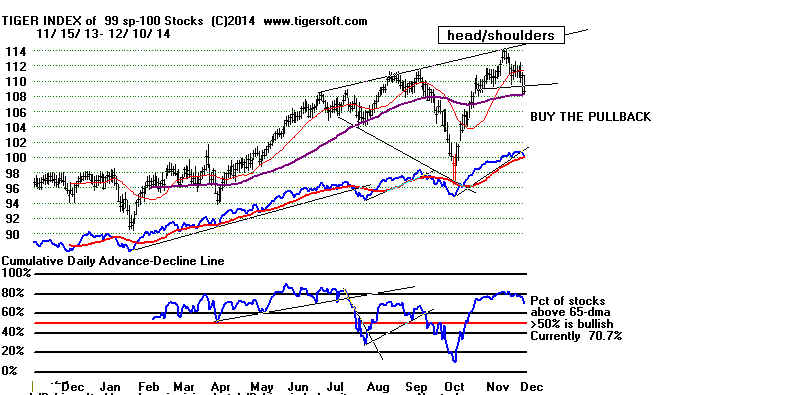 |
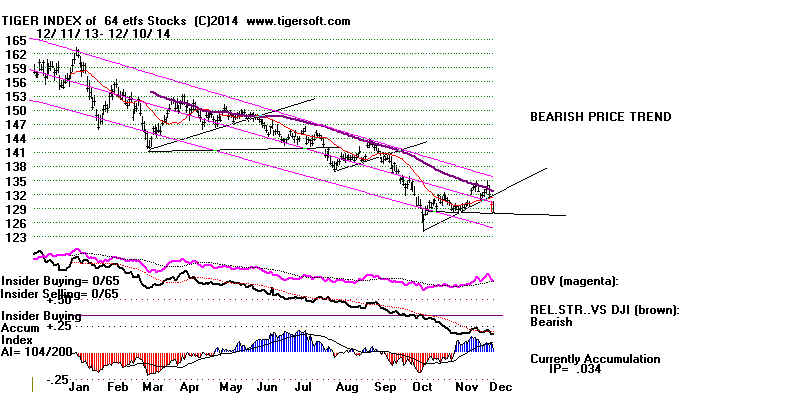 |
================================================================
OLDER HOTLINES
================================================================
12/9/2014 Peerless Remains
on A Buy Lock in
some of the
quick profits in the falling Crude Oil Stocks if they rally tommorrow.
Buy more FAS and QQQ.
None of Crude Oil's
key downtrendlines were broken by today's rally there.
Crude's continued decline would be bullish for the DJI and DIA. On
the
other hand, Crude Oil stocks which we have shorted have fallen so fast and
so quickly that I think there could easily be a short covering rally if they
do not continue to fall tomorrow. Use Buy stops just above their closes
today to lock in profits. My research on how frequently the DJI rallies after
December 17th when it is in a bear market suggests stocks in severe
bear market may do the same. ( I will show this tabulation tomorrow night.)
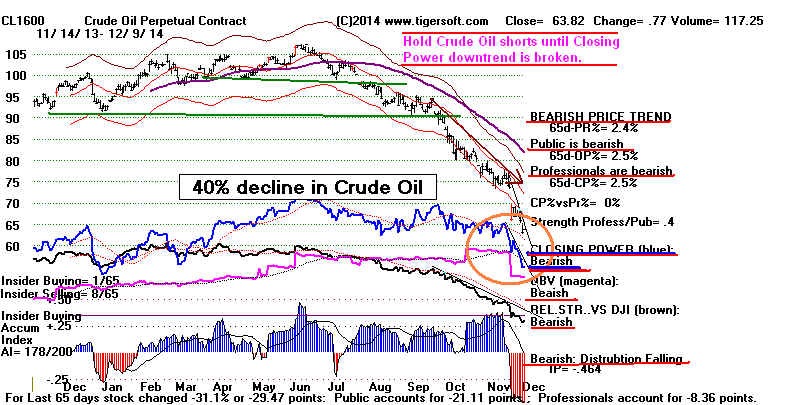
The DJI reversed a
loss of more than 200 points and closed down 51. This shows
considerable support at 17600. But we will need to see if the DJI will be able to
get past the qually apparent resistance at 1800. The DJI closed at the rising 21-day
ma with an IP21 (Accum. Index) of .131, Usually this is a high enough reading to
lt us expect the nearest support (now 17600) will hold. DIA's Closing Power made
a 12 month high. Occurring after the bulge of Accumulation, this is normally
a BUY.
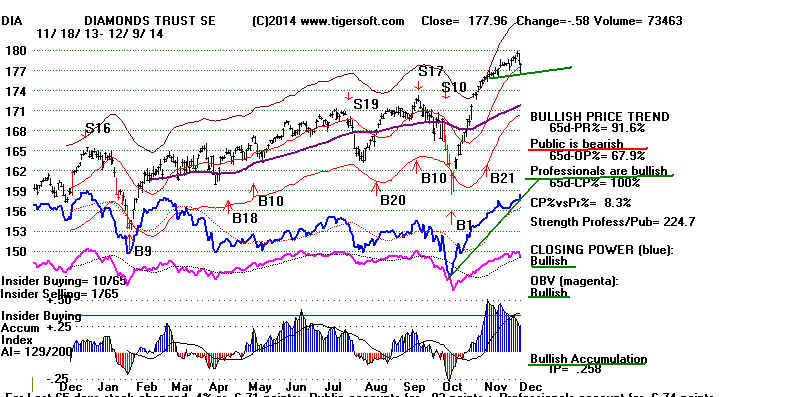
Breadth turned positive. There were 621 more up than down on the NYSE.
The Closing Powers for key ETFs jumped to new highs today. This, too, is
usually bullish. Only a series of extraordinarily weak openings can now
over-power
the steep rate of ascension of the Closing Power. That would be very unusual
if not unprecedented.| Look below at how steeply the Closing Power is rising for
the big financials' ETF, FAS. US professionals have not lost their confidence in
big banks. This is much the strongest of the general market ETFs now. I think
have to be buyers of it still.
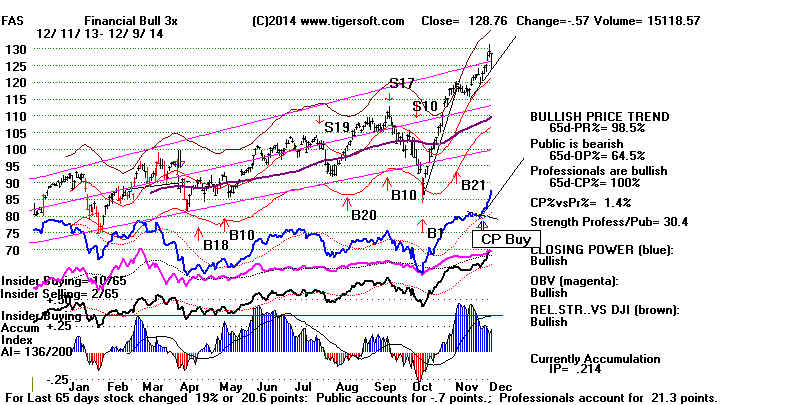
QQQ's Accumulation has been very high since May. With its Closing Power
making a new high today, it seems likely QQQ is still set on a course to reach
120, its high from March 2000. It might retreat again over the next week,
but its low at 103.5 seems excellent support for the rest of this month, as
Peerless will give a Buy B13 on any weaknesss that takes the DJI below its
21-day ma from December 17th to December 23rd.
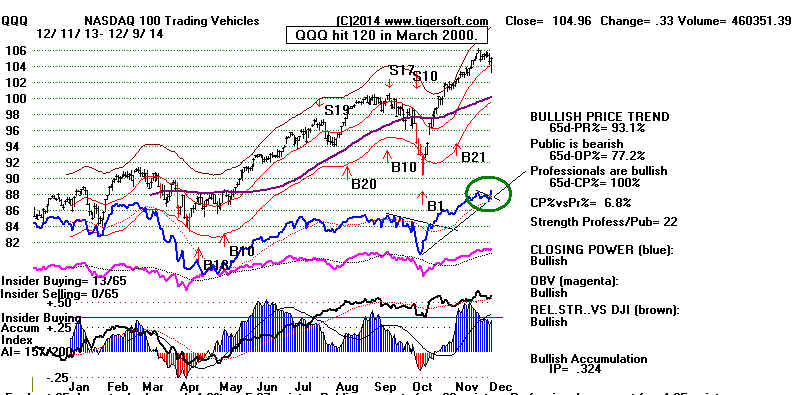
To Key Index and Leading Stock Charts, DJI,
SP-500, etc...
Peerless DJI Chart DIA
SP-500 Chart SPY
NASDAQ Chart QQQ Chart IBB Chart IWM Chart
MDY Chart
Hourly DJI-OBV
Please report any bad links
Percent of Stocks above 65-dma - As long as the percentage is above 60%,
the 65-day ma is likely to hold up for most stocks.
DJI-30
70.0% (NL) vs 73.3% (NL) vs
80% vs 80.0 vs 83.3 vs 80.0 vs 86.7 vs 86.7
OEX 76.8 (NL) vs
77.8% vs 78.8% vs 77.8 vs 80.8% vs 78.8 vs 77.8 vs 81.8
QQQ
83.8% vs
82.8% vs 82.8% vs 81.8
vs 82.9 vs 82.8 vs 84.8 vs 85.9%
SP-500 75.6% vs
76.0% vs 78.0% vs 77.6 vs 78.7
vs 76.0
vs 74.5 vs 78.7 vs 80.7
Russell-1000 73.9% vs 72.6
vs 75.7% vs 74.8
vs 77.6 vs
70.7 vs 76.2 vs 79.1%
14-a 55.6% vs 52.7% vs 55.8%
vs 56.3% vs 56.3% vs
57.5% vs 54.1% vs 51.9%
14-c 58.5% vs 55.7% vs 60.5% vs 56.8% vs 59.1% vs
57.1% vs
55.3% vs 61.6%
14-s 57.3% vs 52.3% vs 55.3% vs 54.9% vs
54.5% vs 52.6% vs 49.9% vs 54.2% vs 58.2%
--> 336 +163
MAXCP stocks Bullish MAXCP Stocks (12/9/2014) Bullish Plurality
--> 148 -82
MINCP stocks Bearish
MINCP Stocks (12/9/2014)
--> 67 +48
New Highs on NASDAQ
52 -85 new lows. Bearish Plurality
--> 66 -24 New Highs on NYSE 83 new lows.
Bearish Plurality |
==================================================================
OLDER HOTLINES
=================================================================
12/8/2014 Peerless Remains
on A Buy
 Based on our history of
the US stock
Based on our history of
the US stock
market, I think we still have to remain bullish on the DJI and the SP-500.
The last Crash in Oil Prices between October 1985 and May 1986 brought
a 34% gain in the DJI as Crude fell 68%. Very bullish seasonality starts
on December 17th. That, too, should limit any decline here. The big banks'
ETF FAS, HOME DEPOT and most big biotechs actually rose today, showing
no fear.
But the Mid-Caps (MDY) and Russell-2000 (IWM) are certainly in question.
MDY and IWM could be forming bearish head and shoulders patterns. We have
enough experience with them to know that these patterns should be believed when
prices also drop below their 65-dma. In addition, we must watch other impending
head/shoulders patterns in key stocks like AAPL, CAT (completed), DOW,
NIKE, TESLA, WALMART and YAHOO. Further
declines in these would almost
certainly cause the SPY and the DJI
to retreat 2%-3% before we get a Santa
Claus Buy B13 on December 17th.
Peerless could be wrong. History could bring a top that we do not get a Peerless
Sell. The non-US stock markets are much, much weaker than the DJI. If their
weakness and Crude Oil'd weakness is signalling the approach of a global depression,
then the blue chip DJI-30 and the US Big Bank stocks will not long be able
to escape the storm. My suggestion here is to hedge by
shorting some of our
bearish MINCP stocks until December 17th or else sell SPY and
DIA if their
Closing Power 21-day ma are penetrated.
Article Tuesday AM on Yahoo: The ratio of DJI vs
Europe+Australia+Far Eastern market
recently hit an all-time 65 year high.
http://finance.yahoo.com/tumblr/blog-foreign-stocks-have-never-been-weaker-relative-to-193008320.html
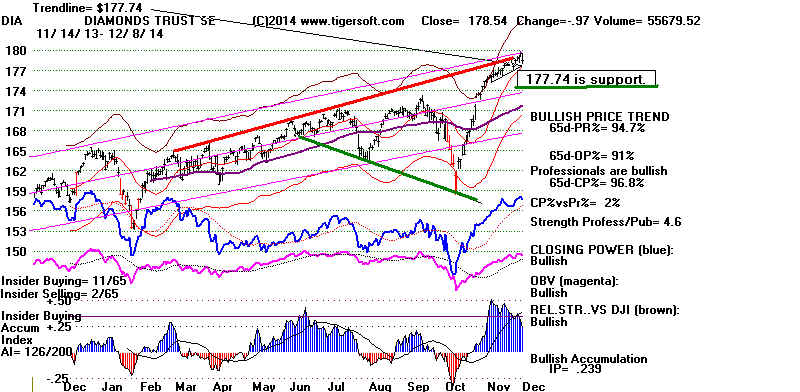 |
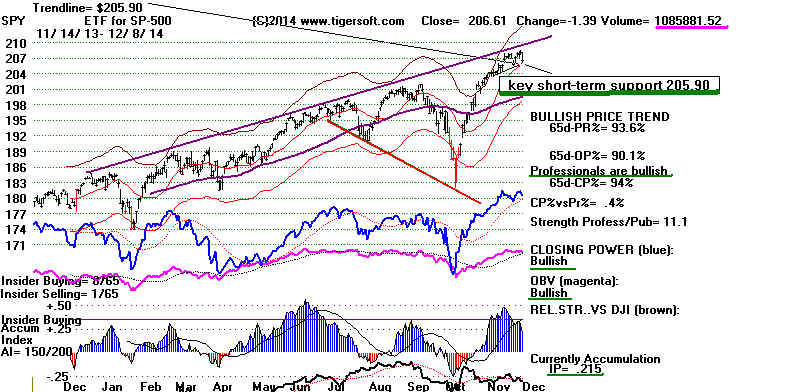
|
Will There Be A Global Depression?
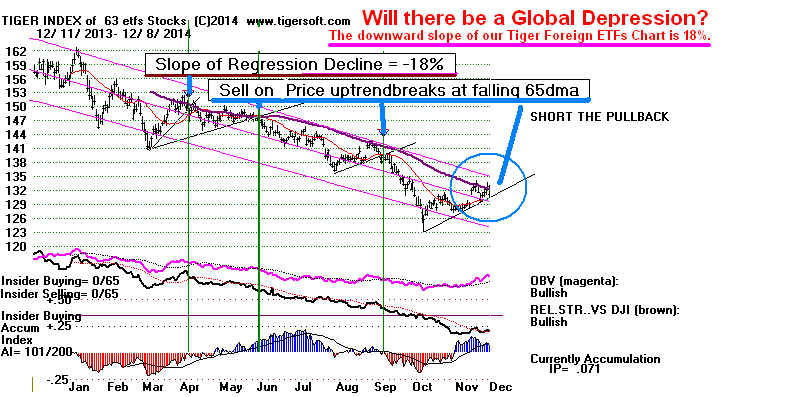
Crude Oil's Collapse
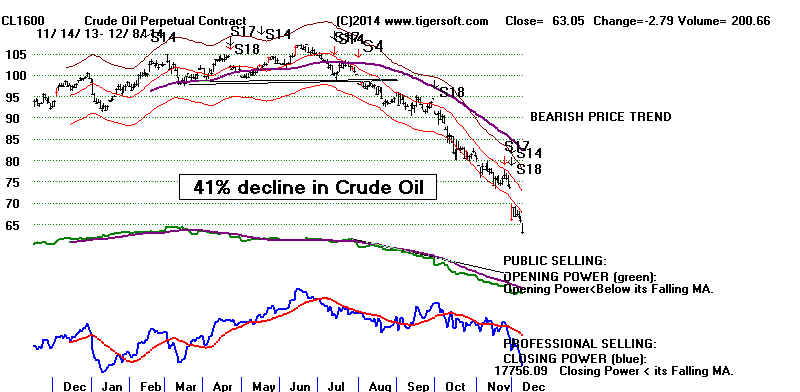
Crude Oil has now fallen
41%. The trend is still down. Lower openings
and
non US selling is mostly responsible. With trends this steep, it is
seldom a good idea to try to call a bottom. History records deeper drops.
Between November 1985 and May 1986, Crude Oil plunged 68% but
simultaneously there was a huge 35% DJI advance. (Back then, the
YEN
and the Japanese economy was very strong. The opppsite is true
now.
Crude Oil
bottomed in mid 1986 but could not make a sustained advance
until 1999.
Its tripling in price between 1999 and 2001 helped break the
back of the
1994-2000 tech bubble. (Source.)
Unless the drop in Crude is telling us now that the Global Economy is about
to go
into a severe spiralling-down Deflation and possible Depression,
I
would think the DJI will make more new highs soon.
The
best way we have to look at the global non-US markets is with a Tiger
graph
of Foreign ETFs. It is declining rapidly and may be about to begin
another leg downward. Sells occur for it when its minor price-uptrendlines
are
violated at its falling 65-dma. That could occur this week.
Crude Oil 1985-1986
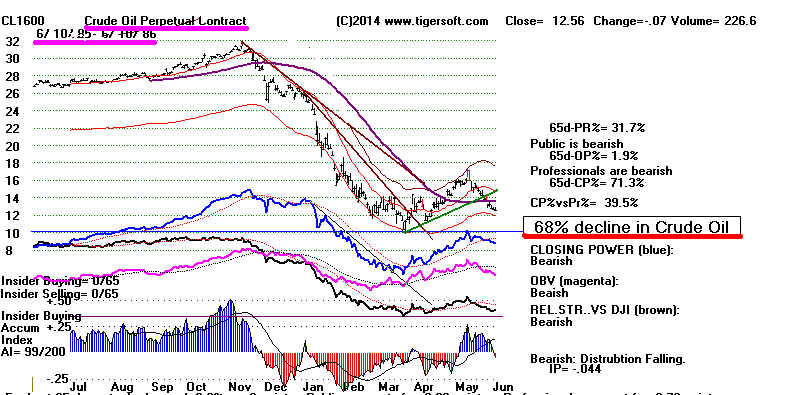
DJI 1985-1986
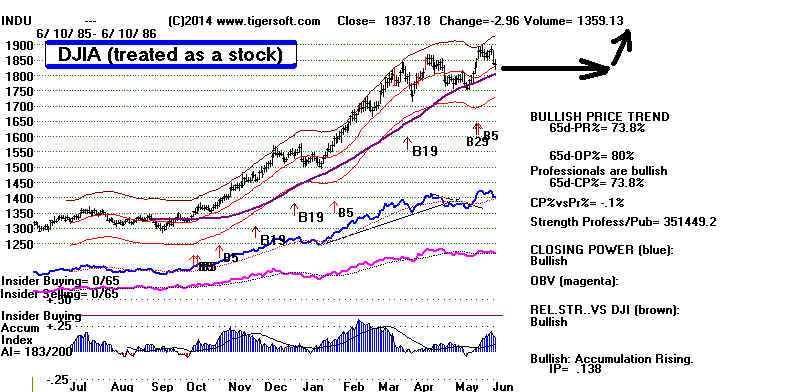
------------------------------------------------------------------------------------------------------------------------------
OLDER HOTLINES
------------------------------------------------------------------------------------------------------------------------------
12/5/2014 Peerless Remains
on A Buy. I see no reason to disturb our
long positions in SPY or DIA. Seasonality is very bullish. December is
the
most bullish month of the year and the third Year of the 4-Year Presidential
Year, which is coming up, is the most bullish of the 4-year cycle. With their
Closing Powers rising, SPY and DIA still look like they will get past their
rising resistance lines, much like the DJI did in October/November 1996.
The best December seasonality comes from December 17th through the 23rd.
In two weeks, a Santa Claus Buy B13 will likely stop any declines below the 21-day
ma.
For the next week, there is only a 55.3% probability of an advance, based on
how the DJI has fared since 1965 over this period. But the odds are 76.6%
over the next 21 trading days.
At the same time, the Bearish MINCP keep falling.
Most of these are now oil and
gas stocks. See
this week's Barrons' discussion of oil rig and drilling stocks. All
this is reminiscent of the many gold stocks that were in our BEARISH MINCP lists
a year ago. What happened to mining stocks in the last few years
(example: Allied Nevada Gold fell from 45.11 three years ago
to
85 cents a month ago.) could happen to many over-leveraged oil and gas stocks.
Nor do I see any real hope for the falling Yen.
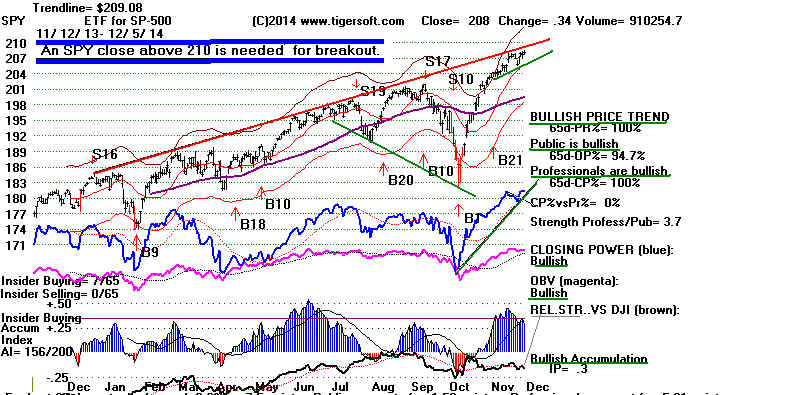
We can learn from history here. The period 1973 to 1982 was
ruled by rising oil, gold/silver and commodity *prices. That brought a wildly
erratic
stock market with numerous swings down, up, down, etc.) Now with oil,
gold and commodity prices falling, the Dollar is much the
most powerful
currency. Might we not expect a market that is the exact opposite of
the period 1973-1982. Wouldn't the exact opposite be a steadily rising
market? Perhaps, one like the 1950s when the Dollar was also king of
currencies?
The Big Banks Are in Charge!
FAS, representing the financials in a leveraged ETF, is "on a tear".
If the market were in danger, FAS and the 7 big banks would not look so good,
I assert.
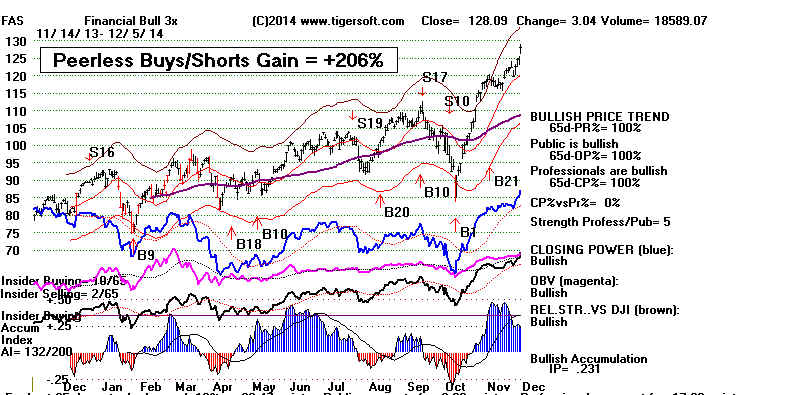
This is an era where the big banks obviously rule the roost. In other
timess, their power was usually exercised more clandestinely amd less overtly.
Now the power of Wall Street's Big Banks is no longer hidden. The
populists camplain. But they have no effect. In an era when there is
no fiscal policy because of the DC political stalemate, the FED's monetary
policy is almost completely in control of stock prices.
The all-powerful Fed is the banks' representative and benefactor in Washington.
Who is going to challenge them politically? Both Democrats and Republicans
get huge political donations from Wall Street. Now the strong Dollar
brings in loads and loads of foreign capital into the US stock and bond
market. International business transactions in Dollars requiring currency
exchanges also bring in more profits for the Big Banks. Now the BIg Banks
are also stock brokerages. They can readily buy and sell stocks. With
their inside knowledge of Fed decisions, they can make even bigger profits. (I
know the FED claims to keep its deliberations secret, but I don't put
much weight on such assertions.) And they have a vested interest in pushing
higher prices. Finally, if the Big Banks thought that the FED was going to tighten
monetary
policy, I would expect their share prices to be retreating. Instead, they are
rising.
Historically rising Big Banks have meant higher stock prices. Consider below BAC's
breakouts in the second half of the years since 1982. BAC has just made an
IP21 confirmed
(IP21>.20) 6 month new high. Historically, how soon after such breakouts did
a top come? Ususually, not until the following Summer, at the earliest.
DJI Advances and Earlier Confirmed BAC Breakouts
in The Second Half of The Years since 1982
Earlier BAC 6 month BAC High
DJI
DJI subsequent
Confirmed Breakouts
Next Summer High
----------------------------- --------------
--------
------------------/---------
9/28/1982 1.86
3.63 6/7/1983
919.33
1248.30 6/16/1983
10/19/1984 4.14
5.53 7/19/1985
1225.93 1357.97
7/16/1985
12/13/1985 5.63
6.94 5/30 1986
1535.21 1898.03 7/2/1986
8/2/1988 6.97
13.72 8/7/1989
2131.22 2734.64
8/24/1989
12/26/1991 10.25
12.34 7/2/1992 3082.96
3413.21 6/1/1992
12/17/1992 12.84
14.41 4/13/1993 3269.23 3648.17
8/26/1993
8/7/1995 14.83
25.78 11/26/1996
4693.32 5762,12 5.23.1996
8/17/2004 43.44
47.00 6/21/2005
9972.83 10705.55 7/28/2005
8/2/2006 51.96
54.90 11/20/2006
11199.93 14000.1 7/19/2007
12/7/2012 10.63
15.81 11/25/20013
13155.13 15658.36 8/2/2013
12/5/2014 17.68
------------------------
==============================================================
OLDER HOTLINES
==============================================================
12/4/2014 Peerless Remains
on A Buy.
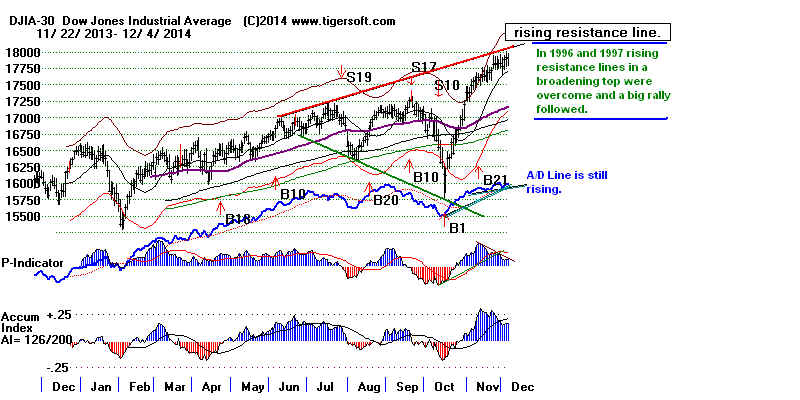
This
is a blue chip market now, pushed up by the rising Dollar
and the need
that
Professionals have to put money to work to try to match the Averges.
The
CLosing Powers of DIA, SPY and QQQ are rising. Professionals are
still
bullish.
It
has also been a fine market to short the Bearish MINCPs,
most of which
have
been oil stocks. That should continue. I expect year-end tax loss selling to
keep
pushing down the weakest Relative Strength and Heavy Distribution
stocks, especially low priced stocks. (Note that in January, they may come alive
if
the market behaves like it did in 1986. Or we may get Sell S9s and Sell S12s if
they
remain weak in early January and the DJI gets too far ahead of the broader
market.)
For
now, the Yen falls nearly every day. Crude Oil seem about to start another
leg
down. This is bullish for most big blue chips. The strong Dollar attracts big
money
to the US and keeps it here. It also means inflation is not a problem and rates
can
be kept low longer by the FED.
Reading The Jobs Report Tomorrow
Things are more complicated than this, of course. The FED is also informally
charged with policing against real wages rising so fast that they might impinge
on
corporate profits. This means it must walk the fine line between wage
inflation and too much unemployment. Seen this way, its policies since
2009
have been very successful. (The next Real Wages Report will be
released by DOL on December 17th.)
The
Jobs Report to be released tomorrow will show how many new
non-farm jobs were created in November. As the Atlanta
Fed has estimated that it
takes
about 100,000 new jobs to keep up with a gradually growing population
of
working adults, it will in theory take a number over 100,000 to make
the
Unemployment Rate rate fall. But the reality is much more complex
because many choose not to work; other have given up looking; still others
can
find only part-time work. So, the Labor Dept. samples 10,000 people for
the
offical Unemployment Rate number. Both numbers affect the market.
But
it is the Jobs' Report we should look at most closely, I think.
We
look at it for changes in trend. Any number November tomorrow
above +274 would be quite bullish, I would think. When the current
month's number
is
above last month's and also above the number for the same month a
year
ago, it is bullish. I have shown these very large blue numbers in the
table
below. September's numbers this year were of this type.
The
opposite also works well and tells us when to watch for a market top.
When
the monthly jobs' report's number falls from month to month and also
compared with a year ago it is a warning. It becomes quite bearish when the
number also turns negative. This last occurred in July 2007 with the June
report. Three weeks later Peerless gave perfect real-time Sell S9s and S12s
at
the market top.
MONTHLY
CHANGE IN NON-FARM US EMPLOYMENT
(in 1000s)
| Year |
Jan |
Feb |
Mar |
Apr |
May |
Jun |
Jul |
Aug |
Sep |
Oct |
Nov |
Dec |
Annual |
| 2004 |
161 |
44 |
332 |
249 |
307 |
74 |
32 |
132 |
162 |
346 |
65 |
129 |
|
| 2005 |
134 |
239 |
134 |
363 |
175 |
245 |
373 |
196 |
67 |
84 |
337 |
159 |
|
| 2006 |
277 |
315 |
280 |
182 |
23 |
77 |
207 |
184 |
157 |
2 |
210 |
171 |
|
| 2007 |
238 |
88 |
188 |
78 |
144 |
71 |
-33 |
-16 |
85 |
82 |
118 |
97 |
|
| 2008 |
15 |
-86 |
-80 |
-214 |
-182 |
-172 |
-210 |
-259 |
-452 |
-474 |
-765 |
-697 |
|
| 2009 |
-798 |
-701 |
-826 |
-684 |
-354 |
-467 |
-327 |
-216 |
-227 |
-198 |
-6 |
-283 |
|
| 2010 |
18 |
-50 |
156 |
251 |
516 |
-122 |
-61 |
-42 |
-57 |
241 |
137 |
71 |
|
| 2011 |
70 |
168 |
212 |
322 |
102 |
217 |
106 |
122 |
221 |
183 |
164 |
196 |
|
| 2012 |
360 |
226 |
243 |
96 |
110 |
88 |
160 |
150 |
161 |
225 |
203 |
214 |
|
| 2013 |
197 |
280 |
141 |
203 |
199 |
201 |
149 |
202 |
164 |
237 |
274 |
84 |
|
| 2014 |
144 |
222 |
203 |
304 |
229 |
267 |
243 |
203 |
256(P) |
214 (P) |
|
|
|
===============================================================
OLDER HOTLINES
===============================================================
12/3/2014 Peerless Remains
on A Buy. See the DJIA's chart.
Bullishly, the Closing Powers for DIA and SPY
have hooked back upwards.
Professionals are betting again on higher prices. I think we also have to.
But
this remains a blue chip market backed by the very strong Dollar.
The Yen keeps falling and Crude Oil
could be about to start another move down.
With
the Dollar this strong, the FED will, I think, have no alternative but
to
keep interest rates for a long time.
True,
the DJIA is back up to its rising resistance line, so it might pullback again.
But I
think the evidence still suggests higher prices. If you sold
it on Monday's
strength, I would buy DIA back. High priced Visa and IBM could soon
start
multi-point moves. The banks in the DIA are moving up again. See
FAS
below.
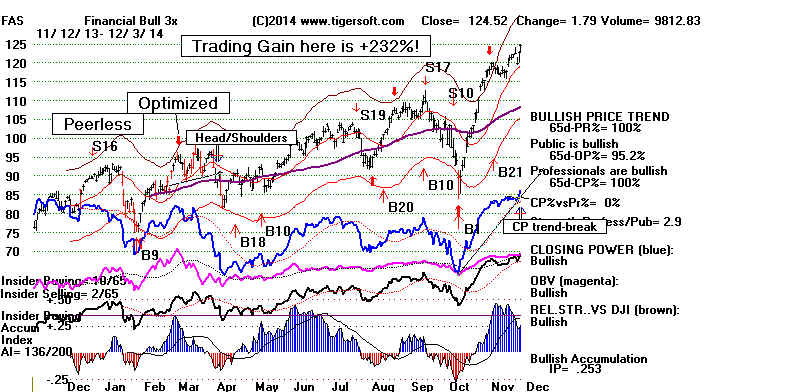
In
addition, the tech stocks, MSFT, INTC and CSCO are in uptrends with plenty
of
Professional buying. If you have been holding DIA or SPY with
the intention
of
selling them if they close below the opening, I would relax a bit and simply
just
hold them.
Hedging with some Bearish MINCP stocks that are apt to be
under heavy
tax
selling until the end of the year is also advised. At the same time, below are
some
stocks showing very high Accumulation, strong Closing Power and
Relative Strength. Their leadership should continue. I think they can still
be
bought with the expectation that if the DJI keeps moving up, so will they.
Their
high Accumulation, if the market were to turn down, should help prevent
them
from declining much. And after all, since 1965 the DJI has averaged
a
gain of 2.4% over the next month and achieves a gain 85.1% of the time.
===============================================================
OLDER HOTLINES
===============================================================
NIGHTLY HOTLINES
12/2/2014 Peerless Remains
on A Buy. Bullishly, the Closing Powers
of DIA and SPY hooked back up as they
approached their CP 21-day moving
averages. Professionals are betting again on higher prices. But, this
remains
a
blue chip market backed by the very strong Dollar.
If
you sold DIA and SPY on strength Monday, as per instructions here, you might
want
to wait for buy back either position. Both are too close to their rising resistance
levels to offer much immediate upside potential. If you chose to continue to hold
DIA
or SPY, I would sell them on a close tomorrow below the opening. This would
be in
keeping with their recent trendbreaks following CP non-confirmations.
As
for stocks, holding long the strongest blue chips among the Bullish MAXCPs
and
short the weakest of Bearish MINCPs should work out
while we wait for
the
DJI either to breakout above its resistance or turn down with more conviction.
My
judgement here is that we will see still higher prices after a week or two
of
hesitation. After all, our research shows the DJI should keep rallying while
Crude Oil falls and the Dollar keeps rising. The strong
Dollar and the falling price
of
Crude are especially bullish for the large retailers, like WMT,
mentioned yesterday.
Tax
loss selling will probably continue to depress the weakest stocks until the
end
of the year.
===============================================================
OLDER HOTLINES
===============================================================
12/1/2014
Peerless
Remains on A Buy. However, the Closing Power
Trend-Breaks on the DIA and SPY charts following their non-confirmations
of
the recent price highs is a classic TigerSoft short-term sell. In additon,
the
rising price-resistance lines seem too much for DIA and SPY now. We also
see
the same bearish CP NCs and trendbreaks in FAS and IWM. I would think
taking trading profits in SPY and DIA on strength tomorrow is only prudent. But
traders who watch the market all day might prefer to wait for the DJI to
appear to be closing below its opening to sell. This would help them avoid
selling prematurely on a bullish reversal-day back upwards.
A
strong closing much above a higher opening tomorrow will look bullish.
Tax
loss selling may be distorting and exaggerating the high number of
new
lows and MINCP stocks now, but it would still probably be best to wait
for
the key Closing Powers to turn up to tell us it's safe again to buy.
Stay
hedged: long some bullish MAXCP blue chips and short some
bearish MINCPs.
The Intermediate-Term Trend Is
Still Up.
The market's wild grations Friday and Monday seem to
be the result of
highly emotional responses by "gold-bugs" and their cousins in the "oil
patch"
to
quite anticipated news, namely (1) that the Swiss people would not approve
of
increasing their country's central bank reserves of Gold to 20% and (2)
that
that OPEC would not be cutting back on oil production to shore up the
falling price of Oil. In so far as these actions have already been priced
into
the market, we should not consider them significant.
As
long Oil Prices do not turn up dramatically and rise back above their
65-dma, history shows that the DJI is apt to keep rising. (See Sunday's Hotline
for
our study of this). Couple that with the fact that the DJI averages a 2%
gain
over the next month and the absence of a new Peerless Sell and you
can
see why I have to say the intermediate-term trend is most likely still
up
even though profit-taking seems prudent for th short-term.
Sunday night, I suggested that traders take some profits in DIA
and SPY
provided the DJI's opening on Monday was not down more than 30 points. But it
opened down much more than that. So, I assume we are still long SPY and
DIA.
The two most bearish technical concerns now are (1) the lagging
NYSE A/D Line and
(2)
the break in the steep Closing Power uptrends of DIA and SPY. I don't think
the
first will stop the major advance here. There are many times when the A/D Line
lags
the DJI for months in a long bull market and DJI still goes higher,
especially in the months of November and December. Two cases demonstrate
the
supremacy of the end-of-year bullish seasonality over bad breadth: late 1986
and
late 1999. December tops in bull markets are rare.
1968 and 2008 are the
best
examples. In the first case, we had a wildly speculative market. The Public
then
was fully involved and busy buying low priced "cats and dogs". That is
certainly not true now. In the second case, 2007, December actually brought
major
a Peerless S9 and a S12. We have had no Peerless Sell here. In fact,
even
with the DJI at the 21-day ma, the current P-I and IP21 indicators are
way
too positive to anticipate either Peerless signal.
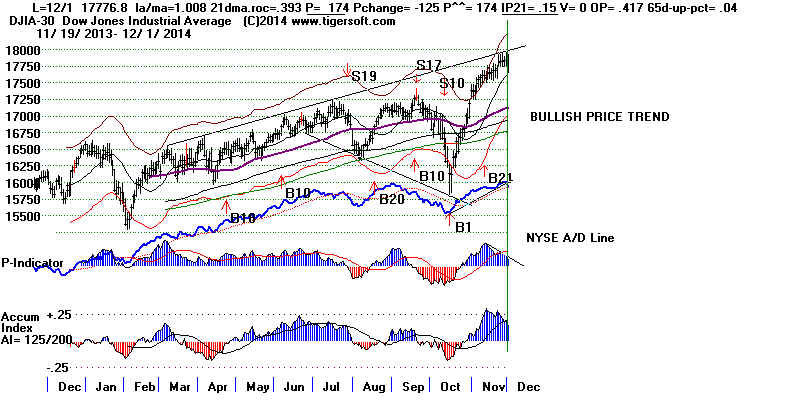
But the fact remains: the breaks in the steep Closing Power
uptrends
of DIA and SPY follow prices highs that the CP Line did not confirm.
See these recent CP NC's below. Such combinations are
classic short-term Sells even without Peerless signals, based on our
Closing Power rules. So, traders should probably take profits in DIA
and SPY on what appears will be a strong opening on Tuesday.
We will still have to watch to see how the markets close tomorrow and
Wednesday. The Closing Powers have fallen and are nearing the support of their
rising 21-day ma. Turns upward by CP from their 21-day mvg.averages
will probably have to be viewed as short-term Buys.
The Closing Powers of DIA and SPY are
nearing the support of their 21-day mvg.avgs.
This should bring in strong Professional Buying.
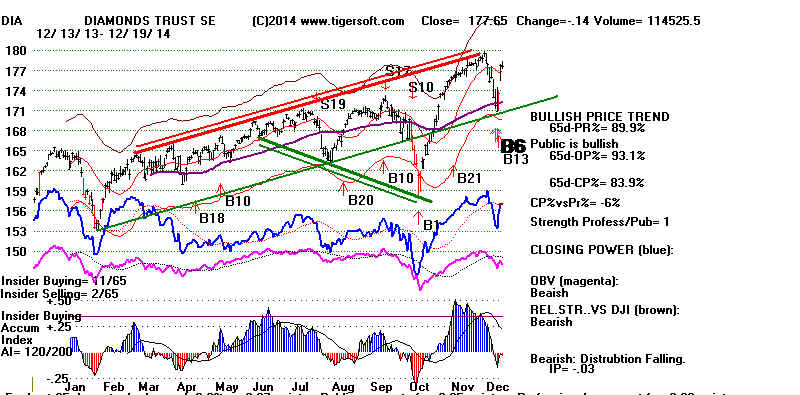
.
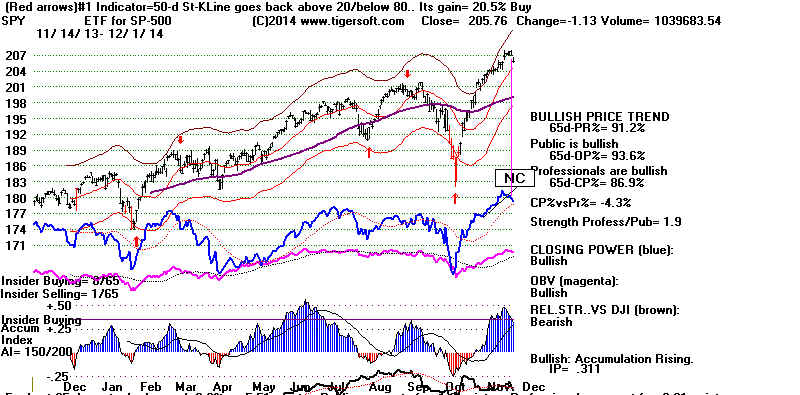
===============================================================
OLDER HOTLINES
===============================================================
11/28/2014 Peerless Remains
on A Buy. The
steep drop in Crude Oil Friday
again boosted Transportation stocks and the Dollar, which in turn is helping
Big Retail importers like Target, Walmart
and Costco. As long as Crude Oil
keeps falling, history suggests the DJI will keep rising so long as Peerless
does not give a Sell.
We should also take into consideration how bullish the month of December
usually is. Even this coming week since 1965 has produced rallies in the DJI
70.2% of the time. This would certainly cause me to hold bullish MAXCP
tech stocks now.
A Brief Post-Thanksgiving
Decline Has Probably Started.
But breadth was bad on Friday; there were 714 down than up on the NYSE.
The most heavily traded ETF, SPY, cannot seem to get past its rising resistance
lines. Usually this causes a retreat while market plumbs for support
before it can next challenge its rising resistance. On Friday, there were three
very big DJI-30 declines in the abbreviated trading. Even if the potholes were
simply the result of the absence of many bigger traders, we should be concerned
when blue chips like CVX, XOM
and CAT each fell more than 5% in a single day.
In addition, SPY's Closing Power uptrend has been violated, though its 21-day
ma has not been penetrated.
Conclusion: if you are a trader, unless there is a very positive opening on Monday,
you should probably lock in SPY and DIA profits. In the next week, when the
Closing Power for SPY and DIA turn back up, we can consider buying them back.
On the other hand, if the DJI opens down 30 or more, I would not sell DIA or SPY
and plan to ride out the short-term weakness in deference to the way the DJI usually
keeps rallying while Oil plunges and the still operative Peerless Buy.
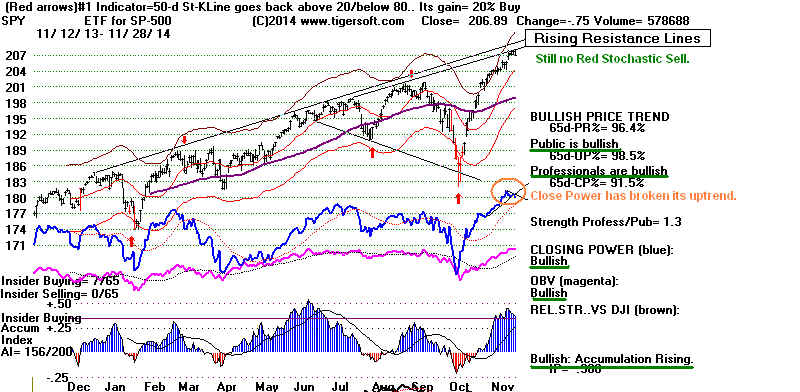
Crude Oil's Decline Is
Bullish,
So Long As Its Decline Continues.
It's only natural to want to wait and see what happens in the aftermath
of Thanksgiving and the sharp 12% drop on Friday by Crude Oil. But
my study here, this weekend, suggests that steeply falling Crude Oil
is actually bullish for the market for as long Crude keeps falling and
there is no Peerless Sell.
Since 1984 only Crude Oil's 60% plunge in the first half of 1986 was larger
than this years 38% big drop. In that case, the DJI kept rising as long as
Crude Oil fell. But when Crude Oil finally moved past its 65-dma, the DJI
then went into a holding 11% wide trading range for seven months. Such
behavior was the most common scenario when Crude Oil swooned when
the DJI rose in a bull market.
Crude Oil and DJI - 1985-1986
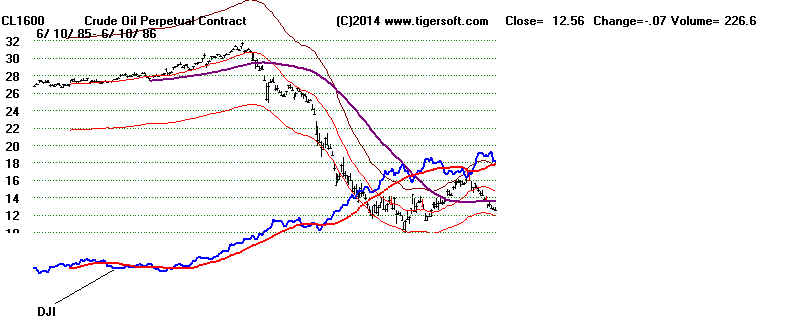

Crude Oil - 2013-2014
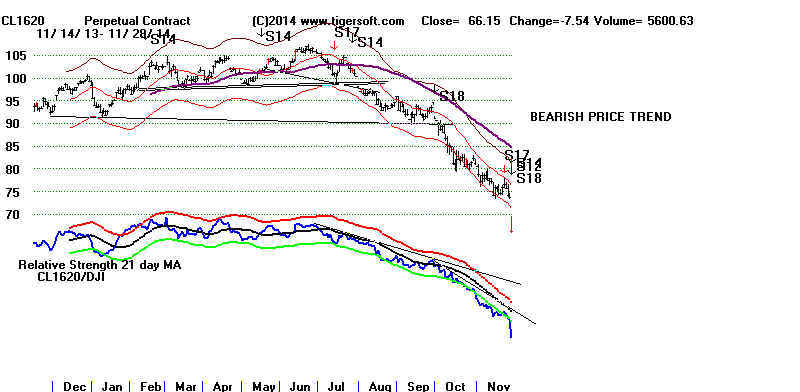
Crude Oil's plunge on Friday now puts it down 38% since its peak on June 19th.
While this puts a lot more money in consumers' pockets, it also represents a big
drop in net worth by all those investors who have bet on a Crude Oil recovery
before the end of the year. Most likely, some big players decided to take their
loses
now rather than become part of a year-end stampede. The other factor is the
economic slowdown in developing nations and Europe to a much lesser extent.
Demand for oil is waning exactly when US supplies of Oil, Oil Shale and Gas are
rising.
Will the benefit to gasoline consumers outweigh the harm done to oil invesotrs
as far as the market goes? Most of the time the DJI and Crude Oil tend to trend
together. But not always. We have the data for Crude Oil since 1983 to shed
some light on this question.
What Has Happened To The DJIA
in The Past When Crude Oil Falls
while DJI Rallies in An On-Going General Bull Market?
Most Frequent Scenarios:
A. The DJI continued to rise until Crude Oil got back above its 65-dma.
April 1986, September 1989, July 1990, October 1994, July 1997,
July 1998 and December 2007.
B. There was a Peerless Sell as the IP21 crossed back below its 21-dma.
August 1987 - A Summer 17% drop in C rude Oil was followed by a S4
which started the DJI's 37% two-month plunge.
C. DJI was repeatedly stopped at a rising resistance line and Peerless
gave a Sell S12.
January 1984 - 15.5% DJI decline.
------------------------------ Details
--------------------------------------------------------------------------------
1. From June 1983 to
December 1983 Crude Oil fell
10% as the DJI rose
from 1200 to 1260. The DJI was then stopped at a rising resistance line. Crude Oil then
bounced back 10% from its
December 19, 1984 low to its high in May 1984. Meanwhile,
the DJI again failed to get past the rising resistance line and was stopped on January 6th
1984
with a Peerless Sell S12. It then went into a six month 15.5% decline.
2. 1985-1986, Until November 1985 the DJI and Crude Oil rose together. But then Oil
fell 60% and theDJI rose. This continued through
mid April 1986. Then when Crude Oil got back
above its 65-dma, the DJI started to move sidewise in a 10% range for the rest of 1986.
3 July-August 1987. Crude Oil fell 17% from July 16th to August 24th, 1987.
The DJI
made a major rop on a Sell S4 in late August 1987 and then plunged 37% in less than two
months.
4. April-Jul 1989. Crude
fell 27% and DJI continued to rally. The DJI
stopped rising and
went sidewise for the rest of the year when Crude Oil turned back up above its 65-dma.
5. 1990. Crude Oil fell
35% in the first six months
of the year, but it then
turned sharply up
and crossed back above its 65-dma just as Peerless was giving major S9s and the DJI
was about to fall 20%.
6. 1994 Crude Oil fell
19% from August to
September. Crude Oil's
rise then in October
back above its 65-dma, forced the DJI into a flat pattern until February 1995.
7 1997 Crude Oil fell
25% in the first seven months
of 1997. Crude Oil's rise in
July
back above its 65-dma, started a 15% DJI decline to an October low.
8 1998 Crude Oil fell
33% in the first 6 months of
1998. Crude Oil briefly
rose in July
back above its 65-dma. This and Peerless Sell S9/S12 brought a 20% decline in DJI in
three
months.
9 2006-2007 Crude Oil fell
30% from July 2006 to January
2007. The DJI suffered
a very brief 5% decline when Crude Oil rose above its 65-dma but then took off to the
upside..
-----------------------------------------------------------------------------------------------------------------------------
OLDER HOTLINES
-----------------------------------------------------------------------------------------------------------------------------
11/26/2014
Peerless Remains on A Buy. Now that the expected pre-Thanksgiving
bullishness
has played out, we may see a minor pullback. The DJI
has not
been able to get past its rising resistance line. In addition,
DIA's
Closing Power has broken its steep uptrend. It remains to be
seen if it
will turn back up at rising 21-day ma support. Professionals
are
adopting a wait-and-see attitude toward the DJI. Meanwhile,
smaller
stocks and the NASDAQ are getting more play.
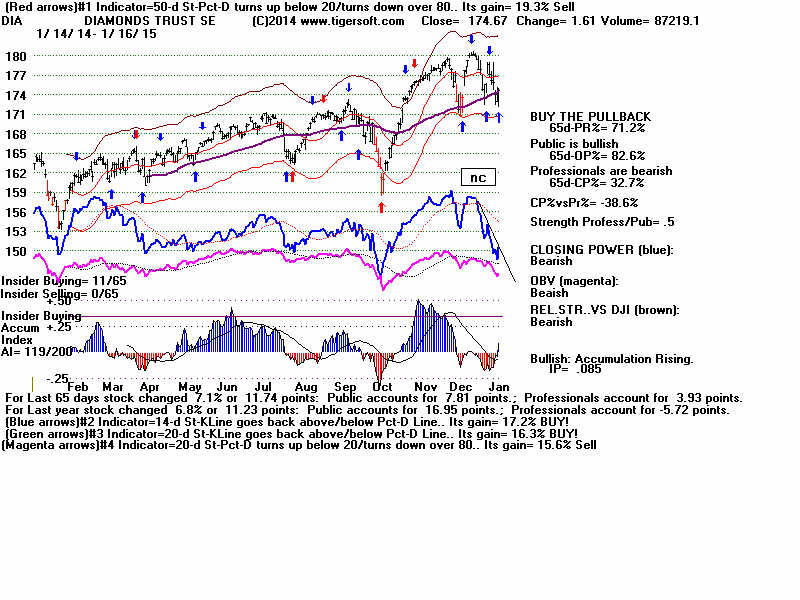
Still, I
don't think any decline will be big enough to disturb our long positions
in SPY and DIA. The Peerless Buy
B21 is quite bullish. The A/D Line for the
DOW-30 is
rising strongly and 90% of the DJI-30 stocks are above their 65-dma.
TigerSoft Index of DJI-30
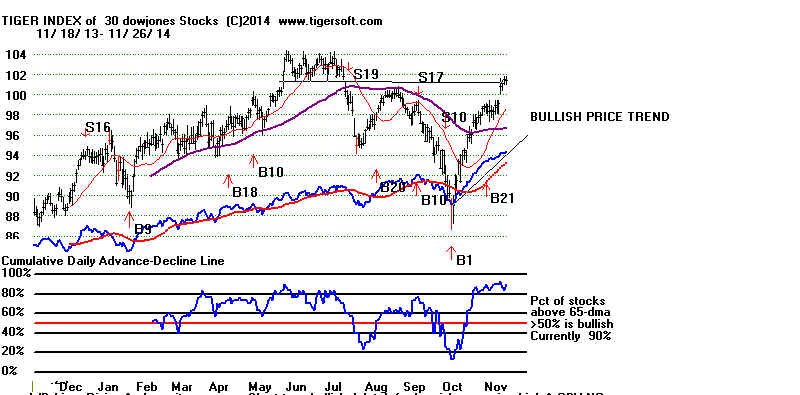
Another
bullish factor: the breakout by Semi-conductors above its
flat
resistance
should continue to boost tech stocks and the QQQ, which seems
bound to
rise another 10% and equal its all-time high of 120 from March 2000.
A upside
target of 760 can be calculated from SOX's recent "V-formation"
breakout.
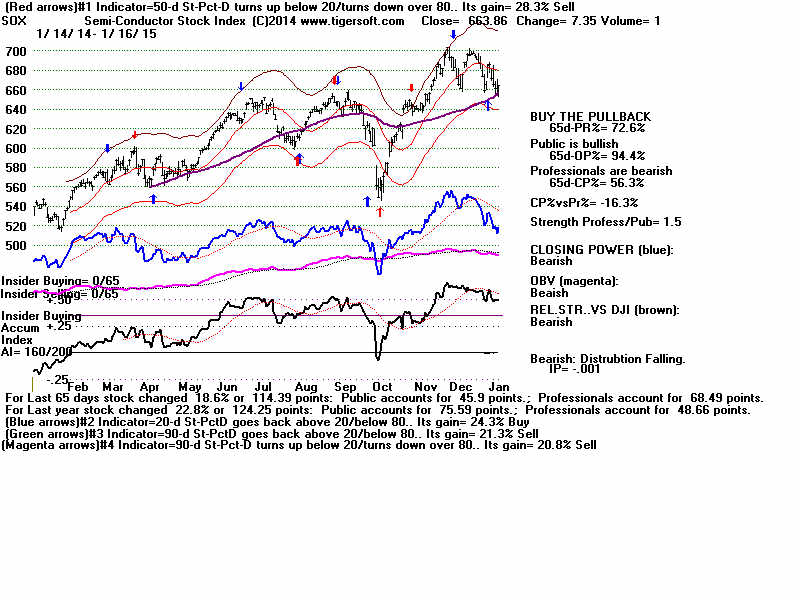
Leadership Rotation Is Normal up to The Point
Where Peerless Renders A Sell S9.
Different bullish markets do not all move at the same time. Someimes,
the DJI
leads the NASDAQ at the end of the year but the broader NASDAQ
comes on
strong with the start of the new year. An example of this is 1986-1987.
Sometimes
at the end of long bull markets, the DJI falters first but the
NASDAQ
keeps rising for another two months. See the DJI-NASDAQ chart
of 1999-2000. Of course, this is also when the long bull market
from 1991-2000
ended. An extreme divergence that brings on Peerless Sell S9s would tell
us the
"jig is up", as Groucho told his broker in October 1929.
At this
juncture. I doubt if there will be this much separation of the different
markets.
Among the DJI-30, we see powerful, high Accumulation brerakouts by
CSCO and INTC. MSFT also shows steady high Accumulation since early June.
MSFT's
Closing Power is now hooking back upwards. These theee are not high priced,
so their
impact on the DJI Average will be limited. But I still have hopes for
very high
priced Visa because of its flag formation, high Accumulation
and rising
Closing
Power. The continued fall in Crude Oil and Gas Prices gives consumers
around the
world more money to spend in the coming holidays. This will bolster
Visa,
though falling Crude prices will hold back XON and CVX among the DJI-30 stocks.
================================================================
OLDER HOTLINES
11/25/2014
Peerless Remains on A Buy. 50% of
the new Peerless Buy B21s bring DJI
gains of
more than 10% at the time of the next reversing Peerless. That
the NYSE
A/D Line has resumed its uptrend is bullish, too. We will have
to watch
now to see how much of the rally recently owes to the seasonal
pre-Thanksgiving bullishness. At this point, though, I see no reason to
disturb our
long positions in SPY and DIA.
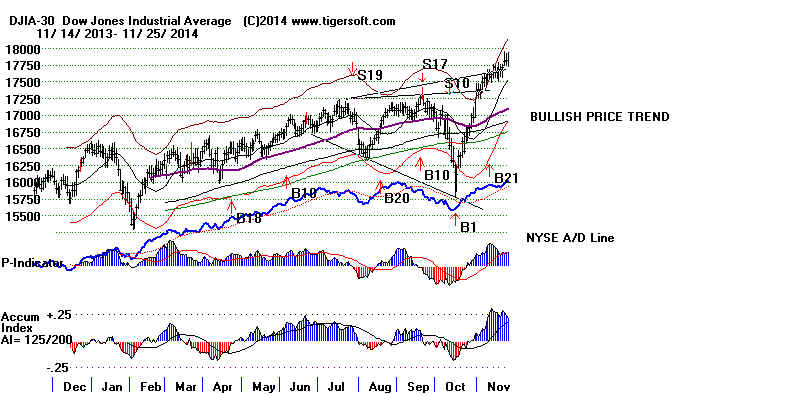
Higher
prices should continue. Visa, the highest prices and therefore
most
weighty of the DJI-30 stocks looks like it has started what could be another vertical
surge.
This looks a lot like a flag pattern breakout.
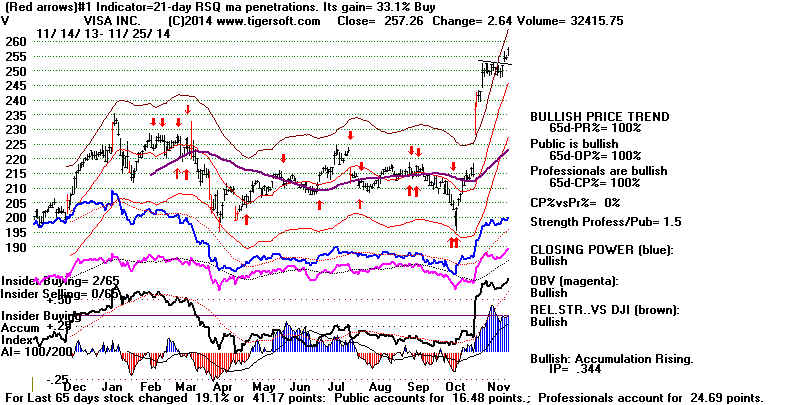
SPY, the
most actively traded ETF, has almost clearly broken above
its rising
resistance.
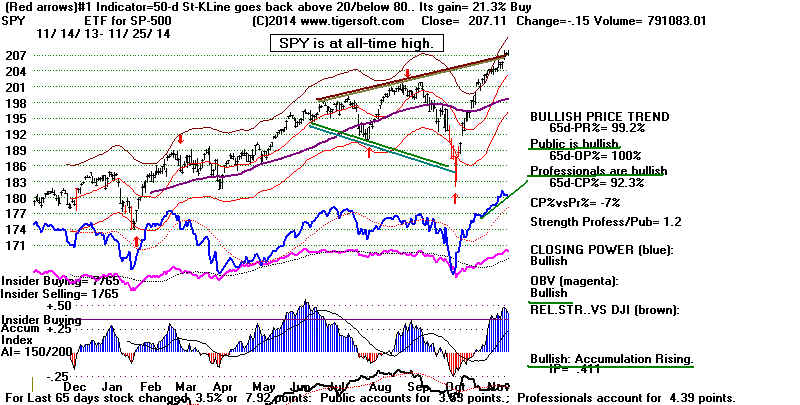
85% of
QQQ's stocks are now safely above their 65-dma and QQQ seems seems to have
its sights
set on it March 2000 high of 120, more than 10% above today's recovery high
closing of
104.84.
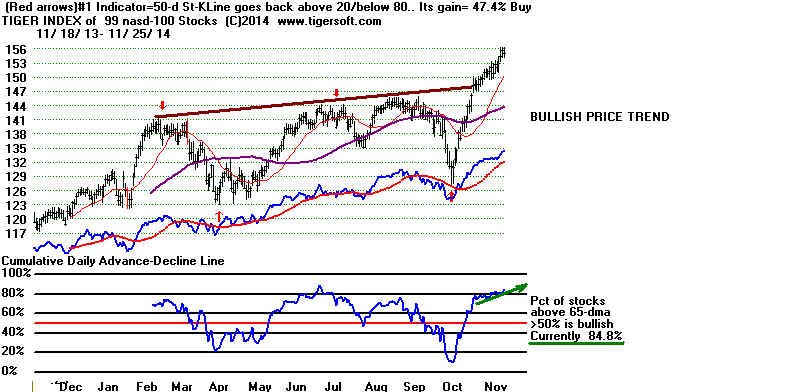
It would
add to the general bullishness if the OEX (SP-500) would add a few points,
so that it
would clearly surpass its own rising resistance line. The same goes for
the
Semi-Conductors' ETF, SOX, which is right at its rising resistance lines.
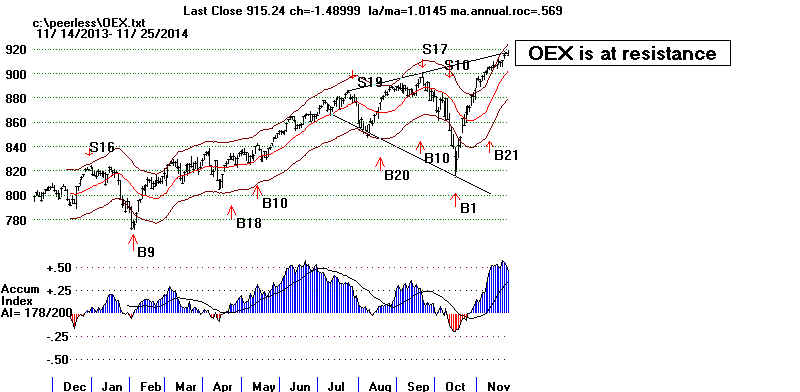
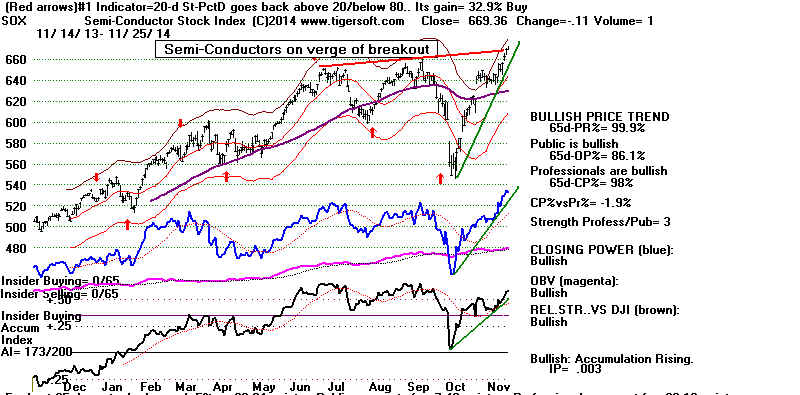
.
===============================================================
OLDER HOTLINES
===============================================================
11/24/2014
Peerless Remains on A Buy. 50% of
the new Peerless Buy B21s bring DJI
gains of
more than 10% at the time of the next reversing Peerless
Sell
signal. (See last night's hotline for the B21s' track record.)
Short-term,
we have to remain bullish as the key ETFs' Closing
Powers are
all still rising. Continue to hold long DIA and SPY.
Many smaller
growth stocks are moving higher. See how heavily traded IWF,
just below, has
just broken past its rising 6-month resistance line. The
advance there
appears to be again accelerating. In additon, the big bank
stocks and
biotechs have regrouped for another surge to new highs.
Meanwhile, the Japanese Yen continues what I think will be a long and
disastrous
decline for those older Japanese who live on fixed incomes and
for most of the
Japanese who do not work for exporters like Sony and Toyota.
(The trading
profits for currency trading hedge funds will then be enormous.
With their
appetites whetted by these massive shorting profits, I am afraid that
they will be
tempted to place major bets against the Euro next year. That
will could have
very bad consequences for many US banks and Wall Street.
But, for now, the
Dollar is very strong and that boosts foreign investments
in US stocks and
bonds.)
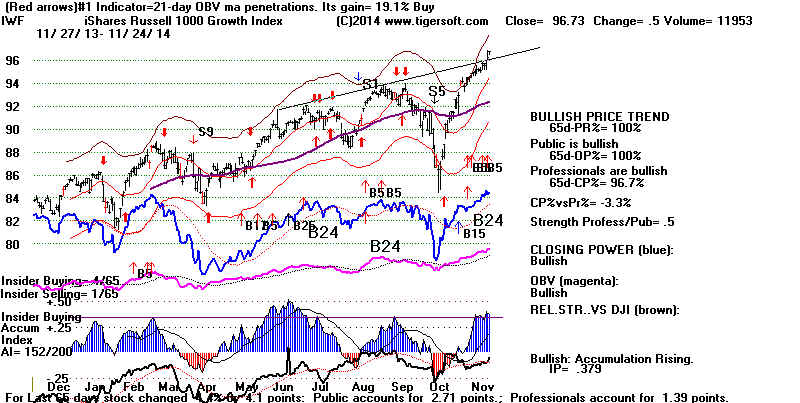
As Apple Goes, So Goes The US Stock Market
AAPL
continues to run. There seems no stopping it. With a total capitalization
worth
almost one trilliojn dollars, its rising is responsible for the advance of nearly
all the
biggest ETFs. Fortunately, its Accum. Index is above +.37, its blue Closing
Power is
making new highs and with prices at an all-time high, sellers are dispersed.
Note also
how its Opening Power is rising, too. The pattern is typical of runaway stocks.
Apply these
criteria to our Bullish MAXCP stocks and the Inv.Daily's Growth stocks,
like SWKS.
As long as these stocks' Closing Powers stay above their rising blue 21-day
ma, they
should be held. Conveniently, this limits the potential losses, too, if the
stocks
suddenly
reverse.
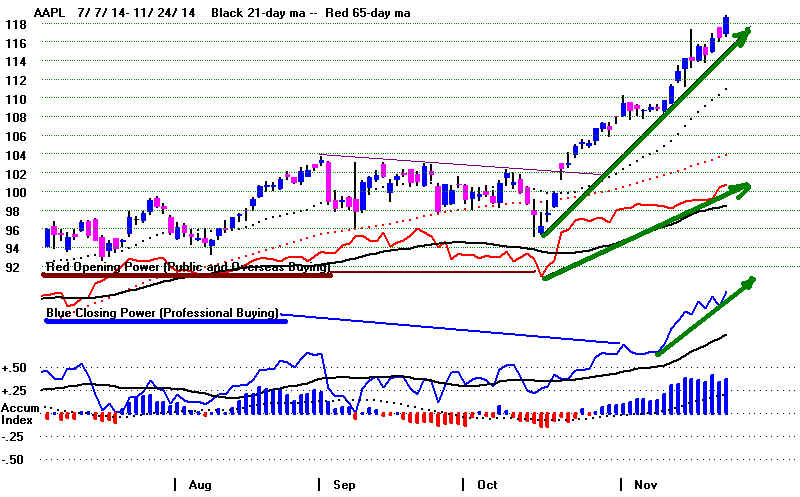 |
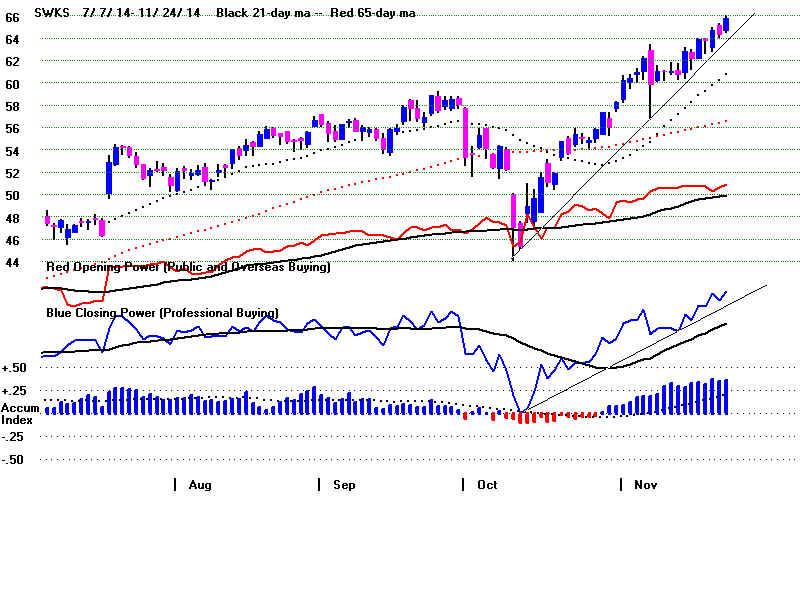 |
=====================================================================================
OLDER HOTLINES
=====================================================================================
NIGHTLY HOTLINES
11/21/2014
Peerless Remains on A Buy. Continue
Holding Long DIA and SPY.
The DJI's very high Accumulation Index
(IP21) readings, above +.22
since
November 11th, can be turned into a most productive Buy B21.
Its median
gain in 17 cases is 10% on the DJI when the next Peerless Sell
signal.
In 12 of the 17 cases there is no paper loss. Since 1928 such
first
occurrences in the last three months of the year fit well into Peerless.
See details
here and below. A new
Buy B21 will be added to Peerless this week
and may be
downloaded from our Elite Page in a few days. While it does
not change
any of the past reversing signals, it does provide notice to
us how
bullish the market has frequently become.
The Closing
Powers are rising and both the Opening Power and Closing
Power are
rising for DIA, OEX, SPY and QQQ. The DJI has risen 70.2%
of the time
over the next 21 trading days since 1965. Over the next six
months, the
DJI rises 74.5% of the time and averages a gain of +6.9%.
DIA and the
ETFs below are on the verge of moving past their respective
rising
resistance lines. My sense is that the uptrends are too steeply rising to
stop the
rallies. Moreover, if the DJI, DIA, SP-500 and SPY can make
new highs
this week, they will be above all easily drawn resistance lines
in all-time
high territory. Shorts will then not know where to concentrate their sell
orders.
That should let prices continue to rise. This is what happened
when the
broadening top's rising resistance line was breached in November 1996.
See how SPY
broke out in November 1996 above rising resistance. It rose
for 8 more
months.
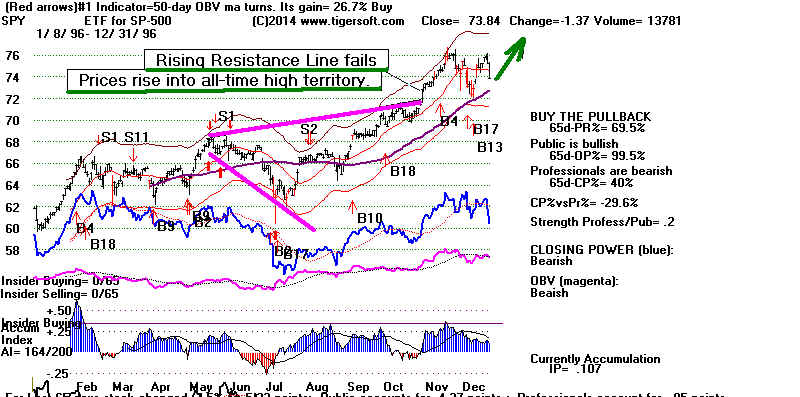
The Beast's Upper Jaw Is Being Held Open by
1)
Bullish Seasonality 2) Peerless Buy Signals 3) Partisan Celelebratory Buying
4)
Strong Dollar 5) Europe's lowering of interest rates 6) Japanese's Godzilla
Quantitative Easing
7)
Falling Oil Prices ....
------------------------------------------------------------------------------------------------------------------
BUY B21s: 1928-2014
DJI Gain Paper
LA/MA P^^ IP21
VI Reversing
Loss
Signal Date
11/11/2014
17615 ------
-------- 1.039 +613
.258 +85
-------------------------------------------------------------------------------------------------------------------
1 11/30/1934 102.9
1.1%
3%
1.042
+481 .22
+51 S16 12/31/1934
-------------------
-------------------------------------------------------------------------------------------------
2 10/1/1943
109.7 29.8%
none 1.02
+341 .237
+37 S19 5/15/1945
---------------------------------------------------------------------------------------------------------------------
3 10/1/1945
183.4 8.6%
none 1.031
+785 .291 +188 S9
1/10/1946
---------------------------------------------------------------------------------------------------------------------
4 11/5/1945
189.5
5.1% none
1.019
+496 .248 +113 S9 1/10/1946
---------------------------------------------------------------------------------------------------------------------
5 10/10/1949
185.2 19.1% none 1.016 +452
.234 +86 S8
5/18/1950
----------------------------------------------------------------------------------------------------------------------
6 11/2/1949
192.9 14.4%
2.6% 1.03 +366
.237 +69 S8
5/18/1950
-----------------------------------------------------------------------------------------------------------------------
7
12/14/1949 198.5
11.1% none 1.027
+461 .272 +107 S8
5/18/1950
------------------------------------------------------------------------------------------------------------------------
8 12/15/1952
286
2.1% none 1.015 +547 .222
+150 S16 12/30/1952
--------------------------------------------------------------------------------------------------------------------------
9 10/29/1953
276.3
69.6% none 1.032
+265 .209 -6 S8 7/27/1955
--------------------------------------------------------------------------------------------------------------------------
10 11/23/1962
644.9 18.5%
none 1.057
+867 .261 +848 S9 12/5/1963
-------------------------------------------------------------------------------------------------------------------------
11 10/1/1973
948.83
4.0% none
1.042 +523 .256 +
2 S9 10/26/1973
-------------------------------------------------------------------------------------------------------------------------
12 11/111985
1432
27.5% none 1.04 +431 .227
+13 S19 4/29/1986
-------------------------------------------------------------------------------------------------------------------------
13 12/2/1986
1956
23.0% 2.4%1.036 +34 .264
+1 S9
4/6/1987
------------------------------------------------------------------------------------------------------------------------
14 12/91988
2173
6.9% none 1.029
+55 .234
+12 S4 2/9/1989
------------------------------------------------------------------------------------------------------------------------
15 10/22/2001
9377 7.9% 1.2%
1.035 +339 .231
+78 S15 2/26/2002
------------------------------------------------------------------------------------------------------------------------
16 12/1/2009
10472
4.0% 5.4% 1.023 +299 .283
+69 S3
3/23/2010
------------------------------------------------------------------------------------------------------------------------
17 12/2/2010
11362
12.7% none 1.014
+47 .230 -24 S8 5/2/2011
-------------------------------------------------------------------------------------------------------------------------
Avg. Gain = 15.6%
Median Gain = 10.0%
Avg. Paper Loss = -.9%
Gains
Over 10% 9 cases
5%-9.9% 4 cases
3%-4.9% 2 cases
1%-2.9% 2 cases
Presidential Election Years
2.1%, 6.9%
Year after Presidential
Election Year
8.6%, 5.1%, 19.1%, 14.4%, 11.1%, 69.6%, 4.0%, 27.5%, 7.9%, 4..0%
Two Years after Presidential
Election Year
1.1%, 18.5%, 23.0%, 12.7%
Three Years after
Presidential Election Year
29.8%
October
29.8%, 8.6%, 19.1%,
69.6%, 4.0%, 7.9% (6)
November
1.1%, 5.1%, 14.4%, 18.5%,
27.5% (5)
December
11.1%, 2.2%, 23.0%, 6.9%,
4.0%, 12.7% (6)
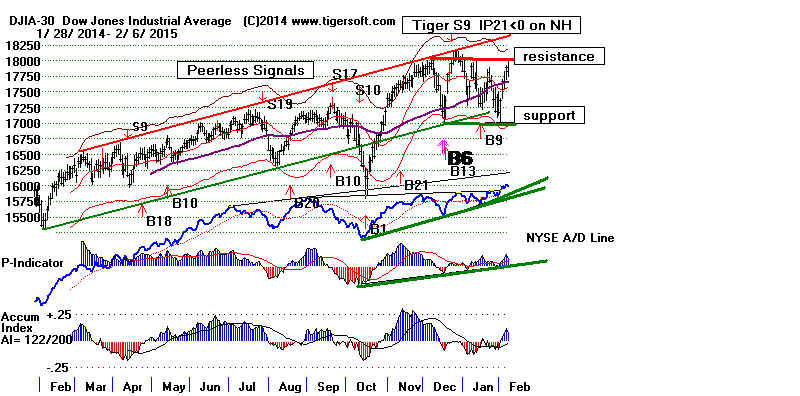
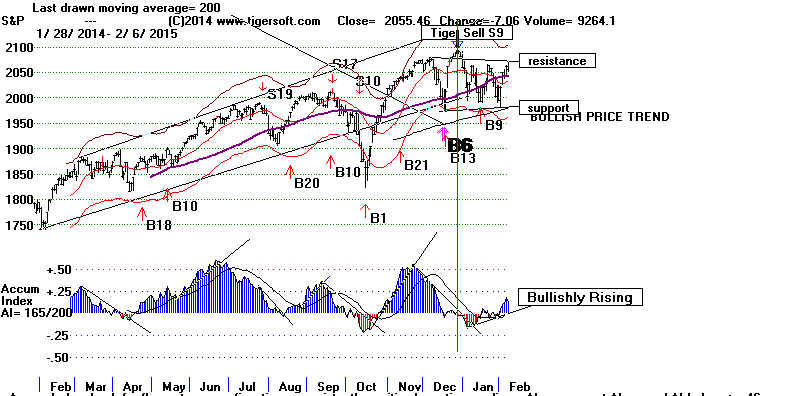
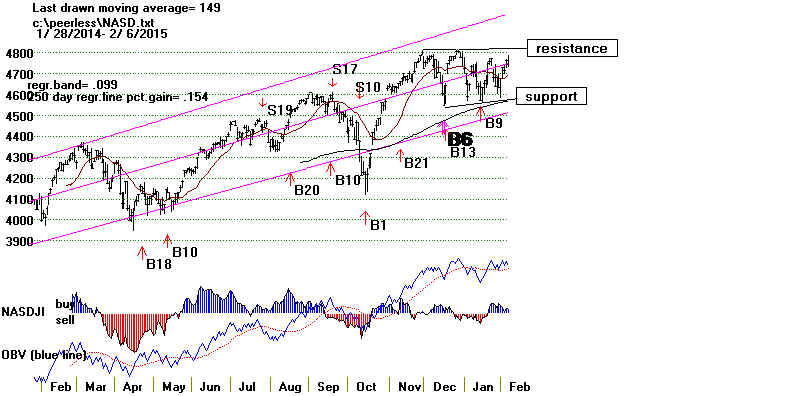
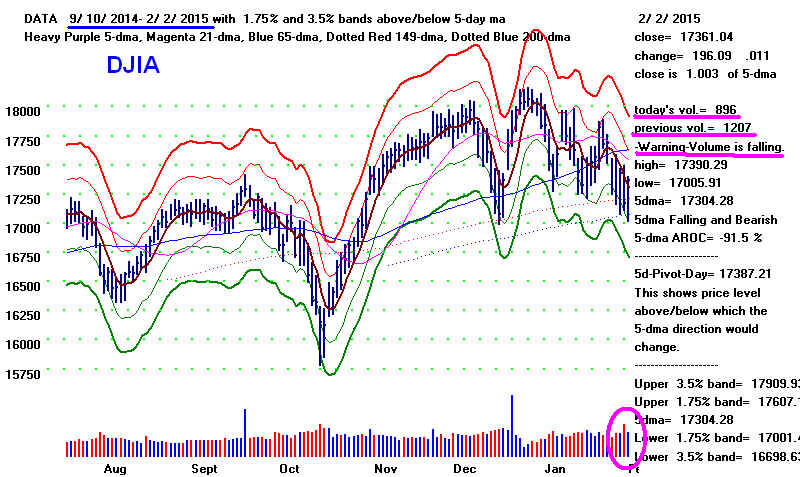
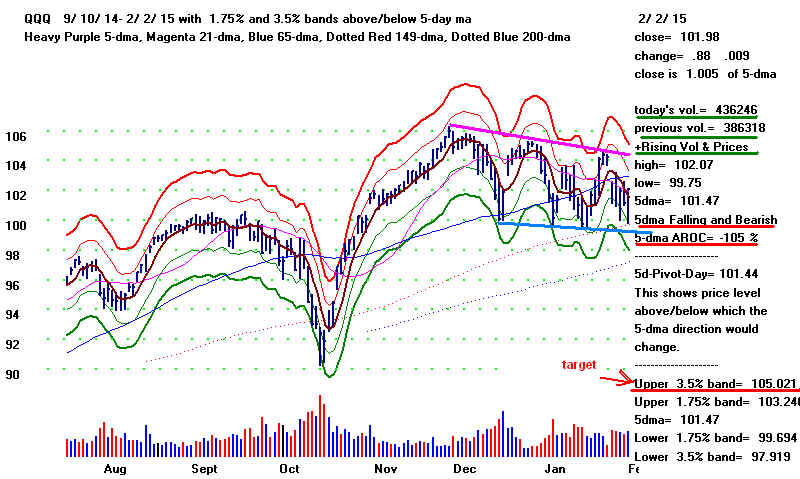
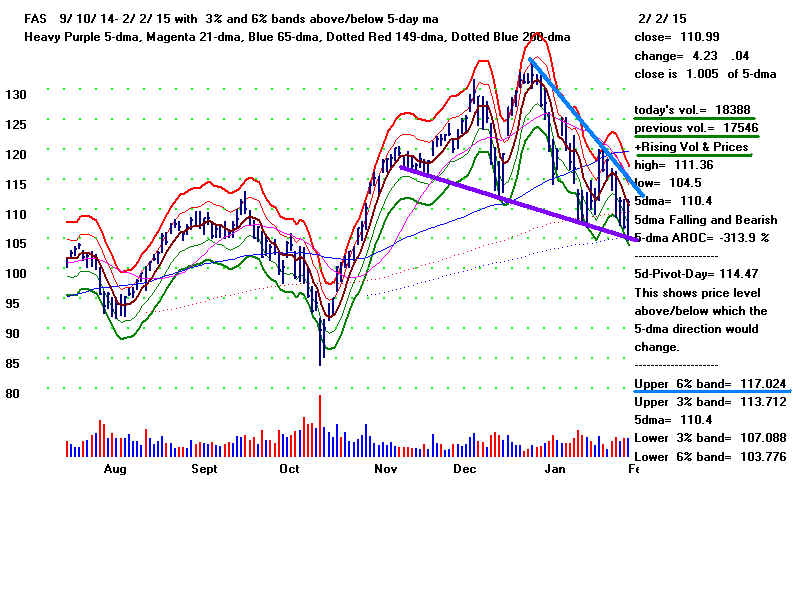
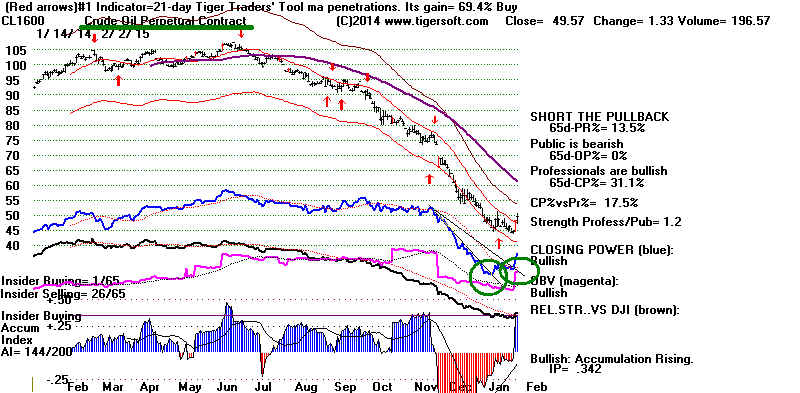
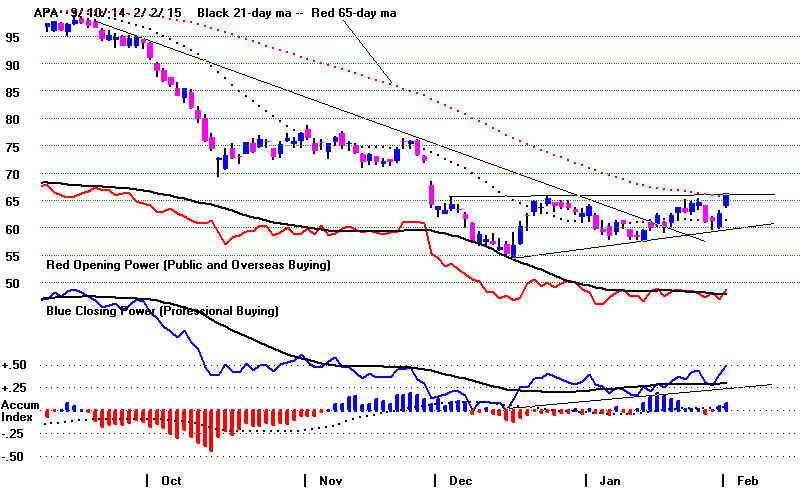
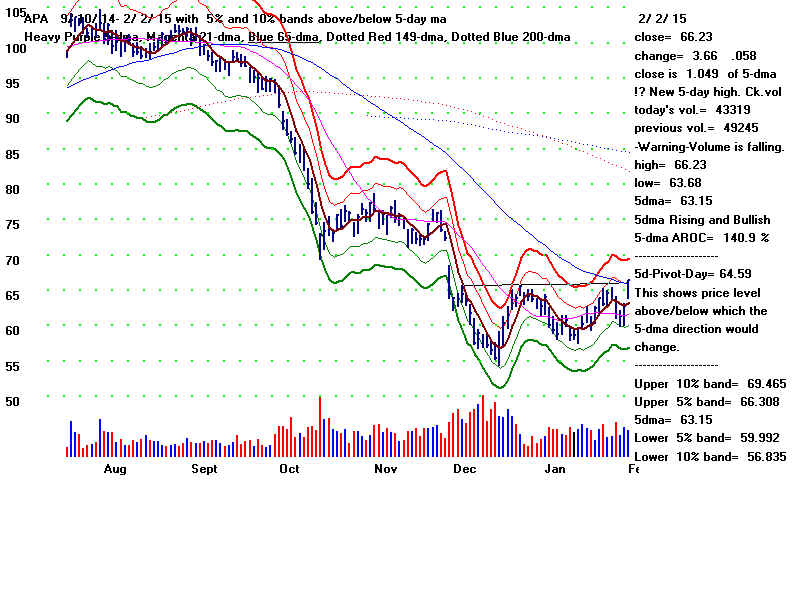
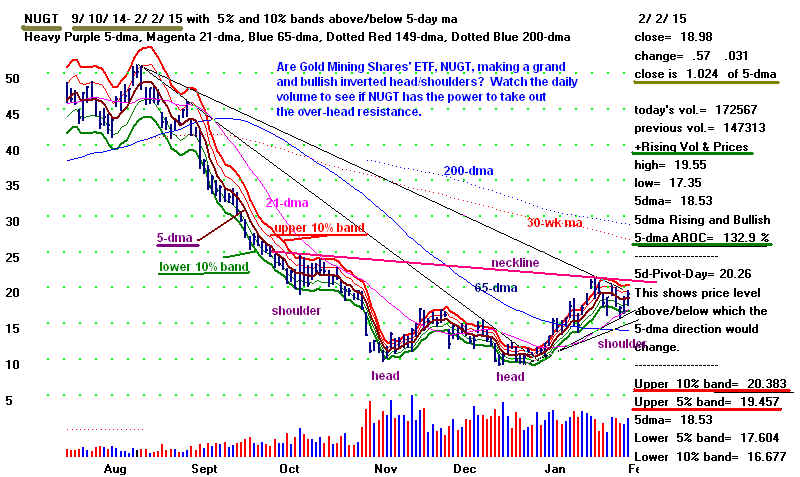
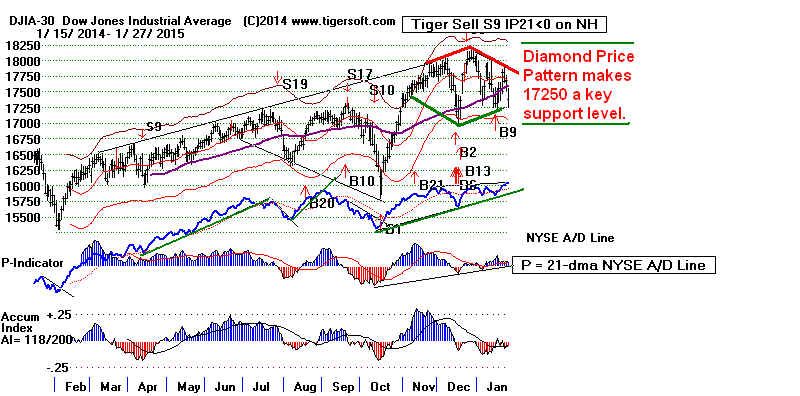
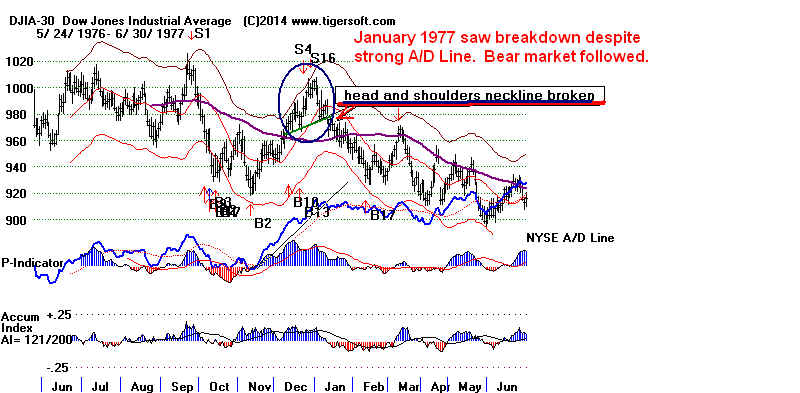
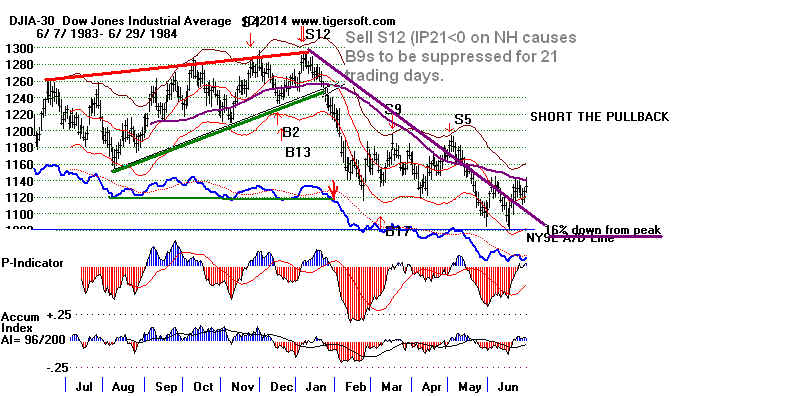
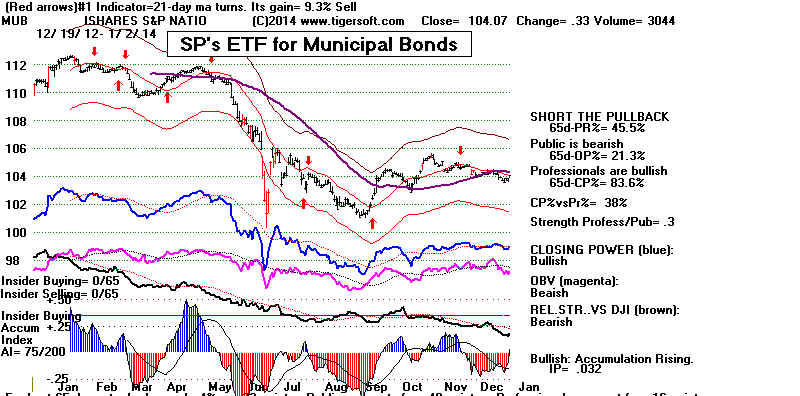
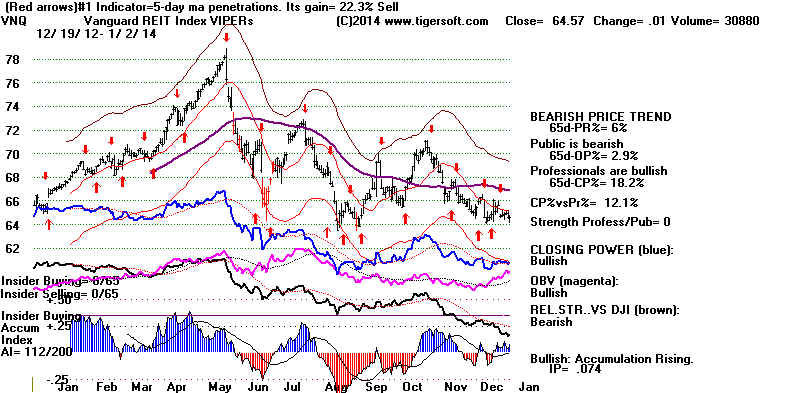
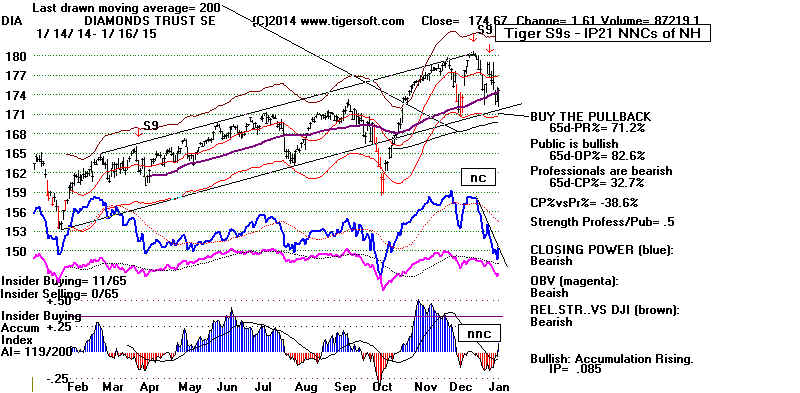
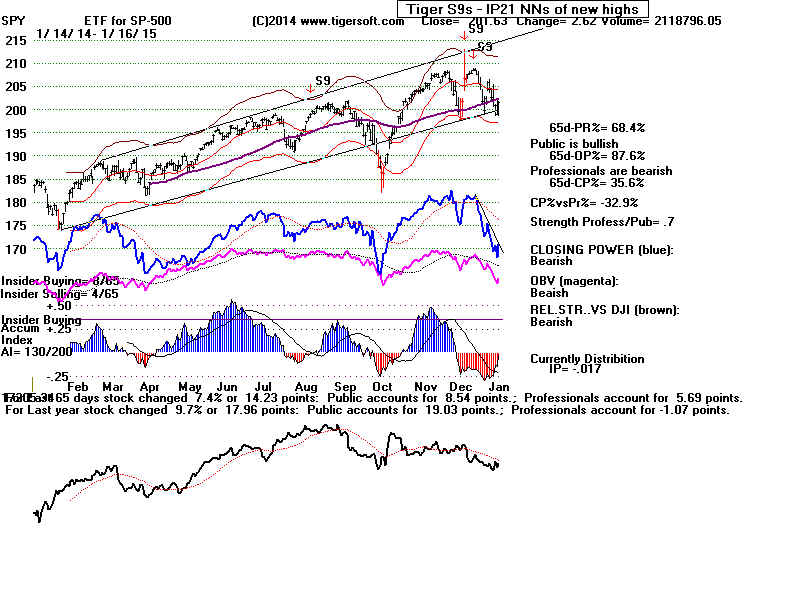
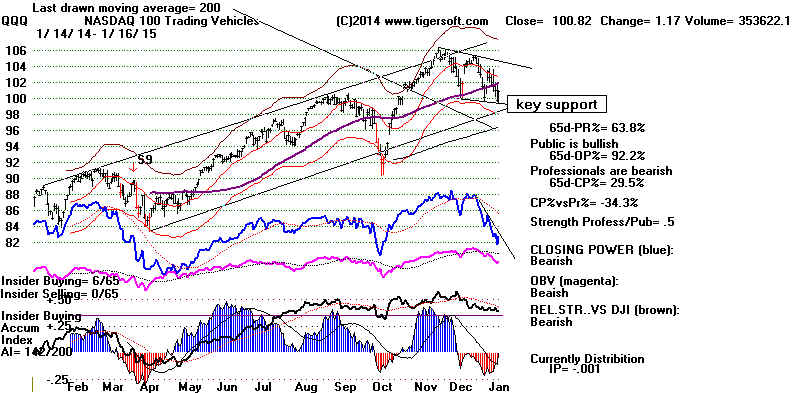
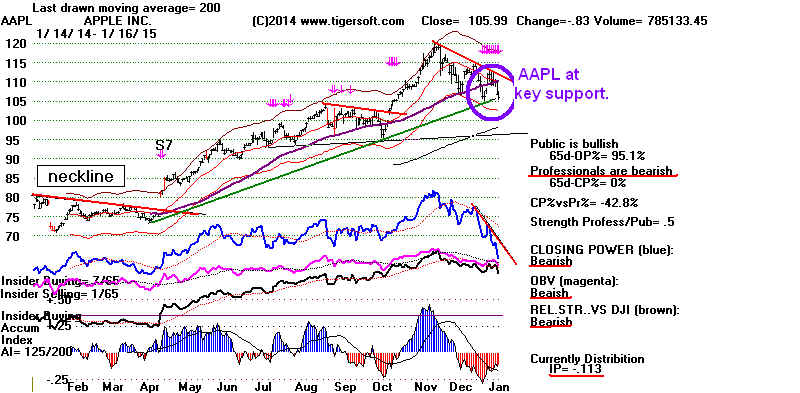
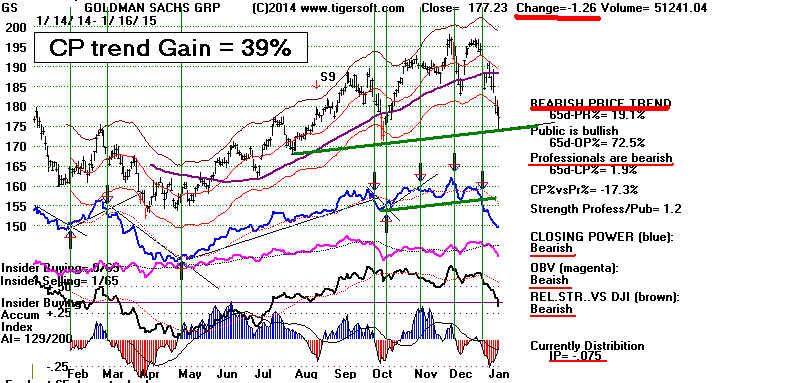
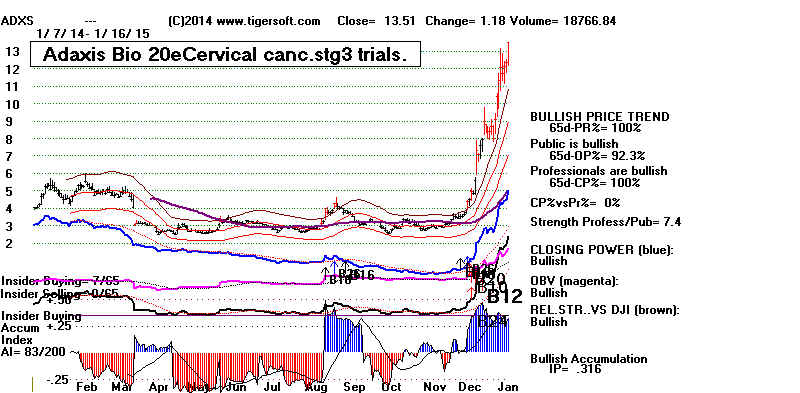
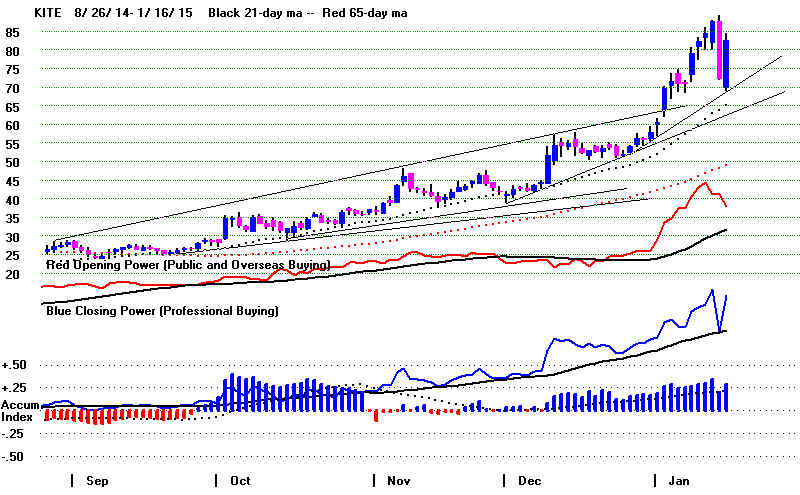
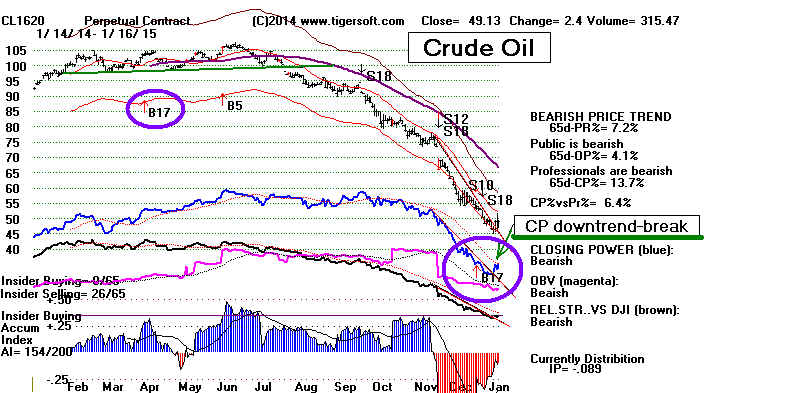
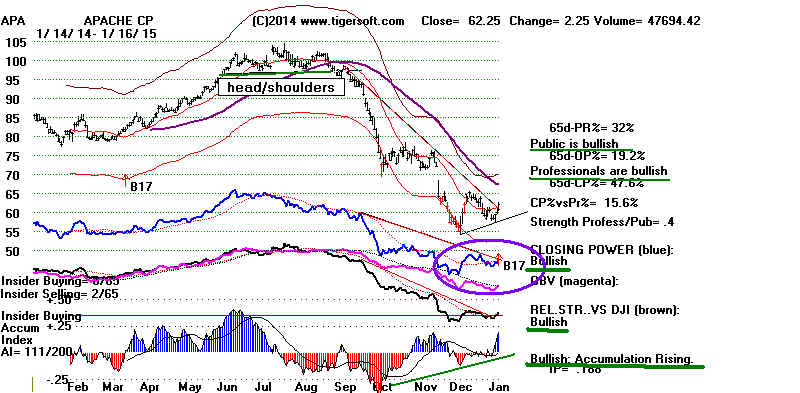
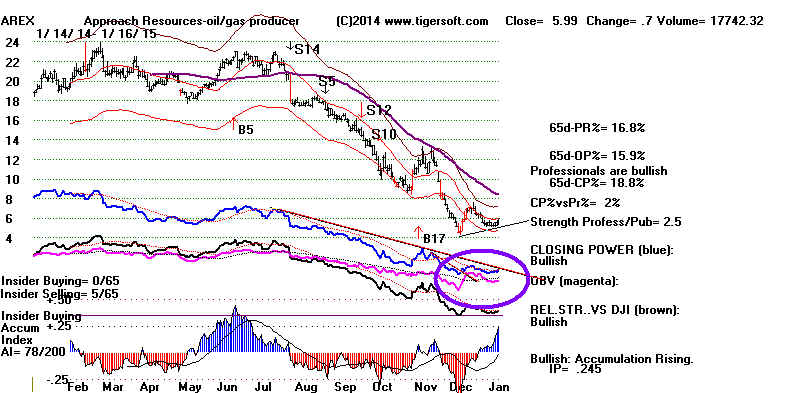
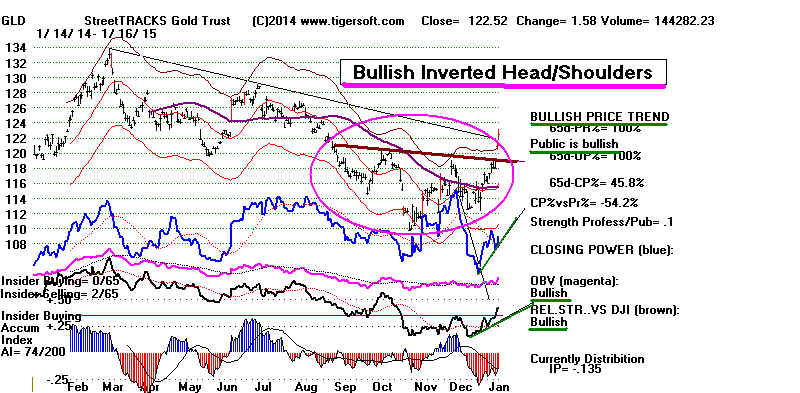
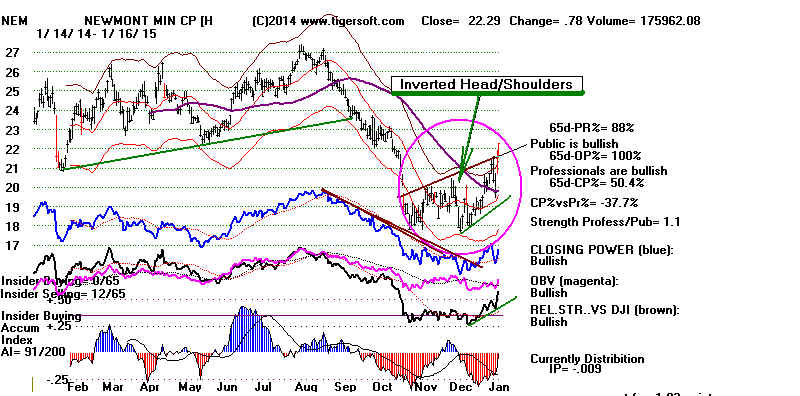
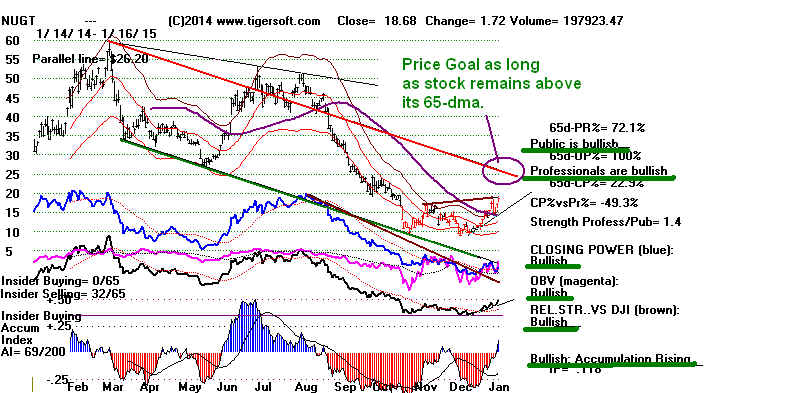
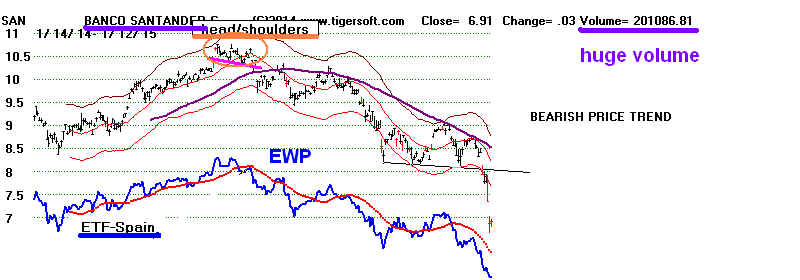
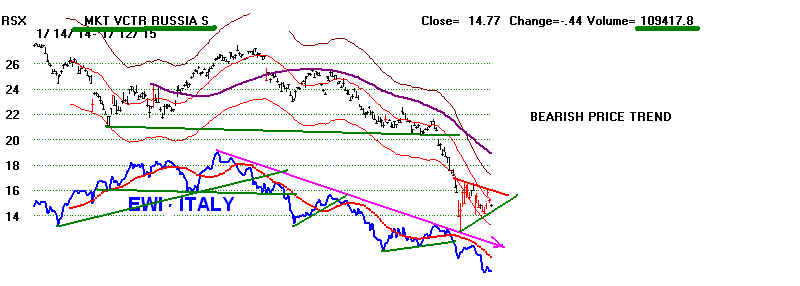
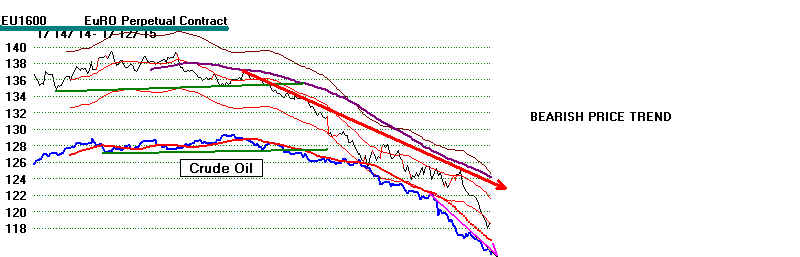
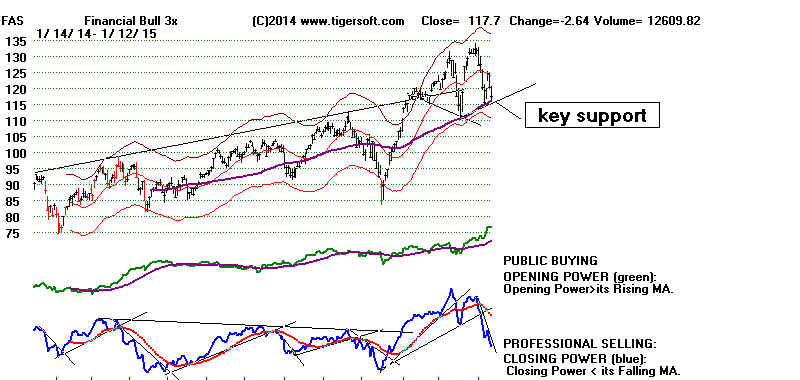
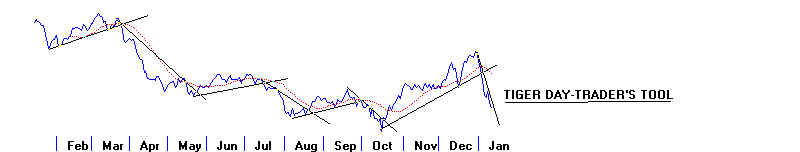
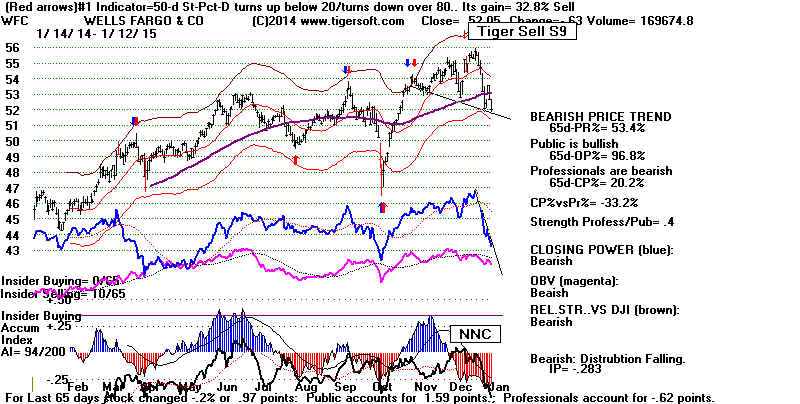
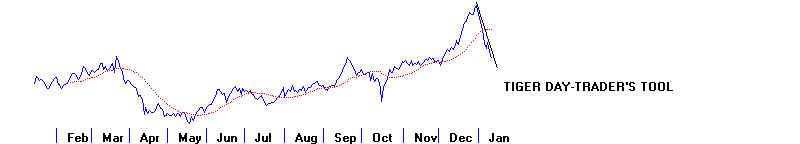
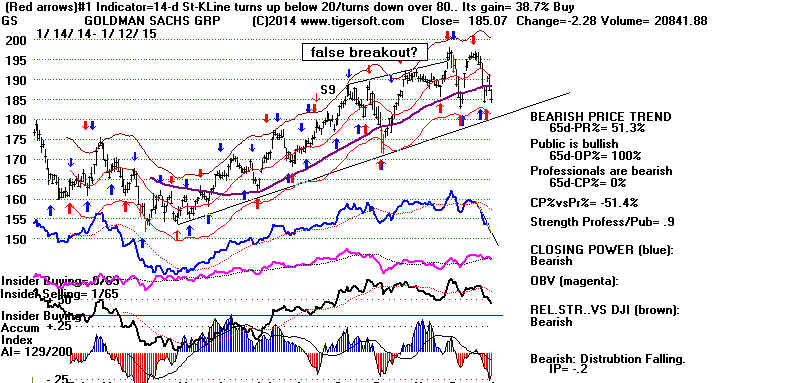
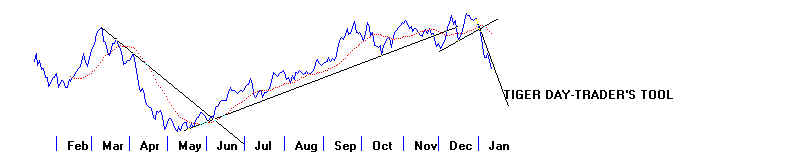
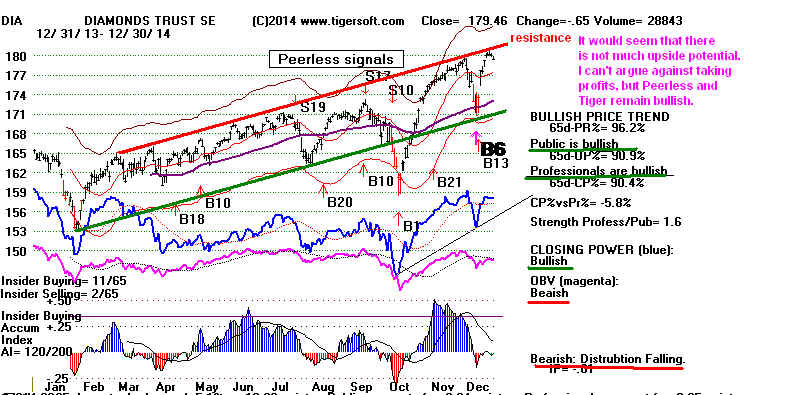
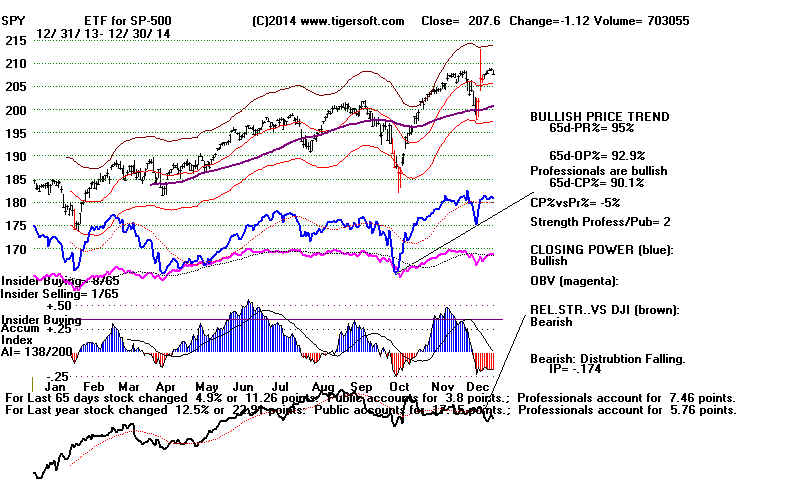
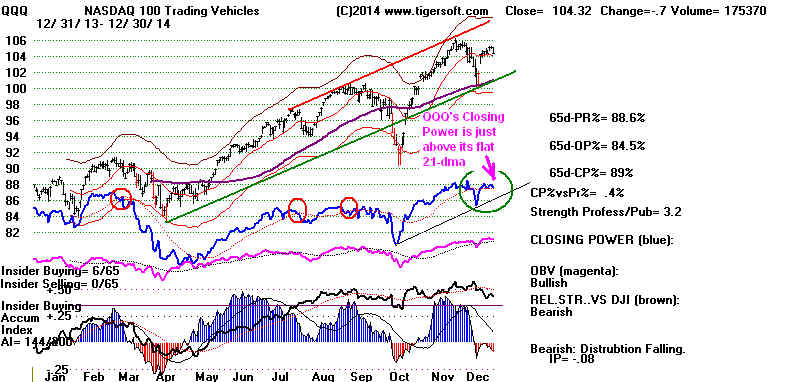
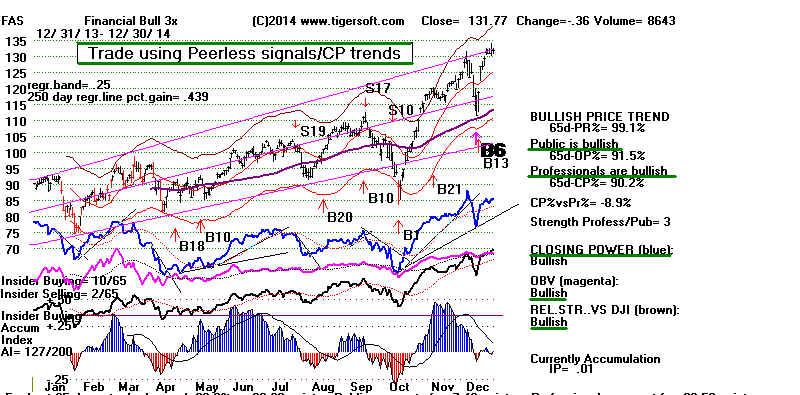
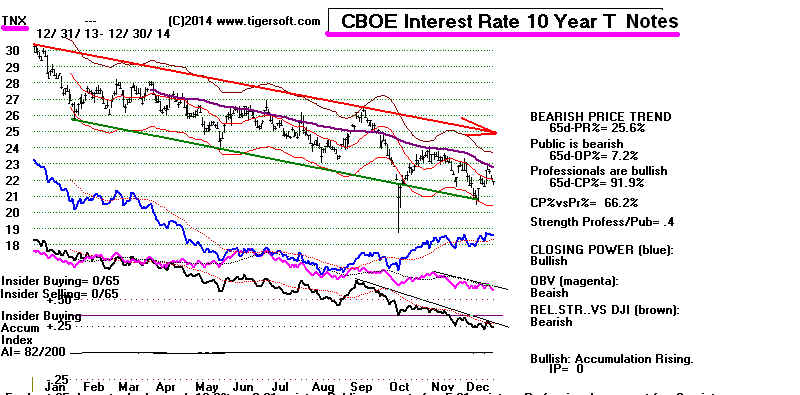
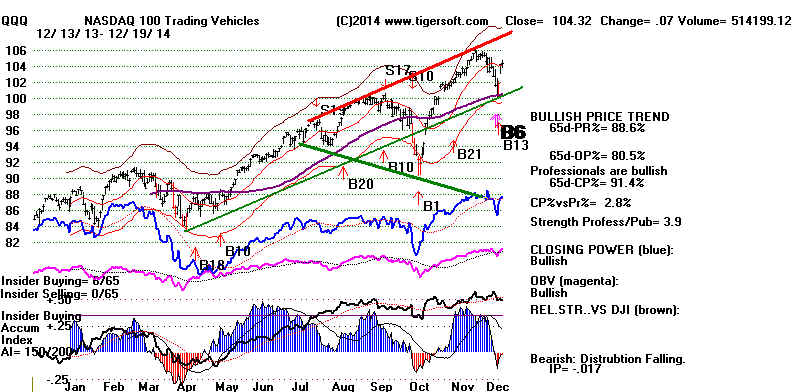
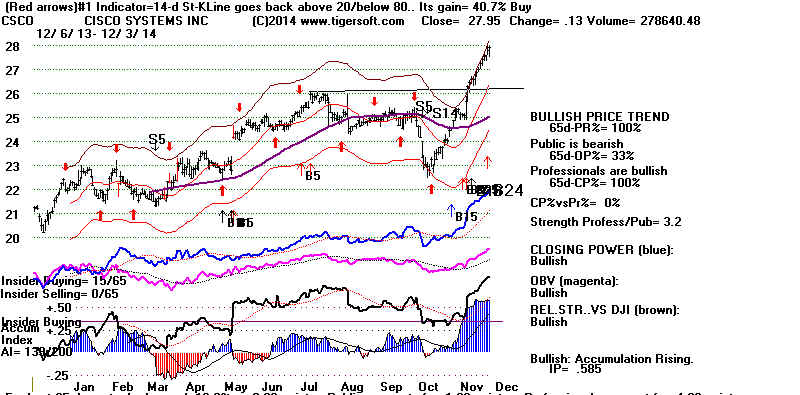
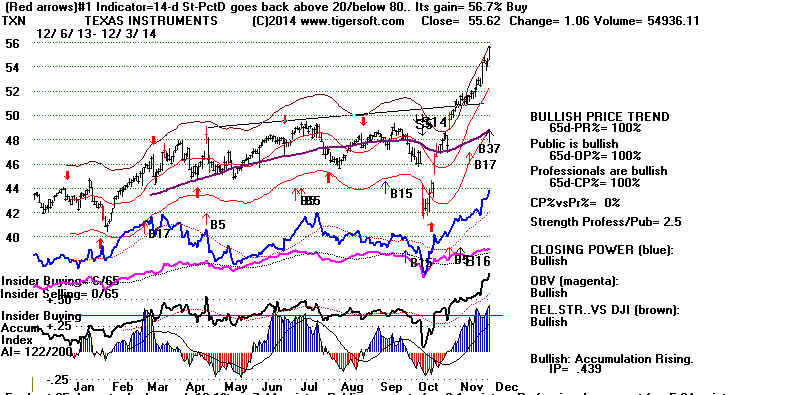
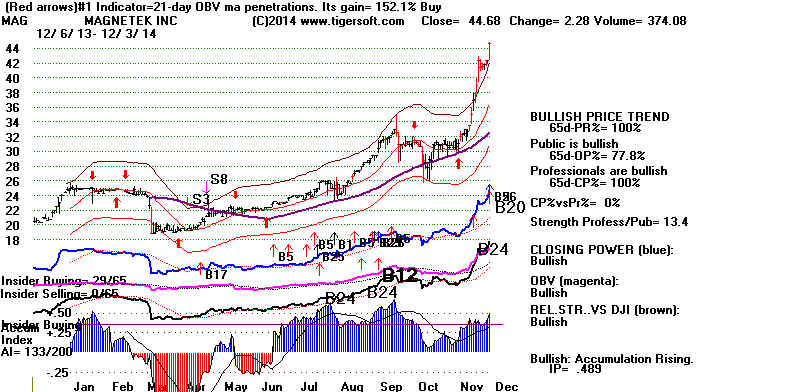
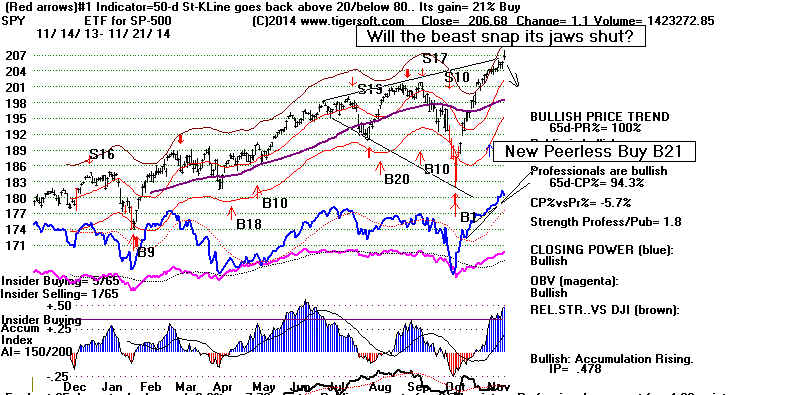
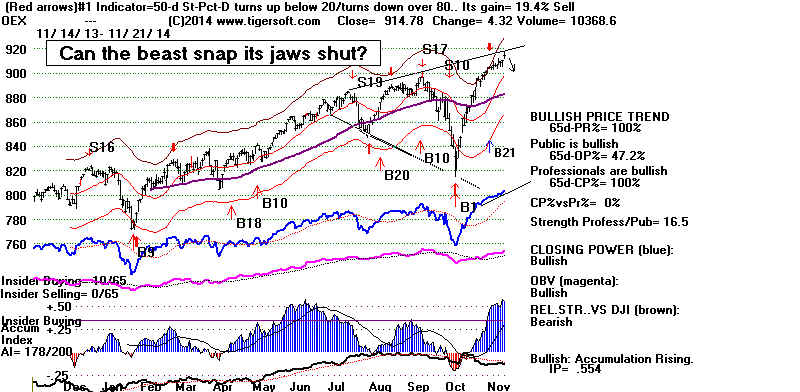
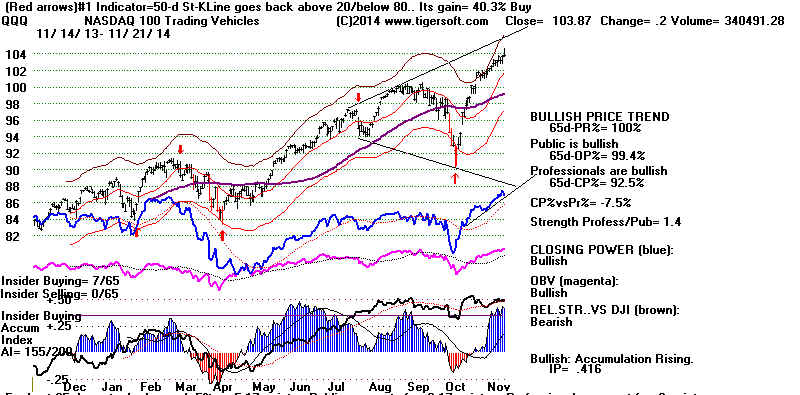
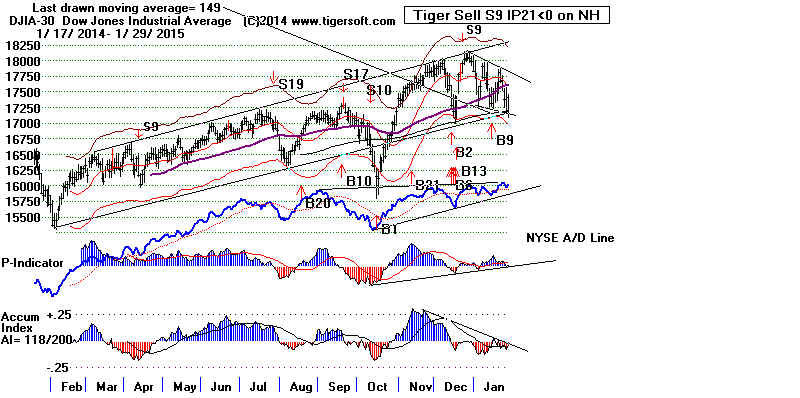
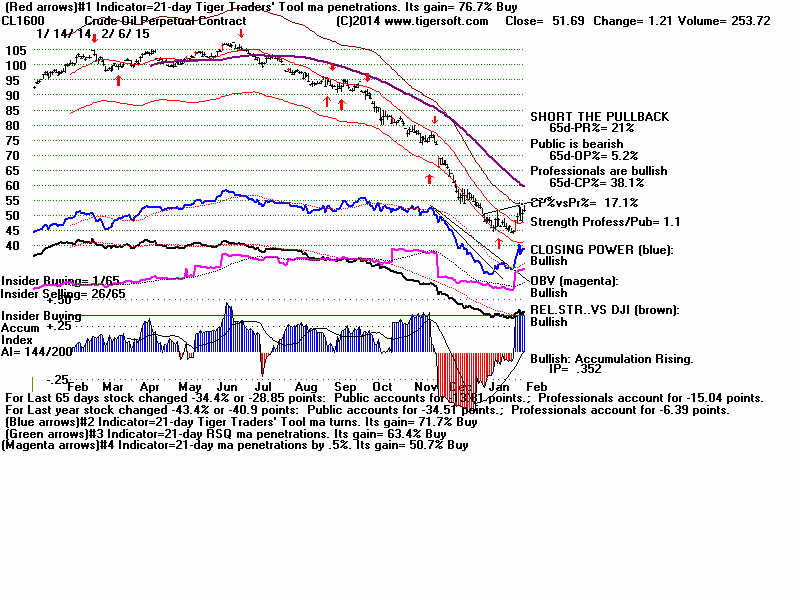
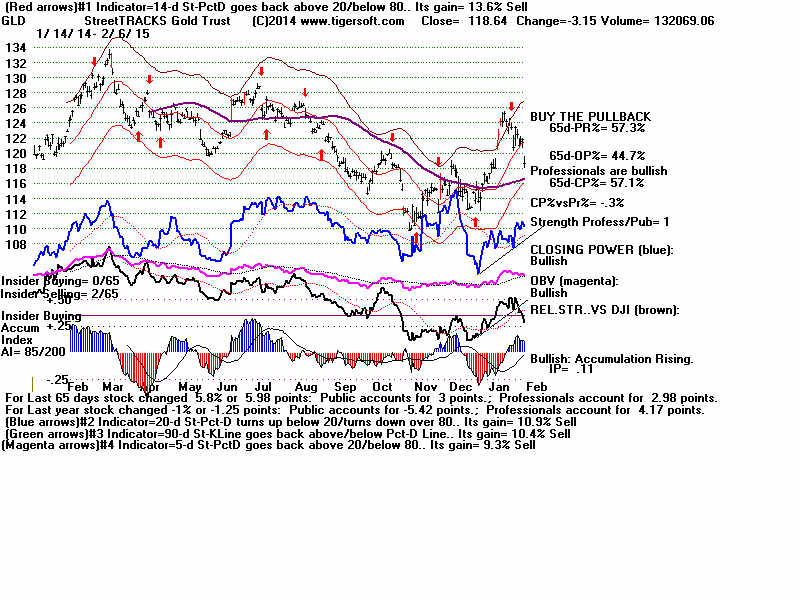
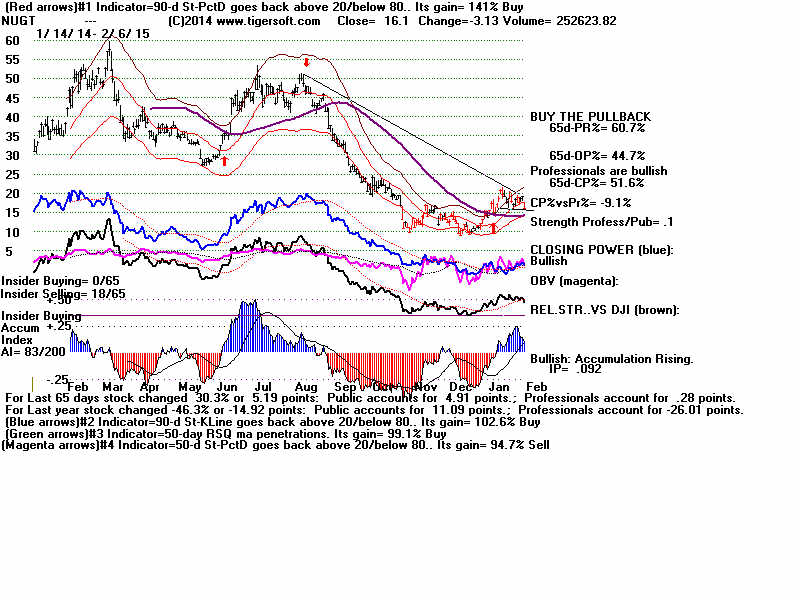
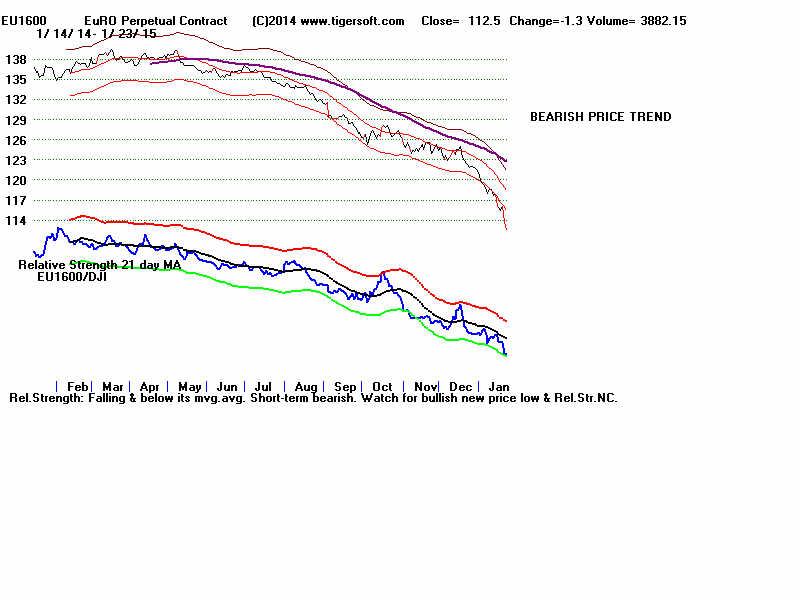
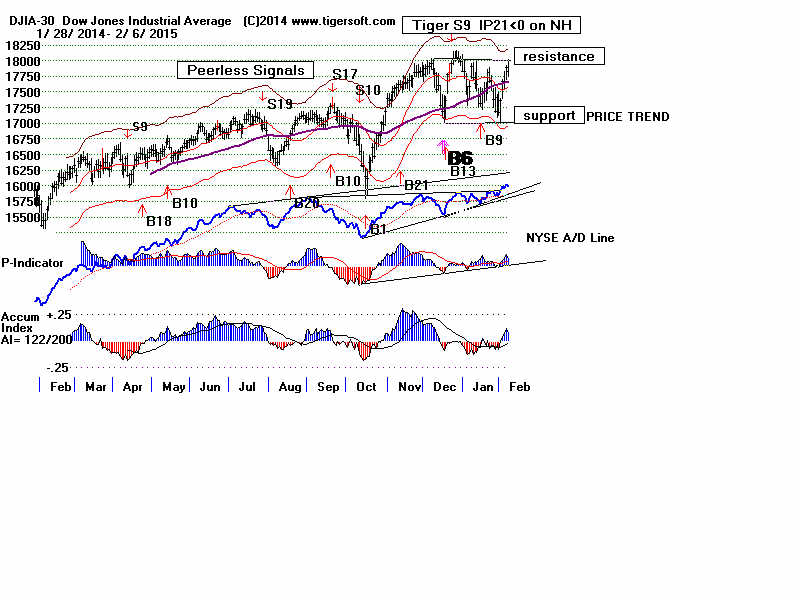
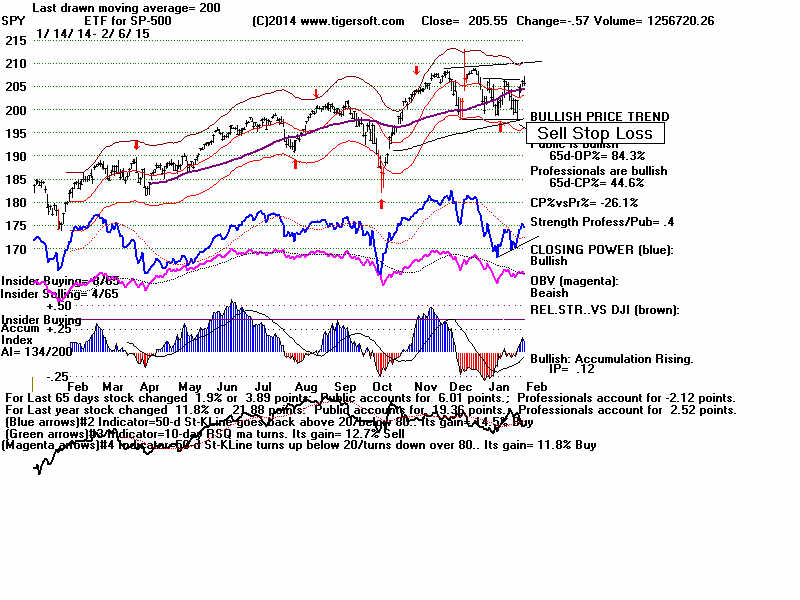
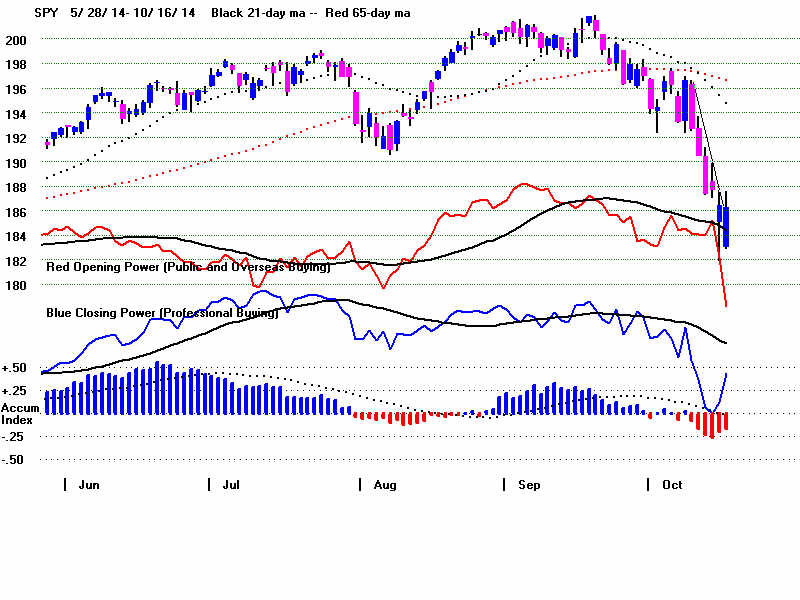
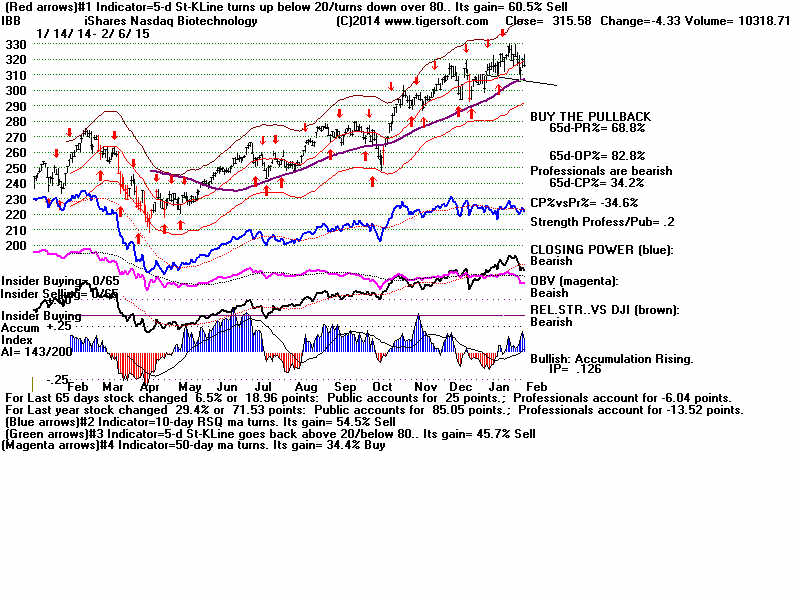
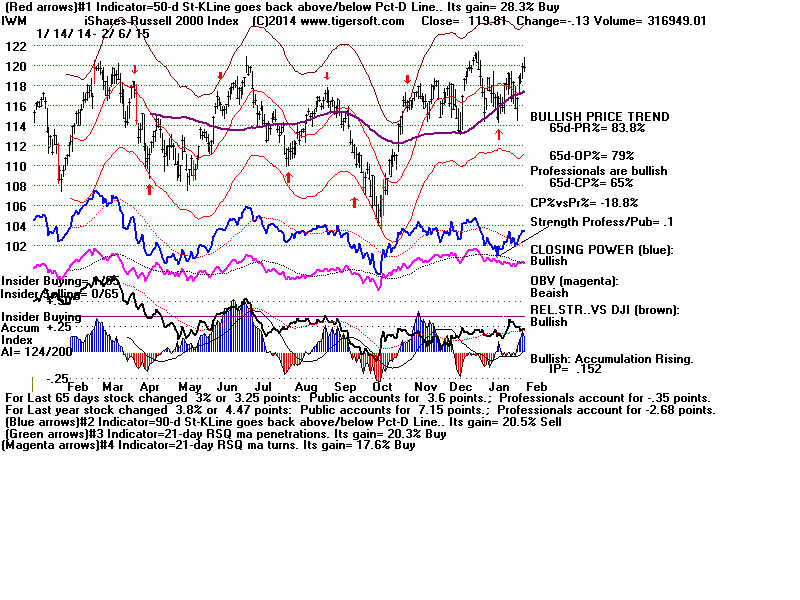
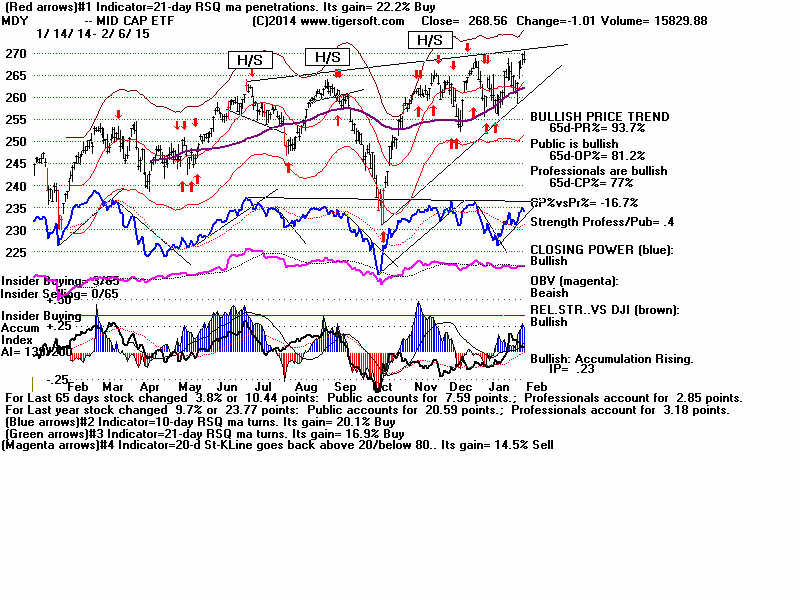
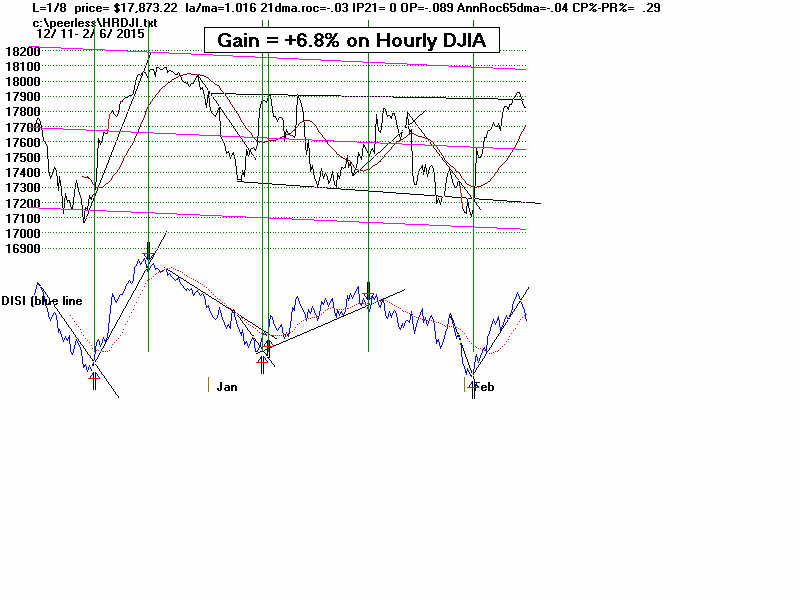
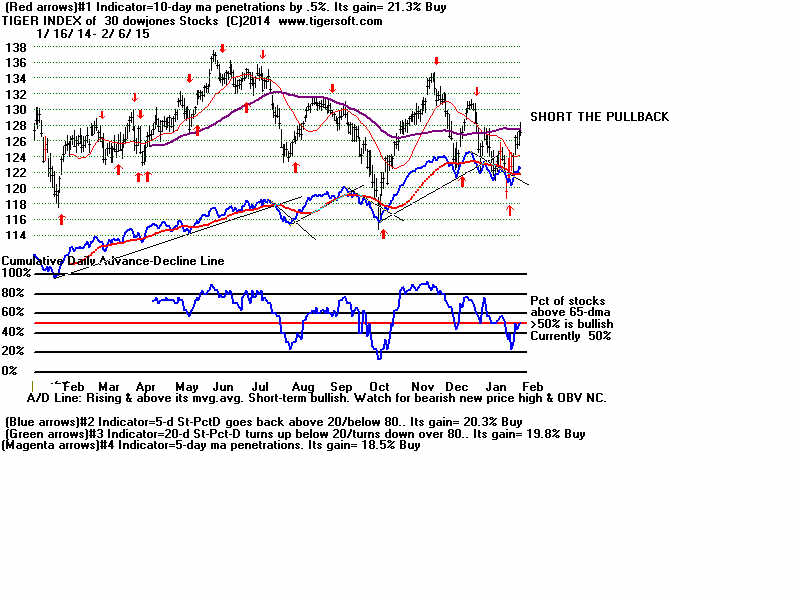
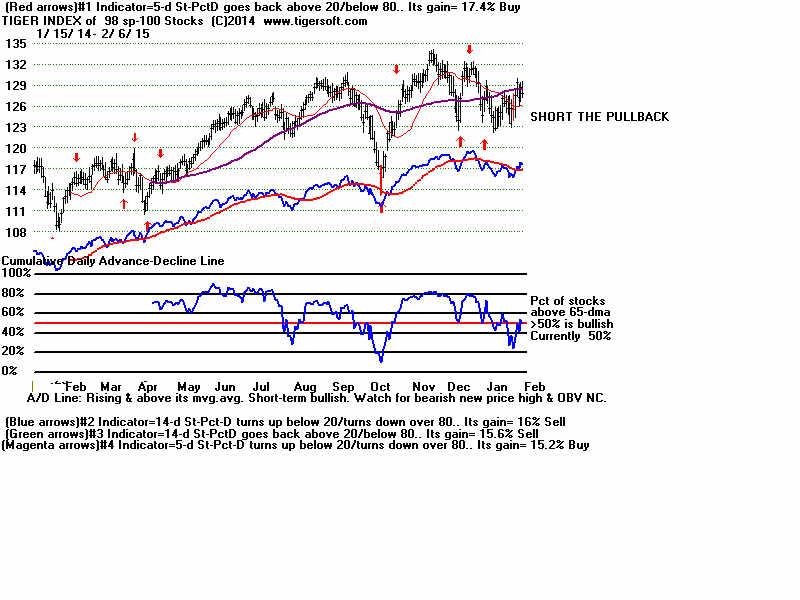
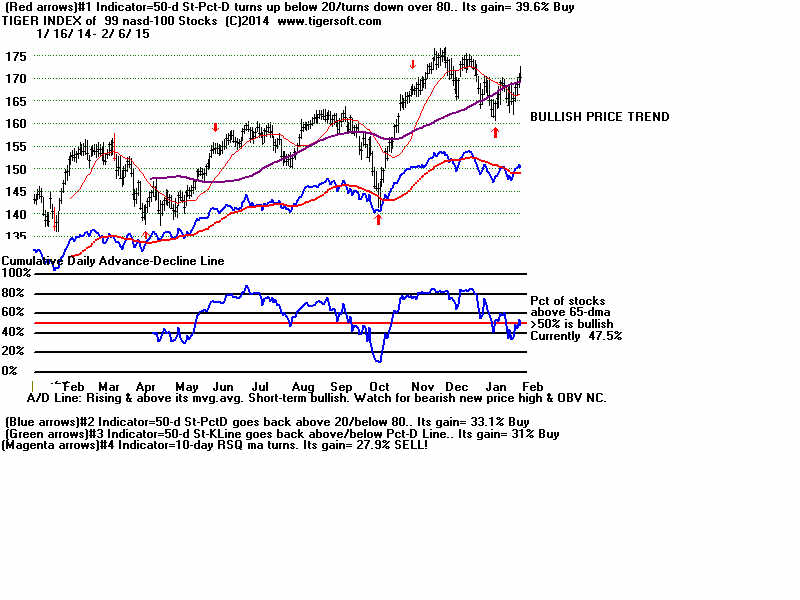
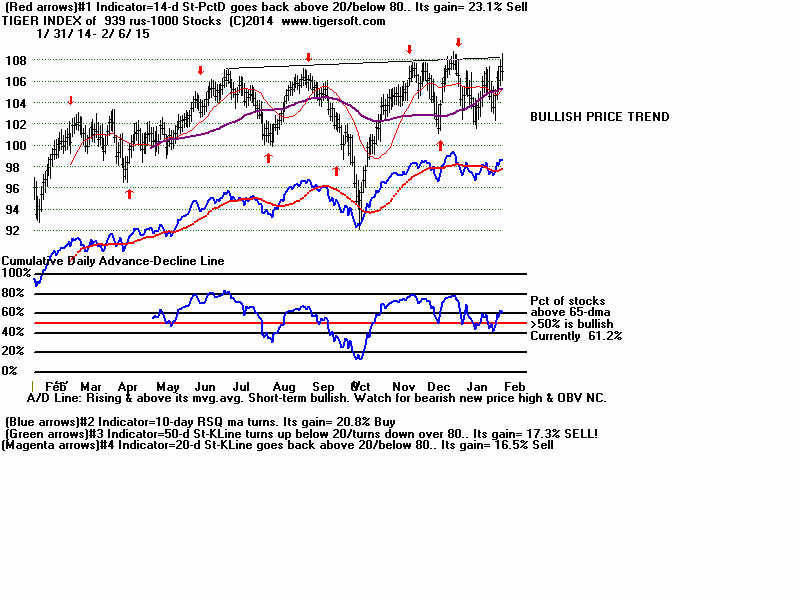
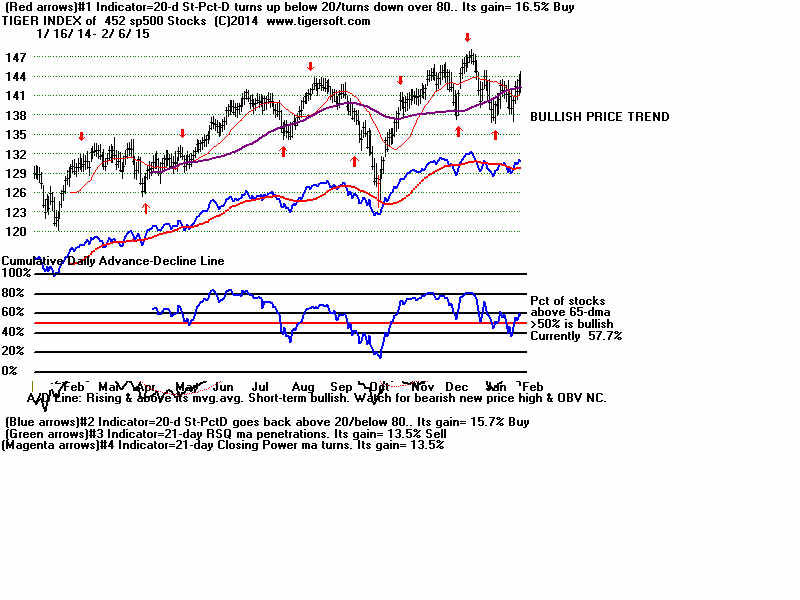
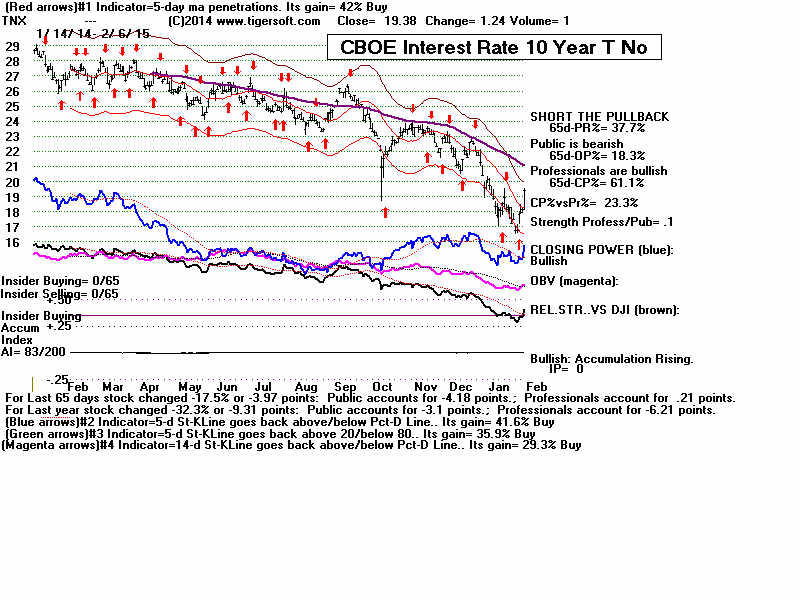
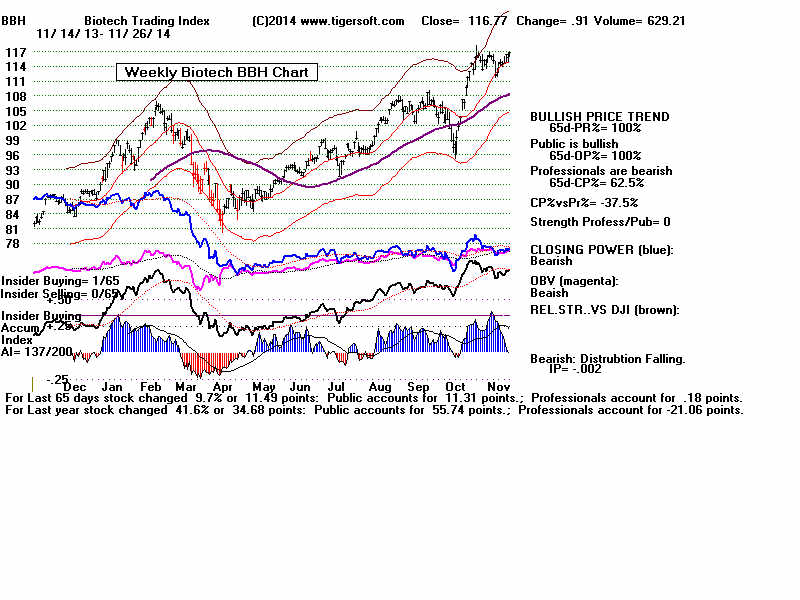
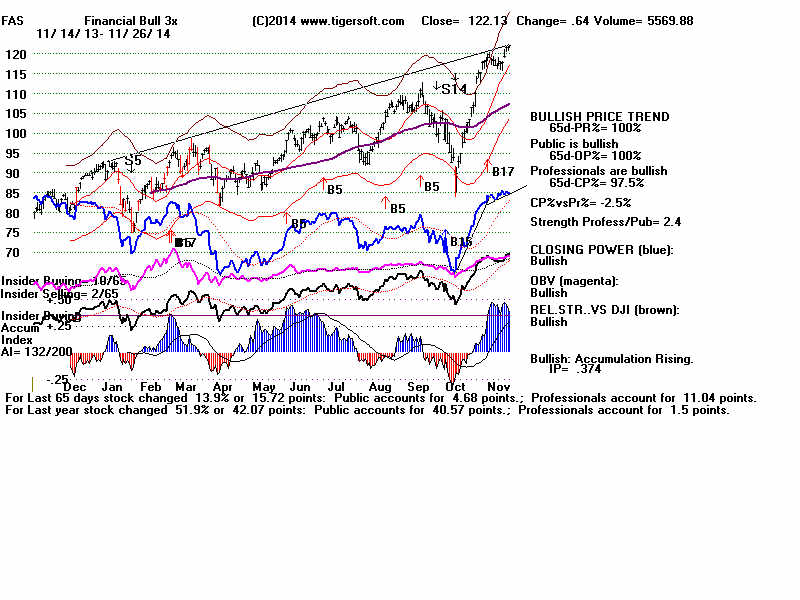
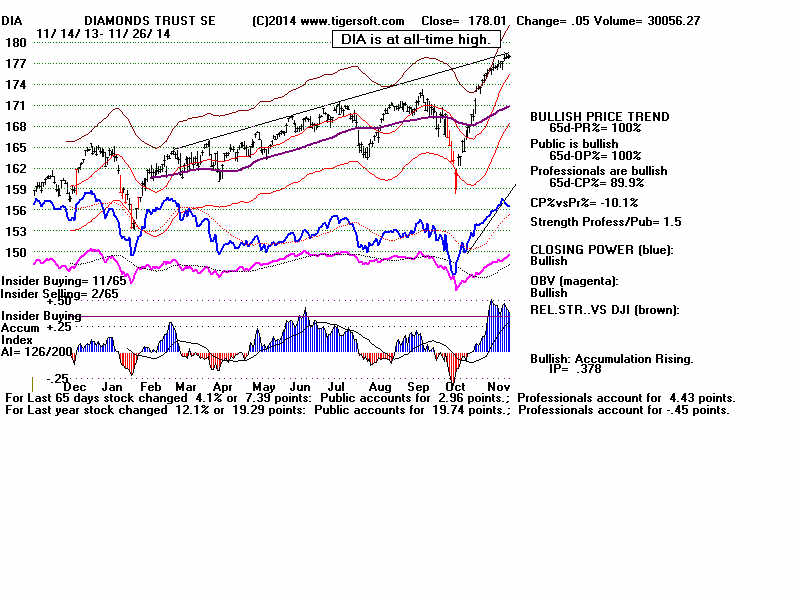
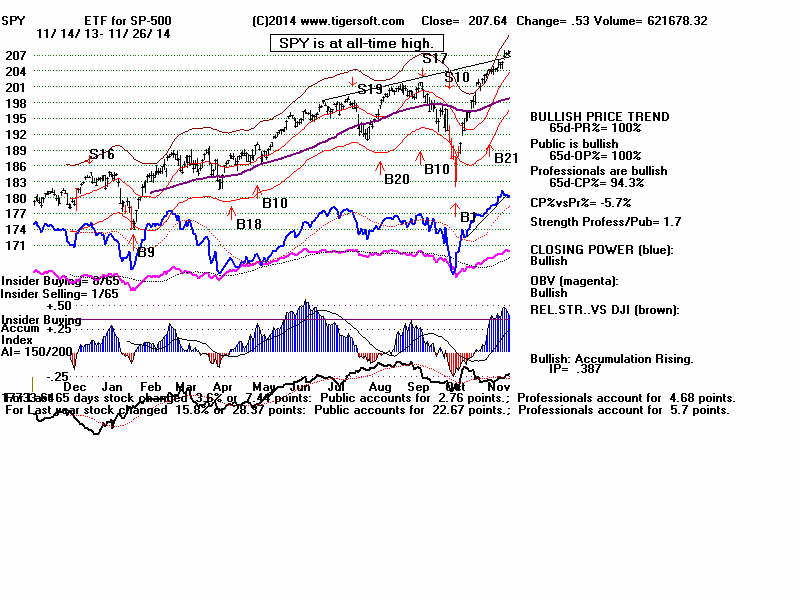
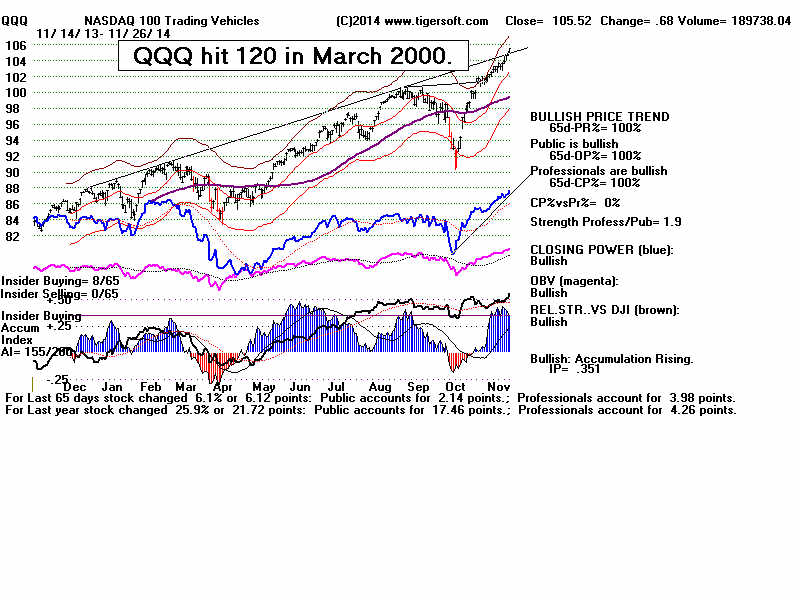
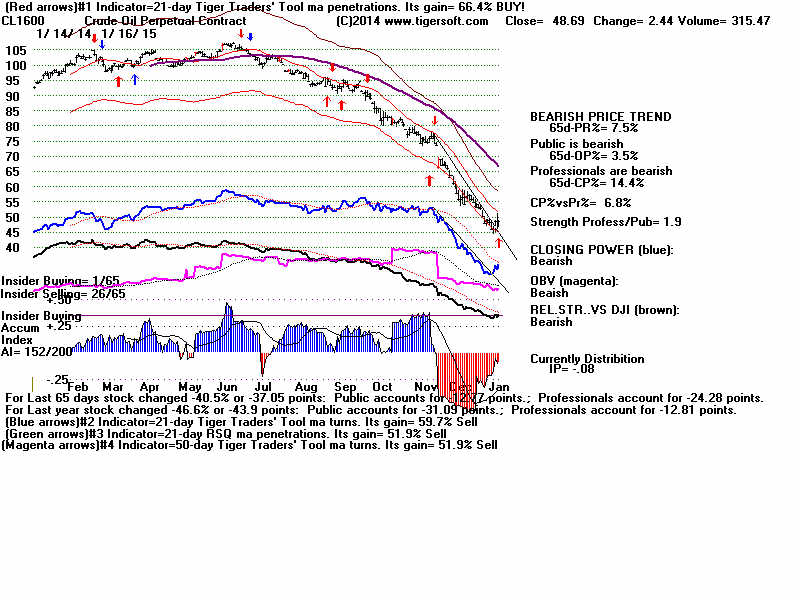
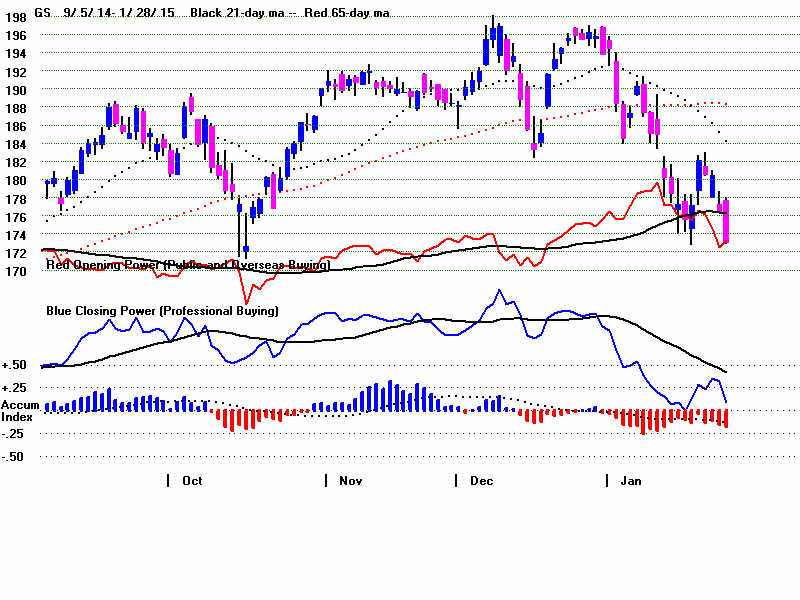
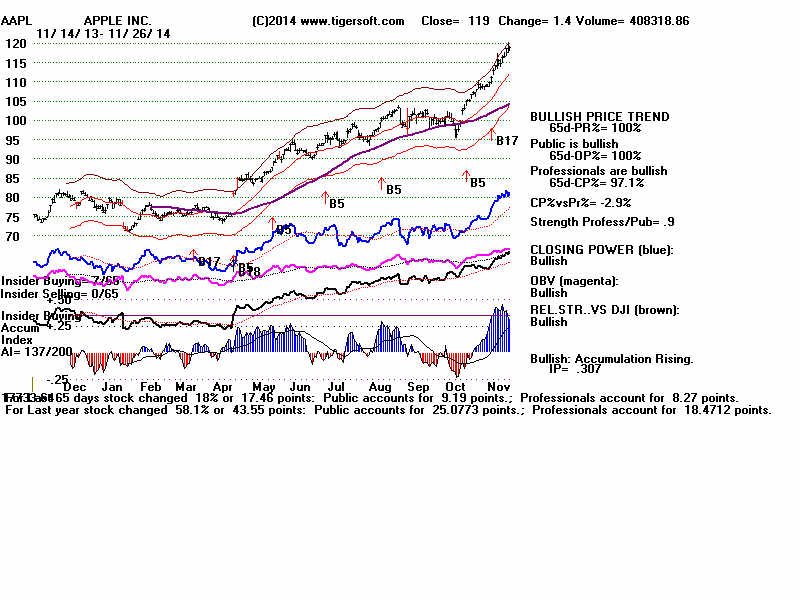
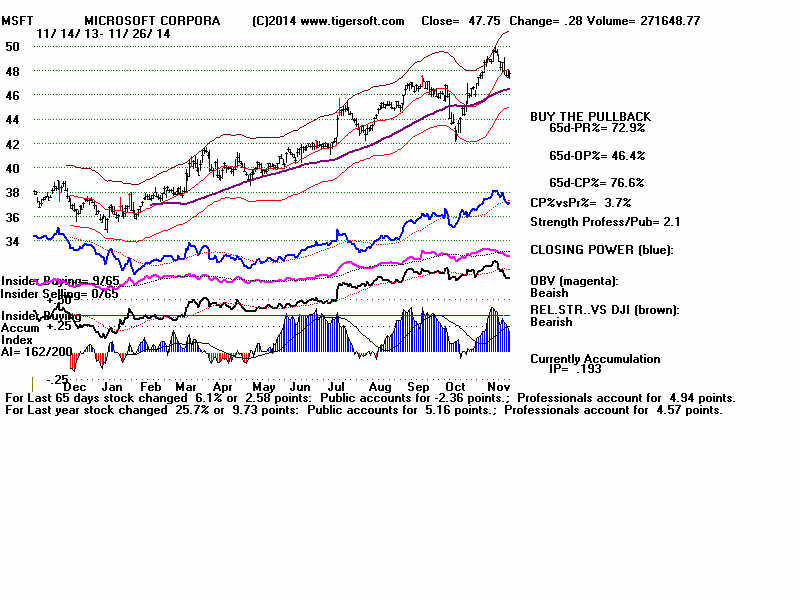
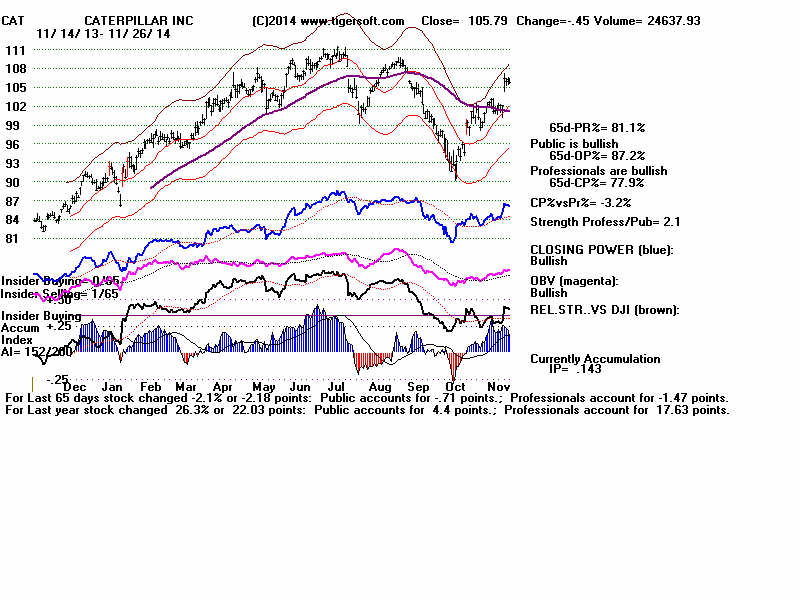
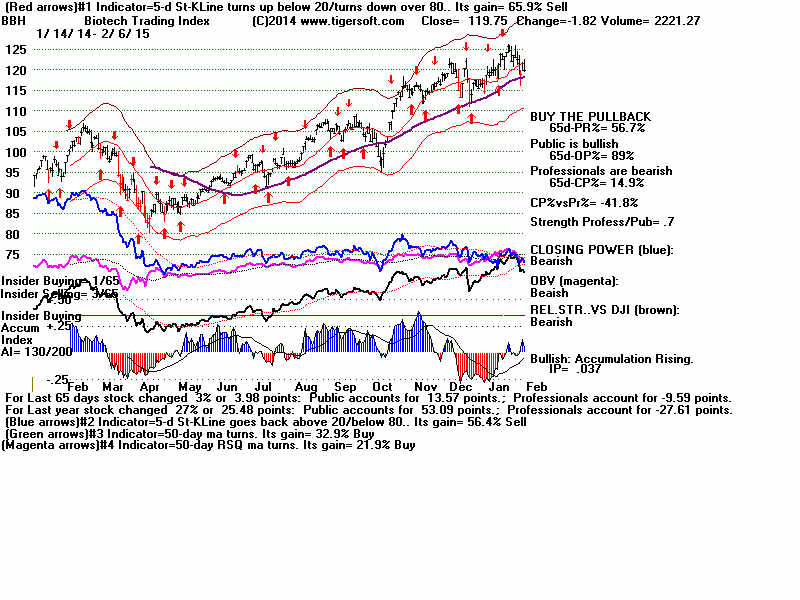
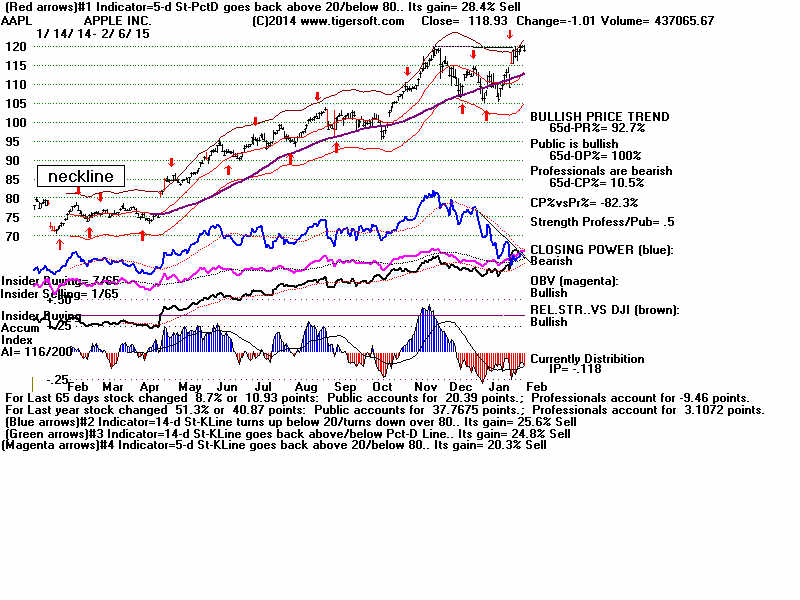
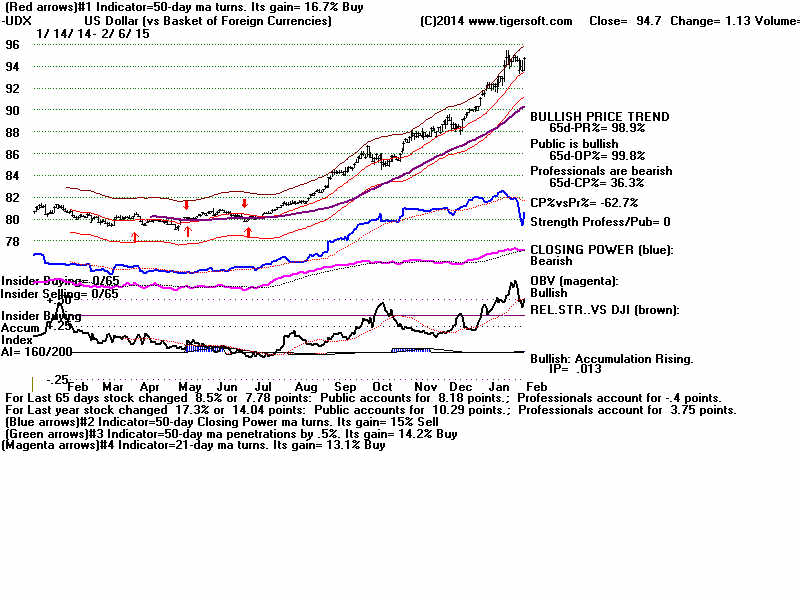
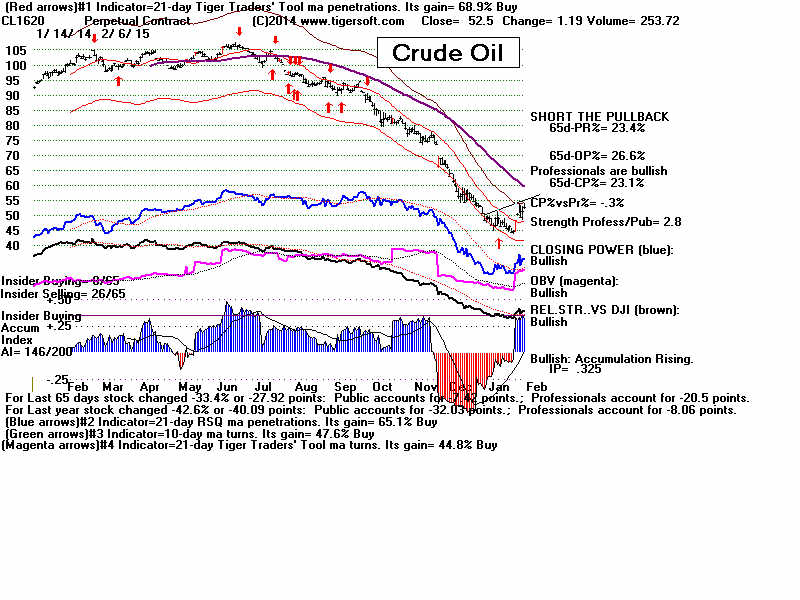
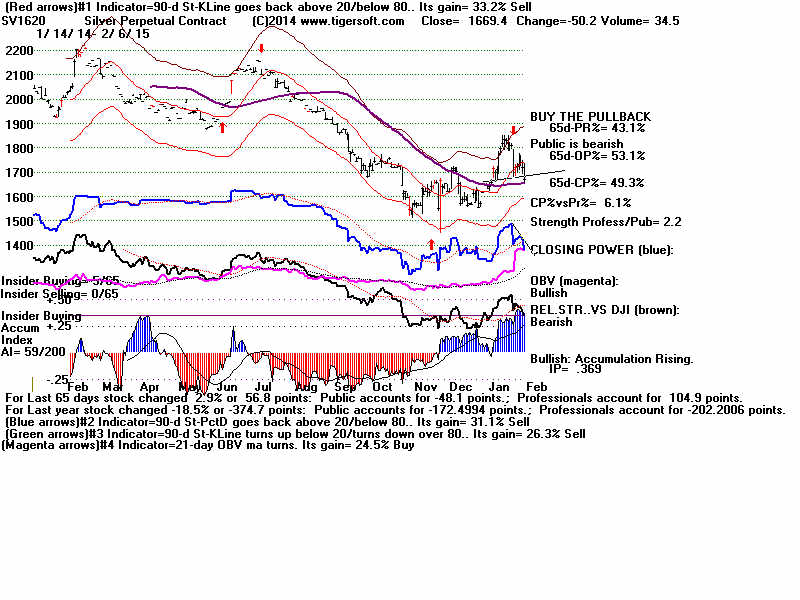
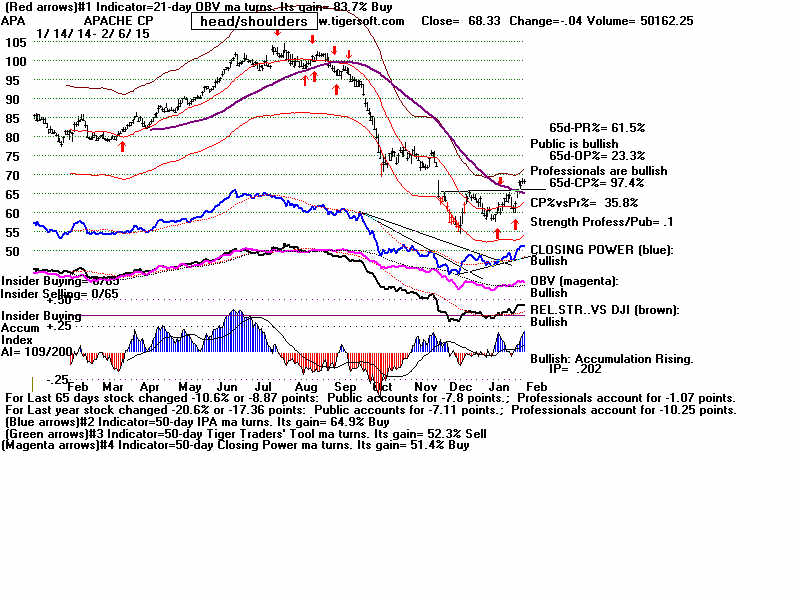
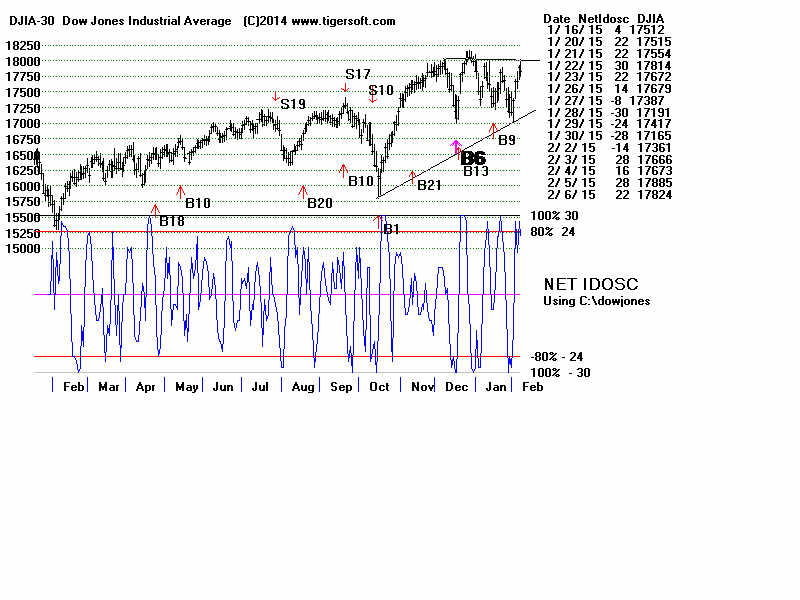
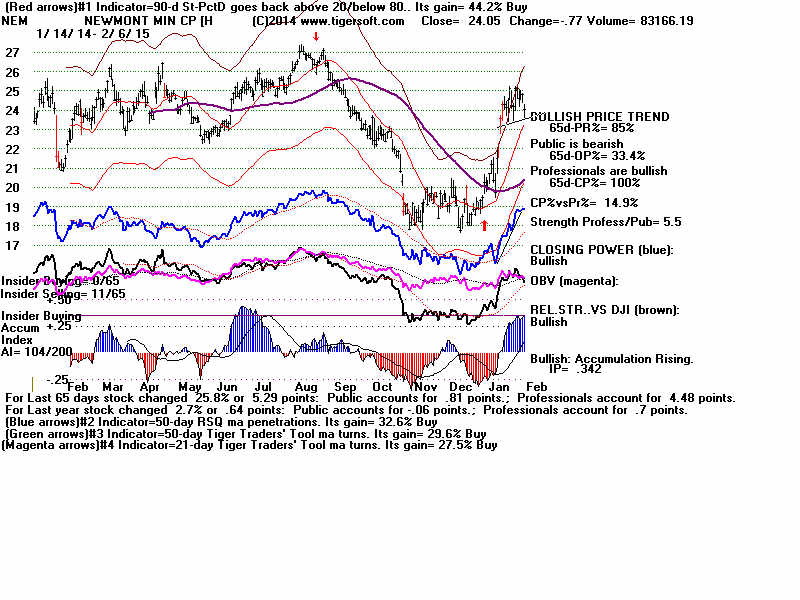
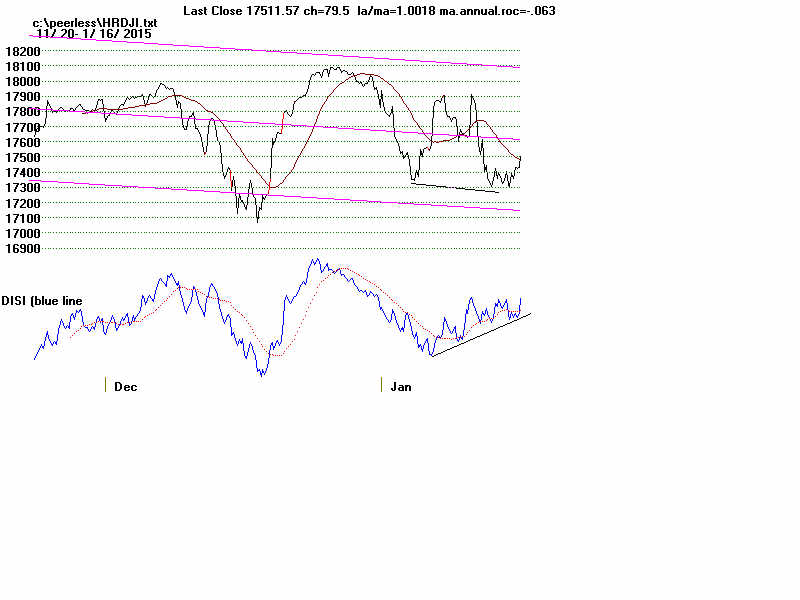
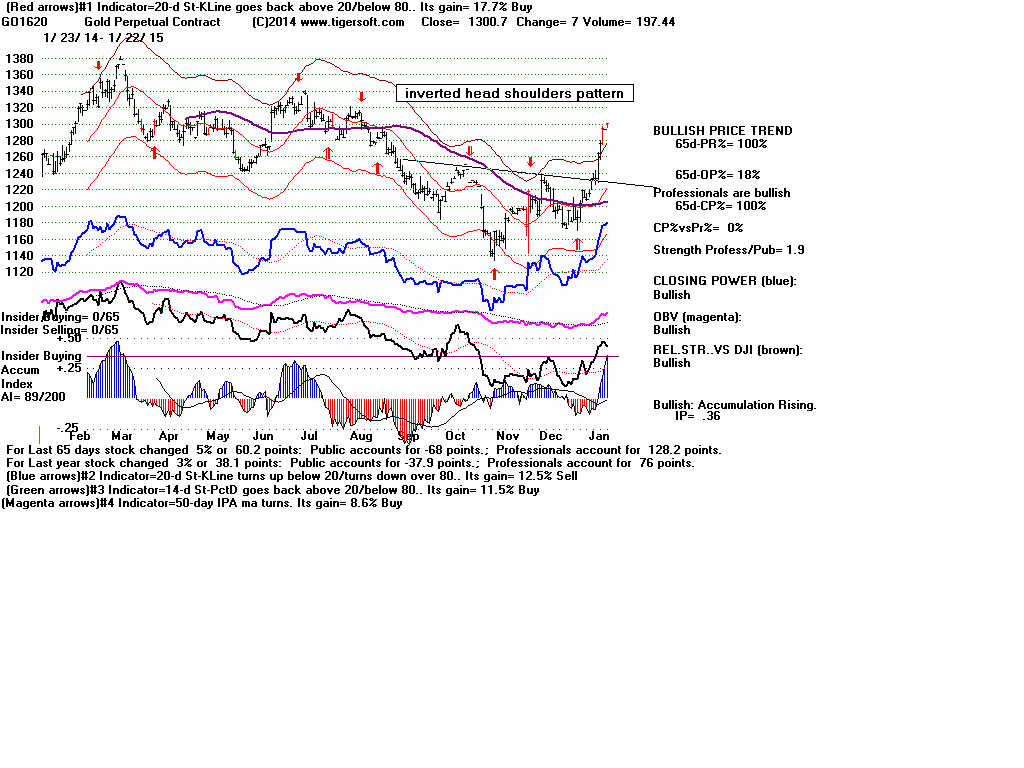
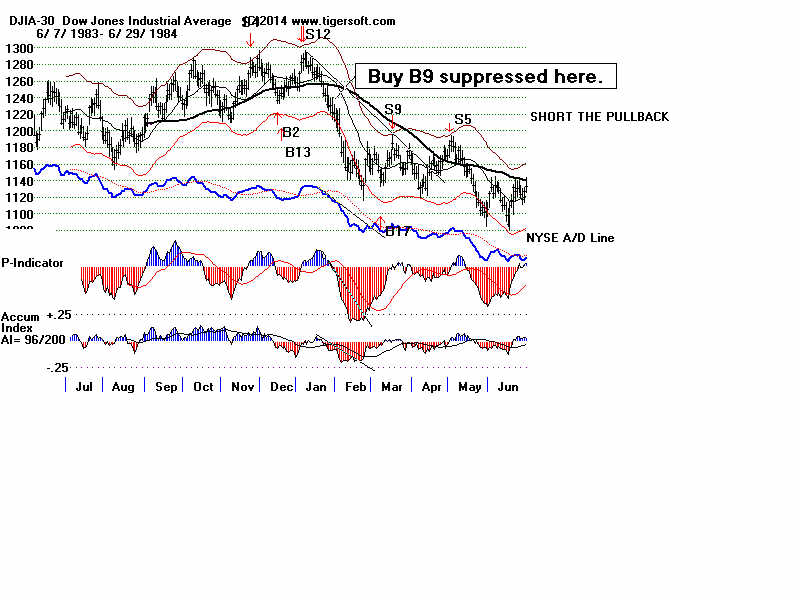
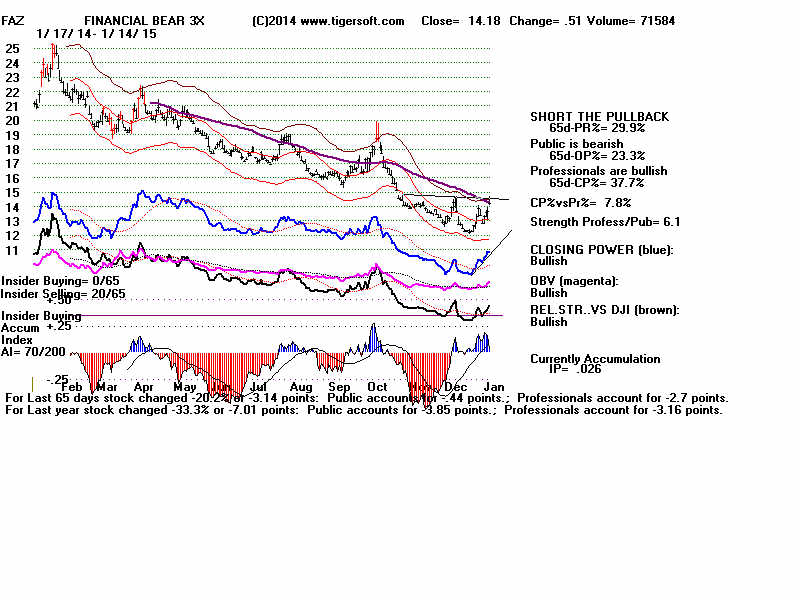
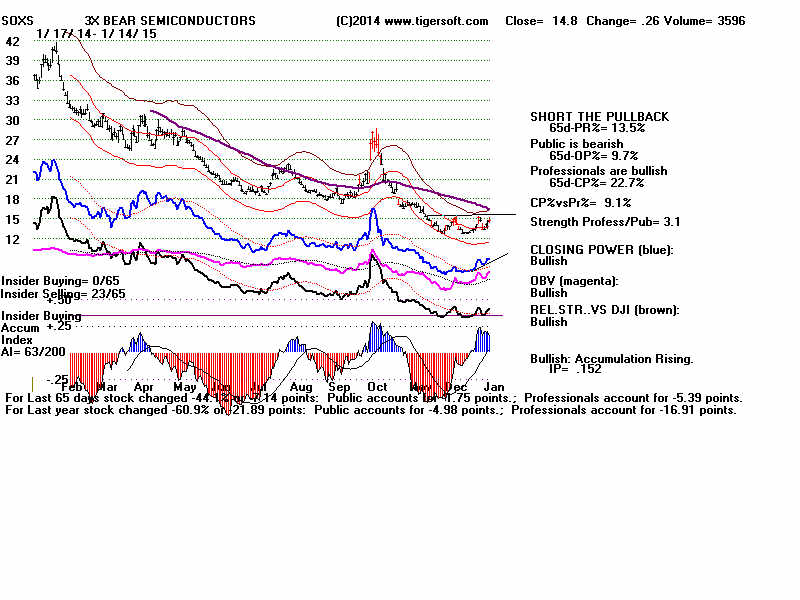
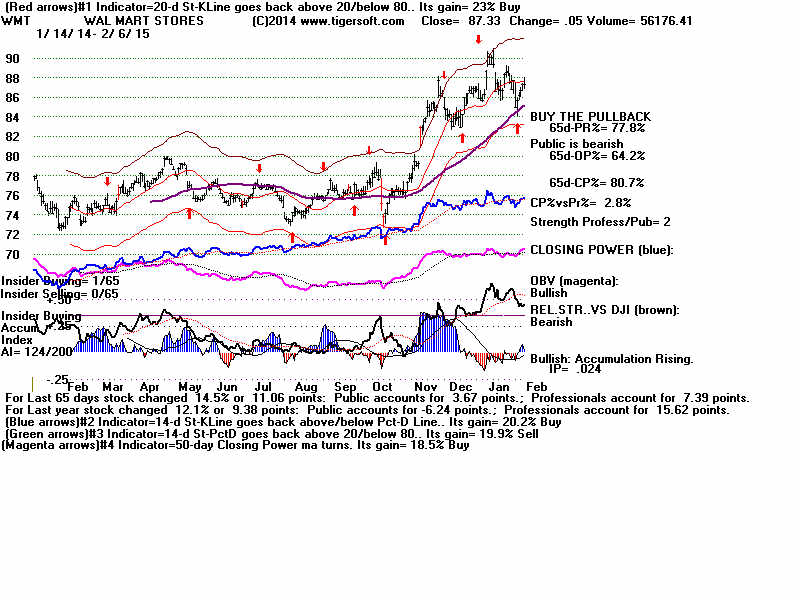
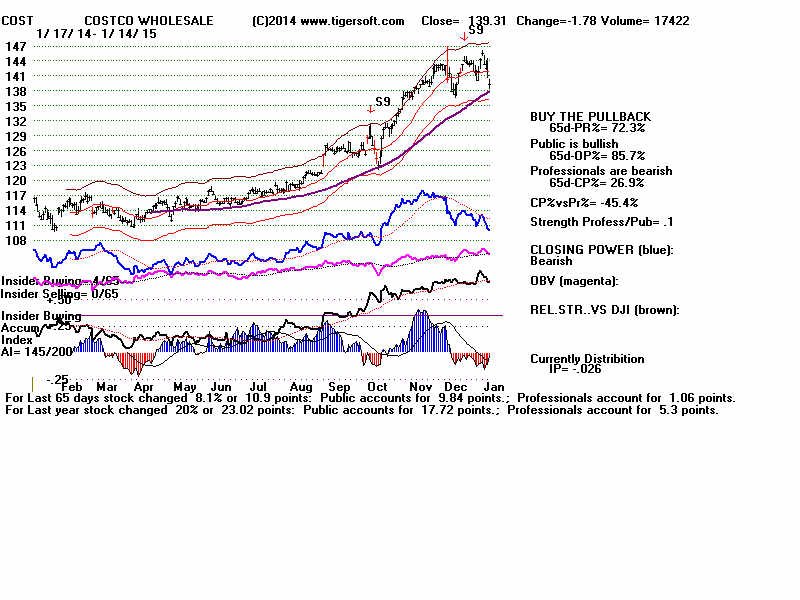
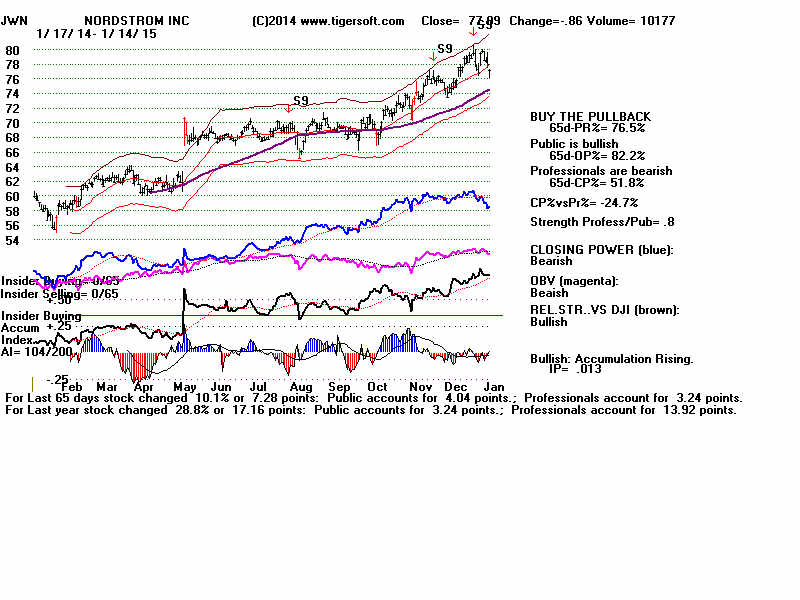
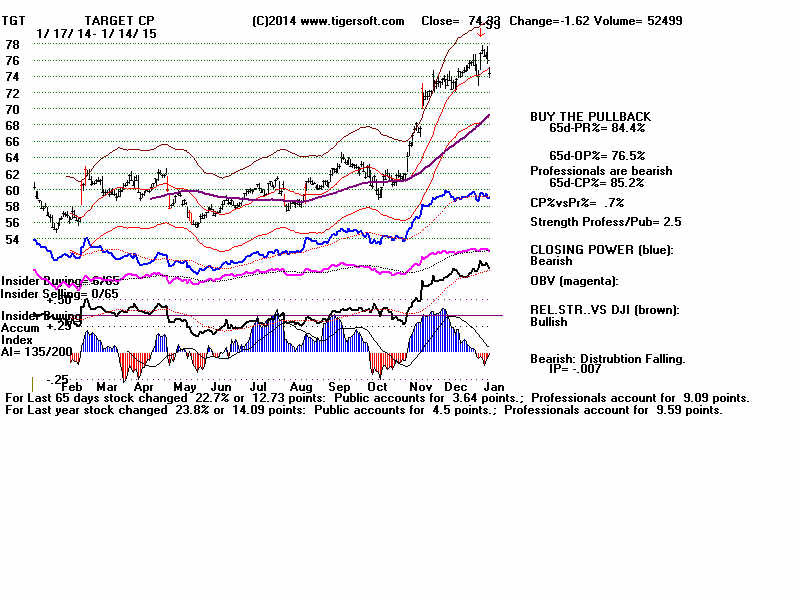
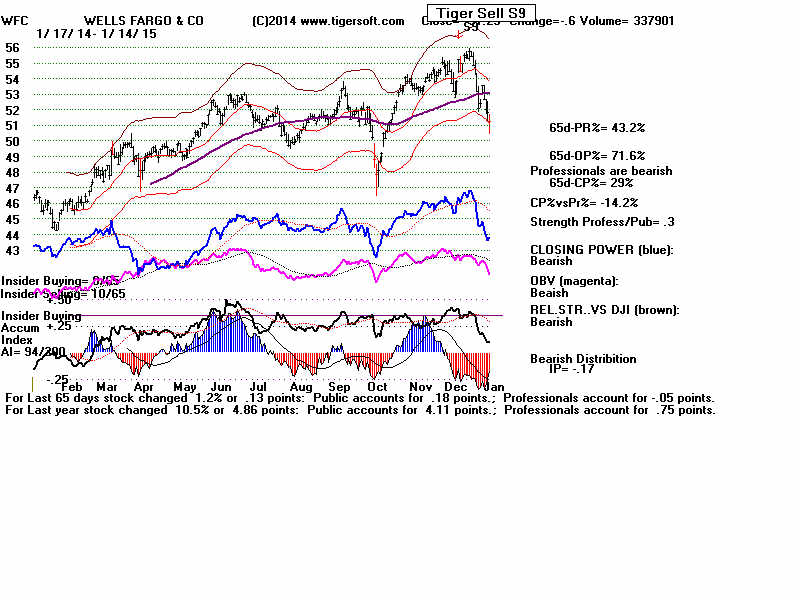
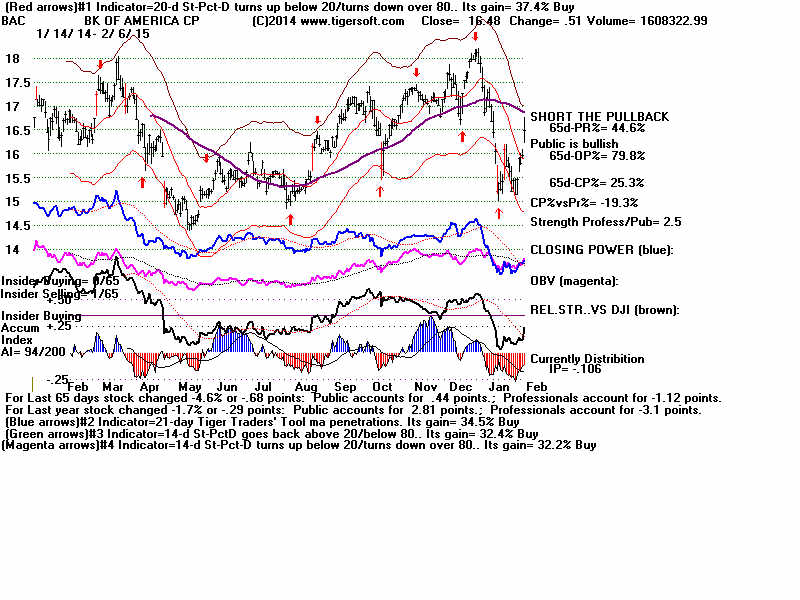
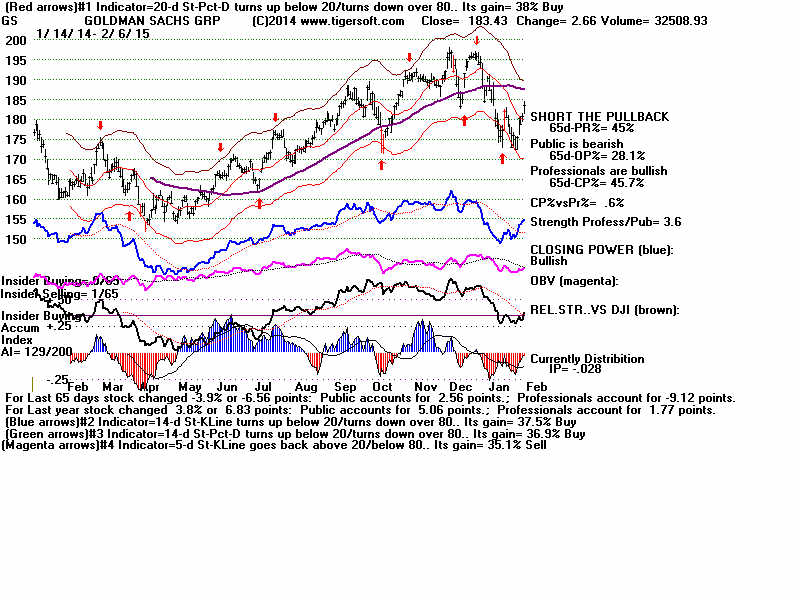
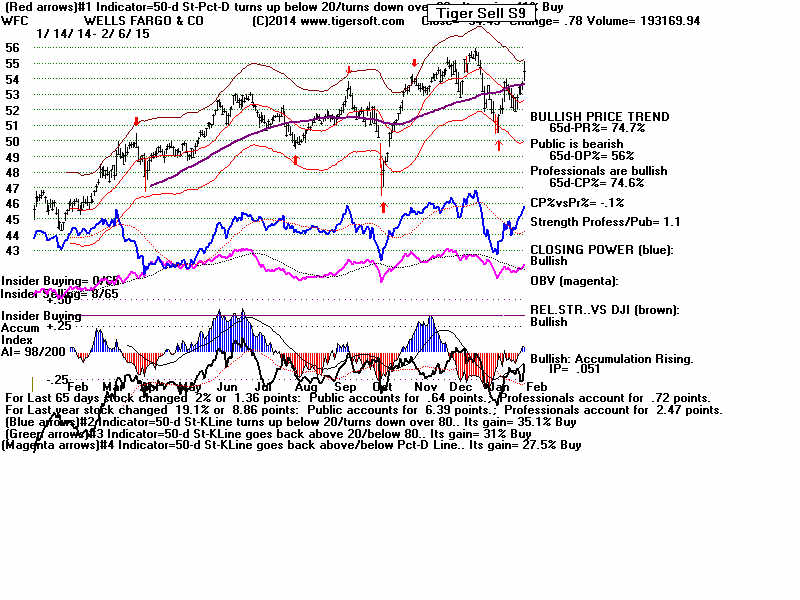
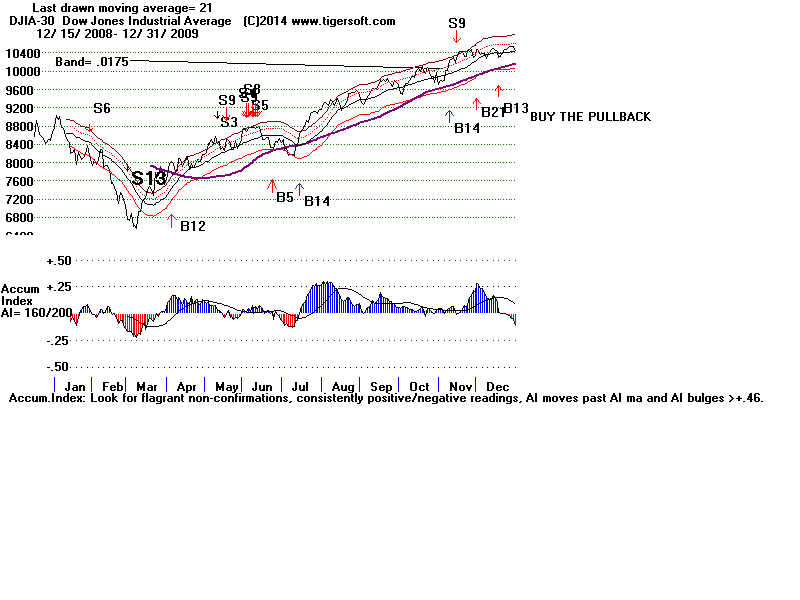
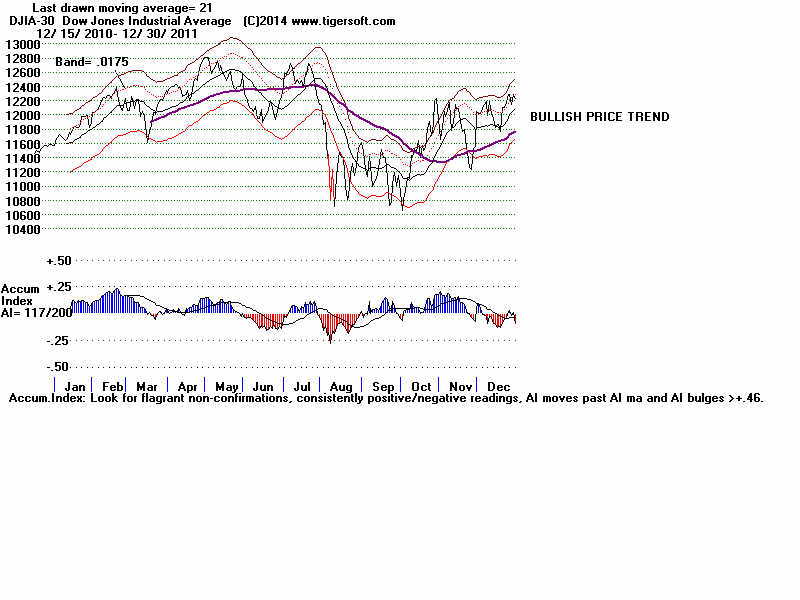
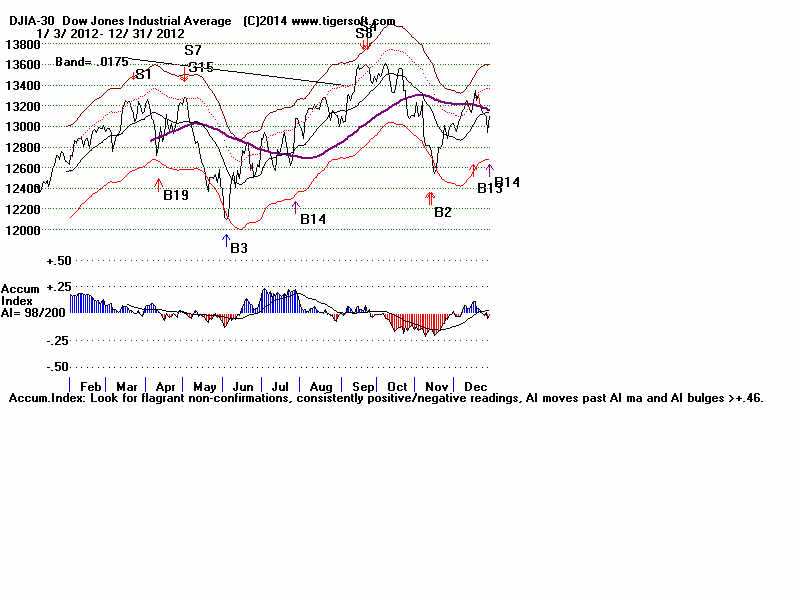
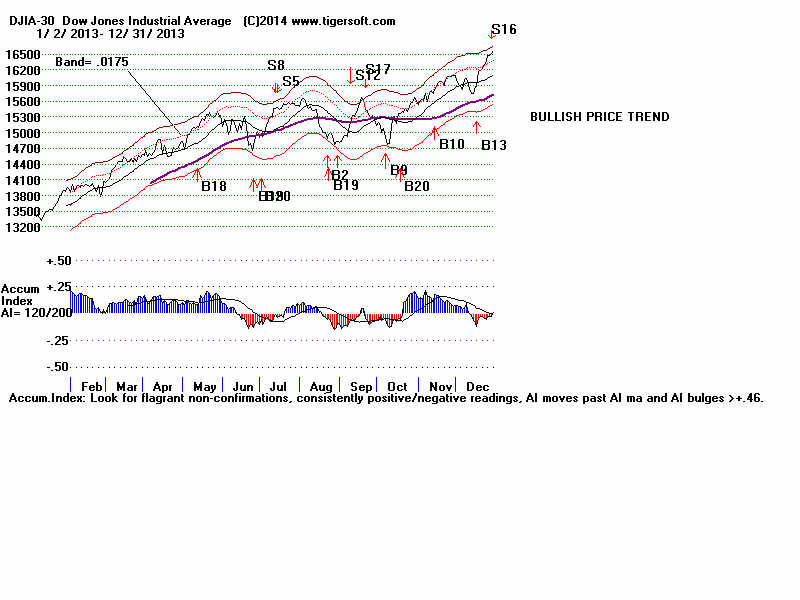
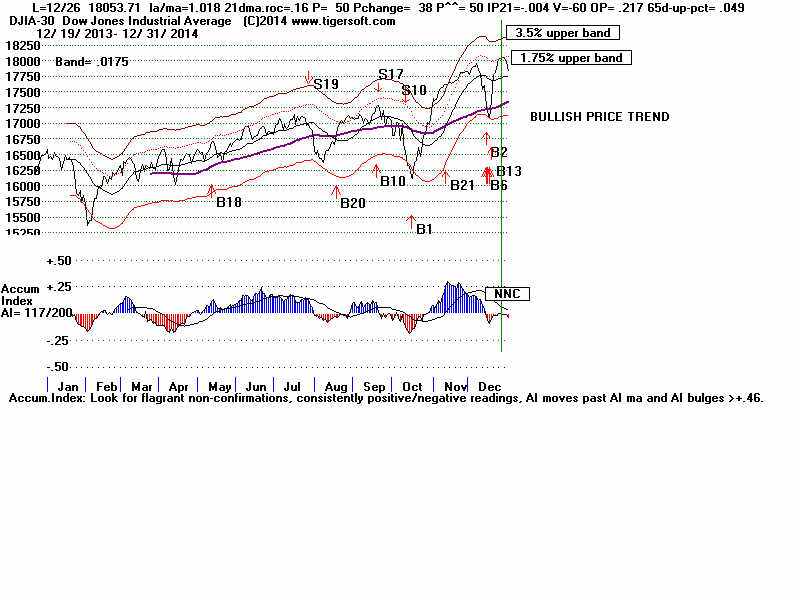
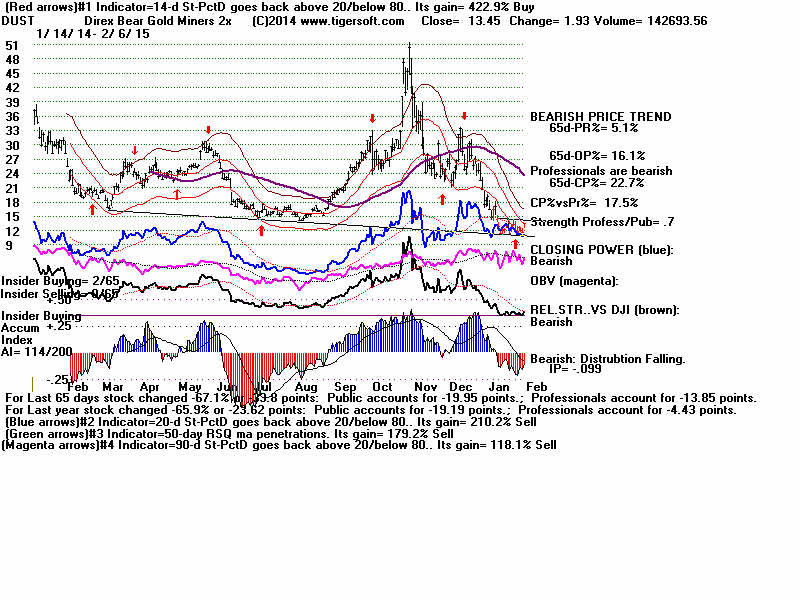
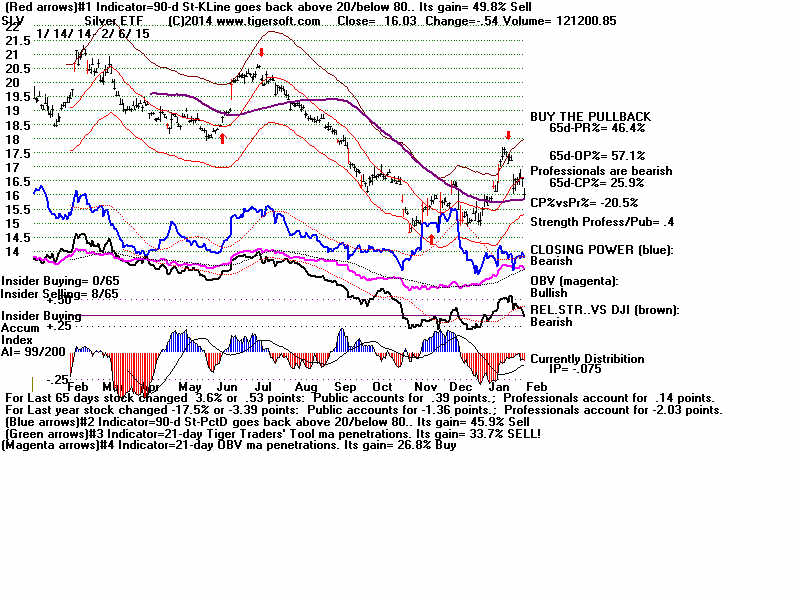
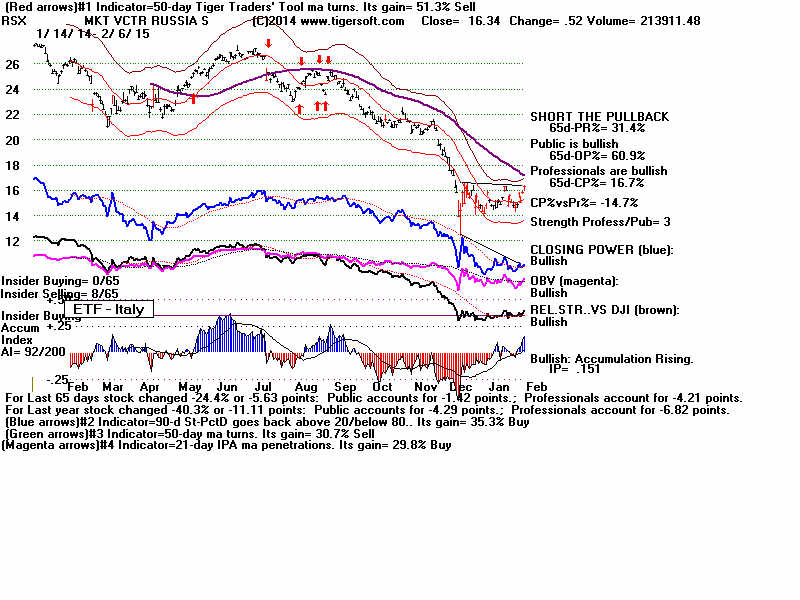
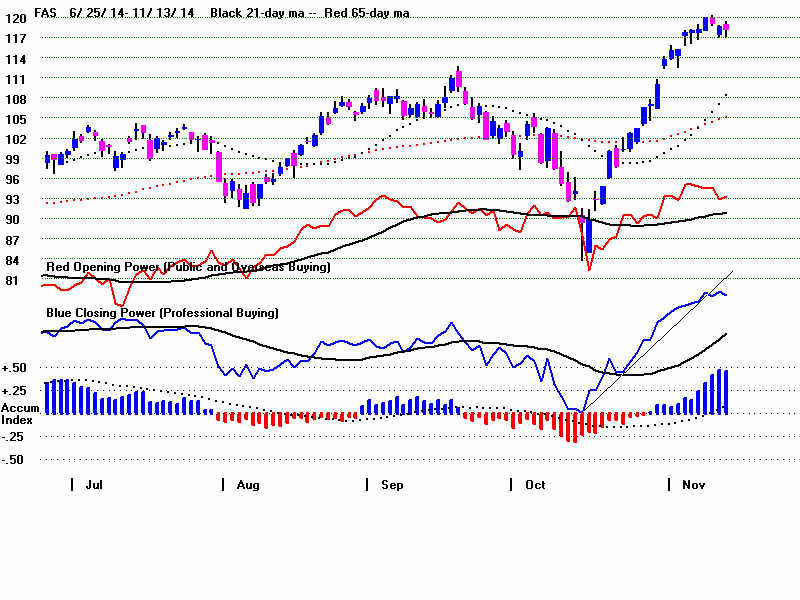
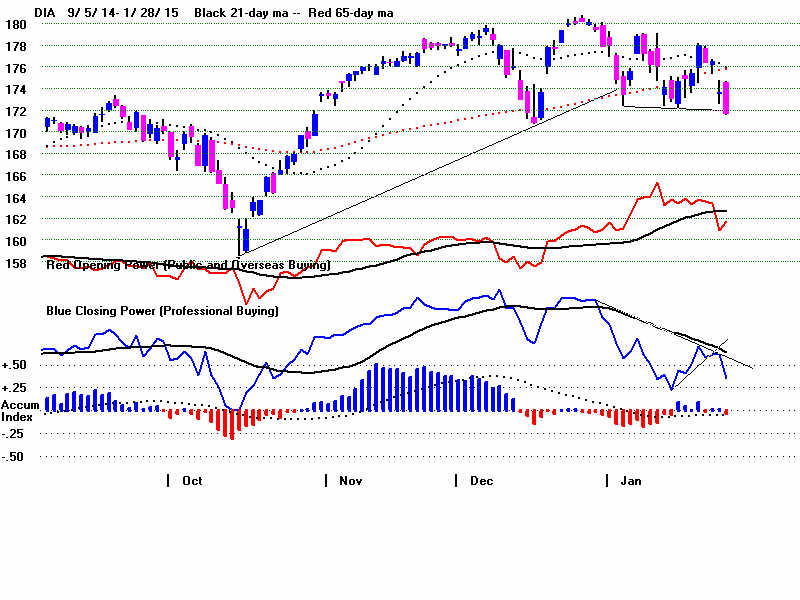
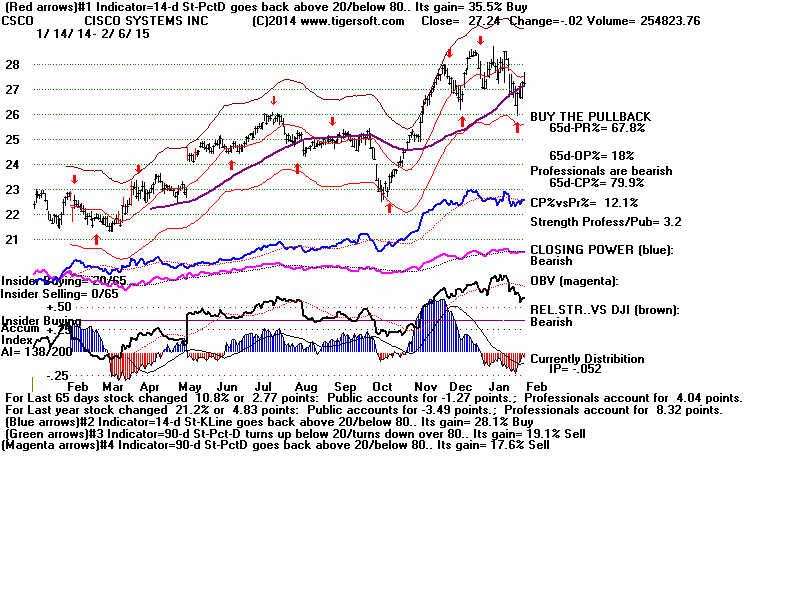
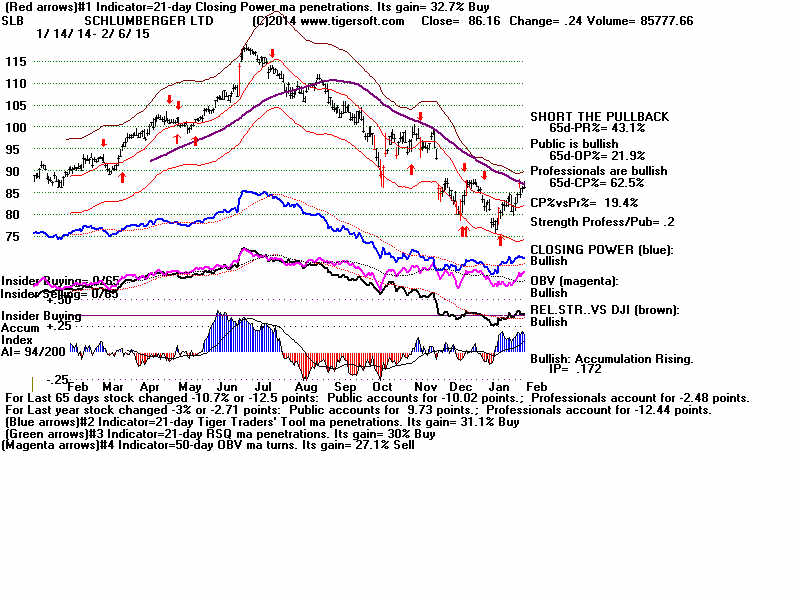
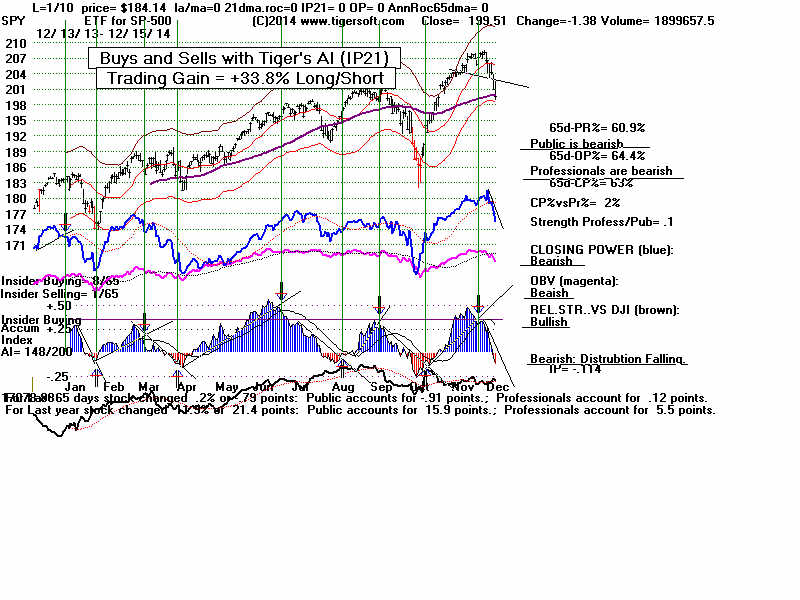
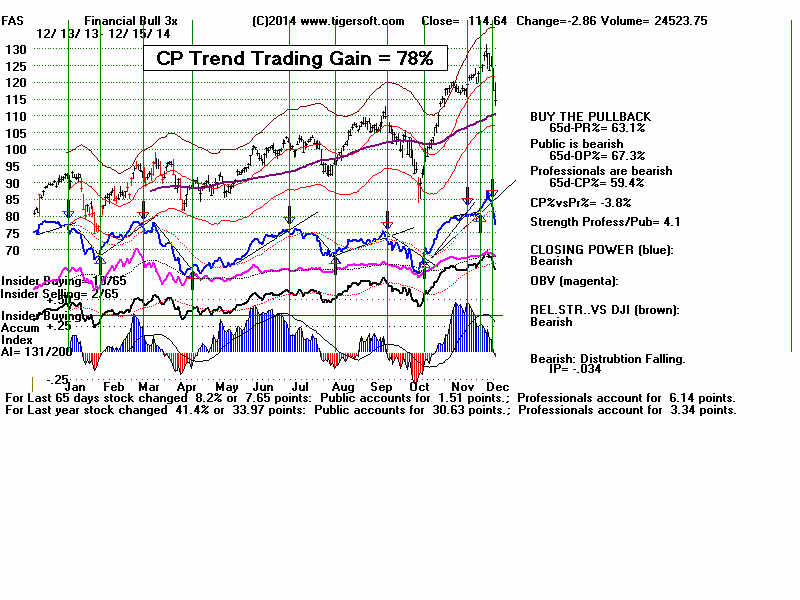
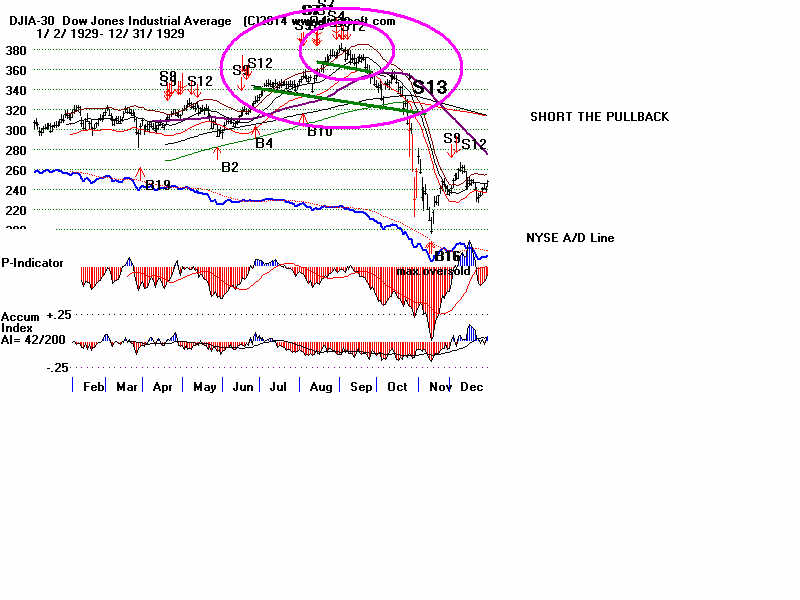
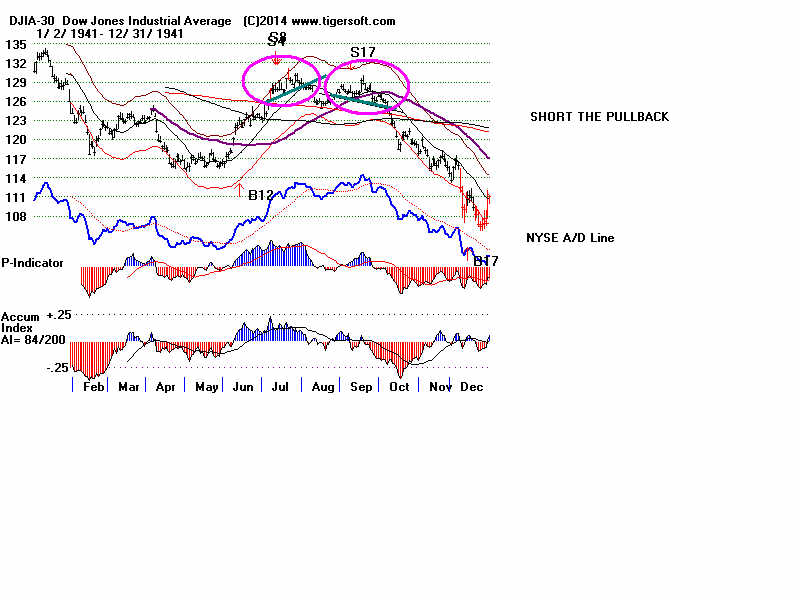
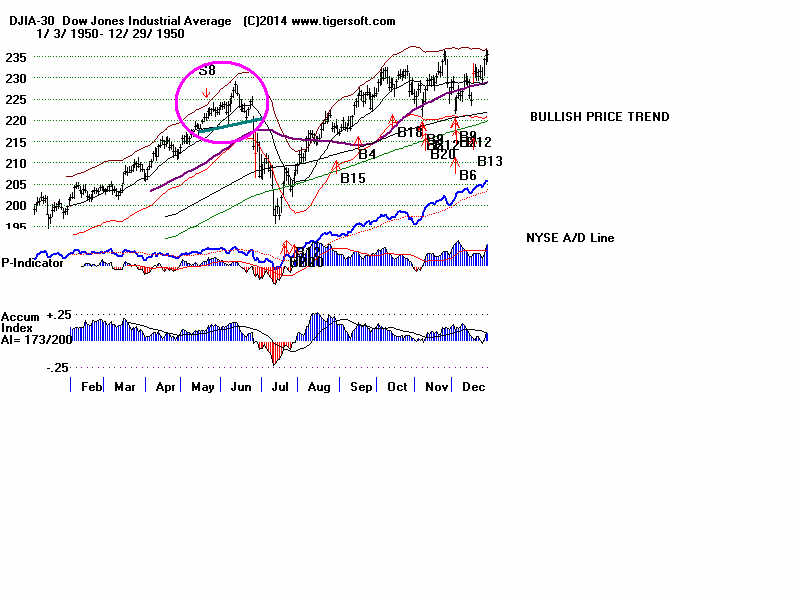
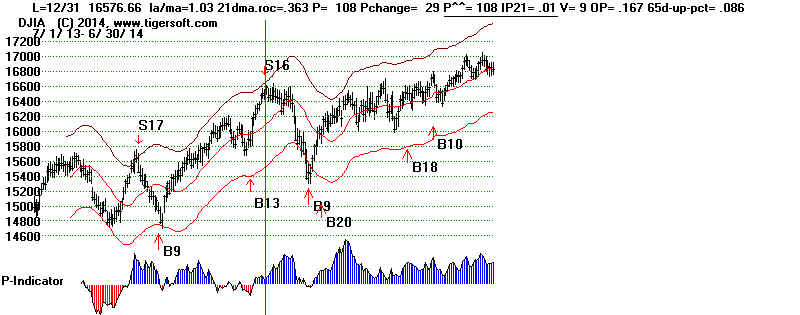
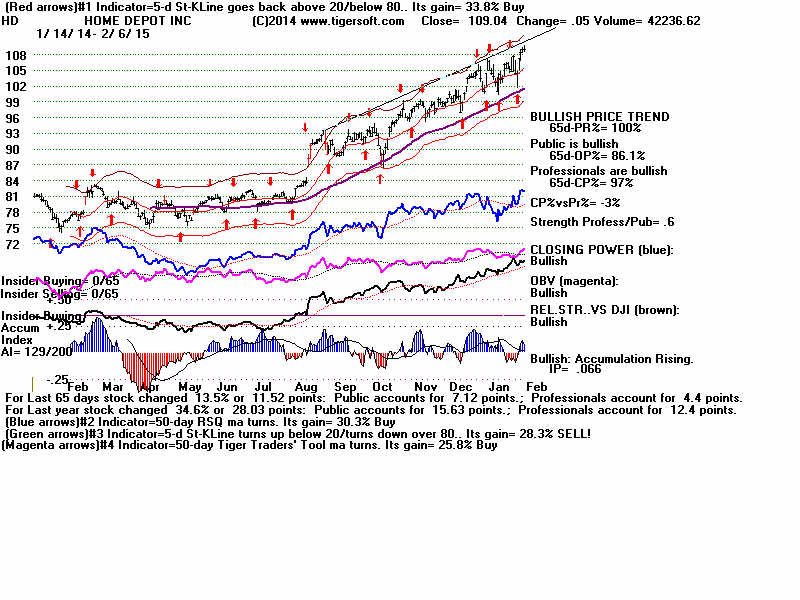
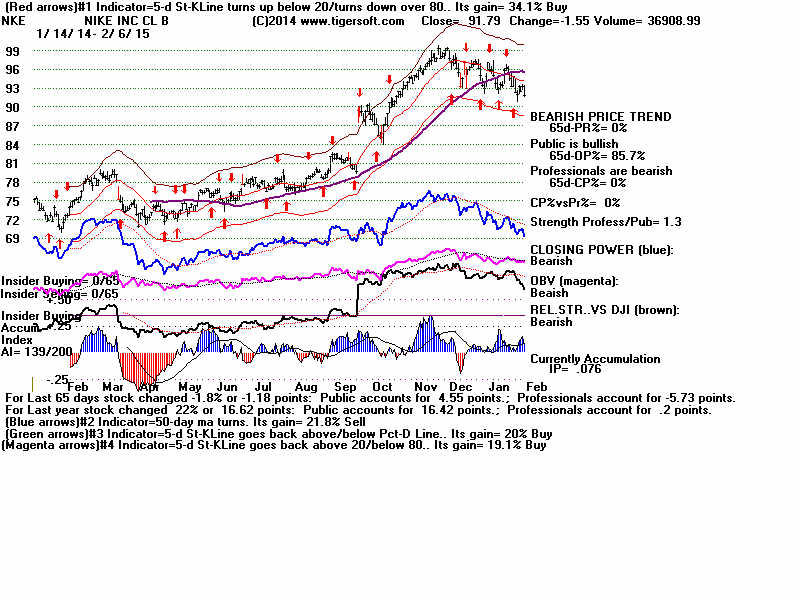
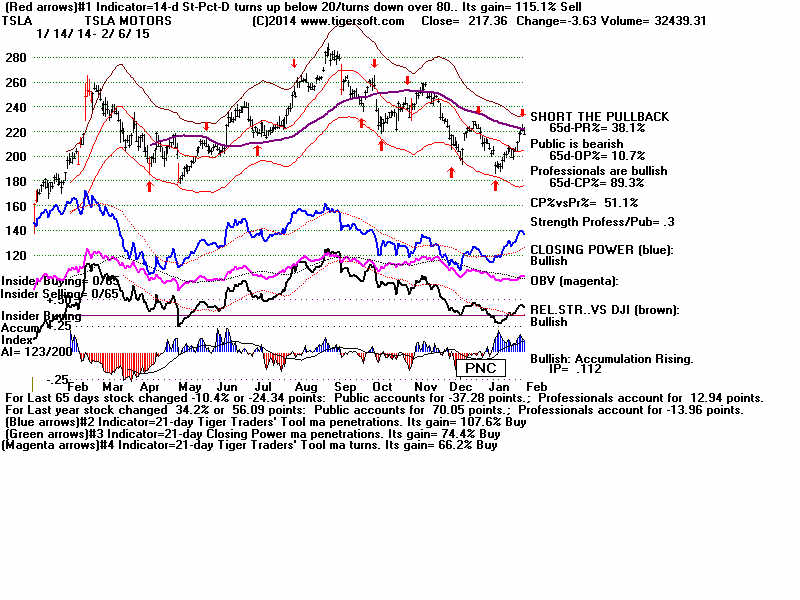
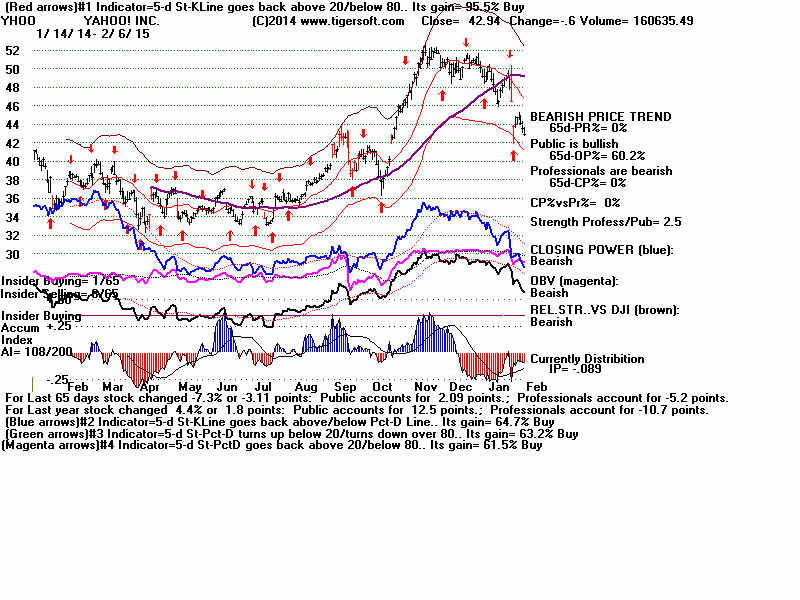
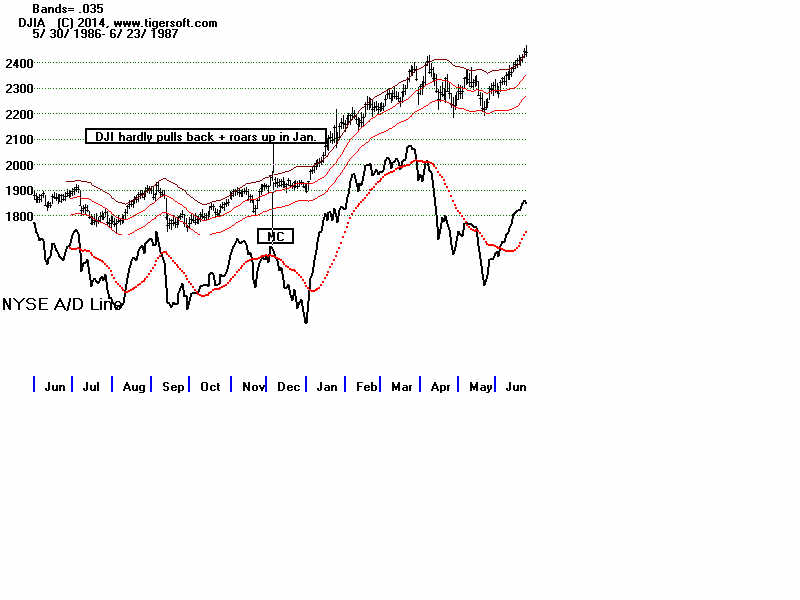
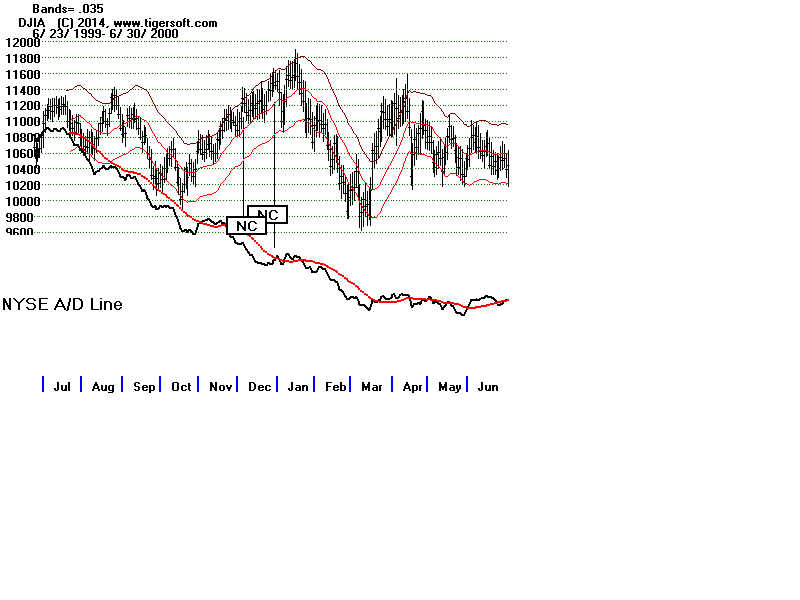
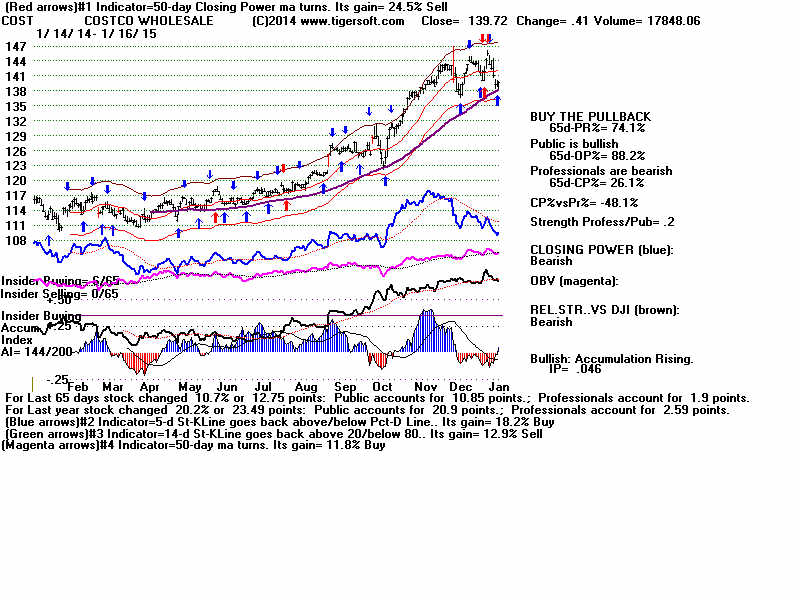
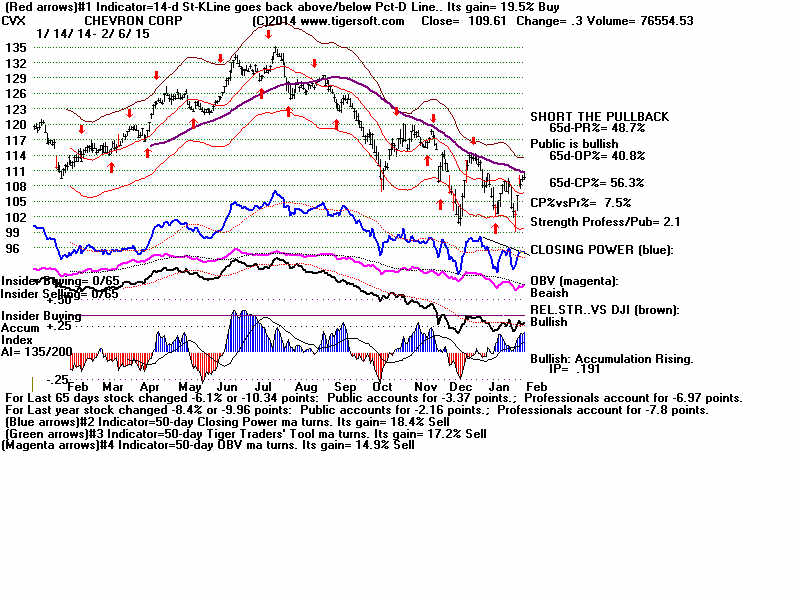
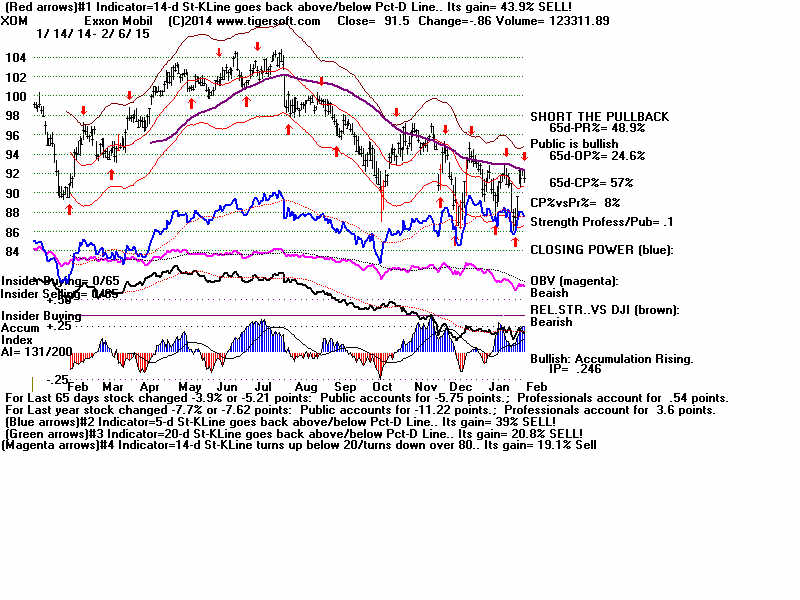
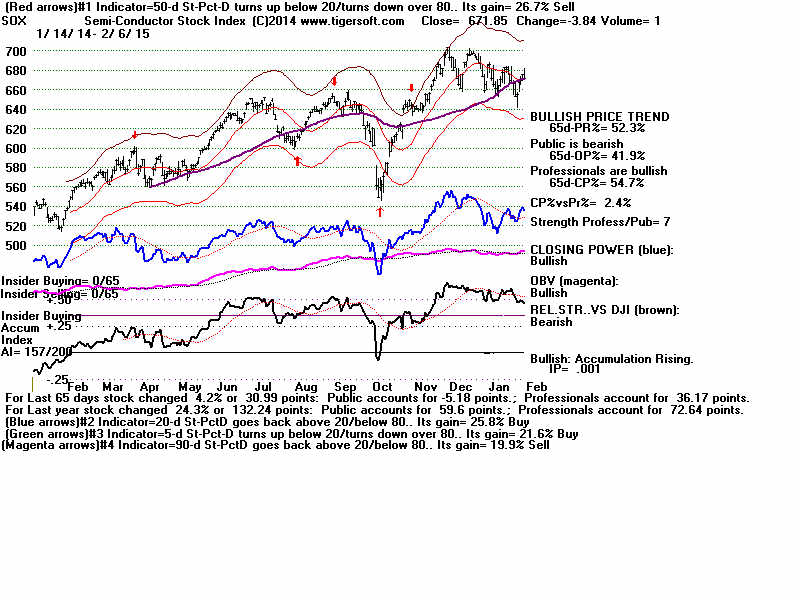
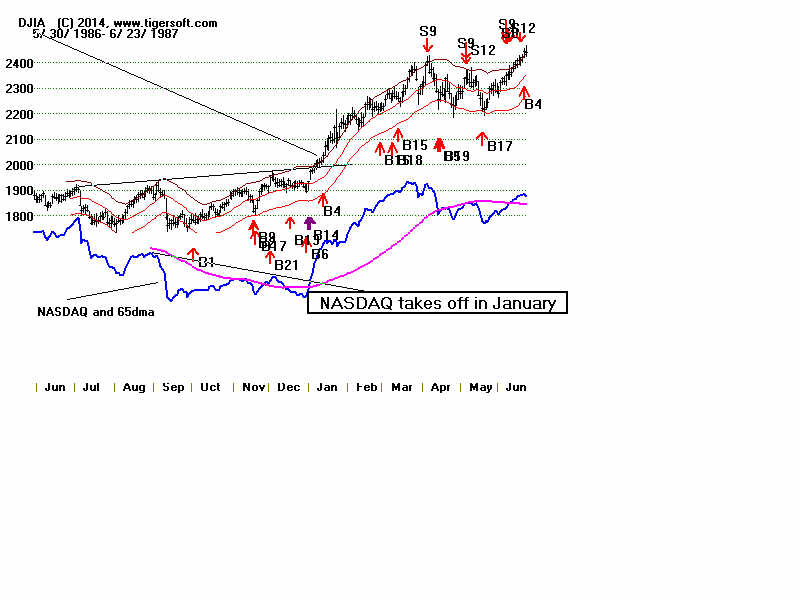
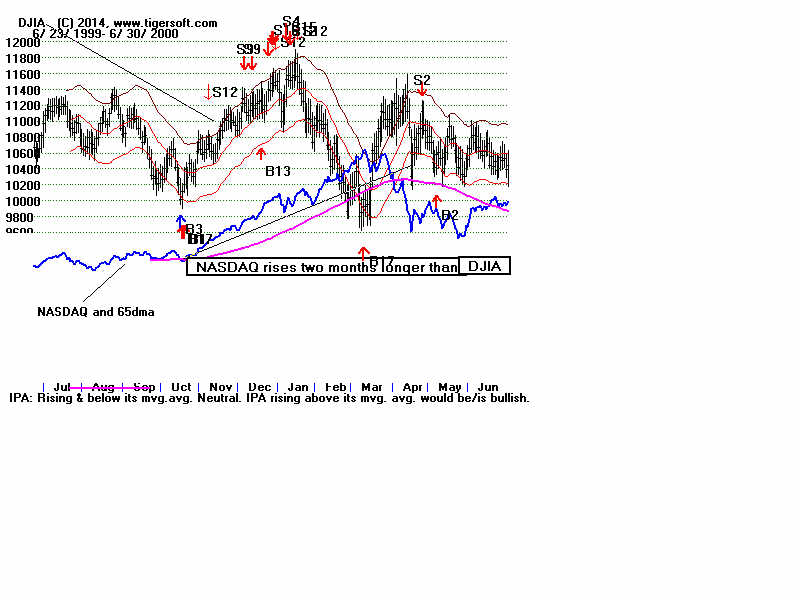
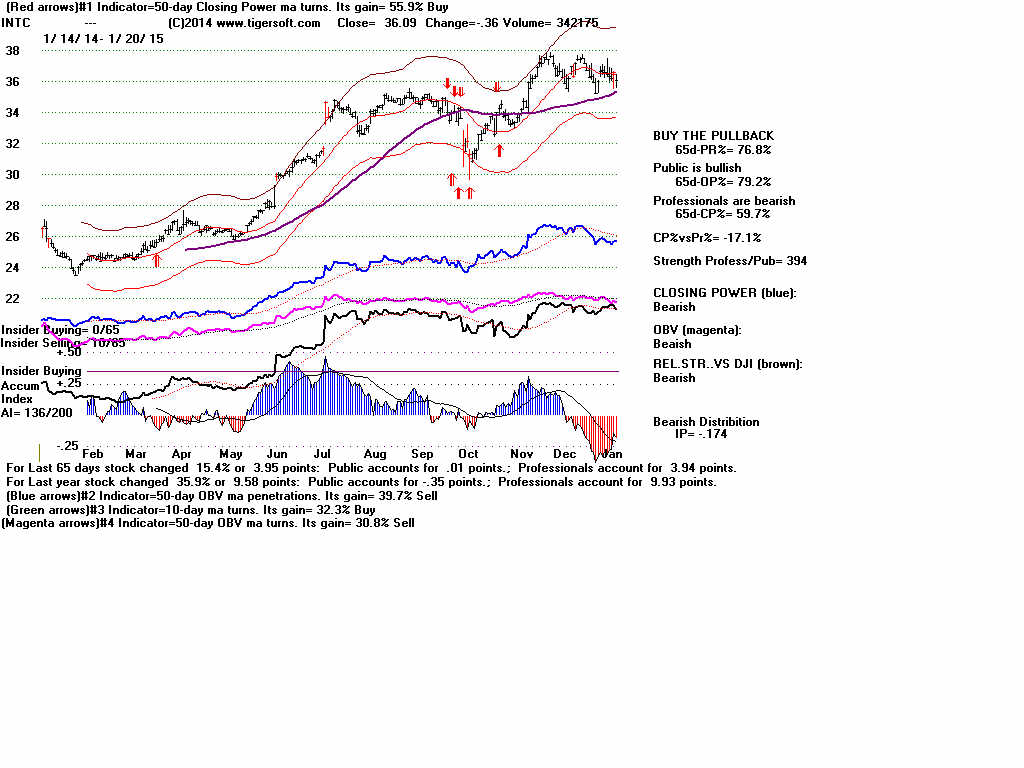
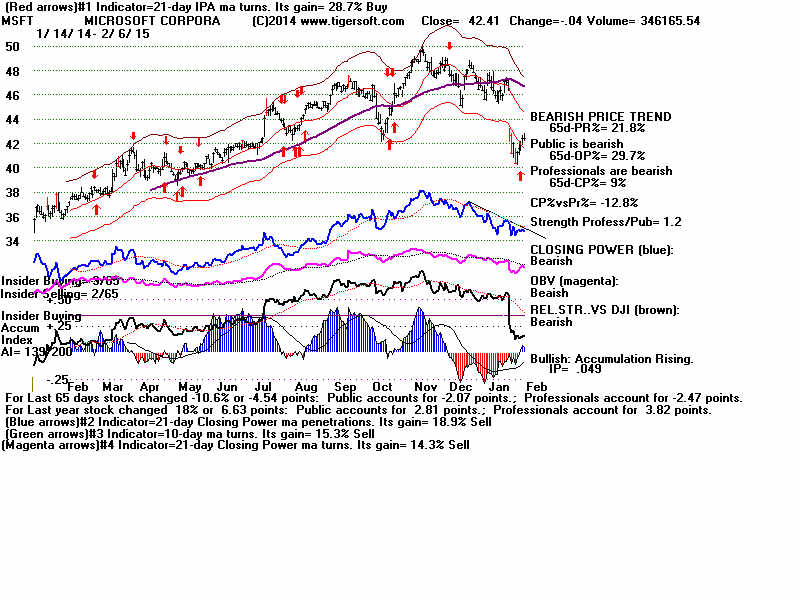
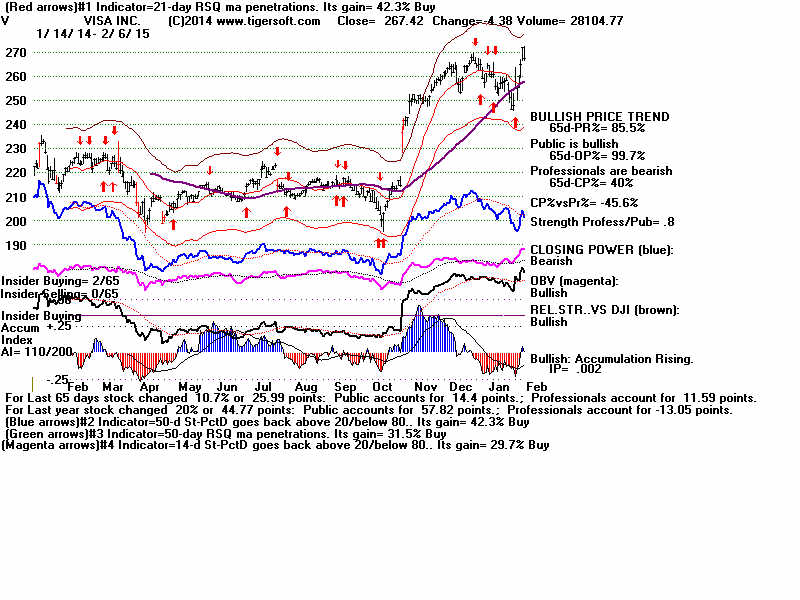
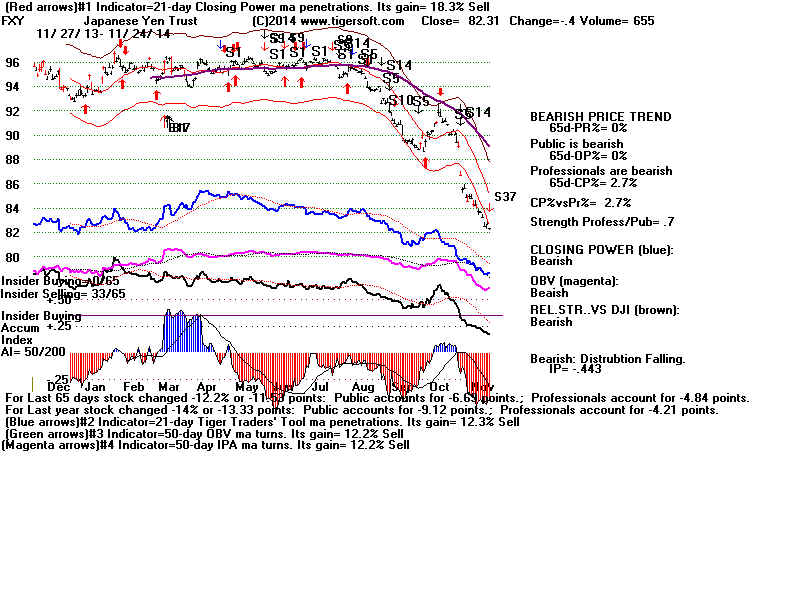
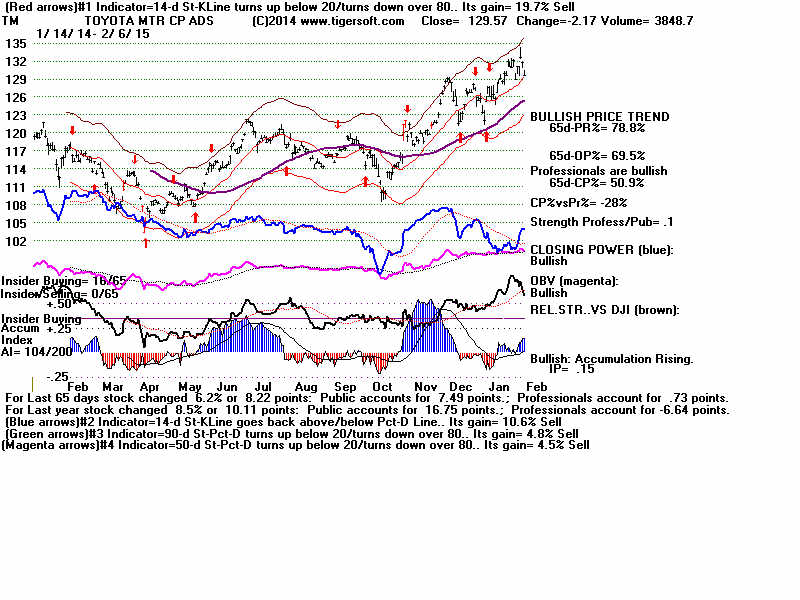