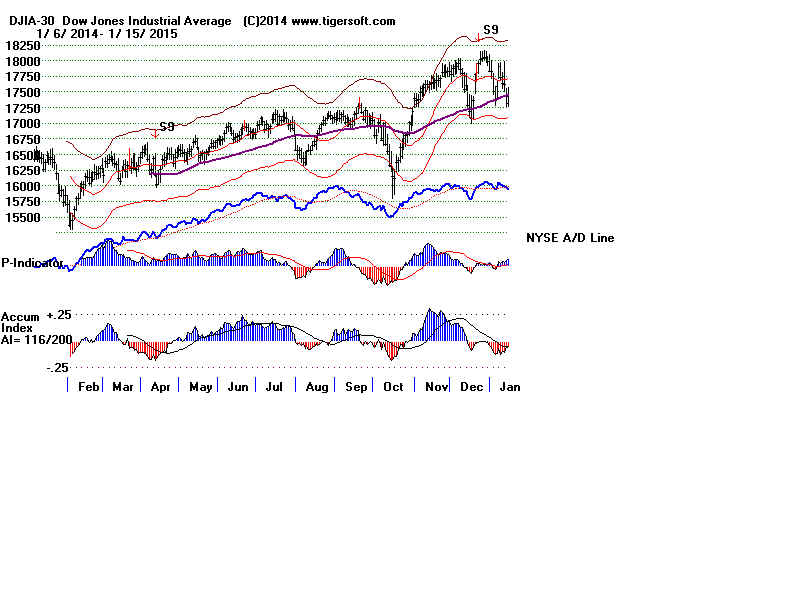
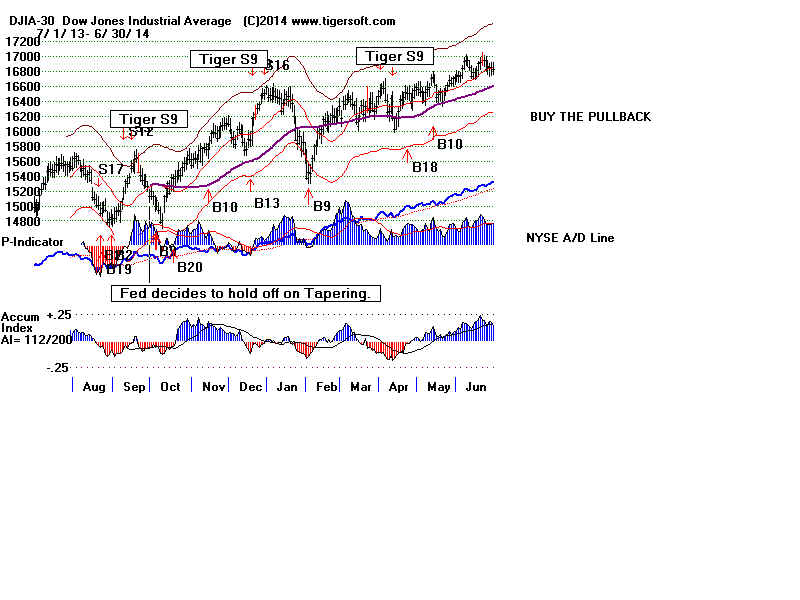
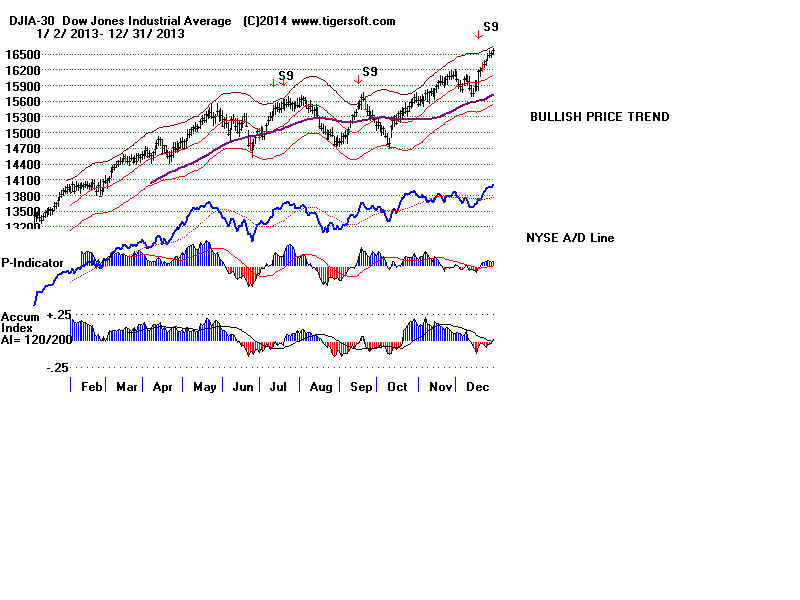
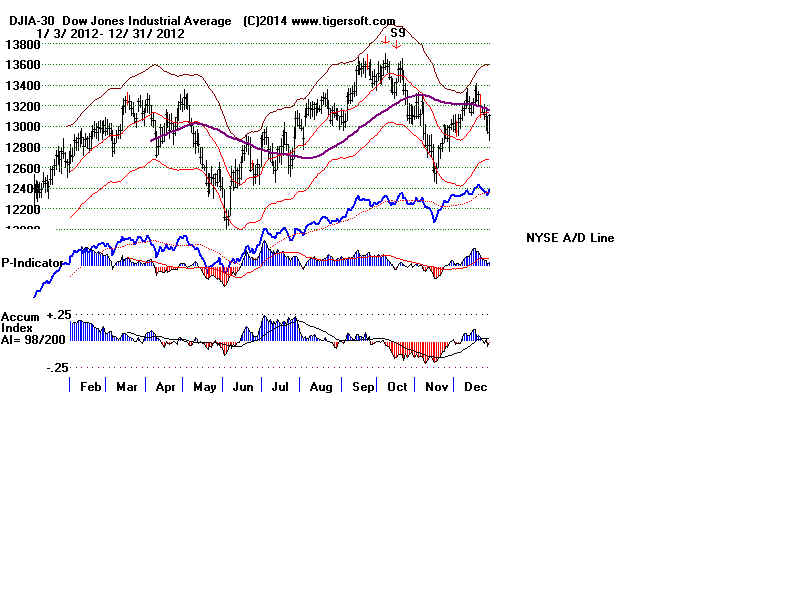
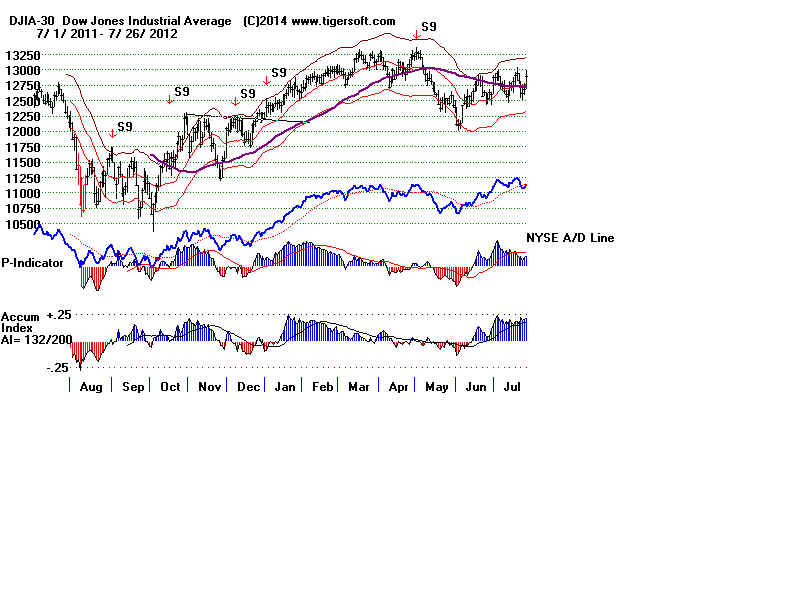
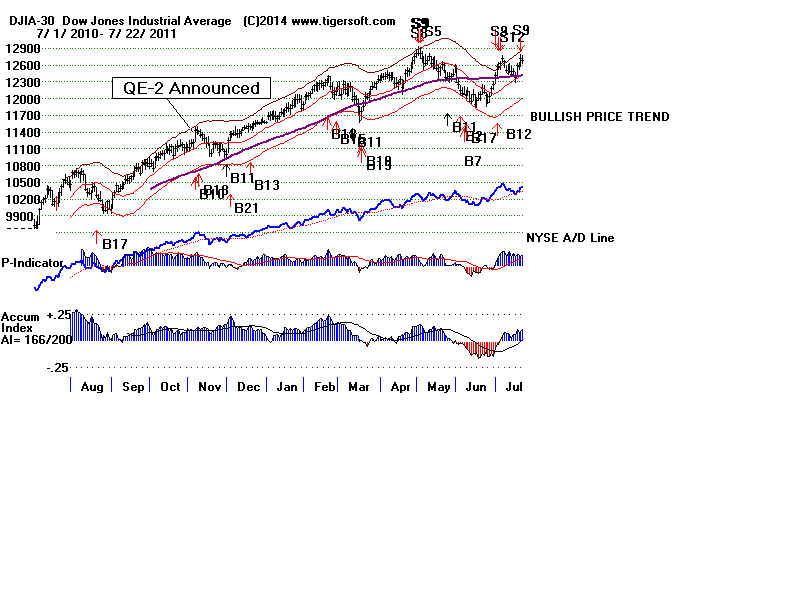
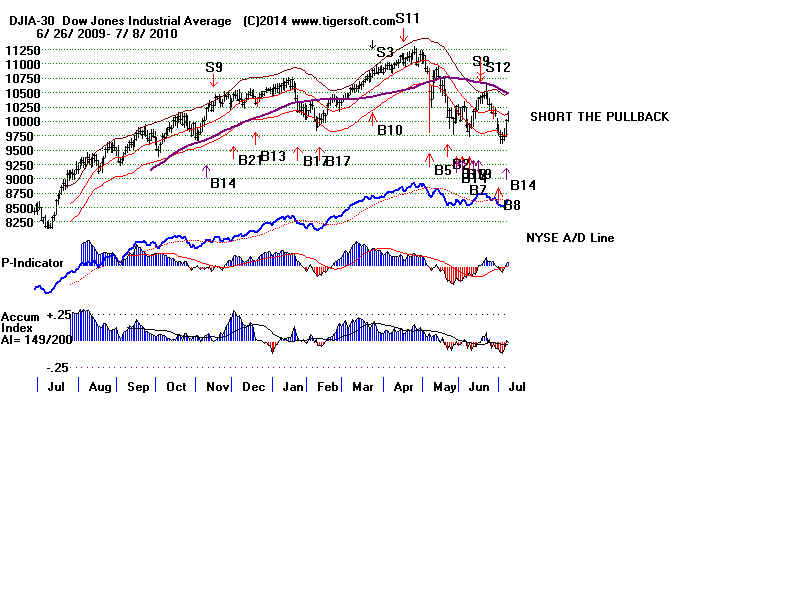
Tiger Sell S9s (IP21
NNCs of new highs)
by
month since 2010
---> Decembers: 3
of 4 fell to lower 2.0% band.
Quantiative Easing
See http://en.wikipedia.org/wiki/Quantitative_easing
Phase 1 -
In late
November 2008, the Federal Reserve started buying $600 billion in mortgage-backed securities.[37]
By March 2009, it
held $1.75 trillion of bank debt, mortgage-backed securities, and Treasury notes;
this amount
reached a peak of $2.1 trillion in June 2010. Further purchases were halted as the economy
started to
improve, but resumed in August 2010 when the Fed decided the economy was not growing robustly.
After the halt in June 1010, holdings
started falling naturally as debt matured and were projected to fall to $1.7
trillion by 2012. The
Fed's revised goal became to keep holdings at $2.054 trillion. To maintain that level,
the Fed bought $30
billion in two- to ten-year Treasury notes per month.
Phase 2 -
In
November 2010, the Fed announced a second round of quantitative easing, buying $600
billion
of Treasury securities by the end of the second quarter of 2011.[38][39]
Phase 3 A
and B-
"QE3",
was announced on 13 September 2012. In an 11–1 vote, the Federal Reserve decided to
launch
a new $40 billion
per month, open-ended bond purchasing program of agency mortgage-backed securities.
Additionally, the
Federal Open Market Committee (FOMC) announced
that it would likely maintain
the federal
funds rate near zero "at least through 2015."
On 12
December 2012, the FOMC announced an increase in the amount of open-ended mortgage
purchases
from $40 billion to $85
billion per month.[47]
Tapering
19
June 2013, Ben
Bernanke announced a "tapering" of some of the Fed's QE policies contingent
upon
continued positive economic data.
Specifically, he said that the Fed could scale back its bond purchases
from $85 billion to $65 billion a
month during the upcoming September 2013 policy meeting.[48
September 2013, the Fed decided to
hold off on scaling back its bond-buying program.[51]
But morthage purchases were halted
on October 29, 2014.[52]
after accumulating $4.5 trillion in assets.[53]
Dec 2014 - fell
to 2.0% lower band, so far
Dec 2013 - rose 2% and then fell below 3.5% band.
Dec 2011 - DJI fall
only to 21-dma and then DJI rallied strongly.
Dec 2009 - rose 2% and then fell slightly below 3.5%
band.
----------------------------------------------------------------------
Oct 2012 - fell below lower 3.5% band
Oct 2011 - Tiger S9 failed.
Sept 2013 - fell to
lower 3.5% lower band
Aug 2011 - fell below lower 3.5% band
July 2013 - fell
to lower 3.5% band.
July 2011 - fell far below lower 3.5% band
May 2012 - fell below lower 3.5% band
Apr 2014 - Tiger S9 failed.
March 2014 - fell to 1.75% lower band
Jan 2012 -
Tiger S9 failed.
Jan 2011 -
Tiger S9 failed.
----------------------------------------------------------------------------
 |
 |
 |
 |
 |
 |
 |