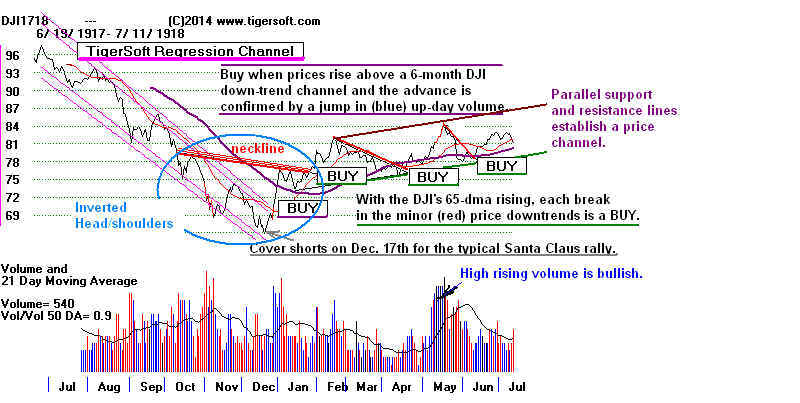
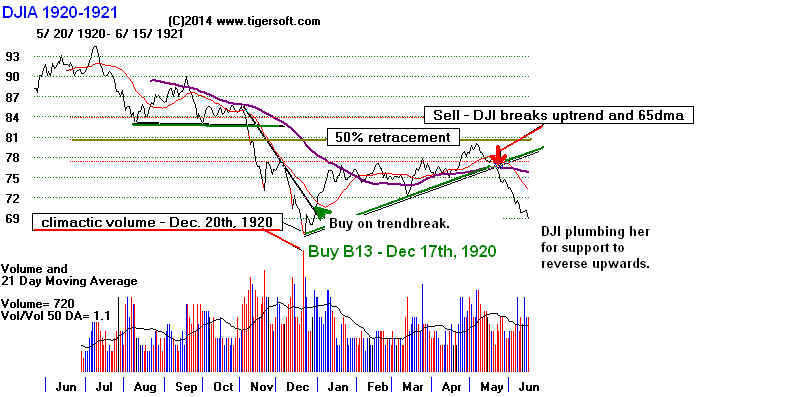
21-dma works well most of the time even in a bear market.
Looking at the 23 cases since 1915 where a Buy B13 might
have neen applied we see there were 15 instances (65.2%
of the time) where the ensuing rally lasted at least to February.
In one more case it lasted until January 29th. That suggests
the odds are 70% (69.6%) of a rally until at least the end of
December. In 6 cases, the DJI rallied to only January. Only
once did the ensuing rally last only until the end of December.)
Amazingly, I think, the DJI did not keep falling right through
the end of the year. There would have been two paper losses
of slightly less than 5%.
Charts below are from work being done on my
"Technical Analysis on DJIA: 1915-2014"


Seasonality
When the DJI is in a bear market, there seems to be a strong tendency for a rally
to occur from just before Christmas. Buying on the 17th - 23rd if the DJI was more
than 1% below its 21-dma would have been possible in 22 of the 24 bear market
years since 1915. Buying this way would have meant only one loss.
Green - rally only until January 6/24 (25% of the time)
Blue - rally until February, at least 16/24 (67% of the time)
1917-1918 December 19th to February 19th: 65.90 t0 82.10
1920-1921 December 21st to February 16st 66.80 to 77.10
1923-1924 December 20th to February 6th 94.00 to 101.30
1929-1930 December 20th to February 5th 230.9 to 272.1
1930-1931 December 16th to February 24th 157.5 to 194.4
1931-1932 December 17th to March 8th 73.8 to 88.8 3.0% paper loss on 1/4
1932-1933 December 22nd to January 10th 56.6 to 64.4
1933-1934 December 20th to February 5th 95.3 to 110.7
1937-1938 December 17th to February 23rd 124..9. to 132.4 4.8% paper loss on 12/28.
1941-1942 December 23rd to January 5th 106.3 to 114.2
1957-1958 December 17th to February 4th 426.7 to 458.7
1966-1967 December 19th to February 8th 798.99 to 850.97 4.8% paper loss on 1/3
1969-1970 December 16th to January 5th 773.83 to 811.31 and then down sharply.
1973-1974 December 17th to March 13th 811.12 to 891.66 0.9% paper loss on 2/11/1974
1974-1975 December 17th to March 17th 597.54 to 786.53
1977-1978 December 19th to December 30th 807.95 to 831.17. Bear market quickly resumed.
1978-1979 December 18th to April 10th 787.51 to 878.72
1981-1982 December 17th to January 29th 870.53 to 871.1 DJI then resumed decline.
(1987-1988 No Buy B13 because DJI was above 21-dma in second half of December.)
1990-1991 December 17th to March 5th 2593.32 to 2972.52 There was a paper loss. DJI fell to 2470.3 on 1991.
2000-2001 December 18th to February 1st 10645.42 to10983.63 There was a paper loss. DJI fell to 10318.93 on 12/20
2001-2002 December 17th to March 12th 9891.96 to 10632.35 There was a paper loss. DJI fell to 9618.24 on 1/29
2002-2003 December 17th to January 14th 8535.39 to to 8842.62 1.7% paper loss on 12/27
(2007-2008 No Buy B13. DJI was not far enough below 21-dma. LA/MA = .993)
2008-2009 December 23rd to January 2nd 8419.49 to 9034.69. DJI then plunged to 6600 in early March,