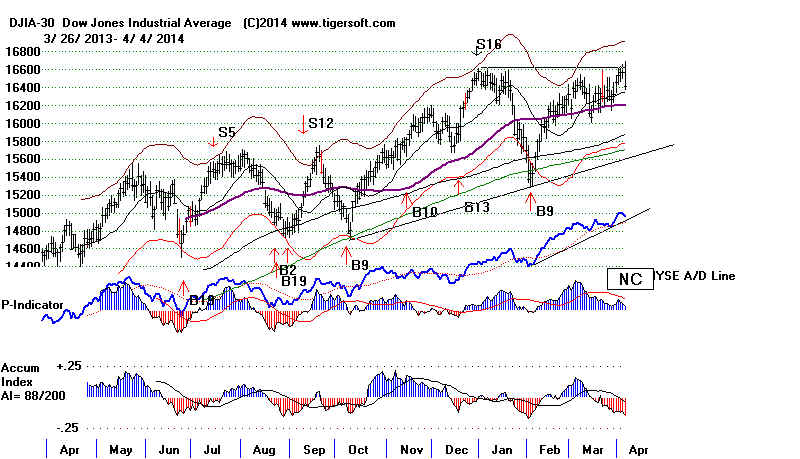
1) Peerless Arrowed Signals from DJIA. B= Buy S= Sell
Fixed rules generate this system based on study of 1928-2014.
P-Indicator (Breadth oscillator), NYSE A/D Line, Tiger Accum Index (IP21)
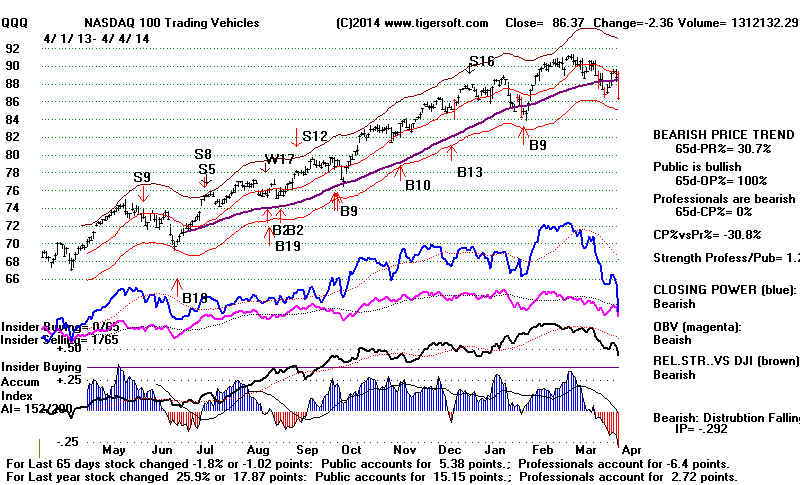
The signals are often superimposed another chart, like QQQ
Tiger Closing Power (blue) shows net trading by Professionals.
Tiger Accumulation Index (blue and red) shows insider and institutional buying/selling
Tiger Relative Strength Quotient compares stocks performance with DJI's
OBV = On Balance Volume)
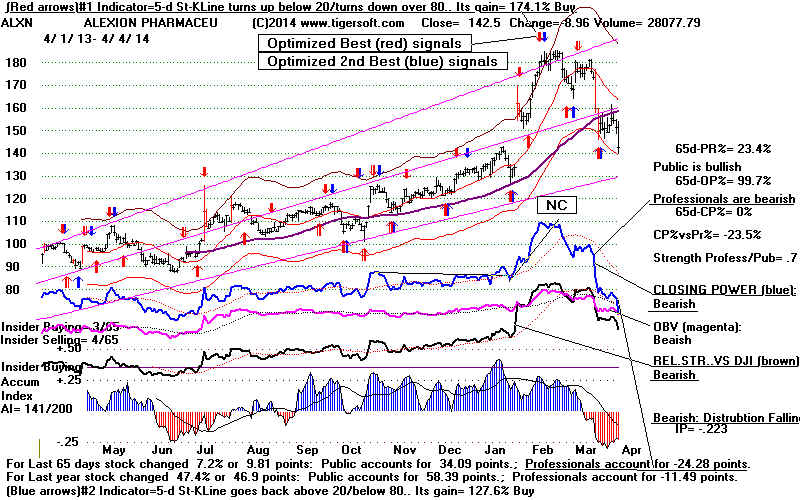
Optimized Red Buys and Sells (arrows) are best system of 60 for last year.
Note gains at top of page.
Optimized Blue Buy and Sells are second best for last year
Tiger Closing Power (blue) shows net trading by Professionals
Tiger Accumulation Index (blue and red) shows insider and institutional buying/selling
Tiger Relative Strength Quotient compares stocks performance with DJI's
OBV = On Balance Volume)
No Optimized signals.
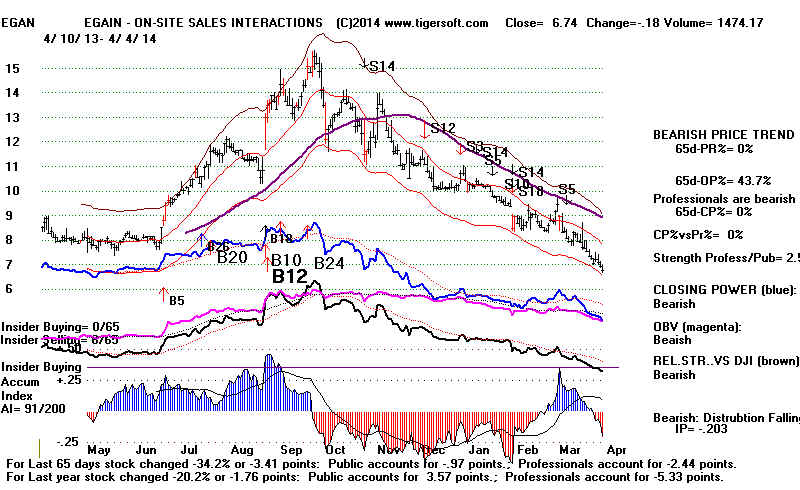
Numbered technical signals. These signals appear automatically
according to technical rules and whether the stock is above or below the 65-dma.
Note how important the 65-dma is.)
(Tiger Closing Power (blue) shows net trading by Professionals
Tiger Accumulation Index (blue and red) shows insider and institutional buying/selling
Tiger Relative Strength Quotient compares stocks performance with DJI's
OBV = On Balance Volume)
No signals on these charts.
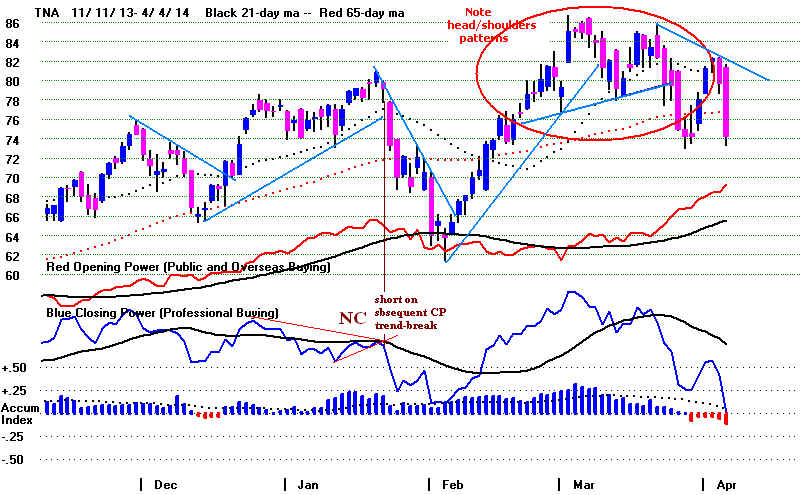
Large scale facilitates the study the CP and price trendline, price patterers
and CP NCs.
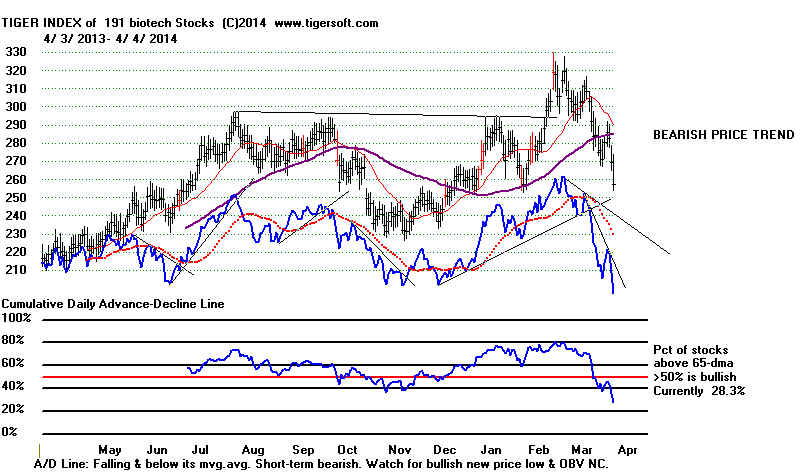
Shows A/D Line for group and percent of stocks in group above
the 65-dma.
Usually shown with no signals.