


TigerSoft and Peerless Daily
Hotline
http://tigersoftware.com/112221-H/
===========> IMPORTANT <=============
Subscribers will get Friday or Saturday
a new Hotline IP address to start Sunday.
-----------------------------------------------------------------------------------------------------------------------
(C) 1985-2014 William Schmidt, Ph.D. www.tigersoft.com
All rights strictly reserved.
Tiger Software 858-273-5900
PO Box 22784 San
Diego, CA 92192
Email william_schmidt@hotmail.com
Previous Hotline - http://tigersoft.com/1111-HL/index.html
10/22/2013-11/21/2013
----------------------------------------------------------------------------------------------------------------------
----------------------------------------------------------------------------------------------------------------------
 Shhh.
Sharing this hotline address with non-subscribers is a violation of our contract
Shhh.
Sharing this hotline address with non-subscribers is a violation of our contract
with you and a violation of copyright laws. I work hard for you. Respect that
effort!
---> To
renew this Hotline,
order here $350 (check) - $360(Visa/MC)
www.tigersoft.com/-2GBL13HL/index.htm
-----------------------------------------------------------------------------------------------------
 http://tigersoft.com/-HL42013/index.html
http://www.tigersoft.com/-2GBL13HL/index.htm
http://tigersoft.com/-HL42013/index.html
http://www.tigersoft.com/-2GBL13HL/index.htm
 A Guide To Profitably Using The
Tiger Nightly HOTLINE
A Guide To Profitably Using The
Tiger Nightly HOTLINE
 Peerless Signals: 1915-2013

New Peerless
Signals and DJI Charts - version 7/4/2013
1965 1965-6
1966
1966-7
1967
1967-8
1968
1968-9
1969 1969-70
1970
1970-1 1971
1971-2
1972
1972-3
1973
1973-4
1974
1974-5
1975
1975-6
1976
1976-7
1977 1977-1978
1978 1978-79
1979
1979-80
1980
1980-1
1981
1981-2
1982
1982-1983
1983
1983-1984
1984 1984-1985
1985 1985-1986
1986
1986-1987
1987
1987-8
1988 1988-9
1989
1989-90
1990 1990-1
1991
1991-2
1992
1992-3
1993
1993-4
1994
1994-5
1995
1995-1996
1996
1996-7 1997 1997-8
1998
1998-1999
1999
1999-2000
2000
2000-1
2001
2001-2
2002
2002-3
2003
2003-4
2004
2004-5
2005
2005-6
2006
2006-7
2007
2007-8
2008
2008-9
2009 2009-10
2010
2010-11
2011
2011-12
2012
2012-2013
Background and New Studies
Introduction to
Tiger/Peerless Buys and Sells.
Peerless Charts and Signals
Documentation for TigerSoft
Automatic and Optimized Signals.
How reliable is a rising
200-day ma? 2/9/2014
The New 2014 Peerless.exe Software has now been posted on the Elite Stock Professional
Page.
==================================================================================
3/20/2014 If news of a more hawkish Fed cannot bring about a
correction,
the market's bullishness must be respected. In addition,
today's DJI
rally makes it appear that the "expanded Buy B9" will
probably
not be reversed by the head/shoulders pattern in the DJI.
Hold IWM
and a mix of Bullish MAXCP stocks along with some of
the weakest
Bearish MINCP stocks. Coal stocks fell sharply today
among the
bearish MINCP stocks. This illustrates the advtange of
hedging
particularly by shorting any group that is heavily represented
among the
bearish MINCP stocks. Bullishly, a number of semi-conductor
stocks like
ADEP, ADI and AMAT
are now Bullish MAXCP stocks.
--> To Key Index and Leading Stock Charts: DJI, SP-500, etc.
DJI Chart SPY Chart NASDAQ Chart IBB Chart
IWM Chart
--> 152 +49 MAXCP stocks Bullish MAXCP Stocks (3/20/2014) Bullish plurality
--> 70
-9 MINCP stocks Bearish MINCP Stocks (3/20/2014)
--> 92 +9 New Highs on NASDAQ 10 new lows. Bullish plurality
--> 60
-18 New Highs on NYSE 14 +9 new
lows. Bullish
plurality
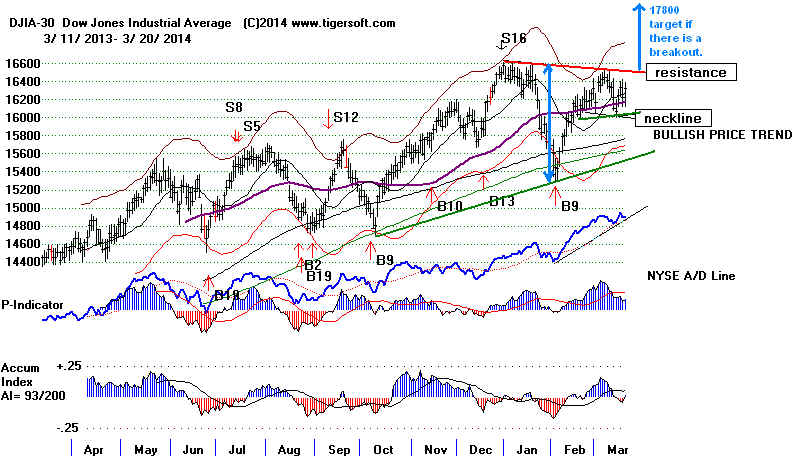
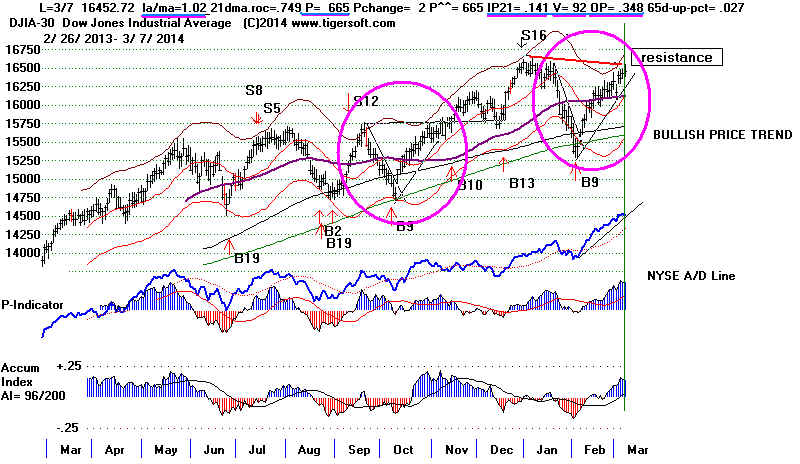
Head/Shoulders? The DJI rallied 109 up to the apex of the right shoulder in
the
potential
head/shoulders pattern mentioned last night. The Hourly DJI chart
shows this
most precisely. Now an hourly reading much above 16360 would
destroy the
symmetry of the pattern and thereby render more impotent its
bearishness. Additional strength in the DJI will force shorts in the general
market ETFs
to cover. The DJI would next be expected to challenge 16600.
and the
flat resistance there. Surprisingly, breadth was negative today. That
and the low
up-day and up-hour volume will work against a DJI breakout past
16000.
We will also want to watch to see if the other general market indexes'
key ETFs
can bullishly destroy their own head/shoulders pattern.
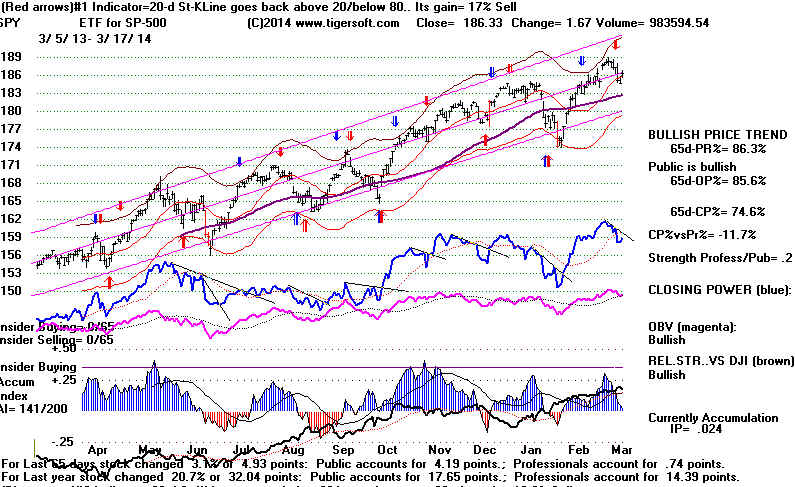
SPY's
Closing Power has broken its downtrendline. it closed at 187.75.
It seems
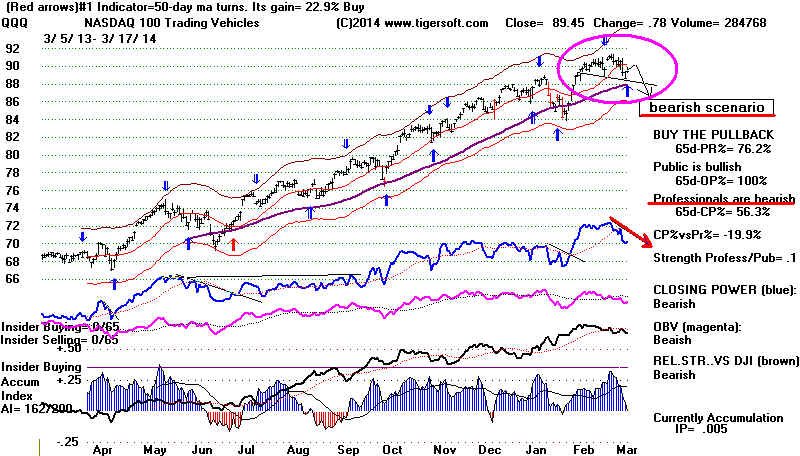
bound to make a nominal new low above 190. QQQ's Closing
Power has
not yet been pentrated. QQQ, now 90.29, will need to rise past
91.00 to
abort its Head/Shoulders. IWM shows the most underlying
Accumulation. Its Closing Power is bullishly angling up. But its rise today
was
very small. It needs to surpass 10.5 to make a new high.
While a DJI
breakout above the flat overhead resistance seems unlikely
based on
the up-day volume being lower than down-day volume this year,
a valid
breakout to 16800 would then be headed for its minimum upside
objective
of 17800.
==================================================================================
OLDER HOTLINE
==================================================================================
3/19/2014 The DJI seems
locked in a narrow trading range: 16000-16600.
Small caps
are favored now. A bearish head/shoulders in the DJI must be watched
for.
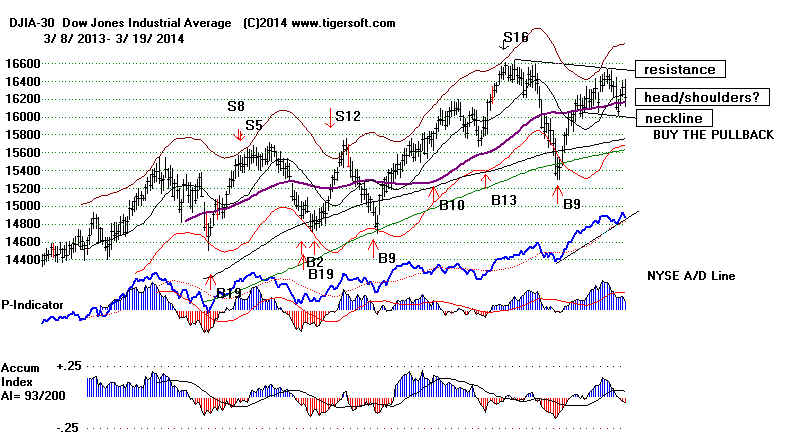
Stay
Hedged. The bearish scenario of a Head/Shoulder Pattern
got new
life today from a very cautious Janet Yellen today. (At one point, it almost seemed
that she
had the same scared look in her eyes that Hank Paulson showed in
October
2008.) She was no Wall Street cheer-leader today. Professionals
lnew in
advance. That was why the Closing Powers of DIA, SPY and QQQ
could not
break their recent downtrend.
No upside
breakout likely. Yellen badly disappointed the Bulls today. Now we have
to worry
about sudden head shoulders patterns suddenly appearing. This is the
way Wall
Street quickly re-adjusts to unexpected bearish news. There are many
examples of
this. This is an important part of Peerless. DJI head and shoulders
can and do
bring big market declines. We must heed a break in the DJI neckline
as a judged
Sell S10 if one occurs. A strong A/D Line helps deter such a bearish
development, but it cannot, by itself, prevent such a breakdown, especially
if there is
a sudden and unexpected change of economic policy. This is what
causes the
head/shoulders.
Usually,
such H/S Sell S10s involve invasions (North Korea-1950, Iraq-1990),
impending
attacks (Pearl Harbor-1941 and 9/11/2001) and impending assasinations
(JFK-1963)
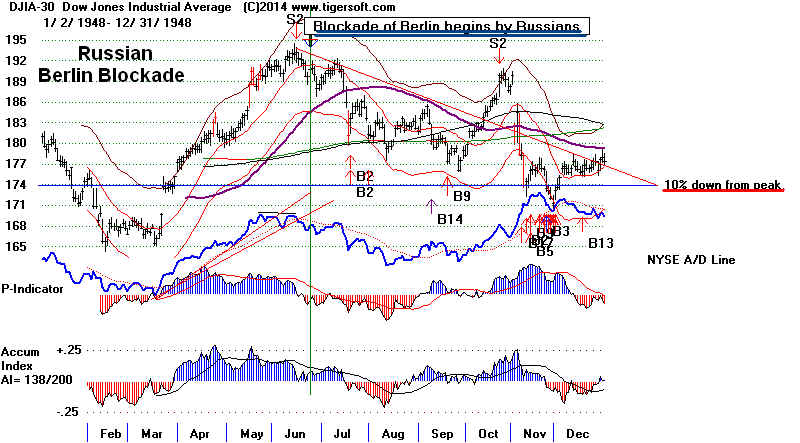
heart attack (Eisenhower-1955). Berlin Blockade of 1948 is another
example.
Bearish
head/shoulders can also occur because of important economic developments
and policy
changes in DC (notably, Nixon's 1971 cessation of selling Gold
on demand
for Dollars), Truman's reluctance to quickly stop the many labor strikes
of 1946 and British Petroleum's
massive oil spill's threat to the Southern Gulf's
economy and
ecology. Another example: in early 1994, the Fed
suddenly boosted
short-term
rates. A quick head/shoulders appeared and the DJI dropped 10%.
Yellen
might today have taken the opportunity of speaking today to allay investor fears
that about
a stock market bubble. Instead, she
suggested interest rates might go
up
sooner than was expected. When pressed, she said the FED would probably
end QE-III
(Fed bond buying) completely in 6 months and start raising interest rates
6 months
later. This was not at the end of 2015, as Bernanke had previouly laid out
as the Fed
plan, or 2016 as has widely been assumed by Wall Street economists
going into
the meeting.
The Public
is still in a mood to speculate. High Accumulation, smaller stocks may
be the last
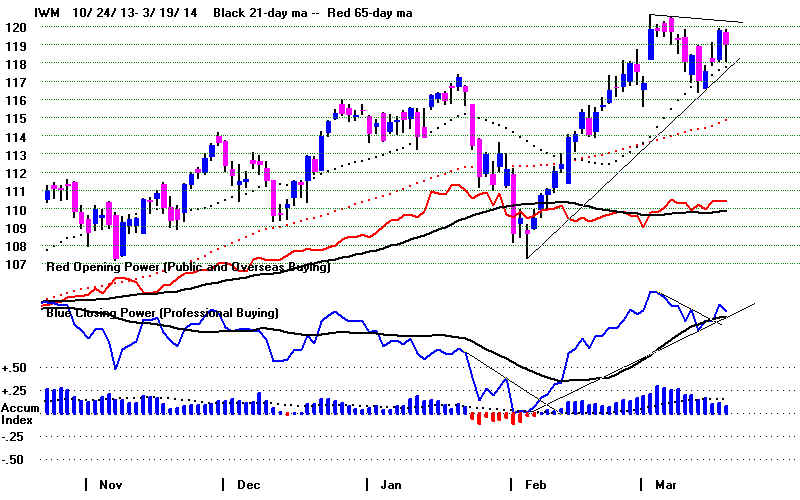
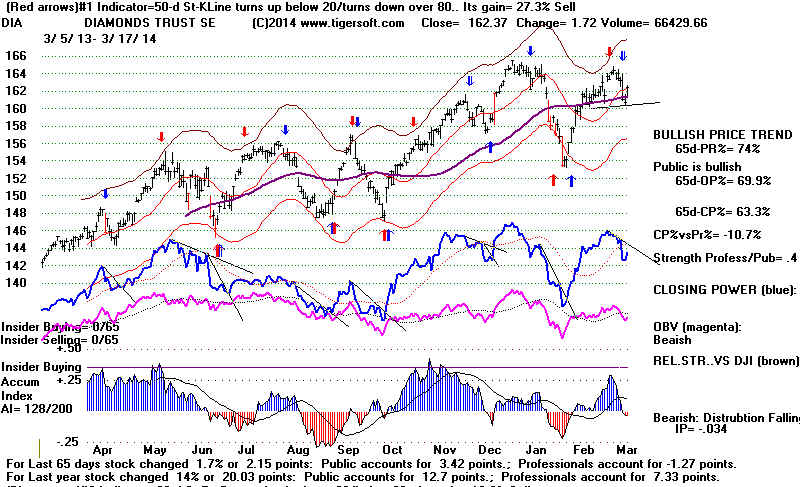
to top out. IWM's Closing Power is in an uptrend. Bearishly,
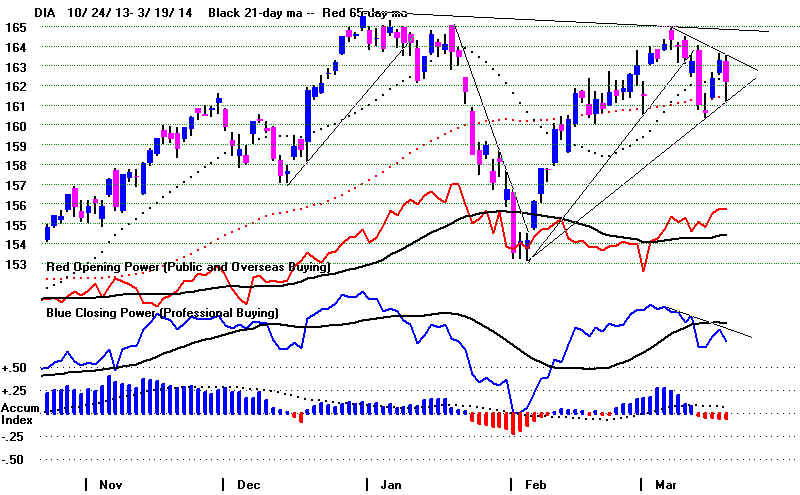
the CP of DIA, SPY and QQQ are falling. DIA is the weakest. Note its
negative
Accumulation Index, too.
Our
Stocks' Hotline is hedged, long about the same number of Bullish
MAXCPs
as it
is short Bearish MINCPs.
IMPORTANT. We see that the market becoming much riskier.
This is what one
must expect
after 5 years of a bull market without more than an 18% correction.
In this
context, consider hedging like our Stocks' Hotline is doing. In addition,
know when
Tiger advises selling individual stocks. See some
examples here.
1) Closing Power non-confirmations followed by CP trend breaks.
2) Peerless Sells followed by CP trendbreaks.
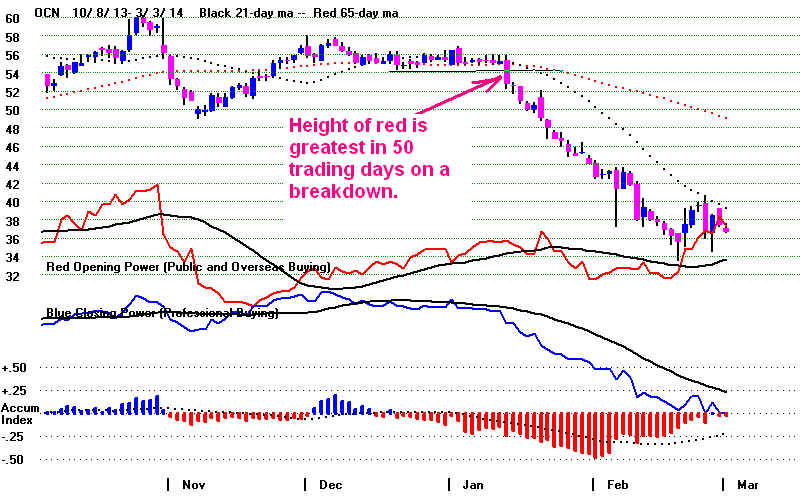
3) Very big advances followed by high volume reversal days (big red popsicles)
4) Very big advances followed by CP trendbreaks.
5) Very big advances followed by OBV NCs, IP21 NNCs and CP trendbreaks.
6) Very big advances followed by head/shoulders patterns.
7) Very big advances followed by breaks of their 65-dma with IP21<0.
--> To
Key Index and Leading Stock Charts: DJI, SP-500, etc.
DJI Chart SPY Chart NASDAQ Chart IBB Chart
IWM Chart
--> 103 -51 MAXCP stocks Bullish MAXCP Stocks (3/19/2014) Bullish plurality
--> 79
+52 MINCP stocks Bearish MINCP Stocks (3/19/2014)
--> 83 +8 New Highs on NASDAQ 10 new lows. Bullish plurality
--> 78
+27 New Highs on NYSE 5 -3 new
lows. Bullish
plurality
==================================================================================
OLDER HOTLINES
==================================================================================
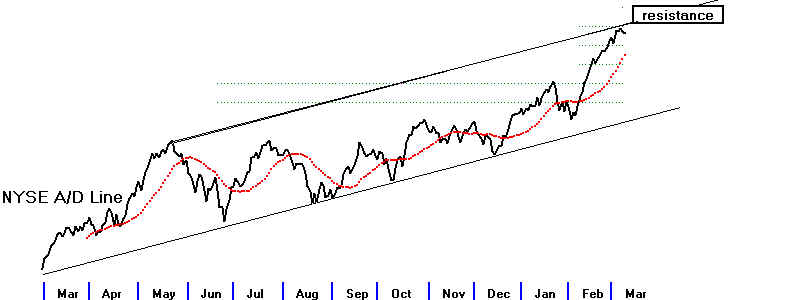
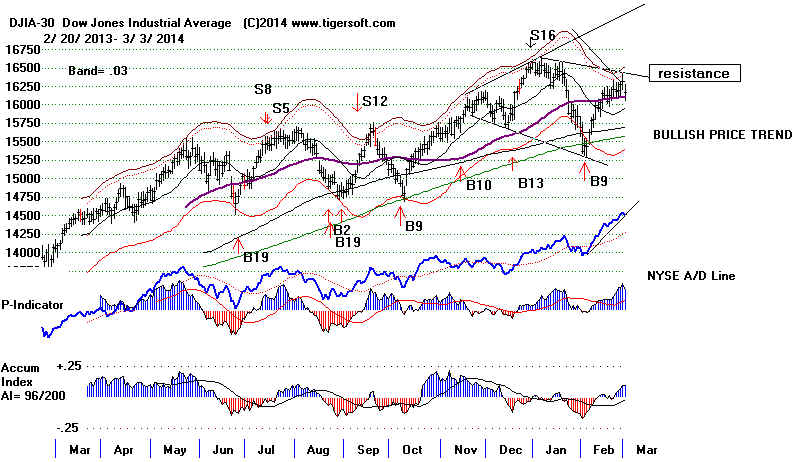
3/18/2014 Super Woman To The
Rescue!?
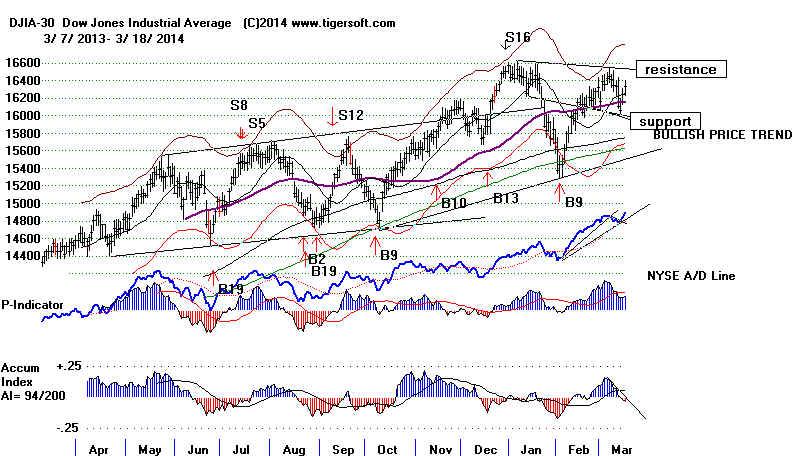
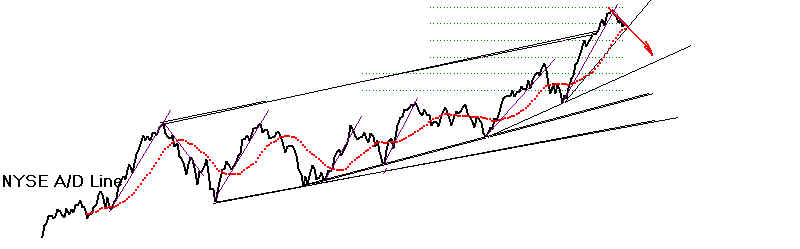
The NYSE A/D Line
made a new high ahead of the DJI and all the other key indexes.
This is too
bullish to argue with. IWM is the strongest of the major market ETFs.
 |
Unless Yellen disappoints investors in her news conference
tomorrow the
excellent breadth (NYSE advances - declines) should allow the
DJI to challenge
the nearly flat 13600 resistance. The Accumulation Index
being negative is
a warning that the overhead supply has not been eaten up.
The relatively
low volume makes a breakout less likely. But, a breakout above
16600 by the DJI
could set up a new target of 17600 if volume and the IP21
start improving.
|
The downtrending
Closing Power of IWM has been bullishly broken above
The downtrends of
the Closing Power for SPY, QQQ
and DIA's have not yet
been broken.
QQQ will need another good day to destroy its potential head/shoulders
pattern.
When that takes
place, short-covering should become very apparent. A good
NASDAQ rally to
new highs would likely take place.
We know that
Closing Powers start to lag at the end of a bull market.
So, with the DJI back above its 65-dma and the A/D Line making
another new high
ahead of price, it's hard to argue against the broader market's
uptrend.
The "expanded Buy B9" has not been reversed by a Peerless Sell.
The number of
MAXCPs is now greater than the number of MINCPs. Traders
must expect
Yellen to assure investors again that she does not see signs of
excessive
speculation.
--> To
Key Index and Leading Stock Charts: DJI, SP-500, etc.
DJI Chart SPY Chart NASDAQ Chart IBB Chart
IWM Chart
--> 154 +70 MAXCP stocks Bullish MAXCP Stocks (3/18/2014) Bullish plurality
--> 47
-43 MINCP stocks Bearish MINCP Stocks (3/18/2014)
--> 83 +8 New Highs on NASDAQ 10 new lows. Bullish plurality
--> 78
+27 New Highs on NYSE 5 -3 new
lows. Bullish
plurality
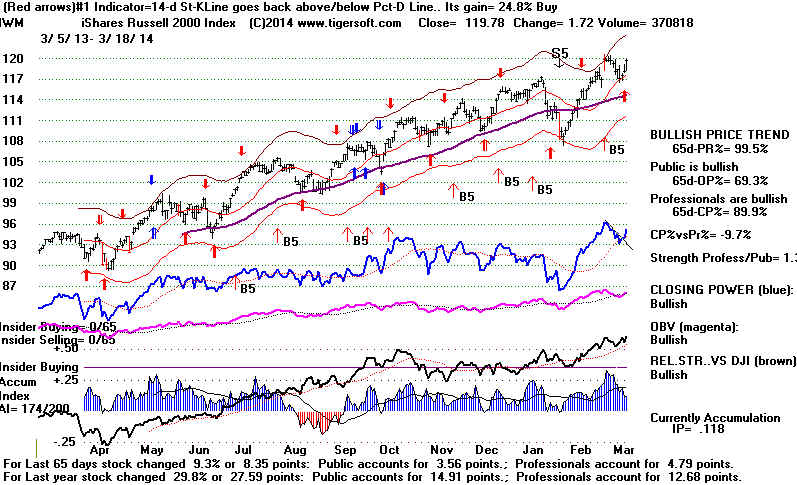
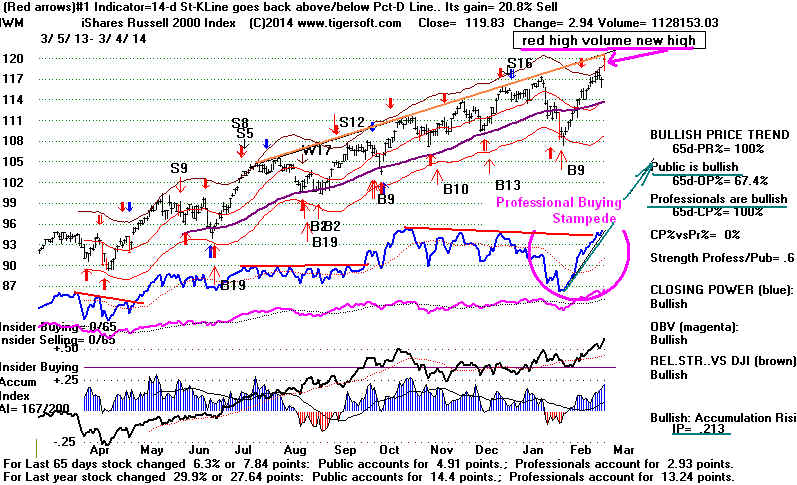
With an A/I 200
score of 174 and a decisive break in its CP downtrend,
IWM looks like the best ETF to buy even now, provided one is
willing
to sell when it
breaks its new Closing Power uptrend. I would not buy the
high Power-Ranked
leveraged ETFs, URTY and TNA now. Both are working
against red and
blue automatic Sells that have worked well this past year.
UTX (United Techn.) is the highest AI/200 stock now in the
DJI-30. Our
water
desalinization stocks also seem good plays now. Our favorite silver
stock, SSRI has
now doubled since it surpassed its 65-dma in December.
Take some profits
in it. Use cross-overs of the 65-dma to buy beaten-down
stocks you
believe in is the lesson here.
MSFT broke out today. Investors believe its abandoning of
its XP market,
which is what
runs 30% of the entire world computers, will bring lots of new
customers over to
buy Windows8. We'll see. Right now one can buy a fast
refurbished DELL
XP laptop on EBAY for less than $150 that runs Tiger
and Peerless
perfectly. MSFT's move may increase the number of such
computers for
sale for a while. Take advantage of this dumping of good
Dells.
Having a backup computer to run Tiger seems a good plan. In 2006,
they cost $1500
new.
A DJI breakout
past 16600 on rising volume could give us a bullish inverted
head and shoulders
pattern with an upside target of 17600.
==================================================================================
3/17/2014 I warned
traders here two weeks ago that news of Yellen's
making a
speech should be used to BUY. Such is her "dovish" reputation
on Wall
Street.
Sure
enough, word this morning that the Fed's leading monetary dove
would speak
Wednesday or Thursday this week came to the rescue of
the stock
market again. Short-term, bews of her coming press conference
proved much
more important for the US stock market than complicated fears
that the
Ukraine might soon be pulled apart violently by long-suppressed ethnic,
religious
and political dislikes, not unlike those that broke Yugoslavia apart.
The Technical Picture
The good
news is that rally brought the DJI up above its rising
65-dma.
Along with
the break in the A/D Line downtrend and its presumed uptrend's
resumption,
its hard not to see the bulls still seem in control. The
"expanded Buy B9" has not been replaced with any Sell. The OEX's
Closing Power downtrend was even violated today, though the
other
ETFs' CP
downtrends were not.
Some
significant technical problems remain. Volume was much lower
on the
rally today than it was on the decline last week. The NASDAQ's
Relative Strength Indicator has turned negative. The
DJI's Accumulation Index
remains
negative and is in a downtrend. The DJI did not retreat close enough
to the
lower band to give a new Peerless Buy signal. And perhaps, most
important,
the QQQ
could be forming a bearish head and shoulders' pattern. Watch
it closely.
The most
bullish thing the markets can do now is keep on rallying. The
closes
should be higher than the openings. This will destroy the QQQ's
potential
head/shoulders pattern.
But when this rally is over, I think the bulls will be lucky to see
the DJI rally back
at the
early January highs. More backing and filling a little above where we are
seems the
most likely scenario for the next few days, as traders wait to see
what Janet
Yellen actually reveals about Fed intentions.
Will the
official Unemployment fall to 6.5%? Will official inflation reach +2.2%?
The Fed has
said such levels would cause it to start raising interest rates.
Is this
still the Fed's view? What else might Yellen have to say about big banks
and Wall
Street? Does she still see no bubble? My guess is that we will
probably
get a pretty good idea of what she will have to say by watching the Tiger
Closing
Powers. Right now, the DIA's, SPY's and QQQ's are still falling.
We can
afford to wait a little before adding to long positions. Our Tiger Stocks'
Hotline
remains hedged. Many of the Bearish MINCP stocks
actually fell today.
 |
 |
--> To Key Index and Leading Stock Charts: DJI, SP-500, etc.
DJI Chart SPY Chart NASDAQ Chart IBB Chart
IWM Chart
--> 84 +35 MAXCP stocks Bullish MAXCP Stocks (3/17/2014)
--> 90
-55 MINCP stocks Bearish MINCP Stocks (3/17/2014) Bearish
plurality
--> 50 +14 New Highs on NASDAQ 10 -7 new lows. Bullish plurality
--> 51
+19 New Highs on NYSE 8 -8 new
lows. Bullish
plurality
==================================================================================
OLDER HOTLINES
==================================================================================
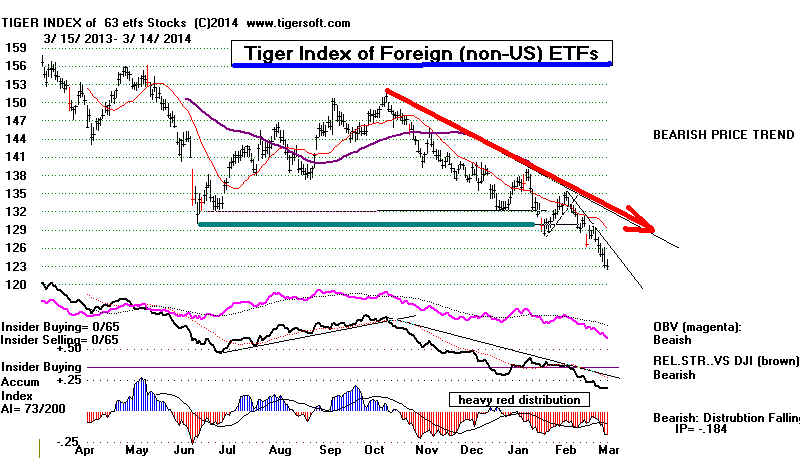
3/14/2014 It's a confusing
market now because the DJI and foreign markets
are so much
weaker than the other US indexes. Usually, the DJI eventually
wins such a
"tug of war", but it could take months if 2014 behaves like 1977
when the
DJI steadily eroded and stayed much weaker than the rest of the
market.
Or if we forget the good breadth, dismissing it as an artificial consequence
of
the Fed's
elongated policy of bank subsidies and low interest-rates, then the
market
takes on the appearance of 1967-1968, 1999-2000 and 2007-2008.
That is
would be bad: every new break in the A/D Line or a 65-dma will then cause
additional
heavy selling of some previously favored group, until in the
end, there
are not enough rising groups to support the market.
Distinguish
between the different markets and sectors by relative strength.
Trade long
the stronger markets and short the weak markets. They are going
in very
different directions. As an example, contrast the rising low-priced stocks now
with the
generally falling foreign ETFs.
Crimea
voted to join Russia. The US has said it would employ sanctions against
Russia for
annexing it. The Europeons will be the ones who suffer from the
American
intrusion into matters 12,000 miles away. They need Russian natural
gas.
Early next week the DJI will retreat further below the support of its 65-dma.
Its next
best price support is at the February closing low of 15372.8.
 |
 |
The different markets' moves in this environment become quirkier and more short-term.
This means
we will want to use all our best short-term trading tools to supplement
and make
sense of the Peerless signals.
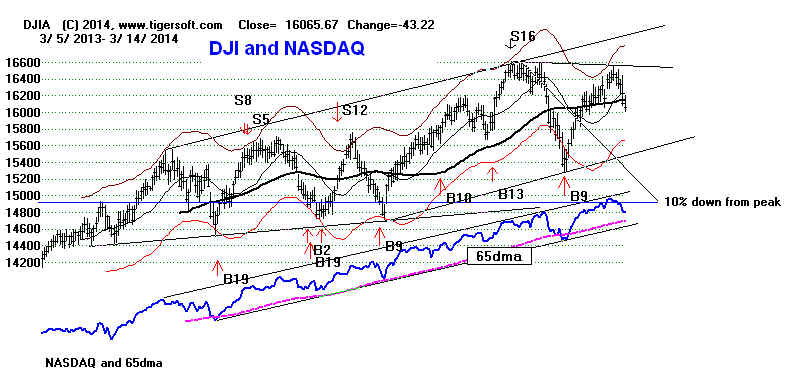
Friday, the
DJI did close below 16100, but breadth was positive and the NASDAQ
and many
secondary stocks are still strongly uptrending. It is important that
SPY and IWM have not fallen below
their 65-dma. Still, their Closing Powers
are
falling, so they are not yet "safe" to buy.
Leading biotechs fell further Friday, however. There is a flight
from well-known
growth stocks to
the safety of dividend paying stocks.
With the DIA, SPY, QQQ
and IWM Closing Powers falling, with the Stochastic-20s
not yet below
oversold (+20), with these ETFs' MACDs on Sells and their
Short-term IDOSC
readings falling, the market still seem svulnerable.
Being hedged now
with bearish MINCP stocks to match any long bullish
MAXCPs seems a reasonable approach. I see no reason
yet to buy a major
market ETF.
--> To
Key Index and Leading Stock Charts: DJI, SP-500, etc.
DJI Chart SPY Chart NASDAQ Chart IBB Chart
IWM Chart
--> 49 -52 MAXCP stocks Bullish MAXCP Stocks (3/14/2014)
--> 145
+68 MINCP stocks Bearish MINCP Stocks (3/14/2014) Bearish
plurality
--> 36 +13 New Highs on NASDAQ 17 -6 new lows.
--> 32
+18 New Highs on NYSE 16 -13 new
lows. Bearish plurality
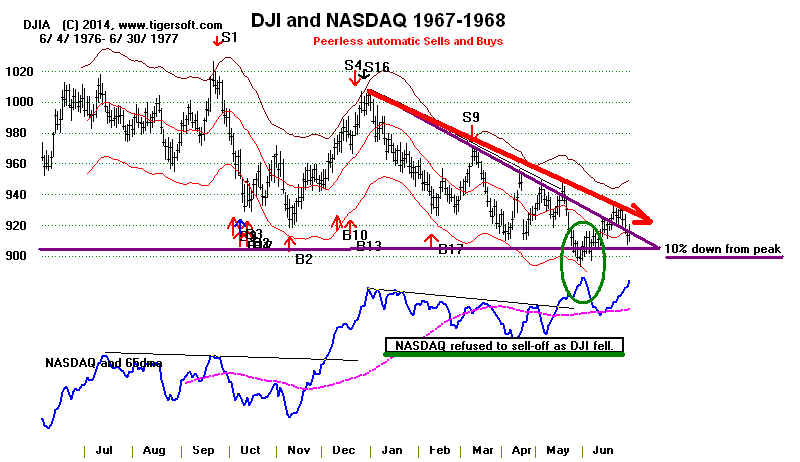
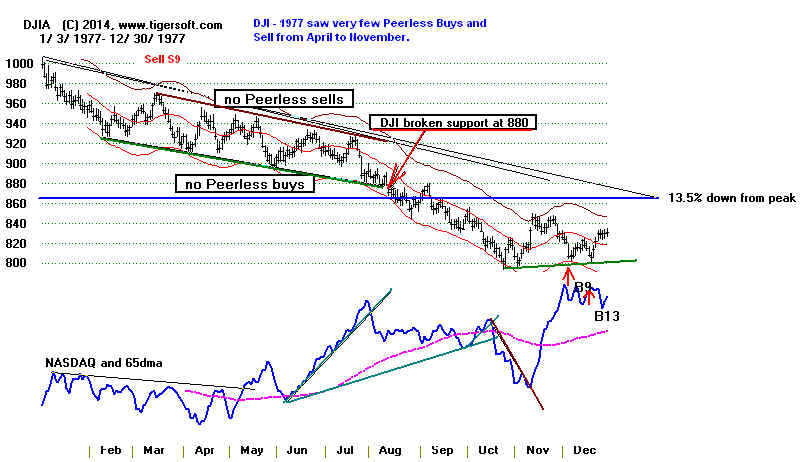
The Lessons of 1977
The best
earlier example of a failing DJI coupled with a very strong NASDAQ
and NYSE
A/D Line comes from early 1977. Like then, as now, we saw
rising
commodity, especially oil and precious metals' prices. Like then, as now,
interest
rates were soon to go back up. Back in 1977, it was not until the
DJI fell
more than 10% that breadth turned weak and not until the DJI
fell more
than 13.5% that the NASDAQ started to suffer. See the DJI-NASDAQ
1976-1977
and 1977 charts below.
 |
 |
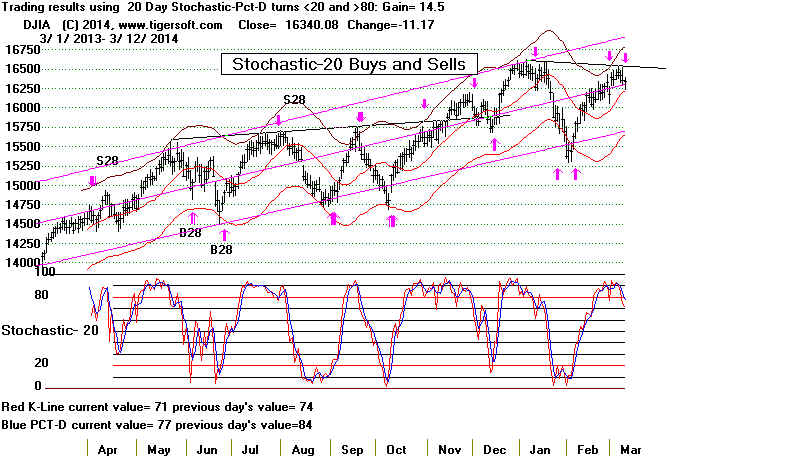
Tiger-Peerless Short-Term Indicators:
Closing Power, Stochastic-20, MACD and Chaiken Idosc
A market
like 1977 may be what lies in store for us now. The primary lesson I drew
from this
period was was that the DJI eventually wins the struggle between it and
the rest of
the market. But it could take many months.
Another
thing to note: in the first half of 1977, the DJI did not fall all the
way down to
the lower band after March, thereby preventing Buy B9s that would
have been
unsuccessful anyway. They would have failed because the DJI
consistently afterwards did not rally close enough to the upper band to get a
Peerless
Sell, something like we just saw in February. In this environment,
one could
still have made quick trades on the long side as long as one also watched
for the
ultimate breakdown by the DJI below the 10%-down-from-the high-level and
watched for
breaks in the short-term uptrends of the NYSE A/D Line, the NASDAQ
itself and
from short-term trading tools.
Until the
end of the year, short-term traders in 1977 and in the DJI needed to use
other
Peerless/Tiger tools than the automatic Peerless Buys and Sells. Recommended
are the
20-day Stochastic, MACD buys and Sells using Tiger and the Chaikin IDOSC
indicator.
See these below.
==================================================================================
OLDER HOTLINES
==================================================================================
3/13/2014 A DJI close below 16100 will probably drop it to 15300.
Closing
Power traders should see that the CP trends are now clearly down.
So, there
appears no reason to hurry in and buy on this weakness. Our Stocks'
Hotline,
which is governed by short-term expectations now, is short about
twice as
many stocks as we are long, having sold the long leveraged ETFs.
The sharp
drop in the current Accumulation Index (IP21) over the last week
is more
likely to indicate we should sell than that we should buy, though
such a
signal does not have enough occurrences in March to be very
certain of
the likely consequences.
--> To
Key Index and Leading Stock Charts: DJI, SP-500, etc.
DJI Chart SPY Chart NASDAQ Chart IBB Chart
IWM Chart
--> 49 -52 MAXCP stocks Bullish MAXCP Stocks (3/13/2014)
--> 145
+68 MINCP stocks Bearish MINCP Stocks (3/13/2014) Bearish
plurality
--> 23 New Highs on NASDAQ 23 new lows.
--> 14 New Highs on NYSE 29 new
lows. Bearish plurality
Note that
the DJI still has not closed below 16100, so intermediate Peerless
traders may
still win out with the "expanded Buy B9". Traders who need to try to
catch every
swing between the upper and lower bands probably acted on the
Closing
Power trend-breaks given the persistent failure of the different indexes
and general
market ETFs to get past their resistance levels. Remember
that the
market is always searching for resistance and support. When it can't
surpass a
resistance level, it goes searching for support, and vice verse.
I did
suggest some profit-taking here. The Stochastic-20 Sells I mentioned last night.
The
megaphone patterns in the DJI, SPY, QQQ and NASDAQ are a late-stage
sign of
excessive speculation. In them, the swings become wilder and wilder.
That means
the next support level may be a big problem, especially with the
bull market
now a full 60 months' old.
I mentioned
that I would become worried if the DJI could not hold up above its
65-dma with
the current "expanded Buy B9". If the current case is going to be like
earlier
such B9s in strong uptrends, then it should not close decisively below
its 65-dma.
If, in fact, it does break that support, then that calls into question the
"expanded Buy B9" here. In that case, I said I would expect a decline to
the
previous
lows where we will see a test of that support.
Well, the
DJI did not close below 16100 today. That's good. The NASDAQ is still
far above
its 65-dma. That's good. And I don't think Russia is going to move
any troops
into the Eastern Ukraine. They want the Crimea because of their
naval base
there. But not the Eastern Ukraine. I believe that they still hope they
can impress
on NATO how provocative and destabilizing in their eyes it would be
for a
far-right Ukraine Gov't. to host NATO missiles pointed at Moscow 475 miles away.
If I'm
right, then the bloodshed in Donetsk and Kharkov will be tolerated if its does
not get
much worse. I certainly could be wrong; the violence in the Ukraine has
been
self-escalating. Donetsk is 49% Russian and 48% Ukraine. How can
both sides
be accommodated peacefully when compromise and tolerance are not
being given
a chance?
What Is The Meaning of A Rapid Decline in The
IP21?
Technically, it is bearish that the Accumulation Index has dropped below its
21-day ma.
Worse, I fear, is how rapidly it has fallen from its highs a week ago.
Rapid big
changes upward in the Accumulation Index can bring Buy B4s.
Should
there be a similar new Sell S4? The Accumulation Index here has
dropped,
from +.161 on 3/5/2014 to +.01 today, 6 days later. How bearish in
history are
such rapid declines of the Accumulation Index?
New Research on Steep and Quick Drop
in IP21
Below is a quick
summary of the results of using a new type of Sell S4 which would
occur when the
DJI is not below the 1% lower band and the IP21 has just fallen by
.16 in 6 trading
days from a level above +.17. For seasonal reasons, no signals are
allowed in
November or December. To simplify getting the results quickly here,
no January sells
were considered. As such, there were 27 instances. 6 would have brought
losses. 18
would have been quite profitable to use as Sells. March instances of this
type of Sell S4s
were not as bearish as those occurring later in the year.
8/2/2013
bad
9/28/2011 good
8/17/09
bad
12/22/2009 2% rally and then decline below the lower band
7/2/2004 excellent
8/29/2002 excellent
2/21/1996 DJI went widows for 3 months
--->3/8/1991 good
8/28/1987 great
--->3/25/1986 a little early, but OK
8/10/1978 early but good
4/16/1956 good
4/17/1949 excellent
6/16/1948 excellent
8/1/1947 good
5/14/1945 flat afterwards for 3 months
7/19/1944 good
6/2/1944 bad
3/27/1944 good
---->3/4/1943
bad
10/4/1940 good
7/25/1939 very good
5/16/1939
bad...quickly reversed by an IP21 B4
8/10/1937 very good
8/6/1935
bad
9/19/1933 very good
7/30/1930 good
|
Why did we
get no Sell S4 signal today with the present rules? The Assume. Index
did drop
below its 21-day ma. The reason is that the current Sell S4 requires there
first be a
DJI rally of more than 8%-9%. The February rally was less.
Still Positive Internal Strength Indicators
DJI
change la/ma
anorak
P-I
IP21
V-I Oct
65-day
Pct Change
-----------------------------------------------------------------------------------------------------------------------------------------------
3/11/14 16351
-67
1.01 .41
+439
-133 .072 -.053
+30 +.165 .029
3/12/14 16340
-11
1.007 .396
+438
-1
.078 + .006 +33
+.076 .032
==================================================================================
==================================================================================
OLDER HOTLINES
==================================================================================
3/12/2014
Remain bullish as long as the Dai's Support at 16100 is not closed
below.
The "expanded Buy B9" averages a 13% gain.
The typical behavior of
the DJI
"V" formation is bullish after two or three weeks of consolidation just below
the breakout
point and down to the 65-dma. The Closing Powers of QQQ
and
and SPY slightly broke their short-term downtrend as they
rebounded from their
rising 21-dma.
The internal strength readings for the DJI of the P-I, V-I, IP21 and
Oct are all
positive. Since 1965, the DJI has risen 66% of the time over the the month
following March
12th and has gained 1.5% on average.
Still Positive Internal Strength Indicators
DJI
change la/ma
anorak
P-I
IP21
V-I Oct
65-day Pct Change
----------------------------------------------------------------------------------------------------------------------------------------
3/11/14 16351
-67
1.01 .41 +439 -133 .072 -.053 +30
+.165
.029
3/12/14 16340
-11 1.007
.396 +438
-1
.078 +-.006 +33
+.076
.032
==================================================================================
But I sense
the pull-back/consolidation is not over. I show below the signs that
low-priced
stock speculation has just gotten much riskier in the last week.
At the very
least, the market needs to work off its over-bought condition.
Note the
pair of new automatic red Sells on TAN based on Stochastic.
In
addition, the Dai's 20-day Stochastic, Pct-D and K-Line have dropped below
80. I
have placed the signals from these on the DDI chart below.
--> To
Key Index and Leading Stock Charts: DJI, SP-500, etc.
DJI Chart SPY Chart NASDAQ Chart IBB Chart
IWM Chart
--> 101 +39 MAXCP stocks Bullish MAXCP Stocks (3/12/2014) Bullish plurality
--> 77
-10 MINCP stocks Bearish MINCP Stocks (3/12/2014)
--> 33 -10 New Highs on NASDAQ 10 new lows. Bullish plurality
--> 32 New Highs on NYSE 21 new
lows. Bullish
plurality
 |
 |
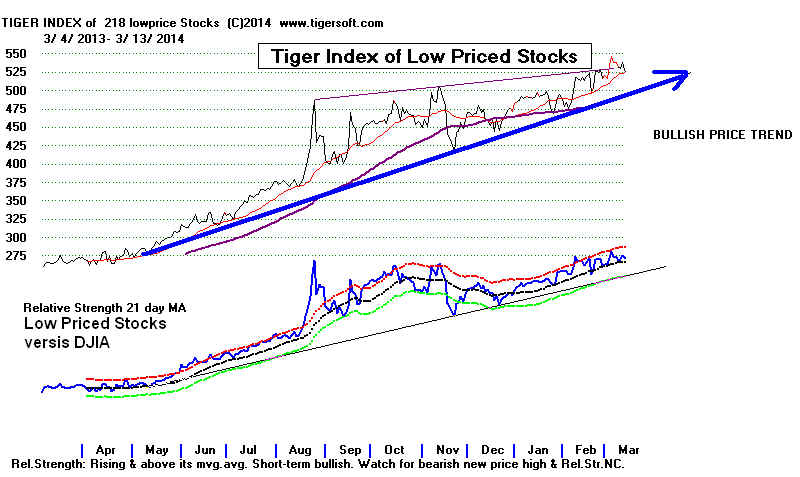
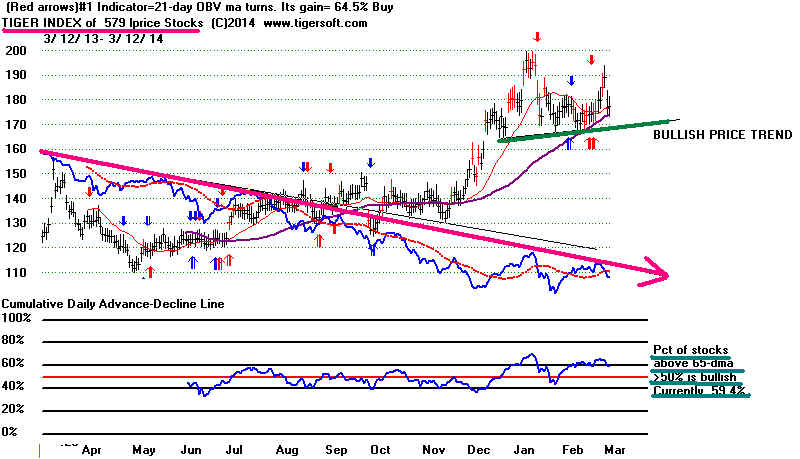
Let's Watch the Tiger Indexes of Low Priced Stocks
The Low Priced, Chinese
and Biotech groups have provided many the biggest gainers this year.
My survey of the
stocks between $1-$8, shows a number of them have had serious declines
in the last week.
Will this take the wind out of their sails or will they quickly return to favor.
I think this will
tell us how robust the speculative energies are now. Let's continue to watch
the Tiger Index
of Low Priced Stocks, $1-$7 (N=579) to see if it hold up above its recent
support. We
don't want to overstay our welcome. Low priced stocks often make a person
wait a long time
to get out even once they break-down late in a bull market.
5-day high 5-day low 3/12/2014
5-day pct change
BLDP 8.25
4.25 5.36
BSPM 3.5
2.15 2.15
CNTF 3.0
2.2 2.27
DPW 2.1
1.19 1.19
FCEL 4.6
2.65 3.37
GERN 4.6
1.5
1.69 -2.71 today
GIGM 1.71
1.40 1.49
-65%
HDY 5.30
1.10 2.19
-3.07 today -60%
HILL 6.0
3.6
3.84
-36%
HOV 6.2
4.8
4.9
HRT 7.0
4.5
5.09
AI/200=185
NVTL 2.80
2.0
2.04
SNTA 6.5
4.5
4.55
ZGNX 4.6
3.5
3.5
==================================================================================
OLDER HOTLINES
==================================================================================
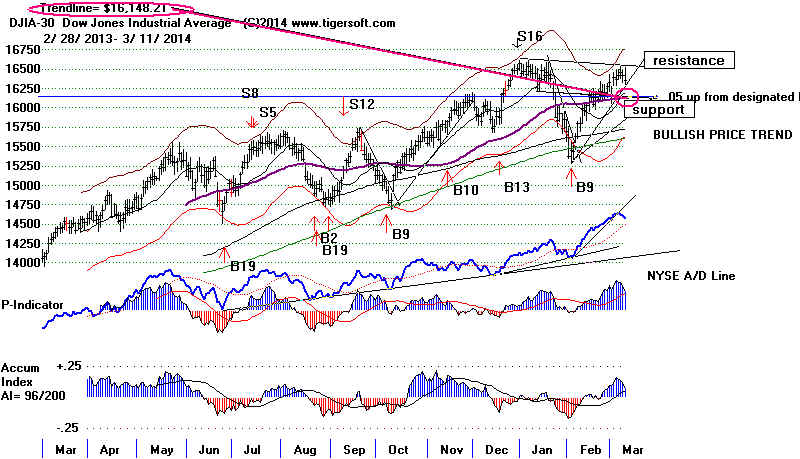
3/11/2014 Remain bullish as
long as the DJI's Support at 16100 is not closed
below.
The "expanded Buy B9", the typical behavior
of DJI "V" formations
and the still
positive internal strength readings of the P-I, V-I, IP21 and OPct lend
hope that this
will be a shallow decline and that it will prove to be a constructive
consolidation.
Still Positive Internal Strength Indicators
DJI change
la/ma
annroc
P-I
IP21
V-I Opct
65-day Pct Change
----------------------------------------------------------------------------------------------------------------------------------------
3/11/14 16351
-67
1.01 .41
+439 -133
.072 -.053 +30
+.165
.029
Watch the current Accumulation Index. It fell by a large amount today.
The IP21's
dropping below its 21-day ma may give us a Sell S4. Whether it does
or not, its
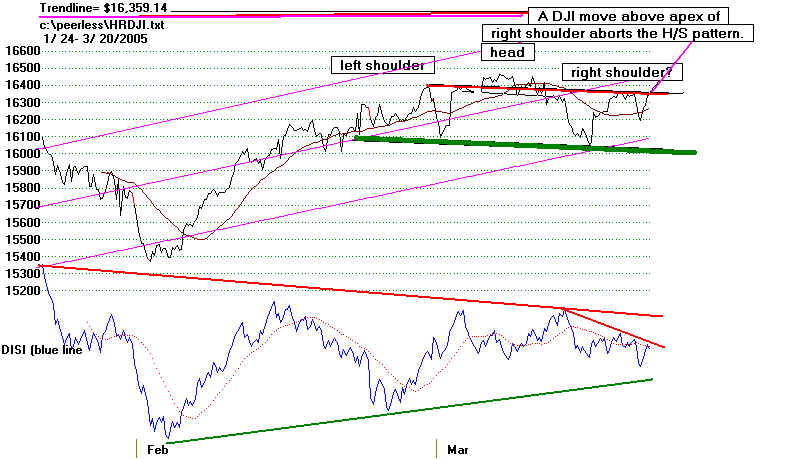
falling below its 21-day ma now with the DJI having failed to make a new
high would look
bearish. It would make the DJI look a lot like when S4s stopped DJI
advances in the
Marches of 1937, 1981 and 2005.
Today's
breadth worsened as the steep A/D Line uptrendline was broken
The markets also
closed substantially below their openings and so the short-term Closing Powers
of DIA, SPY, QQQ, IWM... are all declining.
Professionals have become net sellers for now.
Several of our most Distributed bearish MINCP stocks broke their support
levels. Short-
covering can no
longer hold them up. MINCP stocks now out number MAXCP
stocks.
The number of
bullish looking stocks that warrant consideration for new purchase
has been greatly
reduced.
A "Line in The Sand"
I think we have
to draw a line in the sand, as it were, where a minor pull-back would
start
looking too much like an intermediate-term retreat. Right now the DJI's 21-day
ma
and its rising
65-day ma are nested and so should be good support. This is also
the point at
which the DJI rose more than 5% from its bottom, and so took on
a bullish
momentum despite the earlier Sell S16. However, a close below
16100
would make the
current chart appear to look different than earlier "expanded
B9s" in a
rising market. Odds would then shift for the market's outlook. The
stage then would
be set for a re-test of 15300-15400.
Watch the DJI relative to its
65-dma and
the Current Accumulation Index (IP21) relative to its 21-dma
--> To
Key Index and Leading Stock Charts: DJI, SP-500, etc.
DJI Chart SPY Chart NASDAQ Chart IBB Chart
IWM Chart
--> 62 -44 MAXCP stocks Bullish MAXCP Stocks (3/11/2014)
--> 87
+20 MINCP stocks Bearish MINCP Stocks (3/11/2014) Bearish plurality
--> 43 -33 New Highs on NASDAQ 10 new lows. Bullish plurality
--> 29 New Highs on NYSE 20 new
lows. Bullish
plurality
"Expanded
Buy B9s" are rare. There are only three earlier cases of it appearing in
a market
with a rising 65-dma and 200-dma. the earliest case was in December 1928.
In this
case, the DJI did not stall out before it surged to new highs. It appears
our case is
not so strong. The next two 1933 instances followed a long bear market.
But the key
moving averages were rising strongly. Here the DJI rose for
six weeks
after the B9s before breaking its 65-dma. The 1943 Buy B9 was
different
from our case in that it took place below both a falling 65-day and
200-day ma.
The conclusion I reach, based on these few cases that resemble
the present
"expanded B9" is that we should not now see a clear violation of the
65-dma by
the DJI if this case is going to play out like the first three cases
below.
Earlier Expanded Buy B9s
#1 12/11/1928 very good. Gain = +.161 65-day up-pct = .126
la/ma ann-roc PI PI-ch IP21 V
Opct 65-dayup-pct
.958 .263 -24 +18 .028 -511 .13
.126
Also already a Buy B2.
------------------------------------------------------------------------------
#2 7/24/1933 94.3 Gain = +.054 65-day up-pct = .304
la/ma ann-roc PI PI-ch IP21 V Opct 65-dayup-pct
.932 .165 12 49 -.145 -528 .082 .304
Also A Buy b6
----------------------------------------------------------------------------[--
#3 8/1/1933 92.7 Gain = +.072 65-day up-pct = .268
la/ma ann-roc PI PI-ch IP21 V Opct 65-dayup-pct
.927 -.641 -19 9 -.171 -630
.012 .268
Also a buy B16
-------------------------------------------------------------------------------
#4 11/8/1943 131.7 164 Gain = +.254 65-day up-pct = -.038
la/ma ann-roc PI PI-ch IP21 V Opct
65-dayup-pct
.958 -.527 158 32 -.261 126
-.225 -.038
Already a Buy B9 under previous rules
-------------------------------------------------------------------------------
Avg.Gain = +.133
Expanded Buy B9s: 1928-2013
==================================================================================
3/10/2014 Patience. Expect More Consolidation and Reduced Volatility
After a week or
two, if the good breadth continues, the "expanded B9" is not
reversed and the
internal strength reading for P-I, V-I, IP21 and OPct stay
positive on the
DJI, I think we can a 5%-10% lunge upwards to new highs.
Right now
volatility is waning. Consolidation just below resistance seems the governing
technical
principle now The different markets have reached their strongest resistance
levels. But
cannot breakout. The DJI, which Peerless focuses on, seems unable
for now to get
past 16550. But its "V" pattern is usually favorable unless the
Accumulation
Index drops all the way back below its rising 21-day ma. Most often,
after a period of
consolidation, these patterns produce upside breakouts.
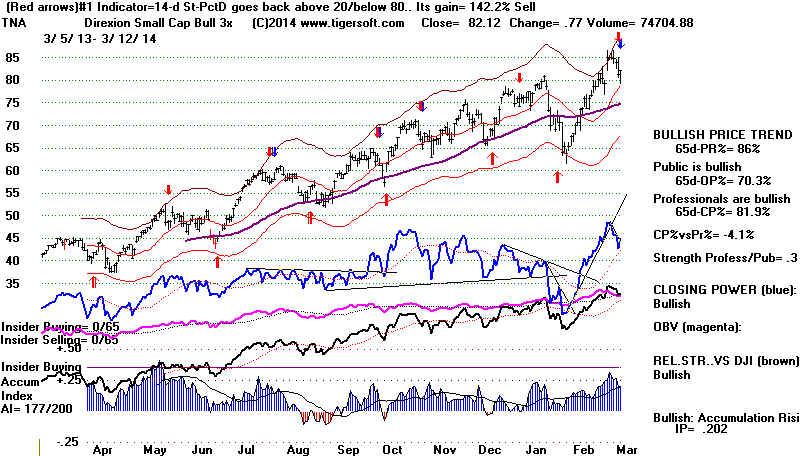
IWM and TNA also
show bearish red popsicles. It's best to take profits in them.
But I said
yesterday that I thought the pull-back will not be deep. The DJI's most likely
support is about
2% lower between 16000 and 16200, I believe.
Since 1965, the
DJI rallies only 53.2% over the next two weeks, but 66% of
the time over the
next two months. Over the past year, Mondays have
risen only 46.9%
of the time. Wednesdays are worse, rising only 43.1% of
the time.
But Tuesdays, Thursdays and Fridays are up 63.4% of the time.
Daily price
change volatility is diminishing and may wane some more.
I think the A/D
Line will firm up again dramatically if we are going to see
a breakout.
Right now, it is retreating reluctantly..
--> To Key Index and Leading Stock Charts: DJI, SP-500, etc.
DJI Chart SPY Chart NASDAQ Chart IBB Chart
IWM Chart
--> 106 -36 MAXCP stocks Bullish MAXCP Stocks (3/10/2014) Bullish
plurality
--> 67
+5
MINCP stocks Bearish
MINCP Stocks (3/10/2014)
--> 76 +5 New Highs on NASDAQ new lows. Bullish plurality
--> 46 -45 New
Highs on NYSE +7 new lows. Bullish plurality
==================================================================================
OLDER HOTLINES
==================================================================================
3/7/2014 The "expanded Buy B9" is boosting the DJI and Bank
Stocks.
But 10-year interest rates are starting to rise, the V-Indicator has turned down
in over-bought territory, the DJI has not achieved a
breakout and the NASDAQ
seems unable to surpass it rising resistance line.
Despite the "B9" we should worry, I think, about the NASDAQ's megaphone pattern.
In particular, the weakening biotechs may cause speculators generally a change of
heart.
There's a limit to how far even biotechs can rally and how much the Government
may be willing to pay for pills under the new Obama Care.
We see lot of warnings in the form of red popsicles in the key ETFs. The
steep uptrendines in the Closing Powers have mostly been broken. But such
breaks are more potent after they fail to confirm a new high. That has not
happened yet. Breaks in CP confirmed uptrendlines often means
"consolidation"
rather than "retreat".
--> To Key Index and Leading Stock
Charts: DJI, SP-500, etc.
DJI Chart SPY Chart NASDAQ Chart IBB Chart
IWM Chart
--> 142 -70 MAXCP stocks Bullish MAXCP Stocks (3/7/2014) Bullish
plurality
--> 62
+16
MINCP stocks Bearish
MINCP Stocks (3/7/2014)
--> 71 - 40 New Highs on NASDAQ 7 new lows. Bullish plurality
--> 91 -26 New
Highs on NYSE 6 new lows. Bullish plurality
The good news is that the NYSE A/D Line remains in an uptrend, the V-Indicator
is positive, the current Accumulation Index is above its 21-day ma and there
is no DJI head/Shoulders pattern. So a major March top is unlikely for the DJI
and, since history shows how closely bank stocks correlate with Peerless, for
the Big Banks. We must watch to see if the NASDAQ continues to weaken
relative to the DJI
The fact remains, the NASDAQ's broadening pattern is dangerous without an
upside breakout above the rising resistance. It shows a speculative market and
often there is not much support underneath the market for a long ways down. Added
to that, the leading biotechs keep selling off on high volume and many show a
Closing
Power that is near the stock's yearly lows. As we know from the 1999-2000
speculative top, Crude Oil in 2008 and Gold/Silver stocks 18 months ago, it is the
Closing Powers that turn down first and start making new lows ahead of prices.
This is how over-speculated, "bubble" stocks top out and turn down after a wild,
public-buying binge.
Dangerous to Your Health
Biotechs are now dangerously priced. Consider GILD. It has a great
hepatitis drug,
which another company (VRUS) developed before GILD bought them out. Lots of
people are starting to question if GILD's CEO should now be worth a Billion
because its Hepatitis Drug's treatment for 12-weeks sells for $84,000.
Biotechs
are now being priced as though there will be no populist backlash against
biotech profiteering. They are probably correct given the current Congress and
President. But investors should look further ahead, too.
Gilead
CEO Becomes Billionaire on $84000 Hepatitis Drug
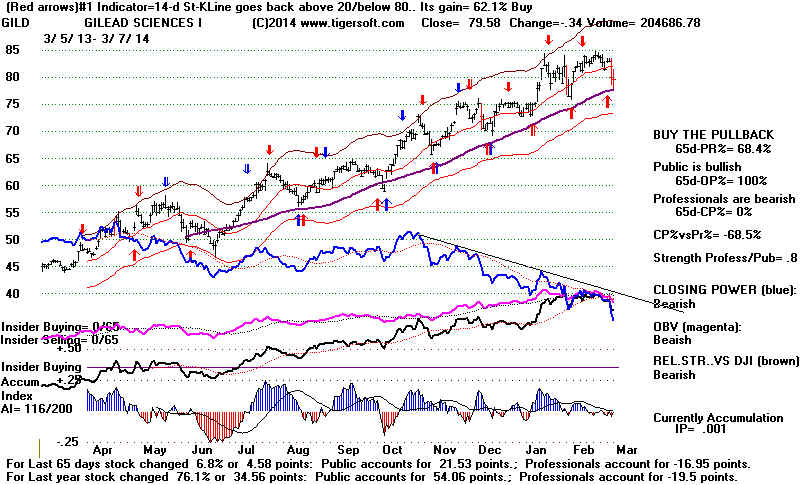
A number of leading biotechs over $40 now show Closing Power
close to or at
their 12 month lows, thus far ahead of price: AEGR,
BAX, BBH, CELG, GILD,
PCYC and PCYC. A few have already fallen through a
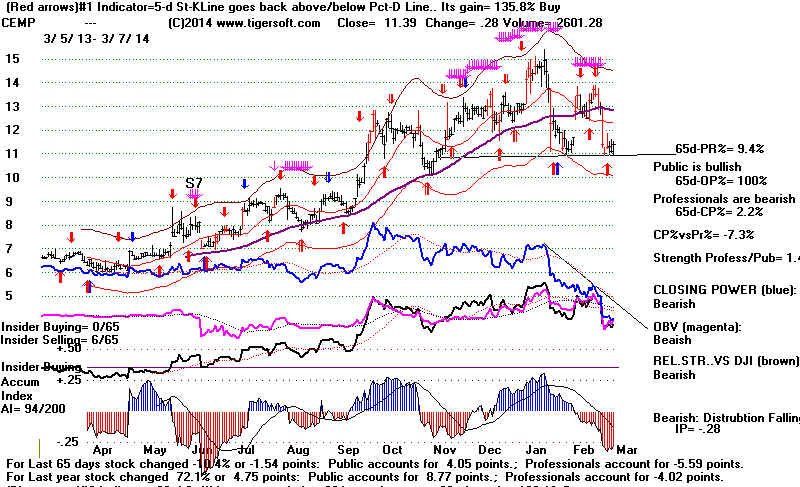
trap-door. CEMP seems
to be on the verge of doing that. It has only 38 employees, But its lead
drug to treat
hospital-born bacterial pneumonia is in Stage -III. Why are
Professionals dumping the stock? As long as the Closing Power is falling, it
must be considered a candidate for a serious breakdown.
Watch The DJI's Accumulation Index.
If It Falls below Its 21-dma, We May Get A Sell Sell S4
The DJI's "V" pattern is more auspicious. Compare the V-pattern now with
the "V" pattern of last September-October. Back then it took a two week
consolidation to prepare a run to new highs. I suspect that's what the DJI
must do now. Study the DJI-formations in
history. We probably should
mostly pay attention to the cases where the DJI first retreats back below
the lower band and then rapidly recoveries back to the old highs. After a pause
and consolidation, V-formations usually bring breakouts unless the internal
strength indicators have turned negative or we get a Sell Signal.
The two notable exceptions to the rule that V-formations bring breakouts are
December 1976 and October 2007. In both cases, the internal
strength indicators
are were positive at the top. So, Sell S4s are important. They occur when the
Accumulation Index falls below its 21-day ma. These can occur in the year of
mid-term Elections, as February 1994 shows.
==================================================================================
OLDER HOTLINES
==================================================================================
3/6/2014 Give The Market a 'Chance to Dance Higher'. For now,
the
"expanded Buy B9" seems to be living up to its advanced billing, where its
past signals have gained 13% on the DJI.
The A/D Line remains very bullish. Professionals are
not yet selling. March
is not usually a market of tops. The NASDAQ could
still breakout above its
rising resistance line and go hyperbolic to 5000. On the NYSE, the number
of new highs expanded. TNA still seems a good ETF to
play the market now.
But don't over-look high Accumulation breakouts among the Bullish
MAXCPs.
--> To Key
Index and Leading Stock Charts: DJI, SP-500, etc.
DJI Chart
SPY Chart
NASDAQ
Chart IBB Chart
IWM Chart
--> 212 -67 MAXCP stocks Bullish MAXCP Stocks (3/6/2014) Bullish
plurality
--> 46
+1
MINCP stocks Bearish
MINCP Stocks (3/6/2014)
--> 111 -1 New Highs on NASDAQ 8 new lows. Bullish plurality
--> 117 +35 New Highs on NYSE 3 new
lows. Bullish
plurality
Biotechs have weakened somewhat, but big banks, a good
measure of Fed intentions,
all rose today. It's bullish that leveraged BAC and leveraged semi-conductors
generally advanced. True, gold and silver rose; so, this could bring on a much
weaker
Dollar and then higher interest rates. However, TNX is still below its falling 650dma
at 2.8%,
For now, the Bullish MAXCP stocks remain strong.
This confirms the Buy B9, I think.
There just are not many Bearish MINCP stocks to
consider much shorting
for hedging purposes.
The Dangers of Macho Election-Year Posturing
You Probably Do Not Know How Close We Came to WW-III in 1962?
China will be likely be the beneficiary as the US risks a new Cold War, with Obama and
Kerry
trying to claim the high moral ground in condemning Russia for invading the Crimea
based on lies and trumped up charges. As I've said before, there is no way Russia
will be dislodged from the Crimea, its naval base there pre-dates the founding of the
United States.
But all this heavy-handed posturing could become very dangerous. What would be very
dangerous would be if new Ukrainian Government were to join NATO and point missiles at
Moscow, just 467 miles away from Kiev. This would bring on a highly dangerous reverse
Cuban Missile Crisis! The DJI fell 27% in the first half of 1962.
For now, the stock market seems to like all this macho posturing. As always, it sees
profits in war preparations. It's the actual fighting it reacts badly to. If you
doubt this,
see how the DJI rose in 1916 but fell apart in 1917; how it rose in 1939 and much of 1940
but fell apart with the German
torpedoing of the US Greer in 1940 and then
with the US Oil Embargo of Japan, which was the prelude to Japan's attack on the US.
Or how the DJI rose throughout the 1950s and until 1962 when the Cuban Missile
Crisis came very much closer to starting a nuclear exchange than most Americans realize.
Most do not know how close we came to war. Read the story of how Vasili Arkhipov
single-handed
stopped the Soviet submarine K-19
from launching a nuclear-headed torpedo at the height of the US embargo
of Cuba in 1962.
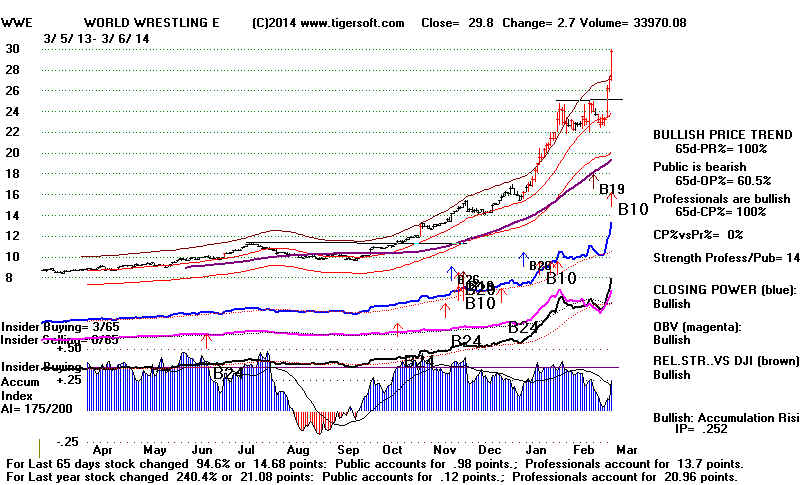
MACHO is In Style Now.
WWE
(WorldWide Wrestling) has found a way to cut out the middle-man, lower prices
for
consumers and make money for shareholders. If successful, its model will be
closely
studied by other companies that still hold the rights to their media content.
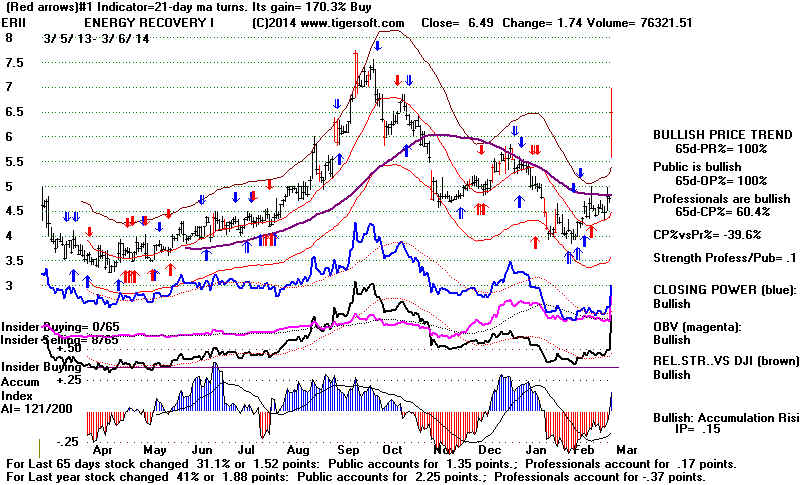
Long-Term Drought and De-Salinization
Leading de-salinization stocks are starting to move. This is another story-area
for investors that will surely quench the thirst for some big profits long-term.
The four best de-salinization stocks I can find are CWCO, ERII, TTEK and LIQT.
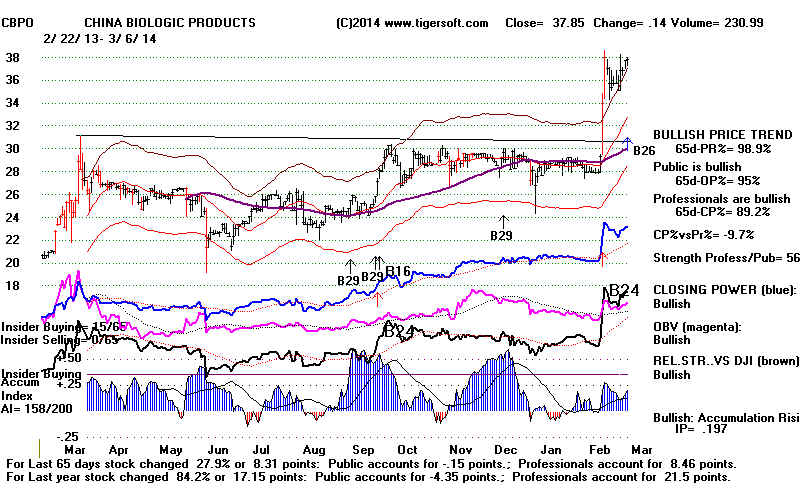
China Looks Better and Better to Speculators
Look at how low priced Chinese stocks jumped today. CPSL rose 94% today. Other
big gainers among Chinese stocks were: ZA 2.12 +13%, YGE 6.78 +12%, TSL 18.19
+ 11%.
None showed much prior Accumulation. So, they are probably not tightly held and
should quickly give back their gains. China will surely emerge as the victor
of a new Cold
War between Russia and the US. CBPO, China Biologic Properties,
on the other hand
shows lots on insider buying and should run much higher on a move past 38.
==================================================================================
OLDER HOTLINES
==================================================================================
3/5/2014 Give The Market a 'Chance to Advance'. The "Expanded Buy
B9"
has caused a number of our Bullish MAXCP stocks to explode to new highs. This
is entirely in keeping with a late-bull market small cap and NASDAQ vertical ascent.
A number of high Accumulation NASDAQ stocks are running upwards ahead of
the slower moving and lagging DJI.
Positive Internal Strength Indicators
DJI change
la/ma
annroc
P-I change IP21
V-I
Opct 65-day Pct Change
----------------------------------------------------------------------------------------------------------------------------------------
3/5/14 16360
-35 1.02
.735 +695
+101 +.161 +99
.255 .016
3/4/14 16396 +228 1.025
.520 +593
+134 +.115 +60
.234 .020
3/3/14 16168 -124 1.013
.239 +458
-124
+.095 +12 .115
.005
2/28/14 16322 +49
1.024
.436 +582
+109 +.096 +41
.203 .015
2/27/14 16273 +75
1.023
.258 +473 -21
+.076 +15 .095
.016
2/26/14 16198 +19
1.019
.270 +493
+103 +.057 +20
.091 .018
All our key internal strength indicators remain positive.
This makes it hard
for a Sell signal of any kind to appear. It makes it very hard to get a top before
a DJI decline of more than 15%,
--> To Key Index and Leading Stock
Charts: DJI, SP-500, etc.
DJI Chart
SPY Chart
NASDAQ
Chart IBB Chart
IWM Chart
--> 279 -82 MAXCP stocks Bullish MAXCP Stocks (3/5/2014) Bullish
plurality
Quite a few low
priced stocks (<20) with IP21>.33 produced Buy B12s and new highs
this week.
See the charts of MXWL, PPHM, RENN, GRO, RFMD, and NPD in the
Bullish MAXCP
stocks tonight.,
--> 45
+1
MINCP stocks Bearish
MINCP Stocks (3/5/2014)
--> 113 -78 New Highs on NASDAQ 8 new lows. Bullish plurality
--> 78 -124 New
Highs on NYSE 4 -5 new lows. Bullish plurality
When one looks back at stock market history, one is struck by
how nearly always a
major top requires months of Advance Decline bearish diivergence and/or a
negative readings from either the P-Indicator, Accumulation or V-Indicator
with the DJI at the upper band. I count 21 major DJI sell-offs of more than 15%.
Negative Non-Confirmations of a DJI advance to the upper band were the way
bull market normally signed off. The NNCs came most frequently from
the V-Indicator at these major tops.
Frequency of NNCs at Major Market Tops: 685.5-566
PI<0
1929
1937 1939 1957
1969 1972 1980
1987 (8)
IP21<.008 1929
1960 1961 1966
1972
1980 1984
1987 (8)
VI<= 0 1929
1937 1939 1957 1960
1969 1972 1980 1981 1984 1987 (11)
OPct<0
1939 1957
PI<0
1990
2000 2007
total
11
IP21<.008
1998 2000
total 10
VI<=0
1990 1998 2000 2007
2011 total 16
OPct<0
Tops before DJI Declines of
More Than 20%: 1928-2014
(C) 2014 William Schmidt, Ph.D. www.tigersoft.comLength of A/D Resulting Bear Market
Divergence
---------------------------------------------------------------------------------------------------------
1 7
months 1929-1932
9/3/1929-7/8/1932 (35 months) 381.2 to 41.2
9/3/1929-2/27/1933
381.2 to 98.1
Sells at top: Sell S7, S12, S9
4/30/1969: la/ma 1.051, P= -14,
IP21 =-.126, V= -351 Opct= + .146, 65-day pct
ch= .281
---------------------------------------------------------------------------------------------------------
2 6
months 1937-1938 8/13/1937-
3/31/1938 (7 months) 189.3-98.9
Sells at top: Sell S4,S7,S9,S8
8/13/1937: la/ma 1.024, P= --2 , IP21 = .042, V=
-43, Opct=+.279, 65-day pct ch= .099
---------------------------------------------------------------------------------------------------------
3 8 months
1939
11/9/1939 - 4/11/1939 (
months) 158.1- 123.8
No Sell at top:
Later S16 12/30/1939 - 4/11/1939
154.4-123.8
and later still: S12, S3
12/30/1939: la/ma 1.029, P= --4 , IP21 = .046, V= 0, Opct=- .28, 65-day pct ch= .151
----------------------------------------------------------------------------------------------------------
4 8 months
1939-1942
9/12/1939-4/28/1942 (31 months) 155.9-92.9
Sell at top: Sell S9...later S16, S1
9/13/1937: la/ma 1.095, P= -43 , IP21 = .138, V=+56, Opct=+.326, 65-day pct ch= .107
---------------------------------------------------------------------------------------------------------
5 None
1946
5/29/1946-10/9/1946 (5 months) 212.5-163.1
H/S
Sell S5,S4
529/1946: la/ma 1.029, P= +64 , IP21 = .269, V=+43, Opct= +.375, 65-day pct ch=
.142
----------------------------------------------------------------------------------------------------------
6 16 months
1957
7/12/1957- 10/22/1957 520.8-419.8
Sell S7, S9, S4
7/12/1957: la/ma 1.022, P= --40, IP21 = .062, V=
-214,
Opct=- .248, 65-day pct ch= .078
----------------------------------------------------------------------------------------------------------------------------
7 8
months 1960
1/5/1960 - 10/25/1960 685.5 - 566.0
Sell S12, S16, S15, S1
7/12/1957: la/ma 1.018, P= +4, IP21
=-.038, V= -170, Opct=+ .099, 65-day pct ch= .085
----------------------------------------------------------------------------------------------------------------------------
8 5 months
1961-1962
11/16/1961-5/25/1962
734.3 - 536.7
Early S9, S16 (nearly perfect)
8/3/1961: la/ma 1.025, P= +34, IP21 =- .042, V= +6, Opct= + .378,
65-day pct ch= .058
-----------------------------------------------------------------------------------------------------------------------------
9 22 days
1966
2/9/1966-10/7/1967
995.15-744.32
Sell S4, S12
1/6/1966: la/ma 1.025, P= +34, IP21 =- .042, V= +6, Opct= + .378,
65-day pct ch= .058
-----------------------------------------------------------------------------------------------------------------------------
10 none at top
1968-1970 12/3/1969-5/26/1970
985.21 - 631.16
Sell S1
4 months 1969-1970
5/14/1969-5/26/1970
968.85 - 631.16
Sell S9,
S3
4/30/1969: la/ma 1.025, P= -30, IP21 =+ .083, V=
-1, Opct= + .219, 65-day pct ch= .01
----------------------------------------------------------------------------------------------------------------------------
11 7
months 1972-1973
1/11/1973 - 12/6/1974
1051.7 -
577.6
Sell S1, S9, S4, S12
1/11/1973: la/ma 1.024, P= -96, IP21 =+ .002, V= -2, Opct= + .059, 65-day pct ch= .117
----------------------------------------------------------------------------------------------------------------------------
12
none
1976-1978 9/21/1976 -
2/28/1978
1014.79 - 742.12
Sell S1, S4, S16
9/21/1977: la/ma 1.033, P= +178, IP21 =+.181, V= +2, Opct= + .18,
65-day pct ch= .012
---------------------------------------------------------------------------------------------------------------------------
13
6 months 1980
2/13/1980 -
3/27/1980 903.84 -
759.98
Sell S4, S9, S15
2/13/1980: la/ma 1.028, P= -26, IP21 =- .01, V= -1, Opct= + .212, 65-day pct ch= .12
----------------------------------------------------------------------------------------------------------------------------
14
7 months 1981-1982
4/27/1981 - 8/11/1982
1024.05 - 777.21
Earlier S9s, Sell S4, S7, S15
4/27/1981: la/ma 1.02, P= +11, IP21 =+.026, V= 0, Opct= + .217, 65-day pct ch=
.098
---------------------------------------------------------------------------------------------------------------------------
15
7 months 1984
1/9/1984 - 7/24/1984
1286.22 - 1086.57
Sell S4, S12
1/9/1984: la/ma 1.021, P= +36, IP21
=+.007, V=-1, Opct= - .169, 65-day pct ch= .04
--------------------------------------------------------------------------------------------------------------------------
16
5 months 1987
8/25/1987-10/19/1987
2722.42 - 1738.74
Sell S4
Later S8, S9, S12 10/2/1987-10/19/1987
2640.99 - 1738.74
10/2/1987: la/ma 1.026, P=
-56, IP21
=- .017, V= -7, Opct= + .072, 65-day pct ch=
.095
----------------------------------------------------------------------------------------------------------------------------
17
7 months 1990
7/17/1990-
10/11/1990 2999.75
- 2365.1
Sell S9,
S8, S5
7/17/1990: la/ma 1.032, P= -1, IP21 =+ .024, V=
-4, Opct= + .414, 65-day pct ch= .09
---------------------------------------------------------------------------------------------------------------------------
18 4 months
1998
7/17/1998 - 8/31/1998
9337.97 - 7539.07
Sell S9, S12
7/8/1998: la/ma 1.03, P=+2, IP21 =- .025, V= -17, Opct= + .061, 65-day pct ch= .021
---------------------------------------------------------------------------------------------------------------------------
19 18 months
2000-2003
1/14/2000 - 3/11/2003
11722.98 - 7286.27 (10/9/02)
Sell S9, S12. S15, S4
1/7/2000: la/ma 1.021, P=-23, IP21 =- .028, V= -59, Opct= + .356, 65-day pct ch= .088
----------------------------------------------------------------------------------------------------------------------------
20
4 months 2007-2009
10/9/2007 - 3/9/2009
11722.98 - 6547.05
Earlier Sell S9 and S5; concurrent S2, S4
7/19/2000: la/ma 1.028, P=-51, IP21 =+ .024, V= -131, Opct= + .054, 65-day pct
ch= .096
----------------------------------------------------------------------------------------------------------------------------
21
2011
5/2/2011 - 10/3/2011
12807.36 - 10655.3
Sell S5, S8
5/2/2010: la/ma 1.028, P=+212, IP21 =+ .147, V= -17, Opct= +
.349, 65-day pct ch= .068
Later S9V
7/21/2010: la/ma 1.025, P=+269, IP21 =+. 085, V= -51, Opct= +
.005, 65-day pct ch= .042
---------------------------------------------------------------------------------------------------------------------------- |
===================================================================================
3/4/2014
Closing Power Is Exceptionally strong
The Unusual Momentum Favors More of An Upside Run.
TNA looks like the best ETF play for a Nasdaq vertical accent run to
5000.
The "expanded Buy B9 is proving its worth. The simplicity of just
waiting for an A/D Line uptrtend-break or a Closing Power uptrend-line break before
taking long profits is also being vindicated. Small caps are now the leaders.
--> To Key Index and Leading Stock
Charts: DJI, SP-500, etc.
DJI Chart
SPY Chart
NASDAQ
Chart IBB Chart
IWM Chart
--> 371 +111 MAXCP stocks Bullish MAXCP Stocks (3/4/2014) Bullish
plurality
--> 44
-1
MINCP stocks Bearish
MINCP Stocks (3/4/2014)
--> 191 +113 New Highs on NASDAQ ? new lows. Bullish plurality
--> 202 +107 New Highs on NYSE 9 -6 new
lows. Bullish
plurality
We saw quite a recovery today. The NASDAQ has soared
to a new high and
closed at 4351.97. A move by it above 4400 would likely start a swift vertical
ascent
to 5000. The NYSE and S&P
both made a new highs and completed bullish inverted
head/shoulders pattern. The OEX close right at its
December and January highs.
The lagging DJI closed at a a downtrending resistance line
drawn through its December
and January peaks.
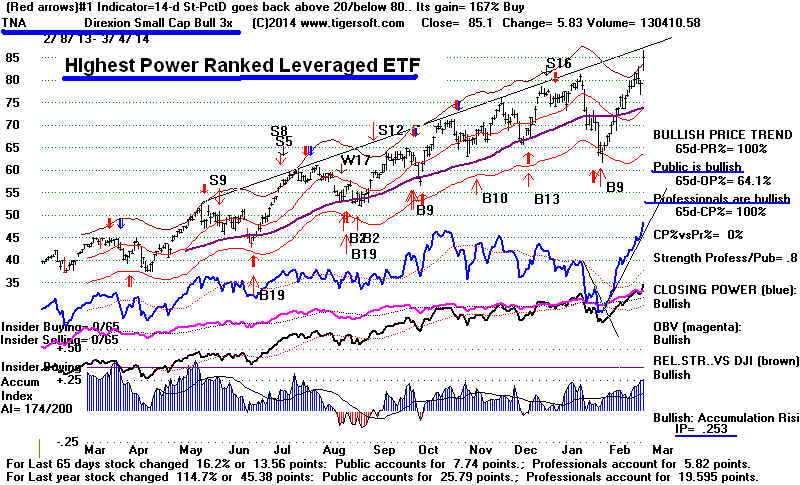
The Best Leveraged ETFS Now.
Running the Tiger Power Ranking program now against the leveraged ETFs
should give us a good idea where to place aggressive trading money. TNA +5.83
the 3x Small Cap ETF is the highest Power Ranked. It appears to be on the verge of
moving past its rising resistance line. Its internals are superb. AI/200=174,
IP21 = .253. Both Opening and Closing Power are rising. URTY+6.79
-Russell-2000-Ultra
looks very similar. The third highest Power Ranked is TQQQ +2.59
There is no evidence yet that Putin wants to force a showdown over the Easter Ukraine
region.
The Russian ETF, RSX, even rallied. Perhaps, cooler heads and diplomats will win
out.
Obama's solution, a billion dollar loan to the new Ukrainian government, should bring
much needed stability and public safety if the Svoboda tough guys go back home.
Recall how Hitler rose to power with much help from the Brown Shirt street thugs
A key question now: Can
Ukraine Control Its Far Right Ultranationalists? How
popular are they when elections are next held? Will they accept the result and calm
down? Will their party be given police powers in the new government? Giving a
a billion dollars to these extremeists seems absurd? How can that be avoided?
==================================================================================
OLDER HOTLINES
==================================================================================
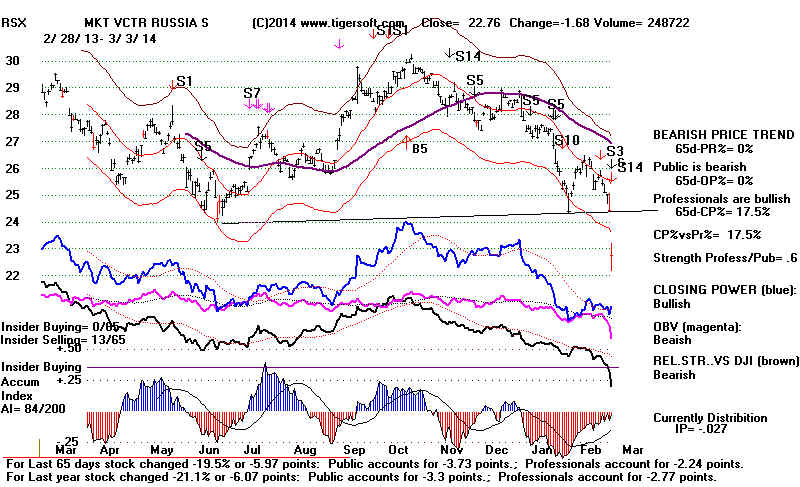
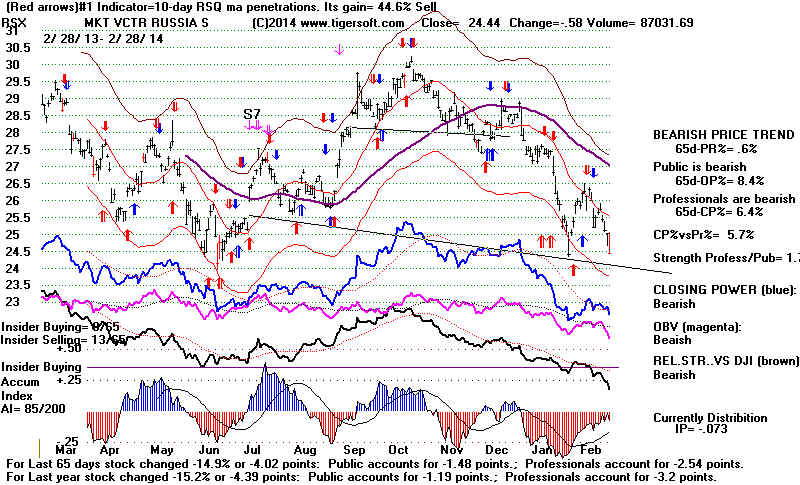
3/3/2014 Russia has its
hands full digesting the Crimea and the consequences
of
its re-taking it nack by force. RSX's sharp break today is the way the West plays
financial
hardball with the Kremlin. As expected, the US has responded verbally and
diplomatically, but
not
militarily. US interests are not at stake presently. Russia has had de jure or
de facto
control of the Crimea for almost as long as there was a USA. We'll keep watching
this
chart
to see when the crisis over.
Cooler Heads
It
will take a while for the players to sort through the complications of the civil strife
in
the rest of the Ukraine. But as long as there is no Russian military action in
Eastern Ukraine,
Western Europe, the US and NATO will likely accept the Russian control of the
Crimea.
The
rebound in the Futures today partly reflects the return of control to "cooler
heads"
both
there and 10000 miles and 9 time-zones away back in New York.
Professionals started buying after 4 hours of selling today. The Opening
Powers decline in
the
key ETFs - DIA, SPY, QQQ and IWM - has largely
been matched by the Opening Power's
rise.
Now tomorrow we get to see with a much higher opening, if the Professionals
will
continue to buy even though the DJI has reached its falling resistance-line
and
its upper 3% band. The excellent breadth (NY A/D Line, P-I and new highs -
new
lows) are firming up the market. At last, the low interest rates may be getting
some
traction with Main Street.
--> To Key Index and Leading Stock
Charts: DJI, SP-500, etc.
DJI Chart
SPY Chart
NASDAQ
Chart IBB Chart
IWM Chart
--> 263 +17 MAXCP stocks Bullish MAXCP Stocks (3/3/2014) Bullish
plurality
--> 45
+9
MINCP stocks Bearish
MINCP Stocks (3/3/2014)
--> 78
+9 New Highs on NASDAQ ? new lows. Bullish plurality
--> 95 +8 New Highs on NYSE 9 -6 new
lows. Bullish
plurality
The
"expanded" Buy B9 has not been reversed even short-term. The Closing
Powers
are
rising and the A/D Line is uptrending. Next, it may be the DJI will be able to take
out
the
overhead resistance line this coming week. Since 1965, the DJI has risen 70.2%
of
the time over the two weeks following March 3rd. But the upper band will not make
that
easy.
Positive Internal Strength Indicators
DJI change
la/ma
annroc
P-I change IP21
V-I
Opct 65-day Pct Change
----------------------------------------------------------------------------------------------------------------------------------------
3/3/14 16168 -124 1.013
.239 +458
-124
+.095 +12 .115
.005
2/28/14 16322 +49
1.024
.436 +582
+109 +.096 +41
.203 .015
2/27/14 16273 +75
1.023
.258 +473 -21
+.076 +15 .095
.016
2/26/14 16198 +19
1.019
.270 +493
+103 +.057 +20
.091 .018
Commodity Prices in Upswing.
There
is another thing to worry about. It only a matter of time before the
very
sharp rise in commodities, especially food prices, gets press and public attention.
This,
in turn, will likely accelerate the Fed's decommissioning of the FED's QEIII
buying of long-term mortgages. This makes it seems risky now to take on more than
very
short-term long positions.
But
bull markets usually end with A/D Line non-confirmations. And this seems remote
now.
So, perhaps, the expanded Buy B9 and the DJI's surpassing of the 5%-up-level
from the
late
January bottom will bring DJI new highs, after all. If that happens, then there
remains
a
good chance for the NASDAQ to go vertical.
Three New Conditions to
Watch for and
for Me To Test and Write Programs To Flag
2 Bullish New Conditions
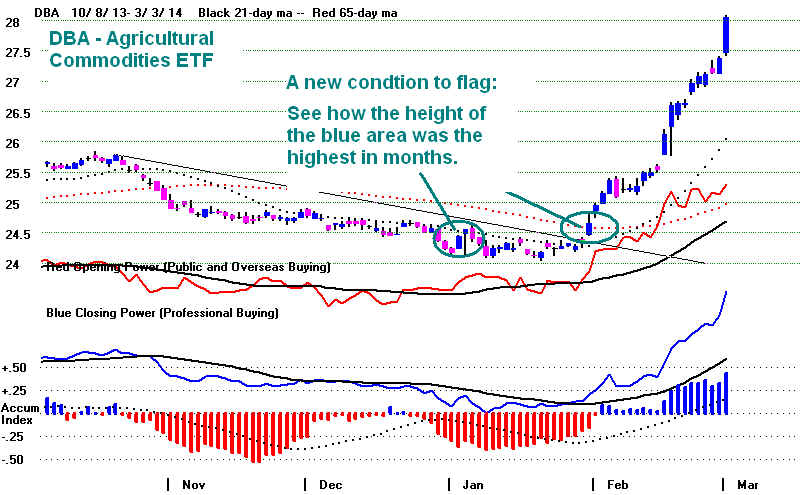
1 New Bearish Condition
==================================================================================
2/28/2014
Russia is not going to back down about the Crimea, which
is
virtually an island, connected very narrowly to the Ukraine. For now, we are in for
a
return to new Cold War. Listen to Boehner
s tough talk: Putin is a "thug:",
The
US military stocks will love this. Russian ETFs will be punished. A 10%
decline might occur, but breadth is very good and US interests are not so evident.
The
real danger is what happens elsewhere in Ukraine. The Russian claim to the
Ukraine is much stronger. I do not expect Obama to admit this. So, we could be
led
back into a new period of war preparations and cold war. In the past, such
crises brought 10%+ sell-offs. It all depends on the diplomats and the American
mass
media coverage. The Russians are not going to turn over the Crimea again
to
the Ukraine as Krushchev (a Ukrainian) did in 1954.
Fortunately, the Operative Peerless Signal is an "expanded B9". Breadth
is
just too good to predict a big market decline. We need a new Peerless Sell signal
to even consider that a possibility. The 6%+ rally up from the late January bottom
is too much to be consistent with setting up a big decline at this time. March tops
are
relatively rare. When they occur, they usually occur because the P-I or IP21 is
negative
at the upper band. All our Peerless key values are positive now. I think we
are safe
for now.
Positive Internal Strength Indicators
DJI change
la/ma
annroc
P-I
IP21 V-I
Opct 65-day Pct Change
----------------------------------------------------------------------------------------------------------------------------------------
2/28/14 16322 +49
1.024
.436 +582
+109 +.096 +41
.203 .015
2/27/14 16273 +75
1.023
.258 +473
-21 +.076 +15
.095 .016
2/26/14 16198 +19
1.019
.270 +493
+103 +.057 +20
.091 .018
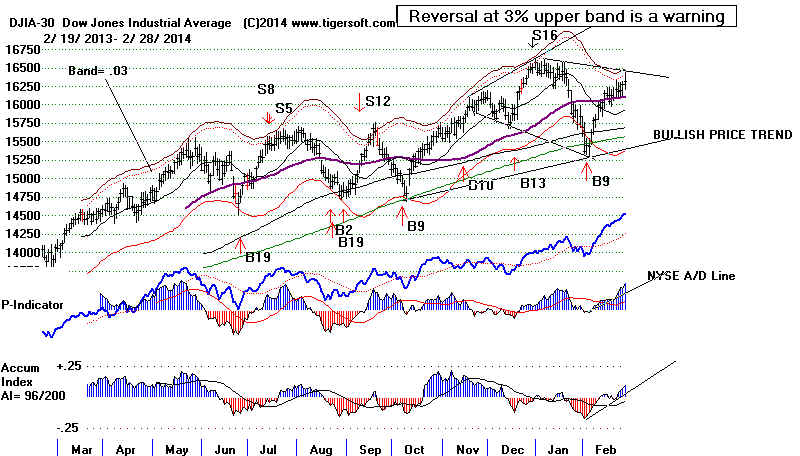
However, the DJI could not get past its well-tested resistance line and it has
nearly tagged its upper 3% band. Looking back at DJI charts for the last 10 years,
you can will see it is rare for the DJI to break above the 3.5% band. But without
a Sell signal, the declines have been limited to only dropping the DJI a little
below the 21-day ma.
The Ukrainian Crisis looks like it will bring such a pull-back. However, the
Closing Power and A/D Lines have not broken their uptrends. Our Tiger Stocks'
Hotline is fully hedged while we wait for Peerless to give a Sell Signal or for breaks
in these uptrends. There are times to take risks in the market. This is not
one of them.
Stock prices for the moment are now dependent upon political rather than market forces.
--> To Key Index and Leading Stock
Charts: DJI, SP-500, etc.
DJI Chart
SPY Chart
NASDAQ
Chart IBB Chart
IWM Chart
--> 246 +9 MAXCP stocks Bullish MAXCP Stocks (2/28/2014) Bullish
plurality
--> 54
+9
MINCP stocks Bearish
MINCP Stocks (2/28/2014)
--> 78
+9 New Highs on NASDAQ ? new lows. Bullish plurality
--> 95 +8 New Highs on NYSE 9 -6 new
lows. Bullish
plurality
Fears of a new Europeon War in the Ukraine will surely bring a pullback.
The DJI's Futures are down 122. At this week's Tiger Meeting (see work materials
from it), I expressed the belief that this would all soon blow over. The market's
technicals,
I said, should be sturdy enough to limit the decline to the DJI's 21-day ma. The
Russian ETF, RSX, will probably be hit a lot more than the DJI. Look at the
heavy
trading in it.
If Eastern Ukraine Becomes A Battlefield,
A Much Bigger Decline Could Start.
Upon further reflection today, I'm not sure Obama is strong enough to resist
the pressure on him from the American right. He may get us involved in yet
another civil war 10,000+ miles away. Surely, one hopes, he realizes that
history in such matters has not been kind to such American involvements.
Unfortunately, all my adult life, America keeps making the same mistake, in my view,
over and over again getting involved in distant foreign civil wars when they can be
couched in a US versus Russian or Communist framework for average TV
American viewers by the mass media here. America better back down.
Russia will not. They see the new Ukrainian leaders very differently than
our media shows them to us. They see them as the new Nazis next door.
Crimea, A Warm Water Port in The
Black Sea.
It's not clear what difference to America or Europe the formal Russian
control over the Crimea really means. The Russian fleet has been there since 1800
except during the German occupation in WWII. The peninsula's population now
is 60% Russian speaking. Ukrainian and Tatar speakers are a minority.
For Russia, the Crimea represents a warm port, a wonderful place to go on
Summer vacation and a show case for Russian movies. Krushchev, a Ukrainian,
turned the Crimea over to the Ukraine in 1954 in what seemed to be only
a token administrative change back then. The Ukraine's claim to it now
is too weak for NATO to make much of a fuss about. But memories of the
Cold War, which really began in 1917, do not fade quickly.
It is the rest of "the Ukraine" which is the big problem. Too many
Ukrainians
seem to see their country's divisions as being beyond peaceful resolution. The Eastern
half is Russian speaking and orthodox. The Western half is Ukrainian and
Catholic.
To them, this matters. To someone far away, the differences between the Russian
and Ukrainian languages seem limited to certain letters. A Russian can understand
most
basic Ukrainian and with a little study vice verse. The same is true of the
religious
differences. To a non-Christian, the similarities between these two priest-oriented
Chistian religions are not so easy to distinguish.
New Nazis Right
Next Door?

Svoboda's Oleh Tyahnybok doing their party salute when re-elected their
leader.Ukraine party accused of anti-Semitism receives top positions in new government
Euromaidan:
The Dark Shadows Of The Far-Right In Ukraine Protest
Russia
says the Ukrainian protesters are fascists and Nazis. Are they? |
The Political Divide Is Very Wide.
People from Western Ukraine (Gallicia) speak a
language more similar to Polish. Poland ruled much of Gallicia, as late as 1941.
In the Russian Civil War, the White Army in Kiev fought the Red Army of Kharkov
(Ukraine). When the NAZIs came, many in Western Ukraine were quick to collaborate
against the Red
Army.
The dynamic leader of the fiercely anti-Communist
Svoboda Party, Oleh Tyahnybok,
gets much of his
support from northwestern Ukraine. Collaborating with the NAZIs is not a disgrace in
Svoboda's Party circles. Those days are remembered with some sympathy by the contemporary
Svoboda Party. Early on, it chose the name Social Nationalists (reversing Hitler's
"National Sociaist" party. It uses the Nazi Party salute and
the same Wolfsangel symbol that was used by the
Waffen SS.
The Eastern half of the Ukraine gives this Svoboda
Party only a miniscule portion of their vote. But the Svoboda is a major
member of the new de facto government running Kiev now. This scares all Ulrainians
minorities, especially Jews, not just the Russian speaking Ukrainians in the East.
Russian Fears run Deep
20,000,000 Russians died in World War II because
of Fascism. There is no way a Russian leader could
permit a new Ukrainian Fascism to threaten Russians a mere 800 miles from Moscow.
When will our mass media talk about this very dark
side of these anti-Russian Ukrainians? Educated Europeons know these things.
Americans will gradually discover the Russian perspective is not going to change because
Obama threatens "consequences".
|

Supporters of the right wing Svoboda Party march under the banner of a
crooked cross, very
reminiscent of the Swastika. The banner in Ukrainian says,
"For the Dead, for the Living and
for the Unborn". |
==================================================================================
2/27/2014
It seems that the "Expanded Buy B9" needs a new Sell signal to be
reversed. At the very least, it needs a trend-change in our measures of
Professional (CP)
and Day-Trading buying, if we are to expect even a short-term pullback. Today
SPY's Closing Power broke out above a series of flat tops. That's usually bullish.
So is the powerful surge in the A/D Line since Yellen became Fed Chairwoman.
--> To Key Index and Leading Stock
Charts: DJI, SP-500, etc.
DJI Chart
SPY Chart
NASDAQ
Chart IBB Chart
IWM Chart
--> 237 +52 MAXCP stocks Bullish MAXCP Stocks (2/27/2014) Bullish plurality
--> 46 -15
MINCP stocks Bearish MINCP Stocks (2/27/2014)
--> 91
+18 New Highs on NASDAQ ? new lows. Bullish plurality
--> 79 +5 New Highs on NYSE 9 -6 new
lows. Bullish
plurality
Have you noticed that the most bearish MINCP charts now are those of the short ETFs?
See the charts of SDS, RWM and TZA below. This has to be bullish.
It is true that many low-priced stocks have enjoyed unsustainable, wild run-ups since
last Summer. But more keep coming on line. Individually, as long as their
Closing Powers
stay above their rising 21-day ma or their steep CP uptrends if they run up too far,
they can be played safely, I think, by users of TigerSoft.
Yes, The Market Appears Over-Bought, but...
Each time I think a convenient pull-back is at hand because of the over-bought
condition of the DJI relative to its 21-day ma, or the lagging Hourly OBV (DISI)
Line or SPY's inability to make a decisively breakout, stocks move higher on economic
news or comments by Yellen, the Fed Chairwoman. Let's just wait for a new
Peerless Sell or, at least, some change in the upper direction of the Closing Power
or the Tiger Day Traders' Tool on SPY (see last chart tonight). Obama's meeting
privately with Boehner may yet yield something constructive. I'm
betting the
Republicans will get aboard a big new (and patriotic) infrastructure rebuilding
program, just as they did under Coolidge and Eisenhower. That would be very
bullish.
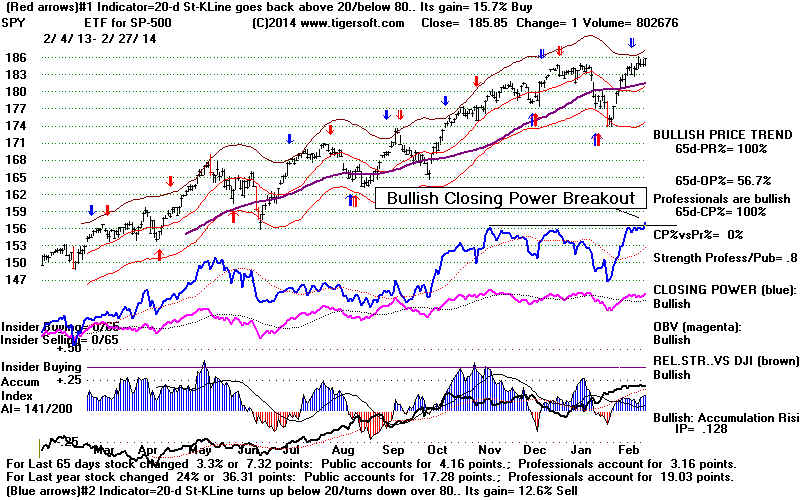
Why fight the Fed?
Janet
Yellen says we don't have a stock bubble. Maybe, we should appreciate
not
whether she is right or wrong, but the effects that her statements have on stock prices.
I
think that each time we learn she is going to give a speech, we should buy before it.
“Stock prices have risen pretty robustly,” she told
Congress in November
But looking at several valuation measures -- she specifically cited equity-risk premiums
--
I do "not see stock prices in territory that suggest…bubble-like
conditions.” Source
Bubbles Can and Do Last A Long
Time
It is in their nature. It is the way Wall Street and human nature work.
Low interest rate bubbles have many critics. Examples:
This
is no recovery, this is a bubble – and it will burst
Fed
Has Become 'Facilitator and Financier' of Government Debt
But it has always seened to me that most of the time these critics of a loose
Fed monetary policy are simply re-fighting the battle against a super-inflated
Weimar Deutch Mark of the 1922-1923. When they point out that that
the
Real Economy in the US is lagging, they are right, of course. But that was true
in the 1920s from October 1927 to October 1929, during which time the DJI doubled.
In England, it was true throughout the 1920s when official unemployment never
fell below 7.5%.
What the critics of cheaper credit are missing is that in many ways, the stock market
is rising now precisely because the "Real Economy"
is lagging.
1) It is the weak economy which gives the FED reason to keep rates low.
2) The stock market is rising in large part because it is still the best game
in town for investors, In a weak economy, other forms of investment generally
show much lower rates of return.
3) Why do the critics not understand that high unemployment means low wages
and this contributes mightly to higher profits?
4) A weak US economy means corporation will search for markets overseas
to make and sell things. In a low tariff environment, this is very profitable.
5) A weak US economy also means corporate cash reserves are built up.
These can be used to buy back stock. Or even better, to buy out competitors
when US anti-trust laws are ignored.
6) Finally, critics forget that the Fed is charged specifically under law
with shoring up a weak Economy with low interest rates, even though its
monetary policy is now a very poor alternative to a real Jobs Bill or a
massive investment in public infrastructure, such as highways were in 1920s
and 1950s. |
So, bubbles last much longer than most shorts can tolerate.
That was true in
1967-1968, 1999-2000 and even in 2008 when penny oil stocks went crazy. Proof
of this
today were the rallies in some of the most (red) distributed (and shorted) stocks,
like JCP below. This means that even when hedging, if you go short, it works
out best
overall to cover when the steep Closing Power downtrend is violated. Lots of
back-testing
validates this principle even in bear markets. There are always more Bearish MINCP
stocks to go short.
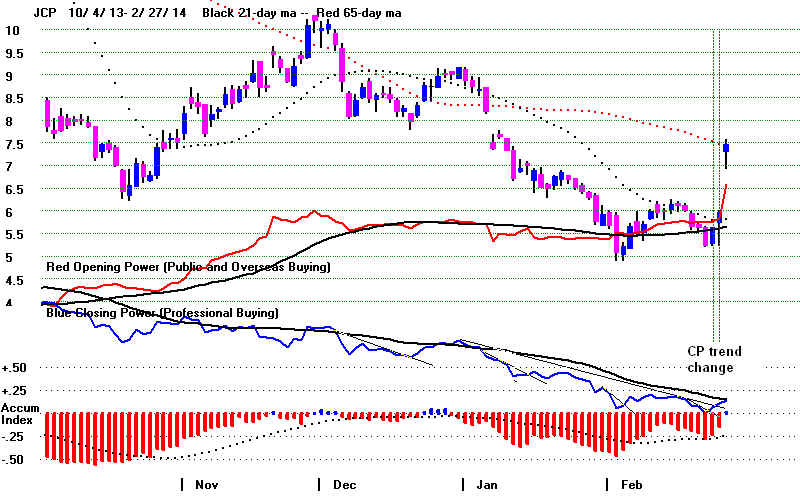
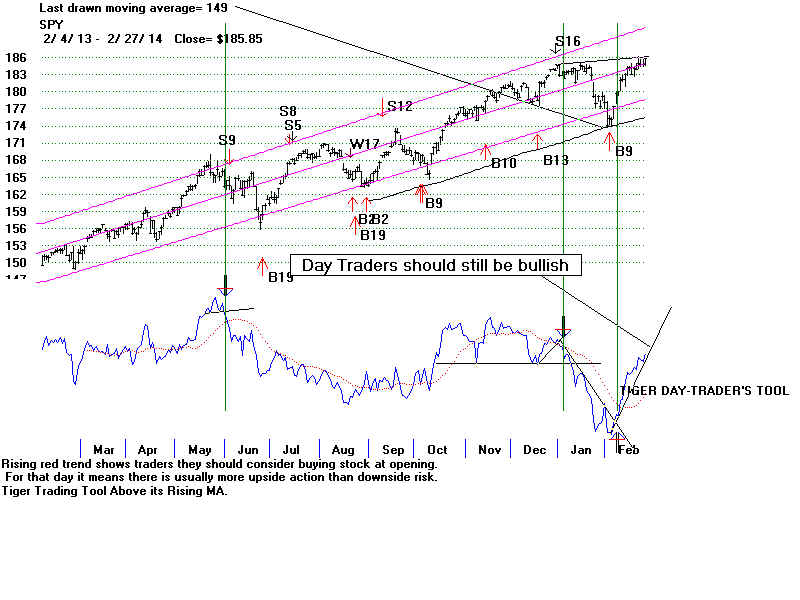
==================================================================================
OLDER HOTLINES
==================================================================================
2/26/2014
The
SPY Needs to Plumb for Support
The very good breadth and expanded Buy B9 should limit the decline.
Use the Bearish MINCPs to
be equally hedged with long positions.
With the Stochastic-20 over the 80-level and the DJI 1.9% over the 21-dma
the market is in overbought territory. The SP-500 still has not broken out over its
key 1850 resistance. Having found ressitance, the markets must search for support.
Fortunately, the internal strength indicators have turned positive. This should
help limit the decline. Futures are down today. A DJI decline back to test its
rising
21-dma at 16000 is needed. So stay fully hedged. If the
DJI breaks below its 21-day
ma, about 100 poin ts below today's close, we will probably see it fall to 15500.
But because the DJI is up a little more than 5% on this recovery, it is now more likely to
advance to new highs than retreat significantly. I say this looking at the S16 cases
that did not bring sell-offs in March or April when they recovered more than 5%.
Notably 1934 and 1990. If the DJI produces a new high, that would almost
certainly mean an SP-500 breakout run and the possibility of a NASDAQ/QQQ
vertical ascent above their uptrend resistance lines. Peerless Sells
occur only in 1/4 of the cases when the DJI makes a new high in March.
So the bullish Spring seasonality may surprise traders if the DJI can make
another run to new highs.
When I consider the past results of the new "expanded Buy B9", I note that
it's average gain is 13.3%. Breadth (A/D Line) is particularly strong now,
reflecting the low interest rates and Yellen's reputation as a "dove" (i.e.,
a Fed member who places concerns about a weak economic revival above
worries about signs of inflation.)
We see megaphone or diamond
formations in development in the case of
DIA, SPY, QQQ... Usually, they do not
reverse until a new high is made.
More often than not they are bullish.
--> To Key Index and Leading Stock
Charts: DJI, SP-500, etc.
DJI Chart
SPY Chart
NASDAQ
Chart IBB Chart
IWM Chart
--> 185-10 MAXCP stocks Bullish MAXCP Stocks (2/26/2014) Bullish plurality
--> 61 -4
MINCP stocks Bearish MINCP Stocks (2/26/2014)
--> 73
+8 New Highs on NASDAQ 8 new lows. Bullish plurality
--> 74 +11 New Highs on NYSE 15 new
lows. Bullish
plurality
Positive Internal Strength Indicators
DJI change
la/ma
annroc
P-I
IP21
V-I
Opct 65-day Pct
Change
----------------------------------------------------------------------------------------------------------------------------------------
2/26/14 16198 +19
1.019
.270 +493
+103 +.057 +20
.091 .018 All are
positive.
The V-Indicator has turned positive. But 10-day Down Volume is
rising and
10-day Up-volume is falling. That was not bearish enough last year in March
to drop the DJI below its 21-day ma. In the research I did a few years ago on S9vs,
I found that 1st quarter bullish seasonality over-rode a negative V-Indicator
reading at the upper band. There needs to be a bearish breadth divergence, too,
at this time of year.
http://www.tigersoft.com/PeerInst-2012-2013/refinedS9v.htm
It may be that the Hourly OBV
Line's declining slope may also be overridden
right now as long as breadth remains very good. But
clearly, there is some
heavy insitutional selling.
Bank Stock Weakness
I do think it's a good idea to watch the bank stocks.
Yellen's "dovishness"
comes with a desire to see banks have higher reserve requirements. I learned
in ECON-101 that tinkering with this potentially can have a big impact on
the economy. Since the big banks are now as much inclined to use their extra
reserves
to trade the equity, bond and currency markets as make loans, I would view any
news on this front - reserve requirement changes for the big banks -
as bearish for the markets. This may explain the weakness now in Goldman Sachs
(GS), why JPM has also slipped
below its 65-dma and why BAC
could bearishly
break a lengthy uptrend. She also may be more inclined to enforce the Dodd-Frank
limits on speculative trading, especially in commodities, as opposed to hedged
trading by big banks. The new limits on Commodity trading has sparked a good
rally there.
http://www.bloomberg.com/news/2013-11-05/traders-face-curbs-on-speculation-with-cftc-vote-on-new-limits.html
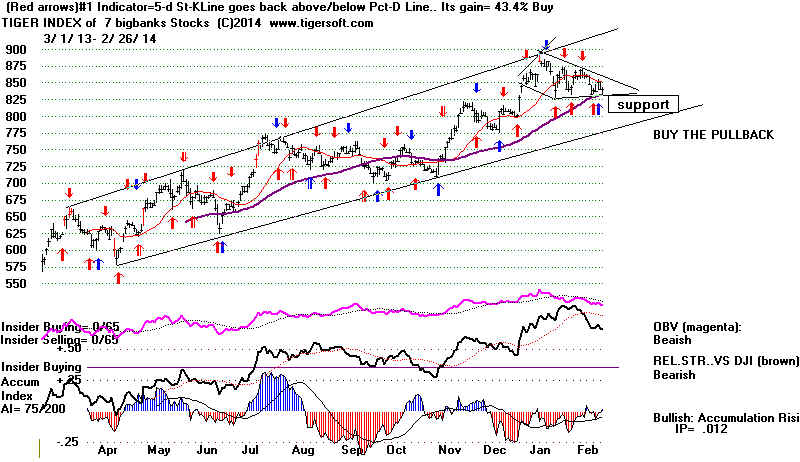
March Peerless Sells in Rising Markets Are Infrequent
What can bring about a significant top in March in a rising market? Here
are the cases of March tops since 1928 when the 65-day rate of change was
above -4. March Sells are in rising markets did not occur in 1942,
1943, 1944,
1945, 1950, 1954, 1955, 1956, 1957, 1959, 1963, 1964, 1965, 1967, 1969, 1971,
1972, 1975, 1985, 1986, 1987, 1989, 1990, 1991, 1992, 1993, 1995, 1996, 1997,
1998, 1999, 2000, 2003, 2004, 2006, 2010, 2011 (37 instances). This suggests
that the odds are 37:13 against a March top if a new high is made next month.
March Peerless Sells in Rising
Markets: 1928-2014
1 19290301 S9 321.2 .056 19290314 S9 316.3 .041
2 19360303 S15 156.2 .042 19360304 S12 156.7 .045
3 19370303 S9 192.9 .142 19370305 S15 194.1 .147
19370310 S9 194.4 .149 19370311 S4 192.2 .139
4 19390309 S3 151.3 .18
5 19660301 S10 938.19 .173
6 19760324 S15 1009.21 .048 Following a top
7 19770315 S9 965.01 .164
8 19800307 S10 820.56 .052 Following a top
9 19810326 S4 1005.76 .032
10 19840316 S9 1184.36 .083
11 20050308 S4 10912.47 .076
12 20090302 S13 6763.29 .025
13 20120321 S1 13124.62 .024 |
---------------------------------------------------------------------------------------------------------------------------------------------------
OLDER HOTLINES
---------------------------------------------------------------------------------------------------------------------------------------------------
2/25/2014 The
market refuses to sell-off. The DJI is still above its 65-dma.
Consider the past results of the new "expanded Buy B9. Paper losses are
inconsequential
and the average gain is 13.3% with these signals. This make them one of the better
Peerless Buys. We should definitely use it the future. As for now, my
judgement is
that we can employ the Buy B9 and go long SPY (or DJI if you prefer) on a close
by SPY above its resistance, 186. If there is no breakout, we will go long on a DJI
of SPY decline back to their 21-day ma. That should act as support so long
as breadth remains so positive. The S16s's warning of a bigger next decline
may still come true. That would be a natural development in the broadening
top pattern we see in the DJI and SP-500.
--> To Key Index and Leading Stock
Charts: DJI, SP-500, etc.
DJI Chart
SPY Chart
NASDAQ
Chart IBB Chart
IWM Chart
--> 195-47 MAXCP stocks Bullish MAXCP Stocks (2/25/2014) Bullish plurality
--> 65 +15
MINCP stocks Bearish MINCP Stocks (2/25/2014)
--> 65
-45 New Highs on NASDAQ 10 new lows. Bullish plurality
--> 63 -44 New Highs on NYSE 12 new
lows. Bullish
plurality
The bearish devergence between the Hourly DJI and OBV (DISI) is increasing.
The Stochast-Pct-D-20 has reached the 80-level. This means it is over-bought.
A decline from here would be signalled by a short-term Stochastic-20 sell. I doubt
if the
markets will runaway to the upside if there is a breakout. With the IP21 still
negative, we could even get a new Peerless Sell at the 3% upper band (la/ma = 1.03).
What to do now in this environment?
Sell short bearish MINCP stocks/ETFs like MXF when they
breakdown below
well-tested support. Each short like this can be used to hedge a bullish MAXCP
stock. The result is usually quite favorable to the hedger.
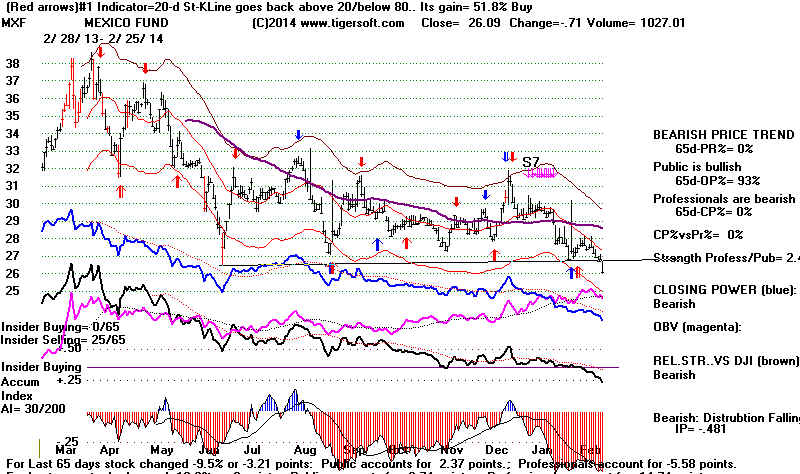
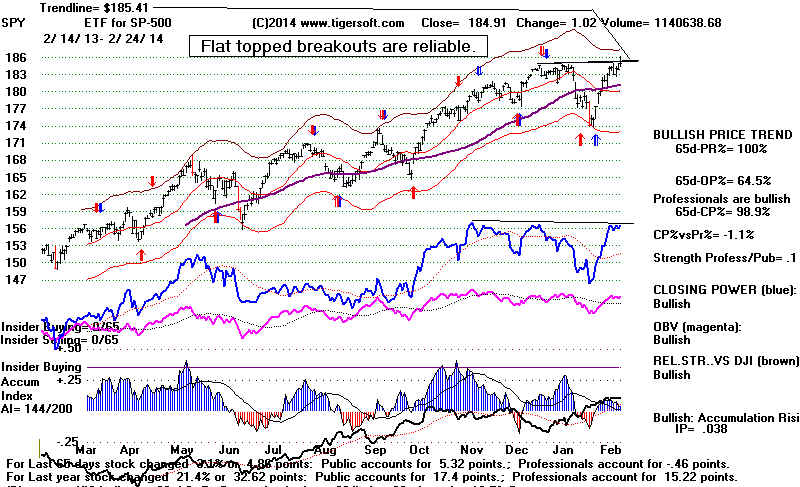
Revised Buy B9.
2/24/2014; "Expanded Buy B9"
Previously if the DJI reached the lower 3% band and the
P-Indicator
was positive, a Buy B9 results. The new B9 expands these parameters,
by giving a Buy B9 if the P-Indicator is above -34 and the DJI
is more than 4% below the 21-day ma provided it is not January
or the the DJI is not more than 4% down from 65 days ago.
Earlier Expanded
Buy B9s
#1 12/11/1928 very good. Gain = +.161 65-day up-pct = .126
la/ma ann-roc PI PI-ch IP21 V
Opct 65-dayup-pct
.958 .263 -24 +18 .028 -511 .13
.126
Also already a Buy B2.
------------------------------------------------------------------------------
#2 7/24/1933 94.3 Gain = +.054 65-day up-pct = .304
la/ma ann-roc PI PI-ch IP21 V Opct 65-dayup-pct
.932 .165 12 49 -.145 -528 .082 .304
Also A Buy b6
----------------------------------------------------------------------------[--
#3 8/1/1933 92.7 Gain = +.072 65-day up-pct = .268
la/ma ann-roc PI PI-ch IP21 V Opct 65-dayup-pct
.927 -.641 -19 9 -.171 -630 .012
.268
Also a buy B16
-------------------------------------------------------------------------------
#4 11/8/1943 131.7 164 Gain = +.254 65-day up-pct = -.038
la/ma ann-roc PI PI-ch IP21 V Opct
65-dayup-pct
.958 -.527 158 32 -.261 126
-.225 -.038
Already a Buy B9 under previous rules
-------------------------------------------------------------------------------
Avg.Gain = +.133
#5 2/4/2014 15445.24 up so far. 65-day Up-Pct was -.012
la/ma ann-roc PI PI-ch IP21 V Opct 65-dayup-pct
.957 -.753 -30 10 -.149 -133 -.358 -.012
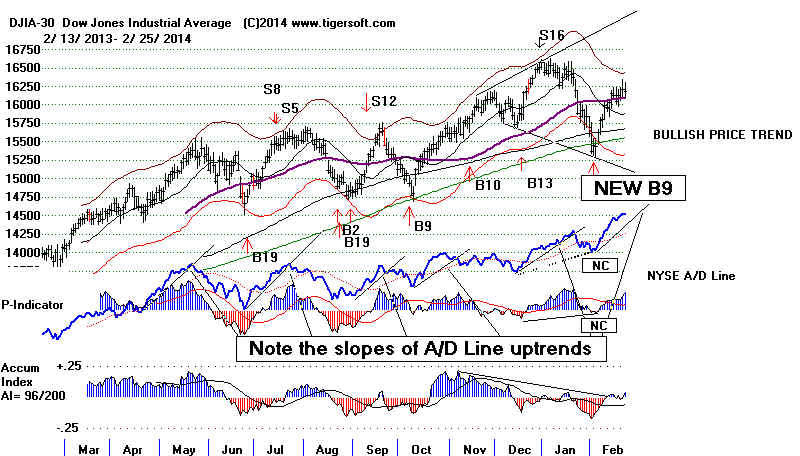
-------------------------------------------------------------------------------
In these expanded Buy B9s, the January cases must be eliminated.
These failures all had an Up-Pct below -.125, so it's hard to know
which of these two factors over-rides the bullishness of the expanded
B9.
1) 1/29/2003 8110.71 TO 7524.03 3/11/04 and then 65day-Up-pct was -.139
2) 1/15/2009 8212.49 fell to 6547.05 ON 3/9/09 65day -UP PCT was -.126
3) 1/23/2009 8077.57 fell to 6547.05 ON 3/9/09 65DAY -Up pct
was =.129 |
==================================================================================
OLD HOTLINES
==================================================================================
2/24/2014 With
the DJI up more than 5% from its low, it seems clear it would
be best to incorporate a new expanded Buy B9 for those cases where the DJI is
4%-5% below the 21-day ma and breadth is improving and the P-Indicator
is above -34. This always worked out well in the past from February to December
as long as the 65-day pct change was not below -.04. A new
Peerless with this
change and the ability to see longer 200-day and 149-da mvg avgs. will be
posted tomorrow on the Tiger ESP page.
Secondary stocks, biotechs, gold and silver stocks, military stocks and
food commodities are the favored groups now. Note, that in the past a rise in
gold and silver stocks is actually a warnng for the market. That was true
for example in August of 1987. When inflationary forces build up, the Dollar gets
weak and the Fed usually decides to raise interest rates. Janet Yellen may not
be able to keep the more conservative Fed Governors from taking actions to
defend the Dollar. Still, considering how far the Fed was behind the curve in 2008,
my guess is that they will be much more concerned about triggering another recession
than inflation.
I do think we still have to be on guard that there will be another, bigger leg down
from a top in March. It is worrisome that the SP-500 could not breakout decisively
above 1850 today. The last hour's sell-off was on heavy volume. See this
in the
Hourly DJI chart below. Bearishly, the DJI is now 2.2% over the 21-day ma
but the IP21 is negative, -.006. This is not enough to bring a sell signal
when
the P-Indicator is as positive as it is now. But it does show lots of institutional
selling
into the strength we are seeing. Look at the 10-day day ma of NYSE Up and Down
Volume below. They appear to be starting to bearishly converge. In additon,
the Stochastic-20 for DIA and SPY have now reached the 80-over-bought levels.
The Tiger Day Traders' Tool is still rising for DIA and SPY.
The volume warnings suggest a pull-back seems likely.
This will probably have only
a small effect on the NASDAQ and QQQ. Out TigerSoft Stocks' Hotline
remains about equally hedged long and short using the MAXCP and MINCP
stocks..
--> To Key Index and Leading Stock
Charts: DJI, SP-500, etc.
DJI Chart
SPY Chart
NASDAQ
Chart IBB Chart
IWM Chart
--> 242 +8 MAXCP stocks Bullish MAXCP Stocks (2/24/2014) Bullish plurality
--> 50 +4
MINCP stocks Bearish MINCP Stocks (2/24/2014)
--> 110
+3 New Highs on NASDAQ 9 new lows. Bullish plurality
--> 107 +34 New Highs on NYSE 9 new
lows. Bullish
plurality
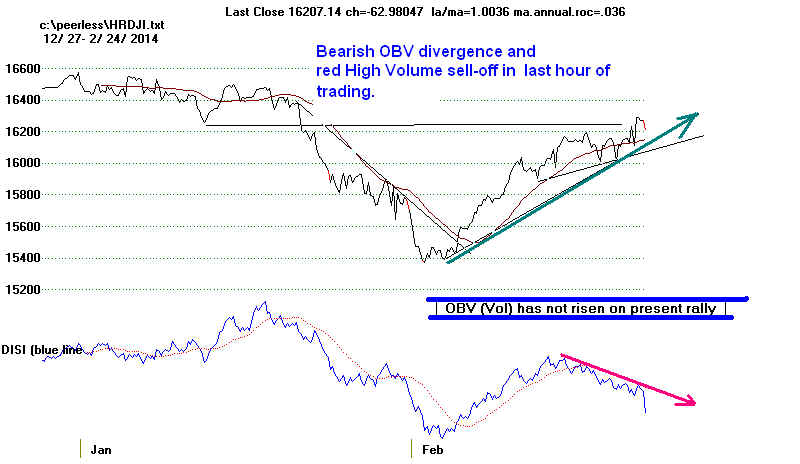 |
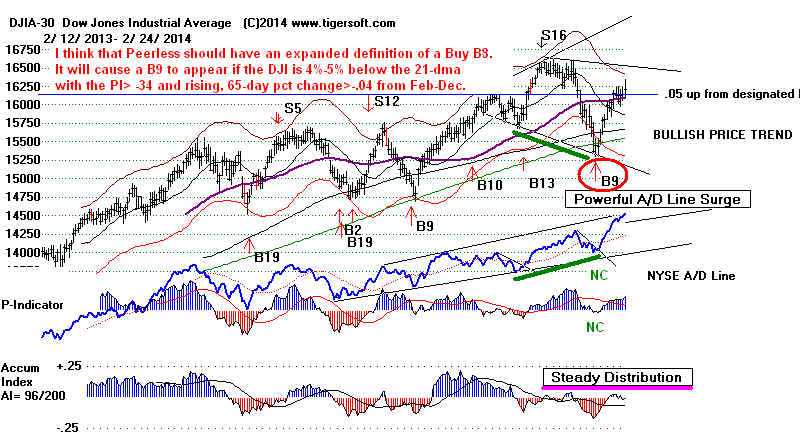
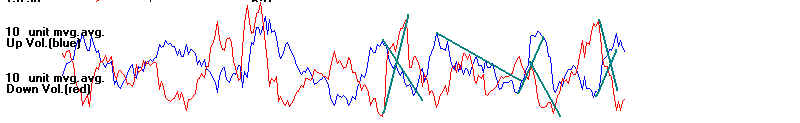 |
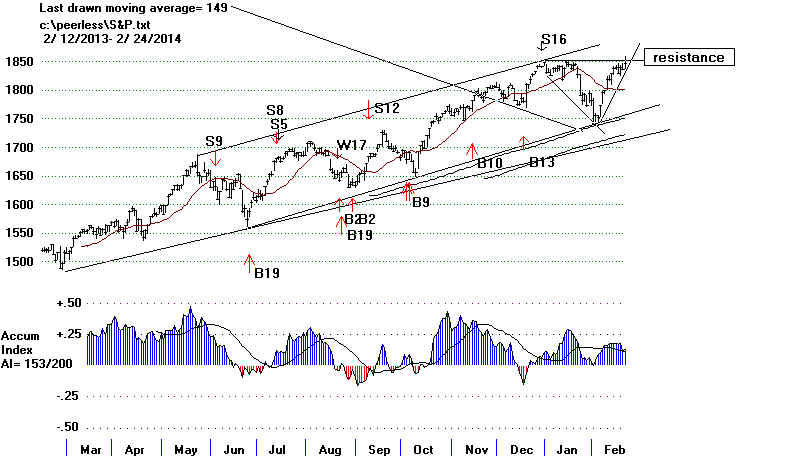 |
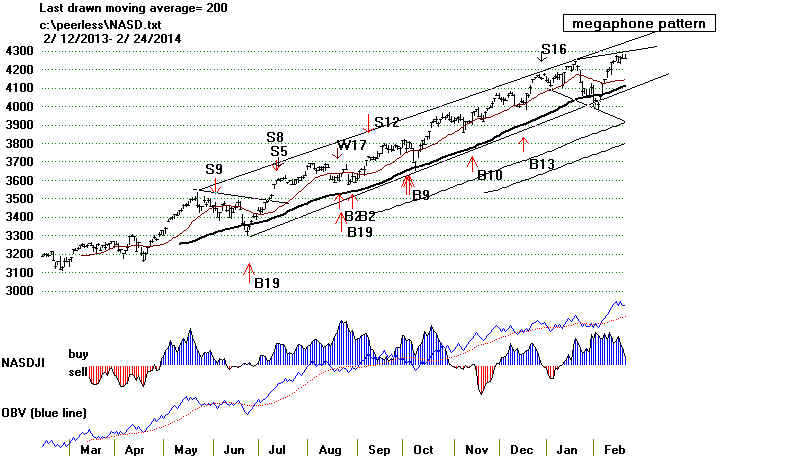 |
ARWR was driven up by
underwriters to a big new issue of the stock.
I think I would take profits in it.
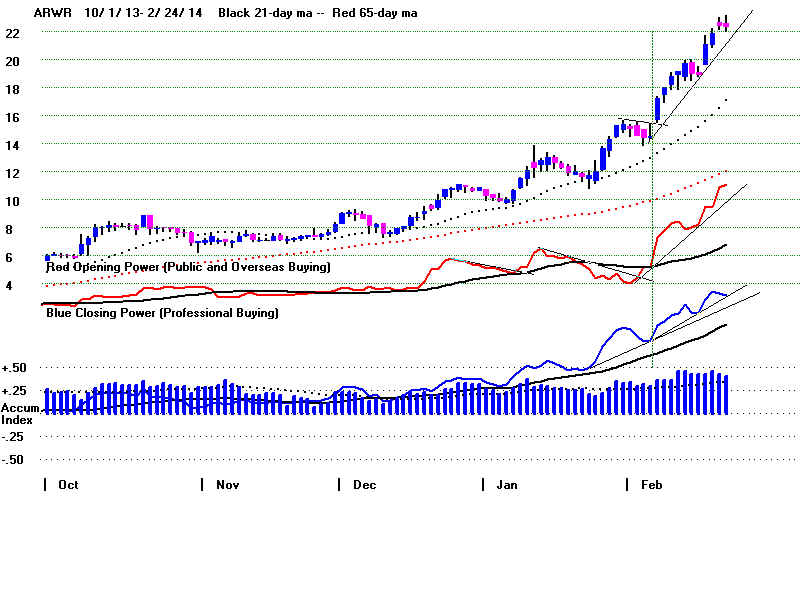 |
==================================================================================
OLDER HOTLINES
==================================================================================
2/21/2014 Sell
S16 - Watchful Waiting. The DJI has not risen more than 5%
from its lows, but speculative "animal spirits" have taken over a number of
high performance funds. None more than FBIOX (Fidelity biotech).
An SP-500 breakout over 1850 should bring another 5% advance.
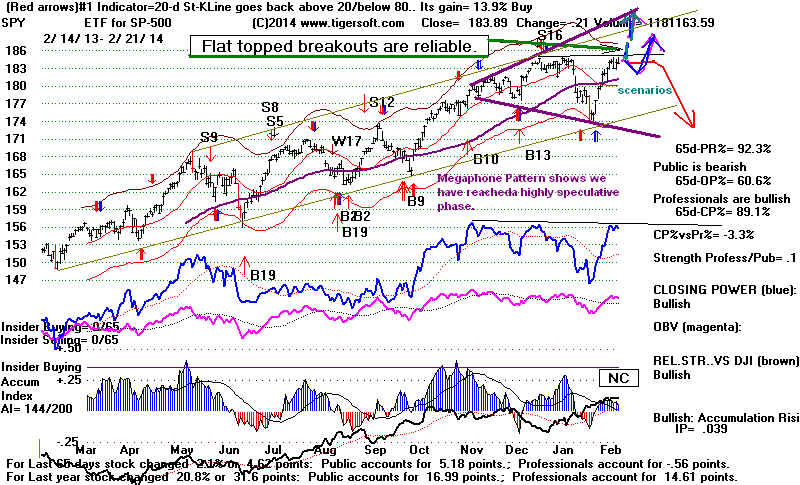
Another 1.5% Rally in DJI may bring a Peerless Sell S12
The DJI is now 1.5% over the
21-day ma. The IP21 is -.011. A lot of distribution
is taking place on this rally. In addition, the Hourly DJI's chart shows a
bearish
OBV (DISI) divergence now. Somewhat higher DJI price will cause the 20-day
Stochastic-Pct
to rise above 90, a level it has reached on every rally in the past year. The Tiger
Traders' Tool has not yet turned down.
The most bullish
factor now is still the Fed and the up-trend.
.
This
weekend a lot of people are reading about Janet Yellen dovishness in 2008
ahead of all the other Fed Governors in 2008. 2000 pages of FOMC and FED
minutes from 2008 were released on Friday.
This is important because many speculators believe the Fed will once again
be behind the curve just as they were in 2008. Partly because of this but mostly
because of human nature, it's a good bet that stock traders (large and small)
will be the victim of their own Animal Spirits
(Keynes' term for what
swerves investors back and forth between excessive fear and excessive confidence.)
And to quote him again: "Markets
can remain irrational longer than you can
remain solvent".
The Fed's Biggest Fear Now:
Letting The Economy Slip into Another Deep Recession.
The minutes shed new light on the Fed in the Dark or off skiiing in Idaho (Mishkin)
while the bank stocks and then the economy plummeted down in 2008.
The FED is clearly very wary of making the same mistake they made throughout
2008 when they badly underestimated the severity of the coming financial collapse.
Geithner's remarks at this time seem particularly uninformed and way off-base.
He was, after all, the head of the NY Fed. His primary concern on March 18th, 2008
was that any pre-emptive actions by the FED would scare confidence away from the
markets. Big US banks were not "as a whole under-capitalized". This was a few days
after Bear Stearns had collapsed and its assets sold to JP Morgan. (Source.)
.
Bernanke, at least, had the good sense to call emergency FED meetings
starting in January
2008. But he also badly underestimated how much the
mortgages' collapse and derivatives would affect the market. On Sept. 16,
the day after Lehman Brothers filed for bankruptcy, Bernanke declared,
“I think that our policy is looking actually
pretty good.” The Fed declined
at that meeting to cut short-term rates. But three weeks later they were
forced to rescue AIG with a twenty billion bailout.
In October, 2008, with the DJI below 900, Yellen was the most forceful Fed
member calling for action. "Frankly, it is time for
all hands on deck when
it comes to our policy tools...We need to do much more and the sooner the
better...I don’t believe in gradualism in circumstances like these.”
Source.
Fisher in Dallas who had nearly always opposed rate cuts in October 2008
relented: “I will conclude with actually once again agreeing with President Yellen,
as I think I have done twice in history."
---> Hedging by being long the most Accumulated Bullish MAXCPs
and
short the most Distributed Bearish MINCPs keeps working out well.
--> To Key Index and Leading Stock
Charts: DJI, SP-500, etc.
DJI Chart
SPY Chart
NASDAQ
Chart IBB Chart
IWM Chart
--> 234 -27 MAXCP stocks Bullish MAXCP Stocks (2/21/2014) Bullish plurality
--> 46 -9
MINCP stocks Bearish MINCP Stocks (2/21/2014)
--> 107
+8 New Highs on NASDAQ 9 new lows. Bullish plurality
--> 73 -18 New Highs on NYSE 7 new
lows. Bullish
plurality
As long as the DJI is unable to move up more than 5% from its
recent botton, the bearish scenario remains alive for the DJI, wherein it falls back
in a second decline to lows. The best way to know that the market is too strong
for this possibility anytime soon will be a powerful breakout by the SP-500.
Actually, there are three markets now. First, there are the bullish MAXCP stocks
that keep surging to new highs after shallow retreats. Srcond, there are the majority
of
stocks that are going sidewise, like the DJI-30, and are not close to making
breakouts or beakdowns. Third are the more and more bearish MINCP stocks.
These have broken their 65-dma, show Closing Powers at or near their year's lows
and show an AI/200 score below 75. These show no ability sustain much of a rally.
Instead some of these steadily decline week to week and some drop precipitously
at unexpected times, ofen when the market is up.
In this environment, I think we should just wait to see whether the DJI will fall
back or
the SPY-500, OEX and IWM will follow the lead of the QQQ and make new
highs. Speculative markets like 1967-1968 and 1999-2000 teach us not to
underestimate
the bullish stampede bt investors into the leaders of the time.
On the other hand, the lessons of early 1977, mid-1986, early 2000 and 2001 and 2002
show that the DJI-30 lead the rest of the market downward and that these these other
indexes
could top out 1-2 months after the DJI does. In this bearish scario, a 10% decline
is
the least depth that occurred. Always Peerless was on a sell. So, waiting now
for a clear A/D Line trendbreak and a Closing Power uptrend break should serve us
well now. That would show the Sell S16 will producing its second leg down.
Such breaks could signal a significant sell-off by the whole market. But,
fortunately
for the bulls, such a top historically is not made until March at the earliest,
when there has been a 5% rally, like now.
DJI change la/ma annroc
P-I
IP21 V-I
Opct
65-day Pct Change
S20-Pct-D
----------------------------------------------------------------------------------------------------------------------------------------
2/6/2014 15628 +188 0.973 -.667 -16
-..095 -121
-.357 000 Back
above 200-dma
2/7/2014
15794 -5
0.986 -.496 +83
-.058 -98
-.261 +.009
2/10/2014 15802 +8 0.988
-.478 +100
-.044
-99 -.176
+.011
2/11/2014 15995 +103 1.002 -.329 +119 -.014 -88 -.088
+.015 At 65-dma
2/12/2014
15995 -29 1.001 -.218 +205
.010 -66
-.083 +.023
2/13/2014
16028 +33 1.005 -.258 +216
.015
-69
-.086 +.016
2/14/2014
16154 +126 1.014 -.245 +221
.029
-71 -.02
+.023
2/18/2014
16130 -24 1.014 -.214 +246
.025 -66 -.095
+.024
2/19/2014 16041 -89 1.009 -.313 +227
-.009 -64
-.199 +.013
2/20/2014 16133 +92
1.016 -.211
+228 .015
-53
-.110 +.016
2/21/2014
16103 -30 1.015 -.202 +206
-.011 -59 -.120
+.008
+75
==================================================================================
OLDER HOTLINES
==================================================================================
2/20/2014 Perhaps,
the Sell S16 probably should have been reversed by a B9.
B9s typically occur near the 3.5% band with the P-Indicator positive. The revised
B9 would occur 4.5% below the 21-day ma with P-Indicator no lower than -35
and rising.
Bearish Scenarios. The DJI is
still not up more than 5% from the recent bottom. That
means a significant second, delayed S16 decline could start in March. In addition,
a rally 1.5% higher by the DJI would probably bring a new Peerless Sell.
Bullish Scenario. Traders, watch now for a bullish SP-500 breakout above its flat top
at 1850. This should set off a buying surge. Even a shallow pull-back here.
could set up a bullish continuation head and shoulders. Either eventuality
would be quite bullish. Traders should buy SPY on
such a breakout at the
close. It may signal a wild, vertical ascent and we would want to play that
possibility.
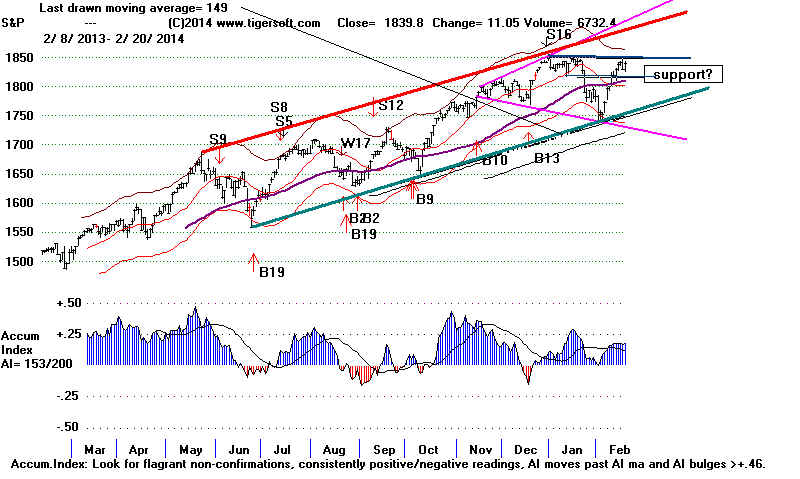
5% Up Rule for DJI, Sell S16:
Towards A Revised Buy B9
The 5% DJI
rally up from the recent bottom may appear stronger than the
unreversed
Sell S16 should allow. I would agree. Accordingly, I must look
for new
ways that might spot such reversals in the future. The mere crossing back
above the
rising 200-day ma, however, does not test well enough by itself, or
even when
good breadth is factored in. Early 1977's Peerless chart
shows this.
What about
a 3-day reversal pattern recognition, Michael in Germany has suggested?
I think
that is an excellent idea. It needs to be tested. What about a revised B9 that
looks for
the DJI with these parameter?
la/ma < .959, P> -32. P-change>0 and 65-day up pct > -.015?
This is
more easily back-tested. See below how well it works in most cases. 3 of the
5 failures
came in January. These would be eliminated in the revised Buy B9.
We can also
eliminate the bear market cases by simply requiring the 65-day Up-Pct
to be above
-.05. Let me do a little more study. But I think with these modifications
to a Buy
B9, the program will be improved. There were only 4 earlier cases where
these
parameters
allapplied. But some of the bear market occurrences would have produced
outstanding
gains. Applying these parameters would expand the current B9 in a safe and
reliable
way, I think you will agree.
Revised Buy B9 with parameters shown above
#1 12/11/1928 very good. Gain =
+.161 65-day up-pct = .126 Also
already a Buy B2 now,
8/11/1930 OK 5.1% 65DAY PCT was -.151
6/29/1932 Perfect 42.8 ---> 76.2 on 9/9/1932
65DAY PCT was -.422
#2 7/24/1933 94.3 --> 99.4 on 8/17 -
65-day up-pct = .304 Also another Buy
#3 8/1/1933 92.7 --->99.4 on 8/17 - 65-day up-pct = .268
Also another Buy
11/18/1937 125.5 FELL TO 11 3.6 ON 11/24
65DAY PCT WAS
-.387
1/31/1938 121.9 --- 6.2% -->129.5 65DAY PCT WAS -.092
3/23/1939 140.3 FELL TO 123.8 ON 4/11 65DAY PCT was -.071
#4 11/8/1943 131.7 TO 129.6 ON 11/30 and THEN
ROSE A LOT Buy 65-day up-pct = -.038 Already a Buy B9
10/9/1946 163.1 THIS WAS BOTTOM of BEAR MKT 65DAY PCT was -.214
11/9/1948 CLOSE TO BOTTOM 173.9 ---> 171.2 and then up to upper band.
65-day up-pct = -.05
1/29/2003 8110.71 TO 7524.03
3/11/ AND THEN UP. 65DAY PCT was -.139
1/15/2009 8212.49 FELL TO 6547.05 ON
3/9 65DAY PCT was -.126
1/23/2009 8077.57 FELL TO 6547.05
ON 3/9 65DAY PCT was
=.129
#5 2/4/2014 15445.24
up so far. 65-day Up-Pct was -.012
--> To Key Index and Leading Stock
Charts: DJI, SP-500, etc.
DJI Chart
SPY Chart
NASDAQ
Chart IBB Chart
IWM Chart
--> 261 +70 MAXCP stocks Bullish MAXCP Stocks (2/20/2014) Bullish plurality
--> 55 +11
MINCP stocks Bearish MINCP Stocks (2/20/2014)
-->
99 New Highs on NASDAQ 10 new lows. Bullish plurality
--> 91 New Highs on NYSE 12 new
lows. Bullish
plurality
Consider the Broader
Market, not just the DIA or SPY.
Try to look beyond the DJI when the NASDAQ and QQQ outperform the
DJI
by a wide margin. This has happened before. I have mentioned 1967-1968
and 1999-2000. History teaches us that secondary growth stocks should be played
long at this time, even despite the Sell S16 that Peerless gave at the end of last year.
Look at the Bullish MAXCPs
for ideas. Many of these stocks have been
appearing on our lists nightly since the rally began. As should be expected,
the best
performers are those showing great bulges of Accumulation, Closing Power new highs
and a quickly rising Relative Strength versus the DJI. (The latter is shown by the
brown RSQ
line just above the Accumulation Index on our daily TigerSoft charts.
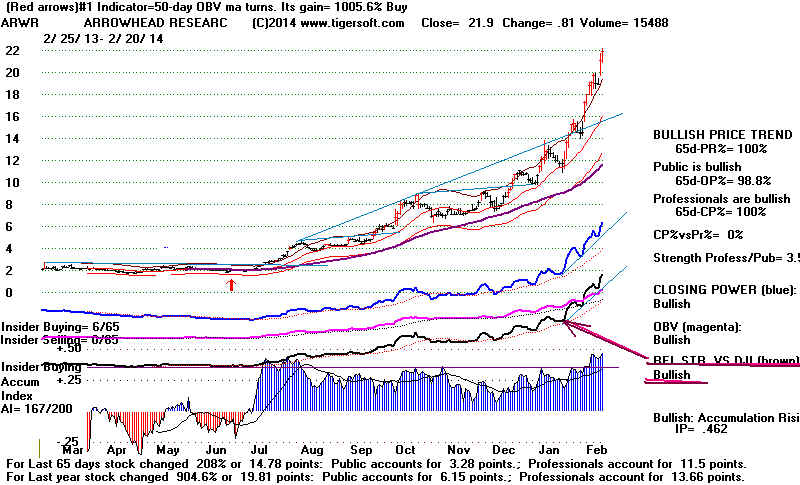
This is too strong a market to short any but the Bearish MINCP stocks, which
surprisingly enough to outsiders, keep declining. JCP and WLT are just the
most obvious examples of that.
.
The DJI is the weakest of the major market ETFs. In the past, a lagging DJI has
shown
that the market has entered a very speculative phase where secondary stocks get
their chance to dance in the sun. But right mow, the DJI is probably too strong
to short. Its coming back above the 65-dma was a warning to cover. So was
the excellent breadth again today. We know from classic chart theory (Edwards
and Magee) that megaphone patterns warn that prices can move unusually
swiftly up from support back to new highs. That is what the NASDAQ, IWM,
QQQ and the SP-500 show.
Last night's recommendation for traders to short DIA on mid-day strength today
was probably premature. But a significant top may still be made for the DJI in March.
While news of a sharp rise in January manufacturing got the DJI to jump up 100 points
between 10:00 AM and 11:00 AM, its close was less than 100 points up for the
day. See the
Hourly DJI chart. Note that the OBV line failed to move higher today.
This is a bearish divergence we should be kept in mind. DIA will probably be a good
short sale again, when the current move's upward momentum and uptrend are reversed.
If we only consider the DJI a little more, it would seem we may see a run to 16300-16400
where its upper band is. Breadth has been good, so other stocks will probably rise
faster and further than the "old-fashioned", "dinosaur" DJI-30.
See below that the
DJI could easily stall out at its 3%-3.5% upper band. Right now, it is may rise
further.
but there still appears to be too much distribution (shown by weak IP21), inadequate
up-volume (shown by negative V-I) and poor intermediate-term momentum (MA-ROC is
negative).

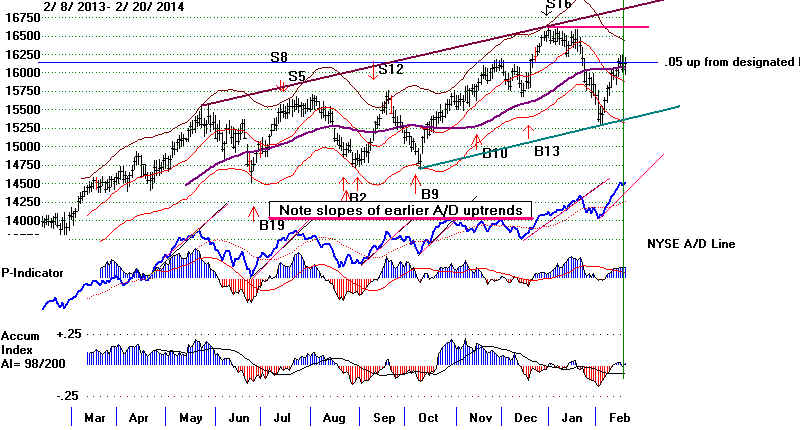
The Sell S16's second decline (wave down) is being delayed. If the DJI rallies up
more
than 5% from its recent lows, say another 200 points more, it would mean that
the S16 no longer looks like those past cases where the next top after the 5%
advance brought a very significant decline. Such an additional advance would suggest
that SPY will achieve a bullish flat-top breakout and we may be starting the long-awaited
NASDAQ's climactic vertical ascent.
Watch Tiger's Day Traders' Tool for DIA. When its current spike upwards ends,
we should see either a reversal or a period of consolidation. Which will occur will
depends on whether secondary stocks take off into a vertical ascent mode.
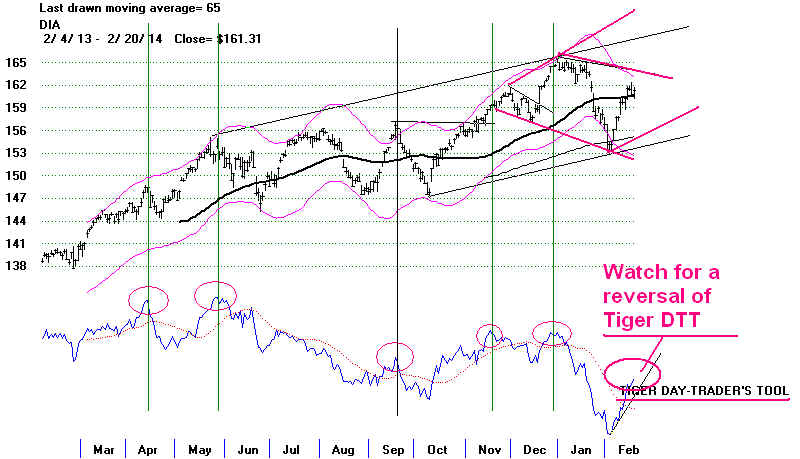
Secondary growth stocks in the Bullish
MAXCPs should be played aggressively long
now. Watch to see if the IWP can get past the top of its price channel.
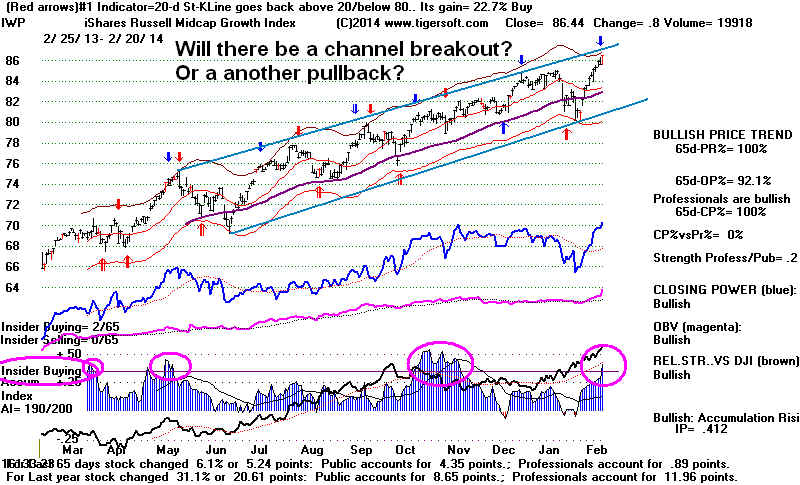
==================================================================================
OLDER HOTLINES
Go to http://tigersoft.com/112211-H /
==================================================================================
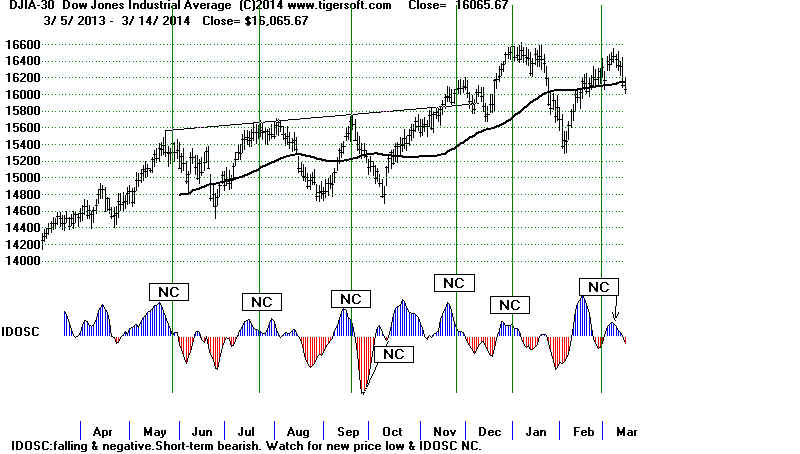
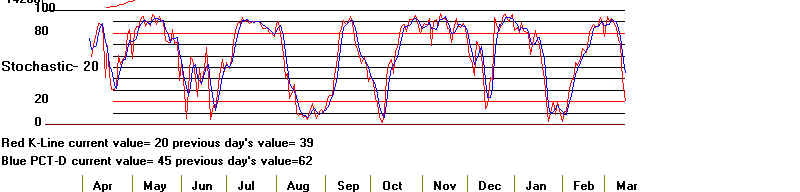
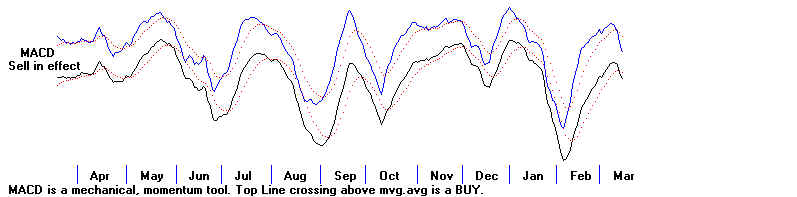
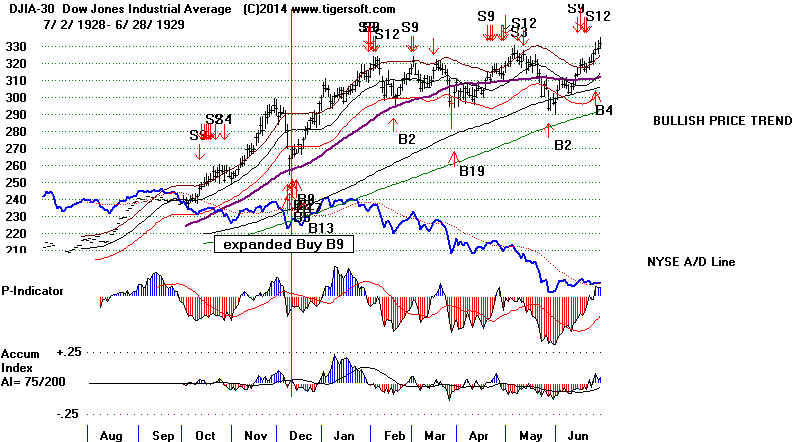
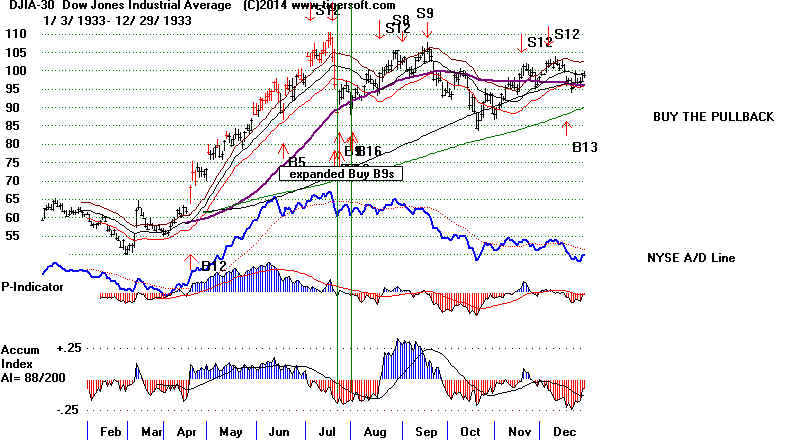
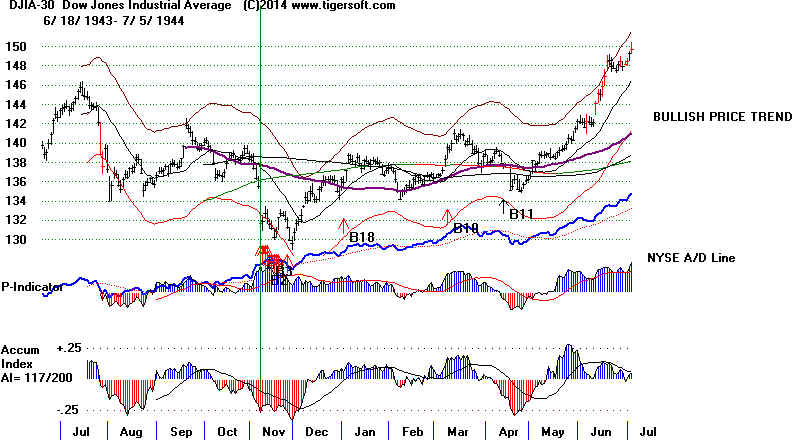
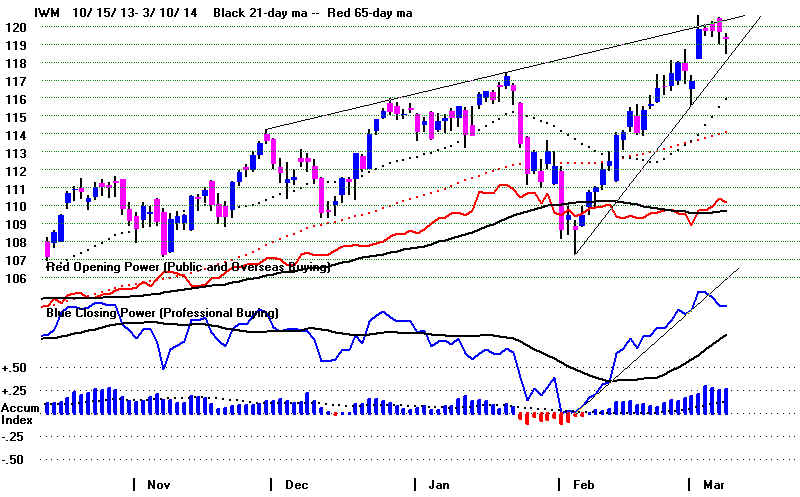
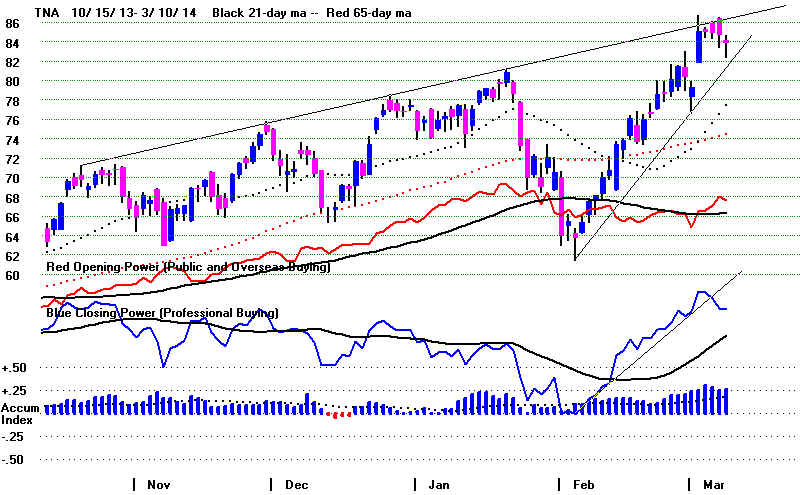
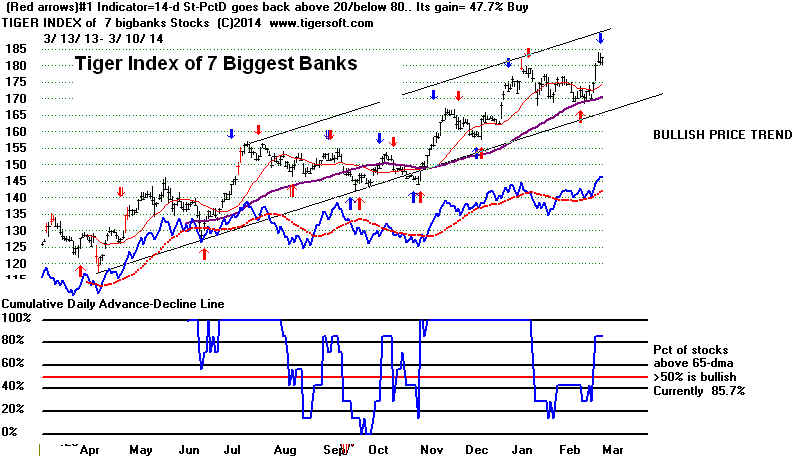
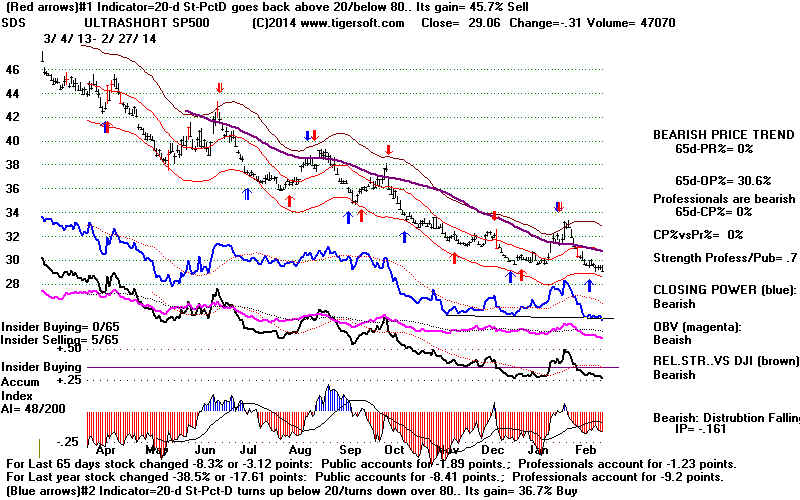
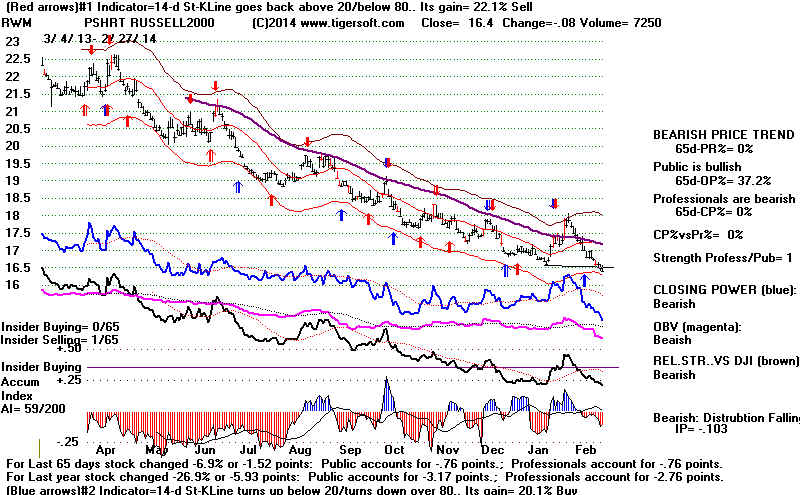
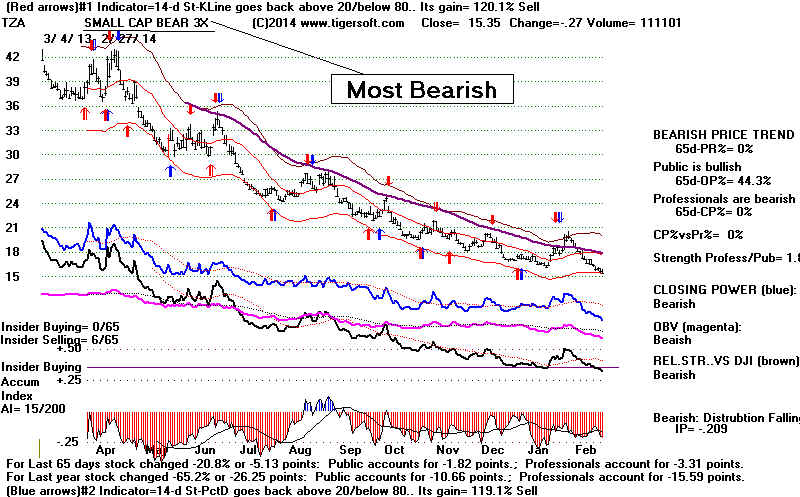
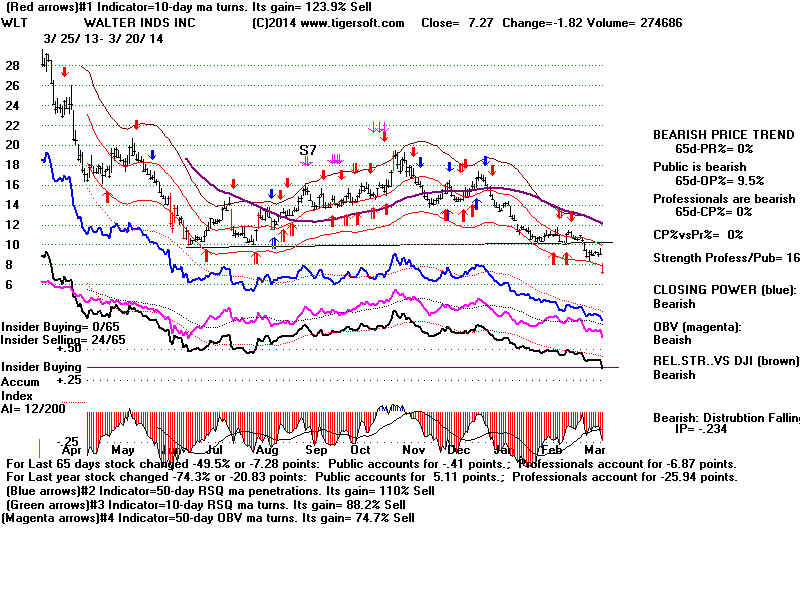
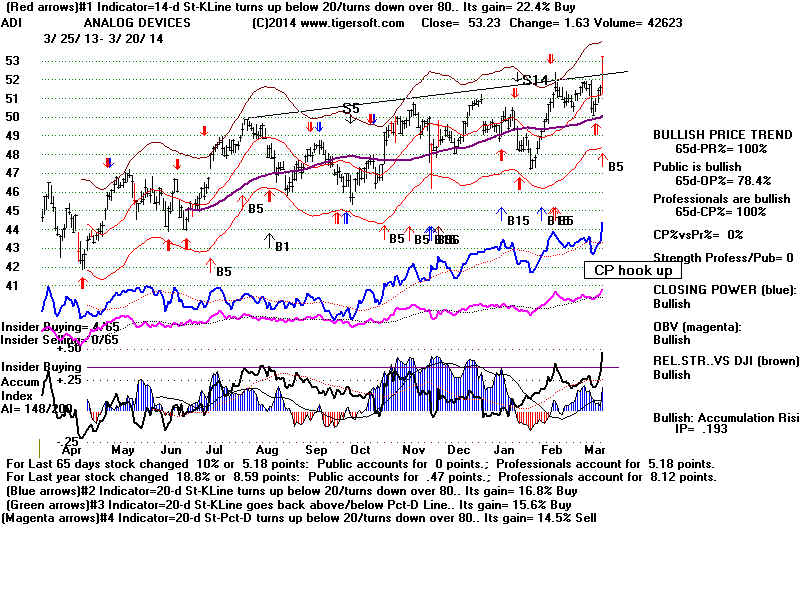
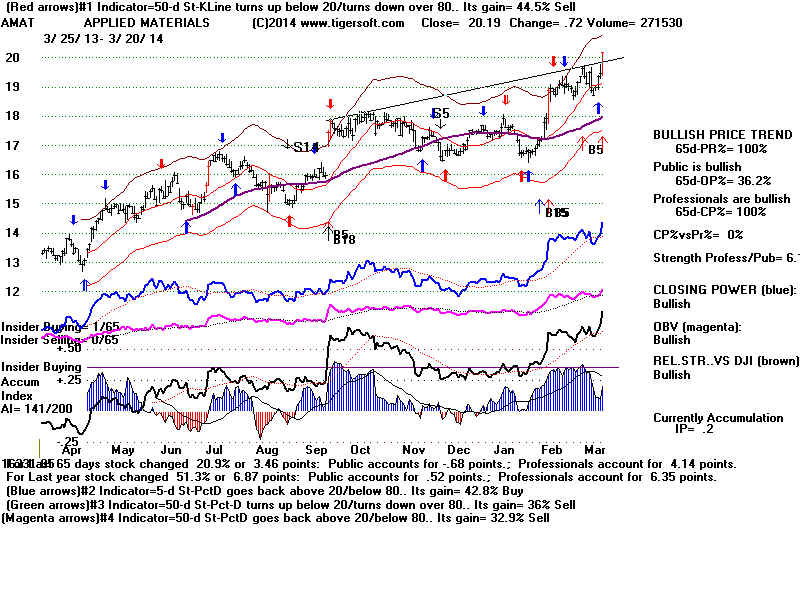
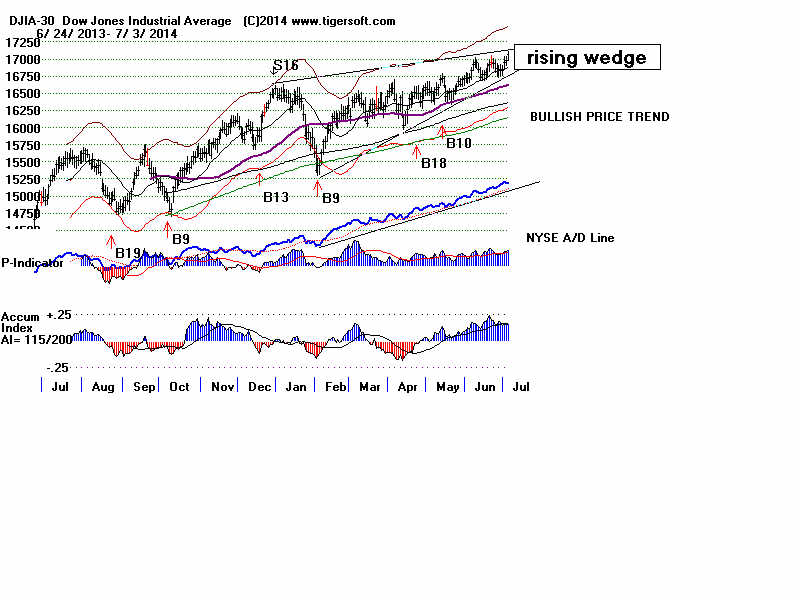
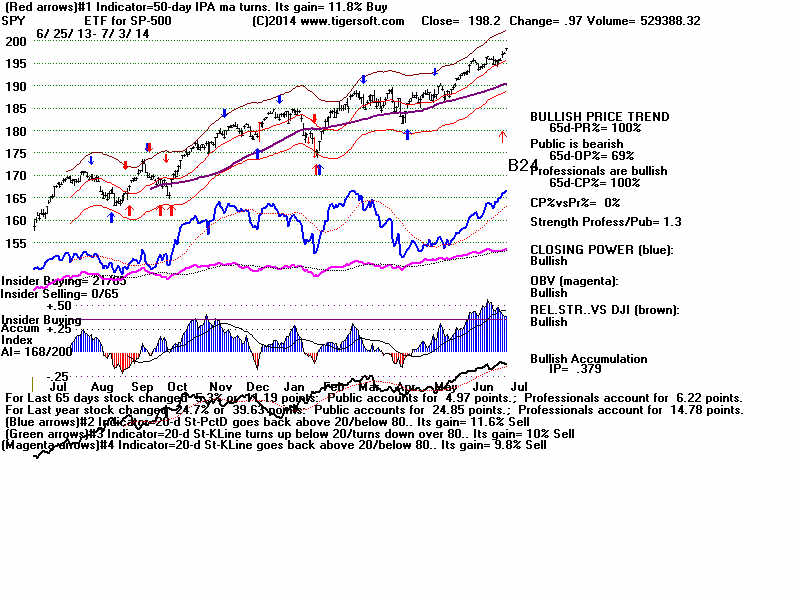
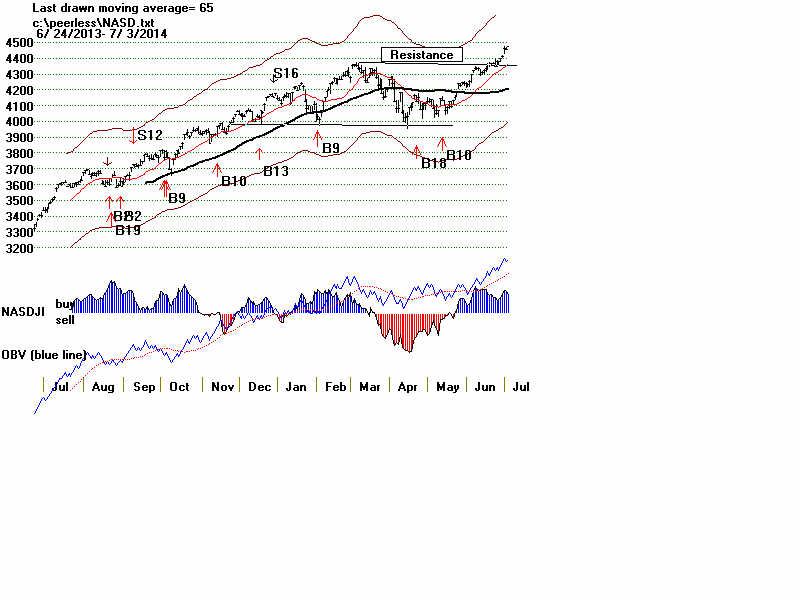
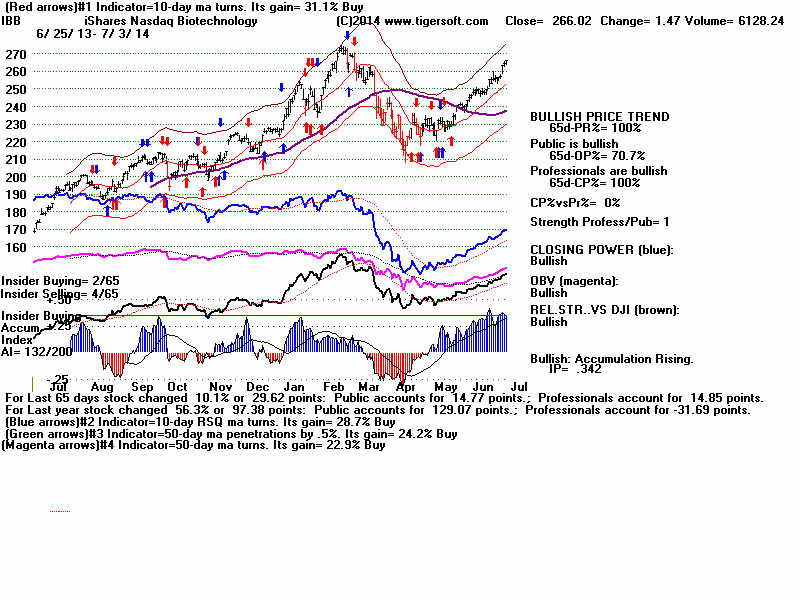
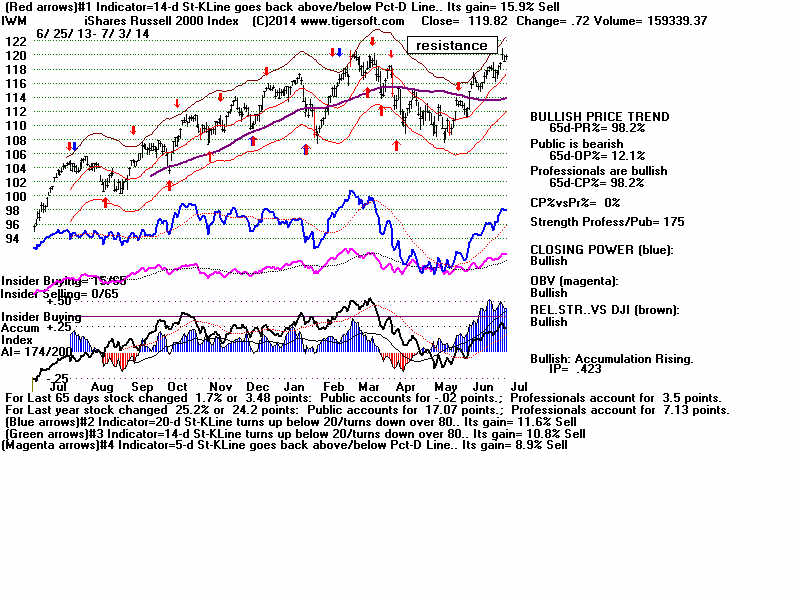
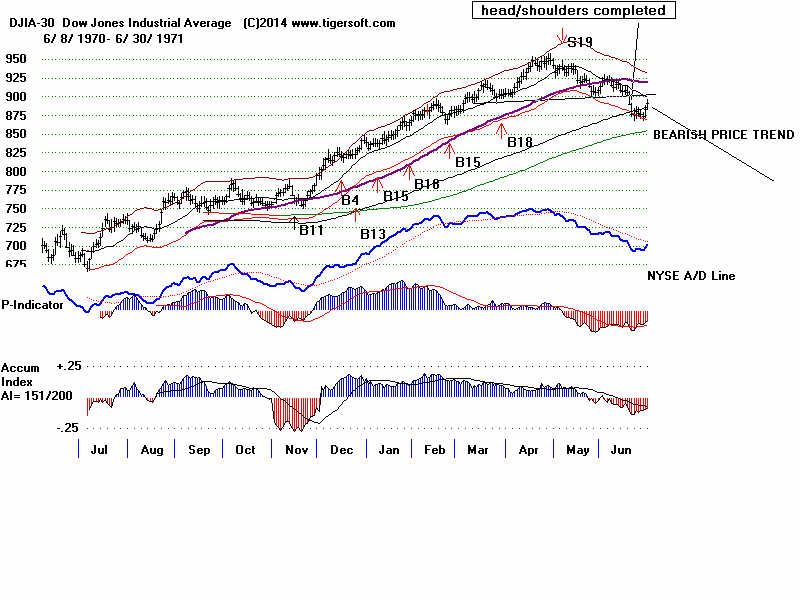
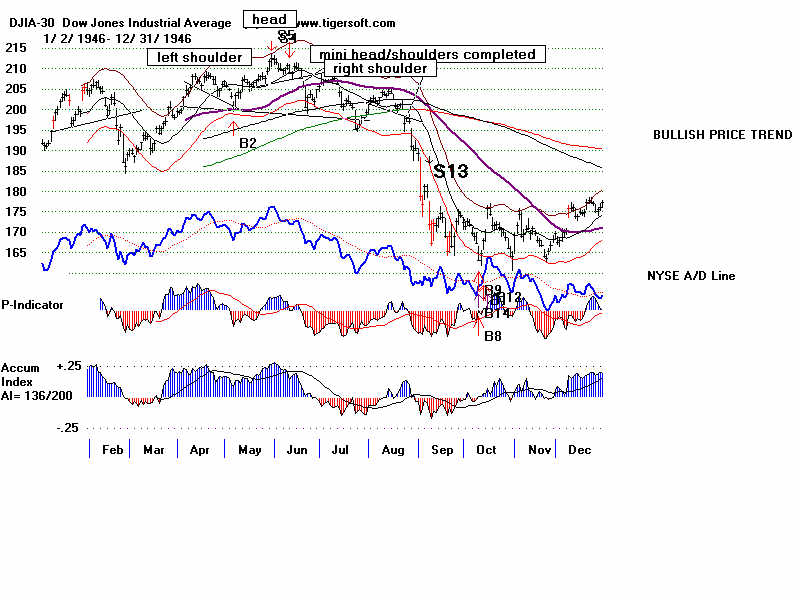
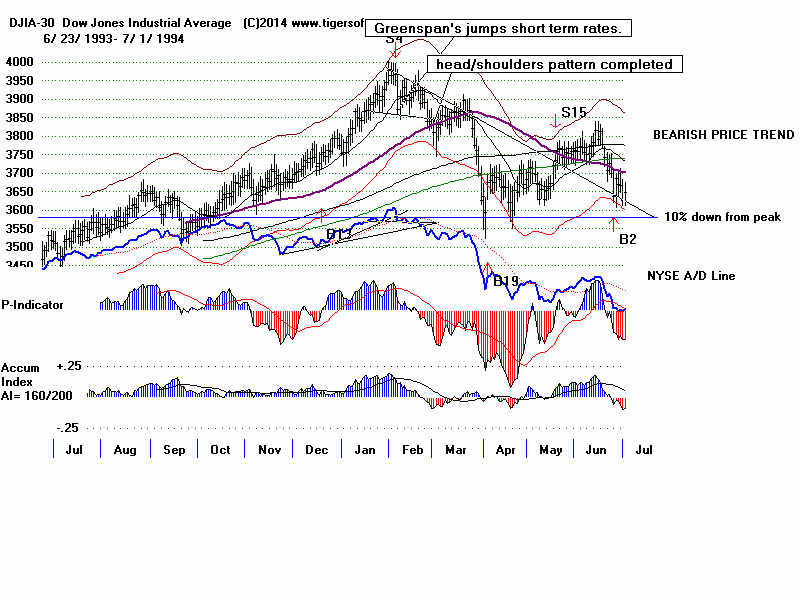
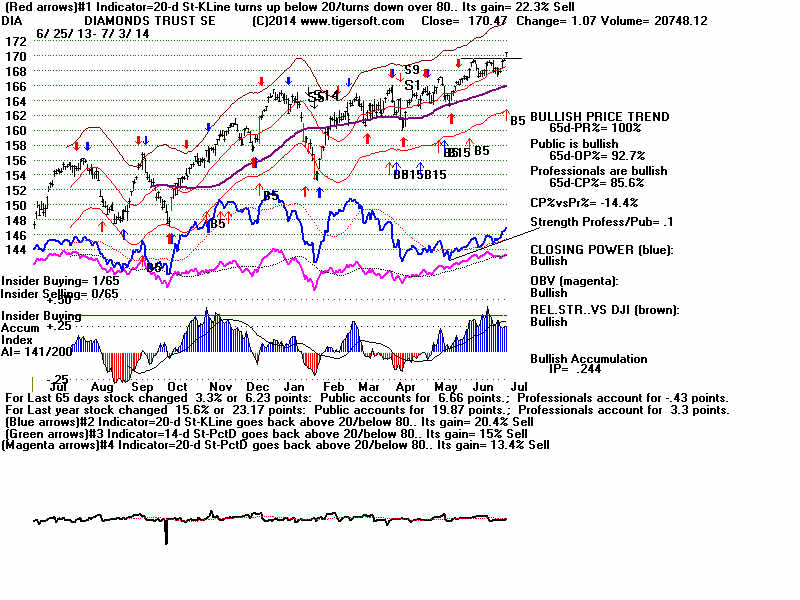
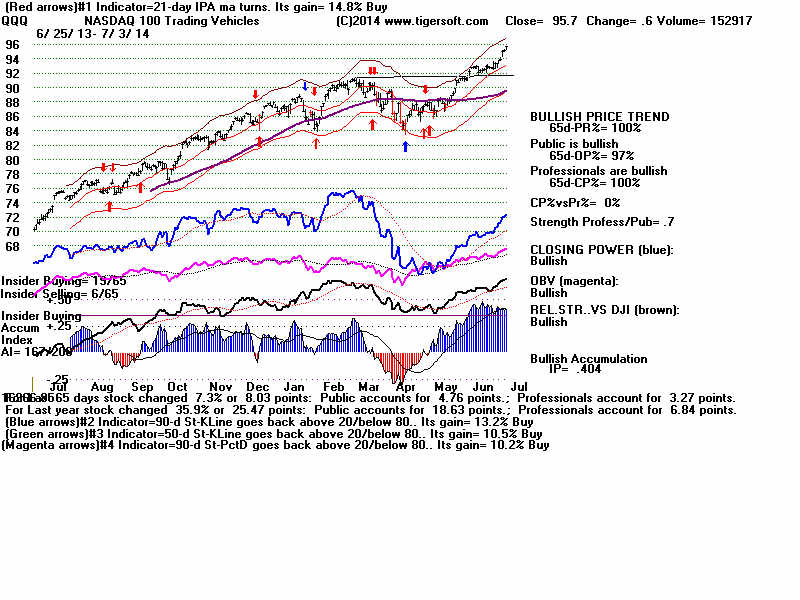
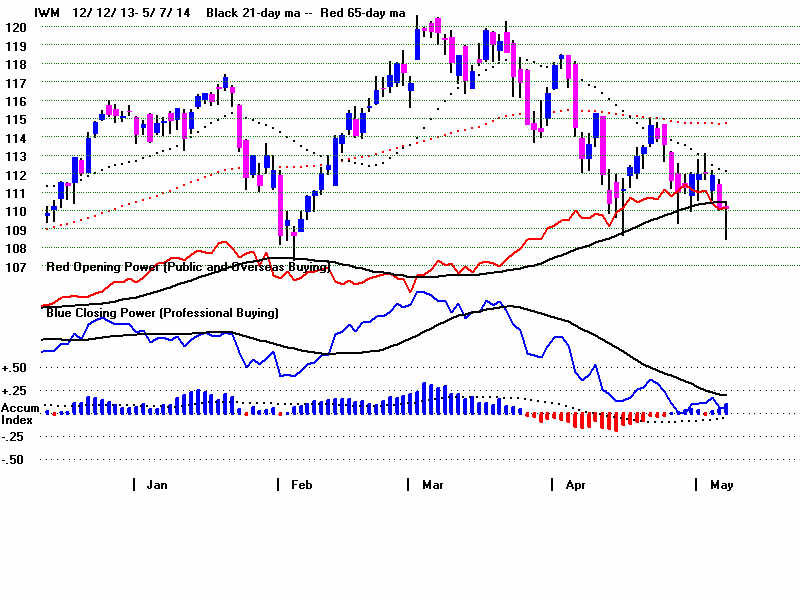
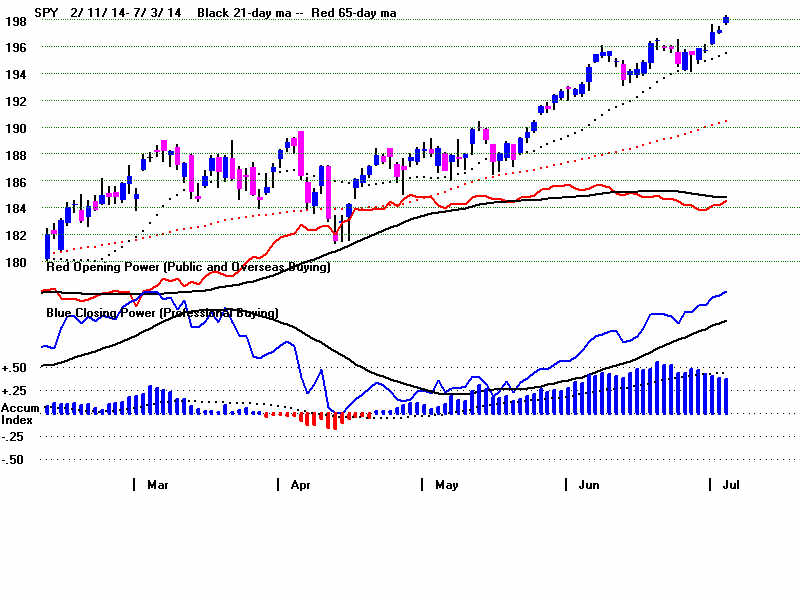
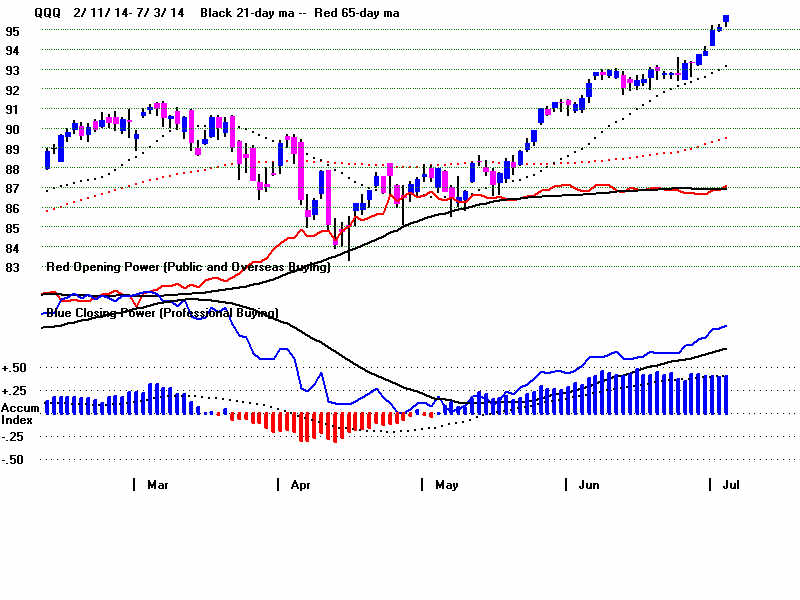
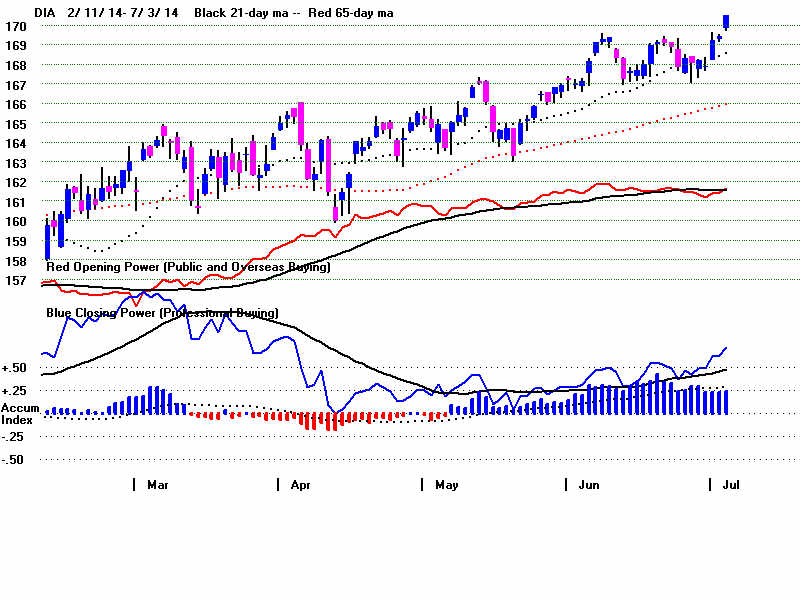
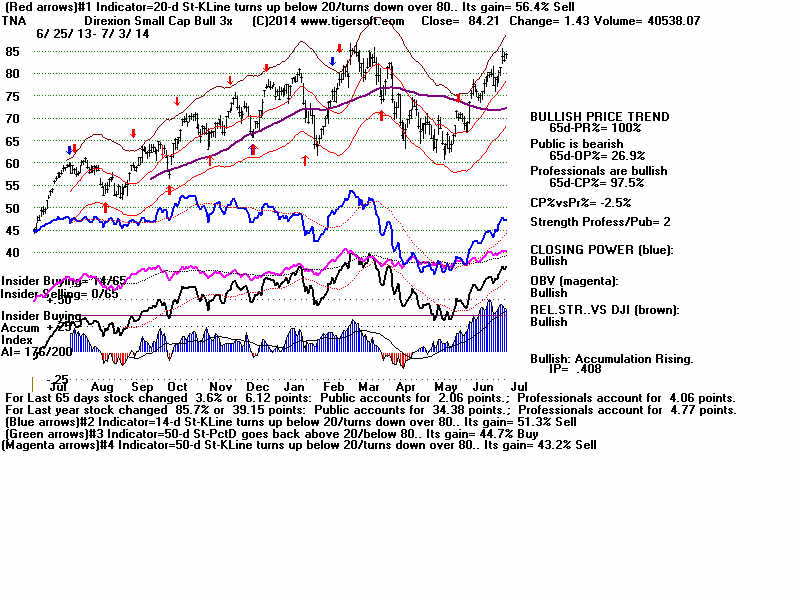
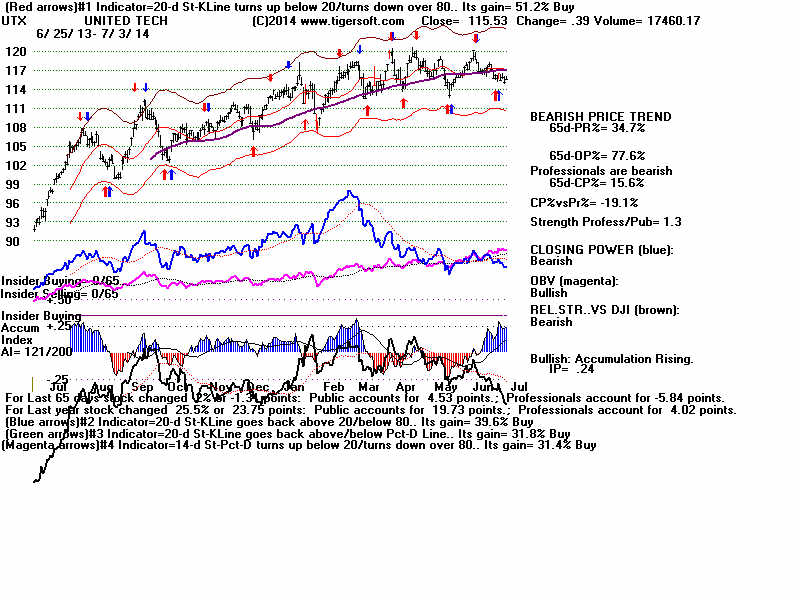
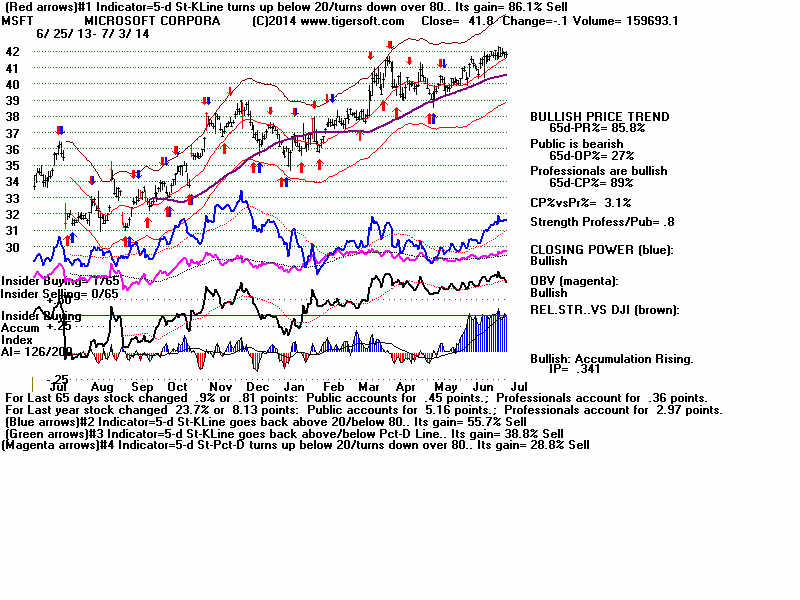
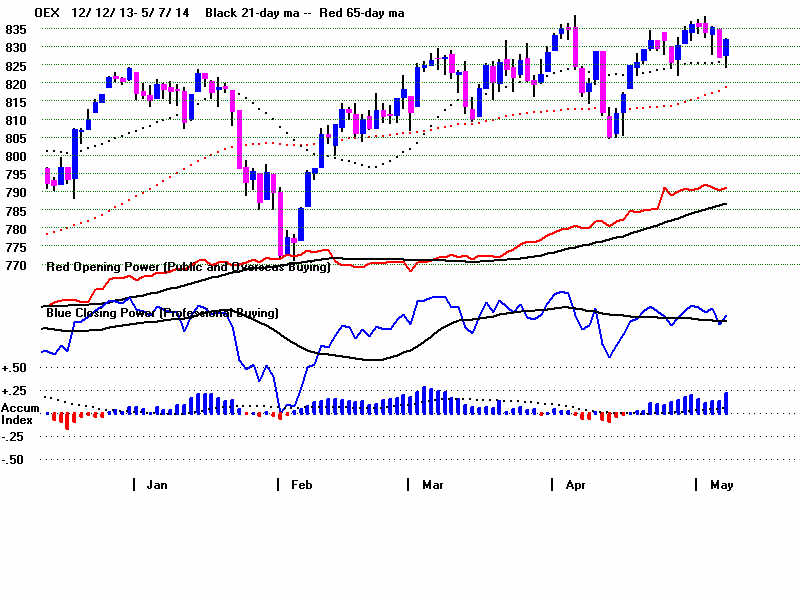
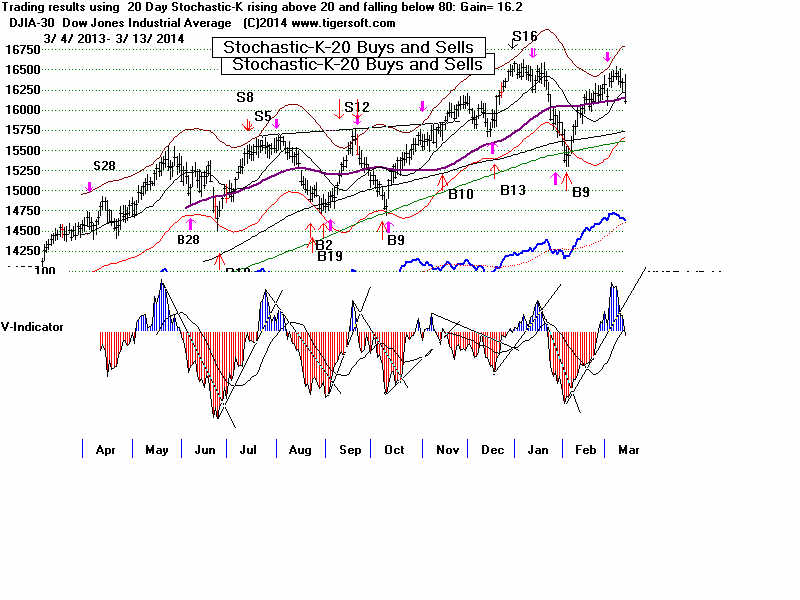
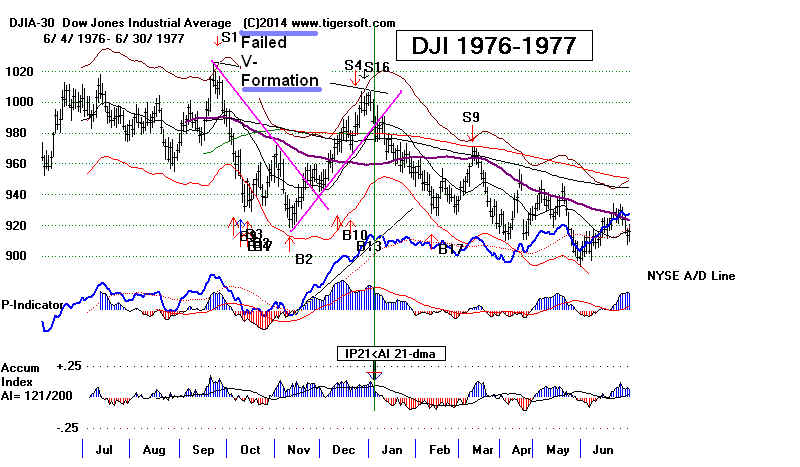
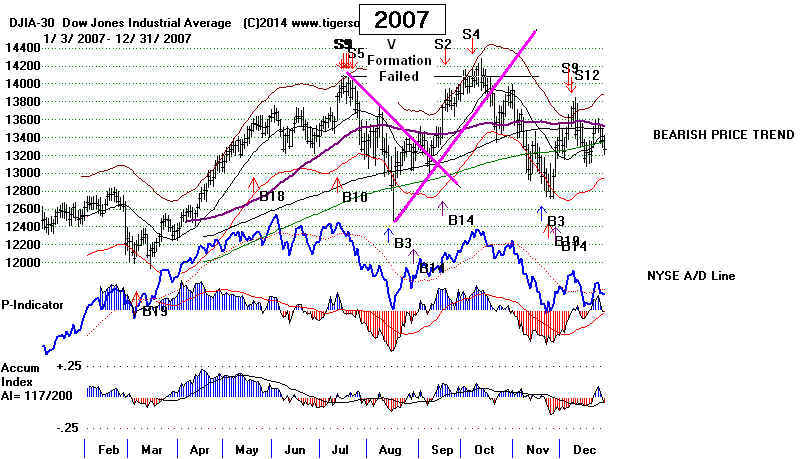
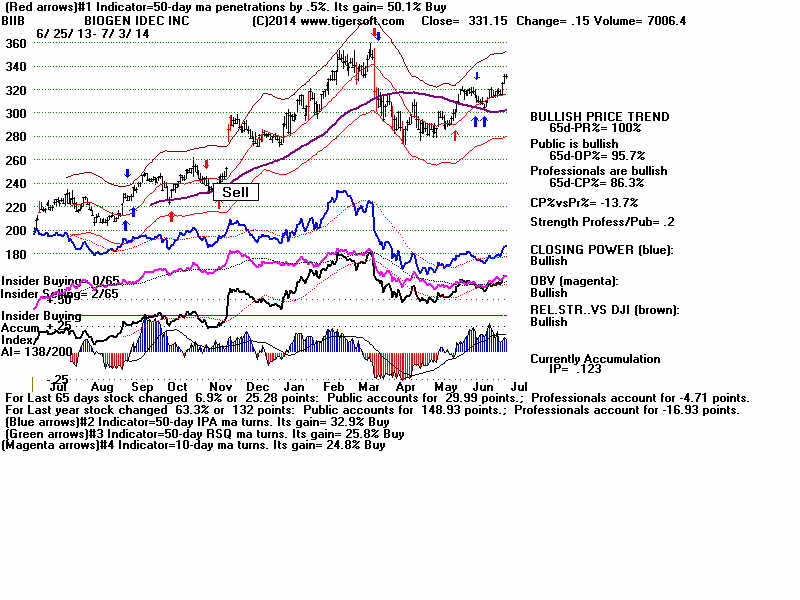
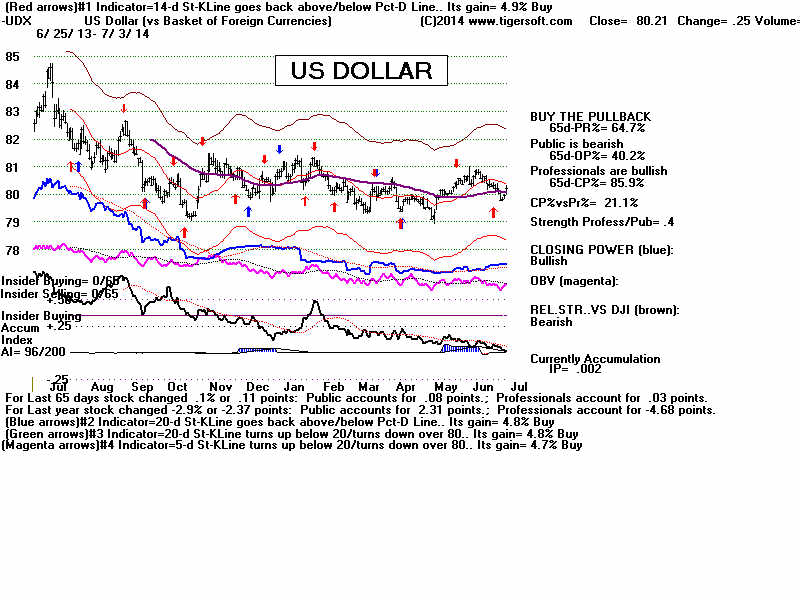
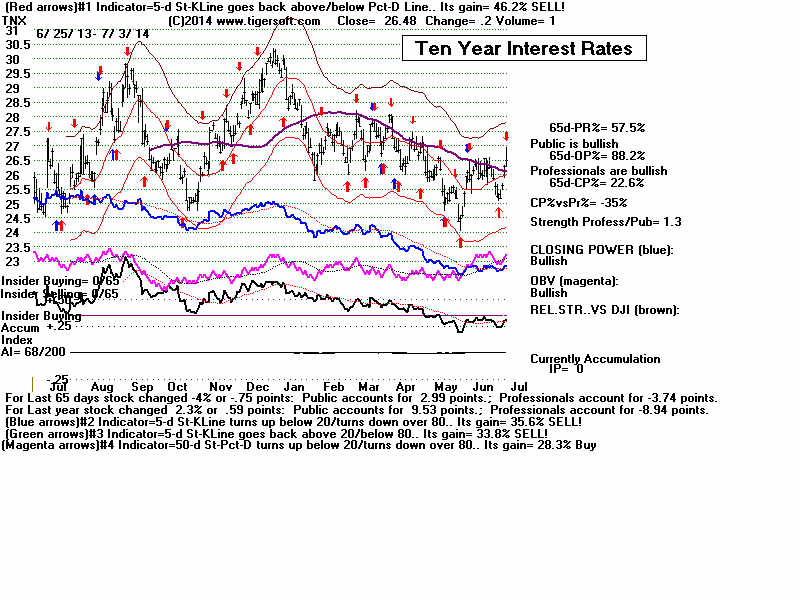
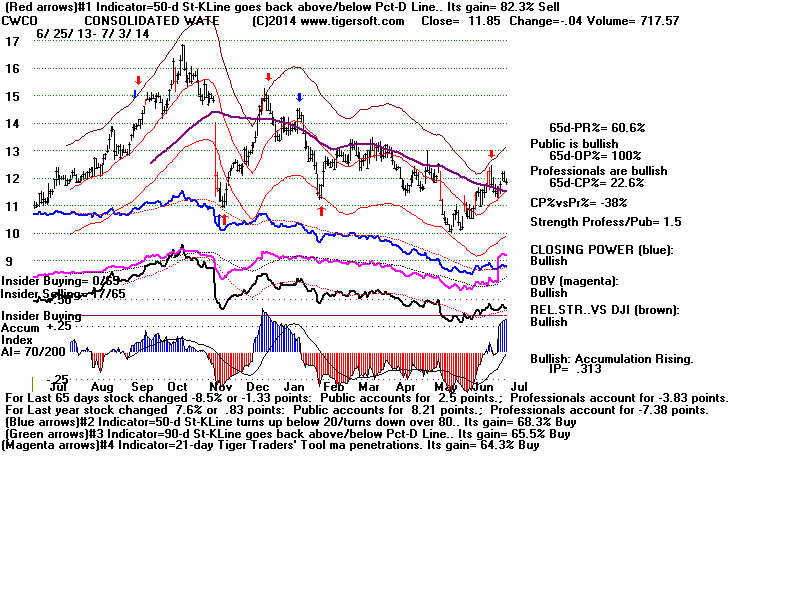
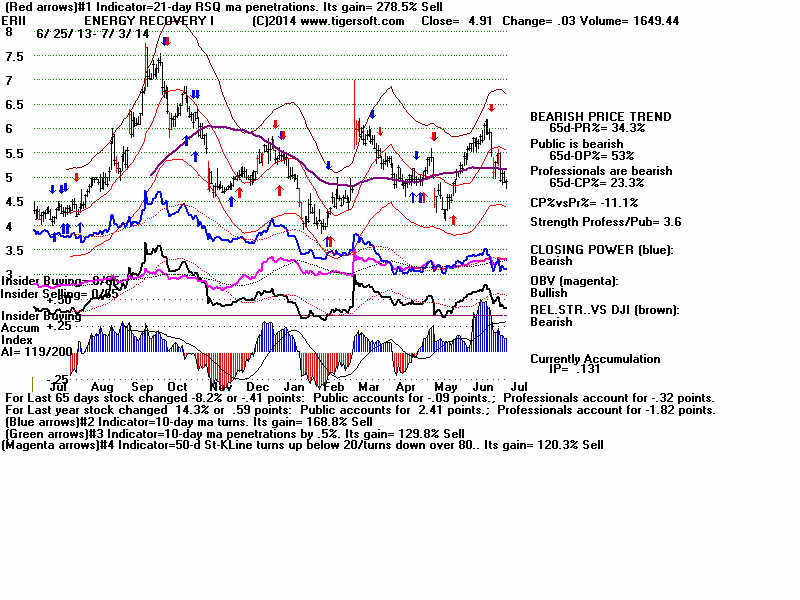
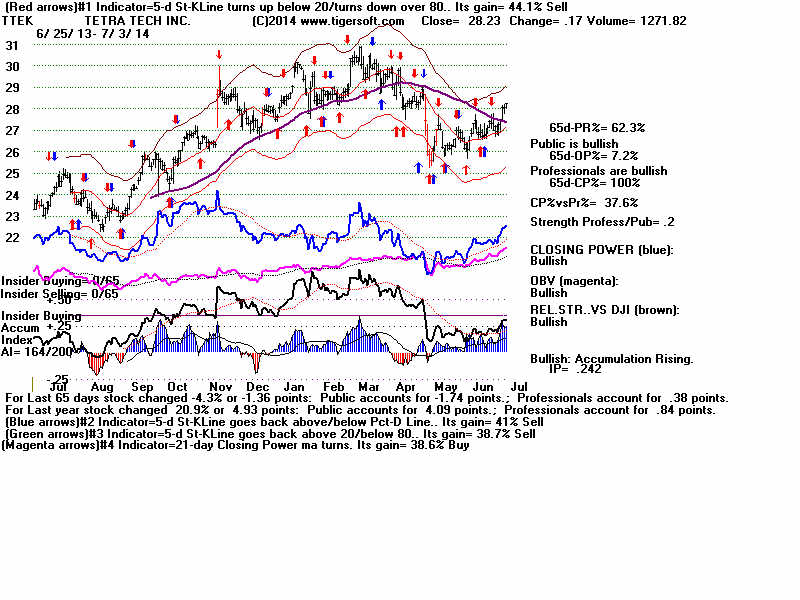
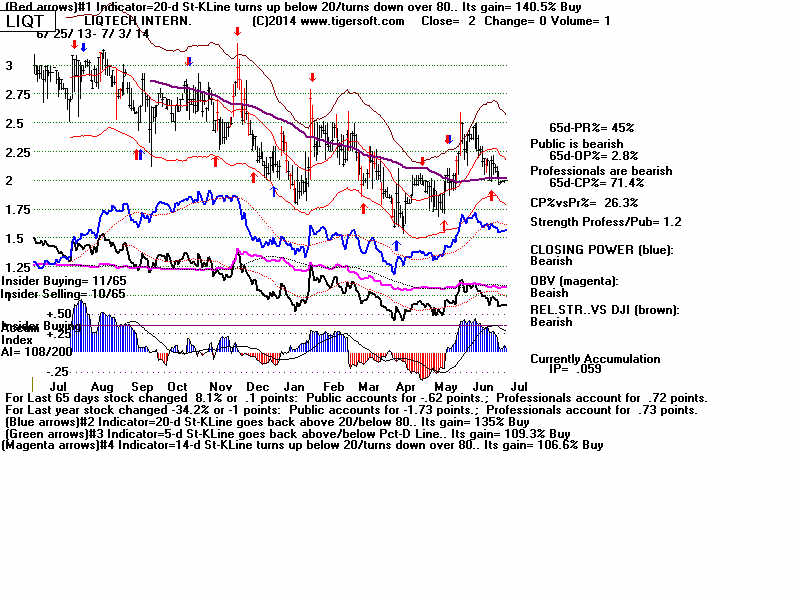
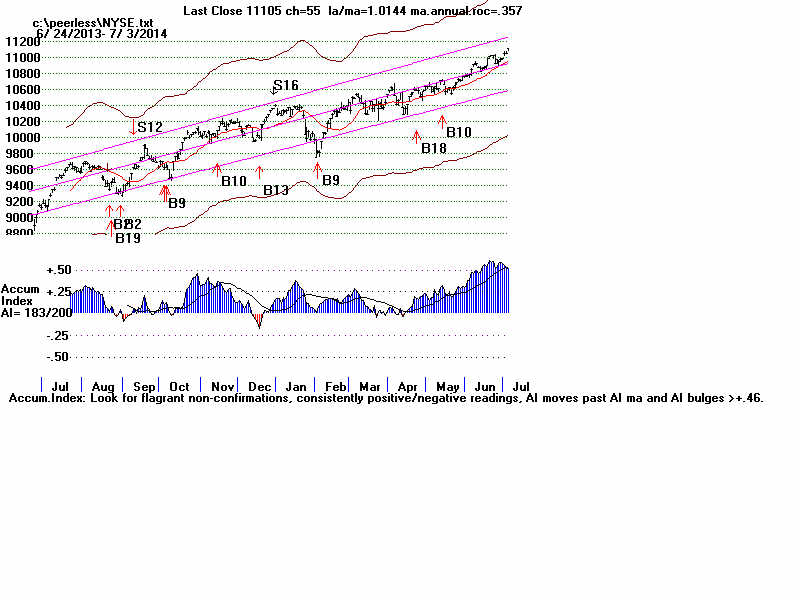
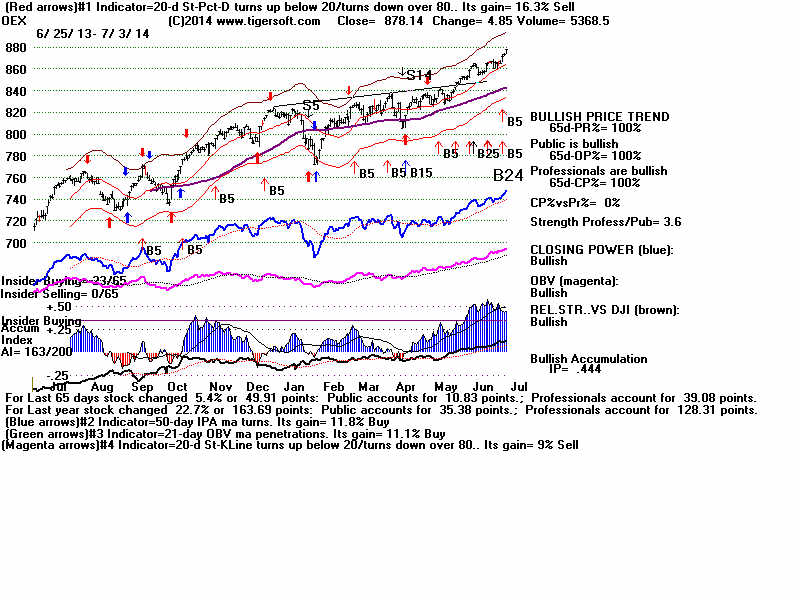
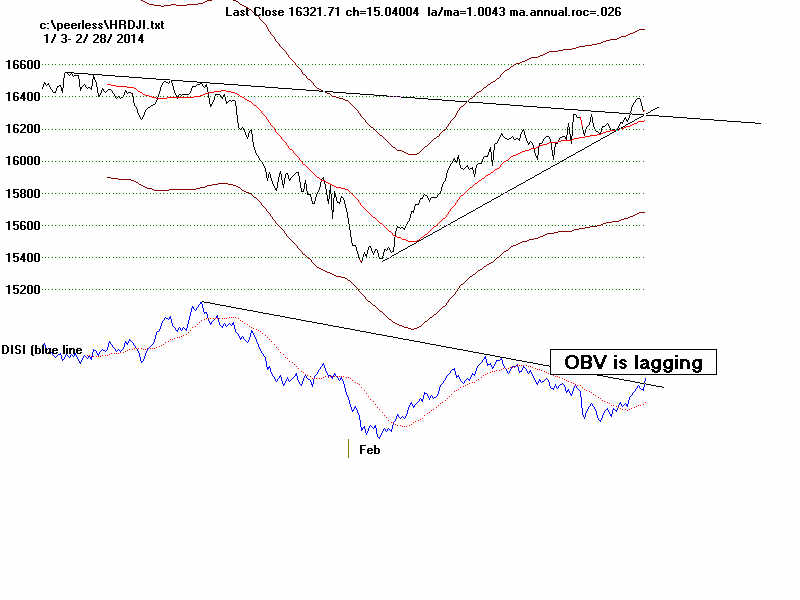
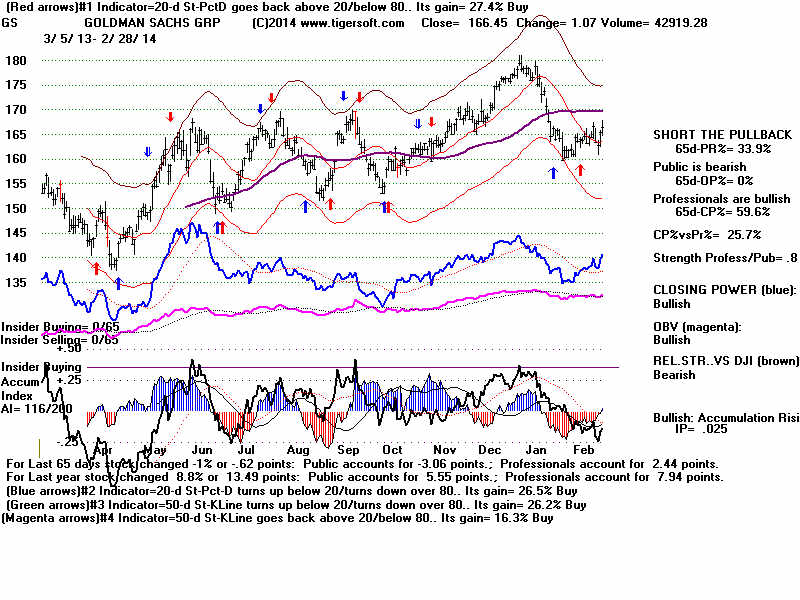
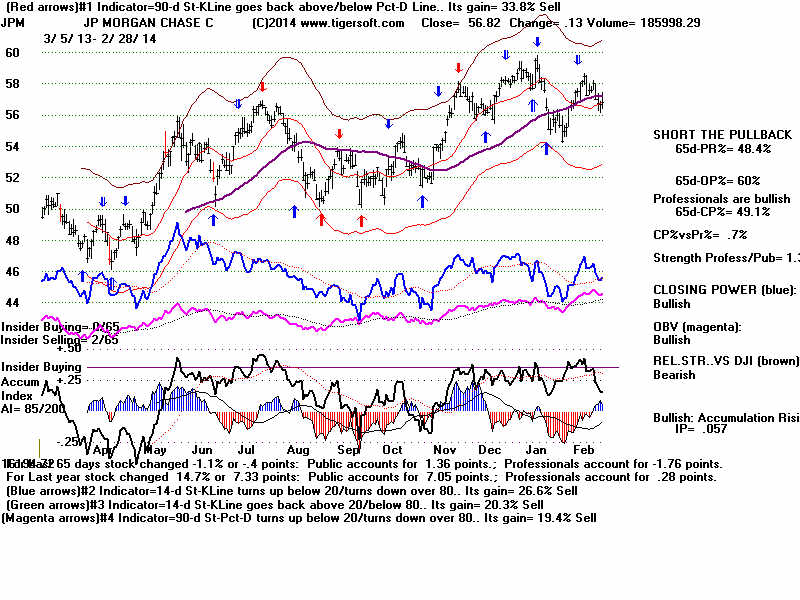
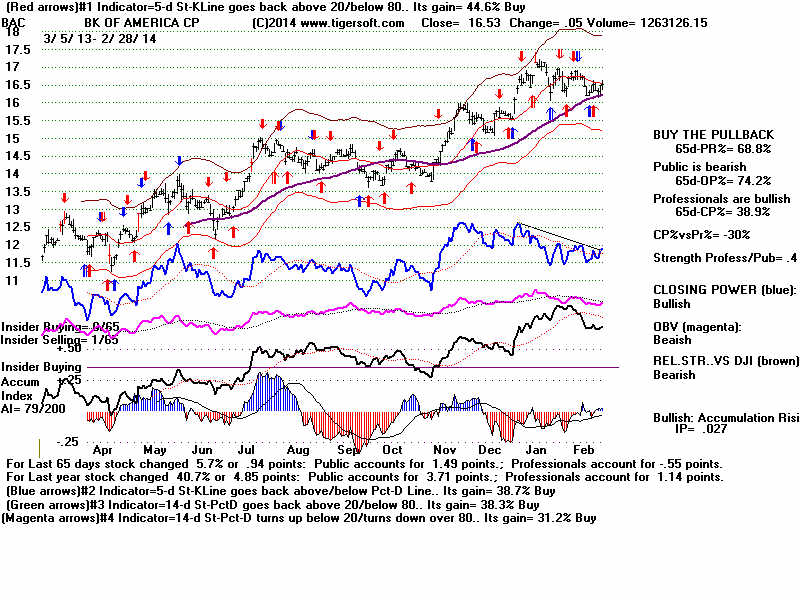
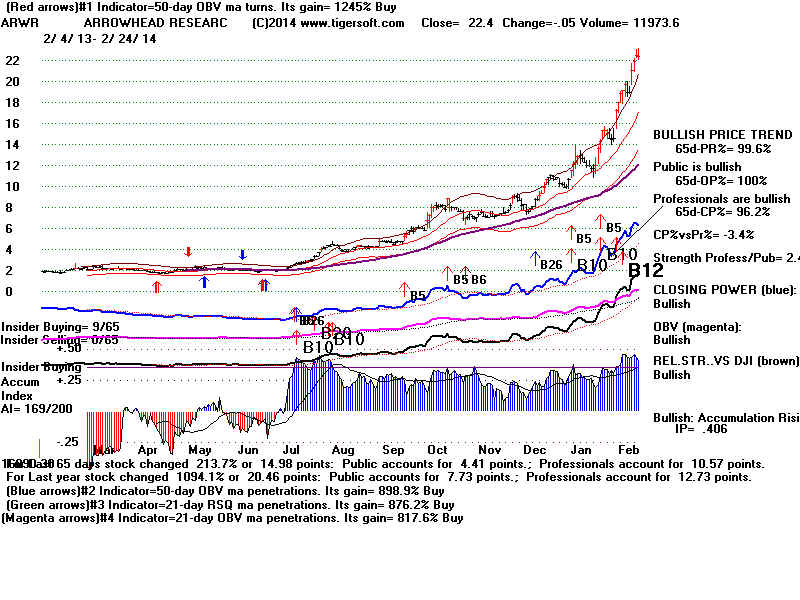
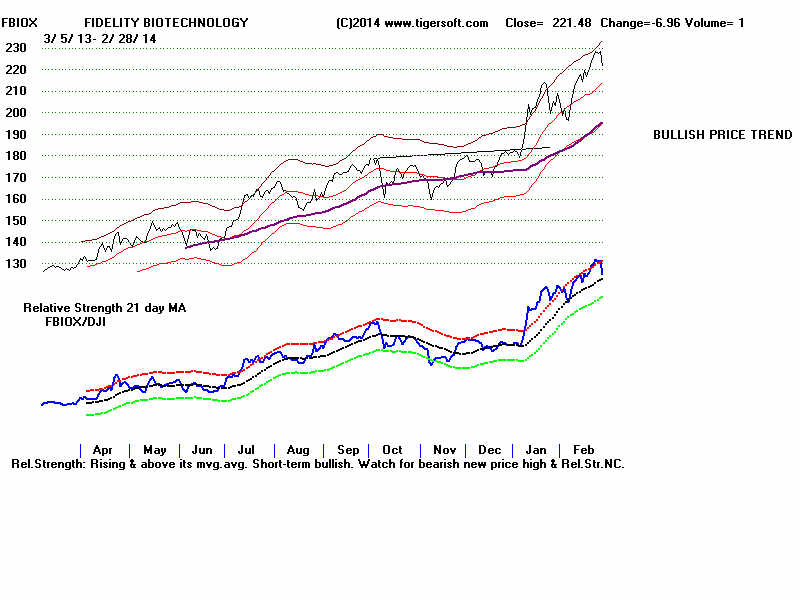
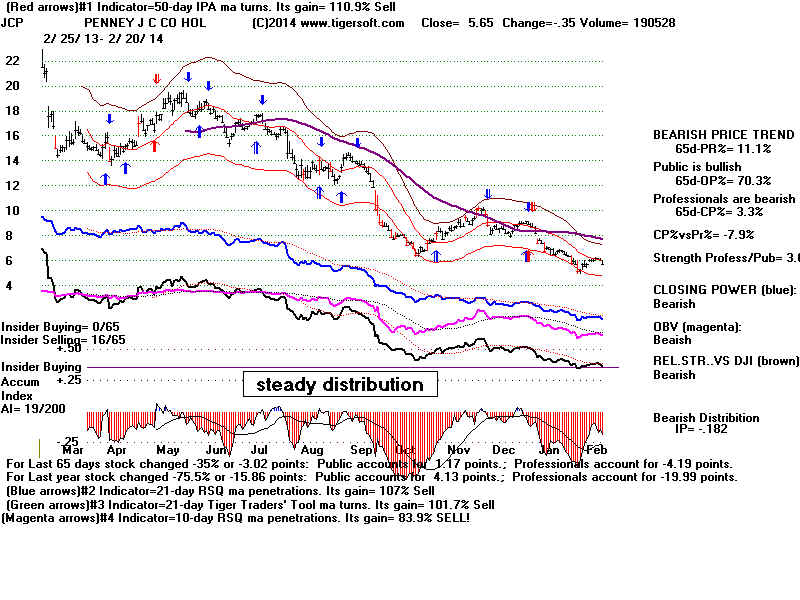
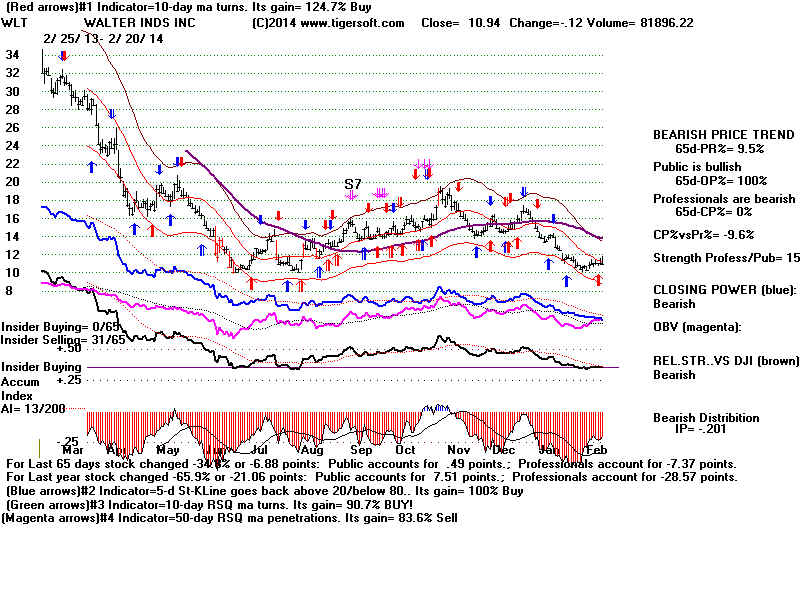