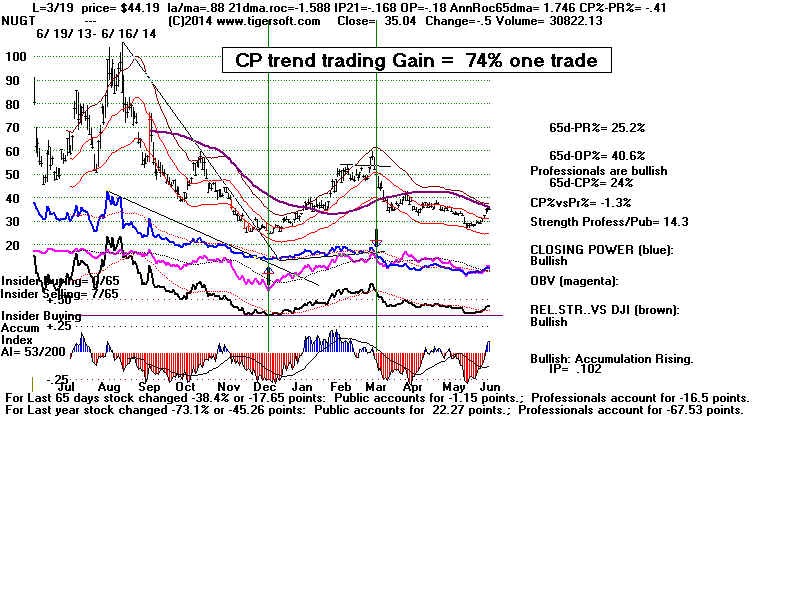
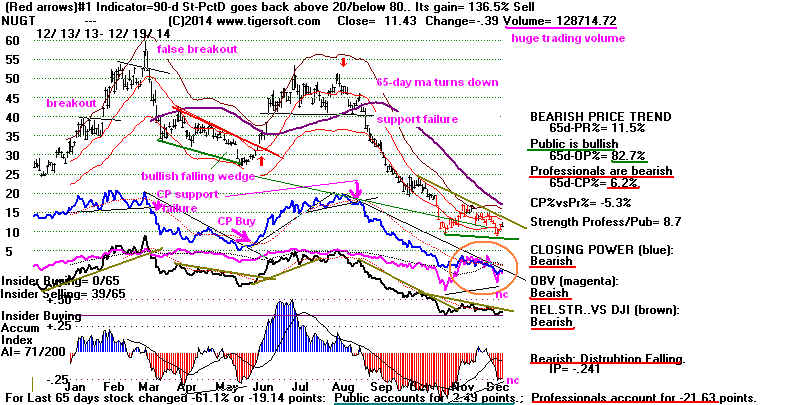
many key Tiger trading principles. See the price breakout over 40 in Feb., the false
breakout at 50, the bullish falling wedges and the key price support failure in August.
Prices generally followed the trend of Tiger's Closing Power. From May to June
prices almost doubled following the CP's break in its downtrend. See how the
CP trendbreak then occurred before prices broke their downtrend and doubled.
To confirm the start of such an advance, we want also to see a break in the
downtrending (brown) Relative Strength Line and the (blue/red) Tiger Accumulation
Index to rise above its 21-day ma.
Presently, we are in the year-end period that can bring rallies in gold and silver stocks,
but not as frequently as stocks do. We can see this by looking back at NEM, a leading
gold miner's year-end performance since 1982.
Good year-end rally: 14
(1982-3, 1984-5, 1985-1986, 1986-1987, 1988-1989, 1989-1990,
1991-1992, 1993-1994, 1994-1995, 1995-1996, 1998-1999,
2005-2006, 2008-2009 and 2013-2014.)
Very small year-end rally followed by bigger January declines: 5
(1996-1997, 2002-2003, 2010-2011, 2011-2012 and 2012-2013.)
Rally delayed until January: 4
1992-1993 (delayed until Jan 18th), 1997-1998 (delayed until Jan 12th),
2001-2002 (delayed until Jan 9th), 2007-2008 (January 19th).
No rally. 4 (1983-4, 1999-2000, 2000-2001 and 2004-2005)
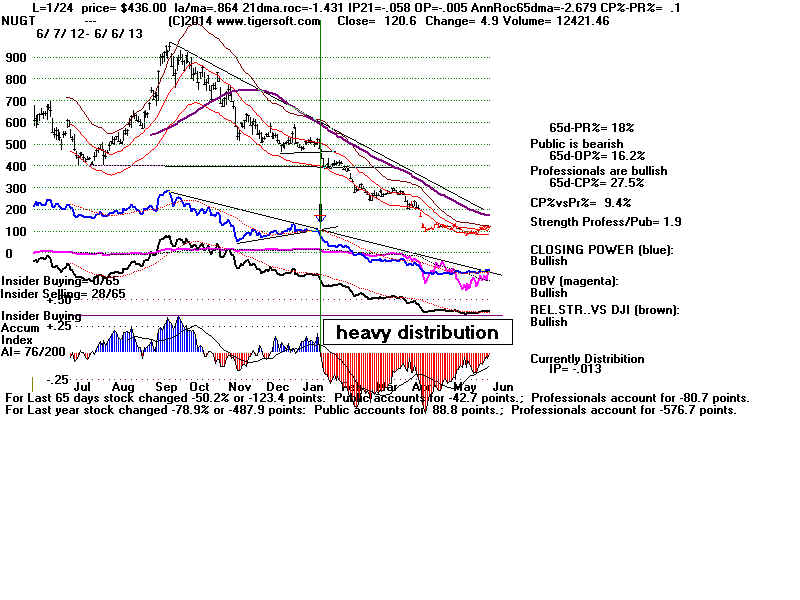
Current NUGT
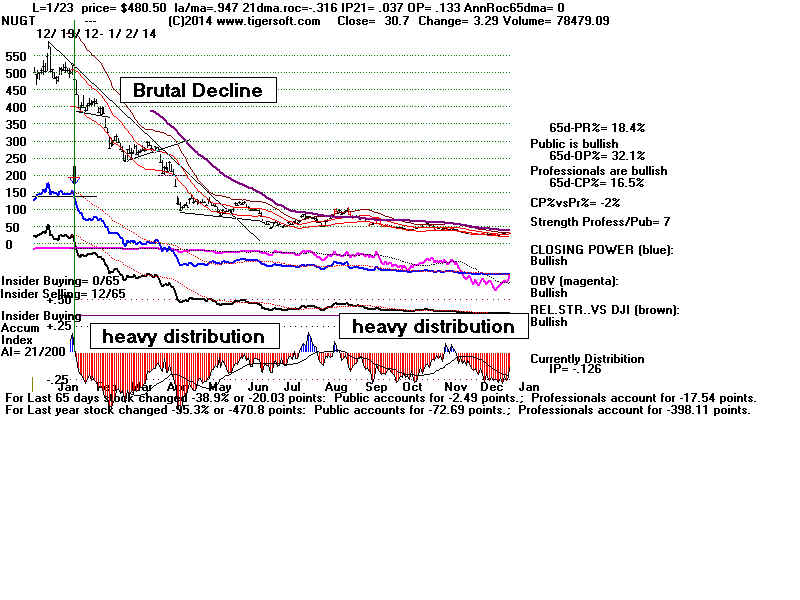
NUGT 2012
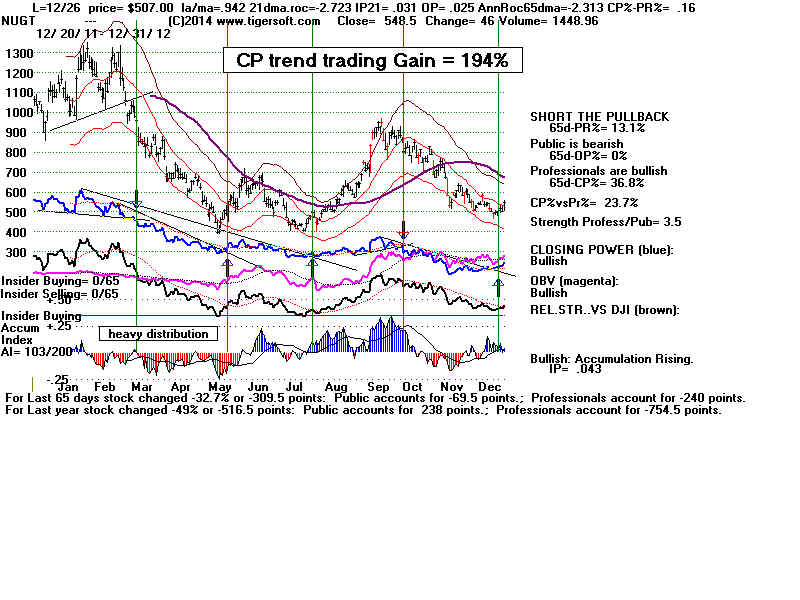
NUGT 2012-2013
