Trading Mining Stocks, NUGT and DUST with Tiger Software
(C) 2015 William Schmidt, Ph.D.
See 1/31/2015 Introducing New Tiger 6-Month Charts: 5-day MA and
Volume Studies
====================================================================================
2/13/2015 See how
NUGT's red down-day volume
warned
the stock would fall back.

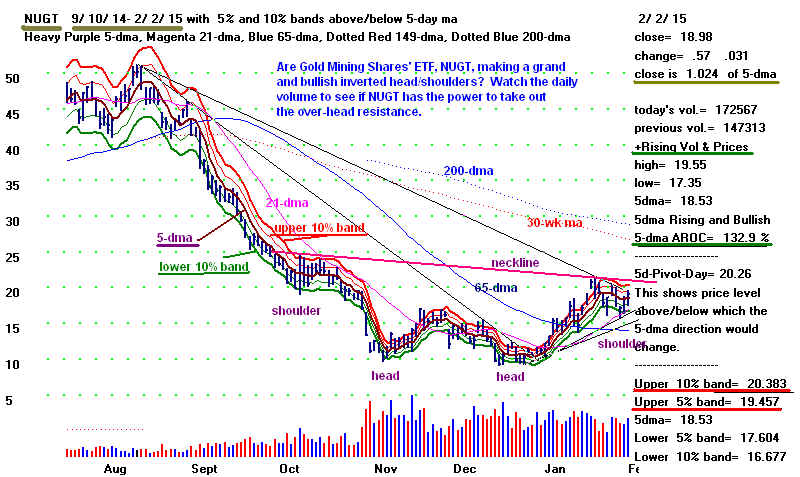
2/2/2015 Is NUGT making a grand inverted head
and shoulders, with an upside projection
50% higher? Watch the
volume on the new TigerSoft
Six-Month charts. Daily volume must increase to overcome the
overhead resistance. The 5-day ma has just turned up. It is
rising only at an annualized rate of 132.9%. This must rise in the
coming days.
1/31/2015
Introducing New Tiger 6-Month Charts
5-day MA and Volume Studies
In these new 6-month Tiger charts, we emphasize the 5-day ma and upper/lower
5% and 10% bands with stocks and volatile leveraged ETFs. Note that we
will work with 1.75% and 3.50% bands with the DJI, NASDAQ, SP-500, OEX
and major market ETFs. Here the focus is on the leveraged ETF, NUGT, and several
mining stocks.
First, note the heavy red 10% upper band, the lighter red 5% upper band and
and heavy purple 5-day ma in the chart of the 3x leveraged mining ETF, NUGT,
below. Underneath these bands are the lighter green 5% lower band and heavier
10% lower band. The 10% bands bracket about 90% of the closings in this
chart. So that most of the time, one could profitably buy at the lower 10%
despite its declining trend. This is not true, however, when prices switch from
a trading range to a steeply trading trend. Buying at the lower band is most
reliable when a stock is either going sidewise (in a trading range) or trending
up.
If you wish to overide the 5% and 10% bands, build an ascii text file in c:\peerless
named bands.txt and on each line enter the symbol and a comma
and the wider desired
band width. Examples:
DATA, .035 (DJI)
INDU, .035
DIA, .035
OEX, .035
QQQ, .035
NASD, .035
SPY, .035
IWM, .04
FAS, .06
GOOG, .08
IBM, .07
GE, .06
This will allow you to use a different set of band widths. Not that the smaller band
width
(upper and lower) will automatically be set at half the bands you have provided in
c:\peerless\bands.txt
On the right side of these 6-month Tiger charts, you will see notes about the stock's (or
ETF, index,
commodity's, currency's) closing price is relation to its 5-day ma. The "change"
is the daily price
change and the percent daily change. The next line shows how near the close is to the
5-day ma.
The ".999" means it is 0.1% below the 5-day ma. A "1.07" would
indicate the stock closed 7%
over the 5-dma. A ".912" would mean the stock has closed 8.8% below the
5-dma.
Always compare the current day's volume with the present day's volume if you are a
short-term
trader. In the chart below, the next message warns that the stock's volume fell on
the day's
rally.
Whether the 5-day ma is rising or falling and how fast it is moving up or down, gives us a
better sense of how solid is the uptrend or downtrend. Further down on the right
side of
the, the computerized notes tell you what the annualized rate of change (AROC) for the
current
5-day ma. You can use the vertical line command to see the 5-dma AROC at past points
on the chart.
We know that in computing the 5-day ma tomorrow, we will be adding the new day's closing
price and dropping off the price six days before, or the fifth day in the current set of
five
days that produce the 5-dma. This is the key "5-day pivot Day." As
long as tomorrow's
close is above the "5-day pivot Day", the 5-day ma will be rising. But a
close below will
this "5-day pivot Day", will cause the 5-d-day ma to turn down. If the
stock's internals
or volatility is worrisome, close out your long position near the close if the stock looks
like
it will close below the 5-day ma. Should you use this procredure to cur losses?
The regular
TigerSoft charts let you see how well 5-day ma turns have worked for the last year.
With
NUGT, they lost 17.6% conservatively calculated using the commands Signals-2 + MA
Turns
+ 5). When you graph these Buys and Sells, it becomes obvious that most of the many
losses
are the small whip-daws that occur as the stock remains locked in a trading range.
So, the
conclusion suggested here is to use this 5-day pivot point system as much as possible
after
there has been 6 or more weeks of consolidation and it seems the stock may be moving
the wrong way out of the consolidation zone.
At the bottom on the right, see the differnent bands' price levels, for placing limit Buy
or Sell orders.
Note these charts show moving averages other than 5-day ma. The 21-day and
65-dma tells us the intermediate-term trends, one month and three-months. The
149-day and 200-day ma are used to tell us the longer term trends.
When prices are above these other mvg.avgs., the relevant trend is considered to be rising
provided the mvg.avg itself is rising. Until the mvg.avg. itself turns up (down),
there
is a good chance a rally will fail (decline will be quickly reversed). The 65-day
and 200-day
moving averages are considered the most important. We generally try to trade mostly
in the direction these two moving averages show.. Note that any of these moving
averages
can bring short-term reversals, as can well-tested support or resistance. Thus, for
traders
they represent useful price targets on the first rallies up to them. The same thing
is true
in reverse for traders who are short when prices fall to these mvg.avgs. Unless the
internals
of the stock are very good, short-term traders are usually well-advised to take profits at
these points.
Examples:
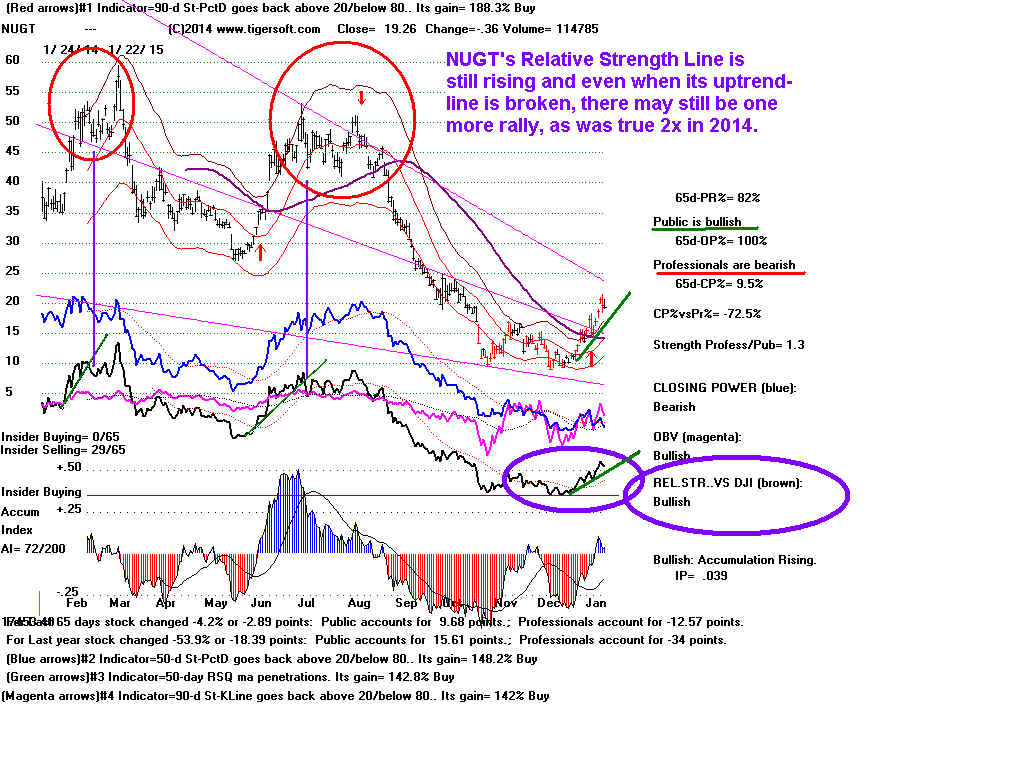
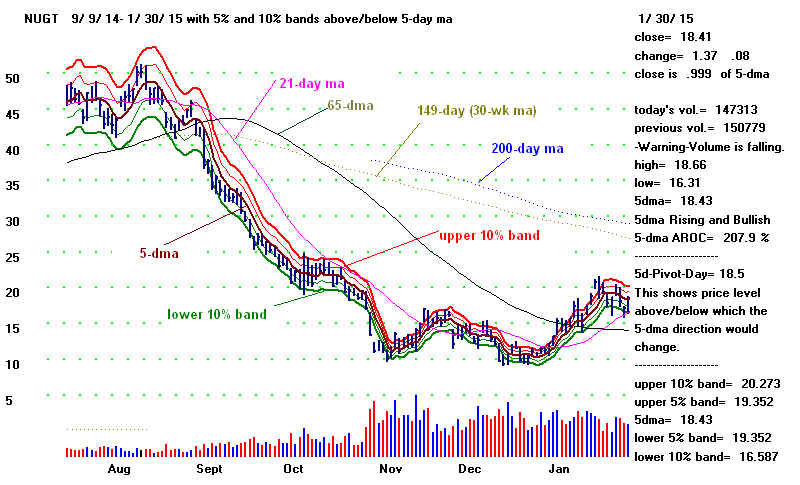
In early Sept 2014, NUGT (above) broke below its key 65-dma AND below well-tested
horizontal support. This is quite bearish. Down-day (red) volume rose on the
decline, confirming the bearishness. Prices fell sharply. The decline was further
confirmed when the (pink) 21-dma fell below the 65-dma. The declining prices managed
to stay between the lower 10% band below the 5-dma and the falling 5-day ma itself.
There was no rally back to the 21-day ma to go short until October. Short sellers
can ptofitably use any rally back to the falling 5-dma to go short when the 5-day AROC
is falling this fast, below -300% on an annualized basis. .
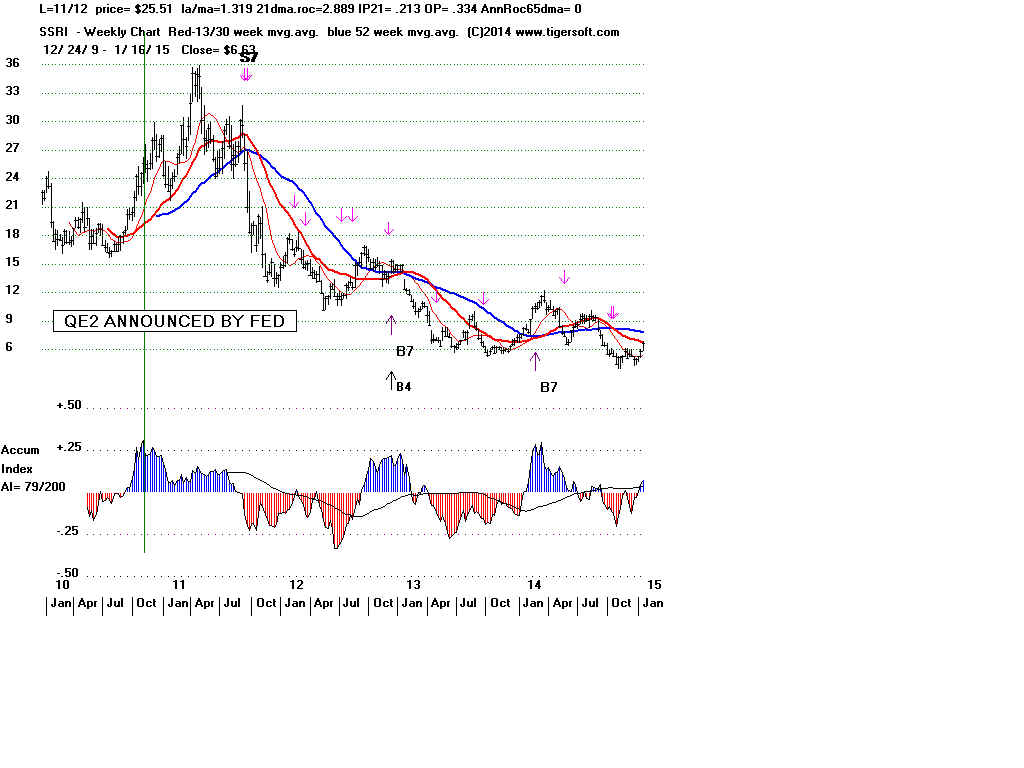
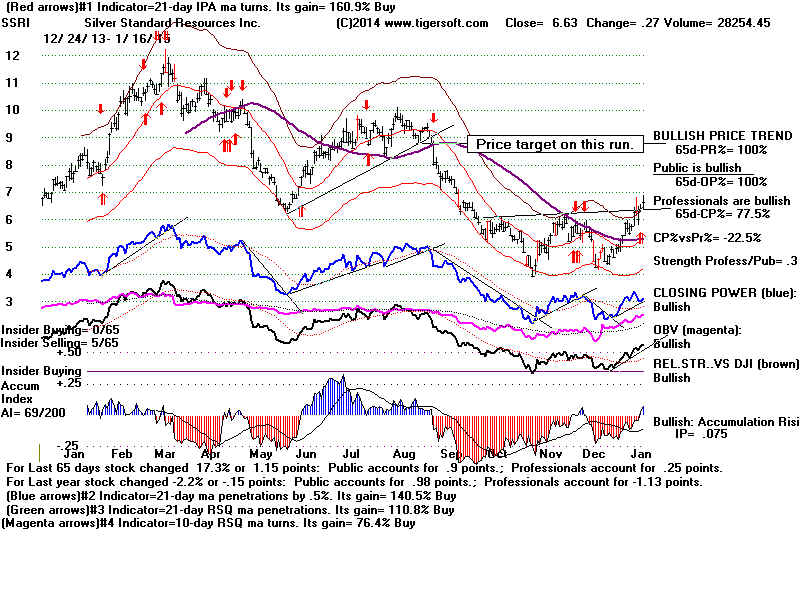
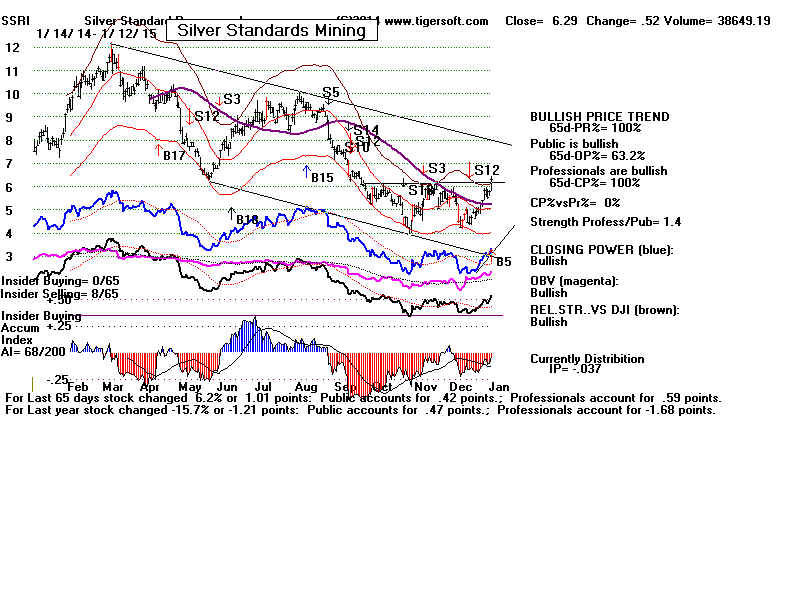
With SSRI below, 3-day clusters of increasing (red) volume on successive down-days is a
warning of dangerous institutional dumping. On the other hand, seeing the highest
(blue)
up-day volume for months is a bullish sign. Seeing the (blue) up-day volume rise
above the
previous day's (red) down-day volume is a good reason to buy if prices are at the lower
band. This was true at the November and December bottoms. See also how the
(blue)
up-day volume failed to keep growing at the January peak. That this was a short-term
top was also suggested when prices closed at the days lows after being turned back from
the falling 149-day (30-wkma).

Some Rules for Very Short-Term Traders,
Watch the 5-day ma, its band and subtle daily
volume non-confirmation
clues about
trend-changes at the upper bands and lower around 5-dma
When the 65-dma is rising:
Buy on dips to the 5% lower band and more on dips
to the 10% lower band. Sell one or both positions at the
5% upper band.
When the 65-dma is falling:
Sell Short on rallies to the 5% upper band and more on rallies
to the 10% upper band. Cover both positions at the 5% lower band.
If the 5-day ma is falling steeply and all rallies seems to fail at it,
with no closes above it, Sell Short the stock on any intra-day rally
to that 5-day ma. Use the 5-day pivot point as a stop loss.
Provided there has not been a flat-topped breakout:
On a rally to the upper 5% band or higher, long positions should
be Sold when daily volume is below the previous day.
After a rally to the upper 10% band, it is a Sell when daily volume
increases on the next declining day.
Provided there has not been a flat-bottomed breakdown:
After a decline to the lower band, it is a Buy when daily volume
increases on the next rising day.
With stocks down a long ways, the lifting of tax-loss selling pressure
in January offers excellent long trades in beaten down stocks,
provided there is enough buying interest, as shown in surges of
(blue) up-day volume.
More Examples to study
1/23/2015 www.tigersoftware.com/DEN/index.html
Buys and Sells on Entire Mining Industry
2014
1/22/2015 www.tigersoftware.com/DEN/index.html
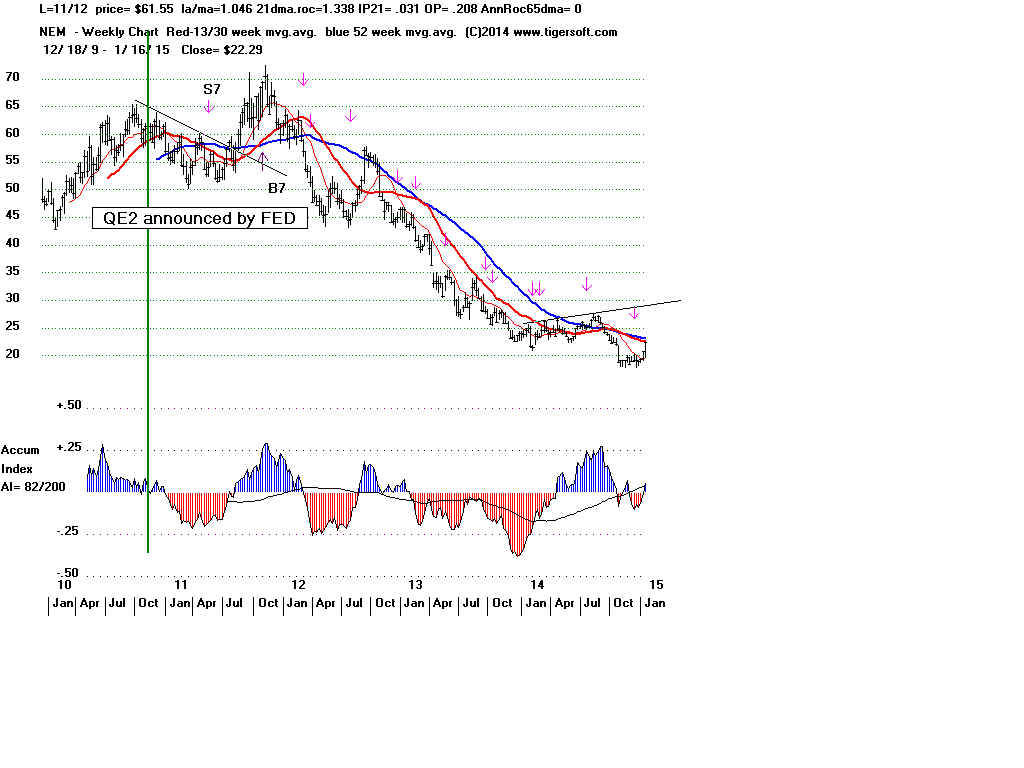
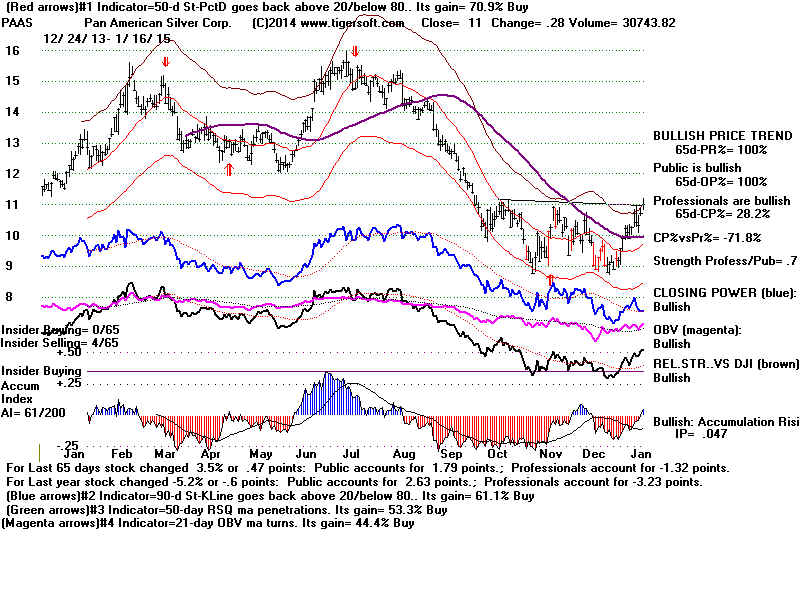
Relative Strength Lines still rising for NEM,
SSRI, PAAS and NUGT.
The US Fed's QE-2 was more bullish
for silver than gold.
------------------------------------------------------------------------------------------------------------------------------
1/15/2015 www.tigersoftware.com/DEN/index.html
Relative Strength
Lines rising for NEM, SSRI, PAAS and NUGT.
Both Professionals and Public
are net buyers.
Expect higher prices.
Charts here are re-sized
owing to loss of main computer on Monday.
========================================
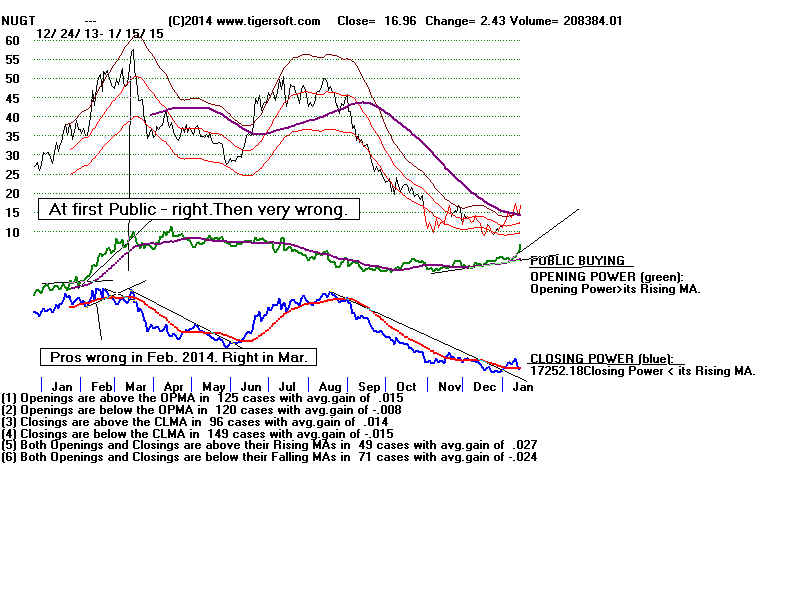
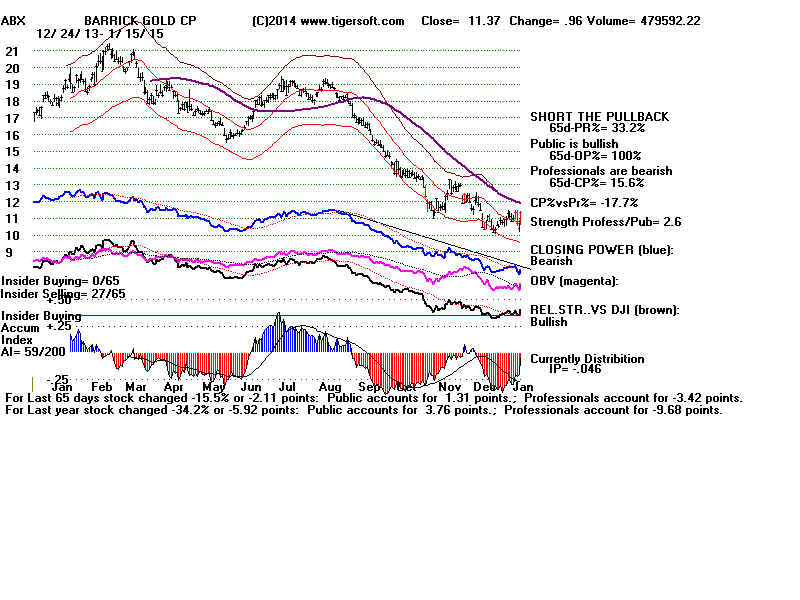
1/15/2015 www.tigersoftware.com/DEN/index.html
PUBLIC ARE NOW BIG BUYERS OF NUGT.
Red Distribution shows there still is resistance overhead.
See ABX chart below and 1/13/15
charts.
In Jan-Feb 2014, this still allowed
a big advance for a month.
Then disaster struck NUGT and Pros
were vindicated.
Back then, the broader equities
market did not look so vulnerable,
but DJI did decline until the end
of January.
NUGT is bullishly back above
65-dma. A rally forces shorts to cover.
The last decline can be seen as a
successful test of 65-dma. 27 is
apparent resistance.
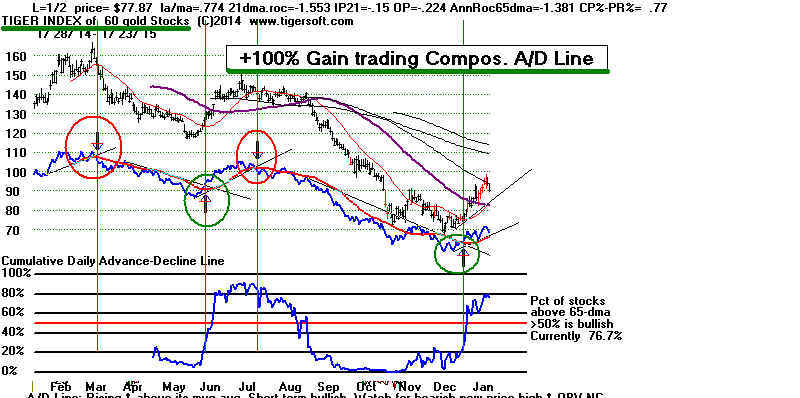
65% of Gold and Silver stocks are back above their
65-dma. See Tiger
Index of these stocks and their long ETFs below. The
biggest Gold stock,
ABX, is lagging badly.

=====================================================
1/13/2014 www.tigersoftware.com/DEN/index.html
NUGT, DUST, NEM, SSRI and Precious
Metals' Mining Stocks.......
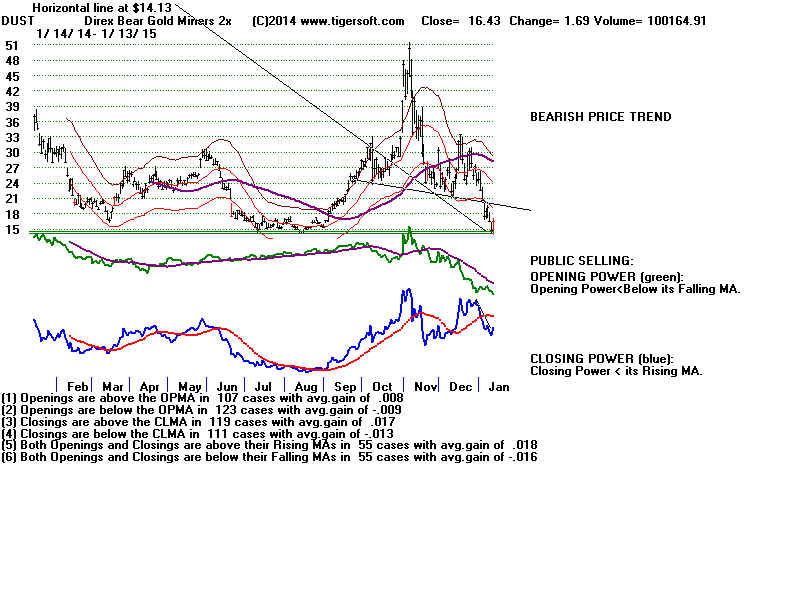
DUST
It pays to keep an eye on
DUST, the 3x leveraged short ETF on gold/silver
mining stocks. It
rebounded from the well-tested support of its lows. Seeing
this technical situation
would have helped recognize more vulnerability in
NUGT, its opposite.
DUST is often used in retirement accounts to match and neutralize
long
mining stock positions.
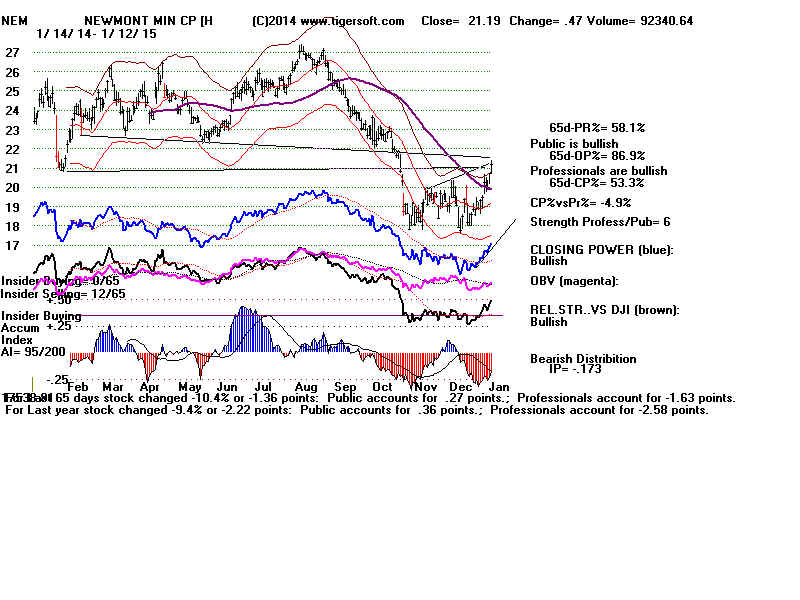
NUGT:
15 is key closing support
here. With red Distribution, Tiger users should consider
any such closing clearly
below the 65-day ma to be a SELL. Has the recent
rally only been a January
bounce in a stock driven down too far by excessive
year-end tax loss selling.
Patterns of sharp one-day
sell-offs (circled in pink)
were always followed by
immediate recoveries in last year.
The Accum. Index still has
not turned positive. So a rally to
17-18 is about all that can
be expected. This shows big selling
on strength.
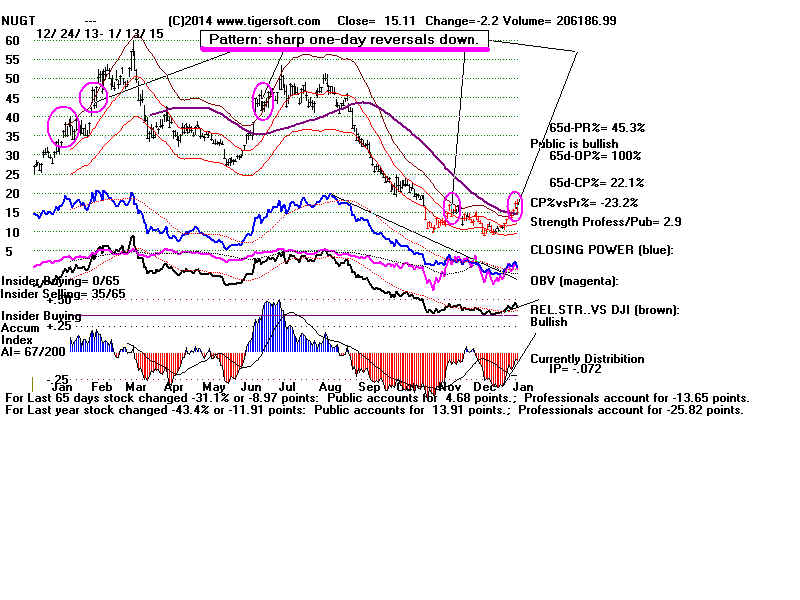
This was a red popicicle day
for NUGT.
With most stocks (not
leveraged ETFs) a 2-point reversal
down fromt he opening would
be quite bearish. Here this
was short-term bearish enough
to bring an immeiate
re-test the 65-dma.
The steep CP uptrend and Day
Traders; uptrends were
easily violated by a 1-point
decline. Hence, the test of
the 65-dma, as the next
support.
But that level (15) should
hold on NUGT.
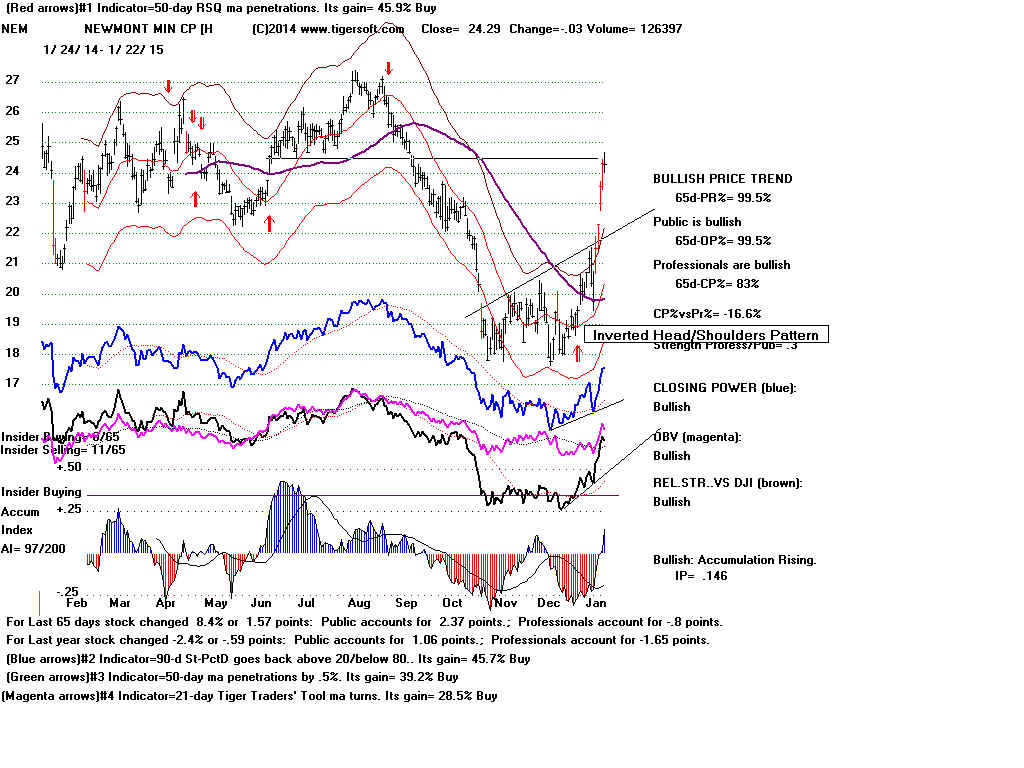
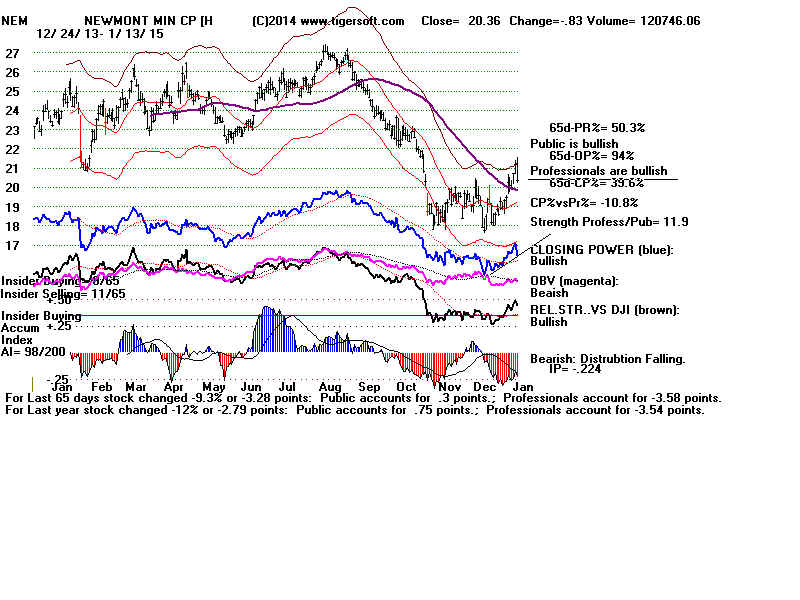
Silver, Gold and NEM did not
break their 65-day ma today.
Background
Two things happened today
that affected gold. More
bullish job news was released
by Labor Dept. The likely
next Prime Minister of Greece
said he would honor
existing debt. That was
what many were worried about.
But he also said he would not
let Greece go further
down the road of
bank-enforced Govt retrenchment
and austerity, which is how
this debt would be paid.
(So, he was trying to make
the big European banks
not worry so much.)
Interestingly, US banks jumped
on this news.
They have some of the Greek and Greek
influenced debt.
But now they are selling off, as though
the big bankers' fears
are a long way from being removed.
All this influences the
price of Gold, because it may
bring about the end of
the EURO. Spain and Italy
could go as Greece
goes, unless the big bankers from
Northern Europe loan
them one way or another a
huge sum, a trillion
Euros is talked about. If the Euro
weakens more, and it
could cease to exist even,
then Gold should go up
in value.
Right now the trend of
NUGT's Closing Power is still
up. It is still
above its 65-dma. The Greek ELections
are Sunday a week.
Between then and now, there
will be more Greek
populist speeches. They will scare
the big bankers of
Northern Europe. And that should
bring more rallies to
Gold and NUGT.
GLD - ETF for Gold 1/10 of ounce gold
 |
NEM -
 |
GLD - ETF for Gold 1/10 of ounce gold
|
-------------------------------------------------------------------------------------------
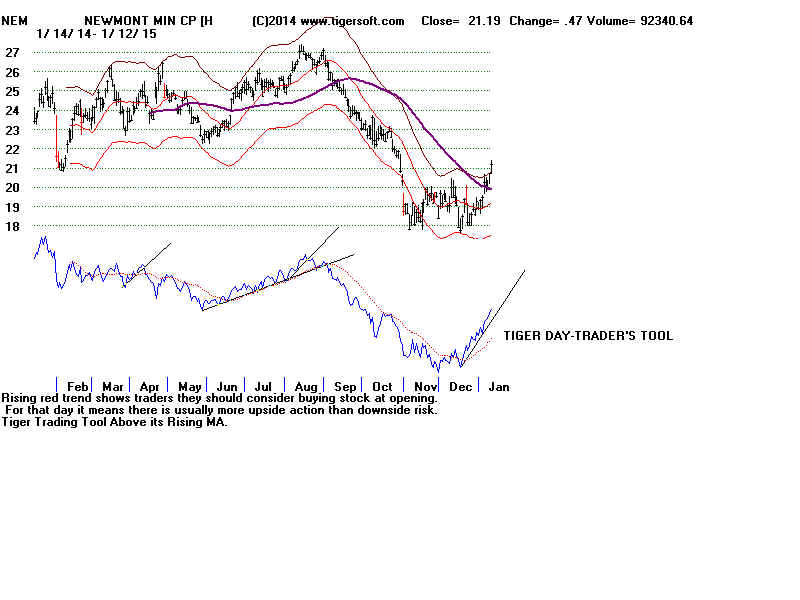
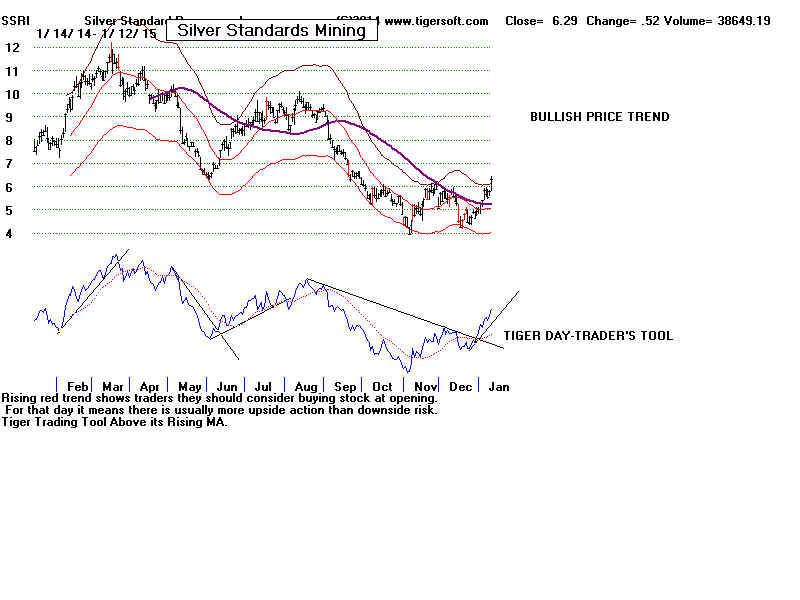
1/12/2014 NUGT, NEM and SSRI:
Watch the Closing Power and Tiger Day Trader Trends
------------------------------------------------------------------------------------------
NUGT
Bullish
Closed back above 65-dma|
Tiger Day Ttraders' Tool shows a bullish
take-off just as it did the last time NUGT took off.
This
shows whether Day Traders should buy or sell a stock at the opening, i.e. whether
there
is more upside potential (to the highs) than danger (to the lows).
Note
the pattern above 41. It has broken support there at 41. That will pose a big
barrier,
assuming prices gets there. The economy will have to in big trouble for such a big
rally.
What
will be the source of that? Deflation in Europe? That works against Gold.
More
terrorist attacks and war with ISIS and radical Islam, maybe.

Closing Power has nice uptrendline to watch and
use.
Both Public and Professionals are bullish.
21-day
pattern of opening higher and closing still higher.
22 3 and 27.0 appear to be next price targets.
Parallel resistance line is now 29.
IP21 is still negative but rising fast tenough
to give B17