HOTLINE 9-22-2023 Tiger Software (C) 2023
PLEASE USE ------> www.tigersoftware.com/zebra/index.htm
---------------------------------------------------------------------------------------------
Recent Peerless Hotlines http://tigersoftware.com/707/oldindex.htm
www.tigersoftware.com/sage22/INDEX.htm
www.tigersoftware.com/dante43/INDEX.htm
www.tigersoftware.com/5HLM/INDEX.htm
---------------------------------------------------------------------------------------------
new new new new new new
new
Tiger Windows-10
Candle-Stick chart programs
can now be purchased for $95. They will
require
you to get TC-2000 data for Windows10 (about
$30/month.) The Candle-Stick charting program
allows Peerless signals to be super-imposed
and shows currently provided Tiger signals as suggested
by the direction of the 65-dma. See samples below.
This is a limited time offer. I will need to get a check
by September 25th. No credit cards, please.
I will send you the programs at the end of the month,
or sooner. You will be delighed at how nice it is
to get data early in the day and how simple our
programs are to run.
William Schmidt, 5834 Kantor STREET, San Diego, CA 92122.
---------------------------------------------------------------------------------------------
The Hotline's price is still
$440 for a year. Visa or MC Credit Cards
remain a problem. The banks are declining too many cards even when
the card numbers we enter are correct. The Data Page for a year is now $240.
william_schmidt@hotmail.com
-----------------------------------------------------------------------------------------
HELP A Guide To Profitably Using The
Tiger Nightly HOTLINE
Introduction to Tiger/Peerless Buys and Sells.
Peerless Buy and
Sell Signals: 1928-2016
Individual Peerless signals explained:
http://tigersoftware.com/PeerlessStudies/Signals-Res/index.htm
Explanation of each Peerless signal
http://www.tigersoft.com/PeerInst-2012-2013/
Different Types of
TigerSoft/Peerless CHARTS, Signals and Indicators
Documentation for TigerSoft
Automatic and Optimized Signals.
How reliable support is the
DJI's rising 200-day ma?
SPY Charts since 1994:
Advisory Closing Power S7s, Accum. Index, 65-dma, Optimized Signals.
http://www.tigersoftware.com/SPY-book-1989-2023/SPY-Book.htm
^^^^^^^^^^^^^^^^^^^^^^^^^^^^^^^^^^^^^^^^^^^^^^^^
1/19/2016 ---> Corrections,Deeper
Declines and Bear Markets since 1945.
1/21/2016 ---> High
Velocity Declines since 1929
2/12/2016 ---> Presidential
Elections Years and Bullish IP21 Positive Non-Confirmations at Lower Band.
2/12/2016 ---> OBV NNCs on DJI's Rally to
2.7% Upper Band when DJI's 65-dma is falling.
11/6/2016 ---> Killer Short Selling Techniques: ===> Order Here ($42.50)
TigerSoft "Combination" Short-Selling... Easy as 1-2-3 Short Sales
Recent Peerless Hotlines http://tigersoftware.com/707/oldindex.htm
www.tigersoftware.com/sage22/INDEX.htm
www.tigersoftware.com/dante43/INDEX.htm
www.tigersoftware.com/5HLM/INDEX.htm
---------------------------------------------------------------------------------------------
New Free Book - DJI History by
Decade: 1950-2020: Technicals, Signals and Events
Events will be added soon for each decade. See 1950-1960 now..
Emphasis is on how FED and also political events shaped market trends.
1950 to 1959-1960 http://tigersoftware.com/z/HISTORY/1950s/decade.htm
1960 to 1969-1970 http://tigersoftware.com/z/HISTORY/1960s/deca-60s.htm
1970 to 1979-1980 http://tigersoftware.com/z/HISTORY/1970s/deca-70s.htm
1980 to 1989-1990 http://tigersoftware.com/z/HISTORY/1980s/decad80s.htm
1990 to 1999-2000 http://tigersoftware.com/z/HISTORY/1990s/deca-90s.htm
2000 to 2009-2010 http://tigersoftware.com/z/HISTORY/2000s/d-2000s.htm
2010 to 2019-2020 http://tigersoftware.com/z/HISTORY/2010s/d-2010s.htm
-------------------------------------------------------------------------------------------------------------------------------------------------
Trading SPY with Tigersoft: 1986-2023 --- http://www.tigersoftware.com/SPY-book-1989-2023/SPY-Book.htm
Market Top of August 1937. www.tigersoftware.com/years/1937/1937.htm
=================================================================================
9/22/23 Friday
6:00 PM DJI futures +51 See https://dowfutures.org/ NASDAQ Futures +91
| |
Data
used: 9/21/2023
|
|
| |
Nightly Hotline
Don't trust the first rally after
so many necklines in head/shoulders patterns
have just been broken.
Historically, over the next week the DJI rallies only 29% of
the time in the third-year in the
Presidential 4-year cycle. The second
week is not much better.
Powell's embrace of the stance
of the FOMC "hawks world view" sent the bond
prices down sharply while the yield
on the ten-year bond jumped to a 17-year
high. The cost of 20-year
mortgages is streaking towards 8%. Smaller stocks
got clobbered again. See how
the head and shoulders patterns for IWM and
MDY showed why they are reliably
bearish. So, did the Housing Stocks.
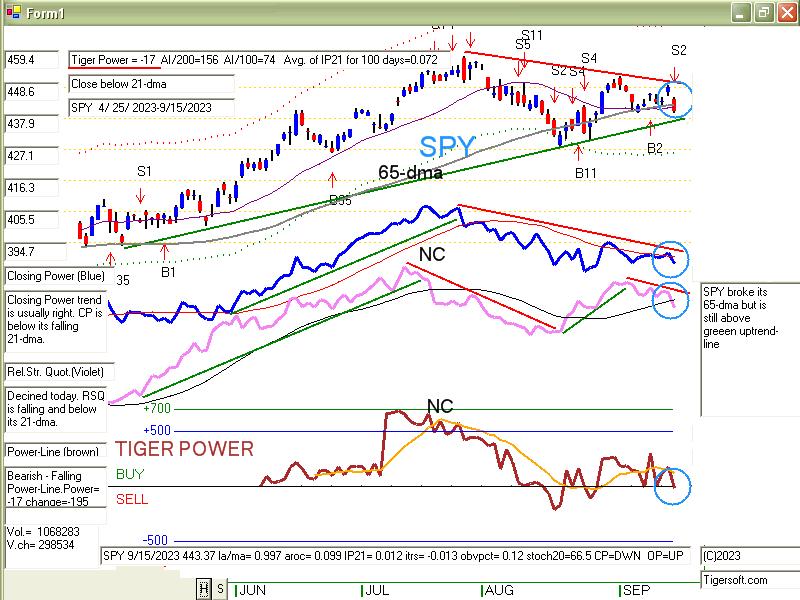
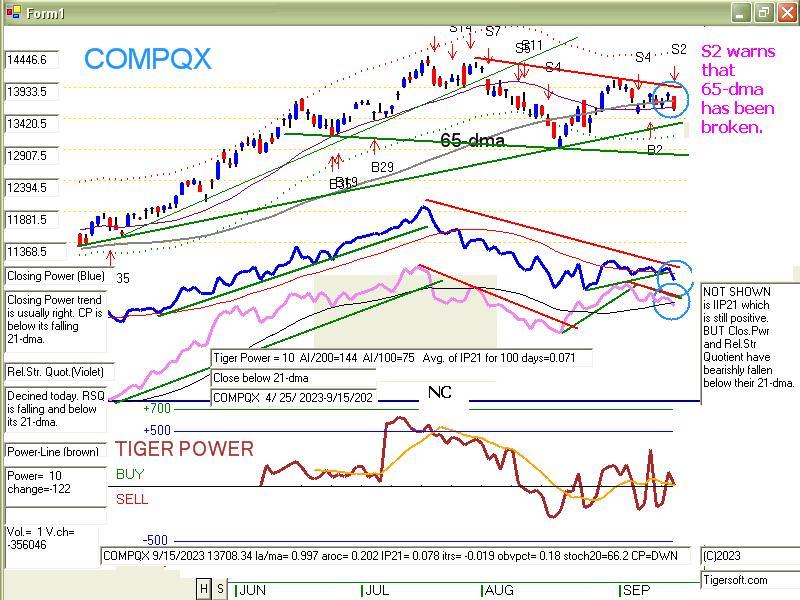
The bigger cap index, SPY, broke
its price uptrendline convincingly. And even
the DJI-30 broke the rising
neckline at 34000 in its oblong, multi-shouldered
head and shoulders pattern.
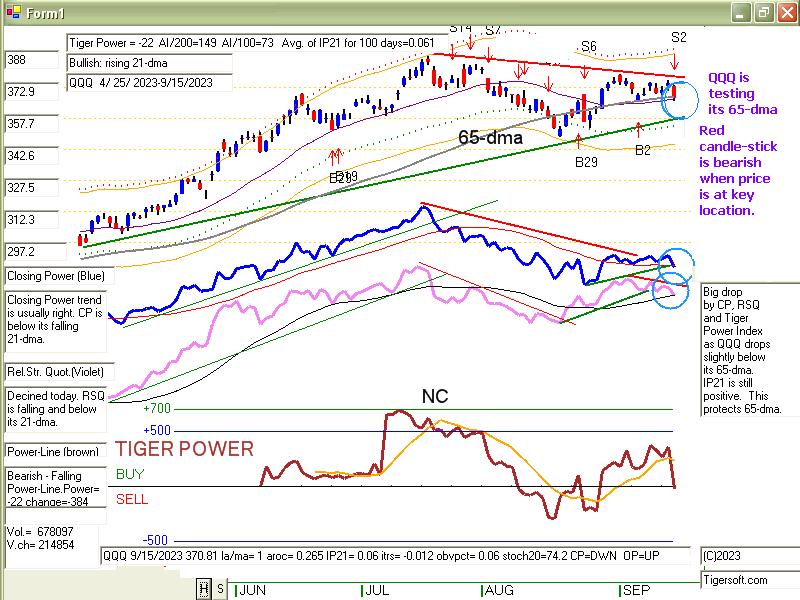
QQQ and SOXL declined to their
trendline-supports, but did not break them
even though NVDA did break its long
uptrend-line.
With less than 31% of all stocks,
of the DJI-30 stocks and of the SP-500 still above
their 65-dma and with the
Closing Powers falling for all the key ETFs, I would
just let the market try to
rally, if it wants. It will probably fail and there will
soon be another leg down.
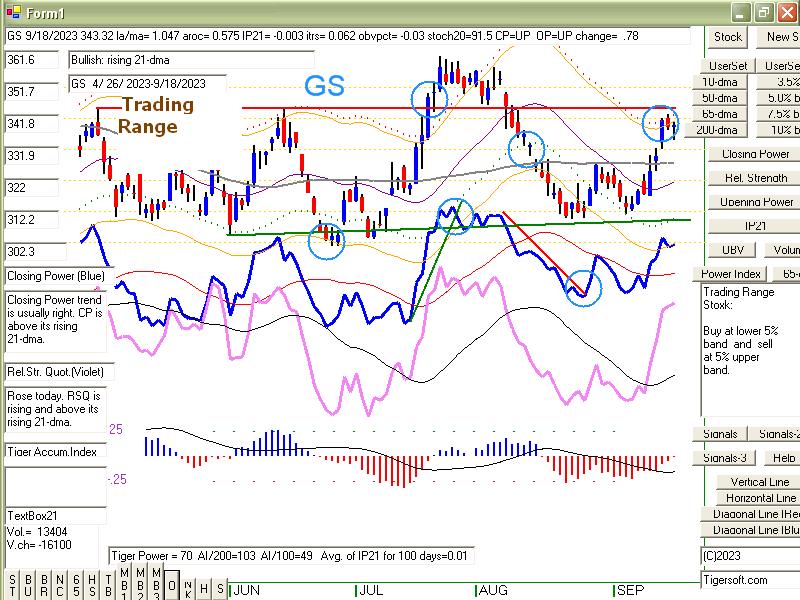
IP21 Moving Average Breaks
Big Money, as measured by our
IP21-Accumulation Index, is a nuanced
indicator that can help
traders a lot. When a stock sells off badly and its IP21
falls to -.25 or lower, watch
in the next bounce for the IP21 to fall back
below its 21-dma or go
negative again. We should flag these occurrences
and give them a special Tiger
name. See some examples below and among
our many bearish MINCPs
What Mice Can Teach
I will do this when I get a
chance. I dropped my mouse in some water
yesterday. It did not
recover. So, I used three old mice. In turn, each
froze up. So yesterday
mid-afternoon, I struggled to find a retail store that
was still open and sold wired
computer mice. I finally found a great
Logitech (the best) mouse at
one of the few Staples in San Diego that
is still open. But not
until 7:00 PM.
Lana as usual was right.
She told me to just get one quickly delivered
by Amazon. I had
previously ordered one just in case, off Ebay ten
days ago, but it still has
not arrived. The moral here is get a more expensive
Logitech mouse and a new
mouse-pad, too from Amazon.. It
would have saved me a lot of
time. And its so much faster and
. easier now. |
|
| |
9/21/2023
2022 PEERLESS DJI, Signals, Indicators Daily DJI Volume
10-DayUp/Down Vol Stoch-20 CCI RSI Pct of All Stocks above 65-dma
Inverted Traders Index
DJI-IPA DJI-OBV
NASDAQ S&P OEX NYSE DJ-15 DJ-20 DJI-30
Old Peerless- 2006
version
Tiger Index of Big
Banks Bond Funds Gold Stocks Housing Stocks
Insurance-Stocks
Regional
Banks Russell-1000
Semi Conductors
ETFs: DIA QQQ SPY IWM MDY
TNA Short-Term Rates Ten Year Rates PST (Short Treasuries)
DOLLAR-UUP
ALLSTOCKs
COIN (Bit
Coin ETF)
USO-CrudeOil DBO BLDP FAS GLD HD IBB JETS JNUG KOL NAIL
NUGT NRGU OIH PALL RSX RETL SDS AGQ SLV SOXL TAN |
TECL TLT TMF TNA UGA USO
China: YINN
CHAU BABA BIDU
Commodities: CANE COCO CORN DBC CORN, CUT (paper)
MOO, NRGU
SOYB WEAT UUP (Dollar) LIT
(Lithium) PALL
(Palladium)
Stocks: AA AAPL ADBE AMAT AMGN AMD AMZN ANET AXP BA BAC
BSX CAT CDNS CHKP CNX CPB CRM CVX CMG DE DIS ENPH FB
FSLR FTNT GILD GME GOOG GS HD IBM INTU JPM KO KR LRCX
MRK MRNA MOS MSFT NEM NFLX NKE NOC NUE NVDA PANW PG
PYPL QCOM QDEL REGN REV RE SCHW SNOW SO SQUARE TSLA
TXN XOM V VRTX WFC WMT XLE ZM ZOM
SEMI-Condctors in SOXL:
NVDA. AVGO, AMD. INTC LRCX TXN MCHP NXPI AMAT ON AAOI TSM
HOMEBUILDERS: BLDP NAIL
BZH HOV LEN MHO MTH PHM -
REGIONAL BANKS:
EGBN
FFIC GBCI HMST
Carl Icahn and associates: IEP
MS
JEF
Leveraged Short ETFs:
FAZ - financials, TZA and SRTY- small caps, MZZ - mid caps, TECS -Techs,
SOXS -
semi-conductors LABD
- Biotechs
Bullish MAXCPs http://tigersoftware.com/upping/9-21-2023/Bullish.htm
Bearish MINCPs www.tigersoftware.com/downing/9-21-2023/Bearish.htm |
|
 |
 |
 |
 |
 |
 |
 |
 |
 |
 |
 |
 |
 |
 |
 |
 |
Table 1 - Daily Breadth and Volume Statistics
| NYSE |
Latest
Close |
Previous
Close |
Week
Ago |
| Issues
traded |
3,003 |
3,008 |
3,002 |
| Advances |
462 |
1,169 |
2,290 |
| Declines |
2,489 |
1,735 |
629 |
| Unchanged |
52 |
104 |
83 |
| New
highs |
14 |
50 |
64 |
| New
lows |
220 |
68 |
63 |
| Adv.
volume* |
94,691,737 |
261,471,026 |
737,401,572 |
| Decl.
volume* |
747,887,854 |
485,355,509 |
154,611,313 |
| Total
volume* |
846,041,152 |
759,415,129 |
909,838,757 |
| Closing
Arms (TRIN)† |
1.60 |
1.06 |
0.90 |
| Block
trades* |
3,939 |
3,838 |
3,994 |
| Adv.
volume |
377,661,850 |
1,260,368,631 |
2,877,840,343 |
| Decl.
volume |
3,262,523,778 |
1,986,688,800 |
712,082,132 |
| Total
volume |
3,662,344,500 |
3,308,451,449 |
3,648,725,051 |
| NASDAQ |
Latest
Close |
Previous
Close |
Week
Ago |
| Issues
traded |
4,478 |
4,545 |
4,486 |
| Advances |
1,136 |
1,495 |
2,880 |
| Declines |
3,178 |
2,839 |
1,400 |
| Unchanged |
164 |
211 |
206 |
| New
highs |
27 |
51 |
49 |
| New
lows |
443 |
262 |
185 |
| Closing
Arms (TRIN)† |
0.72 |
0.80 |
1.24 |
| Block
trades |
42,215 |
44,819 |
35,580 |
| Adv.
volume |
1,636,145,742 |
1,886,377,930 |
2,849,290,738 |
| Decl.
volume |
3,295,529,141 |
2,847,926,169 |
1,719,074,076 |
| Total
volume |
5,014,891,963 |
4,782,447,469 |
4,649,014,014 |
|
Table 2 TIGER QUICKSILVER on ETFS - 9/21/2023 ---
     Bullish = 1  DBO
     Bearish = 8  MDY, IWM, SOXL,TECL, RETL,IBB, GLD, TAN
ETF       CLOSE     CHANGE    PIVOT-PT  5-dma AROC   CL-PWR  CANDLE  IP21    ITRS  POWER INDEX
===============================================================================================
DIA       340.58  -3.74      346.14       -135.1%     Bearish  RED   -.159    0    ------------
---------------------------------------------------------------------------------------------
COMPQX    13223.99  -245.14  13708.34     -256.3%     Bearish  RED   -.031   -.041    -.072
---------------------------------------------------------------------------------------------
SPY       431.39  -7.25      443.37       -213.8%     Bearish  RED   -.062   -.024    -.086
---------------------------------------------------------------------------------------------
QQQ       357.86  -6.68      370.81       -261.9%     Bearish  RED   -.001   -.031    -.032
---------------------------------------------------------------------------------------------
MDY       455.78  -8.4       468.54       -205.5%     Bearish  RED   -.225   -.061    -.286
---------------------------------------------------------------------------------------------
IWM       177.07  -2.79      183.61       -232.2%     Bearish  RED   -.301   -.068    -.369
---------------------------------------------------------------------------------------------
FAS       63.14  -3.29       67.72        -423.7%     Bearish  RED   -.053   -.05     -.103
---------------------------------------------------------------------------------------------
RETL      5.58  -.21         6.25         -780.5%     Bearish  RED   -.103   -.284    -.387
---------------------------------------------------------------------------------------------
SOXL      17.42  -1.06       19.79        -1065.2%    Bearish  RED   -.023   -.313    -.336
---------------------------------------------------------------------------------------------
TECL      43.4  -2.12        47.26        -708.2%     Bearish  RED    .001   -.186    -.185
---------------------------------------------------------------------------------------------
IBB       123.05  -1.58      126.61       -179.8%     Bearish  RED   -.275   -.029    -.304
---------------------------------------------------------------------------------------------
GLD       178.05  -1.3       178.34        24.6%      -------  BLUE  -.246   -.012    -.258
---------------------------------------------------------------------------------------------
DBO       17.71   .06        17.93        -58.7%      -------  RED    .123    .19      .313
---------------------------------------------------------------------------------------------
OIH       342.9  -5.92       356.93       -236.8%     Bearish  RED   -.225    .068    -.157
---------------------------------------------------------------------------------------------
CPER     22.83  -.21         23.44        -150.3%     -------  ----   .056   -.031     .025
---------------------------------------------------------------------------------------------
TAN     53.59  -.95          55.92        -317.5%     Bearish  RED   -.081   -.24     -.321
---------------------------------------------------------------------------------------------
UUP       29.46   .02        29.42         3.4%       Bullish  ----   .166    .07     .236
---------------------------------------------------------------------------------------------
CORN      21.91  -.29        21.97        -50%        -------  RED   -.034    .013    -.021
---------------------------------------------------------------------------------------------
WEAT      5.75  -.12         5.98         -135.9%     -------  RED   -.161   -.08    -.241
---------------------------------------------------------------------------------------------
YINN      28.21  -1.97       31.43        -610.9%     -------  RED    .015   -.241    -.226
|
 Table 3      RANKING OF KEY DIRECTORIES BASED PCT.OF STOCKS ABOVE 65-DMA
              9/21/23
 Bullish =5
 Bearish = 44
---------------------------------------------------------------------------------------
Directory     Current       day-1         day-2         day-3         day-4         day-5
----------------------------------------------------------------------------------------
COAL           1             1             1             1             1             1
INSURANC       .72           .76           .76           .8            .72           .76
EDU            .666          .666          .666          .666          .833          .833
OILGAS         .639          .69           .69           .721          .731          .762
MARIJUAN       .6            .7            .7            .8            .8            .8
============================================================================================
HACKERS        .5            .437          .437          .5            .5            .5
=============================================================================================
DJI-13         .461          .538          .384          .384          .461          .461
COMODITY       .394          .578          .552          .526          .5            .5
FOOD           .367          .489          .469          .469          .448          .428
GUNS           .357          .428          .357          .428          .357          .428
FIDSTKS        .325          .443          .431          .461          .449          .497
SOFTWARE       .321          .357          .375          .41           .41           .482
SP-100         .311          .411          .422          .444          .433          .5
COPPER         .285          .428          .571          .571          .571          .714
RETAIL         .282          .347          .326          .326          .347          .369
INDMATER       .277          .319          .361          .347          .388          .361
TRANSP         .263          .21           .263          .263          .263          .315
NASD-100       .257          .415          .435          .445          .435          .504
               ======
HIGHPRIC       .255          .329          .354          .38           .376          .51
LOWPRICE       .255          .255          .272          .281          .331          .322
RUS-1000       .244          .329          .354          .372          .378          .426
INDEXES        .237          .291          .286          .286          .318          .41
DOWJONES       .233          .4            .333          .366          .433          .5
               ======
SP500          .232          .331          .35           .37           .374          .429
               ======
HOSPITAL       .23           .23           .23           .153          .076          .153
MILITARY       .23           .23           .23           .269          .23           .269
BIOTECH        .205          .225          .241          .248          .266          .276
COMPUTER       .2            .3            .3            .3            .35           .35
EAT            .195          .243          .195          .268          .195          .268
INFRA          .193          .258          .258          .225          .225          .387
AUTO           .185          .259          .203          .222          .24           .296
UTILITY        .179          .282          .282          .333          .333          .307
FINANCE        .175          .325          .35           .387          .412          .45
ELECTRON       .172          .172          .21           .187          .203          .278
GREEN          .166          .222          .222          .222          .277          .277
CHEM           .162          .255          .302          .325          .418          .418
GOLD           .155          .355          .311          .377          .311          .2
REIT           .155          .311          .377          .377          .467          .475
CHINA          .146          .17           .121          .121          .146          .146
BIGBANKS       .142          .428          .571          .714          .571          .571
NIFTY          .113          .272          .318          .318          .295          .431
GAMING         .105          .105          .105          .21           .157          .263
SEMI           .097          .119          .152          .13           .141          .26
ETFS           .09           .236          .236          .236          .236          .236
JETS           .076          0             .076          .076          .076          .076
BEVERAGE       .071          .214          .214          .214          .214          .142
HOMEBLDG       .035          .071          .071          .107          .142          .285
BONDFUND       .022          .045          .068          .057          .057          .057
REGBANKS       0             .052          .105          .105          .184          .236
SOLAR          0             0             0             0             0             0
|
=================================================================================
Thursday 9/21/2023 5:20 AM Data
used here is from 9/20/2023
DJI Futures -187 See https://dowfutures.org/
NASDAQ Futures -157
| |
9/20/2023
|
|
| |
Nightly Hotline
Now the market has to look
forward to yet another rate hike. A late
Septmber and early October sell-off
could be quite ugly. Wednesday,
Powell might have just said:
"We will wait on the data." Instead, he yielded
to the hawks. He fell into
the pattern of institutionalized hawkishmess
that so often occurs at the FED in
September. But, if he wanted to make
Wall Street a little poorer, so
that they would spend a little less,
then you can say he succeeded.
The decline was particularly
bearish for the previous leaders,
techs, semi-conductors and housing
stocks. Now Professionals are
dumping the previously resilient
indexes, too. See the steepening
Closing Power downtrends in DIA,
SPY, QQQ (which now looks
way too bearish to hold).
Each has broken steep price-uptrends.
Each was unable to get up to its
65-dma. And a big decline today
will cause each now to show a
65-dma that has dangerously turned
down, a devlopment which will
technical trigger Sells for many chartists.
Making matters worse are the
completed head and shoulders
patterns in the md-caps (MDY)
and IWM (the Russell-2000.
Our bearish MINCPs should be
aggressively shorted. Nothing
looks safe to buy. GLD
cannot seem to rise above its 65-dma.
Powell claims a "soft
landing" is still his goal. Perhaps, he should get out
more and see the damage he's
already done to retailers, smaller banks,
all those who depend on
borrowing and all those holding stocks down
50% or more this year.
At least, his friend Jamie Diamon is still smiling.
Powell continues to please
creditors, those who benefit from a strong dollar.
Now we will watch to see how
much longer JPM can resist the decline.
Cynics will tell you that
Powell will only ease up when JPM sells
off.
The auto strike will probably
get worse, judging by the strong
uptrends in Toyota amd Honda.
Until these two break their
uptrend-lines, expect no
agreement between GM (and F)
with the UAW.
|
|
| |
9/20/2023
2022 PEERLESS DJI, Signals, Indicators Daily DJI Volume
10-DayUp/Down Vol Stoch-20 CCI RSI Pct of All Stocks above 65-dma
Inverted Traders Index
DJI-IPA DJI-OBV
NASDAQ S&P OEX NYSE DJ-15 DJ-20 DJI-30
Old Peerless- 2006
version
Tiger Index of Big
Banks Bond Funds Gold Stocks Housing Stocks
Insurance-Stocks
Regional
Banks Russell-1000
Semi Conductors
ETFs: DIA QQQ SPY IWM MDY
TNA Short-Term Rates Ten Year Rates PST (Short Treasuries)
DOLLAR-UUP
ALLSTOCKs
COIN (Bit
Coin ETF)
USO-CrudeOil DBO BLDP FAS GLD HD IBB JETS JNUG KOL NAIL
NUGT NRGU OIH PALL RSX RETL SDS AGQ SLV SOXL TAN |
TECL TLT TMF TNA UGA USO
China: YINN
CHAU BABA BIDU
Commodities:
CANE
COCO CORN DBC CORN, CUT (paper)
MOO, NRGU
SOYB WEAT UUP (Dollar) LIT
(Lithium) PALL
(Palladium)
Stocks: AA AAPL ADBE AMAT AMGN AMD AMZN ANET AXP BA BAC
BSX CAT CDNS CHKP CNX CPB CRM CVX CMG DE DIS ENPH FB
FSLR FTNT GILD GME GOOG GS HD IBM INTU JPM KO KR LRCX
MRK MRNA MOS MSFT NEM NFLX NKE NOC NUE NVDA PANW PG
PYPL QCOM QDEL REGN REV RE SCHW SNOW SO SQUARE TSLA
TXN XOM V VRTX WFC WMT XLE ZM ZOM
SEMI-Condctors in SOXL:
NVDA. AVGO, AMD. INTC LRCX TXN MCHP NXPI AMAT ON AAOI TSM
HOMEBUILDERS: BLDP NAIL
BZH HOV LEN MHO MTH PHM -
REGIONAL BANKS:
EGBN
FFIC GBCI HMST
Carl Icahn and associates: IEP
MS
JEF
Leveraged Short ETFs:
FAZ - financials, TZA and SRTY- small caps, MZZ - mid caps, TECS -Techs,
SOXS -
semi-conductors LABD
- Biotechs
Bullish MAXCPs http://tigersoftware.com/upping/9-20-2023/Bullish.htm
Bearish MINCPs www.tigersoftware.com/downing/9-20-2023/Bearish.htm
|
|
 |
 |
 |
 |
 |
 |
 |
 |
 |
 |
 |
 |
 |
 |
 |
Table 1: Daily Breadth and Volume Data
| NYSE |
Latest
Close |
Previous
Close |
Week
Ago |
| Issues
traded |
3,008 |
2,997 |
3,004 |
| Advances |
1,169 |
1,206 |
1,134 |
| Declines |
1,735 |
1,669 |
1,747 |
| Unchanged |
104 |
122 |
123 |
| New
highs |
50 |
46 |
51 |
| New
lows |
68 |
103 |
93 |
| Adv.
volume* |
261,471,026 |
336,673,129 |
295,647,636 |
| Decl.
volume* |
485,355,509 |
539,387,232 |
564,430,992 |
| Total
volume* |
759,415,129 |
888,531,853 |
872,417,944 |
| Closing
Arms (TRIN)† |
1.06 |
1.11 |
1.15 |
| Block
trades* |
3,838 |
4,276 |
3,792 |
| Adv.
volume |
1,260,368,631 |
1,398,402,640 |
1,250,477,747 |
| Decl.
volume |
1,986,688,800 |
2,156,025,266 |
2,220,055,580 |
| Total
volume |
3,308,451,449 |
3,614,882,481 |
3,529,431,146 |
| NASDAQ |
Latest
Close |
Previous
Close |
Week
Ago |
| Issues
traded |
4,545 |
4,509 |
4,480 |
| Advances |
1,495 |
1,731 |
1,637 |
| Declines |
2,839 |
2,537 |
2,645 |
| Unchanged |
211 |
241 |
198 |
| New
highs |
51 |
44 |
32 |
| New
lows |
262 |
295 |
211 |
| Closing
Arms (TRIN)† |
0.80 |
0.90 |
0.63 |
| Block
trades |
44,819 |
36,670 |
38,742 |
| Adv.
volume |
1,886,377,930 |
1,893,043,433 |
2,370,561,461 |
| Decl.
volume |
2,847,926,169 |
2,493,451,724 |
2,414,021,499 |
| Total
volume |
4,782,447,469 |
4,453,464,230 |
4,840,315,901 |
|
Table 2 TIGER QUICKSILVER on ETFS - 9/20/2023 ---
     Bullish = 1  DBO
     Bearish = 6  MDY, IWM, SOXL, RETL,IBB,  TAN
There are no bullish Closing Power trends below.
ETF       CLOSE     CHANGE    PIVOT-PT  5-dma AROC   CL-PWR  CANDLE  IP21    ITRS  POWER INDEX
=================================================================================================
DIA       344.32  -.75       349.94       -32.2%      Bearish  RED   -.14       0   --------
---------------------------------------------------------------------------------------------
COMPQX    13469.13  -209.06  13926.05     -125.1%     Bearish  RED   -.008   -.026    -.034
---------------------------------------------------------------------------------------------
SPY       438.64  -4.07      450.36       -88.4%      Bearish  RED   -.03    -.014    -.044
---------------------------------------------------------------------------------------------
QQQ       364.54  -5.33      377.27       -129.8%     Bearish  RED    .035   -.015     .02
---------------------------------------------------------------------------------------------
MDY       464.18  -2.64      475.03       -49.6%      Bearish  RED   -.204   -.051    -.255
---------------------------------------------------------------------------------------------
IWM       179.86  -1.82      185.55       -84.9%      Bearish  RED   -.264   -.057    -.321
---------------------------------------------------------------------------------------------
FAS       66.43  -1.43       68.89        -49.3%      Bearish  RED   -.036    .005    -.031
---------------------------------------------------------------------------------------------
RETL      5.79  -.11         6.53         -236%       Bearish  RED   -.13    -.269    -.399
---------------------------------------------------------------------------------------------
SOXL      18.48  -.95        21.65        -673.8%     Bearish  RED   -.007   -.246    -.253
---------------------------------------------------------------------------------------------
TECL      45.52  -2.31       50.16        -374.6%     Bearish  RED    .017   -.132    -.115
---------------------------------------------------------------------------------------------
IBB       124.63  -1.08      127.58       -97.7%      Bearish  RED   -.262   -.021    -.283
---------------------------------------------------------------------------------------------
GLD       179.35   .13       177.17        63.7%      -------  ----  -.215   -.005    -.22
---------------------------------------------------------------------------------------------
DBO       17.65  -.3         17.92         16.8%      -------  RED    .182    .187     .369
---------------------------------------------------------------------------------------------
OIH       348.82  -2.43      359.72       -80.8%      Bearish  RED   -.208    .081    -.127
---------------------------------------------------------------------------------------------
CPER     23.04  -.09         23.53        -66.4%      -------  RED    .149   -.014     .135
---------------------------------------------------------------------------------------------
TAN     54.54  -.06          57.1         -97.3%      Bearish  RED   -.096   -.219    -.315
---------------------------------------------------------------------------------------------
UUP       29.44   .05        29.44         30.6%      Bullish  BLUE   .198    .043     .241
---------------------------------------------------------------------------------------------
CORN      22.2   .23         22.13         9.1%       -------  BLUE   .013   -.02     -.007
---------------------------------------------------------------------------------------------
WEAT      5.87   .04         5.91         -42.4%      -------  ----  -.125   -.107    -.232
---------------------------------------------------------------------------------------------
YINN      30.18  -.58        32.01        -174%       -------  RED    .018   -.13     -.112
|
Table 3       RANKING OF KEY DIRECTORIES BASED PCT.OF STOCKS ABOVE 65-DMA
              9/20/23
 Bullish = 7
 Bearish = 43
---------------------------------------------------------------------------------------
Directory     Current       day-1         day-2         day-3         day-4         day-5
----------------------------------------------------------------------------------------
COAL           1             1             1             1             1             1
INSURANC       .76           .76           .8            .72           .76           .72
MARIJUAN       .7            .7            .8            .8            .8            .8
OILGAS         .69           .69           .721          .731          .762          .731
EDU            .666          .666          .666          .833          .833          .666
COMODITY       .578          .578          .5            .5            .5            .447
DJI-13         .538          .384          .384          .461          .461          .461
=============================================================================================
FOOD           .489          .489          .448          .448          .428          .387
FIDSTKS        .443          .431          .461          .449          .502          .437
HACKERS        .437          .437          .5            .5            .5            .5
BIGBANKS       .428          .571          .714          .571          .571          .428
COPPER         .428          .571          .571          .571          .714          .285
GUNS           .428          .357          .428          .357          .428          .214
NASD-100       .415          .435          .445          .435          .514          .485
SP-100         .411          .422          .444          .433          .5            .411
DOWJONES       .4            .333          .366          .433          .5            .433
               =====
SOFTWARE       .375          .392          .41           .41           .464          .446
GOLD           .355          .311          .377          .311          .2            .177
RETAIL         .347          .326          .326          .347          .369          .347
SP500          .331          .35           .37           .372          .431          .356
RUS-1000       .33           .354          .371          .378          .428          .362
HIGHPRIC       .329          .354          .38           .376          .51           .441
FINANCE        .325          .35           .387          .4            .45           .362
INDMATER       .319          .361          .347          .388          .388          .305
REIT           .311          .36           .377          .475          .475          .344
COMPUTER       .3            .3            .3            .35           .35           .35
INDEXES        .291          .286          .286          .318          .416          .335
UTILITY        .282          .282          .333          .333          .333          .179
NIFTY          .272          .318          .318          .295          .431          .409
AUTO           .259          .222          .222          .24           .296          .203
INFRA          .258          .258          .225          .225          .387          .258
CHEM           .255          .302          .325          .418          .418          .325
LOWPRICE       .255          .275          .284          .331          .319          .281
EAT            .243          .195          .268          .195          .268          .195
ETFS           .236          .236          .236          .236          .254          .145
HOSPITAL       .23           .23           .153          .076          .153          .076
MILITARY       .23           .23           .269          .23           .269          .153
BIOTECH        .223          .238          .251          .266          .276          .261
GREEN          .222          .222          .222          .277          .277          .277
BEVERAGE       .214          .214          .214          .214          .214          .142
TRANSP         .21           .263          .263          .263          .315          .263
ELECTRON       .172          .21           .187          .203          .27           .255
CHINA          .17           .121          .121          .146          .17           .146
SEMI           .119          .152          .13           .141          .271          .239
GAMING         .105          .105          .157          .21           .263          .157
HOMEBLDG       .071          .071          .107          .142          .285          .25
REGBANKS       .052          .105          .105          .184          .236          .105
BONDFUND       .045          .057          .057          .068          .068          .068
JETS           0             .076          .076          .076          .076          .076
SOLAR          0             0             0             0             0             0
|
=====================================================================================
Wednesday 9/20/2023 6:15 AM Data
used here is from 9/19/2023
DJI Futures +112 See https://dowfutures.org/ NASDAQ Futures +55
| |
9/19/2023
|
|
| |
Nightly Hotline
Don't trust the key indexes to
rally much because the FED chooses not to
raise rates in September.
This is what has been expected for the
last two weeks. Look instead
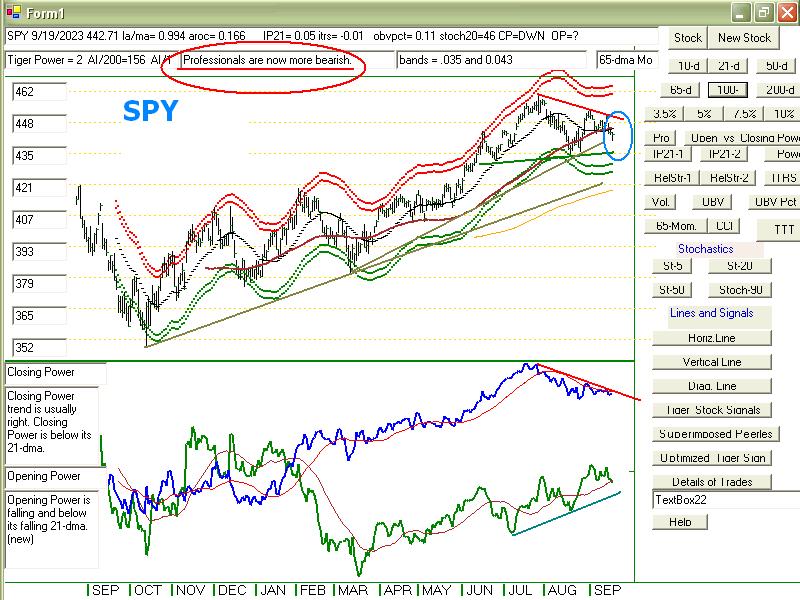
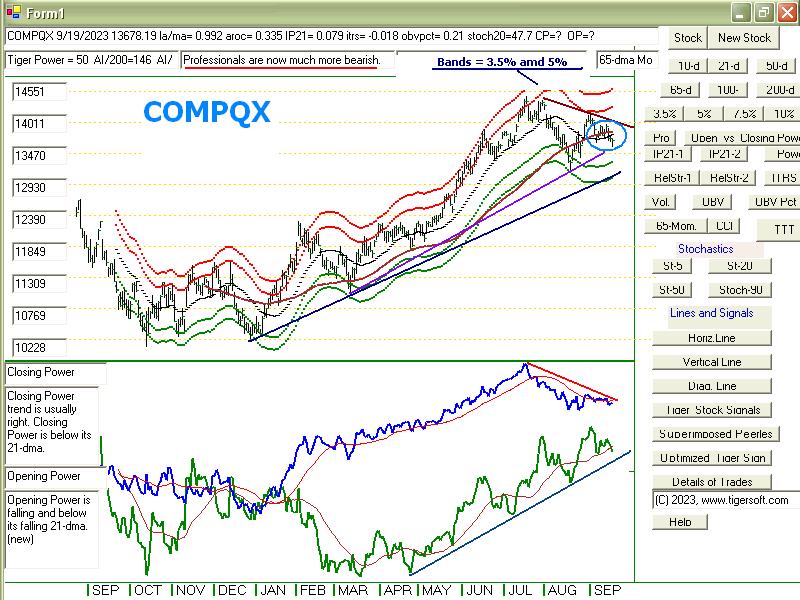
at how close the yield on
10-year bonds is to making a new
high. Professionals remain net
bearish in the DJ-30, DIA, the
NASDAQ, QQQ and SPY.
IWM, MDY and small caps have formed
bearish head and
shoulders. Look at Table 3.
See how only 33% of the
30-DJI stocks are still above their
65-dma. And now all the
key indices we follow are below
their key 65-dma even as
they try to hold up above their
price-uptrends. Previous leading
groups, home-building and
semi-conductors have not turned
up. We would expect this if a
major bottom was being made.
It is not a mere coincidence the
September is the most bearish month
of the year. And we see lots
and lots of bearish MINCPs to short
to hedge. Ahead is the scary
month of October and after
this FED meeting, the FOMC will be
hard-pressed to continue to
prop up the market, especially if
Oil rises more and the Dollar
should weaken in the face of a
rally in Gold.
If there is a rally, the key
indices and their ETFs will have professionals
trying to hold up the appearance
that all is still well on Wall Street.
In that case, we hold QQQ, but will
sell it on not much of a rally.
They are well-known to do this
before a much bigger decline.
Gold is close to giving a buy from
its 90-day Stochastic. A gold
rally now would add to the ultimate
bearishness ahead. Watch
the Gold stocks I have added to the
Bearish MINCPs. |
|
| |
9/19/2023
2022 PEERLESS DJI, Signals, Indicators Daily DJI Volume
10-DayUp/Down Vol Stoch-20 CCI RSI Pct of All Stocks above 65-dma
Inverted Traders Index
DJI-IPA DJI-OBV
NASDAQ S&P OEX NYSE DJ-15 DJ-20 DJI-30
Old Peerless- 2006
version
Tiger Index of Big
Banks Bond Funds Gold Stocks Housing Stocks
Insurance-Stocks
Regional
Banks Russell-1000
Semi Conductors
ETFs: DIA QQQ SPY IWM MDY
TNA Short-Term Rates Ten Year Rates PST (Short Treasuries)
DOLLAR-UUP
ALLSTOCKs
COIN (Bit
Coin ETF)
USO-CrudeOil DBO BLDP FAS GLD HD IBB JETS JNUG KOL NAIL
NUGT NRGU OIH PALL RSX RETL SDS AGQ SLV SOXL TAN |
TECL TLT TMF TNA UGA USO
China: YINN
CHAU BABA BIDU
Commodities:
CANE
COCO CORN DBC CORN, CUT (paper)
MOO, NRGU
SOYB WEAT UUP (Dollar) LIT
(Lithium) PALL
(Palladium)
Stocks: AA AAPL ADBE AMAT AMGN AMD AMZN ANET AXP BA BAC
BSX CAT CDNS CHKP CNX CPB CRM CVX CMG DE DIS ENPH FB
FSLR FTNT GILD GME GOOG GS HD IBM INTU JPM KO KR LRCX
MRK MRNA MOS MSFT NEM NFLX NKE NOC NUE NVDA PANW PG
PYPL QCOM QDEL REGN REV RE SCHW SNOW SO SQUARE TSLA
TXN XOM V VRTX WFC WMT XLE ZM ZOM
SEMI-Condctors in SOXL:
NVDA. AVGO, AMD. INTC LRCX TXN MCHP NXPI AMAT ON AAOI TSM
HOMEBUILDERS: BLDP NAIL
BZH HOV LEN MHO MTH PHM -
REGIONAL BANKS:
EGBN
FFIC GBCI HMST
Carl Icahn and associates: IEP
MS
JEF
Leveraged Short ETFs:
FAZ - financials, TZA and SRTY- small caps, MZZ - mid caps, TECS -Techs,
SOXS -
semi-conductors LABD
- Biotechs
Bullish MAXCPs http://tigersoftware.com/upping/9-19-2023/Bullish.htm
Bearish MINCPs www.tigersoftware.com/downing/9-19-2023/Bearish.htm |
|
 |
 |
 |
 |
 |
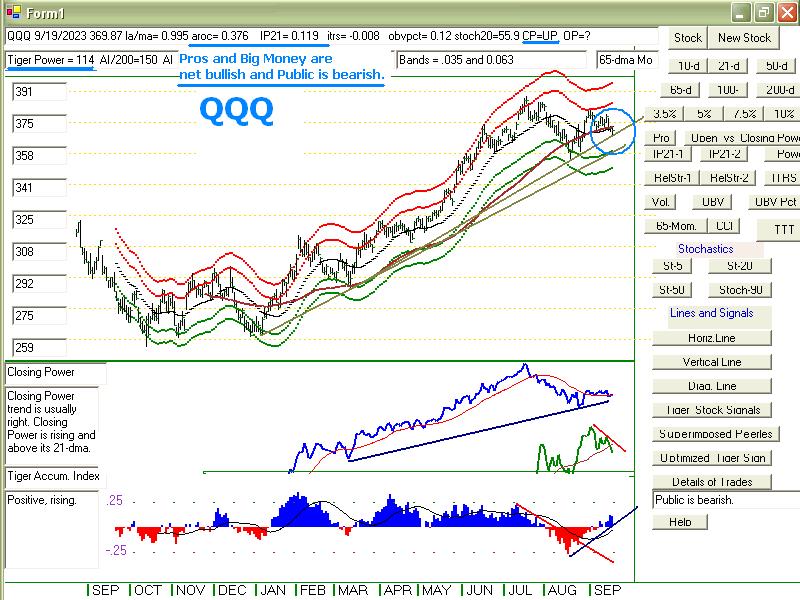 |
Table 1 - Daily Statistics
| NYSE |
Latest
Close |
Previous
Close |
Week
Ago |
| Issues
traded |
2,997 |
3,013 |
2,995 |
| Advances |
1,206 |
1,298 |
1,361 |
| Declines |
1,669 |
1,579 |
1,520 |
| Unchanged |
122 |
136 |
114 |
| New
highs |
46 |
40 |
67 |
| New
lows |
103 |
103 |
95 |
| Adv.
volume* |
336,673,129 |
282,718,783 |
426,734,405 |
| Decl.
volume* |
539,387,232 |
555,761,596 |
338,919,889 |
| Total
volume* |
888,531,853 |
850,915,962 |
772,443,317 |
| Closing
Arms (TRIN)† |
1.11 |
1.77 |
0.75 |
| Block
trades* |
4,276 |
3,869 |
3,748 |
| Adv.
volume |
1,398,402,640 |
980,101,578 |
1,853,339,879 |
| Decl.
volume |
2,156,025,266 |
2,107,003,221 |
1,544,834,382 |
| Total
volume |
3,614,882,481 |
3,161,233,605 |
3,435,747,638 |
| NASDAQ |
Latest
Close |
Previous
Close |
Week
Ago |
| Issues
traded |
4,509 |
4,538 |
4,479 |
| Advances |
1,731 |
1,582 |
1,888 |
| Declines |
2,537 |
2,747 |
2,342 |
| Unchanged |
241 |
209 |
249 |
| New
highs |
44 |
59 |
60 |
| New
lows |
295 |
271 |
196 |
| Closing
Arms (TRIN)† |
0.90 |
0.79 |
0.69 |
| Block
trades |
36,670 |
43,942 |
34,798 |
| Adv.
volume |
1,893,043,433 |
2,034,532,091 |
2,439,222,208 |
| Decl.
volume |
2,493,451,724 |
2,778,222,001 |
2,082,401,337 |
| Total
volume |
4,453,464,230 |
4,855,887,232 |
4,595,491,826 |
|
Table 2 TIGER QUICKSILVER on ETFS - 9/19/2023 ---
     Bullish = 1  DBO
     Bearish = 4  IWM RETL  TAN  WEAT
ETF       CLOSE     CHANGE    PIVOT-PT  5-dma AROC   CL-PWR  CANDLE  IP21    ITRS  POWER INDEX
=================================================================================================
DIA       345.07  -1.08      346.55       -30.8%     Bearish  RED   -.064    0       ====
---------------------------------------------------------------------------------------------
COMPQX    13678.19  -32.05   13813.59     -34.6%     -------  BLUE   .08   -.017      .063
---------------------------------------------------------------------------------------------
SPY       442.71  -.92       446.51       -36.8%     Bearish  ----   .051   -.009     .042
---------------------------------------------------------------------------------------------
QQQ       369.87  -.79       374.21       -39.1%     -------  BLUE   .119   -.007     .112
---------------------------------------------------------------------------------------------
MDY       466.82  -.94       468.84       -51.7%     Bearish  RED   -.136   -.046    -.182
---------------------------------------------------------------------------------------------
IWM       181.68  -.71       182.97       -68%       Bearish  RED   -.203   -.049    -.252
---------------------------------------------------------------------------------------------
FAS       67.86  -.55        67.1          36.8%     -------  RED    .019    .051     .07
---------------------------------------------------------------------------------------------
RETL      5.9  -.06          6.08         -233.8%    Bearish  ----  -.105   -.22     -.325
---------------------------------------------------------------------------------------------
SOXL      19.43  -.5         21.23        -364.6%    Bearish  RED    .079   -.217    -.138
---------------------------------------------------------------------------------------------
TECL      47.83  -.04        49.15        -90.5%     -------  BLUE   .116   -.093     .023
---------------------------------------------------------------------------------------------
IBB       125.71   .46       127.1        -69.8%     Bearish  BLUE  -.178   -.024    -.202
---------------------------------------------------------------------------------------------
GLD       179.22  -.17       177.08        48.6%     -------  RED   -.115   -.014    -.129
---------------------------------------------------------------------------------------------
DBO       17.95   0          17.59         98.3%     -------  RED    .226    .223     .449
---------------------------------------------------------------------------------------------
OIH       351.25  -7.44      354.58       -154.1%    Bearish  RED   -.173    .115    -.058
---------------------------------------------------------------------------------------------
CPER     23.13  -.2          23.35        -51.3%     -------  ----   .202   -.028     .174
---------------------------------------------------------------------------------------------
TAN     54.6   .36           55.62        -195.8%    -------  BLUE  -.065   -.229    -.294
---------------------------------------------------------------------------------------------
UUP       29.39   .02        29.26         25.6%     Bullish  ----   .129    .028     .157
---------------------------------------------------------------------------------------------
CORN      21.97   .15        22.16        -4.5%      -------  BLUE  -.075   -.038    -.113
---------------------------------------------------------------------------------------------
WEAT      5.83  -.02         5.92         -16.9%     -------  ----  -.172   -.108    -.28
---------------------------------------------------------------------------------------------
YINN      30.76  -.37        31.27        -199.5%    -------  RED    .107   -.106     .001
|
 Table 3      RANKING OF KEY DIRECTORIES BASED PCT.OF STOCKS ABOVE 65-DMA
              9/19/23
 Bullish = 8
 Bearish = 42
---------------------------------------------------------------------------------------
Directory     Current       day-1         day-2         day-3         day-4         day-5
----------------------------------------------------------------------------------------
COAL           1             1             1             1             1             1
INSURANC       .76           .8            .72           .76           .72           .76
MARIJUAN       .7            .8            .8            .8            .8            .8
OILGAS         .69           .721          .731          .762          .742          .752
EDU            .666          .666          .833          .833          .666          .666
COMODITY       .578          .526          .473          .5            .447          .473
BIGBANKS       .571          .714          .571          .571          .428          .142
COPPER         .571          .571          .571          .714          .285          .142
===========================================================================================
FOOD           .489          .469          .428          .428          .387          .408
HACKERS        .437          .5            .5            .5            .5            .562
NASD-100       .435          .445          .435          .514          .485          .485
FIDSTKS        .431          .461          .449          .502          .443          .431
SP-100         .422          .444          .433          .5            .422          .4
SOFTWARE       .41           .428          .41           .464          .428          .428
DJI-13         .384          .384          .461          .461          .461          .384
INDMATER       .361          .347          .388          .388          .319          .333
REIT           .36           .36           .475          .483          .344          .418
GUNS           .357          .428          .357          .428          .214          .285
RUS-1000       .355          .371          .377          .428          .37           .393
HIGHPRIC       .354          .38           .376          .51           .445          .463
FINANCE        .35           .387          .4            .437          .362          .387
SP500          .35           .37           .372          .429          .362          .374
DOWJONES       .333          .366          .433          .5            .433          .4
               =====
RETAIL         .326          .326          .347          .369          .347          .347
NIFTY          .318          .318          .295          .431          .431          .386
GOLD           .311          .377          .311          .2            .177          .177
CHEM           .302          .325          .418          .418          .325          .372
COMPUTER       .3            .3            .35           .35           .35           .35
INDEXES        .286          .286          .318          .416          .351          .351
UTILITY        .282          .333          .333          .333          .179          .128
LOWPRICE       .275          .287          .334          .319          .278          .278
TRANSP         .263          .263          .263          .315          .263          .21
INFRA          .258          .225          .225          .387          .258          .193
BIOTECH        .236          .248          .269          .276          .261          .271
ETFS           .236          .236          .236          .254          .163          .145
HOSPITAL       .23           .153          .076          .153          .076          .153
MILITARY       .23           .269          .23           .269          .192          .153
AUTO           .222          .24           .24           .296          .203          .203
GREEN          .222          .222          .277          .277          .277          .277
BEVERAGE       .214          .214          .214          .214          .142          .214
ELECTRON       .21           .187          .203          .27           .248          .225
EAT            .195          .268          .195          .268          .195          .17
SEMI           .152          .13           .141          .271          .239          .217
CHINA          .121          .121          .146          .17           .146          .219
GAMING         .105          .157          .157          .315          .157          .105
REGBANKS       .105          .105          .184          .236          .131          .21
JETS           .076          .076          .076          .076          .076          .153
HOMEBLDG       .071          .107          .142          .285          .25           .321
BONDFUND       .057          .045          .068          .08           .08           .068
SOLAR          0             0             0             0             0             0
|
==================================================================================
Tuesday 9/19/2023 6:15
AM Data used here is from 9/18/2023
DJI Futures +37 See https://dowfutures.org/ NASDAQ Futures +10
|
9/18/2023
|
|
|
Nightly Hotline
Economics text books warn
readers of how unevenly the
effects of inflation and
highest interest rates impact businesses
by size. That certainly
is true now. See how MDY (midcaps)
and IWM (Russell-2000) have
formed potential head and
shoulders patterns. Any
higher rates now are likely to push them
over the edge, below their
necklines. They will then join the
cacading retailers (other
than WMT and AMZN). As you
can readily see, retailers
are well-repesented among our bearish
MINCPs. Consumers are
not eager to incur more debt with
interest rates so high.
Of course, what the
Government can boost with subsidies, it can
bust and break by denying
them. The solar energy stocks are hit
in two ways, by the change in
political power in the House of
Representatives and now, how
higher rates hurt housing construction.
So, our short sales in these
areas keep making traders money.
Also in need of regular
funds, by floating more stock or by
borrowing, are many,
many smaller biotechs. They are also
commonly seen among the
many bearish MINCPs. Now
we see new weakness in
the bigger biotechs. BIIB is particularly
interesting among the
bearish MINCPs. It is breaking key support
and shows heavy red
Distribution and a falling Closing Power.
Meanwhile, the blue chips,
NYSE, NASDAQ, SP-500 and
OEX hang tightly to their
still rising 65-dma and stay above
their uptrend-lines.
Semi-conductors and stocks like AAPL and
ADBE rose a little today.
Their action suggests that the
FED will not be raising rates
in September. Their internals,
their AROC (rate of change of
21-dma) and IP21 are positive,
thereby taking them out of
the "Danger Zone" for now.
Stay hedged with shorted
MINCPs. I would avoid buying
anything but QQQ. See
how its 21-day ma is rising and its
IP21 is positive, as it seeks
support at its 21-dma. |
|
|
9/18/2023
2022 PEERLESS DJI, Signals, Indicators Daily DJI Volume
10-DayUp/Down Vol Stoch-20 CCI RSI Pct of All Stocks above 65-dma
Inverted Traders Index
DJI-IPA DJI-OBV
NASDAQ S&P OEX NYSE DJ-15 DJ-20 DJI-30
Old Peerless- 2006
version
Tiger Index of Big
Banks Bond Funds Gold Stocks Housing Stocks
Insurance-Stocks
Regional
Banks Russell-1000
Semi Conductors
ETFs: DIA QQQ SPY IWM MDY
TNA Short-Term Rates Ten Year Rates PST (Short Treasuries)
DOLLAR-UUP
ALLSTOCKs
COIN (Bit
Coin ETF)
USO-CrudeOil DBO BLDP FAS GLD HD IBB JETS JNUG KOL NAIL
NUGT NRGU OIH PALL RSX RETL SDS AGQ SLV SOXL TAN |
TECL TLT TMF TNA UGA USO
China: YINN
CHAU BABA BIDU
Commodities:
CANE
COCO CORN DBC CORN, CUT (paper)
MOO, NRGU
SOYB WEAT UUP (Dollar) LIT
(Lithium) PALL
(Palladium)
Stocks: AA AAPL ADBE AMAT AMGN AMD AMZN ANET AXP BA BAC
BSX CAT CDNS CHKP CNX CPB CRM CVX CMG DE DIS ENPH FB
FSLR FTNT GILD GME GOOG GS HD IBM INTU JPM KO KR LRCX
MRK MRNA MOS MSFT NEM NFLX NKE NOC NUE NVDA PANW PG
PYPL QCOM QDEL REGN REV RE SCHW SNOW SO SQUARE TSLA
TXN XOM V VRTX WFC WMT XLE ZM ZOM
SEMI-Condctors in SOXL:
NVDA. AVGO, AMD. INTC LRCX TXN MCHP NXPI AMAT ON AAOI TSM
HOMEBUILDERS: BLDP NAIL
BZH HOV LEN MHO MTH PHM -
REGIONAL BANKS:
EGBN
FFIC GBCI HMST
Carl Icahn and associates: IEP
MS
JEF
Leveraged Short ETFs:
FAZ - financials, TZA and SRTY- small caps, MZZ - mid caps, TECS -Techs,
SOXS -
semi-conductors LABD
- Biotechs
Bullish MAXCPs http://tigersoftware.com/upping/9-18-2023/Bullish.htm
Bearish MINCPs www.tigersoftware.com/downing/9-18-2023/Bearish.htm |
|
 |
 |
 |
 |
 |
 |
 |
 |
 |
 |
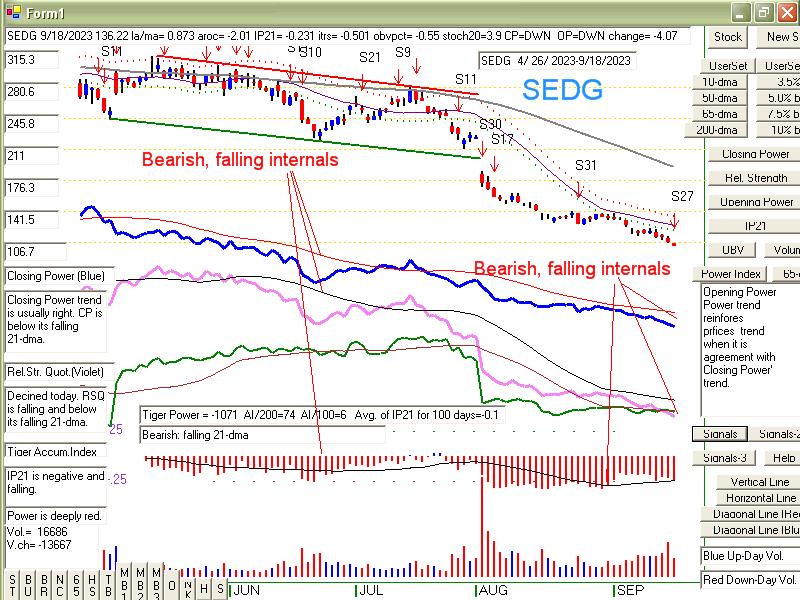 |
Table 1 - NYSE Breadth and Volume Statistics
| NYSE |
Latest
Close |
Previous
Close |
Week
Ago |
| Issues
traded |
3,013 |
3,000 |
3,018 |
| Advances |
1,298 |
966 |
1,578 |
| Declines |
1,579 |
1,916 |
1,305 |
| Unchanged |
136 |
118 |
135 |
| New
highs |
40 |
45 |
65 |
| New
lows |
103 |
91 |
75 |
| Adv.
volume* |
282,718,783 |
1,225,486,687 |
463,013,896 |
| Decl.
volume* |
555,761,596 |
2,126,628,344 |
292,902,279 |
| Total
volume* |
850,915,962 |
3,429,975,980 |
769,205,705 |
| Closing
Arms (TRIN)† |
1.77 |
0.92 |
0.76 |
| Block
trades* |
3,869 |
5,776 |
3,994 |
| Adv.
volume |
980,101,578 |
2,396,129,315 |
2,036,199,637 |
| Decl.
volume |
2,107,003,221 |
4,352,928,085 |
1,275,190,407 |
| Total
volume |
3,161,233,605 |
6,932,233,456 |
3,369,924,175 |
| NASDAQ |
Latest
Close |
Previous
Close |
Week
Ago |
| Issues
traded |
4,538 |
4,509 |
4,485 |
| Advances |
1,582 |
1,520 |
2,247 |
| Declines |
2,747 |
2,808 |
2,023 |
| Unchanged |
209 |
181 |
215 |
| New
highs |
59 |
61 |
58 |
| New
lows |
271 |
236 |
202 |
| Closing
Arms (TRIN)† |
0.79 |
0.74 |
0.57 |
| Block
trades |
43,942 |
59,044 |
32,829 |
| Adv.
volume |
2,034,532,091 |
3,396,988,883 |
2,952,966,376 |
| Decl.
volume |
2,778,222,001 |
4,667,616,691 |
1,517,149,189 |
| Total
volume |
4,855,887,232 |
8,162,212,567 |
4,538,877,923 |
|
Table 2 TIGER QUICKSILVER on ETFS - 9/18/2023 ---
     Bullish = 1  DBO
     Bearish = 0
ETF       CLOSE     CHANGE    PIVOT-PT  5-dma AROC   CL-PWR  CANDLE  IP21    ITRS  POWER INDEX
=================================================================================================
DIA       346.15   .01       347.21       -17.6%     Bearish  RED   -.055    0        ===
---------------------------------------------------------------------------------------------
COMPQX    13710.24   1.9     13773.62     -75.1%     -------  BLUE   .075   -.022     .053
---------------------------------------------------------------------------------------------
SPY       443.63   .26       445.99       -53.9%     -------  BLUE   .055   -.014     .041
---------------------------------------------------------------------------------------------
QQQ       370.66  -.15       372.79       -84.3%     -------  BLUE   .122   -.014     .108
---------------------------------------------------------------------------------------------
MDY       467.76  -.78       471.68       -40.2%     Bearish  RED   -.088   -.041    -.129
---------------------------------------------------------------------------------------------
IWM       182.39  -1.22      184.18       -53.5%     Bearish  RED   -.136   -.038    -.174
---------------------------------------------------------------------------------------------
FAS       68.41   .69        67.36         200.4%    -------  BLUE   .029    .065     .094
---------------------------------------------------------------------------------------------
RETL      5.96  -.29         6.19         -207.9%    Bearish  RED   -.092   -.179    -.271
---------------------------------------------------------------------------------------------
SOXL      19.93   .14        20.94        -361.7%    -------  BLUE   .111   -.158    -.047
---------------------------------------------------------------------------------------------
TECL      47.87   .61        48.71        -374.7%    -------  BLUE   .119   -.095     .024
---------------------------------------------------------------------------------------------
IBB       125.25  -1.36      127.48       -95.5%     Bearish  RED   -.196   -.019    -.215
---------------------------------------------------------------------------------------------
GLD       179.39   1.05      177.49        27.6%     -------  BLUE  -.128   -.022    -.15
---------------------------------------------------------------------------------------------
DBO       17.95   .02        17.6          181.1%    -------  RED    .266    .209     .475
---------------------------------------------------------------------------------------------
OIH       358.69   1.76      362.3         70.4%     -------  RED   -.083    .14      .057
------------------------------------------------------------------------------------- --------
CPER     23.33  -.11         23.37        -21.3%     -------  RED    .219   -.025     .194
---------------------------------------------------------------------------------------------
TAN     54.24  -1.68         56.79        -132.5%    -------  RED   -.006   -.229     -.235
---------------------------------------------------------------------------------------------
UUP       29.37  -.05        29.24         30.7%      Bullish  ----   .118    .015     .133
---------------------------------------------------------------------------------------------
CORN      21.82  -.15        21.99        -115.3%     -------  RED   -.082   -.05     -.132
---------------------------------------------------------------------------------------------
WEAT      5.85  -.13         5.85          17%        -------  RED   -.094   -.119    -.213
---------------------------------------------------------------------------------------------
YINN      31.13  -.3         32.02        -119.8%     -------  BLUE   .1   -.109      - .01
|
 Table 3      RANKING OF KEY DIRECTORIES BASED PCT.OF STOCKS ABOVE 65-DMA
              9/18/23
 Bullish = 8
 Bearish = 41
---------------------------------------------------------------------------------------
Directory     Current       day-1         day-2         day-3         day-4         day-5
----------------------------------------------------------------------------------------
COAL           1             1             1             1             1             1
INSURANC       .8            .72           .76           .72           .76           .72
MARIJUAN       .8            .8            .8            .8            .8            .8
OILGAS         .721          .731          .762          .742          .752          .721
BIGBANKS       .714          .571          .571          .428          .142          .142
EDU            .666          .833          .833          .666          .666          .666
COPPER         .571          .571          .714          .285          .142          .285
COMODITY       .526          .5            .473          .447          .473          .473
============================================================================================
HACKERS        .5            .5            .5            .5            .562          .562
============================================================================================
FOOD           .469          .448          .408          .387          .408          .408
FIDSTKS        .461          .449          .502          .443          .431          .455
SOFTWARE       .446          .428          .464          .428          .41           .5
NASD-100       .445          .435          .514          .485          .485          .524
SP-100         .444          .433          .5            .422          .4            .4
GUNS           .428          .357          .428          .214          .285          .285
FINANCE        .387          .4            .437          .35           .387          .337
DJI-13         .384          .461          .461          .461          .384          .384
HIGHPRIC       .38           .376          .51           .445          .463          .515
GOLD           .377          .311          .2            .177          .177          .155
RUS-1000       .372          .377          .427          .37           .394          .395
SP500          .37           .372          .429          .36           .374          .389
DOWJONES       .366          .433          .5            .433          .4            .433
REIT           .36           .459          .483          .352          .426          .426
INDMATER       .347          .388          .388          .319          .347          .333
UTILITY        .333          .333          .333          .179          .128          .128
RETAIL         .326          .347          .369          .347          .369          .369
CHEM           .325          .418          .418          .325          .372          .348
NIFTY          .318          .295          .431          .431          .386          .477
COMPUTER       .3            .35           .35           .35           .35           .35
LOWPRICE       .287          .337          .322          .278          .278          .284
INDEXES        .286          .318          .416          .351          .362          .416
MILITARY       .269          .23           .269          .192          .153          .192
EAT            .268          .195          .268          .195          .17           .195
TRANSP         .263          .263          .315          .263          .21           .263
BIOTECH        .246          .266          .279          .261          .269          .284
AUTO           .24           .259          .296          .203          .203          .222
ETFS           .236          .236          .254          .163          .163          .145
INFRA          .225          .225          .387          .258          .193          .29
GREEN          .222          .277          .277          .277          .277          .333
BEVERAGE       .214          .214          .214          .142          .214          .285
ELECTRON       .187          .203          .27           .248          .218          .225
GAMING         .157          .157          .263          .21           .105          .157
HOSPITAL       .153          .076          .153          .076          .153          .076
SEMI           .13           .141          .271          .239          .228          .228
CHINA          .121          .146          .17           .146          .219          .17
HOMEBLDG       .107          .142          .285          .25           .321          .392
REGBANKS       .105          .184          .236          .131          .21           .157
JETS           .076          .076          .076          .076          .153          .153
BONDFUND       .045          .057          .08           .091          .08           .08
SOLAR          0             0             0             0             0             0
|
======================================================================
Monday
9/18/2023 6:04 AM Data used here is from 9/15/2023
DJI Futures -37 See https://dowfutures.org/
NASDAQ Futures -53
| |
9/15/2023
|
|
| |
Nightly Hotline
Ten Year rates rose to 4.32%.
That makes them uncomfortably close to
a breakout above 4.5% that
could easily mean a run to 5%. At that
level, their yield would seem
very attractive to all the folks owning
falling stocks paying
questionable dividends. Their yield now is
already hurting tech and
semi-conductor stocks, not to mention more
more stocks on the NYSE.
And this doesn't even factor in the
hardship the high rates even
now are hurting debtors, retailer
and home buyers.
See how in unison, the DJI, DIA,
SPY, NASDAQ, QQQ and the
likes of NVDA and LRCX closed below
their 65-dma. Though these
all still show marginally rising
65-day moving averages, this united
decline is clearly bearish..
Though the 6-month+ uptrend-lines are
still in tact in most cases,
Friday's wide sell-off will probably start
a new wave of technical selling.
Who will fight the seasonal bearishness?
The bearishness of an extended
strike in the auto industry? And the
likelihood that the FED will
further tighten given the continued rise in
crude oil and gasoline prices.
All institutions develop
patterns of behavior. Over and over, as in
1966, 1973-4, 1976-1977,
1981, 1987... 2007-2008, the pattern
of rising oil prices
was each time followed by higher interest rdates.
In every case September
and October were not good times
in these years to
stubbornly hold stocks.
The break in the the leaders
(notably semi-conductors and
home-building) bodes ill for
the market. The performance game
of musical chairs is winding
down. There are fewer and fewer
stocks still holding up.
Professionals and "big money" want out of
this market, at the same
time. See the falling Closing Powers
below in the most important
ETFs and stocks. And now even
their Relative Strength Lines
are falling. When the Public and the
most stubborn bulls holding
"safe" blue chips, finally decide to sell,
the sell-off could match
other panics occuring this time of the
year. It's true
the there are still unviolated uptrends. But waiting
for that
"inevitability" could be very costly. I suspect the remaining
uptrend-lines will be
violated unless the FED acts whollly out
of character.
Of course, we could
"hold tight and hope" for the best or that the
FED will change their
deep-rooted institutional behavior. That
would be like the frog
carrying the scorpion across the river,
quite dangerous. And
wholly unnecessary. We can and should sell
short the most bearish MINCPs
both for protection and profit. |
|
| |
9/15/2023
2022 PEERLESS DJI, Signals, Indicators Daily DJI Volume
10-DayUp/Down Vol Stoch-20 CCI RSI Pct of All Stocks above 65-dma
Inverted Traders Index
DJI-IPA DJI-OBV
NASDAQ S&P OEX NYSE DJ-15 DJ-20 DJI-30
Old Peerless- 2006
version
Tiger Index of Big
Banks Bond Funds Gold Stocks Housing Stocks
Insurance-Stocks
Regional
Banks Russell-1000
Semi Conductors
ETFs: DIA QQQ SPY IWM MDY
TNA Short-Term Rates Ten Year Rates PST (Short Treasuries)
DOLLAR-UUP
ALLSTOCKs
COIN (Bit
Coin ETF)
USO-CrudeOil DBO BLDP FAS GLD HD IBB JETS JNUG KOL NAIL
NUGT NRGU OIH PALL RSX RETL SDS AGQ SLV SOXL TAN |
TECL TLT TMF TNA UGA USO
China: YINN
CHAU BABA BIDU
Commodities:
CANE
COCO CORN DBC CORN, CUT (paper)
MOO, NRGU
SOYB WEAT UUP (Dollar) LIT
(Lithium) PALL
(Palladium)
Stocks: AA AAPL ADBE AMAT AMGN AMD AMZN ANET AXP BA BAC
BSX CAT CDNS CHKP CNX CPB CRM CVX CMG DE DIS ENPH FB
FSLR FTNT GILD GME GOOG GS HD IBM INTU JPM KO KR LRCX
MRK MRNA MOS MSFT NEM NFLX NKE NOC NUE NVDA PANW PG
PYPL QCOM QDEL REGN REV RE SCHW SNOW SO SQUARE TSLA
TXN XOM V VRTX WFC WMT XLE ZM ZOM
SEMI-Condctors in SOXL:
NVDA. AVGO, AMD. INTC LRCX TXN MCHP NXPI AMAT ON AAOI TSM
HOMEBUILDERS: BLDP NAIL
BZH HOV LEN MHO MTH PHM -
REGIONAL BANKS:
EGBN
FFIC GBCI HMST
Carl Icahn and associates: IEP
MS
JEF
Leveraged Short ETFs:
FAZ - financials, TZA and SRTY- small caps, MZZ - mid caps, TECS -Techs,
SOXS -
semi-conductors LABD
- Biotechs
Bullish MAXCPs http://tigersoftware.com/upping/9-15-2023/Bullish.htm
Bearish MINCPs www.tigersoftware.com/downing/9-15-2023/Bearish.htm |
|
 |
 |
 |
| 
|
 |
 |
 |
 |
 |
 |
 |
 |
 |
 |
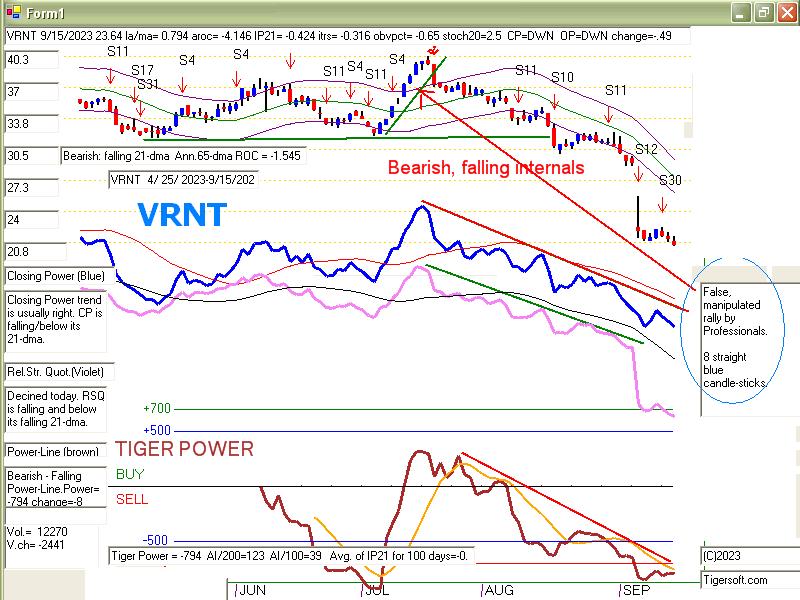 |
Table 1 - Daily Breadth and Volume Statistics
| NYSE |
Latest
Close |
Previous
Close |
Week
Ago |
| Issues
traded |
3,000 |
3,002 |
3,015 |
| Advances |
966 |
2,290 |
1,526 |
| Declines |
1,916 |
629 |
1,380 |
| Unchanged |
118 |
83 |
109 |
| New
highs |
45 |
64 |
48 |
| New
lows |
91 |
63 |
96 |
| Adv.
volume* |
1,225,486,687 |
737,401,572 |
405,500,966 |
| Decl.
volume* |
2,126,628,344 |
154,611,313 |
311,364,304 |
| Total
volume* |
3,429,975,980 |
909,838,757 |
733,743,630 |
| Closing
Arms (TRIN)† |
0.92 |
0.90 |
0.86 |
| Block
trades* |
5,776 |
3,994 |
3,834 |
| Adv.
volume |
2,396,129,315 |
2,877,840,343 |
1,791,637,856 |
| Decl.
volume |
4,352,928,085 |
712,082,132 |
1,391,033,217 |
| Total
volume |
6,932,233,456 |
3,648,725,051 |
3,259,292,272 |
| NASDAQ |
Latest
Close |
Previous
Close |
Week
Ago |
| Issues
traded |
4,509 |
4,486 |
4,495 |
| Advances |
1,520 |
2,880 |
1,956 |
| Declines |
2,808 |
1,400 |
2,308 |
| Unchanged |
181 |
206 |
231 |
| New
highs |
61 |
49 |
40 |
| New
lows |
236 |
185 |
246 |
| Closing
Arms (TRIN)† |
0.74 |
1.24 |
0.92 |
| Block
trades |
59,044 |
35,580 |
27,572 |
| Adv.
volume |
3,396,988,883 |
2,849,290,738 |
1,976,373,573 |
| Decl.
volume |
4,667,616,691 |
1,719,074,076 |
2,138,339,634 |
| Total
volume |
8,162,212,567 |
4,649,014,014 |
4,160,361,257 |
|
Table 2 TIGER QUICKSILVER on ETFS - 9/15/2023 ---
     Bullish = 1  DBO
     Bearish = 0
ETF       CLOSE     CHANGE    PIVOT-PT  5-dma AROC   CL-PWR  CANDLE  IP21    ITRS  POWER INDEX
=================================================================================================
DIA       346.14  -3.8       347.37       -5.3%      Bearish  RED   -.122    0       =====
---------------------------------------------------------------------------------------------
COMPQX    13708.34  -217.71  13917.89     -19.2%     Bearish  RED    .035   -.018     .017
---------------------------------------------------------------------------------------------
SPY       443.37  -6.99      448.45       -24%       Bearish  RED    .012   -.012     0
---------------------------------------------------------------------------------------------
QQQ       370.81  -6.46      376.97       -23.6%     Bearish  RED    .06   -.011      .049
---------------------------------------------------------------------------------------------
MDY       468.54  -6.49      471.55       -27%       Bearish  RED   -.125   -.025    -.15
---------------------------------------------------------------------------------------------
IWM       183.61  -1.94      184.36       -8.4%      Bearish  RED   -.15   -.016     -.166
---------------------------------------------------------------------------------------------
FAS       67.72  -1.17       65.71         202.8%    -------  ----  -.038    .063     .025
---------------------------------------------------------------------------------------------
RETL      6.25  -.28         6.22          32%       Bearish  RED   -.091   -.111    -.202
---------------------------------------------------------------------------------------------
SOXL      19.79  -1.86       21.45        -400.4%    Bearish  RED    .068   -.159    -.091
---------------------------------------------------------------------------------------------
TECL      47.26  -2.9        51.57        -356.4%    Bearish  RED    .058   -.114    -.056
---------------------------------------------------------------------------------------------
IBB       126.61  -.97       127.68       -9.4%      -------  RED   -.204   -.011    -.215
---------------------------------------------------------------------------------------------
GLD       178.34   1.17      178.41        7.3%      Bearish  RED   -.204   -.015    -.219
---------------------------------------------------------------------------------------------
DBO       17.93   .01        17.31         188.2%    Bullish  BLUE   .24    .238      .478
---------------------------------------------------------------------------------------------
OIH       356.93  -2.79      353.66        54.1%     -------  RED   -.131    .219     .088
---------------------------------------------------------------------------------------------
CPER     23.44  -.09         23.43         122.3%    -------  RED    .193   -.006     .187
---------------------------------------------------------------------------------------------
TAN     55.92  -1.18         55.73         31.2%     -------  RED   -.012   -.19     -.202
---------------------------------------------------------------------------------------------
UUP       29.42  -.02        29.19         15.4%     Bullish  ----   .129    .013     .142
---------------------------------------------------------------------------------------------
CORN      21.97  -.16        22.33        -47.4%     -------  RED   -.023   -.055    -.078
---------------------------------------------------------------------------------------------
WEAT      5.98   .07         5.83          42.5%     -------  BLUE  -.081   -.102    -.183
---------------------------------------------------------------------------------------------
YINN      31.43  -.58        31.89         120.4%    -------  RED    .032   -.036    -.004
|
 Table 3      RANKING OF KEY DIRECTORIES BASED PCT.OF STOCKS ABOVE 65-DMA
              9/15/23
 Bullish = 7
 Bearish = 41
---------------------------------------------------------------------------------------
Directory     Current       day-1         day-2         day-3         day-4         day-5
----------------------------------------------------------------------------------------
COAL           1             1             1             1             1             1
EDU            .833          .833          .666          .666          .666          .833
MARIJUAN       .8            .8            .8            .8            .8            .7
OILGAS         .731          .762          .742          .752          .721          .731
INSURANC       .72           .76           .72           .76           .72           .68
BIGBANKS       .571          .571          .428          .142          .142          .142
COPPER         .571          .714          .285          .142          .285          .142
===============================================================================================
COMODITY       .5            .5            .421          .473          .473          .447
HACKERS        .5            .5            .5            .562          .562          .5
DJI-13         .461          .461          .461          .384          .384          .384
REIT           .459          .467          .352          .434          .426          .401
FIDSTKS        .449          .502          .443          .431          .455          .426
FOOD           .448          .428          .367          .408          .408          .387
SOFTWARE       .446          .482          .428          .41           .482          .482
NASD-100       .435          .514          .485          .485          .534          .504
DOWJONES       .433          .5            .433          .4            .433          .466
               =====
SP-100         .433          .5            .422          .4            .4            .4
CHEM           .418          .418          .325          .372          .348          .372
FINANCE        .4            .437          .35           .375          .337          .312
INDMATER       .388          .388          .319          .347          .333          .347
RUS-1000       .378          .427          .369          .394          .4            .385
HIGHPRIC       .376          .51           .445          .463          .519          .454
SP500          .372          .429          .36           .372          .389          .368
GUNS           .357          .428          .214          .285          .285          .285
COMPUTER       .35           .35           .35           .35           .35           .35
RETAIL         .347          .369          .347          .369          .369          .391
LOWPRICE       .337          .325          .281          .278          .281          .293
UTILITY        .333          .333          .179          .128          .128          .076
INDEXES        .318          .416          .351          .362          .416          .34
GOLD           .311          .2            .177          .177          .155          .111
NIFTY          .295          .431          .431          .386          .477          .454
GREEN          .277          .277          .277          .277          .333          .388
BIOTECH        .263          .276          .263          .269          .286          .266
TRANSP         .263          .315          .263          .21           .263          .21
AUTO           .259          .314          .203          .203          .222          .222
ETFS           .236          .254          .163          .163          .163          .127
MILITARY       .23           .269          .192          .153          .192          .115
INFRA          .225          .387          .258          .193          .29           .29
BEVERAGE       .214          .214          .142          .214          .285          .214
ELECTRON       .203          .27           .248          .218          .233          .255
EAT            .195          .268          .195          .17           .195          .219
REGBANKS       .184          .236          .131          .21           .157          .131
GAMING         .157          .263          .157          .157          .157          .105
CHINA          .146          .17           .146          .219          .195          .17
HOMEBLDG       .142          .285          .25           .321          .392          .392
SEMI           .141          .271          .239          .228          .25           .25
HOSPITAL       .076          .153          .076          .153          .076          .153
JETS           .076          .076          .076          .153          .153          .076
BONDFUND       .057          .068          .091          .091          .091          .057
SOLAR          0             0             0             0             0             0
|
==================================================================================
Friday 9/15/2023 5:45 AM
Data used here is from 9/14/2023
DJI Futures +35 See https://dowfutures.org/ NASDAQ Futures -40
| |
9/14/2023
|
|
| |
Nightly Hotline
The rally today impressively
disregarded the impending auto strike
and the still high and but
not falling interest rates. But follow-through
strength by Professionals and
a bigger advance by Closing Powers
are needed now.
Otherwise, expect another test of the 65-dma by the DJIA.
The key indexes seem to be
over-looking the well advertised bearishness
of September. But much
of that comes in the last 15 trading days
of the month. Our
seasonal data shows the DJI being up only 28.6% of
the time after two weeks from
now, September 14th, and 50% of the time
over the next month in the
third year of the four year Presidential cycle
since 1967.
So, far it looks as though
the key indexes and their main stocks
want to hold up above their
65-dma. With the help of the FEDs
and with the big banks'
determination, they may well succeed. At least
for now hold QQQ long along
with some bullish MAXCPs
and shorts among the bearish
MINCPs.
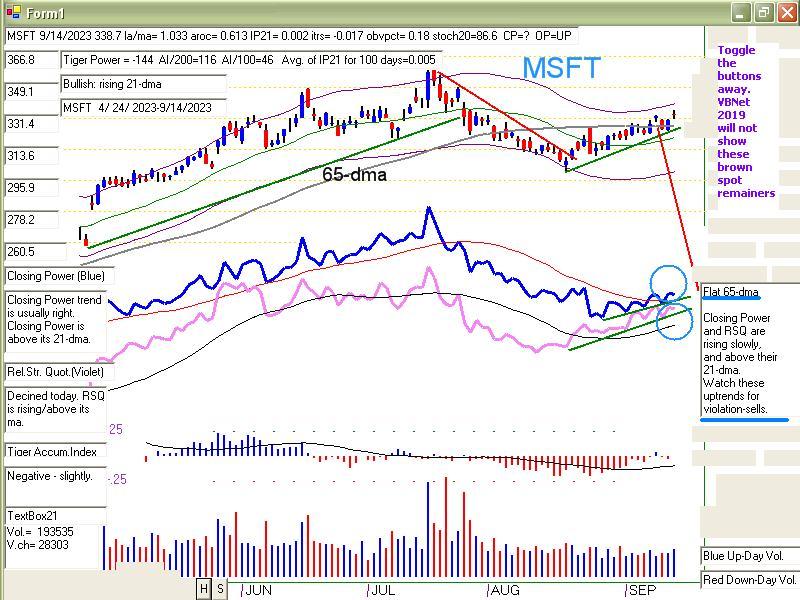
I have simplified and
de-cluttered the most important charts shown
below on the new candle stick
charts using VBNet. The buttons used
to build each graph can be
hidden. This helps simplify the charts'
appearance. The Opening
Power, which often is misleading, has
been left out. Now we
can focus on what I take to be the most important
Tiger internal strength
indicators.
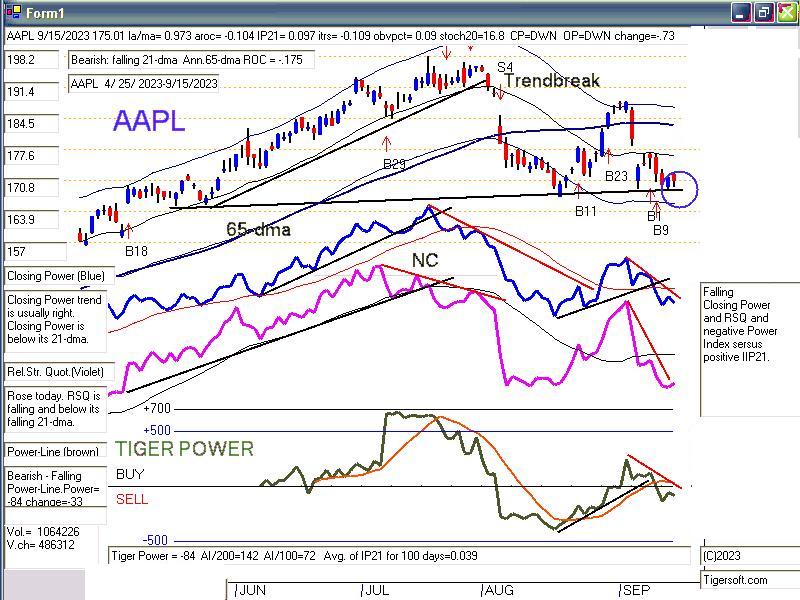
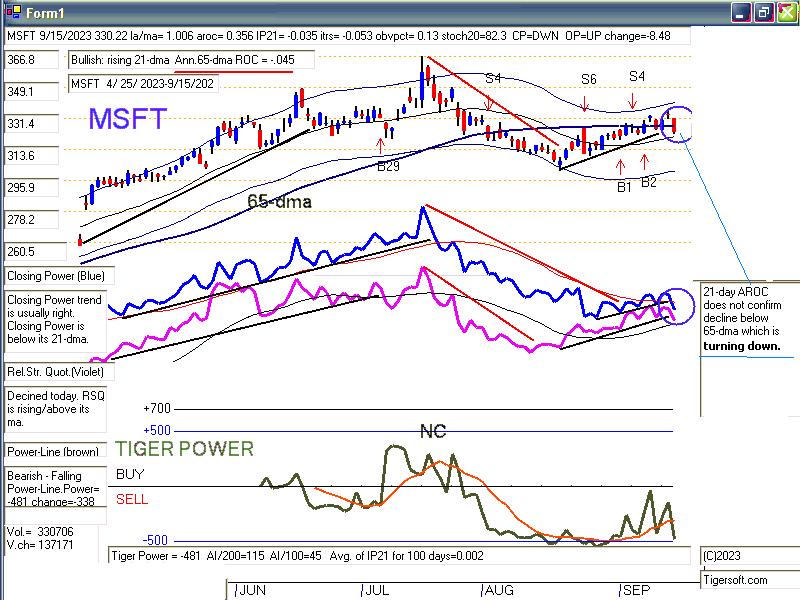
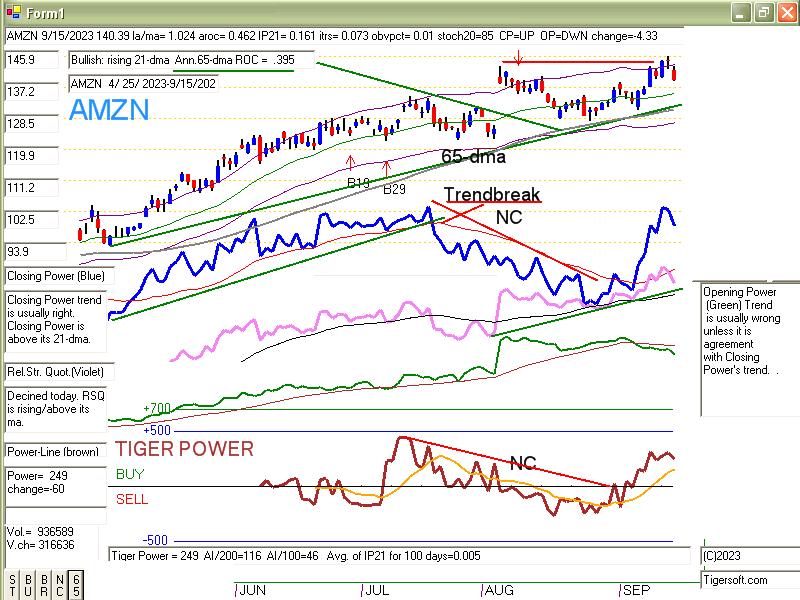
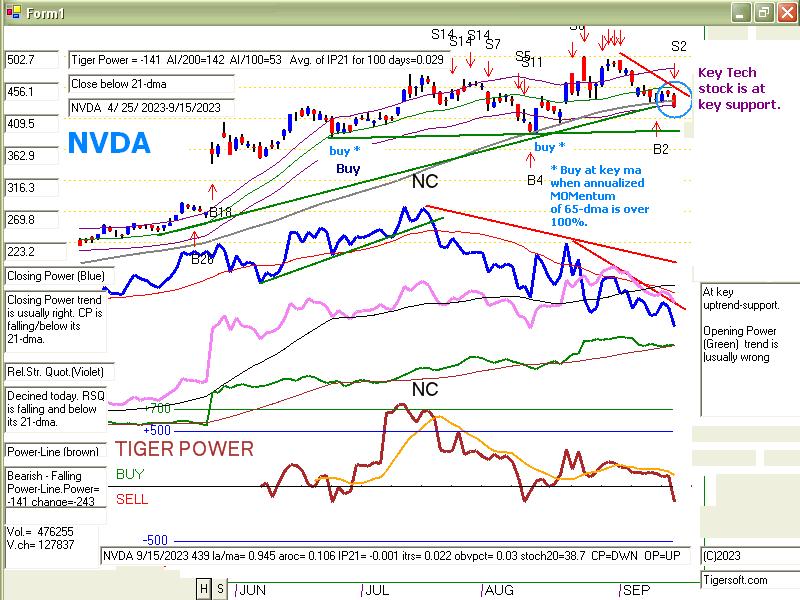
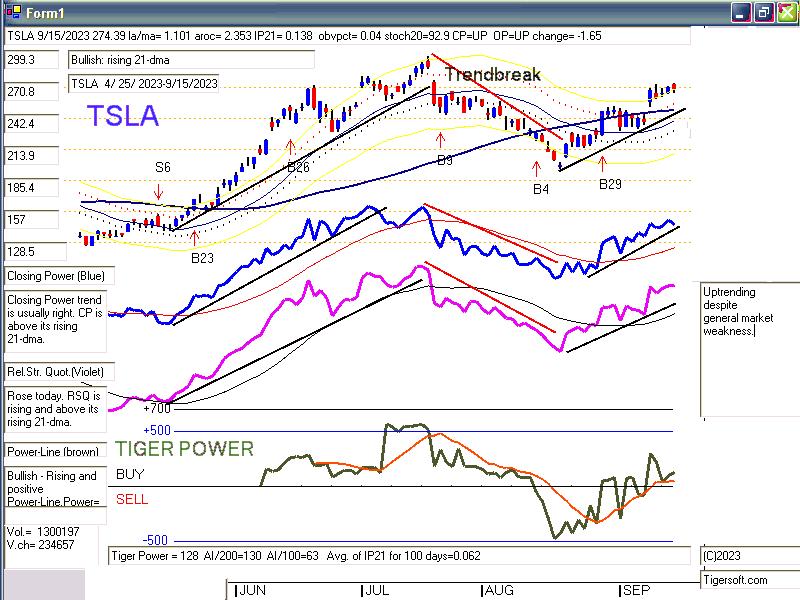
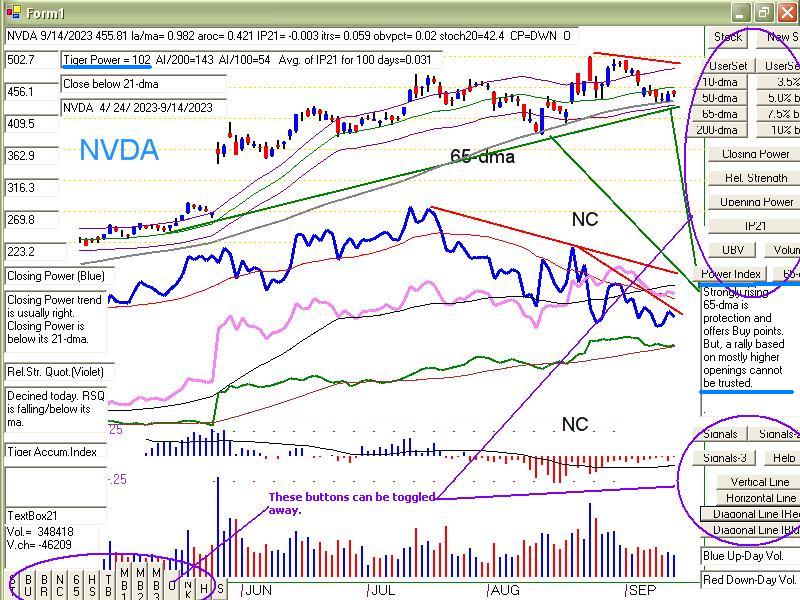
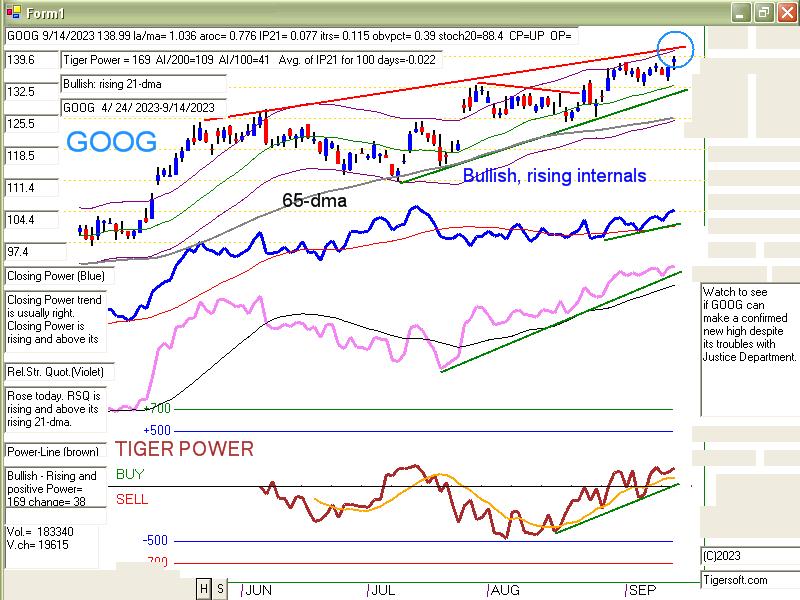
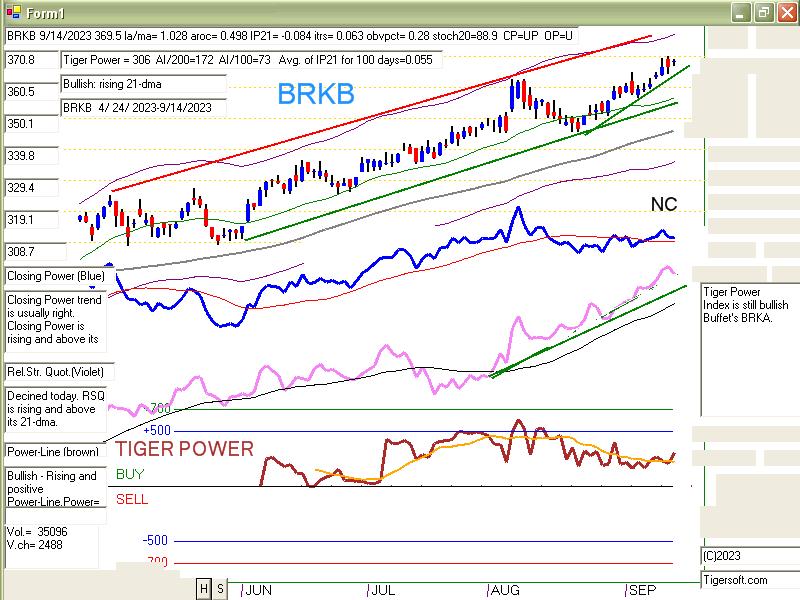
Shown below are AAPL, MSFT,
NVDA, GOOG, AMZN and BRKB.
They are the top
capitalization stocks in the SP-500 and QQQ. I left
out TSLA due to time
constraints.
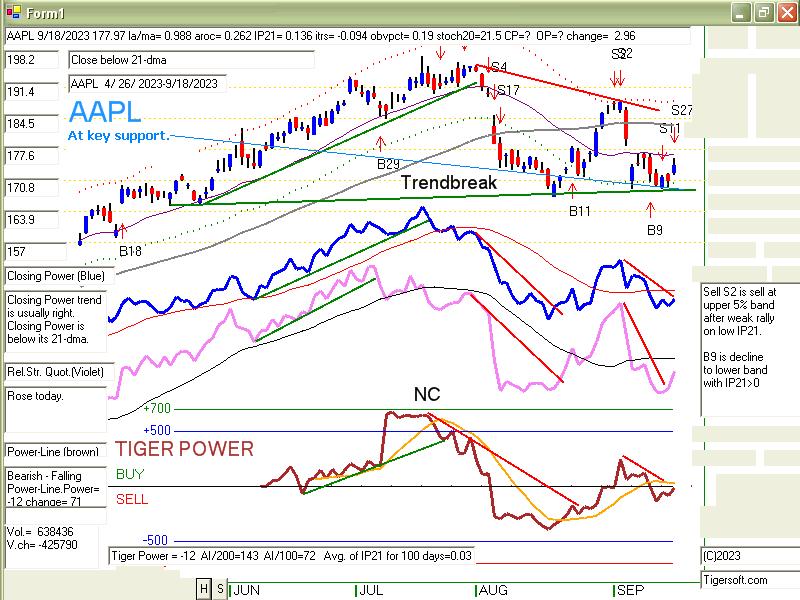
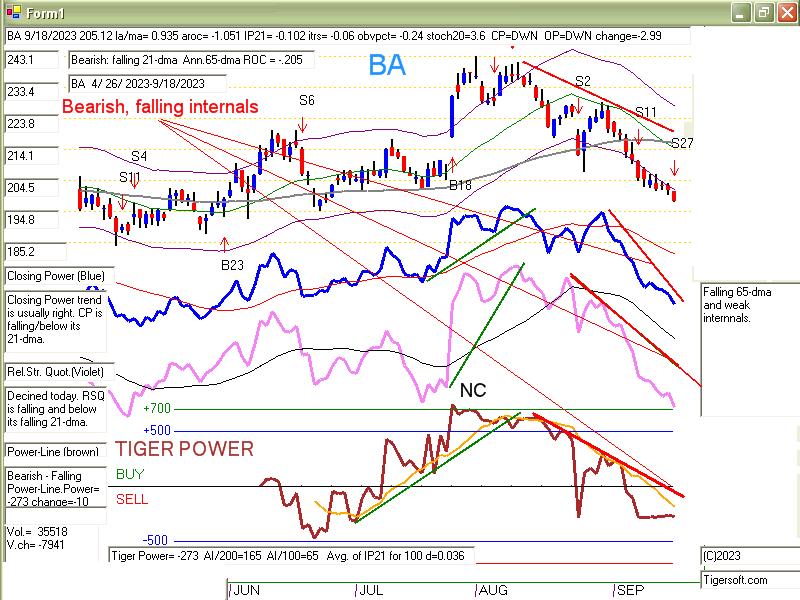
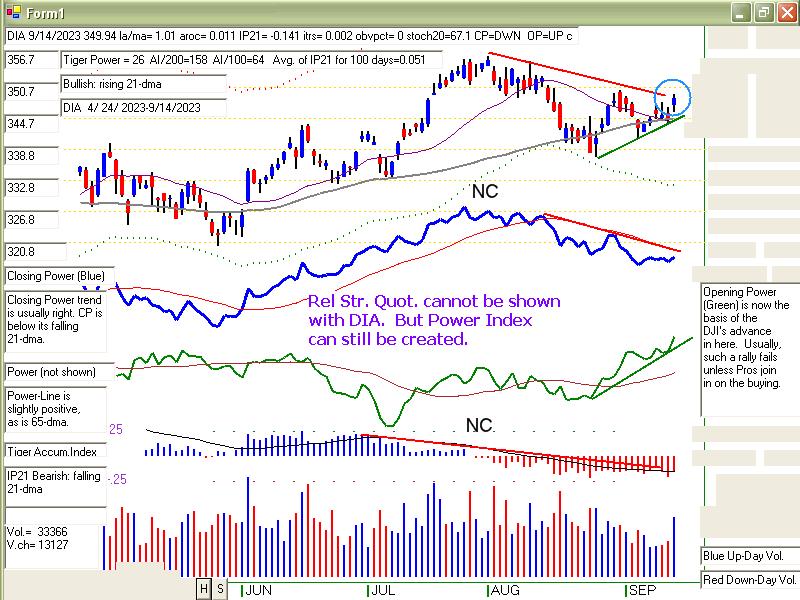
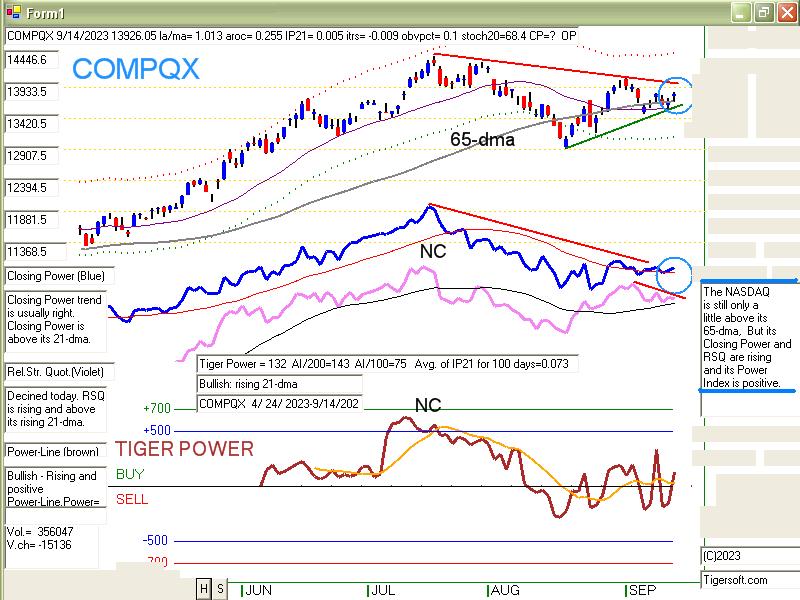
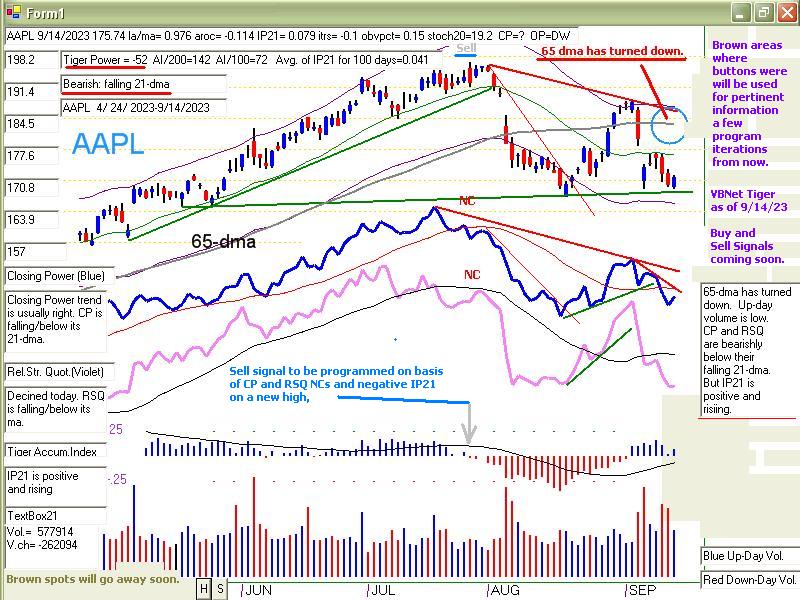
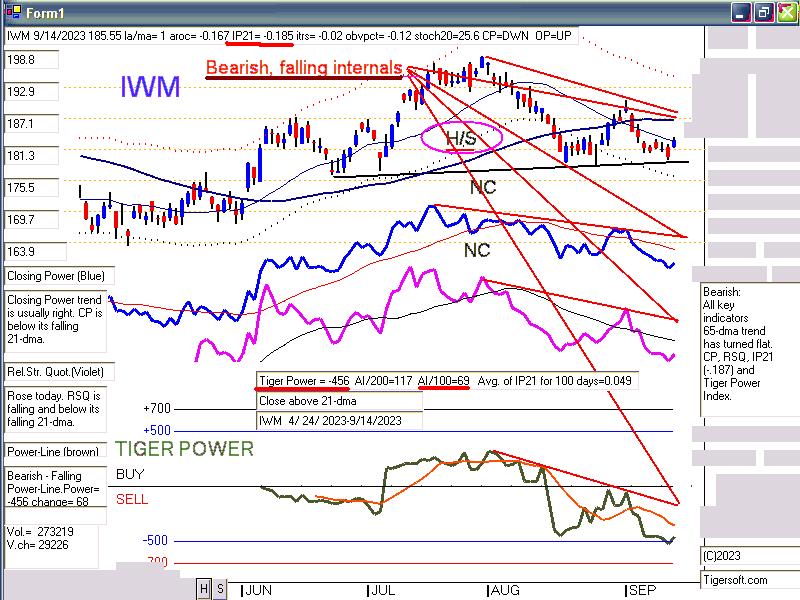
1) The 65-dma's trend.
Only AAPL and IWM show falling
65-dma. The DJI, DIA, SPY,
NASDAQ, QQQ, MSFT, NVDA,
AMZN, GOOG and BRKB do not.
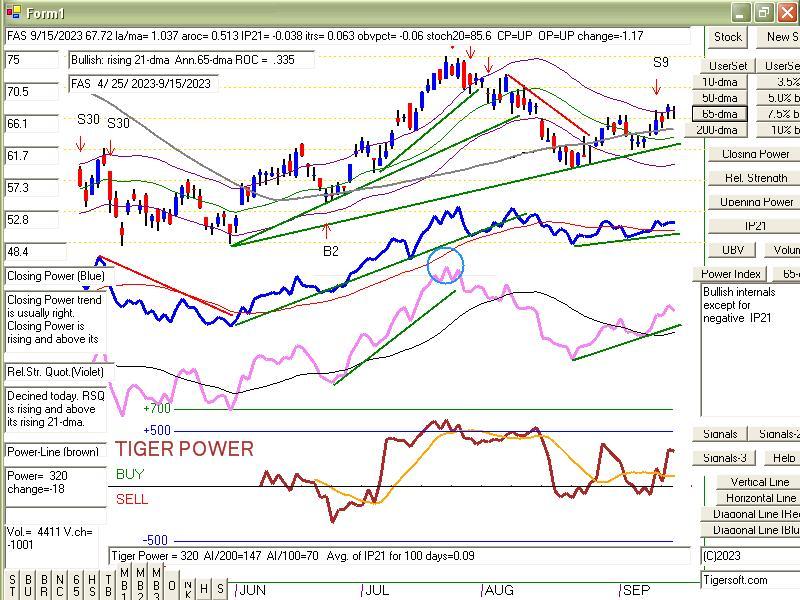
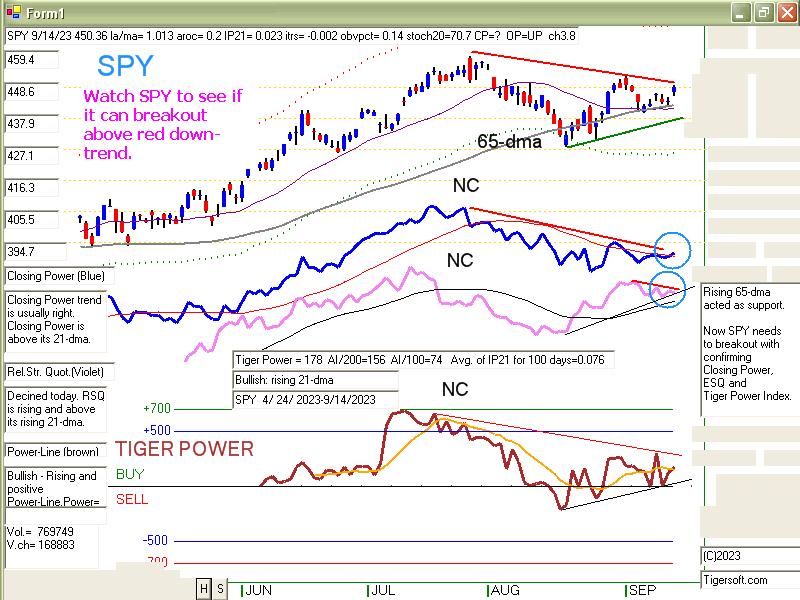
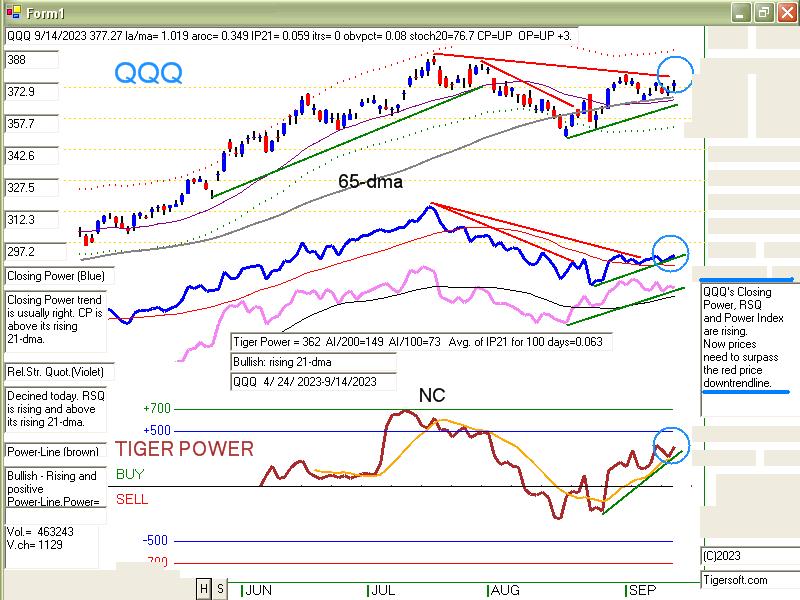
2) The Closing Powers are
falling for DIA, AAPL and IWM. They
could breakout bullishly or
fall back bearishly for the NASDAQ
and SPY. QQQ's is
rising but needs to show more strength to be
convincing.
3) The best Relative Strength
Quotient is shown in the charts of BRKB
and AMZN. Except for
AAPL and IWM, the RSQs are above their
rising 21-dma.
4) The IP21-Accumuations are
negative only in the cases of
DIA, NVDA and IWM. Some
of the others like the NASDAQ
and SPY are only barely
positive.
5) The Power Indexes are all
positive except for AAPL and IWM.
QQQ's is the highest in the
key charts shown here. |
|
| |
9/14/2023
2022 PEERLESS DJI, Signals, Indicators Daily DJI Volume
10-DayUp/Down Vol Stoch-20 CCI RSI Pct of All Stocks above 65-dma
Inverted Traders Index
DJI-IPA DJI-OBV
NASDAQ S&P OEX NYSE DJ-15 DJ-20 DJI-30
Old Peerless- 2006
version
Tiger Index of Big
Banks Bond Funds Gold Stocks Housing Stocks
Insurance-Stocks
Regional
Banks Russell-1000
Semi Conductors
ETFs: DIA QQQ SPY IWM MDY
TNA Short-Term Rates Ten Year Rates PST (Short Treasuries)
DOLLAR-UUP
ALLSTOCKs
COIN (Bit
Coin ETF)
USO-CrudeOil DBO BLDP FAS GLD HD IBB JETS JNUG KOL NAIL
NUGT NRGU OIH PALL RSX RETL SDS AGQ SLV SOXL TAN |
TECL TLT TMF TNA UGA USO
China: YINN
CHAU BABA BIDU
Commodities:
CANE
COCO CORN DBC CORN, CUT (paper)
MOO, NRGU
SOYB WEAT UUP (Dollar) LIT
(Lithium) PALL
(Palladium)
Stocks: AA AAPL ADBE AMAT AMGN AMD AMZN ANET AXP BA BAC
BSX CAT CDNS CHKP CNX CPB CRM CVX CMG DE DIS ENPH FB
FSLR FTNT GILD GME GOOG GS HD IBM INTU JPM KO KR LRCX
MRK MRNA MOS MSFT NEM NFLX NKE NOC NUE NVDA PANW PG
PYPL QCOM QDEL REGN REV RE SCHW SNOW SO SQUARE TSLA
TXN XOM V VRTX WFC WMT XLE ZM ZOM
SEMI-Condctors in SOXL:
NVDA. AVGO, AMD. INTC LRCX TXN MCHP NXPI AMAT ON AAOI TSM
HOMEBUILDERS: BLDP NAIL
BZH HOV LEN MHO MTH PHM -
REGIONAL BANKS:
EGBN
FFIC GBCI HMST
Carl Icahn and associates: IEP
MS
JEF
Leveraged Short ETFs:
FAZ - financials, TZA and SRTY- small caps, MZZ - mid caps, TECS -Techs,
SOXS -
semi-conductors LABD
- Biotechs
Bullish MAXCPs http://tigersoftware.com/upping/9-14-2023/Bullish.htm
Bearish MINCPs www.tigersoftware.com/downing/9-14-2023/Bearish.htm |
|
 |
 |
 |
 |
 |
 |
 |
 |
 |
 |
|
Table
1 - Daily Breadth and Volume
| NYSE |
Latest
Close |
Previous
Close |
Week
Ago |
| Issues
traded |
3,002 |
3,004 |
3,010 |
| Advances |
2,290 |
1,134 |
1,041 |
| Declines |
629 |
1,747 |
1,862 |
| Unchanged |
83 |
123 |
107 |
| New
highs |
64 |
51 |
40 |
| New
lows |
63 |
93 |
116 |
| Adv.
volume* |
737,401,572 |
295,647,636 |
279,240,788 |
| Decl.
volume* |
154,611,313 |
564,430,992 |
621,527,299 |
| Total
volume* |
909,838,757 |
872,417,944 |
912,068,467 |
| Closing
Arms (TRIN)† |
0.90 |
1.15 |
1.38 |
| Block
trades* |
3,994 |
3,792 |
4,068 |
| Adv.
volume |
2,877,840,343 |
1,250,477,747 |
1,073,111,229 |
| Decl.
volume |
712,082,132 |
2,220,055,580 |
2,639,352,244 |
| Total
volume |
3,648,725,051 |
3,529,431,146 |
3,763,765,222 |
| NASDAQ |
Latest
Close |
Previous
Close |
Week
Ago |
| Issues
traded |
4,486 |
4,480 |
4,437 |
| Advances |
2,880 |
1,637 |
1,407 |
| Declines |
1,400 |
2,645 |
2,865 |
| Unchanged |
206 |
198 |
165 |
| New
highs |
49 |
32 |
39 |
| New
lows |
185 |
211 |
274 |
| Closing
Arms (TRIN)† |
1.24 |
0.63 |
0.89 |
| Block
trades |
35,580 |
38,742 |
26,085 |
| Adv.
volume |
2,849,290,738 |
2,370,561,461 |
1,529,859,850 |
| Decl.
volume |
1,719,074,076 |
2,414,021,499 |
2,757,897,852 |
| Total
volume |
4,649,014,014 |
4,840,315,901 |
4,320,836,734 |
|
Table 2 TIGER QUICKSILVER on ETFS - 9/15/2023 ---
     Bullish = 1  DBO
     Bearish = 1  TAN
ETF       CLOSE     CHANGE    PIVOT-PT  5-dma AROC   CL-PWR  CANDLE  IP21    ITRS  POWER INDEX
=================================================================================================
DIA       349.94   3.39      346.51        61.3%     Bearish  BLUE  -.14      0      ------
---------------------------------------------------------------------------------------------
COMPQX    13926.05   112.46  13761.53      64.2%     Bearish  BLUE   .005   -.011    -.006
---------------------------------------------------------------------------------------------
SPY       450.36   3.85      445.52        61.7%     Bearish  BLUE   .024   -.004     .02
---------------------------------------------------------------------------------------------
QQQ       377.27   3.06      372.58        69.7%     -------  BLUE   .059   -.002     .057
---------------------------------------------------------------------------------------------
MDY       475.03   6.19      471.09        37.7%     Bearish  BLUE  -.137   -.023    -.16
---------------------------------------------------------------------------------------------
IWM       185.55   2.58      183.92        33.2%     Bearish  BLUE  -.184   -.022    -.206
---------------------------------------------------------------------------------------------
FAS       68.89   1.79       65.01         315.2%     ------- BLUE  -.052    .051    -.001
---------------------------------------------------------------------------------------------
RETL      6.53   .45         6.21          161.1%    Bearish  BLUE  -.109   -.105    -.214
---------------------------------------------------------------------------------------------
SOXL      21.65   .42        21.5         -51.4%     Bearish  RED    .069   -.113    -.044
---------------------------------------------------------------------------------------------
TECL      50.16   1.01       50.83        -34.9%     -------  BLUE   .047   -.068    -.021
---------------------------------------------------------------------------------------------
IBB       127.58   .48       126.85        27.5%     Bearish  BLUE  -.22    -.016    -.236
---------------------------------------------------------------------------------------------
GLD       177.17   .09       178.08       -23.9%     Bearish  BLUE  -.207   -.025    -.232
---------------------------------------------------------------------------------------------
DBO       17.92   .33        17.27         212.8%    Bullish  BLUE   .153    .231     .384 bullish
---------------------------------------------------------------------------------------------
OIH       359.72   5.14      353.07        108.6%    -------  RED   -.144    .218     .074
---------------------------------------------------------------------------------------------
CPER      23.53   .18         22.87         68.8%     -------  BLUE   .106   -.005    .101
---------------------------------------------------------------------------------------------
TAN       57.1   1.48        55.57         137.9%    -------  BLUE  -.05   -.203     -.253 bearish
---------------------------------------------------------------------------------------------
UUP       29.44   .18        29.33         23.9%     Bullish  BLUE   .133    .011     .144
---------------------------------------------------------------------------------------------
CORN      22.13  -.03        22.18        -40.6%     -------  BLUE   .027   -.022     .005
---------------------------------------------------------------------------------------------
WEAT      5.91  -.01         5.93         -50.8%     -------  ----  -.078   -.133    -.211
---------------------------------------------------------------------------------------------
YINN      32.01   .74        30.67         183.5%    -------  BLUE   .016   -.104    -.088
|
 Table 3      RANKING OF KEY DIRECTORIES BASED PCT.OF STOCKS ABOVE 65-DMA
              9/14/23
 Bullish = 10
 Bearish = 35
---------------------------------------------------------------------------------------
Directory     Current       day-1         day-2         day-3         day-4         day-5
----------------------------------------------------------------------------------------
COAL           1             1             1             1             1             1
EDU            .833          .666          .666          .666          .833          .833
MARIJUAN       .8            .8            .8            .8            .8            .5
OILGAS         .762          .742          .752          .721          .731          .721
INSURANC       .76           .72           .76           .72           .68           .72
COPPER         .714          .285          .142          .285          .142          .142
BIGBANKS       .571          .428          .142          .142          .142          .142
NASD-100       .514          .485          .485          .534          .504          .504
HIGHPRIC       .51           .445          .463          .519          .458          .467
FIDSTKS        .502          .443          .431          .455          .431          .408
================================================================================================
COMODITY       .5            .447          .447          .473          .447          .473
DOWJONES       .5            .433          .4            .433          .466          .433
HACKERS        .5            .5            .562          .562          .5            .5
SOFTWARE       .5            .446          .41           .482          .464          .464
SP-100         .5            .422          .4            .4            .4            .388
================================================================================================
REIT           .467          .336          .434          .434          .401          .385
DJI-13         .461          .461          .384          .384          .384          .384
FINANCE        .437          .35           .375          .325          .312          .25
NIFTY          .431          .431          .386          .477          .454          .409
SP500          .429          .36           .372          .386          .37           .376
FOOD           .428          .387          .387          .408          .428          .448
GUNS           .428          .214          .285          .285          .285          .428
RUS-1000       .428          .369          .393          .4            .387          .387
CHEM           .418          .325          .372          .348          .372          .395
INDEXES        .416          .351          .362          .416          .351          .362
INDMATER       .388          .319          .347          .333          .375          .375
INFRA          .387          .258          .193          .29           .29           .354
RETAIL         .369          .347          .369          .369          .391          .391
COMPUTER       .35           .35           .35           .35           .35           .35
UTILITY        .333          .179          .128          .128          .076          .051
LOWPRICE       .325          .284          .281          .281          .29           .296
TRANSP         .315          .263          .21           .263          .21           .263
AUTO           .314          .222          .203          .222          .222          .222
HOMEBLDG       .285          .25           .321          .392          .392          .428
GREEN          .277          .277          .277          .333          .388          .388
BIOTECH        .274          .261          .271          .286          .266          .256
SEMI           .271          .239          .228          .25           .25           .282
ELECTRON       .27           .248          .218          .233          .248          .278
MILITARY       .269          .192          .153          .192          .153          .153
EAT            .268          .195          .17           .195          .219          .219
GAMING         .263          .157          .105          .21           .105          .157
ETFS           .254          .163          .163          .163          .145          .145
REGBANKS       .236          .131          .21           .157          .131          .078
BEVERAGE       .214          .142          .214          .285          .214          .214
GOLD           .2            .177          .177          .155          .111          .111
CHINA          .17           .146          .219          .195          .17           .146
HOSPITAL       .153          .076          .153          .076          .153          .153
JETS           .076          .076          .153          .153          .076          .076
BONDFUND       .068          .08           .091          .103          .068          .057
SOLAR          0             0             0             0             0             0
|
====================================================================================
Thursday 9/14/2023 6:00 AM Data
used here is from 9/13/2023
DJI Futures +80 See https://dowfutures.org/ NASDAQ
Futures +80
| |
|
|
| |
Market Comments
The DJI remains stuck in its "Danger Zone" and sits on a
point very close to its still rising 65-dma, but shows a negative
AROC (21-dma trend), IP21 and OBV Pct, too. In addition,
its Closing Power is falling. So, the DJI is probably not the
best place to put money to work right now, even though the
general market seems to want to rally today, now that the
"bad" news is out on the CPI.
Talk on the "street" certainly suggests that the FED may be
done raising rates. But is it ready to lower rates? That is what
usually turns the market up, and sometimes three times it must
drop short-term rates. But at least, the 10-year rates are still
well below 4.5%, their yearly highs.
The QQQ would seem to be the place for short-term
traders to go for a long position now. Its Closing Power
has turned up slightly. At the same time, we want to
watch IWM as a potential short sale if it should complete
its head shoulders pattern. See these charts below.
The overall market is certainly oversold enough to make
a bottom. 95% of the stock groups we follow have a
majority of their components below their 65-dma. See
table 3. But the danger is that just keeping rates where
they are will not help consumers. Hence, the weakness
in the bearish MINCPs will probably continue. |
|
| |
|
9/13/2026
2022 PEERLESS DJI, Signals, Indicators Daily DJI Volume
10-DayUp/Down Vol Stoch-20 CCI RSI Pct of All Stocks above 65-dma
Inverted Traders Index
DJI-IPA DJI-OBV
NASDAQ S&P OEX NYSE DJ-15 DJ-20 DJI-30
Old Peerless- 2006
version
Tiger Index of Big
Banks Bond Funds Gold Stocks Housing Stocks
Insurance-Stocks
Regional
Banks Russell-1000
Semi Conductors
ETFs: DIA QQQ SPY IWM MDY
TNA Short-Term Rates Ten Year Rates PST (Short Treasuries)
DOLLAR-UUP
ALLSTOCKs
COIN (Bit
Coin ETF)
USO-CrudeOil DBO BLDP FAS GLD HD IBB JETS JNUG KOL NAIL
NUGT NRGU OIH PALL RSX RETL SDS AGQ SLV SOXL TAN |
TECL TLT TMF TNA UGA USO
China: YINN
CHAU BABA BIDU
Commodities: CANE COCO CORN DBC CORN, CUT (paper)
MOO, NRGU
SOYB WEAT UUP (Dollar) LIT
(Lithium) PALL
(Palladium)
Stocks: AA AAPL ADBE AMAT AMGN AMD AMZN ANET AXP BA BAC
BSX CAT CDNS CHKP CNX CPB CRM CVX CMG DE DIS ENPH FB
FSLR FTNT GILD GME GOOG GS HD IBM INTU JPM KO KR LRCX
MRK MRNA MOS MSFT NEM NFLX NKE NOC NUE NVDA PANW PG
PYPL QCOM QDEL REGN REV RE SCHW SNOW SO SQUARE TSLA
TXN XOM V VRTX WFC WMT XLE ZM ZOM
SEMI-Condctors in SOXL:
NVDA. AVGO, AMD. INTC LRCX TXN MCHP NXPI AMAT ON AAOI TSM
HOMEBUILDERS: BLDP NAIL
BZH HOV LEN MHO MTH PHM -
REGIONAL BANKS:
EGBN
FFIC GBCI HMST
Carl Icahn and associates: IEP
MS
JEF
Leveraged Short ETFs:
FAZ - financials, TZA and SRTY- small caps, MZZ - mid caps, TECS -Techs,
SOXS -
semi-conductors LABD
- Biotechs
Bullish MAXCPs
http://tigersoftware.com/upping/9-13-2023/Bullish.htm
Bearish MINCPs www.tigersoftware.com/downing/9-13-2023/Bearish.htm |
|
 |
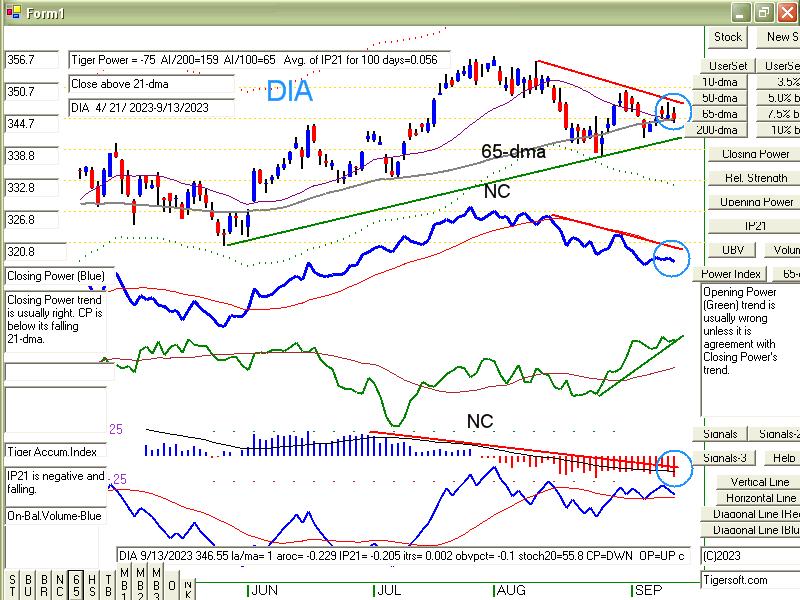 |
 |
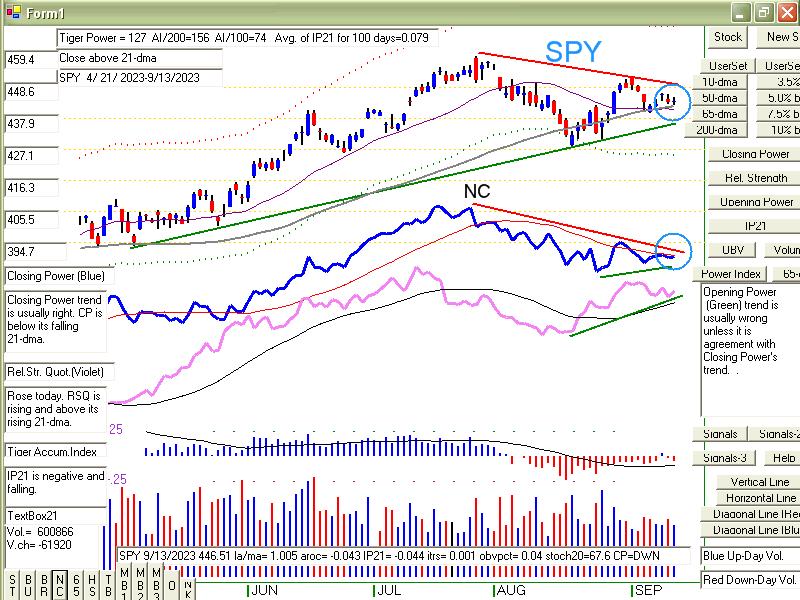 |
 |
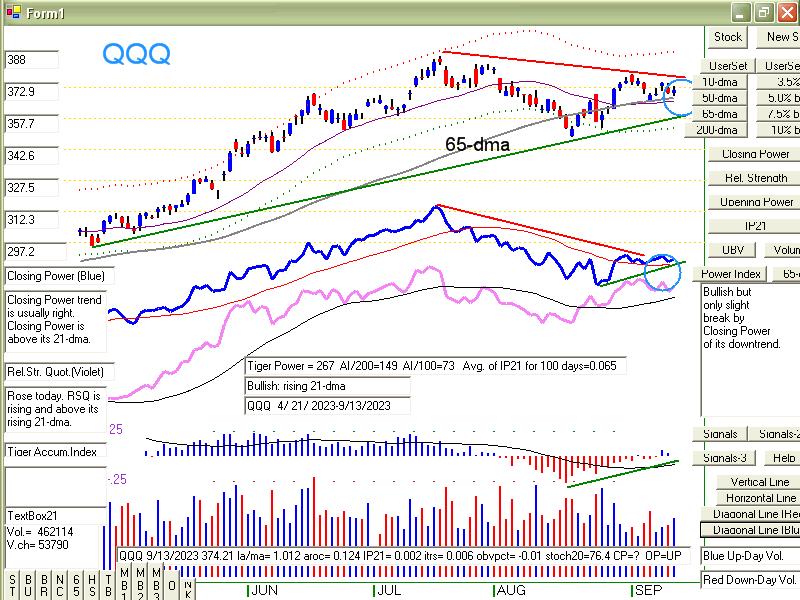 |
 |
 |
Table 2 TIGER QUICKSILVER on ETFS - 9/12/2023 ---
     Bullish = 1  DBO
     Bearish = 4  IWM, RETL, GLD  and TAN
     Only the Dollar shows a rising Closing Power
ETF       CLOSE     CHANGE    PIVOT-PT  5-dma AROC   CL-PWR  CANDLE  IP21    ITRS  POWER INDEX
=================================================================================================
DIA       346.55  -.66       345.69        22.4%     Bearish  RED   -.205    ---    -----
---------------------------------------------------------------------------------------------
COMPQX    13813.59   39.97   13748.83     -21.3%     Bearish  BLUE  -.06    -.007    -.067
---------------------------------------------------------------------------------------------
SPY       446.51   .52       444.85        3.2%      Bearish  BLUE  -.043   -.001    -.044
---------------------------------------------------------------------------------------------
QQQ       374.21   1.42      372.06       -7.1%      Bearish  BLUE   .002    .003     .005
---------------------------------------------------------------------------------------------
MDY       468.84  -2.84      471.48       -71.1%     Bearish  RED   -.207   -.03     -.237
---------------------------------------------------------------------------------------------
IWM       182.97  -1.21      184.33       -85.6%     Bearish  RED   -.254   -.032    -.286 bearish
---------------------------------------------------------------------------------------------
FAS       67.1  -.26         64.73         154%      Bearish  RED   -.137    .028    -.109
-------------------------------------------------------------------------------------------
RETL      6.08  -.11         6.33         -294.6%    Bearish  RED   -.213   -.162    -.375 bearish
---------------------------------------------------------------------------------------------
SOXL      21.23   .29        21.87        -506%      Bearish  BLUE   .021   -.174    -.153
---------------------------------------------------------------------------------------------
TECL      49.15   .44        50.51        -366.4%    Bearish  BLUE   .003   -.091    -.088
---------------------------------------------------------------------------------------------
IBB       127.1  -.38        126.88       -8.3%      Bearish  RED   -.225   -.005    -.23
---------------------------------------------------------------------------------------------
GLD       177.08  -.41       178.02       -21.1%     Bearish  RED   -.266   -.015    -.281 bearish
---------------------------------------------------------------------------------------------
DBO       17.59  -.01        17.18         80.8%     -------  ----   .083    .242     .325
---------------------------------------------------------------------------------------------
OIH       354.58  -7.72      352.01        10.8%     -------  RED   -.143    .213     .07
---------------------------------------------------------------------------------------------
CPER     23.35  -.02         23.21         2.2%      -------  RED    .046   -.007     .039
---------------------------------------------------------------------------------------------
TAN     55.62  -1.17         55.56        -106.1%    -------  RED   -.177   -.228    -.405 bearish
---------------------------------------------------------------------------------------------
UUP       29.26   .02        29.3          5.1%      Bullish  ----   .12    .023      .143
---------------------------------------------------------------------------------------------
CORN      22.16   .17        22.31        -31.5%     -------  BLUE  -.058   -.018    -.076
---------------------------------------------------------------------------------------------
WEAT      5.92   .07         5.97         -109.7%    -------  ----  -.156   -.088     -.244
---------------------------------------------------------------------------------------------
YINN      31.27  -.75        30.86        -372.5%    Bearish  ----  -.016   -.144    -.16
|
 Table 3      RANKING OF KEY DIRECTORIES BASED PCT.OF STOCKS ABOVE 65-DMA
              9/13/23
 Bullish = 5
 Bearish = 44
---------------------------------------------------------------------------------------
Directory     Current       day-1         day-2         day-3         day-4         day-5
----------------------------------------------------------------------------------------
COAL           1             1             1             1             1             1
MARIJUAN       .8            .8            .8            .8            .5            .6
OILGAS         .742          .752          .721          .731          .721          .731
INSURANC       .72           .76           .72           .68           .72           .64
EDU            .666          .666          .666          .833          .833          .833
----------------------------------------------------------------------------------------------
HACKERS        .5            .562          .562          .5            .5            .5
----------------------------------------------------------------------------------------------
NASD-100       .485          .485          .534          .504          .504          .534
SOFTWARE       .464          .428          .482          .464          .446          .482
DJI-13         .461          .384          .384          .384          .384          .384
COMODITY       .447          .473          .447          .447          .473          .473
HIGHPRIC       .445          .463          .519          .458          .467          .506
FIDSTKS        .443          .431          .455          .431          .414          .449
DOWJONES       .433          .4            .433          .466          .433          .433
               -----
NIFTY          .431          .386          .477          .454          .409          .5
BIGBANKS       .428          .142          .142          .142          .142          .142
SP-100         .422          .4            .4            .4            .388          .411
FOOD           .387          .408          .387          .428          .448          .448
RUS-1000       .37           .393          .399          .387          .39           .4
SP500          .36           .372          .386          .368          .378          .391
               -----
INDEXES        .351          .362          .416          .351          .367          .41
COMPUTER       .35           .35           .35           .35           .35           .35
FINANCE        .35           .375          .325          .3            .25           .262
RETAIL         .347          .369          .369          .391          .391          .369
REIT           .336          .418          .442          .409          .377          .368
CHEM           .325          .372          .348          .372          .418          .395
INDMATER       .319          .347          .333          .375          .402          .388
COPPER         .285          .142          .285          .142          .142          .285
LOWPRICE       .284          .284          .284          .29           .293          .319
GREEN          .277          .277          .333          .388          .388          .333
TRANSP         .263          .21           .263          .21           .263          .263
BIOTECH        .258          .269          .289          .266          .256          .289
INFRA          .258          .193          .29           .29           .354          .451
HOMEBLDG       .25           .321          .392          .392          .428          .428
ELECTRON       .248          .218          .233          .248          .27           .338
SEMI           .239          .228          .25           .25           .282          .369
AUTO           .222          .222          .222          .222          .222          .296
GUNS           .214          .285          .285          .285          .428          .5
EAT            .195          .17           .195          .219          .219          .195
MILITARY       .192          .153          .192          .153          .153          .23
UTILITY        .179          .128          .128          .076          .051          .051
GOLD           .177          .177          .155          .111          .088          .133
ETFS           .163          .163          .163          .145          .163          .2
GAMING         .157          .105          .157          .157          .157          .105
CHINA          .146          .219          .195          .17           .146          .219
BEVERAGE       .142          .214          .285          .214          .214          .214
REGBANKS       .131          .21           .157          .131          .078          .157
BONDFUND       .08           .08           .103          .08           .08           .068
HOSPITAL       .076          .153          .076          .153          .153          .23
JETS           .076          .153          .153          .076          .076          .076
SOLAR          0             0             0             0             0             0
|
===================================================================================
Wednesday 9/13/2023 6:10 AM
Data used here is from 9/12/2023
DJI Futures -12 See https://dowfutures.org/
NASDAQ Futures -22
| |
CONSUMER
PRICE INDEX - AUGUST 2023
The Consumer Price Index for All Urban Consumers (CPI-U) rose 0.6 percent
in August on a seasonally adjusted basis, after increasing 0.2 percent in
July, the U.S. Bureau of Labor Statistics reported today. Over the last
12 months, the all items index increased 3.7 percent before seasonal
adjustment.
The index for gasoline was the largest contributor to the monthly all
items increase, accounting for over half of the increase. Also contributing
to the August monthly increase was continued advancement in the shelter index,
which rose for the 40th consecutive month. The energy index rose 5.6 percent
in August as all the major energy component indexes increased.
Market Comments
The jump in the CPI back upwards should not be a surprise to those who
watched the steady rise in crude oil, gasoline and the oil service and
equipment stocks recently. What will be important now is how the market and
the FED respond react to this. The DJI, Nasdaq, QQQ and SPY are
all sitting on their rising 65-dma. Ordinarily this would be a bullish
point from which a good bounce could occur, especially with the uncertainty
of the month's CPI number now removed. And a bounce may still
occur. Bank stocks, in fact, turned up yesterday. We should now watch
AAPL, MSFT and NVDA especially closely, as they are very close
to their 65-dma.
The problem with the bullish view of the leading indexes is how increasingly
isolated they are from the broader market, where only 33% of all stocks
are above their 65-dma and, according to Table 3 below, 80% of the different
groups we follow show a clear majority of their component stocks are
below their 65-dma.
If we judge the trend using our Closing Powers, then we have to say that
Professionals are not yet ready to commit to the long side of the DIA, SPY
and QQQ. Their charts' Closing Powers are all in falling trends. And if
we use the Danger Zone pointers, discussed here, we have to admit that
the DJI is still at high risk since its 21-day ma is falling and its IP21 is
negative as it clings to its 65-dma. The 65-dma there, however, is still
rising. It cannot turn down until the DJI drops back below 34000, where
it was 65 days ago.
Certainly the DJI can hold up the appearance of a stable, rising stock
market for a long time. And certainly, the leading tech stocks are where
aggressive fund managers and traders go for profits, now more than ever.
But with the Closing Powers falling now for QQQ and SPY, we have
to wait on developments.
As such it is a great time to be short the weakest sectors. The "little
guy"
is hurting. And now he's cutting back on going to restaurants as well
as convenional retail stores. This is not going to change anytime soon.
So, consider more shorts on the weakest MINCPs.
|
|
| |
9/12/2026
2022 PEERLESS DJI, Signals, Indicators Daily DJI Volume
10-DayUp/Down Vol Stoch-20 CCI RSI Pct of All Stocks above 65-dma
Inverted Traders Index
DJI-IPA DJI-OBV
NASDAQ S&P OEX NYSE DJ-15 DJ-20 DJI-30
Old Peerless- 2006
version
Tiger Index of Big
Banks Bond Funds Gold Stocks Housing Stocks
Insurance-Stocks
Regional
Banks Russell-1000
Semi Conductors
ETFs: DIA QQQ SPY IWM MDY
TNA Short-Term Rates Ten Year Rates PST (Short Treasuries)
DOLLAR-UUP
ALLSTOCKs
COIN (Bit
Coin ETF)
USO-CrudeOil DBO BLDP FAS GLD HD IBB JETS JNUG KOL NAIL
NUGT NRGU OIH PALL RSX RETL SDS AGQ SLV SOXL TAN |
TECL TLT TMF TNA UGA USO
China: YINN
CHAU BABA BIDU
Commodities: CANE COCO CORN DBC CORN, CUT (paper)
MOO, NRGU
SOYB WEAT UUP (Dollar) LIT
(Lithium) PALL
(Palladium)
Stocks: AA AAPL ADBE AMAT AMGN AMD AMZN ANET AXP BA BAC
BSX CAT CDNS CHKP CNX CPB CRM CVX CMG DE DIS ENPH FB
FSLR FTNT GILD GME GOOG GS HD IBM INTU JPM KO KR LRCX
MRK MRNA MOS MSFT NEM NFLX NKE NOC NUE NVDA PANW PG
PYPL QCOM QDEL REGN REV RE SCHW SNOW SO SQUARE TSLA
TXN XOM V VRTX WFC WMT XLE ZM ZOM
SEMI-Condctors in SOXL:
NVDA. AVGO, AMD. INTC LRCX TXN MCHP NXPI AMAT ON AAOI TSM
HOMEBUILDERS: BLDP NAIL
BZH HOV LEN MHO MTH PHM -
REGIONAL BANKS:
EGBN
FFIC GBCI HMST
Carl Icahn and associates: IEP
MS
JEF
Leveraged Short ETFs:
FAZ - financials, TZA and SRTY- small caps, MZZ - mid caps, TECS -Techs,
SOXS -
semi-conductors LABD
- Biotechs
Bullish MAXCPs
http://tigersoftware.com/upping/9-12-2023/Bullish.htm
Bearish MINCPs www.tigersoftware.com/downing/9-12-2023/Bearish.htm |
|
 |
 |
 |
 |
 |
 |
 |
 |
 |
 |
 |
 |
 |
 |
Table 1 - Daily Breadth and Volume Statistics
| NYSE |
Latest
Close |
Previous
Close |
Week
Ago |
| Issues
traded |
2,995 |
3,018 |
3,017 |
| Advances |
1,361 |
1,578 |
645 |
| Declines |
1,520 |
1,305 |
2,294 |
| Unchanged |
114 |
135 |
78 |
| New
highs |
67 |
65 |
64 |
| New
lows |
95 |
75 |
86 |
| Adv.
volume* |
426,734,405 |
463,013,896 |
194,466,481 |
| Decl.
volume* |
338,919,889 |
292,902,279 |
627,077,055 |
| Total
volume* |
772,443,317 |
769,205,705 |
826,665,985 |
| Closing
Arms (TRIN)† |
0.75 |
0.76 |
0.75 |
| Block
trades* |
3,748 |
3,994 |
4,049 |
| Adv.
volume |
1,853,339,879 |
2,036,199,637 |
950,941,028 |
| Decl.
volume |
1,544,834,382 |
1,275,190,407 |
2,539,307,151 |
| Total
volume |
3,435,747,638 |
3,369,924,175 |
3,526,252,329 |
| NASDAQ |
Latest
Close |
Previous
Close |
Week
Ago |
| Issues
traded |
4,479 |
4,485 |
4,497 |
| Advances |
1,888 |
2,247 |
1,329 |
| Declines |
2,342 |
2,023 |
3,011 |
| Unchanged |
249 |
215 |
157 |
| New
highs |
60 |
58 |
77 |
| New
lows |
196 |
202 |
157 |
| Closing
Arms (TRIN)† |
0.69 |
0.57 |
0.41 |
| Block
trades |
34,798 |
32,829 |
29,243 |
| Adv.
volume |
2,439,222,208 |
2,952,966,376 |
2,243,671,597 |
| Decl.
volume |
2,082,401,337 |
1,517,149,189 |
2,060,737,525 |
| Total
volume |
4,595,491,826 |
4,538,877,923 |
4,379,798,387 |
|
Table 2 TIGER QUICKSILVER on ETFS - 9/12/2023 ---
     Bullish = 1  DBO
     Bearish = 2  RETL and TAN
     Only the Dollar shows a rising Closing Power
ETF       CLOSE     CHANGE    PIVOT-PT  5-dma AROC   CL-PWR  CANDLE  IP21    ITRS  POWER INDEX
=================================================================================================
DIA       347.21  -.16       345           3.3%      Bearish  BLUE  -.15    =====    ======
---------------------------------------------------------------------------------------------
COMPQX    13773.62  -144.27  13872.47     -89.2%     Bearish  RED   -.025   -.011    -.036
---------------------------------------------------------------------------------------------
SPY       445.99  -2.46      446.22       -36.4%     Bearish  RED   -.014   -.004    -.018
---------------------------------------------------------------------------------------------
QQQ       372.79  -4.18      374.74       -70.4%     -------  RED    .035   -.001     .034
---------------------------------------------------------------------------------------------
MDY       471.68   .13       475.56       -57%       Bearish  BLUE  -.153   -.025    -.178
---------------------------------------------------------------------------------------------
IWM       184.18  -.18       186.13       -71.6%     Bearish  BLUE  -.189   -.026    -.215
---------------------------------------------------------------------------------------------
FAS       67.36   1.65       65.08         151.9%    Bearish  BLUE  -.11     .05     -.06
---------------------------------------------------------------------------------------------
RETL      6.19  -.03         6.45         -298.9%    Bearish  ----  -.145   -.128    -.273
---------------------------------------------------------------------------------------------
SOXL      20.94  -.51        23.44        -685.8%    -------  ----   .075   -.166    -.091
---------------------------------------------------------------------------------------------
TECL      48.71  -2.86       52.88        -566.4%    -------  RED    .036   -.108    -.072
---------------------------------------------------------------------------------------------
IBB       127.48  -.2        127.31       -25.9%     -------  RED   -.159   -.006    -.165
---------------------------------------------------------------------------------------------
GLD       177.49  -.92       177.83       -32.3%     Bearish  BLUE  -.228   -.014    -.242
---------------------------------------------------------------------------------------------
DBO       17.6   .29         17.31         136.3%    -------  BLUE   .077    .237     .314
---------------------------------------------------------------------------------------------
OIH       362.3   8.64       353.81        137.8%    -------  BLUE  -.098    .25      .152
---------------------------------------------------------------------------------------------
CPER     23.37  -.06         23.34        -53.7%     -------  BLUE   .073   -.002     .071
---------------------------------------------------------------------------------------------
TAN     56.79   1.06         56.81        -109.2%    -------  BLUE  -.092   -.215    -.307
---------------------------------------------------------------------------------------------
UUP       29.24   .05        29.23         3.4%      Bullish  ----   .1    .021       .121
---------------------------------------------------------------------------------------------
CORN      21.99  -.34        22.3         -85.2%     -------  RED   -.119   -.019    -.138
---------------------------------------------------------------------------------------------
WEAT      5.85   .02         6.05         -75.7%     Bearish  ----  -.11   -.101     -.211
---------------------------------------------------------------------------------------------
YINN      32.02   .13        33.64        -232%      -------  BLUE   .014   -.075    -.061
|
Table 3    RANKING OF KEY DIRECTORIES BASED PCT.OF STOCKS ABOVE 65-DMA
               9/12/23
   Bullsh = 6
   Bearish = 44
---------------------------------------------------------------------------------------
Directory     Current       day-1         day-2         day-3         day-4         day-5
----------------------------------------------------------------------------------------
COAL           1             1             1             1             1             1
MARIJUAN       .8            .8            .8            .5            .6            .6
INSURANC       .76           .72           .68           .72           .64           .64
OILGAS         .752          .721          .731          .721          .731          .752
EDU            .666          .666          .833          .833          .833          .833
HACKERS        .562          .562          .5            .5            .5            .5
====================================================================================================
NASD-100       .485          .534          .504          .504          .534          .603
COMODITY       .473          .473          .421          .473          .473          .552
HIGHPRIC       .463          .519          .458          .467          .51           .558
SOFTWARE       .446          .5            .464          .446          .464          .517
FIDSTKS        .431          .455          .431          .414          .455          .52
REIT           .418          .426          .418          .385          .368          .352
FOOD           .408          .408          .408          .448          .448          .489
DOWJONES       .4            .433          .466          .433          .433          .533
SP-100         .4            .4            .4            .388          .411          .466
RUS-1000       .394          .399          .386          .39           .406          .435
NIFTY          .386          .477          .454          .409          .5            .59
DJI-13         .384          .384          .384          .384          .384          .538
FINANCE        .375          .325          .3            .237          .262          .387
CHEM           .372          .348          .372          .418          .395          .441
SP500          .372          .386          .368          .376          .395          .419
RETAIL         .369          .369          .391          .391          .391          .478
INDEXES        .362          .416          .351          .367          .41           .459
COMPUTER       .35           .35           .35           .35           .35           .4
INDMATER       .347          .333          .375          .402          .416          .458
HOMEBLDG       .321          .392          .392          .428          .428          .392
GUNS           .285          .285          .285          .428          .5            .428
LOWPRICE       .284          .287          .293          .293          .316          .328
GREEN          .277          .333          .388          .388          .333          .333
BIOTECH        .266          .286          .269          .256          .291          .296
SEMI           .228          .25           .25           .282          .369          .413
AUTO           .222          .24           .222          .222          .296          .351
CHINA          .219          .195          .17           .146          .219          .243
ELECTRON       .218          .233          .248          .27           .33           .39
BEVERAGE       .214          .285          .214          .214          .214          .285
REGBANKS       .21           .157          .131          .078          .184          .421
TRANSP         .21           .263          .21           .263          .263          .263
INFRA          .193          .29           .29           .354          .451          .58
GOLD           .177          .155          .111          .088          .133          .133
EAT            .17           .195          .219          .219          .195          .243
ETFS           .163          .163          .145          .163          .218          .2
HOSPITAL       .153          .076          .153          .153          .23           .23
JETS           .153          .153          .076          .076          .076          .153
MILITARY       .153          .192          .153          .153          .23           .269
BIGBANKS       .142          .142          .142          .142          .142          .142
COPPER         .142          .285          .142          .142          .285          .571
UTILITY        .128          .128          .076          .051          .051          .076
GAMING         .105          .157          .105          .21           .105          .157
BONDFUND       .08           .091          .08           .091          .08           .08
SOLAR          0             0             0             0             0             0
|
============================================================================
Tuesday 9/12/2023 6:10 AM Data used
here is from 9/11/2023
DJI Futures -52 See https://dowfutures.org/
NASDAQ Futures -54
| |
9/11/2023
|
|
| |
Market Comments
On suspiciously low volume the DJI
managed to hold up above its
65-dma after a 100 point
early rally. But its Closing Power is falling
and with a negative IP21 and
falling 2-dma, it has not escaped
what I have called its
"danger zone", where it could drop so seriously
below its 65-dma that it
would violate the support of its 200-day ma,
its lengthy uptrendline and
set off an extended September decline
in "Blue Chips".
Look at the declining retails
stocks within the DJI-30 Nike and
Walgreen. They warn us
that the FED's just leaving rates where they are
is having a serious
effect on consumers. As very low priced DOW
stocks, NKE and WAG,
have little direct on the DJIA. But they do
point us to good short
sales among our MINCPs.
QQQ, the NASDAQ and SPY
(see below) have escaped the
"danger
zone", as their IP21s have either turned positive or the
21-dma has turned up.
In fact, QQQ looks bullish with its Closing
Power downtrend
violated, in large part because of the big rise in
TSLA.
Study the
bulging, high IP21 stocks in the bullish MAXCPs. This
is often the
first sign of serious insider buying and Accumulation.
Trading the
Bullish MAXCPs and Bearish MINCPs remains the
favored strategy
for now.
|
|
| |
9/11/2026
2022 PEERLESS DJI, Signals, Indicators Daily DJI Volume
10-DayUp/Down Vol Stoch-20 CCI RSI Pct of All Stocks above 65-dma
Inverted Traders Index
DJI-IPA DJI-OBV
NASDAQ S&P OEX NYSE DJ-15 DJ-20 DJI-30
Old Peerless- 2006
version
Tiger Index of Big
Banks Bond Funds Gold Stocks Housing Stocks
Insurance-Stocks
Regional
Banks Russell-1000
Semi Conductors
ETFs: DIA QQQ SPY IWM MDY
TNA Short-Term Rates Ten Year Rates PST (Short Treasuries)
DOLLAR-UUP
ALLSTOCKs
COIN (Bit
Coin ETF)
USO-CrudeOil DBO BLDP FAS GLD HD IBB JETS JNUG KOL NAIL
NUGT NRGU OIH PALL RSX RETL SDS AGQ SLV SOXL TAN |
TECL TLT TMF TNA UGA USO
China: YINN
CHAU BABA BIDU
Commodities: CANE COCO CORN DBC CORN, CUT (paper)
MOO, NRGU
SOYB WEAT UUP (Dollar) LIT
(Lithium) PALL
(Palladium)
Stocks: AA AAPL ADBE AMAT AMGN AMD AMZN ANET AXP BA BAC
BSX CAT CDNS CHKP CNX CPB CRM CVX CMG DE DIS ENPH FB
FSLR FTNT GILD GME GOOG GS HD IBM INTU JPM KO KR LRCX
MRK MRNA MOS MSFT NEM NFLX NKE NOC NUE NVDA PANW PG
PYPL QCOM QDEL REGN REV RE SCHW SNOW SO SQUARE TSLA
TXN XOM V VRTX WFC WMT XLE ZM ZOM
SEMI-Condctors in SOXL:
NVDA. AVGO, AMD. INTC LRCX TXN MCHP NXPI AMAT ON AAOI TSM
HOMEBUILDERS: BLDP NAIL
BZH HOV LEN MHO MTH PHM -
REGIONAL BANKS:
EGBN
FFIC GBCI HMST
Carl Icahn and associates: IEP
MS
JEF
Leveraged Short ETFs:
FAZ - financials, TZA and SRTY- small caps, MZZ - mid caps, TECS -Techs,
SOXS -
semi-conductors LABD
- Biotechs
Bullish MAXCPs
http://tigersoftware.com/upping/9-11-2023/Bullish.htm
Bearish MINCPs www.tigersoftware.com/downing/9-11-2023/Bearish.htm |
|
 |
 |
 |
 |
 |
 |
 |
 |
 |
 |
| |
| |
| |
| |
| |
| |
| |
Table 1 - Daily Breadth and Volume Statistics
| NYSE |
Latest
Close |
Previous
Close |
Week
Ago |
| Issues
traded |
3,018 |
3,015 |
3,005 |
| Advances |
1,578 |
1,526 |
1,864 |
| Declines |
1,305 |
1,380 |
1,021 |
| Unchanged |
135 |
109 |
120 |
| New
highs |
65 |
48 |
116 |
| New
lows |
75 |
96 |
29 |
| Adv.
volume* |
463,013,896 |
405,500,966 |
536,725,095 |
| Decl.
volume* |
292,902,279 |
311,364,304 |
211,905,003 |
| Total
volume* |
769,205,705 |
733,743,630 |
773,114,559 |
| Closing
Arms (TRIN)† |
0.76 |
0.86 |
0.71 |
| Block
trades* |
3,994 |
3,834 |
3,950 |
| Adv.
volume |
2,036,199,637 |
1,791,637,856 |
2,282,119,191 |
| Decl.
volume |
1,275,190,407 |
1,391,033,217 |
884,303,562 |
| Total
volume |
3,369,924,175 |
3,259,292,272 |
3,246,260,032 |
| NASDAQ |
Latest
Close |
Previous
Close |
Week
Ago |
| Issues
traded |
4,485 |
4,495 |
4,432 |
| Advances |
2,247 |
1,956 |
2,687 |
| Declines |
2,023 |
2,308 |
1,567 |
| Unchanged |
215 |
231 |
178 |
| New
highs |
58 |
40 |
101 |
| New
lows |
202 |
246 |
95 |
| Closing
Arms (TRIN)† |
0.57 |
0.92 |
1.12 |
| Block
trades |
32,829 |
27,572 |
26,787 |
| Adv.
volume |
2,952,966,376 |
1,976,373,573 |
2,398,116,744 |
| Decl.
volume |
1,517,149,189 |
2,138,339,634 |
1,572,632,864 |
| Total
volume |
4,538,877,923 |
4,160,361,257 |
4,033,962,056 |
|
Table 2 TIGER QUICKSILVER on ETFS - 9/11/2023 ---
     Bullish = 1  DBO
     Bearish = 3  GLD TAN WEAT
     Only the Dollar shows a rising Closing Power
ETF       CLOSE     CHANGE    PIVOT-PT  5-dma AROC   CL-PWR  CANDLE  IP21    ITRS  POWER INDEX
=================================================================================================
DIA       347.37   .86       346.98       -23.2%     Bearish  RED   -.113    --     -------
---------------------------------------------------------------------------------------------
COMPQX    13917.89   156.36  14020.95     -41%       -------  BLUE   0      .006      .006
---------------------------------------------------------------------------------------------
SPY       448.45   2.93      449.24       -30.6%     Bearish  BLUE   .03    .005      .035
---------------------------------------------------------------------------------------------
QQQ       376.97   4.39      378.07       -8.3%      -------  BLUE   .067    .018     .085
---------------------------------------------------------------------------------------------
MDY       471.55   .46       477.08       -176.9%    Bearish  RED   -.138   -.027    -.165
---------------------------------------------------------------------------------------------
IWM       184.36   .44       186.83       -174.1%    Bearish  RED   -.16   -.029     -.189
---------------------------------------------------------------------------------------------
FAS       65.71   .7         65.38        -122.9%    Bearish  RED   -.09    .041     -.049
---------------------------------------------------------------------------------------------
RETL      6.22   .01         6.57         -643.8%    Bearish  RED   -.11   -.121     -.231
---------------------------------------------------------------------------------------------
SOXL      21.45  -.05        24.02        -559.4%    Bearish  RED    .068   -.117    -.049
---------------------------------------------------------------------------------------------
TECL      51.57   .74        54.61        -233%      -------  RED    .064   -.019     .045
---------------------------------------------------------------------------------------------
IBB       127.68   .83       128.14       -91.1%     -------  BLUE  -.152   -.004    -.156
---------------------------------------------------------------------------------------------
GLD       178.41   .33       178.64       -47.6%     Bearish  RED   -.271   -.011    -.282
---------------------------------------------------------------------------------------------
DBO       17.31   .04        17.13         110.7%    -------  RED    .05    .216      .266
---------------------------------------------------------------------------------------------
OIH       353.66   .59       352.57        56.5%     -------  RED   -.121    .233     .112
---------------------------------------------------------------------------------------------
CPER     23.43   .56         23.62        -60%       -------  ----   .061    .012     .073
---------------------------------------------------------------------------------------------
TAN     55.73   .16          58.02        -235.6%    Bearish  RED   -.11   -.21      -.32
---------------------------------------------------------------------------------------------
UUP       29.19  -.14        29.22         20.5%     Bullish  ----   .14    .006      .146
---------------------------------------------------------------------------------------------
CORN      22.33   .15        22.37         29.2%     -------  ----  -.14   -.064     -.204
---------------------------------------------------------------------------------------------
WEAT      5.83  -.1          5.94         -75.5%     Bearish  RED   -.177   -.134    -.311
---------------------------------------------------------------------------------------------
YINN      31.89   1.22       33.51        -467.5%    Bearish  RED    .02   -.062     -.042
|
 Table 3      RANKING OF KEY DIRECTORIES BASED PCT.OF STOCKS ABOVE 65-DMA
              9/11/23
 Bullish = 9
 Bearish = 41
---------------------------------------------------------------------------------------
Directory     Current       day-1         day-2         day-3         day-4         day-5
----------------------------------------------------------------------------------------
COAL           1             1             1             1             1             1
MARIJUAN       .8            .8            .5            .6            .6            .6
OILGAS         .721          .731          .721          .731          .752          .731
INSURANC       .72           .68           .72           .64           .64           .84
EDU            .666          .833          .833          .833          .833          .833
HACKERS        .562          .5            .5            .5            .5            .562
NASD-100       .534          .504          .504          .534          .603          .603
HIGHPRIC       .519          .458          .467          .51           .558          .692
SOFTWARE       .517          .482          .446          .464          .5            .553
-----------------------------------------------------------------------------------------------------
NIFTY          .477          .454          .409          .5            .59           .545
COMODITY       .473          .447          .447          .473          .552          .763
FIDSTKS        .455          .431          .414          .455          .514          .52
DOWJONES       .433          .466          .433          .433          .533          .566
               -----
REIT           .426          .401          .393          .377          .36           .475
INDEXES        .416          .356          .372          .41           .464          .627
FOOD           .408          .428          .428          .448          .51           .673
RUS-1000       .4            .386          .389          .406          .438          .537
SP-100         .4            .4            .388          .411          .466          .5
HOMEBLDG       .392          .392          .428          .428          .392          .75
               ----
SP500          .386          .368          .376          .393          .421          .503
DJI-13         .384          .384          .384          .384          .538          .538
RETAIL         .369          .391          .391          .391          .478          .565
COMPUTER       .35           .35           .35           .35           .4            .4
CHEM           .348          .372          .418          .395          .441          .558
GREEN          .333          .388          .388          .333          .333          .444
INDMATER       .333          .375          .402          .416          .472          .527
FINANCE        .325          .3            .237          .25           .387          .475
INFRA          .29           .29           .354          .451          .58           .677
LOWPRICE       .287          .296          .296          .316          .325          .34
BEVERAGE       .285          .214          .214          .214          .285          .428
COPPER         .285          .142          .142          .285          .571          .571
GUNS           .285          .285          .428          .5            .428          .571
BIOTECH        .284          .266          .258          .291          .296          .362
TRANSP         .263          .21           .263          .263          .263          .368
SEMI           .25           .25           .282          .369          .413          .445
               -----
AUTO           .24           .24           .222          .296          .351          .444
ELECTRON       .233          .248          .27           .33           .383          .473
CHINA          .195          .17           .146          .219          .243          .341
EAT            .195          .219          .219          .195          .243          .268
MILITARY       .192          .153          .153          .23           .269          .346
ETFS           .163          .145          .163          .218          .218          .381
GAMING         .157          .105          .157          .157          .21           .21
REGBANKS       .157          .131          .078          .184          .421          .5
GOLD           .155          .111          .088          .133          .111          .311
JETS           .153          .076          .076          .076          .153          .153
BIGBANKS       .142          .142          .142          .142          .142          .142
UTILITY        .128          .076          .051          .051          .076          .128
BONDFUND       .091          .068          .091          .091          .091          .091
HOSPITAL       .076          .153          .153          .23           .23           .384
SOLAR          0             0             0             0             0             0
|
============================================================================
Monday 9/11/2023 6:18 AM Data used
here is from 9/8/2023
DJI Futures +45 See https://dowfutures.org/
|
9/8/2023
|
|
|
Market Comments
When we judge the general market by comparing the number
of bearish MINCP with bullish MAXCP or the data in
our Tables 2 and 3 below, we have to be hedged with
short sales in the weakest stocks and industry-groups.
But we also trade QQQ, the NASDAQ and the leading
stocks long. Here there is still life! And
growth!
The DJI, SPY, QQQ and NASDAQ are doing their best to
ignore the bears' warnings about an extended period of high
interest rates and what this will do over-extended debtors,
including the Federal Government. They are also ignoring
my warnings about September and how bearish it would be
if he DJI were to break below its lengthy uptrendline. Instead
of dropping further below its 65-dma, the DJI has climbed
back to within 60 points of it. And if you look at the SPY,
QQQ and NASDAQ charts below, you can see that these
indexes have moved up to points slightly above their still
rising 65-dma. A rally from here would require some new
buying from Professionals in SPY and QQQ. This would
cause our Closing Powers for them to bullishly break their
downtrend lines. Exactly that may be what we shall see.
Traders are quick to sense when the market as measured
by these four indexes (or their ETFs) refuse to retreat, as
now, in the face of another threat of a Federal Government
shut-down and a failure to pay its debts. Technically, the pros
also have spotted the uptrend channel in the DJI that is emerging
from the current chart. And they love it when there appears
to be more upside potential than downside risk, provided
they can quickly sell when the DJI's uptrend-line and 200-day
ma are violated. Their best friend on the FOMC, the New
York Fed Governor, has now stated what many on Wall Street
hope, namely the FED should pause where it is in rates for
while. With a friend like this in high places, the Professionals
are apt to keep prices slowly moving up away from the
danger-zone and the point where the 65-dma finally turns down
with the 21-dma also falling, when our IP21 is negative and the Closing
Power acts more bearishly than the Opening Power.
|
|
|
9/8/2026
2022 PEERLESS DJI, Signals, Indicators Daily DJI Volume
10-DayUp/Down Vol Stoch-20 CCI RSI Pct of All Stocks above 65-dma
Inverted Traders Index
DJI-IPA DJI-OBV
NASDAQ S&P OEX NYSE DJ-15 DJ-20 DJI-30
Old Peerless- 2006
version
Tiger Index of Big
Banks Bond Funds Gold Stocks Housing Stocks
Insurance-Stocks
Regional
Banks Russell-1000
Semi Conductors
ETFs: DIA QQQ SPY IWM MDY
TNA Short-Term Rates Ten Year Rates PST (Short Treasuries)
DOLLAR-UUP
ALLSTOCKs
COIN (Bit
Coin ETF)
USO-CrudeOil DBO BLDP FAS GLD HD IBB JETS JNUG KOL NAIL
NUGT NRGU OIH PALL RSX RETL SDS AGQ SLV SOXL TAN |
TECL TLT TMF TNA UGA USO
China: YINN
CHAU BABA BIDU
Commodities: CANE COCO CORN DBC CORN, CUT (paper)
MOO, NRGU
SOYB WEAT UUP (Dollar) LIT
(Lithium) PALL
(Palladium)
Stocks: AA AAPL ADBE AMAT AMGN AMD AMZN ANET AXP BA BAC
BSX CAT CDNS CHKP CNX CPB CRM CVX CMG DE DIS ENPH FB
FSLR FTNT GILD GME GOOG GS HD IBM INTU JPM KO KR LRCX
MRK MRNA MOS MSFT NEM NFLX NKE NOC NUE NVDA PANW PG
PYPL QCOM QDEL REGN REV RE SCHW SNOW SO SQUARE TSLA
TXN XOM V VRTX WFC WMT XLE ZM ZOM
SEMI-Condctors in SOXL:
NVDA. AVGO, AMD. INTC LRCX TXN MCHP NXPI AMAT ON AAOI TSM
HOMEBUILDERS: BLDP NAIL
BZH HOV LEN MHO MTH PHM -
REGIONAL BANKS:
EGBN
FFIC GBCI HMST
Carl Icahn and associates: IEP
MS
JEF
Leveraged Short ETFs:
FAZ - financials, TZA and SRTY- small caps, MZZ - mid caps, TECS -Techs,
SOXS -
semi-conductors LABD
- Biotechs
Bullish MAXCPs http://tigersoftware.com/upping/9-08-2023/Bullish.htm
Bearish MINCPs www.tigersoftware.com/downing/9-08-2023/Bearish.htm |
|
 |
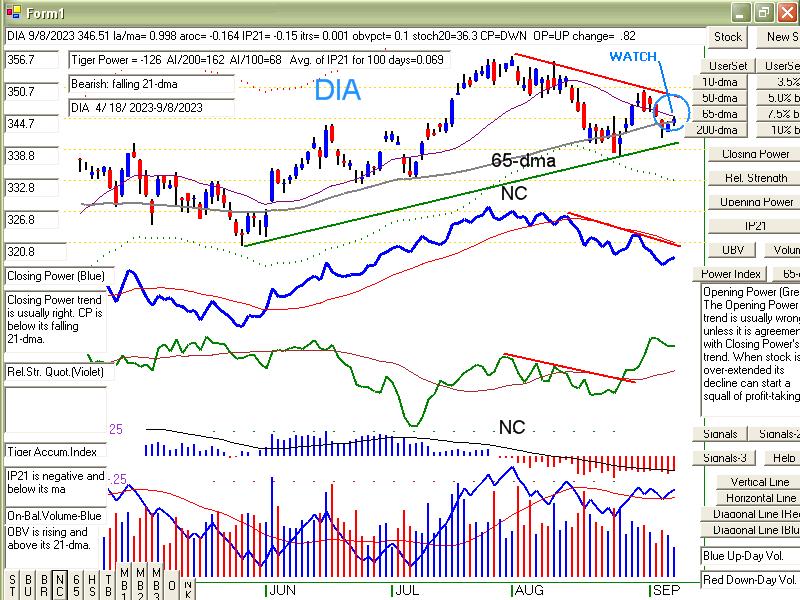 |
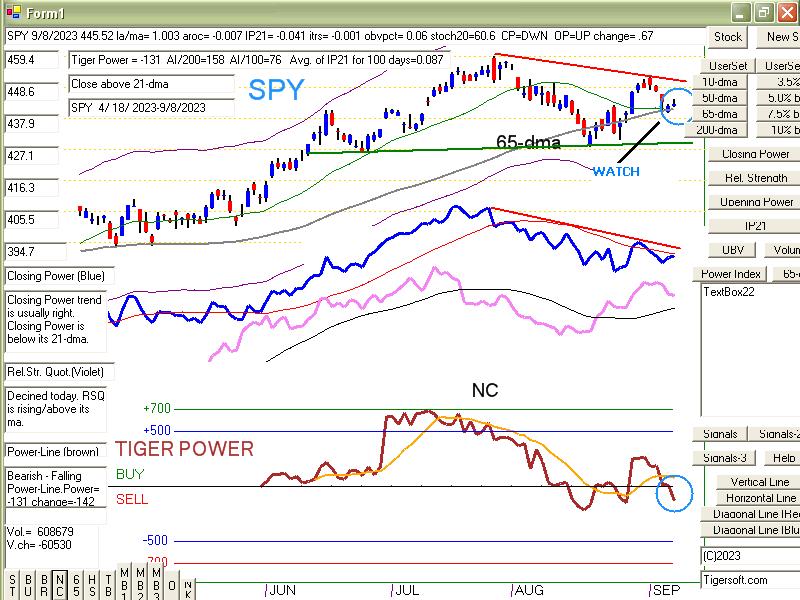 |
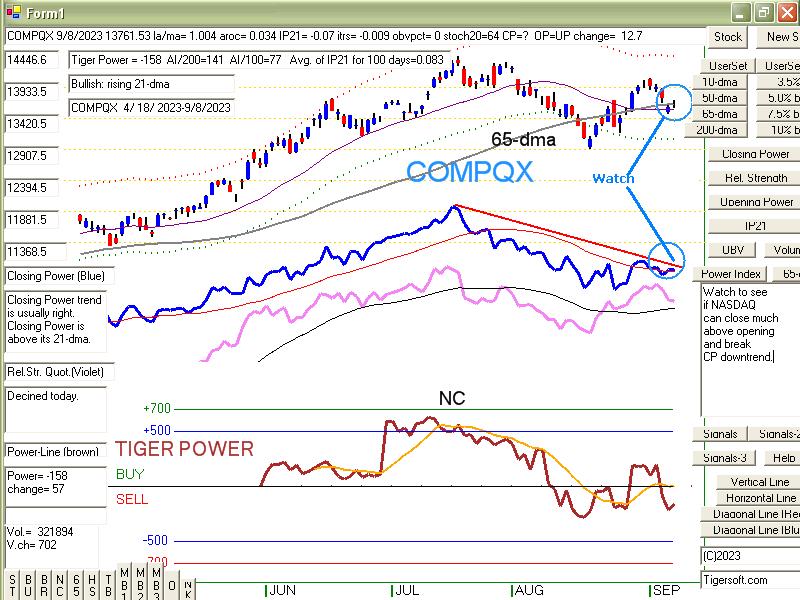 |
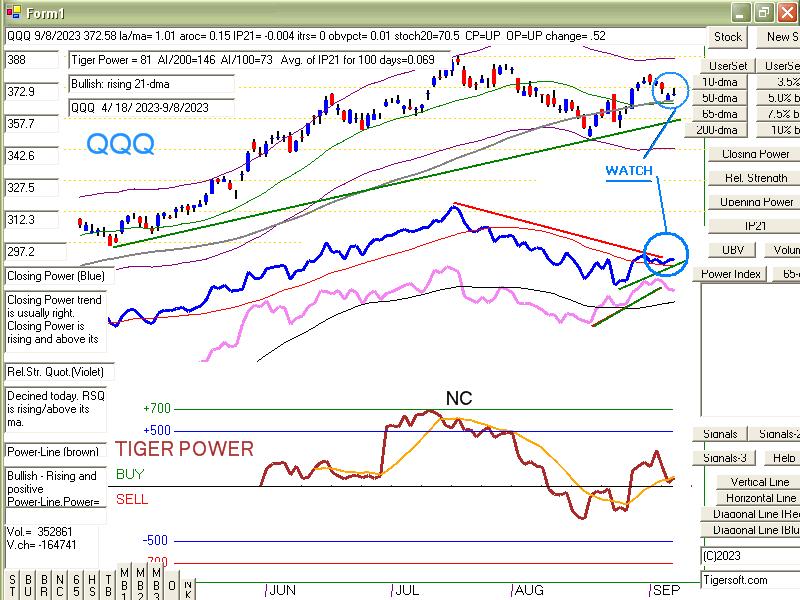 |
Table 1 - Daily Breadth and Volume
| NYSE |
Latest
Close |
Previous
Close |
Week
Ago |
| Issues
traded |
3,015 |
3,010 |
3,005 |
| Advances |
1,526 |
1,041 |
1,864 |
| Declines |
1,380 |
1,862 |
1,021 |
| Unchanged |
109 |
107 |
120 |
| New
highs |
48 |
40 |
116 |
| New
lows |
96 |
116 |
29 |
| Adv.
volume* |
405,500,966 |
279,240,788 |
536,725,095 |
| Decl.
volume* |
311,364,304 |
621,527,299 |
211,905,003 |
| Total
volume* |
733,743,630 |
912,068,467 |
773,114,559 |
| Closing
Arms (TRIN)† |
0.86 |
1.38 |
0.71 |
| Block
trades* |
3,834 |
4,068 |
3,950 |
| Adv.
volume |
1,791,637,856 |
1,073,111,229 |
2,282,119,191 |
| Decl.
volume |
1,391,033,217 |
2,639,352,244 |
884,303,562 |
| Total
volume |
3,259,292,272 |
3,763,765,222 |
3,246,260,032 |
| NASDAQ |
Latest
Close |
Previous
Close |
Week
Ago |
| Issues
traded |
4,495 |
4,437 |
4,432 |
| Advances |
1,956 |
1,407 |
2,687 |
| Declines |
2,308 |
2,865 |
1,567 |
| Unchanged |
231 |
165 |
178 |
| New
highs |
40 |
39 |
101 |
| New
lows |
246 |
274 |
95 |
| Closing
Arms (TRIN)† |
0.92 |
0.89 |
1.12 |
| Block
trades |
27,572 |
26,085 |
26,787 |
| Adv.
volume |
1,976,373,573 |
1,529,859,850 |
2,398,116,744 |
| Decl.
volume |
2,138,339,634 |
2,757,897,852 |
1,572,632,864 |
| Total
volume |
4,160,361,257 |
4,320,836,734 |
4,033,962,056 |
|
Table 2 TIGER QUICKSILVER on ETFS - 9/8/2023 ---
Bullish = 1 DBO
Bearish = 4 GLD TAN CORN WEAT
ETF       CLOSE     CHANGE    PIVOT-PT  5-dma AROC   CL-PWR  CANDLE  IP21    ITRS  POWER INDEX
=================================================================================================
DIA       346.51   .82       348.98       -18.7%     Bearish  BLUE  -.15      0      =====
---------------------------------------------------------------------------------------------
COMPQX    13761.53   12.7    14031.82     -98.1%     Bearish  BLUE  -.069   -.011    -.08
---------------------------------------------------------------------------------------------
SPY       445.52   .67       451.19       -53.9%     Bearish  BLUE  -.04    -.002    -.042
---------------------------------------------------------------------------------------------
QQQ       372.58   .52       377.59       -71.9%     -------  BLUE  -.003   -.001    -.004
---------------------------------------------------------------------------------------------
MDY       471.09  -.39       488.42       -130.2%    Bearish  RED   -.15    -.021    -.171
---------------------------------------------------------------------------------------------
IWM       183.92  -.41       190.85       -125.2%    Bearish  RED   -.164   -.025    -.189
---------------------------------------------------------------------------------------------
FAS       65.01   .28        67.32        -61.7%     Bearish  BLUE  -.133    .077    -.056
---------------------------------------------------------------------------------------------
RETL      6.21  -.12         7.06         -561.9%    Bearish  RED   -.118   -.114    -.232
---------------------------------------------------------------------------------------------
SOXL      21.5  -.37         24.02        -503.4%    Bearish  RED    .04   -.117     -.077
---------------------------------------------------------------------------------------------
TECL      50.83   .32        54.02        -257%      -------  BLUE   .011   -.033    -.022
---------------------------------------------------------------------------------------------
IBB       126.85  -.03       130.01       -72.5%     -------  ----  -.211   -.019    -.23
---------------------------------------------------------------------------------------------
GLD       178.08   .06       180.11       -54.2%     Bearish  RED   -.29   -.019     -.309
---------------------------------------------------------------------------------------------
DBO       17.27   .09        16.93         211.5%    -------  ----   .038    .216     .254
---------------------------------------------------------------------------------------------
OIH       353.07   1.06      349.68        176.4%    -------  RED   -.121    .25      .129
---------------------------------------------------------------------------------------------
CPER     22.87  -.34         23.71        -142.7%    Bullish  ----   .043   -.026     .017
---------------------------------------------------------------------------------------------
TAN     55.57   .01          58.41        -231.7%    Bearish  RED   -.127   -.225    -.352
---------------------------------------------------------------------------------------------
UUP       29.33   .03        29.07         75.5%     Bullish  ----   .175    .01      .185
---------------------------------------------------------------------------------------------
CORN      22.18  -.13        22.2          24.7%     -------  RED   -.163   -.089    -.252
---------------------------------------------------------------------------------------------
WEAT      5.93  -.04         5.92         -50.2%     Bearish  RED   -.174   -.125    -.299
---------------------------------------------------------------------------------------------
YINN      30.67  -.19        34.95        -316.8%    Bearish  ----   0      -.147    -.147
 Table 3      RANKING OF KEY DIRECTORIES BASED PCT.OF STOCKS ABOVE 65-DMA
              9/8/23
 Bullish = 6
 Bearish = 42
---------------------------------------------------------------------------------------
Directory     Current       day-1         day-2         day-3         day-4         day-5
----------------------------------------------------------------------------------------
COAL           1             1             1             1             1             1
EDU            .833          .833          .833          .833          .833          .833
MARIJUAN       .8            .5            .6            .6            .6            .6
OILGAS         .731          .721          .731          .752          .731          .701
INSURANC       .68           .72           .64           .64           .84           .68
NASD-100       .504          .504          .534          .603          .613          .594
==============================================================================================
HACKERS        .5            .5            .5            .5            .562          .562
SOFTWARE       .5            .464          .464          .5            .535          .517
==============================================================================================
DOWJONES       .466          .433          .433          .533          .566          .533
HIGHPRIC       .458          .467          .51           .558          .692          .67
NIFTY          .454          .409          .5            .59           .545          .568
COMODITY       .447          .473          .447          .552          .763          .789
FIDSTKS        .431          .414          .455          .514          .526          .514
FOOD           .428          .448          .428          .51           .714          .734
REIT           .401          .377          .385          .368          .491          .467
SP-100         .4            .388          .411          .466          .5            .455
HOMEBLDG       .392          .428          .428          .392          .75           .642
RETAIL         .391          .391          .391          .478          .565          .521
GREEN          .388          .388          .333          .333          .444          .444
RUS-1000       .387          .389          .405          .438          .544          .502
DJI-13         .384          .384          .384          .538          .538          .538
INDMATER       .375          .402          .416          .472          .541          .486
CHEM           .372          .418          .395          .441          .558          .534
SP500          .368          .376          .393          .419          .505          .472
INDEXES        .356          .372          .41           .464          .621          .6
COMPUTER       .35           .35           .35           .4            .4            .4
FINANCE        .3            .237          .25           .375          .475          .387
LOWPRICE       .296          .299          .319          .325          .337          .319
INFRA          .29           .354          .451          .58           .677          .612
GUNS           .285          .428          .5            .428          .571          .571
BIOTECH        .263          .256          .294          .296          .36           .34
SEMI           .25           .282          .369          .413          .445          .423
ELECTRON       .248          .27           .33           .383          .466          .436
AUTO           .24           .24           .296          .351          .444          .333
EAT            .219          .219          .195          .243          .268          .292
BEVERAGE       .214          .214          .214          .285          .428          .571
TRANSP         .21           .263          .263          .263          .368          .315
CHINA          .17           .146          .219          .243          .341          .268
HOSPITAL       .153          .153          .23           .23           .384          .461
MILITARY       .153          .153          .23           .269          .346          .423
ETFS           .145          .163          .218          .218          .4            .327
BIGBANKS       .142          .142          .142          .142          .142          .142
COPPER         .142          .142          .285          .571          .571          .285
REGBANKS       .131          .078          .184          .421          .5            .368
GOLD           .111          .088          .133          .111          .311          .377
GAMING         .105          .157          .105          .263          .21           .21
JETS           .076          .076          .076          .153          .153          .153
UTILITY        .076          .051          .051          .076          .128          .128
BONDFUND       .068          .08           .091          .103          .103          .103
SOLAR          0             0             0             0             0             0
|
|
============================================================================
-------------------------------------------------------------------------------------------------------------------
Friday 9/8/2023 6:05 AM Data used
here is from 9/7/2023
DJI Futures -25 See https://dowfutures.org/
| |
9/7/2023
|
|
| |
Market Comments
The DJI found temporary support at its rising trendline that
marks the bottom of its bearish rising wedge pattern. But it
is now 140 points below the broken support of its 65-dma.
It is in the same "S4 Danger Zone" that the DIA, NASDAQ,
SPY and QQQ are in. When the 65-dma is rising at less
than +18% annualized and shows a negative IP21, negative
AROC (annualized 21-dma) and a Closing Power that is
much weaker than its Opening Power, the danger is high that
the 65-dma will turn down and this will trigger a wave of
new selling.
The Governor of the FED's New York branch says that
the FED's rates now are in a "very good place". Good for
what? "Fighting inflation and not bringing on a recession?"
Let's hope. But he could be very wrong. Look at all the
many bearish MINCPs tonight. Labor troubles are on the
horizon. (Read about the awful decline in 1937 and the
role a wave of strikes played then, just as the FED
tighened credit and the Federal Government cut back on
its depression-era spending and invoked social security
taxes.)
It won't take much more of a decline for the stock of the
biggest of the big banks, JPM (shown below) and Goldman
Sachs (heavily weighted DJI-30 component to break their
uptrend-line support and for their 65-dma to turn down.
They, too, are in the "S4 danger zone".
I will try this weekend to put this special S4 in the XP
programs.
Watch the 10-year bond's rates. It retreated a little
Thursday, but Bonds fell lower. If these 10-year rates
should go above 4.5%, it will be cause many traders
to expect 5%. This will pinch the appeal of tech stocks.
Perhaps, this was partly why AAPL's big drop today resonated
among many techs though the Justice Department's plans to
attack GOOG for anti-trust policies is also now a factor.
We want to see a decline in here also as an opportunity.
When the tide goes out, we see the rocks. When the
market goes down, we want to watch for stocks showing
big surges of accumulation from our IP21 indicator. There
are a few such stocks showing very high accumulation now.
Somebody with a lot of money has inside information and
is very busy employing it. Watch the MAXCPs for more
stocks showing an IP21 above .40. This is a very bullish sign.
|
|
| |
9/7/2026
2022 PEERLESS DJI, Signals, Indicators Daily DJI Volume
10-DayUp/Down Vol Stoch-20 CCI RSI Pct of All Stocks above 65-dma
Inverted Traders Index
DJI-IPA DJI-OBV
NASDAQ S&P OEX NYSE DJ-15 DJ-20 DJI-30
Old Peerless- 2006
version
Tiger Index of Big
Banks Bond Funds Gold Stocks Housing Stocks
Insurance-Stocks
Regional
Banks Russell-1000
Semi Conductors
ETFs: DIA QQQ SPY IWM MDY
TNA Short-Term Rates Ten Year Rates PST (Short Treasuries)
DOLLAR-UUP
ALLSTOCKs
COIN (Bit
Coin ETF)
USO-CrudeOil DBO BLDP FAS GLD HD IBB JETS JNUG KOL NAIL
NUGT NRGU OIH PALL RSX RETL SDS AGQ SLV SOXL TAN |
TECL TLT TMF TNA UGA USO
China: YINN
CHAU BABA BIDU
Commodities: CANE COCO CORN DBC CORN, CUT (paper)
MOO, NRGU
SOYB WEAT UUP (Dollar) LIT
(Lithium) PALL
(Palladium)
Stocks: AA AAPL ADBE AMAT AMGN AMD AMZN ANET AXP BA BAC
BSX CAT CDNS CHKP CNX CPB CRM CVX CMG DE DIS ENPH FB
FSLR FTNT GILD GME GOOG GS HD IBM INTU JPM KO KR LRCX
MRK MRNA MOS MSFT NEM NFLX NKE NOC NUE NVDA PANW PG
PYPL QCOM QDEL REGN REV RE SCHW SNOW SO SQUARE TSLA
TXN XOM V VRTX WFC WMT XLE ZM ZOM
SEMI-Condctors in SOXL:
NVDA. AVGO, AMD. INTC LRCX TXN MCHP NXPI AMAT ON AAOI TSM
HOMEBUILDERS: BLDP NAIL
BZH HOV LEN MHO MTH PHM -
REGIONAL BANKS:
EGBN
FFIC GBCI HMST
Carl Icahn and associates: IEP
MS
JEF
Leveraged Short ETFs:
FAZ - financials, TZA and SRTY- small caps, MZZ - mid caps, TECS -Techs,
SOXS -
semi-conductors LABD
- Biotechs
Bullish MAXCPs http://tigersoftware.com/upping/9-07-2023/Bullish.htm
Bearish MINCPs www.tigersoftware.com/downing/9-07-2023/Bearish.htm
|
|
 |
 |
 |
 |
 |
 |
 |
 |
Table 1 - Daily Breadth and Volume
| NYSE |
Latest
Close |
Previous
Close |
Week
Ago |
| Issues
traded |
3,010 |
3,001 |
3,019 |
| Advances |
1,041 |
1,087 |
1,375 |
| Declines |
1,862 |
1,805 |
1,526 |
| Unchanged |
107 |
109 |
118 |
| New
highs |
40 |
38 |
78 |
| New
lows |
116 |
88 |
20 |
| Adv.
volume* |
279,240,788 |
269,050,608 |
506,835,714 |
| Decl.
volume* |
621,527,299 |
502,322,507 |
684,285,303 |
| Total
volume* |
912,068,467 |
781,458,477 |
1,204,376,898 |
| Closing
Arms (TRIN)† |
1.38 |
1.19 |
1.32 |
| Block
trades* |
4,068 |
3,829 |
4,224 |
| Adv.
volume |
1,073,111,229 |
1,131,091,705 |
1,584,359,811 |
| Decl.
volume |
2,639,352,244 |
2,241,859,354 |
2,321,563,046 |
| Total
volume |
3,763,765,222 |
3,418,859,424 |
3,946,363,851 |
| NASDAQ |
Latest
Close |
Previous
Close |
Week
Ago |
| Issues
traded |
4,437 |
4,425 |
4,547 |
| Advances |
1,407 |
1,425 |
1,923 |
| Declines |
2,865 |
2,809 |
2,420 |
| Unchanged |
165 |
191 |
204 |
| New
highs |
39 |
48 |
90 |
| New
lows |
274 |
181 |
104 |
| Closing
Arms (TRIN)† |
0.89 |
0.80 |
0.77 |
| Block
trades |
26,085 |
25,039 |
30,850 |
| Adv.
volume |
1,529,859,850 |
1,615,352,483 |
2,299,590,567 |
| Decl.
volume |
2,757,897,852 |
2,556,911,966 |
2,233,523,182 |
| Total
volume |
4,320,836,734 |
4,215,329,809 |
4,568,619,191 |
|
Table 2 TIGER QUICKSILVER on ETFS - 9/7/2023 ---
Bullish = 1 DBO
Bearish = 4 GLD TAN CORN WEAT
ETF       CLOSE     CHANGE    PIVOT-PT  5-dma AROC   CL-PWR  CANDLE  IP21    ITRS  POWER INDEX
=================================================================================================
DIA       345.69   .69       347.81       -53.4%     Bearish  BLUE  -.179    ----    ------
---------------------------------------------------------------------------------------------
COMPQX    13748.83  -123.64  14034.97     -96.6%     Bearish  BLUE  -.091   -.005    -.096
---------------------------------------------------------------------------------------------
SPY       444.85  -1.37      450.35       -68.5%     Bearish  BLUE  -.062    .001    -.061
---------------------------------------------------------------------------------------------
QQQ       372.06  -2.68      377.99       -63.7%     Bearish  BLUE  -.024    .004    -.02
---------------------------------------------------------------------------------------------
MDY       471.48  -4.08      483.57       -122%      Bearish  RED   -.155   -.016    -.171
---------------------------------------------------------------------------------------------
IWM       184.33  -1.8       188.61       -122.4%    Bearish  RED   -.161   -.014    -.175
---------------------------------------------------------------------------------------------
FAS       64.73  -.35        65.82        -142.3%    -------  BLUE  -.206    .071    -.135
---------------------------------------------------------------------------------------------
RETL      6.33  -.12         6.96         -448.8%    Bearish  RED   -.127   -.088    -.215
---------------------------------------------------------------------------------------------
SOXL      21.87  -1.57       23.86        -322.1%    Bearish  ----   .02    -.122    -.102
---------------------------------------------------------------------------------------------
TECL      50.51  -2.37       53.56        -220.2%    -------  BLUE  -.008   -.034    -.042
---------------------------------------------------------------------------------------------
IBB       126.88  -.43       128.71       -115.3%    -------  BLUE  -.194   -.008    -.202
---------------------------------------------------------------------------------------------
GLD       178.02   .19       180.02       -64.1%     Bearish  RED   -.305   -.017    -.322 bearish
---------------------------------------------------------------------------------------------
DBO       17.18  -.13        16.55         276.2%    -------  ----   .057    .237     .294 bullish
---------------------------------------------------------------------------------------------
OIH       352.01  -1.8       340.73        146.1%    -------  RED   -.122    .251     .129
---------------------------------------------------------------------------------------------
CPER     23.21  -.13         23.54        -93.3%     -------  BLUE  -.016   -.026    -.042
---------------------------------------------------------------------------------------------
TAN     55.56  -1.25         58.23        -234.7%    -------  ----  -.122   -.216    -.338  bearish
---------------------------------------------------------------------------------------------
UUP       29.3   .07         28.89         94.7%     Bullish  ----   .171    .018     .189
---------------------------------------------------------------------------------------------
CORN      22.31   .01        22.07         33.8%     -------  ----  -.166   -.11     -.276  bearish
---------------------------------------------------------------------------------------------
WEAT      5.97  -.08         5.99         -41.8%     Bearish  RED   -.194   -.149    -.343   bearish
---------------------------------------------------------------------------------------------
YINN      30.86  -2.78       32.77        -483.7%    -------  RED   -.006   -.158    -.164
|
 Table 3      RANKING OF KEY DIRECTORIES BASED PCT.OF STOCKS ABOVE 65-DMA
              9/7/23
Bullish = 5
Bearish = 43
---------------------------------------------------------------------------------------
Directory     Current       day-1         day-2         day-3         day-4         day-5
----------------------------------------------------------------------------------------
COAL           1             1             1             1             1             1
EDU            .833          .833          .833          .833          .833          .833
OILGAS         .721          .731          .752          .731          .701          .711
INSURANC       .72           .64           .64           .84           .68           .76
NASD-100       .504          .534          .603          .613          .594          .603
-------------------------------------------------------------------------------------------
HACKERS        .5            .5            .5            .562          .562          .562
MARIJUAN       .5            .6            .6            .6            .6            .5
-------------------------------------------------------------------------------------------
SOFTWARE       .482          .482          .5            .535          .5            .535
COMODITY       .473          .473          .526          .763          .789          .763
HIGHPRIC       .467          .51           .558          .692          .67           .662
FOOD           .448          .448          .489          .714          .734          .714
DOWJONES       .433          .433          .533          .566          .533          .6
GUNS           .428          .5            .428          .571          .571          .642
HOMEBLDG       .428          .428          .392          .75           .642          .678
CHEM           .418          .395          .441          .558          .534          .581
FIDSTKS        .414          .455          .514          .526          .514          .55
NIFTY          .409          .5            .59           .545          .568          .545
INDMATER       .402          .416          .472          .541          .5            .527
RETAIL         .391          .391          .478          .565          .521          .565
RUS-1000       .39           .405          .437          .544          .506          .536
GREEN          .388          .333          .333          .444          .444          .444
SP-100         .388          .411          .466          .5            .466          .544
DJI-13         .384          .384          .538          .538          .538          .615
REIT           .377          .368          .377          .5            .475          .5
SP500          .376          .393          .419          .503          .48           .517
INDEXES        .372          .41           .464          .621          .605          .6
INFRA          .354          .451          .58           .677          .612          .612
COMPUTER       .35           .35           .4            .4            .4            .4
LOWPRICE       .299          .322          .328          .337          .313          .302
SEMI           .282          .369          .413          .445          .423          .38
ELECTRON       .27           .33           .383          .466          .428          .413
TRANSP         .263          .263          .263          .368          .315          .368
BIOTECH        .253          .291          .299          .36           .337          .368
AUTO           .24           .314          .351          .444          .351          .407
FINANCE        .237          .25           .375          .462          .387          .4
EAT            .219          .195          .243          .268          .292          .317
BEVERAGE       .214          .214          .285          .428          .571          .642
ETFS           .163          .218          .218          .4            .345          .454
GAMING         .157          .105          .21           .263          .21           .21
HOSPITAL       .153          .23           .23           .384          .461          .461
MILITARY       .153          .23           .269          .346          .423          .384
CHINA          .146          .219          .243          .341          .268          .268
BIGBANKS       .142          .142          .142          .142          .142          .285
COPPER         .142          .285          .571          .571          .285          .428
GOLD           .088          .133          .111          .311          .377          .355
BONDFUND       .08           .08           .103          .114          .114          .091
REGBANKS       .078          .184          .421          .5            .421          .421
JETS           .076          .076          .153          .153          .153          .153
UTILITY        .051          .051          .076          .128          .128          .153
SOLAR          0             0             0             0             0             0
|
===================================================================================
Thursday 9/7/2023 5:57 AM Data used
here is from 9/6/2023
DJI Futures -98 NASDAQ
Futures -50
| |
9/6/2023
|
|
| |
Market Comments
The "worst is yet to
come". That will begin when the DJI's 65-dma
turns down. Clearly,
lots of funds use this as a sell signal. Our job
is to anticipate this
happening by using the revised Sell S4 rules
set out here yesterday.
"Consider a breakdown imminent when the 65-dma's
annualized rate of change falls below 20% and you also
see the 21-dma rate of change (AROC) drop below 0
and the IP21 below 0, assuming the Closing Power is
much weaker than Opening Power."
The DJI fell almost 200 on
Wednesday and broke below the support of
its 65-dma. The rising
10-year rates, which are approaching 4.4%
again is the apparent cause
for the decline. But the bearish month of
September - the DJI rises
only 46% of the time over the next month
going back to 1965 - is at
work, too. Why? Cynical professionals
are now back from Summer
vacations and need a decline to buy into
so that they can feed out
shares when the market rallies, typically
in November and December.
Obliging them will be those who must
sell stocks and mutual funds
to pay the huge tuitions all colleges now
demand. This year the
auto workers may go on strike. And oil prices
are rallying, also putting
more pressure on the Fed to curb inflation.
So, watch the chart of the
leveraged inverted 10-year rates ETF, PST.
A breakout to new highs would
have a widely negative effect on the market.
Technically, we can't trust
that the DJI will hold above its rising wedge
trend-line. Such patterns
mostly produce breakdown. The Peerless S9-V
is now in effect. The
breakout above 35,000 on the DJI failed and
that level now acts as
resistance. In additon, the DIA ETF for the DJI
shows a falling Closing
Power. Don't trust an early DJI rally.
Professionals are clearly
bearish and big money is bearish, too. This
will trend to blunt and
reverse any early rally.
Revised Tiger Sell S4
In addition, watch the four
key internal strength indicators
that best predict prices when
a stock or ETF is at or just below
its 65-dma. These are
the 21-dma AROC (daily rate of change),
IP21-Accum.Index, MOM (the rate of daily change of the 65-dma)
and the CP%-Pr% (a measure of
the Closing Power's 65-day
strength compared to
prices.). All negative mumbers are
especially bearish after
prices crack below their 65-dma. As
explained last night, we can
use these indicators to predict
the breaking of the 65-dma. But it is when MOM turns negative
that the big decline is most
likely to start.
ETF
AROC IP21 MOM
CP%-Pr%
---------------------------------------------------------------
DIA
-.037 -.071 +.077
-.10
NASDAQ -.114
-.075 +.176
-.44
SPY
-.195 -.071 +.15
-.27
QQQ
+.303
-.024 +.209
- .44
Our bearish hedges
among the MINCPs remain expecially
vulnerable. Short more. |
|
| |
9/6/2026
2022 PEERLESS DJI, Signals, Indicators Daily DJI Volume
10-DayUp/Down Vol Stoch-20 CCI RSI Pct of All Stocks above 65-dma
Inverted Traders Index
DJI-IPA DJI-OBV
NASDAQ S&P OEX NYSE DJ-15 DJ-20 DJI-30
Old Peerless- 2006
version
Tiger Index of Big
Banks Bond Funds Gold Stocks Housing Stocks
Insurance-Stocks
Regional
Banks Russell-1000
Semi Conductors
ETFs: DIA QQQ SPY IWM MDY
TNA Short-Term Rates Ten Year Rates PST (Short Treasuries)
DOLLAR-UUP
ALLSTOCKs
COIN (Bit
Coin ETF)
USO-CrudeOil DBO BLDP FAS GLD HD IBB JETS JNUG KOL NAIL
NUGT NRGU OIH PALL RSX RETL SDS AGQ SLV SOXL TAN |
TECL TLT TMF TNA UGA USO
China: YINN
CHAU BABA BIDU
Commodities: CANE COCO CORN DBC CORN, CUT (paper)
MOO, NRGU
SOYB WEAT UUP (Dollar) LIT
(Lithium) PALL
(Palladium)
Stocks: AA AAPL ADBE AMAT AMGN AMD AMZN ANET AXP BA BAC
BSX CAT CDNS CHKP CNX CPB CRM CVX CMG DE DIS ENPH FB
FSLR FTNT GILD GME GOOG GS HD IBM INTU JPM KO KR LRCX
MRK MRNA MOS MSFT NEM NFLX NKE NOC NUE NVDA PANW PG
PYPL QCOM QDEL REGN REV RE SCHW SNOW SO SQUARE TSLA
TXN XOM V VRTX WFC WMT XLE ZM ZOM
SEMI-Condctors in SOXL:
NVDA. AVGO, AMD. INTC LRCX TXN MCHP NXPI AMAT ON AAOI TSM
HOMEBUILDERS: BLDP NAIL
BZH HOV LEN MHO MTH PHM -
REGIONAL BANKS:
EGBN
FFIC GBCI HMST
Carl Icahn and associates: IEP
MS
JEF
Leveraged Short ETFs:
FAZ - financials, TZA and SRTY- small caps, MZZ - mid caps, TECS -Techs,
SOXS -
semi-conductors LABD
- Biotechs
Bullish MAXCPs
http://tigersoftware.com/upping/9-06-2023/Bullish.htm
Bearish MINCPs www.tigersoftware.com/downing/9-06-2023/Bearish.htm
|
|
 |
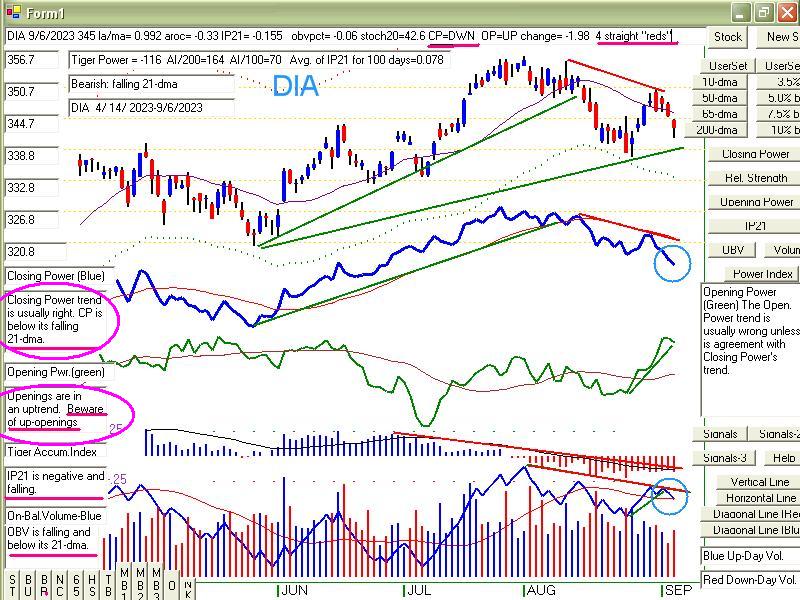
|
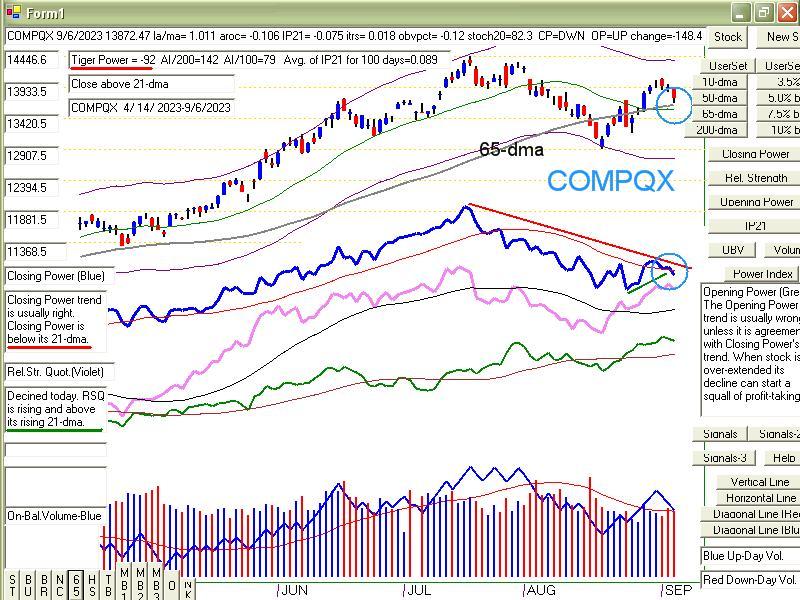 |
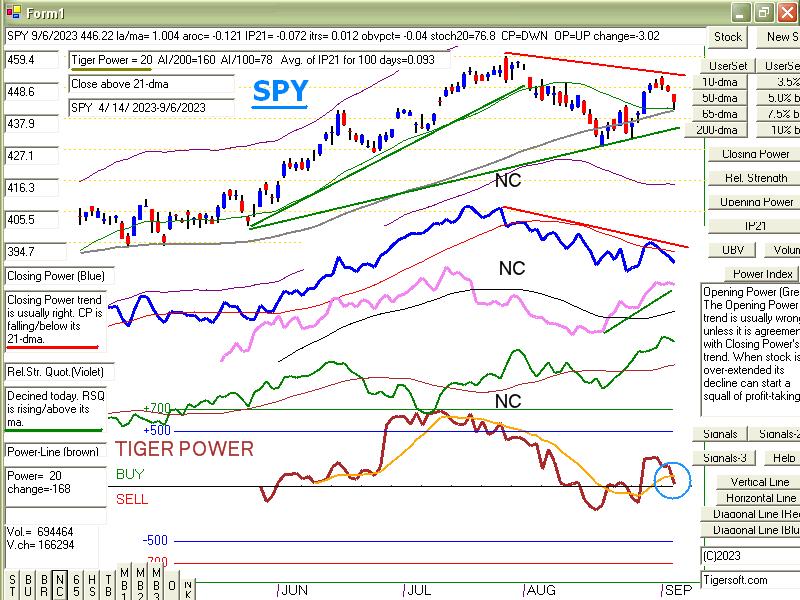 |
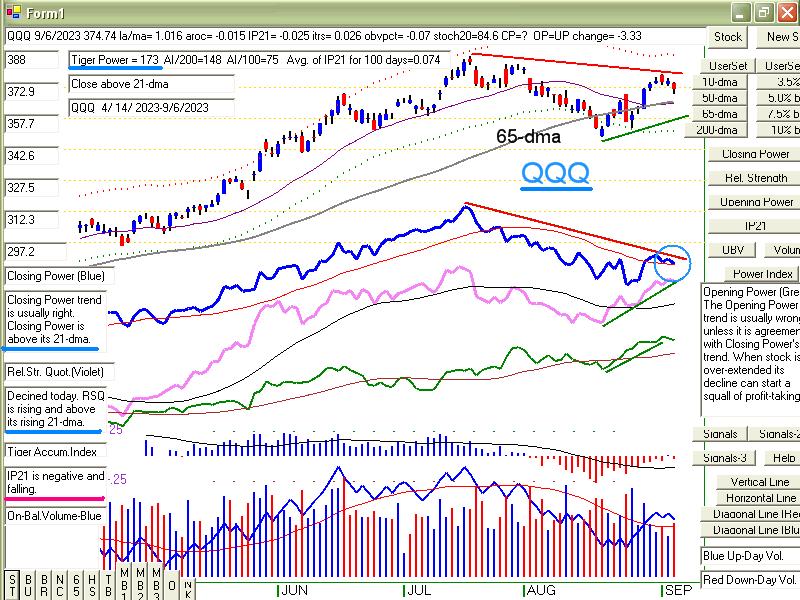 |
 |
MSFT trying to get past is now falling 65-dma.
Its internals are bearish: AROC, IP21, OPct and CP lags price. |
Will rising Opening Power hold up NVDA in this environment?
Big money is still selling heavily, judging from negative IP21.
 |
 |
 |
 |
 |
 |
Table 1 - Daily Breadth and Volume Statistics
| NYSE |
Latest
Close |
Previous
Close |
Week
Ago |
| Issues
traded |
3,001 |
3,017 |
3,001 |
| Advances |
1,087 |
645 |
1,747 |
| Declines |
1,805 |
2,294 |
1,120 |
| Unchanged |
109 |
78 |
134 |
| New
highs |
38 |
64 |
98 |
| New
lows |
88 |
86 |
18 |
| Adv.
volume* |
269,050,608 |
194,466,481 |
380,621,633 |
| Decl.
volume* |
502,322,507 |
627,077,055 |
279,700,871 |
| Total
volume* |
781,458,477 |
826,665,985 |
679,883,715 |
| Closing
Arms (TRIN)† |
1.19 |
0.75 |
1.15 |
| Block
trades* |
3,829 |
4,049 |
3,416 |
| Adv.
volume |
1,131,091,705 |
950,941,028 |
1,703,433,672 |
| Decl.
volume |
2,241,859,354 |
2,539,307,151 |
1,255,089,860 |
| Total
volume |
3,418,859,424 |
3,526,252,329 |
3,064,112,605 |
| NASDAQ |
Latest
Close |
Previous
Close |
Week
Ago |
| Issues
traded |
4,425 |
4,497 |
4,510 |
| Advances |
1,425 |
1,329 |
2,383 |
| Declines |
2,809 |
3,011 |
1,925 |
| Unchanged |
191 |
157 |
202 |
| New
highs |
48 |
77 |
83 |
| New
lows |
181 |
157 |
81 |
| Closing
Arms (TRIN)† |
0.80 |
0.41 |
0.86 |
| Block
trades |
25,039 |
29,243 |
32,224 |
| Adv.
volume |
1,615,352,483 |
2,243,671,597 |
2,551,813,781 |
| Decl.
volume |
2,556,911,966 |
2,060,737,525 |
1,767,632,353 |
| Total
volume |
4,215,329,809 |
4,379,798,387 |
4,364,609,824 |
|
Table 2 TIGER QUICKSILVER on ETFS - 9/5/2023 ---
Bullish = 1 DBO
Bearish = 3 GLD (-.341) TAN CORN WEAT
ETF       CLOSE     CHANGE    PIVOT-PT  5-dma AROC   CL-PWR  CANDLE  IP21    ITRS  POWER INDEX
=================================================================================================
DIA       345  -1.98         349.4        -52%       Bearish  RED   -.154    0       ----
---------------------------------------------------------------------------------------------
COMPQX    13872.47  -148.48  14019.31     -25.4%     Bearish  RED   -.075    .017    -.058
---------------------------------------------------------------------------------------------
SPY       446.22  -3.02      451.01       -32.7%     Bearish  RED   -.071    .011    -.06
---------------------------------------------------------------------------------------------
QQQ       374.74  -3.33      376.86       -.4%       Bearish  RED   -.024    .024     0
---------------------------------------------------------------------------------------------
MDY       475.56  -1.52      483.23       -70.9%     Bearish  RED   -.093    .005    -.088
---------------------------------------------------------------------------------------------
IWM       186.13  -.7        188.94       -55.6%     Bearish  RED   -.11    .006     -.104
---------------------------------------------------------------------------------------------
FAS       65.08  -.3         66.61        -93.5%     -------  BLUE  -.11    .095     -.015
---------------------------------------------------------------------------------------------
RETL      6.45  -.12         6.94         -269.3%    Bearish  RED   -.061   -.026    -.087
---------------------------------------------------------------------------------------------
SOXL      23.44  -.58        23.4          78.1%     Bearish  RED    .024    .038     .062
---------------------------------------------------------------------------------------------
TECL      52.88  -1.73       52.87         112.5%    Bearish  RED    .014    .07      .084
---------------------------------------------------------------------------------------------
IBB       127.31  -.83       129.85       -83.6%     -------  RED   -.148   -.021    -.169
---------------------------------------------------------------------------------------------
GLD       177.83  -.81       180.32       -56.7%     Bearish  RED   -.314   -.027    -.341 bearish
---------------------------------------------------------------------------------------------
DBO       17.31   .18        16.25         343.2%    Bullish  BLUE   .08    .216      .296 bullish
---------------------------------------------------------------------------------------------
OIH       353.81   1.24      341.85        208.3%    Bullish  BLUE  -.053    .271     .218
---------------------------------------------------------------------------------------------
CPER     23.34  -.28         23.65        -65.6%     Bullish  RED   -.09   -.025     -.115
---------------------------------------------------------------------------------------------
TAN     56.81  -1.21         58.28        -163.7%    Bearish  RED   -.119   -.193    -.312 bearish
---------------------------------------------------------------------------------------------
UUP       29.23   .01        28.75         74.3%     Bullish  ----   .162    .009     .171
---------------------------------------------------------------------------------------------
CORN      22.3  -.07         22.16         0%        -------  RED   -.116   -.153    -.269 bearish
---------------------------------------------------------------------------------------------
WEAT      6.05   .11         6.02          58.6%     Bearish  BLUE  -.139   -.184    -.323 bearish
---------------------------------------------------------------------------------------------
YINN      33.64   .13        34.13        -176.3%    -------  ----   .03   -.026      .004
|
Table 3       RANKING OF KEY DIRECTORIES BASED PCT.OF STOCKS ABOVE 65-DMA
              9/6/23
Bullish = 7
Bearish = 39
---------------------------------------------------------------------------------------
Directory     Current       day-1         day-2         day-3         day-4         day-5
----------------------------------------------------------------------------------------
COAL           1             1             1             1             1             1
EDU            .833          .833          .833          .833          .833          .833
OILGAS         .731          .752          .731          .701          .711          .701
INSURANC       .64           .64           .84           .68           .76           .72
MARIJUAN       .6            .6            .6            .6            .5            .3
NASD-100       .534          .603          .613          .594          .613          .574
HIGHPRIC       .51           .558          .692          .67           .675          .636
===============================================================================================
GUNS           .5            .428          .571          .571          .642          .571
HACKERS        .5            .5            .562          .562          .562          .5
NIFTY          .5            .59           .545          .568          .545          .522
SOFTWARE       .5            .517          .535          .5            .517          .482
===============================================================================================
COMODITY       .473          .552          .736          .789          .763          .815
FIDSTKS        .455          .514          .526          .514          .55           .556
INFRA          .451          .58           .677          .612          .612          .58
FOOD           .448          .51           .693          .734          .714          .755
DOWJONES       .433          .533          .566          .533          .6            .566
HOMEBLDG       .428          .392          .75           .642          .714          .535
INDMATER       .416          .472          .541          .5            .541          .513
SP-100         .411          .466          .5            .466          .544          .511
INDEXES        .41           .464          .621          .605          .6            .578
RUS-1000       .406          .437          .543          .506          .541          .518
CHEM           .395          .441          .558          .534          .581          .534
SP500          .393          .419          .503          .478          .523          .513
RETAIL         .391          .478          .565          .521          .565          .565
DJI-13         .384          .538          .538          .538          .615          .538
SEMI           .369          .413          .445          .423          .38           .369
REIT           .368          .36           .508          .483          .508          .508
COMPUTER       .35           .4            .4            .4            .4            .35
GREEN          .333          .333          .444          .444          .444          .444
ELECTRON       .33           .383          .466          .428          .406          .398
LOWPRICE       .322          .331          .34           .313          .302          .299
AUTO           .314          .37           .444          .351          .407          .37
BIOTECH        .289          .296          .362          .337          .368          .342
COPPER         .285          .571          .571          .285          .428          .428
TRANSP         .263          .263          .368          .315          .368          .368
FINANCE        .25           .375          .462          .375          .4            .412
HOSPITAL       .23           .23           .384          .461          .461          .384
MILITARY       .23           .269          .346          .423          .384          .307
CHINA          .219          .243          .341          .268          .268          .317
ETFS           .218          .218          .4            .345          .49           .545
BEVERAGE       .214          .285          .428          .571          .642          .642
EAT            .195          .243          .268          .292          .317          .292
REGBANKS       .184          .421          .5            .421          .421          .447
BIGBANKS       .142          .142          .142          .142          .285          .285
GOLD           .133          .111          .311          .377          .355          .377
GAMING         .105          .21           .21           .263          .21           .263
BONDFUND       .08           .091          .114          .126          .103          .08
JETS           .076          .153          .153          .153          .153          .153
UTILITY        .051          .076          .128          .128          .153          .179
SOLAR          0             0             0             0             0             0
|
===================================================================================
Wednesday 9/6/2023 6:25 AM Data
used here is from 9/5/2023
DJI Futures -98 NASDAQ
Futures -50
| |
9/5/2023
|
|
| |
Market Comments
Remember, remember the fifth of September. Just how nasty it can be.
The bearish seasonal scenario looks like it is right on schedule. Interest
rates are on the rise again. The 10-year rates look like they will
breakout above 4.5% and run to 5%. That is why Utilities broke lower,
bond funds are about to breakdown, housing stocks got torn down, oil
stocks closed at their lows and breadth showed a whopping 1800 more
down than up on the NYSE today. Even Gold and Silver look
vulnerable as rates go potentially much higher.
The DJI appears to be on the verge of significantly falling below
both its 65-dma and its rising support line in its wedge formation.
If JPM and FAS do the same, it will be a bad sign for the overall
market.
I have suggested hedging with some bearish MINCPs. Add to
your shorts some of the bearish stocks displayed below.
Focus on whether prices in your holdings are above or below
their 65-dma and what is the rate of change of 65-dma when
we takes its daily percent change and multiply it by 250. Consider
a breakdown imminent when the 65-dma's
annualized rate of change falls
below 20% and you also see the 21-dma rate of change (AROC) drop
below 0 and the IP21 below 0, assuming the Closing Power is
much weaker than Opening Power. The charts below highlight
this. From this we see the DJI's annualized 65-dma a
MOM is .17.
A breakdown must be considered imminent. |
|
| |
9/5/2026
2022 PEERLESS DJI, Signals, Indicators Daily DJI Volume
10-DayUp/Down Vol Stoch-20 CCI RSI Pct of All Stocks above 65-dma
Inverted Traders Index
DJI-IPA DJI-OBV
NASDAQ S&P OEX NYSE DJ-15 DJ-20 DJI-30
Old Peerless- 2006
version
Tiger Index of Big
Banks Bond Funds Gold Stocks Housing Stocks
Insurance-Stocks
Regional
Banks Russell-1000
Semi Conductors
ETFs: DIA QQQ SPY IWM MDY
TNA Short-Term Rates Ten Year Rates PST (Short Treasuries)
DOLLAR-UUP
ALLSTOCKs
COIN (Bit
Coin ETF)
USO-CrudeOil DBO BLDP FAS GLD HD IBB JETS JNUG KOL NAIL
NUGT NRGU OIH PALL RSX RETL SDS AGQ SLV SOXL TAN |
TECL TLT TMF TNA UGA USO
China: YINN
CHAU BABA BIDU
Commodities: CANE COCO CORN DBC CORN, CUT (paper)
MOO, NRGU
SOYB WEAT UUP (Dollar) LIT
(Lithium) PALL
(Palladium)
Stocks: AA AAPL ADBE AMAT AMGN AMD AMZN ANET AXP BA BAC
BSX CAT CDNS CHKP CNX CPB CRM CVX CMG DE DIS ENPH FB
FSLR FTNT GILD GME GOOG GS HD IBM INTU JPM KO KR LRCX
MRK MRNA MOS MSFT NEM NFLX NKE NOC NUE NVDA PANW PG
PYPL QCOM QDEL REGN REV RE SCHW SNOW SO SQUARE TSLA
TXN XOM V VRTX WFC WMT XLE ZM ZOM
SEMI-Condctors in SOXL:
NVDA. AVGO, AMD. INTC LRCX TXN MCHP NXPI AMAT ON AAOI TSM
HOMEBUILDERS: BLDP NAIL
BZH HOV LEN MHO MTH PHM -
REGIONAL BANKS:
EGBN
FFIC GBCI HMST
Carl Icahn and associates: IEP
MS
JEF
Leveraged Short ETFs:
FAZ - financials, TZA and SRTY- small caps, MZZ - mid caps, TECS -Techs,
SOXS -
semi-conductors LABD
- Biotechs
Bullish MAXCPs http://tigersoftware.com/upping/9-05-2023/Bullish.htm
NONE
Bearish MINCPs www.tigersoftware.com/downing/9-05-2023/Bearish.htm |
|
 |
 |
 |
 |
 |
 |
 |
Gold Stocks are weakening.
 |
 |
 |
 |
 |
Bearish Stocks to Hedge with.
 |
 |
 |
 |
 |
 |
 |
Table 1
| NYSE |
Latest
Close |
Previous
Close |
Week
Ago |
| Issues
traded |
3,017 |
3,005 |
3,029 |
| Advances |
645 |
1,864 |
2,416 |
| Declines |
2,294 |
1,021 |
528 |
| Unchanged |
78 |
120 |
85 |
| New
highs |
64 |
116 |
65 |
| New
lows |
86 |
29 |
25 |
| Adv.
volume* |
194,466,481 |
536,725,095 |
617,006,511 |
| Decl.
volume* |
627,077,055 |
211,905,003 |
112,267,315 |
| Total
volume* |
826,665,985 |
773,114,559 |
737,031,982 |
| Closing
Arms (TRIN)† |
0.75 |
0.71 |
1.01 |
| Block
trades* |
4,049 |
3,950 |
3,532 |
| Adv.
volume |
950,941,028 |
2,282,119,191 |
2,726,559,500 |
| Decl.
volume |
2,539,307,151 |
884,303,562 |
600,430,033 |
| Total
volume |
3,526,252,329 |
3,246,260,032 |
3,354,821,575 |
| NASDAQ |
Latest
Close |
Previous
Close |
Week
Ago |
| Issues
traded |
4,497 |
4,432 |
4,501 |
| Advances |
1,329 |
2,687 |
3,109 |
| Declines |
3,011 |
1,567 |
1,199 |
| Unchanged |
157 |
178 |
193 |
| New
highs |
77 |
101 |
69 |
| New
lows |
157 |
95 |
130 |
| Closing
Arms (TRIN)† |
0.41 |
1.12 |
0.60 |
| Block
trades |
29,243 |
26,787 |
37,174 |
| Adv.
volume |
2,243,671,597 |
2,398,116,744 |
3,817,731,525 |
| Decl.
volume |
2,060,737,525 |
1,572,632,864 |
885,783,115 |
| Total
volume |
4,379,798,387 |
4,033,962,056 |
4,748,184,554 |
==========================================================================


     Table 2         TIGER QUICKSILVER on ETFS - 9/5/2023   ---
Bullish = 1 DBO
Bearish = 3 GLD TAN (-.299) WEAT
ETF       CLOSE     CHANGE    PIVOT-PT  5-dma AROC    CL-PWR  CANDLE  IP21    ITRS  POWER INDEX
=================================================================================================
DIA       346.98  -2         348.62        18.2%      Bearish  RED   -.125    0      ------
---------------------------------------------------------------------------------------------
COMPQX    14020.95  -10.87   13943.76      113.2%     Bearish  BLUE  -.011    .01    -.0999
---------------------------------------------------------------------------------------------
SPY       449.24  -1.95      449.16        72.2%      Bearish  RED   -.04    .008    -.032
---------------------------------------------------------------------------------------------
QQQ       378.07   .48       374.77        150.9%     Bearish  BLUE   .016    .014     .03
---------------------------------------------------------------------------------------------
MDY       477.08  -11.34     482.41        13.2%      -------  RED   -.055    .011    -.044
---------------------------------------------------------------------------------------------
IWM       186.83  -4.02      188.23        31.6%      Bearish  RED   -.081    .006    -.075
---------------------------------------------------------------------------------------------
FAS       65.38  -1.94       66.32         57.5%      -------  RED   -.087    .088     .001
---------------------------------------------------------------------------------------------
RETL      6.57  -.49         6.82          51.1%      Bearish  RED   -.027   -.009    -.036
---------------------------------------------------------------------------------------------
SOXL      24.02   0          23.07         561.5%     -------  BLUE   .048    .068     .116
---------------------------------------------------------------------------------------------
TECL      54.61   .59        51.68         556.7%     Bullish  BLUE   .029    .074     .103
---------------------------------------------------------------------------------------------
IBB       128.14  -1.87      129.47        1.5%       -------  RED   -.148   -.032    -.18
---------------------------------------------------------------------------------------------
GLD       178.64  -1.47      179.87        14.2%      Bearish  RED   -.273   -.027    -.3   bearish
---------------------------------------------------------------------------------------------
DBO       17.13   .2         16.17         351.1%     Bullish  RED    .084    .202     .286 bullish
---------------------------------------------------------------------------------------------
OIH       352.57   2.89      339.44        236.8%     Bullish  RED   -.09     .289     .199
---------------------------------------------------------------------------------------------
CPER     23.62  -.09         23.65         46.6%      Bullish  ----  -.065   -.026    -.091
---------------------------------------------------------------------------------------------
TAN     58.02  -.39          58.72         132.7%     Bearish  RED   -.123   -.176    -.299 bearish
---------------------------------------------------------------------------------------------
UUP       29.22   .15        28.8          45%        Bullish  BLUE   .161    .002     .163
---------------------------------------------------------------------------------------------
CORN      22.37   .17        22.3         -71.8%      -------  BLUE  -.038   -.152    -.19
---------------------------------------------------------------------------------------------
WEAT      5.94   .02         5.98         -158.1%     Bearish  ----  -.081   -.208    -.289 bearish
---------------------------------------------------------------------------------------------
YINN      33.51  -1.44       34.84         98.8%      -------  RED    .046   -.02      .026
|
Table 3      RANKING OF KEY DIRECTORIES BASED PCT.OF STOCKS ABOVE 65-DMA
             9/5/23
 Bullish = 16
 Bearish = 33
---------------------------------------------------------------------------------------
Directory     Current       day-1         day-2         day-3         day-4         day-5
----------------------------------------------------------------------------------------
COAL           1             1             1             1             1             1
EDU            .833          .833          .833          .833          .833          .833
OILGAS         .752          .731          .701          .711          .701          .68
INSURANC       .64           .84           .68           .76           .72           .56
NASD-100       .603          .613          .594          .613          .574          .415
MARIJUAN       .6            .6            .6            .5            .3            .3
NIFTY          .59           .545          .568          .545          .522          .386
INFRA          .58           .677          .612          .612          .58           .451
COPPER         .571          .571          .285          .428          .428          .142
HIGHPRIC       .558          .692          .67           .675          .64           .489
COMODITY       .552          .763          .763          .763          .815          .578
DJI-13         .538          .538          .538          .615          .538          .538
SOFTWARE       .535          .553          .5            .517          .464          .446
DOWJONES       .533          .566          .533          .6            .566          .5
FIDSTKS        .514          .526          .514          .55           .556          .467
FOOD           .51           .714          .714          .714          .734          .591
----------------------------------------------------------------------------------------------
HACKERS        .5            .562          .562          .562          .5            .5
---------------------------------------------------------------------------------------------
RETAIL         .478          .565          .521          .565          .565          .434
INDMATER       .472          .541          .5            .541          .527          .472
SP-100         .466          .5            .466          .544          .511          .444
INDEXES        .464          .621          .605          .6            .583          .448
CHEM           .441          .558          .534          .581          .534          .488
RUS-1000       .438          .543          .505          .541          .524          .428
GUNS           .428          .571          .571          .642          .571          .5
REGBANKS       .421          .5            .421          .421          .447          .421
SP500          .419          .503          .478          .521          .515          .423
SEMI           .413          .445          .423          .38           .38           .315
COMPUTER       .4            .4            .4            .4            .35           .35
HOMEBLDG       .392          .75           .642          .714          .535          .357
ELECTRON       .383          .466          .428          .406          .398          .345
AUTO           .377          .471          .358          .415          .415          .301
FINANCE        .375          .462          .375          .387          .412          .387
REIT           .36           .491          .491          .516          .508          .393
GREEN          .333          .444          .444          .444          .444          .388
LOWPRICE       .331          .343          .316          .302          .296          .296
BIOTECH        .294          .36           .34           .368          .34           .309
BEVERAGE       .285          .428          .571          .642          .642          .571
MILITARY       .269          .346          .423          .384          .346          .307
TRANSP         .263          .368          .315          .368          .368          .368
CHINA          .243          .341          .268          .268          .317          .17
EAT            .243          .268          .292          .317          .292          .268
HOSPITAL       .23           .384          .461          .461          .461          .307
ETFS           .218          .4            .345          .49           .563          .236
GAMING         .21           .21           .21           .263          .263          .21
JETS           .153          .153          .153          .153          .153          .153
BIGBANKS       .142          .142          .142          .285          .285          .285
GOLD           .111          .311          .377          .355          .377          .244
BONDFUND       .091          .103          .126          .114          .091          .068
UTILITY        .076          .128          .128          .153          .179          .179
SOLAR          0             0             0             0             0             0
|
| |
| |
| |
| |
| |
| |
| |
| |
====================================================================================
Tuesday 9/5/2023 6:15 AM Data used
here is from 9/1/2023
DJI Futures -26 NASDAQ
Futures -46
| |
9/1/2023
|
|
| |
Market Comments
Everywhere we see the inroads
that artificial intelligence is making in
even our daily lives and this
is just the beginning. "Paint me a Picasso
original. Then a new
Beethoven piano sonata. Oh, and hurry up with
that new program to find the
best trading system for Dell's stock."
It won't be long before Bing
and Bing's descendants can do all these
things and much more.
The creators and owners of this new technology
will make a lot of money.
Are these dreams? I don't think so. They
will make lot of industries
more profitable for their shareholders. A
lot of workers will be let
go, I expect. That is why the impending
automakers' strike will be
important to watch.
Watch NVDA. It is the
hands' down market leader now. By our
usual standard when
seeing a falling Closing Power and negative IP21,
it should sell off.
But if it does not, I would suggest that too many traders
just want to own it and
are not willing to wait, particularly since
its upward momentum is
so high.
Wall Street must factor in
this new future. The big techs refuse to sell-off
even under the pressure of
Professional selling and big money distribution.
Will it start down now that
we are into the frequently bearish month
of September and many on the
FED want to push up interest rates
higher?. The DJI's
rising wedge pattern and the still active Sell S9-V
from Peerless make this one
scenario.
But seeing that the NYSE A/D
Line is still in an uptrend, makes me
view hedging as a reasonable
approach. SLB (in the bullish oil
services sector), HOV (in the
bullish home-building sector)
and LRCX (among the bullish
semi-conductors) all look very
good. Meanwhile, among
the bearish MINCPs is CVS. It shows
the same impending breakdown
pattern that it showed 6 months
ago.
Watch to see which way the
Closing Powers of QQQ and SPY
move from their Closing
Powers' 21-day ma. If September does
not bring a sell-off,
the period from October to the end of the
year will be very
bullish.
|
|
| |
9/1/2023
2022 PEERLESS DJI, Signals, Indicators Daily DJI Volume
10-DayUp/Down Vol Stoch-20 CCI RSI Pct of All Stocks above 65-dma
Inverted Traders Index
DJI-IPA DJI-OBV
NASDAQ S&P OEX NYSE DJ-15 DJ-20 DJI-30
Old Peerless- 2006
version
Tiger Index of Big
Banks Bond Funds Gold Stocks Housing Stocks
Insurance-Stocks
Regional
Banks Russell-1000
Semi Conductors
ETFs: DIA QQQ SPY IWM MDY
TNA Short-Term Rates Ten Year Rates PST (Short Treasuries)
DOLLAR-UUP
ALLSTOCKs
COIN (Bit
Coin ETF)
USO-CrudeOil DBO BLDP FAS GLD HD IBB JETS JNUG KOL NAIL
NUGT NRGU OIH PALL RSX RETL SDS AGQ SLV SOXL TAN |
TECL TLT TMF TNA UGA USO
China: YINN
CHAU BABA BIDU
Commodities:
CANE
COCO CORN DBC CORN, CUT (paper)
MOO, NRGU
SOYB WEAT UUP (Dollar) LIT
(Lithium) PALL
(Palladium)
Stocks: AA AAPL ADBE AMAT AMGN AMD AMZN ANET AXP BA BAC
BSX CAT CDNS CHKP CNX CPB CRM CVX CMG DE DIS ENPH FB
FSLR FTNT GILD GME GOOG GS HD IBM INTU JPM KO KR LRCX
MRK MRNA MOS MSFT NEM NFLX NKE NOC NUE NVDA PANW PG
PYPL QCOM QDEL REGN REV RE SCHW SNOW SO SQUARE TSLA
TXN XOM V VRTX WFC WMT XLE ZM ZOM
SEMI-Condctors in SOXL:
NVDA. AVGO, AMD. INTC LRCX TXN MCHP NXPI AMAT ON AAOI TSM
HOMEBUILDERS: BLDP NAIL
BZH HOV LEN MHO MTH PHM -
REGIONAL BANKS:
EGBN
FFIC GBCI HMST
Carl Icahn and associates: IEP
MS
JEF
Leveraged Short ETFs:
FAZ - financials, TZA and SRTY- small caps, MZZ - mid caps, TECS -Techs,
SOXS -
semi-conductors LABD
- Biotechs
Bullish MAXCPs
http://tigersoftware.com/upping/9-01-2023/Bullish.htm
Bearish MINCPs www.tigersoftware.com/downing/9-01-2023/Bearish.htm |
|
 |
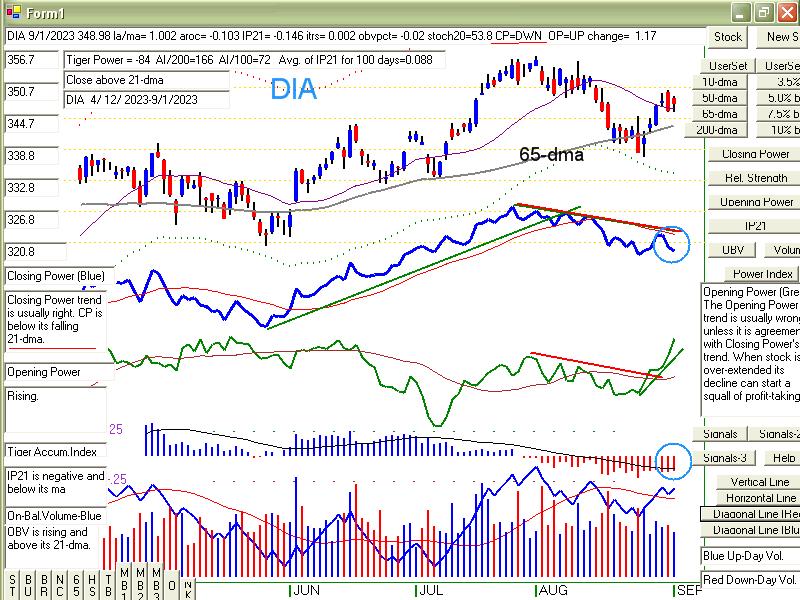 |
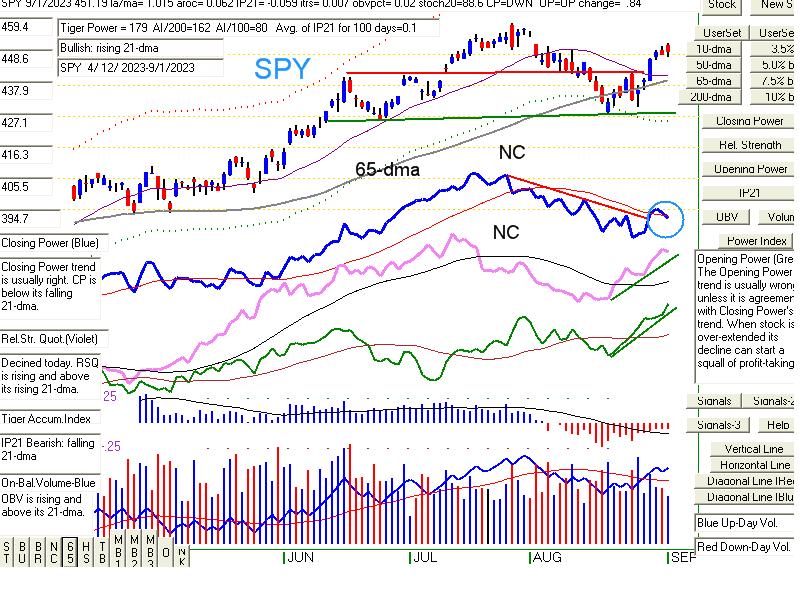 |
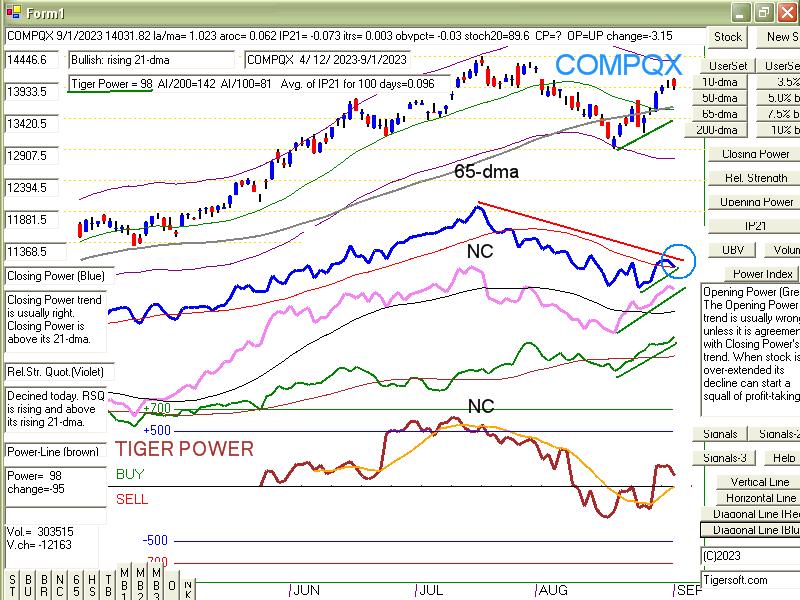 |
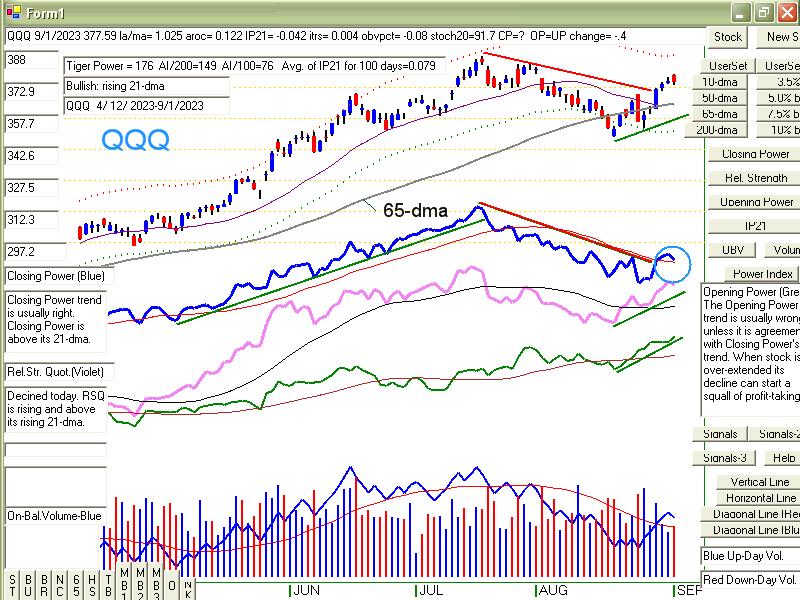 |
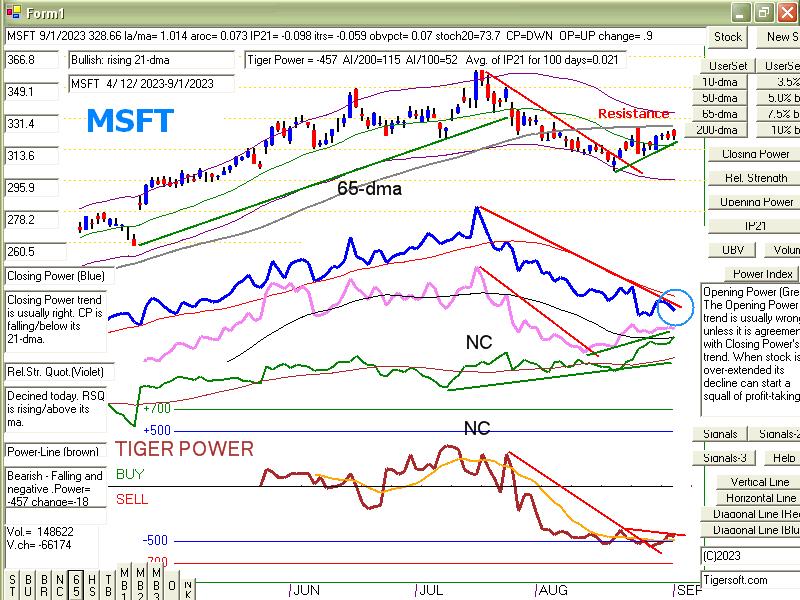 |
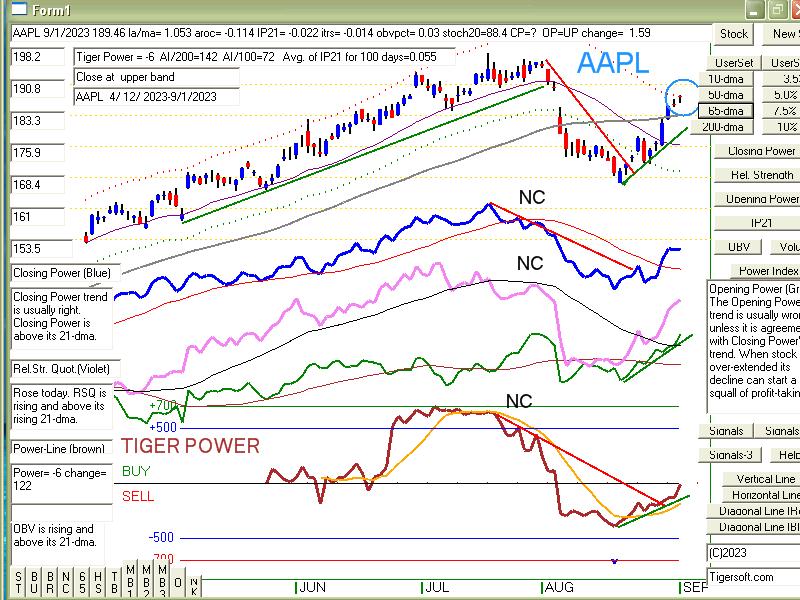 |
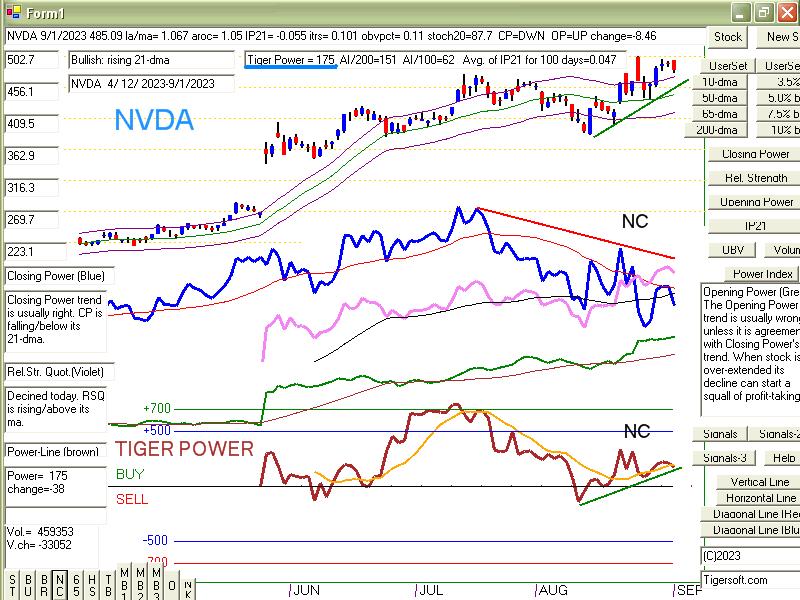 |
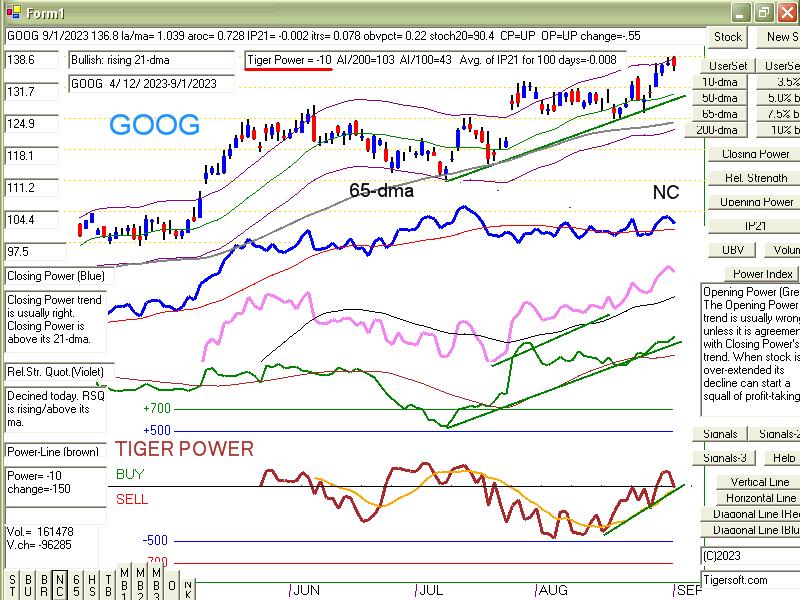 |
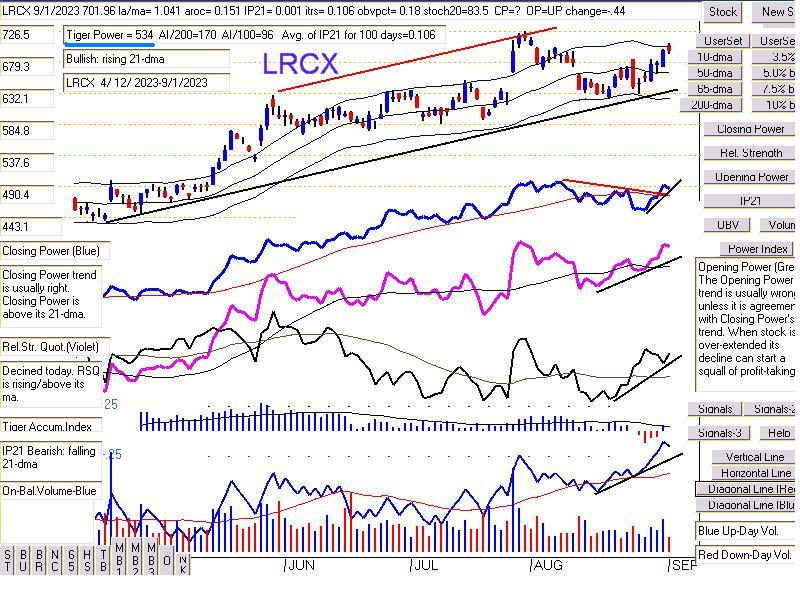 |
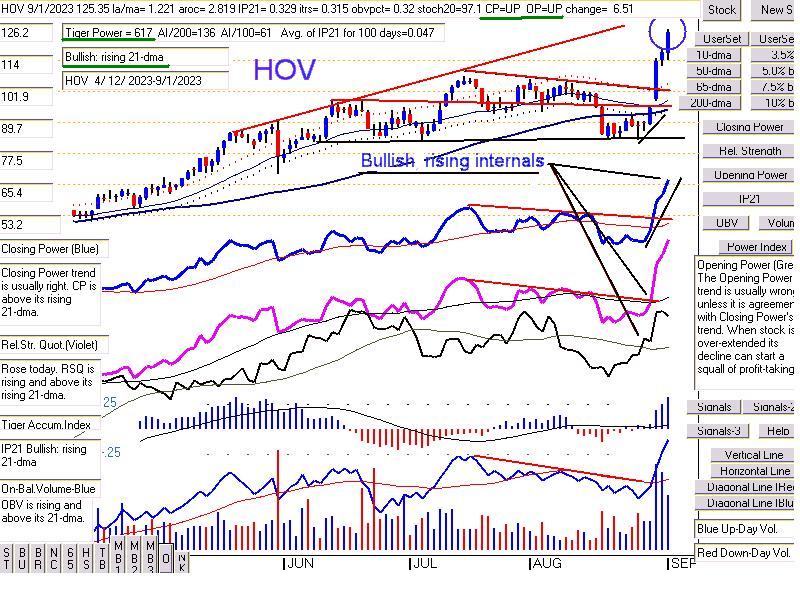 |
 |
 |
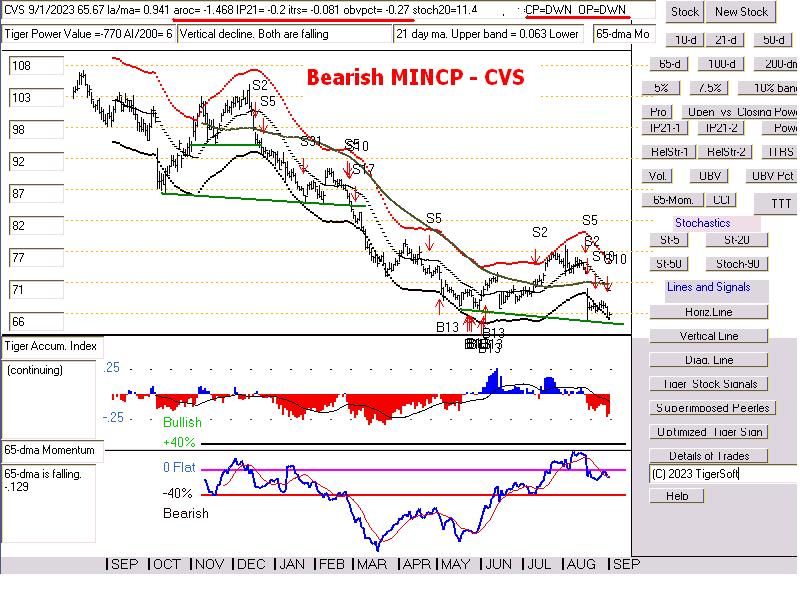 |
| NYSE |
Latest
Close |
Previous
Close |
Week
Ago |
| Issues
traded |
3,005 |
3,019 |
2,988 |
| Advances |
1,864 |
1,375 |
1,715 |
| Declines |
1,021 |
1,526 |
1,133 |
| Unchanged |
120 |
118 |
140 |
| New
highs |
116 |
78 |
25 |
| New
lows |
29 |
20 |
66 |
| Adv.
volume* |
536,725,095 |
506,835,714 |
451,469,168 |
| Decl.
volume* |
211,905,003 |
684,285,303 |
276,562,838 |
| Total
volume* |
773,114,559 |
1,204,376,898 |
742,383,629 |
| Closing
Arms (TRIN)† |
0.71 |
1.32 |
0.93 |
| Block
trades* |
3,950 |
4,224 |
3,369 |
| Adv.
volume |
2,282,119,191 |
1,584,359,811 |
1,990,023,668 |
| Decl.
volume |
884,303,562 |
2,321,563,046 |
1,226,091,480 |
| Total
volume |
3,246,260,032 |
3,946,363,851 |
3,296,182,945 |
| NASDAQ |
Latest
Close |
Previous
Close |
Week
Ago |
| Issues
traded |
4,432 |
4,547 |
4,450 |
| Advances |
2,687 |
1,923 |
2,325 |
| Declines |
1,567 |
2,420 |
1,917 |
| Unchanged |
178 |
204 |
208 |
| New
highs |
101 |
90 |
33 |
| New
lows |
95 |
104 |
211 |
| Closing
Arms (TRIN)† |
1.12 |
0.77 |
0.73 |
| Block
trades |
26,787 |
30,850 |
26,661 |
| Adv.
volume |
2,398,116,744 |
2,299,590,567 |
2,446,791,394 |
| Decl.
volume |
1,572,632,864 |
2,233,523,182 |
1,467,389,182 |
| Total
volume |
4,033,962,056 |
4,568,619,191 |
3,970,063,909 |
|
Table 2 TIGER QUICKSILVER on ETFS - 9/1/2023 ---
Bullish = 1 DBO
Bearish = 2 TAN (-.413) WEAT
ETF       CLOSE     CHANGE    PIVOT-PT  5-dma AROC    CL-PWR  CANDLE  IP21    ITRS  POWER INDEX
=================================================================================================
DIA       348.98   1.17      345.71        79%        Bearish  RED   -.146    0       =====
---------------------------------------------------------------------------------------------
COMPQX    14031.82  -3.15    13705.13      159.2%     Bearish  RED   -.072    .001    -.071
---------------------------------------------------------------------------------------------
SPY       451.19   .84       442.76        125.6%     Bearish  RED   -.058    .005    -.053
---------------------------------------------------------------------------------------------
QQQ       377.59  -.4        366.76        182.4%     Bearish  RED   -.041    .003    -.038
---------------------------------------------------------------------------------------------
MDY       488.42   4.85      475.81        174.6%     Bullish  BLUE  -.026    .024    -.002
---------------------------------------------------------------------------------------------
IWM       190.85   2.24      185.64        183.1%     -------  BLUE  -.062    .013    -.049
---------------------------------------------------------------------------------------------
FAS       67.32   1.5        64.62         292.2%     -------  BLUE  -.104    .107     .003
---------------------------------------------------------------------------------------------
RETL      7.06   .1          6.5           589.7%     Bearish  ----  -.034    .041     .007
---------------------------------------------------------------------------------------------
SOXL      24.02   .16        21.42         747.3%     Bearish  RED    .039    .011     .05
---------------------------------------------------------------------------------------------
TECL      54.02   .46        48.8          619.6%     -------  RED   -.027    .025    -.002
---------------------------------------------------------------------------------------------
IBB       130.01   1.3       128.1         94.4%      -------  BLUE  -.154   -.027    -.181
---------------------------------------------------------------------------------------------
GLD       180.11   .09       178.13        69.5%      Bearish  RED   -.231   -.015    -.246
---------------------------------------------------------------------------------------------
DBO       16.93   .38        15.98         287.2%     Bullish  BLUE   .142    .19      .332
---------------------------------------------------------------------------------------------
OIH       349.68   8.95      336.39        274.3%     Bullish  BLUE  -.044    .264     .22
---------------------------------------------------------------------------------------------
CPER     23.71   .17         23.4          100%       Bullish  RED   -.061   -.04     -.101
------------------------------------------------------------------------------------ ---------
TAN     58.41   .18          56.48         194.5%     -------  RED   -.168   -.181    -.349
---------------------------------------------------------------------------------------------
UUP       29.07   .18        28.96         10.4%      Bullish  BLUE   .163    .002     .165
---------------------------------------------------------------------------------------------
CORN      22.2   .13         22.69        -20.2%      -------  RED   -.031   -.2      -.231
---------------------------------------------------------------------------------------------
WEAT      5.92  -.07         6.13         -181.8%     Bearish  RED   -.095   -.221    -.316
---------------------------------------------------------------------------------------------
YINN      34.95   2.18       32.84         641.3%     -------  BLUE   .023   -.044    -.021
|
 Table 3      RANKING OF KEY DIRECTORIES BASED PCT.OF STOCKS ABOVE 65-DMA
              9/1/23
 BULLISH = 25
 BEARISH = 23
---------------------------------------------------------------------------------------
Directory     Current       day-1         day-2         day-3         day-4         day-5
----------------------------------------------------------------------------------------
COAL           1             1             1             1             1             1
INSURANC       .84           .68           .76           .72           .6            .6
EDU            .833          .833          .833          .833          .833          .666
COMODITY       .763          .789          .736          .815          .578          .526
HOMEBLDG       .75           .642          .714          .535          .392          .321
OILGAS         .731          .701          .711          .701          .68           .659
FOOD           .714          .734          .693          .734          .612          .551
HIGHPRIC       .692          .67           .675          .64           .497          .419
INFRA          .677          .612          .612          .58           .451          .419
INDEXES        .621          .605          .6            .583          .459          .335
NASD-100       .613          .594          .613          .574          .435          .386
MARIJUAN       .6            .6            .5            .3            .3            .3
COPPER         .571          .285          .428          .428          .142          .142
GUNS           .571          .571          .642          .571          .5            .428
SOFTWARE       .571          .517          .517          .464          .428          .428
DOWJONES       .566          .533          .6            .566          .5            .466
RETAIL         .565          .521          .565          .565          .456          .413
HACKERS        .562          .562          .562          .5            .5            .437
CHEM           .558          .534          .581          .534          .511          .418
NIFTY          .545          .568          .545          .522          .386          .34
RUS-1000       .544          .505          .54           .524          .439          .398
INDMATER       .541          .5            .541          .527          .5            .43
DJI-13         .538          .538          .615          .538          .538          .615
FIDSTKS        .526          .514          .55           .556          .479          .408
SP500          .503          .478          .521          .513          .437          .382
=============================================================================================
REGBANKS       .5            .421          .421          .447          .421          .263
SP-100         .5            .466          .544          .511          .444          .411
=============================================================================================
REIT           .491          .475          .524          .516          .401          .295
AUTO           .471          .377          .415          .415          .32           .301
ELECTRON       .466          .428          .406          .398          .338          .278
FINANCE        .462          .375          .387          .4            .4            .337
SEMI           .445          .423          .38           .38           .315          .228
GREEN          .444          .444          .444          .444          .388          .388
BEVERAGE       .428          .571          .642          .642          .642          .571
COMPUTER       .4            .4            .4            .35           .35           .25
ETFS           .4            .345          .49           .563          .254          .181
HOSPITAL       .384          .461          .461          .461          .384          .307
TRANSP         .368          .315          .368          .368          .368          .315
BIOTECH        .357          .337          .37           .34           .309          .296
MILITARY       .346          .423          .384          .346          .307          .269
LOWPRICE       .343          .319          .304          .296          .293          .29
CHINA          .341          .268          .268          .317          .195          .17
GOLD           .311          .377          .355          .377          .244          .155
EAT            .268          .292          .317          .292          .317          .268
GAMING         .21           .21           .21           .315          .21           .21
JETS           .153          .153          .153          .153          .153          .153
BIGBANKS       .142          .142          .285          .285          .285          .142
UTILITY        .128          .128          .153          .179          .179          .153
BONDFUND       .103          .114          .114          .103          .08           .057
SOLAR          0             0             0             0             0             0
|
============================================================================
Thursday 8/31/2023 6:08 AM Data
used here is from 8/30/2023
DJI Futures +140 NASDAQ
Futures +30
|
8/30/2023
|
|
|
Market Comments
With the Ten Year Rates no longer
looking like they will make
a breakout to new highs above 4.5%
in the immediate future,
the DJI has not only bounced up off
its 65-dma, it has sliced
its way through the 65-dma.
It is bullish that the DJI has now
broken clearly above its rising
65-dma and the A/D Line downtrend
has broken.
At the same time, the key indexes
and general market ETFs
have moved up past the expected
resistance from their right
shoulder peaks. I have tried
to show all the bearish head and shoulders
patterns in these indexes (and
ETFs) that have been aborted in
the process.
This has caused a lot of
short-covering, as such head and shoulders
patterns are watched for by hedge
fund managerss and chartists,
generally. Most often, a move
above the right shoulder apex in
these patterns brings a rally to
new highs. Sometimes, the rally is
quick and exciting, as in HOV today
in the home-building group.
See its chart below. I take
its explosive move up to be a very bullish
development and signal to buy other
leading home-builders and
also NAIL. See their charts
below.
Going back to the DJI, see how the
Stochastic-20-Pct D has risen
back above 20 and the Up volume
minus Down Volume (cummulative)
has bullishly broken above its
downtrend. One thing that strikes me as
unusual is how low the Down Stocks'
volume has been on the NYSE recently
and day after day. Only one
day of the last six has seen NYSE
Down Volume go above 302 million.
So, unless the FED turns
"hawkish", the blue chips
and the leading techs should all go higher
and short sellers will have a hard
time covering on weakness.
. |
|
|
8/30/2026
2022 PEERLESS DJI, Signals, Indicators Daily DJI Volume
10-DayUp/Down Vol Stoch-20 CCI RSI Pct of All Stocks above 65-dma
Inverted Traders Index
DJI-IPA DJI-OBV
NASDAQ S&P OEX NYSE DJ-15 DJ-20 DJI-30
Old Peerless- 2006
version
Tiger Index of Big
Banks Bond Funds Gold Stocks Housing Stocks
Insurance-Stocks
Regional
Banks Russell-1000
Semi Conductors
ETFs: DIA QQQ SPY IWM MDY
TNA Short-Term Rates Ten Year Rates PST (Short Treasuries)
DOLLAR-UUP
ALLSTOCKs
COIN (Bit
Coin ETF)
USO-CrudeOil DBO BLDP FAS GLD HD IBB JETS JNUG KOL NAIL
NUGT NRGU OIH PALL RSX RETL SDS AGQ SLV SOXL TAN |
TECL TLT TMF TNA UGA USO
China: YINN
CHAU BABA BIDU
Commodities:
CANE
COCO CORN DBC CORN, CUT (paper)
MOO, NRGU
SOYB WEAT UUP (Dollar) LIT
(Lithium) PALL
(Palladium)
Stocks: AA AAPL ADBE AMAT AMGN AMD AMZN ANET AXP BA BAC
BSX CAT CDNS CHKP CNX CPB CRM CVX CMG DE DIS ENPH FB
FSLR FTNT GILD GME GOOG GS HD IBM INTU JPM KO KR LRCX
MRK MRNA MOS MSFT NEM NFLX NKE NOC NUE NVDA PANW PG
PYPL QCOM QDEL REGN REV RE SCHW SNOW SO SQUARE TSLA
TXN XOM V VRTX WFC WMT XLE ZM ZOM
SEMI-Condctors in SOXL:
NVDA. AVGO, AMD. INTC LRCX TXN MCHP NXPI AMAT ON AAOI TSM
HOMEBUILDERS: BLDP NAIL
BZH HOV LEN MHO MTH PHM -
REGIONAL BANKS:
EGBN
FFIC GBCI HMST
Carl Icahn and associates: IEP
MS
JEF
Leveraged Short ETFs:
FAZ - financials, TZA and SRTY- small caps, MZZ - mid caps, TECS -Techs,
SOXS -
semi-conductors LABD
- Biotechs
Bullish MAXCPs
http://tigersoftware.com/upping/8-30-2023/Bullish.htm
Bearish MINCPs www.tigersoftware.com/downing/8-30-2023/Bearish.htm |
|
 |
 |
 |
 |
 |
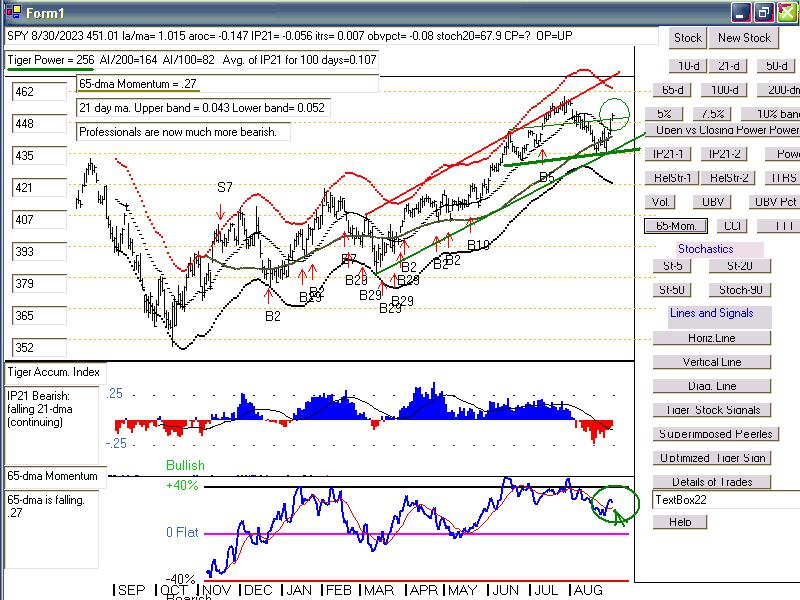 |
 |
 |
 |
 |
Table 1
| NYSE |
Latest
Close |
Previous
Close |
Week
Ago |
| Issues
traded |
3,001 |
3,029 |
3,024 |
| Advances |
1,747 |
2,416 |
2,287 |
| Declines |
1,120 |
528 |
663 |
| Unchanged |
134 |
85 |
74 |
| New
highs |
98 |
65 |
43 |
| New
lows |
18 |
25 |
62 |
| Adv.
volume* |
380,621,633 |
617,006,511 |
546,877,078 |
| Decl.
volume* |
279,700,871 |
112,267,315 |
300,113,788 |
| Total
volume* |
679,883,715 |
737,031,982 |
853,125,797 |
| Closing
Arms (TRIN)† |
1.15 |
1.01 |
2.11 |
| Block
trades* |
3,416 |
3,532 |
4,280 |
| Adv.
volume |
1,703,433,672 |
2,726,559,500 |
2,363,485,168 |
| Decl.
volume |
1,255,089,860 |
600,430,033 |
1,444,043,363 |
| Total
volume |
3,064,112,605 |
3,354,821,575 |
3,837,272,575 |
| NASDAQ |
Latest
Close |
Previous
Close |
Week
Ago |
| Issues
traded |
4,510 |
4,501 |
4,511 |
| Advances |
2,383 |
3,109 |
2,878 |
| Declines |
1,925 |
1,199 |
1,430 |
| Unchanged |
202 |
193 |
203 |
| New
highs |
83 |
69 |
57 |
| New
lows |
81 |
130 |
167 |
| Closing
Arms (TRIN)† |
0.86 |
0.60 |
0.90 |
| Block
trades |
32,224 |
37,174 |
30,798 |
| Adv.
volume |
2,551,813,781 |
3,817,731,525 |
2,795,076,527 |
| Decl.
volume |
1,767,632,353 |
885,783,115 |
1,247,024,867 |
| Total
volume |
4,364,609,824 |
4,748,184,554 |
4,127,853,401 |
|
Table 2 TIGER QUICKSILVER on ETFS - 8/30/2023 ---
Bullish = 0
Bearish = 2 TAN (-.413) GLD
ETF       CLOSE     CHANGE    PIVOT-PT  5-dma AROC   CL-PWR  CANDLE  IP21    ITRS  POWER INDEX
=================================================================================================
DIA       349.4   .78        341.03        66.3%     -------  BLUE  -.151    ---------------
---------------------------------------------------------------------------------------------
COMPQX    14019.31   75.55   13463.97      109%      Bearish  BLUE  -.055   -.001    -.056
---------------------------------------------------------------------------------------------
SPY       451.01   1.85      436.89        90.2%     -------  BLUE  -.055    .005    -.05
---------------------------------------------------------------------------------------------
QQQ       376.86   2.09      361.22        105.5%    Bearish  BLUE  -.059    .001    -.058
---------------------------------------------------------------------------------------------
MDY       483.23   .82       469.73        88%       Bullish  BLUE  -.029    .008    -.021
---------------------------------------------------------------------------------------------
IWM       188.94   .71       183.22        85%       -------  BLUE  -.021   -.006    -.027
---------------------------------------------------------------------------------------------
FAS       66.61   .29        62.89         251.8%    Bullish  BLUE  -.037    .053     .016
---------------------------------------------------------------------------------------------
RETL      6.94   .12         6.18          239.2%    -------  BLUE   .002    .028     .03
---------------------------------------------------------------------------------------------
SOXL      23.4   .33         20.41         184.9%    Bearish  BLUE   0      -.077    -.077
---------------------------------------------------------------------------------------------
TECL      52.87   1.19       46.26         316.3%    -------  BLUE  -.06   -.017     -.077
---------------------------------------------------------------------------------------------
IBB       129.85   .38       126.86        71.1%     Bullish  BLUE  -.147   -.03     -.177
---------------------------------------------------------------------------------------------
GLD       180.32   .45       177.85        68.2%     Bearish  RED   -.237   -.023     -.26
---------------------------------------------------------------------------------------------
DBO       16.25   .08        15.77         153.7%    -------  ----   .048    .122     .17
---------------------------------------------------------------------------------------------
OIH       341.85   2.41      331.44        97.1%     Bullish  BLUE  -.033    .23      .197
----------------------------------------------------------------------------------- ----------
CPER     23.65   0           23.27         23.5%     Bullish  ----  -.119   -.039    -.158
---------------------------------------------------------------------------------------------
TAN     58.28  -.44          55.5          134%      Bearish  RED   -.213   -.2      -.413
---------------------------------------------------------------------------------------------
UUP       28.75  -.05        28.97         1.7%      Bullish  ----   .129   -.008     .121
---------------------------------------------------------------------------------------------
CORN      22.16  -.14        22.36        -35.7%     -------  RED   -.052   -.173    -.225
---------------------------------------------------------------------------------------------
WEAT      6.02   .04         6.25         -219.2%    Bearish  ----  -.092   -.161    -.253
---------------------------------------------------------------------------------------------
YINN      34.13  -.71        30.87         566.4%    -------  BLUE   .035   -.095    -.06
|
Table 3       RANKING OF KEY DIRECTORIES BASED PCT.OF STOCKS ABOVE 65-DMA
              8/30/23
Bullish = 26
Bearish = 23
---------------------------------------------------------------------------------------
Directory     Current       day-1         day-2         day-3         day-4         day-5
----------------------------------------------------------------------------------------
COAL           1             1             1             1             1             1
EDU            .833          .833          .833          .666          .833          .833
COMODITY       .763          .815          .552          .526          .5            .552
INSURANC       .76           .72           .6            .6            .64           .6
FOOD           .714          .734          .591          .551          .53           .551
HOMEBLDG       .714          .535          .392          .321          .321          .5
OILGAS         .711          .701          .68           .659          .618          .67
HIGHPRIC       .675          .64           .497          .432          .367          .558
BEVERAGE       .642          .642          .642          .571          .5            .642
GUNS           .642          .571          .5            .428          .428          .642
DJI-13         .615          .538          .538          .615          .461          .615
NASD-100       .613          .574          .435          .386          .356          .514
               -----
INFRA          .612          .58           .451          .419          .387          .548
DOWJONES       .6            .566          .5            .466          .433          .533
               -----
INDEXES        .6            .583          .459          .356          .329          .502
CHEM           .581          .534          .511          .418          .395          .372
RETAIL         .565          .565          .456          .413          .456          .521
HACKERS        .562          .5            .5            .437          .375          .437
SOFTWARE       .553          .482          .428          .41           .321          .41
FIDSTKS        .55           .556          .479          .414          .437          .473
NIFTY          .545          .522          .386          .363          .272          .409
SP-100         .544          .511          .444          .411          .388          .433
INDMATER       .541          .527          .5            .444          .402          .444
RUS-1000       .541          .523          .438          .404          .393          .445
SP500          .521          .513          .435          .382          .38           .437
REIT           .508          .508          .418          .295          .295          .319
=============================================================================================
MARIJUAN       .5            .3            .3            .3            .3            .3
=============================================================================================
ETFS           .49           .563          .254          .2            .163          .254
HOSPITAL       .461          .461          .384          .307          .307          .384
GREEN          .444          .444          .388          .388          .277          .333
AUTO           .433          .433          .32           .301          .32           .377
COPPER         .428          .428          .142          .142          .142          .285
REGBANKS       .421          .447          .421          .289          .394          .368
ELECTRON       .406          .398          .338          .27           .285          .353
COMPUTER       .4            .35           .35           .25           .35           .35
FINANCE        .387          .4            .387          .325          .35           .325
MILITARY       .384          .346          .307          .269          .269          .384
SEMI           .38           .38           .315          .228          .239          .326
TRANSP         .368          .368          .368          .368          .368          .368
BIOTECH        .365          .34           .312          .296          .281          .327
GOLD           .355          .377          .244          .155          .222          .222
EAT            .317          .292          .317          .268          .341          .39
LOWPRICE       .307          .302          .296          .29           .272          .322
BIGBANKS       .285          .285          .285          .142          .285          .285
CHINA          .268          .317          .195          .195          .17           .219
GAMING         .21           .263          .21           .263          .157          .315
JETS           .153          .153          .153          .153          .076          .153
UTILITY        .153          .179          .179          .153          .153          .179
BONDFUND       .103          .091          .091          .08           .068          .091
SOLAR          0             0             0             0             0             0
|
====================================================================================
Wednesday 8/30/2023 6:20 AM Data
used here is from 8/29/2023
DJI Futures +78 NASDAQ
Futures +4
| |
8/29/2023
|
|
| |
The shorts are starting to cover our Bearish MINCPs.
I have found
their timing is usually very good. Cover
any shorts where
their steep Closing Power trends
are broken.
Wednesday's big
drop in 10-year rates was the tonic the DJI
needed to close
decisively back above its rising 65-dma and
cause the NYSE
A/D Line to break its downtrend. In the past,
when Peerless was
not on a Buy and this happened, it meant that"
the DJI would go
on a hunt higher for overhead reistance. Usually,
this means the
upper 2.5% to 3% upper band. Here, that probably
means
35,000. Given the still negative IP21-Accumulation and
falling Closing
Powers, the rally will likely run into plenty of resistance.
In fact, it still
must show that it can eat up the resistance just at its
falling 21-dma,
where it is now.
The DJI is
important, even if its movements now within its wedge
pattern are
likely to be limited. Its getting back above its 65-dma
has coincided
with the S&P, NASDAQ , NYSE and OEX eating up
most of the
supply of stock at the right shoulder in their head/shoulders
patterns.
Professional
traders have become very focused on the tech giants,
particularly
AAPL, MSFT and NVDA. We watch them here each
night for that
reason. As long as they stay strong, so will the SP-500
and the NASDAQ,
as well as the DJI.
To study these, I
have introduced two new technical tools. The
first is the
Power Index, which is really a compsite of all our
main indicators.
This week I began showing a derivative of the
65-dma and called
it MOM for momentum. As long as MOM
stays above .40
(40% annualized rate of ascent), it is too strong
to use many SELLs
on the stock and instead it may reasonably
be bought on a
test of its 65-dma. Tonight, I want to point out
the value of
watching MOM's red 10-day ma. This indicator's
turning up after
an intermediate-term decline renders very good
points to Buy the
stocks and ETFs shown below.
Tiger has its own
Buys and Sells. I am in the process of placing
them in the new
Windows-10 Tiger. But as I do this, I want to
simplify them as
much as possible and also look for possible
new signals. See
the SP-500 chart for an explanation of those now
showing. |
|
| |
8/29/2026
2022 PEERLESS DJI, Signals, Indicators Daily DJI Volume
10-DayUp/Down Vol Stoch-20 CCI RSI Pct of All Stocks above 65-dma
Inverted Traders Index
DJI-IPA DJI-OBV
NASDAQ S&P OEX NYSE DJ-15 DJ-20 DJI-30
Old Peerless- 2006
version
Tiger Index of Big
Banks Bond Funds Gold Stocks Housing Stocks
Insurance-Stocks
Regional
Banks Russell-1000
Semi Conductors
ETFs: DIA QQQ SPY IWM MDY
TNA Short-Term Rates Ten Year Rates PST (Short Treasuries)
DOLLAR-UUP
ALLSTOCKs
COIN (Bit
Coin ETF)
USO-CrudeOil DBO BLDP FAS GLD HD IBB JETS JNUG KOL NAIL
NUGT NRGU OIH PALL RSX RETL SDS AGQ SLV SOXL TAN |
TECL TLT TMF TNA UGA USO
China: YINN
CHAU BABA BIDU
Commodities:
CANE
COCO CORN DBC CORN, CUT (paper)
MOO, NRGU
SOYB WEAT UUP (Dollar) LIT
(Lithium) PALL
(Palladium)
Stocks: AA AAPL ADBE AMAT AMGN AMD AMZN ANET AXP BA BAC
BSX CAT CDNS CHKP CNX CPB CRM CVX CMG DE DIS ENPH FB
FSLR FTNT GILD GME GOOG GS HD IBM INTU JPM KO KR LRCX
MRK MRNA MOS MSFT NEM NFLX NKE NOC NUE NVDA PANW PG
PYPL QCOM QDEL REGN REV RE SCHW SNOW SO SQUARE TSLA
TXN XOM V VRTX WFC WMT XLE ZM ZOM
SEMI-Condctors in SOXL:
NVDA. AVGO, AMD. INTC LRCX TXN MCHP NXPI AMAT ON AAOI TSM
HOMEBUILDERS: BLDP NAIL
BZH HOV LEN MHO MTH PHM -
REGIONAL BANKS:
EGBN
FFIC GBCI HMST
Carl Icahn and associates: IEP
MS
JEF
Leveraged Short ETFs:
FAZ - financials, TZA and SRTY- small caps, MZZ - mid caps, TECS -Techs,
SOXS -
semi-conductors LABD
- Biotechs
Bullish MAXCPs http://tigersoftware.com/upping/8-29-2023/Bullish.htm
Bearish MINCPs www.tigersoftware.com/downing/8-29-2023/Bearish.htm |
|
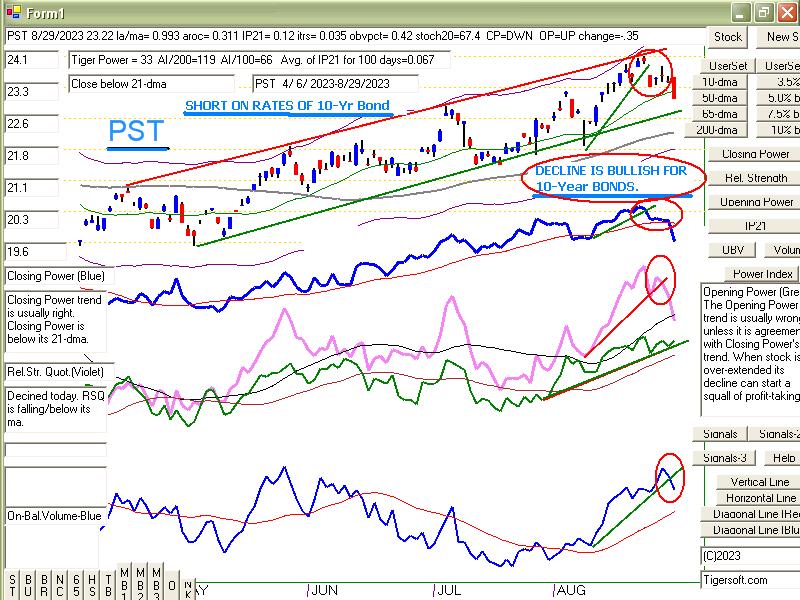 |
 |
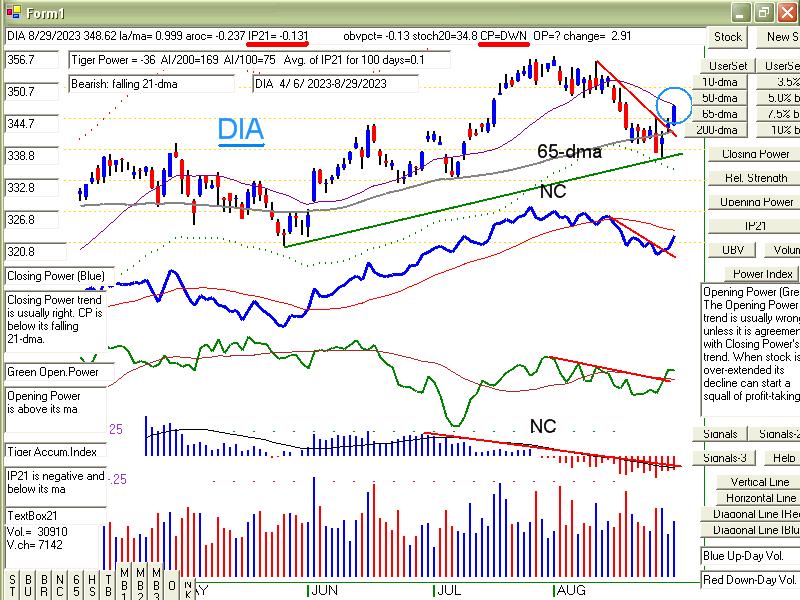 |
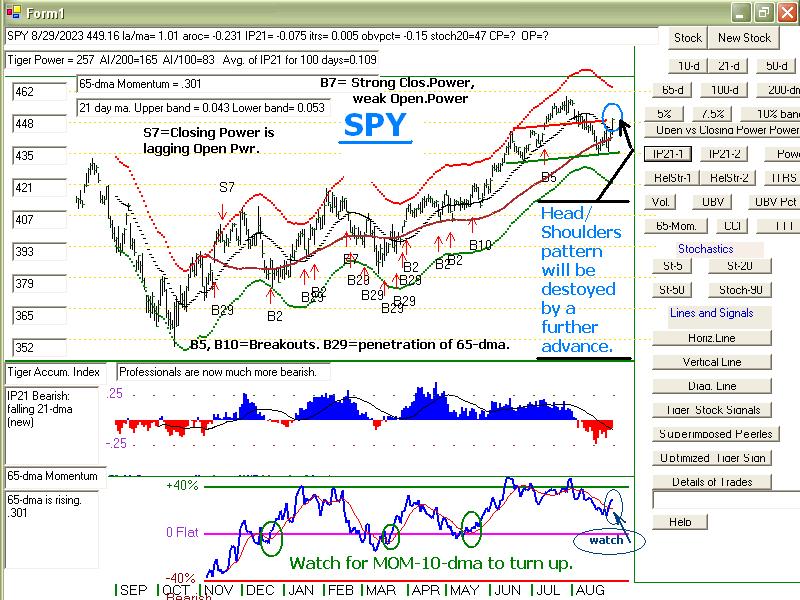 |
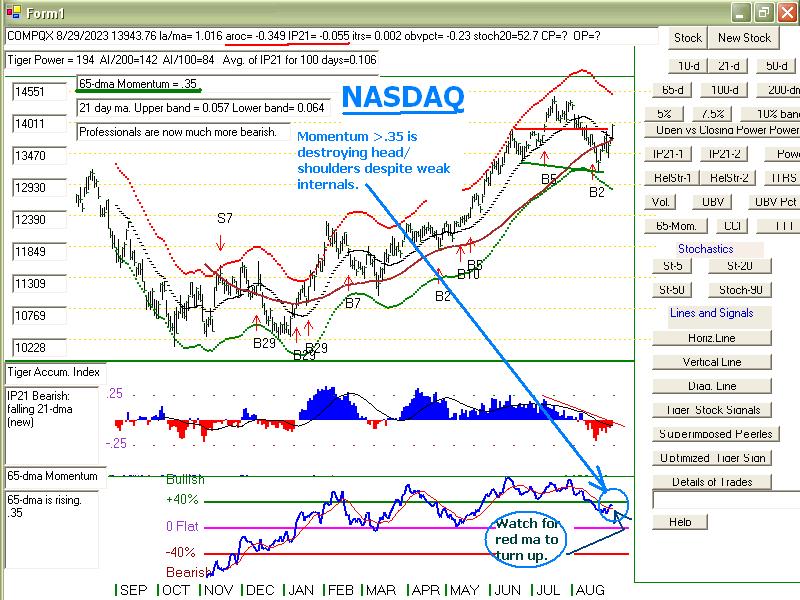 |
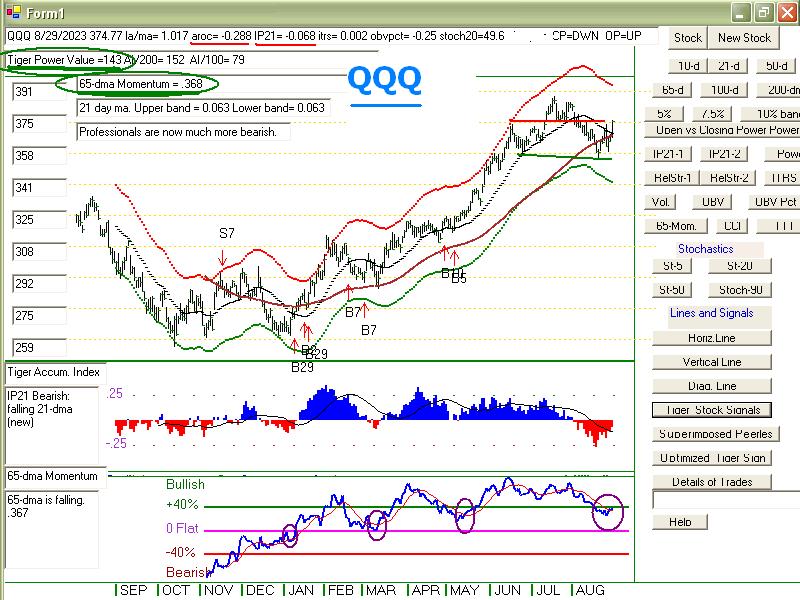 |
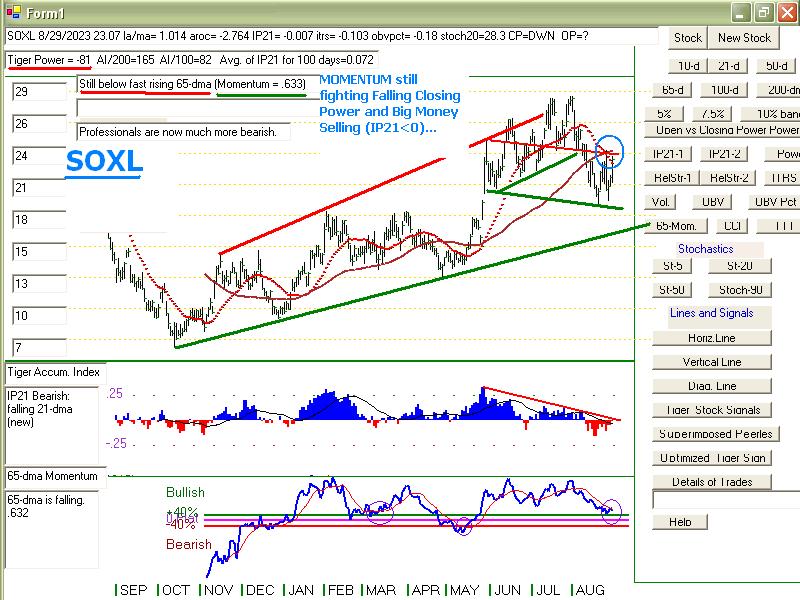 |
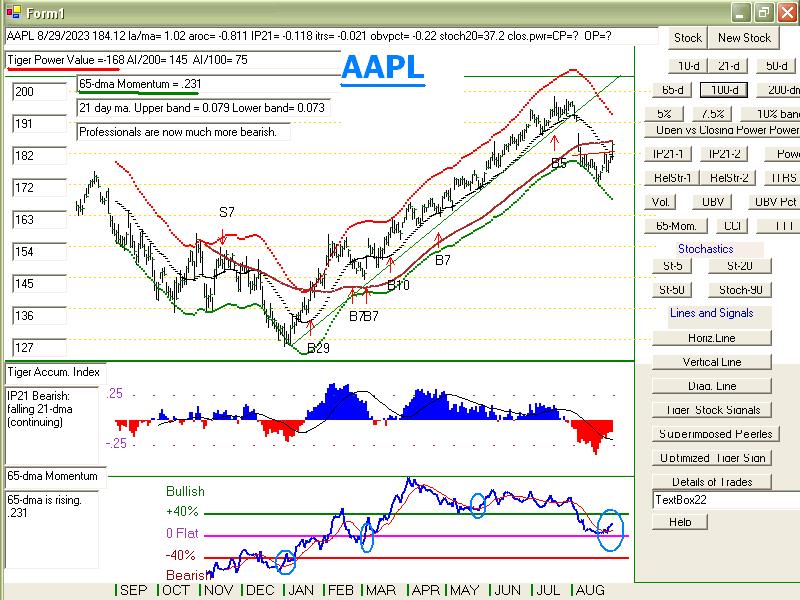 |
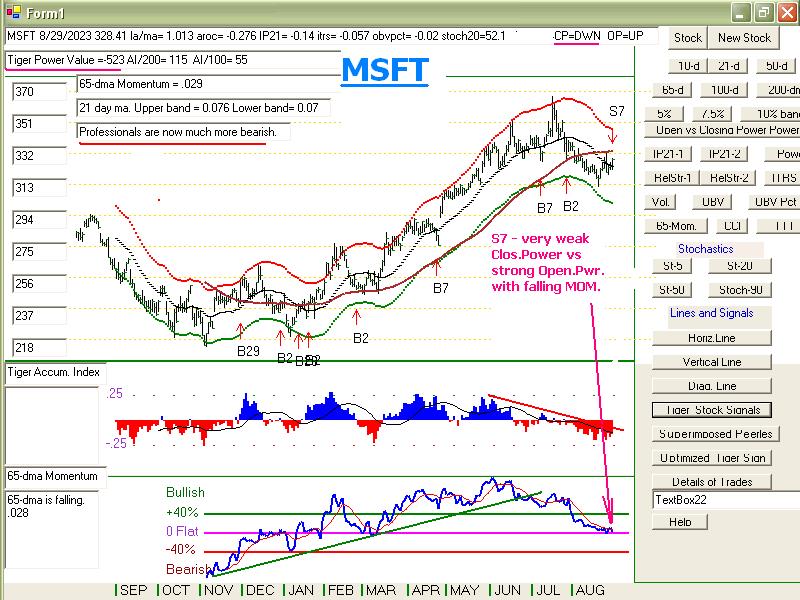 |
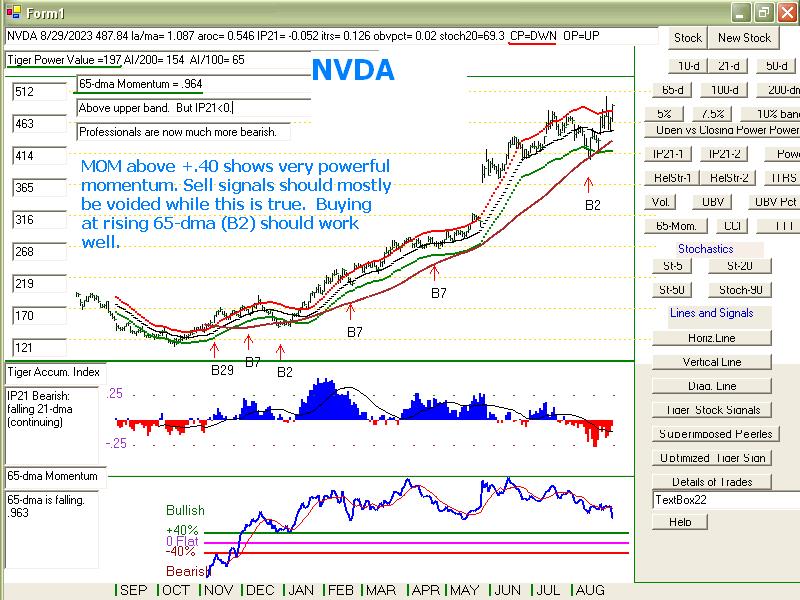 |
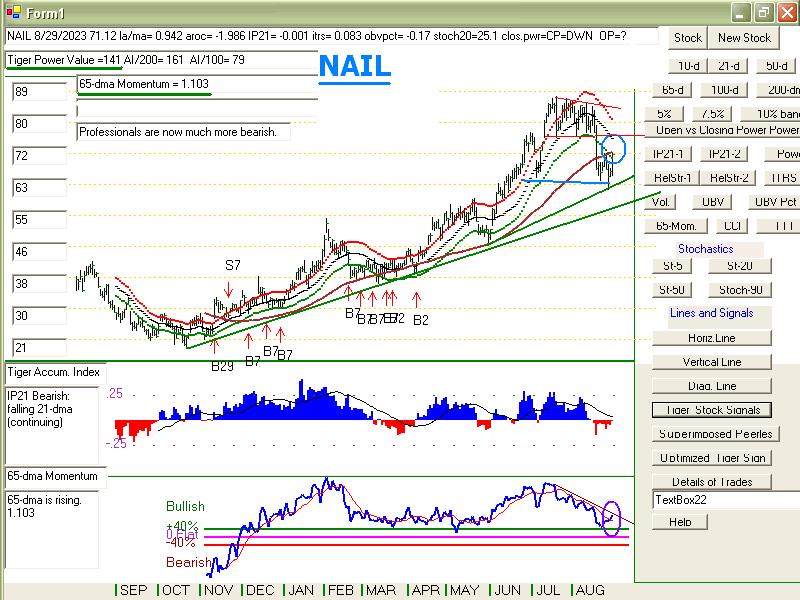 |
| NYSE |
Latest
Close |
Previous
Close |
Week
Ago |
| Issues
traded |
3,029 |
3,010 |
3,023 |
| Advances |
2,416 |
2,140 |
1,238 |
| Declines |
528 |
762 |
1,672 |
| Unchanged |
85 |
108 |
113 |
| New
highs |
65 |
50 |
37 |
| New
lows |
25 |
22 |
81 |
| Adv.
volume* |
617,006,511 |
520,217,461 |
265,591,937 |
| Decl.
volume* |
112,267,315 |
120,880,619 |
468,978,054 |
| Total
volume* |
737,031,982 |
659,043,835 |
745,097,847 |
| Closing
Arms (TRIN)† |
1.01 |
0.69 |
1.28 |
| Block
trades* |
3,532 |
3,231 |
3,942 |
| Adv.
volume |
2,726,559,500 |
2,306,073,160 |
1,269,598,670 |
| Decl.
volume |
600,430,033 |
566,643,383 |
2,194,705,633 |
| Total
volume |
3,354,821,575 |
2,957,236,058 |
3,522,763,017 |
| NASDAQ |
Latest
Close |
Previous
Close |
Week
Ago |
| Issues
traded |
4,501 |
4,450 |
4,509 |
| Advances |
3,109 |
2,625 |
1,764 |
| Declines |
1,199 |
1,623 |
2,529 |
| Unchanged |
193 |
202 |
216 |
| New
highs |
69 |
69 |
43 |
| New
lows |
130 |
175 |
242 |
| Closing
Arms (TRIN)† |
0.60 |
1.13 |
1.11 |
| Block
trades |
37,174 |
28,580 |
35,601 |
| Adv.
volume |
3,817,731,525 |
2,141,154,615 |
1,624,749,569 |
| Decl.
volume |
885,783,115 |
1,494,065,958 |
2,587,717,583 |
| Total
volume |
4,748,184,554 |
3,666,686,449 |
4,282,431,362 |
|
Table 2 TIGER QUICKSILVER on ETFS - 8/28/2023 ---
Bullish = 0
Bearish = 2 TAN (-.523) CORN
ETF       CLOSE     CHANGE    PIVOT-PT  5-dma AROC   CL-PWR  CANDLE  IP21    ITRS  POWER INDEX
=================================================================================================
DIA       348.62   2.91      344.83        82.4%     -------  BLUE  -.13      ====   ======
---------------------------------------------------------------------------------------------
COMPQX    13943.76   238.63  13721.03      161%      Bearish  BLUE  -.054    .002    -.052
---------------------------------------------------------------------------------------------
SPY       449.16   6.4       443.03        125.1%    -------  BLUE  -.074    .006    -.068
---------------------------------------------------------------------------------------------
QQQ       374.77   8.01      369.11        156.1%    Bearish  BLUE  -.067    .002    -.065
---------------------------------------------------------------------------------------------
MDY       482.41   6.6       474.87        135.7%    Bullish  BLUE  -.006    .009     .003
---------------------------------------------------------------------------------------------
IWM       188.23   2.59      185.79        119.2%    -------  BLUE   .01   -.004      .006
---------------------------------------------------------------------------------------------
FAS       66.32   1.7        63.38         363%      Bullish  BLUE   .004    .035     .039
---------------------------------------------------------------------------------------------
RETL      6.82   .32         6.63          304.6%    -------  BLUE  -.008    .004    -.004
---------------------------------------------------------------------------------------------
SOXL      23.07   1.65       22.6          404%      Bearish  BLUE  -.006   -.103    -.109
---------------------------------------------------------------------------------------------
TECL      51.68   2.88       49.78         462.9%    -------  BLUE  -.079   -.051    -.13
---------------------------------------------------------------------------------------------
IBB       129.47   1.37      128.03        85.4%     Bullish  BLUE  -.156   -.03     -.186
---------------------------------------------------------------------------------------------
GLD       179.87   1.74      177.89        106.2%    -------  BLUE  -.219   -.026    -.245
---------------------------------------------------------------------------------------------
DBO       16.17   .19        15.76         62.9%     Bullish  BLUE   .058    .119     .177
---------------------------------------------------------------------------------------------
OIH       339.44   3.05      335.35        108.2%    Bullish  BLUE  -.015    .212     .197
---------------------------------------------------------------------------------------------
CPER     23.65   .25         23.54         72.8%     Bullish  BLUE  -.178   -.026    -.204
---------------------------------------------------------------------------------------------
TAN     58.72   2.24         56.76         261%      -------  BLUE  -.218   -.21     -.428
---------------------------------------------------------------------------------------------
UUP       28.8  -.16         28.74        -6.9%      Bullish  RED    .018    .007     .025
---------------------------------------------------------------------------------------------
CORN      22.3  -.39         22.32         82.9%     -------  RED   -.121   -.157    -.278
---------------------------------------------------------------------------------------------
WEAT      5.98  -.15         6.29         -145.3%    -------  RED   -.075   -.145    -.22
---------------------------------------------------------------------------------------------
YINN      34.84   2          30.51         997.5%    -------  BLUE  -.01   -.187     -.197
|
 Table 3      RANKING OF KEY DIRECTORIES BASED PCT.OF STOCKS ABOVE 65-DMA
              8/29/23
 Bullish = 25
 Bearish = 23
---------------------------------------------------------------------------------------
Directory     Current       day-1         day-2         day-3         day-4         day-5
----------------------------------------------------------------------------------------
COAL           1             1             1             1             1             1
EDU            .833          .833          .666          .833          .833          .833
COMODITY       .815          .578          .5            .5            .552          .394
FOOD           .734          .612          .53           .53           .551          .448
INSURANC       .72           .6            .6            .64           .6            .56
OILGAS         .701          .68           .659          .618          .67           .701
BEVERAGE       .642          .642          .571          .5            .642          .5
HIGHPRIC       .64           .497          .432          .367          .558          .402
INDEXES        .583          .459          .356          .329          .502          .335
INFRA          .58           .451          .419          .387          .548          .387
NASD-100       .574          .435          .386          .356          .514          .386
GUNS           .571          .5            .428          .428          .642          .428
DOWJONES       .566          .5            .466          .433          .533          .433
RETAIL         .565          .456          .413          .456          .521          .478
ETFS           .563          .254          .2            .163          .29           .163
FIDSTKS        .556          .479          .414          .437          .473          .426
DJI-13         .538          .538          .615          .461          .615          .615
HOMEBLDG       .535          .392          .321          .321          .5            .357
CHEM           .534          .511          .418          .395          .372          .372
INDMATER       .527          .5            .444          .402          .444          .43
RUS-1000       .524          .438          .403          .393          .448          .388
NIFTY          .522          .386          .363          .272          .409          .295
SP500          .513          .435          .382          .378          .439          .366
SP-100         .511          .444          .411          .388          .433          .4
REIT           .508          .401          .303          .303          .311          .213
==============================================================================================
HACKERS        .5            .5            .437          .375          .437          .312
SOFTWARE       .5            .446          .41           .321          .392          .339
==============================================================================================
HOSPITAL       .461          .384          .307          .307          .384          .384
REGBANKS       .447          .421          .289          .394          .421          .263
GREEN          .444          .388          .388          .277          .333          .277
AUTO           .433          .339          .301          .32           .358          .32
COPPER         .428          .142          .142          .142          .285          .142
FINANCE        .4            .387          .325          .337          .35           .237
ELECTRON       .398          .338          .27           .285          .345          .285
SEMI           .38           .315          .228          .239          .326          .228
GOLD           .377          .244          .155          .222          .222          .111
TRANSP         .368          .368          .368          .368          .368          .368
COMPUTER       .35           .35           .25           .35           .35           .35
MILITARY       .346          .307          .269          .269          .384          .307
BIOTECH        .337          .309          .299          .281          .324          .289
CHINA          .317          .195          .195          .17           .219          .195
LOWPRICE       .302          .299          .293          .272          .316          .281
MARIJUAN       .3            .3            .3            .3            .3            .3
EAT            .292          .317          .268          .341          .39           .317
BIGBANKS       .285          .285          .142          .285          .285          .142
GAMING         .263          .21           .21           .21           .315          .157
UTILITY        .179          .179          .153          .153          .179          .128
JETS           .153          .153          .153          .076          .153          .153
BONDFUND       .091          .08           .08           .08           .103          .034
SOLAR          0             0             0             0             0             0
|
============================================================================
Tuesday 8/29/2023
5:10 AM Data used here is from 8/28/2023
DJI Futures +23
NASDAQ Futures +15
| |
8/28/2023
|
|
| |
Stay hedged with some short sales. The most bearish looking
MINCPs keep
falling. The DJI, SPY, QQQ and NASDAQ
all advanced, but
without much help from Professionals (the
Closing Powers
remain in downtrends.) or from "big money",
as shown by our
IP21s.
The divergence between the rising Opening Powers and falling
Closing Powers
has reach epic proportions in some stocks.
This is usually
bearish, though sometimes it takes a month of
S7s to complete a
top. Look at our XP charts, like NVDA
recently.
See the multiple Sell S7s above prices in lots of stocks
as they topped
out. The S7s will be shown on the new Windows10
charts here
tomorrow night. They have not yet been programmed.
While, the market
tends to advance just before the Labor Day
(Monday,
September 4th), it appears too much money is trying
to go into
a few big tech stocks. Buy the inability of MSFT and
AAPL to
make a convincing turn-around is a problem at this
point.
Their recoveries, as with SPY, QQQ and the NASDAQ
as a whole,
are dependent solely on higher openings, something which
is missing
this morning even though the DJI closed above its
65-dma.
Normally, this would be a bullish development..
It would be
"nice" if all of our indicators and signals pointed
the same way.
That is not true now. Thus even though the
DJI was able to
rise back above its rising 65-dma, it still shows
what could
develop into a head and shoulders top AND,
bearishly its
Accumulation (IP21) indicator is negative and
its Closing Power
is unable to rise much. This was a low volume
rally achieved by
a higher opening. This has become the pattern
for the last 10
days, or so. As such it has to be suspect.
Still, at least
the breadth was good Monday on the NYSE. There were
700 more up than
down. Confusing matters more, while FED officials
are hinting that
the present level of rates could stay in place for the
rest of the year,
Short-Term
Rates rose again today and Bond Funds
can't get any
traction.
Tiger Buy B2s - Buys within 1% of a rising 65-dma.
The XP Tiger
programs give Buy B2s when a stock falls back to
its rising 21-dma
provided the IP21 is positive and the Closing Power
is not weak
compared to the Opening Power. I am experimenting with
a new idea,
namely that a reading from the annualized 65-dma rate of
change (MOM)
above +.35 allows a Buy B2 to appear even though there
is a potential
head/shoulders developing and even though the Closing
Power is weaker
than the Opening Power and the IP21 is negative.
Look at the VBNet
Tiger year charts below. You will see a few recent
Buy B2s. If
you take them, work with a stop just below the necklines
shown in their
charts below and be hedged with some of our bearish
MINCPs. |
|
| |
8/28/2026
2022 PEERLESS DJI, Signals, Indicators Daily DJI Volume
10-DayUp/Down Vol Stoch-20 CCI RSI Pct of All Stocks above 65-dma
Inverted Traders Index
DJI-IPA DJI-OBV
NASDAQ S&P OEX NYSE DJ-15 DJ-20 DJI-30
Old Peerless- 2006
version
Tiger Index of Big
Banks Bond Funds Gold Stocks Housing Stocks
Insurance-Stocks
Regional
Banks Russell-1000
Semi Conductors
ETFs: DIA QQQ SPY IWM MDY
TNA Short-Term Rates Ten Year Rates PST (Short Treasuries)
DOLLAR-UUP
ALLSTOCKs
COIN (Bit
Coin ETF)
USO-CrudeOil DBO BLDP FAS GLD HD IBB JETS JNUG KOL NAIL
NUGT NRGU OIH PALL RSX RETL SDS AGQ SLV SOXL TAN |
TECL TLT TMF TNA UGA USO
China: YINN
CHAU BABA BIDU
Commodities:
CANE
COCO CORN DBC CORN, CUT (paper)
MOO, NRGU
SOYB WEAT UUP (Dollar) LIT
(Lithium) PALL
(Palladium)
Stocks: AA AAPL ADBE AMAT AMGN AMD AMZN ANET AXP BA BAC
BSX CAT CDNS CHKP CNX CPB CRM CVX CMG DE DIS ENPH FB
FSLR FTNT GILD GME GOOG GS HD IBM INTU JPM KO KR LRCX
MRK MRNA MOS MSFT NEM NFLX NKE NOC NUE NVDA PANW PG
PYPL QCOM QDEL REGN REV RE SCHW SNOW SO SQUARE TSLA
TXN XOM V VRTX WFC WMT XLE ZM ZOM
SEMI-Condctors in SOXL:
NVDA. AVGO, AMD. INTC LRCX TXN MCHP NXPI AMAT ON AAOI TSM
HOMEBUILDERS: BLDP NAIL
BZH HOV LEN MHO MTH PHM -
REGIONAL BANKS:
EGBN
FFIC GBCI HMST
Carl Icahn and associates: IEP
MS
JEF
Leveraged Short ETFs:
FAZ - financials, TZA and SRTY- small caps, MZZ - mid caps, TECS -Techs,
SOXS -
semi-conductors LABD
- Biotechs
Bullish MAXCPs http://tigersoftware.com/upping/8-28-2023/Bullish.htm
Bearish MINCPs www.tigersoftware.com/downing/8-28-2023/Bearish.htm |
|
 |
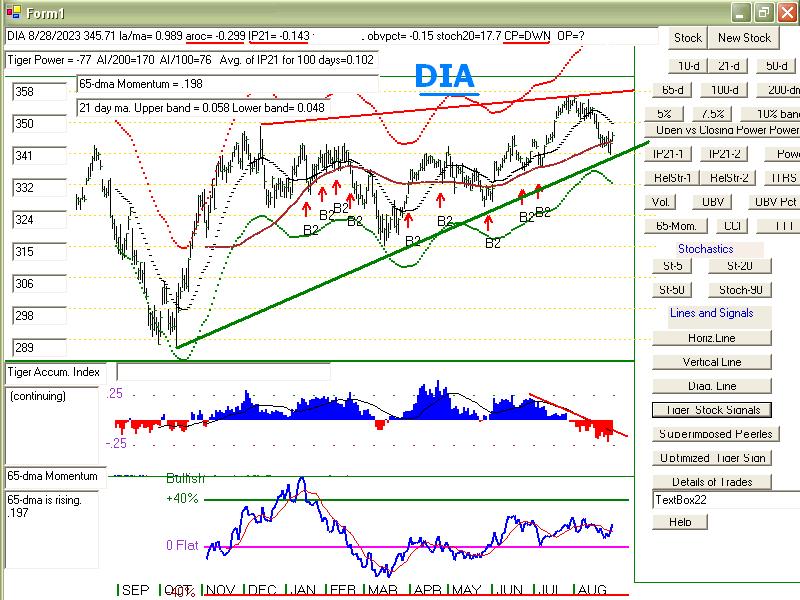 |
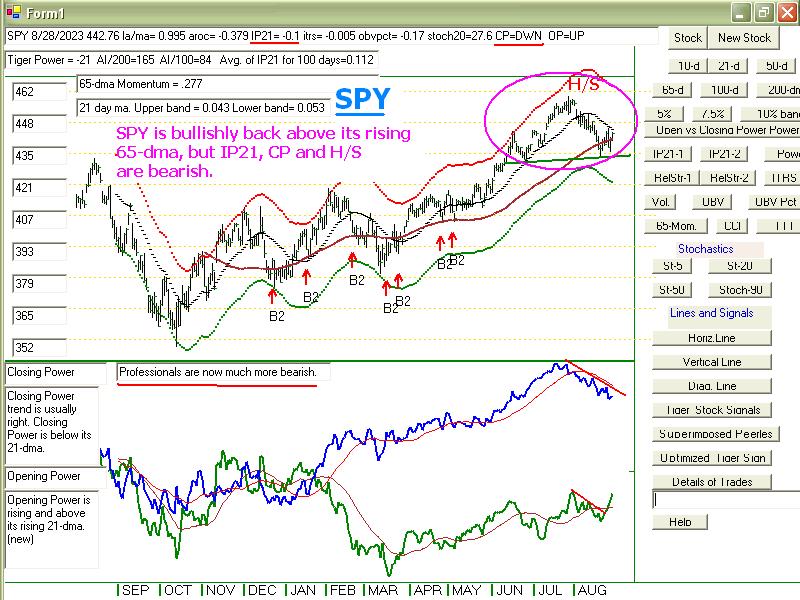 |
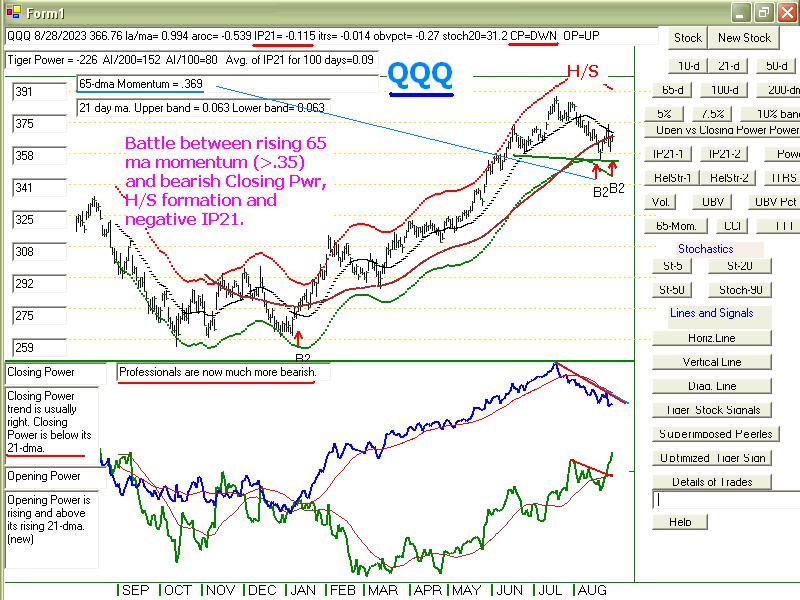 |
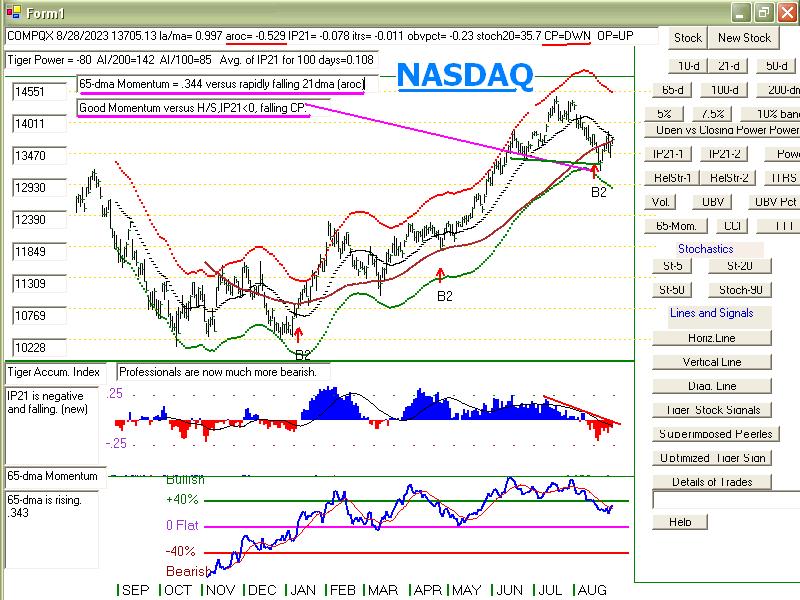 |
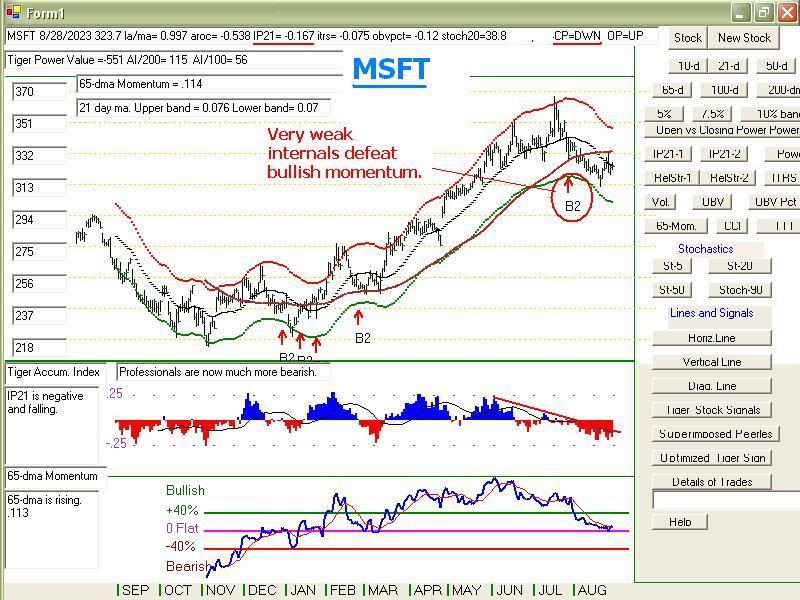 |
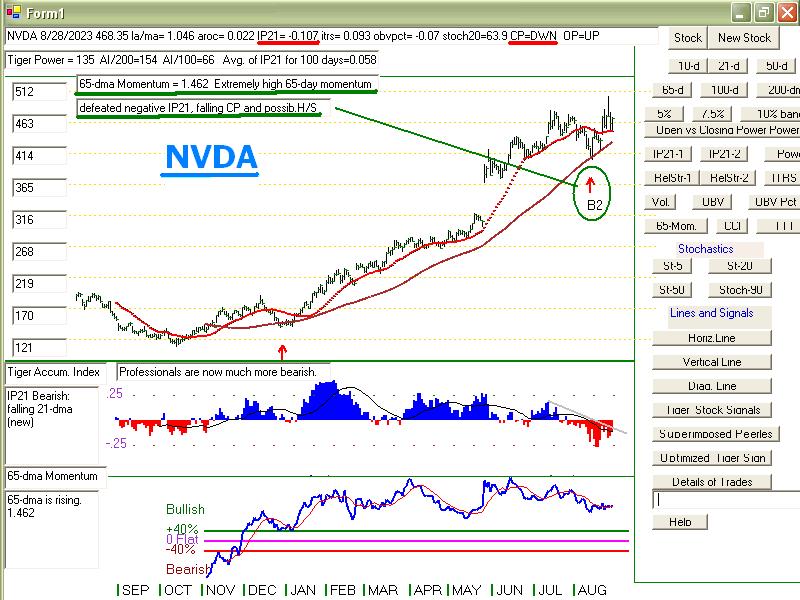 |
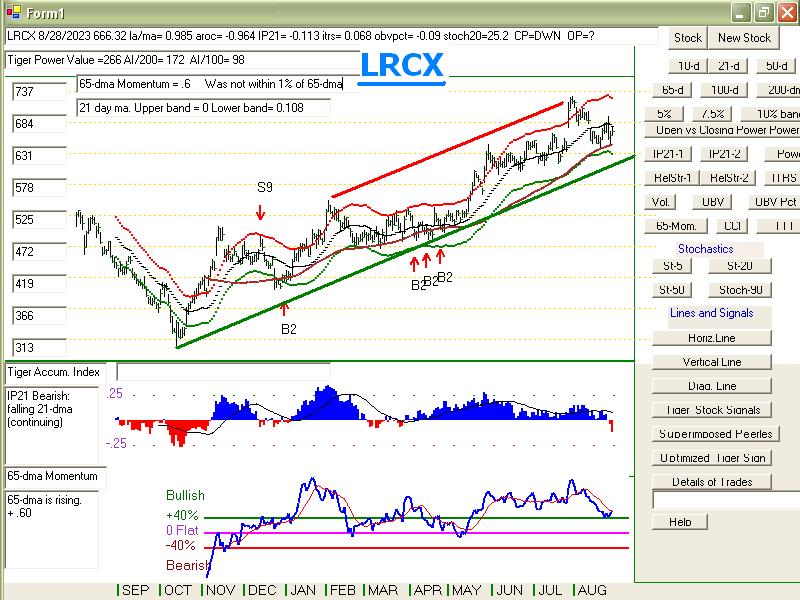 |
 |
 |
| NYSE |
Latest
Close |
Previous
Close |
Week
Ago |
| Issues
traded |
3,010 |
2,988 |
3,023 |
| Advances |
2,140 |
1,715 |
1,113 |
| Declines |
762 |
1,133 |
1,804 |
| Unchanged |
108 |
140 |
106 |
| New
highs |
50 |
25 |
31 |
| New
lows |
22 |
66 |
87 |
| Adv.
volume* |
520,217,461 |
451,469,168 |
369,863,789 |
| Decl.
volume* |
120,880,619 |
276,562,838 |
426,626,740 |
| Total
volume* |
659,043,835 |
742,383,629 |
805,236,928 |
| Closing
Arms (TRIN)† |
0.69 |
0.93 |
0.66 |
| Block
trades* |
3,231 |
3,369 |
4,074 |
| Adv.
volume |
2,306,073,160 |
1,990,023,668 |
1,776,635,483 |
| Decl.
volume |
566,643,383 |
1,226,091,480 |
1,895,554,544 |
| Total
volume |
2,957,236,058 |
3,296,182,945 |
3,726,855,043 |
| NASDAQ |
Latest
Close |
Previous
Close |
Week
Ago |
| Issues
traded |
4,450 |
4,450 |
4,531 |
| Advances |
2,625 |
2,325 |
2,072 |
| Declines |
1,623 |
1,917 |
2,262 |
| Unchanged |
202 |
208 |
197 |
| New
highs |
69 |
33 |
44 |
| New
lows |
175 |
211 |
215 |
| Closing
Arms (TRIN)† |
1.13 |
0.73 |
0.76 |
| Block
trades |
28,580 |
26,661 |
35,521 |
| Adv.
volume |
2,141,154,615 |
2,446,791,394 |
2,367,794,566 |
| Decl.
volume |
1,494,065,958 |
1,467,389,182 |
1,958,546,815 |
| Total
volume |
3,666,686,449 |
3,970,063,909 |
4,363,077,964 |
|
Table 2 TIGER QUICKSILVER on ETFS - 8/28/2023 ---
Bullish = 0
Bearish = 3 GLD TAN (-.523) YINN
ETF       CLOSE     CHANGE    PIVOT-PT  5-dma AROC   CL-PWR  CANDLE  IP21    ITRS  POWER INDEX
=================================================================================================
DIA       345.71   2.21      342.96        15.1%      -------  BLUE  -.143    0       -----
---------------------------------------------------------------------------------------------
COMPQX    13705.13   114.48  13505.87      76.6%      Bearish  BLUE  -.077   -.008    -.085
---------------------------------------------------------------------------------------------
SPY       442.76   2.79      438.15        38.9%      Bearish  BLUE  -.1   -.002      -.102
---------------------------------------------------------------------------------------------
QQQ       366.76   2.74      363.38        39.3%      Bearish  RED   -.115   -.012    -.127
---------------------------------------------------------------------------------------------
MDY       475.81   4.13      469.59        42.9%      -------  BLUE  -.029    .001    -.028
---------------------------------------------------------------------------------------------
IWM       185.64   1.64      183.83        34.2%      -------  BLUE   .012   -.012     0
---------------------------------------------------------------------------------------------
FAS       64.62   1.12       61.73         90.5%      Bullish  BLUE  -.021    .016    -.005
---------------------------------------------------------------------------------------------
RETL      6.5   .23          6.43         -422.3%     -------  BLUE   .004   -.075    -.071
---------------------------------------------------------------------------------------------
SOXL      21.42   .76        21.35        -107.6%     Bearish  BLUE  -.043   -.177    -.22
---------------------------------------------------------------------------------------------
TECL      48.8   1.09        47.24         142.6%     -------  BLUE  -.116   -.114    -.23
---------------------------------------------------------------------------------------------
IBB       128.1   .52        127.29        34.1%      Bullish  ----  -.208   -.031    -.239
---------------------------------------------------------------------------------------------
GLD       178.13   .51       176.1         65.5%      Bearish  BLUE  -.321   -.024    -.345
---------------------------------------------------------------------------------------------
DBO       15.98  -.02        15.97        -18.9%      -------  ----   .025    .133     .158
---------------------------------------------------------------------------------------------
OIH       336.39   5.25      332.23        0%         -------  BLUE  -.022    .205     .183
---------------------------------------------------------------------------------------------
CPER     23.4   .16          23.31         64.4%      Bullish  BLUE  -.054   -.027    -.081
---------------------------------------------------------------------------------------------
TAN     56.48   .31          55.79         8.9%       Bearish  RED   -.292   -.231    -.523
---------------------------------------------------------------------------------------------
UUP       28.96  -.05        28.84         38.1%      Bullish  ----   .134    .028     .162
---------------------------------------------------------------------------------------------
CORN      22.69   .4         21.93         132.9%     -------  BLUE  -.103   -.097    -.2
---------------------------------------------------------------------------------------------
WEAT      6.13  -.01         6.16         -16.1%      Bearish  ----  -.081   -.081    -.162
---------------------------------------------------------------------------------------------
YINN      32.84   2.13       28.71         687.2%     -------  BLUE  -.017   -.235    -.252
|
Table 3       RANKING OF KEY DIRECTORIES BASED PCT.OF STOCKS ABOVE 65-DMA
               8/28/23
BULLISH = 9
BEARISH = 36
---------------------------------------------------------------------------------------
Directory     Current       day-1         day-2         day-3         day-4         day-5
----------------------------------------------------------------------------------------
COAL           1             1             1             1             1             1
EDU            .833          .666          .833          .833          .833          .833
OILGAS         .68           .659          .618          .67           .701          .69
BEVERAGE       .642          .571          .5            .642          .5            .5
FOOD           .612          .551          .51           .551          .428          .428
INSURANC       .6            .6            .64           .6            .56           .64
COMODITY       .578          .526          .473          .552          .394          .394
DJI-13         .538          .615          .461          .615          .615          .615
CHEM           .511          .418          .395          .372          .395          .418
============================================================================================
DOWJONES       .5            .466          .433          .533          .433          .5
GUNS           .5            .428          .428          .642          .428          .571
HACKERS        .5            .437          .375          .437          .312          .312
INDMATER       .5            .444          .402          .444          .444          .458
============================================================================================
HIGHPRIC       .497          .432          .367          .558          .406          .411
FIDSTKS        .479          .414          .437          .473          .426          .431
SOFTWARE       .464          .428          .321          .392          .321          .321
INDEXES        .459          .356          .329          .502          .351          .416
RETAIL         .456          .413          .456          .521          .5            .608
INFRA          .451          .419          .387          .548          .387          .419
SP-100         .444          .411          .388          .433          .4            .433
RUS-1000       .439          .403          .392          .448          .392          .407
NASD-100       .435          .386          .356          .514          .396          .415
SP500          .435          .382          .378          .437          .37           .397
REGBANKS       .421          .289          .394          .421          .289          .526
REIT           .401          .286          .311          .319          .204          .204
HOMEBLDG       .392          .321          .321          .5            .357          .25
GREEN          .388          .388          .277          .333          .277          .277
FINANCE        .387          .325          .337          .337          .237          .375
NIFTY          .386          .363          .272          .409          .295          .295
HOSPITAL       .384          .307          .307          .384          .384          .384
TRANSP         .368          .368          .368          .368          .368          .368
COMPUTER       .35           .25           .35           .35           .35           .35
AUTO           .339          .32           .32           .358          .32           .339
ELECTRON       .338          .27           .285          .345          .278          .308
EAT            .317          .268          .341          .39           .317          .317
SEMI           .315          .228          .239          .326          .228          .26
BIOTECH        .307          .296          .284          .324          .291          .284
MILITARY       .307          .269          .269          .384          .307          .23
MARIJUAN       .3            .3            .3            .3            .3            .3
LOWPRICE       .299          .296          .275          .316          .278          .287
BIGBANKS       .285          .142          .285          .285          .142          .285
ETFS           .254          .2            .163          .29           .181          .127
GOLD           .244          .155          .222          .222          .111          .088
GAMING         .21           .21           .157          .368          .157          .263
CHINA          .195          .195          .17           .219          .195          .195
UTILITY        .179          .153          .153          .179          .128          .128
JETS           .153          .153          .076          .153          .153          .153
COPPER         .142          .142          .142          .285          .142          .142
BONDFUND       .08           .068          .08           .114          .045          .034
SOLAR          0             0             0             0             0             0
|
====================================================================================
Monday 8/28/2023 6:06 AM
Data used here is from 8/25/2023
DJI Futures
+ 111 NASDAQ Futures +63
| |
8/25/2026
|
|
| |
Market Comments
Watch to see if SPY can
rally above its right shoulder peak.
Short more Bearish
MINCPs if the 65-dma of QQQ and
the NASDAQ turn down.
A rally is shaping up.
The risk remains that the Ten Year rates
will break out above
4.5% in September and reach the scary 5%
level. This is
why Retail stocks are so well-represented among
our Bearish Mincps and
why this group should be used for hedging
purposes.
It is very important
now for the bulls to get prices not only to rally
this morning, but to
stay up and even go still higher. The danger
is that Professionals
(Closing Power) and Big Money (IP21) will
again turn early
strength into a decline. And that could cause
the DJI to break its
key uptrendline and cause SPY to complete
its bearish looking
head and shoulders.
Expect techs to
resume their rally. But if they also fail there
is a real danger that
their 65-dma will stop rising and turn down.
Their tilting down
would be dangerous because that moving average
would then be more
reliable resistance. Given their negative IP21s,
falling Closing Powers
and negative Power scores, this would
set up QQQ and the
NASDAQ for a serious decline in the
bearish month of
September. See the yearly charts below which
emphasize the 65-dma.
Prices breaking below or down from
a falling 65-dma with
negative IP21 give very reliable Sells at
this point. But
as long as the annualized 65-dma are rising at
a rate above 40%, the
odds favor a recovery back above the
65-dma. See how
NVDA bounced up from its 65-dma despite
a negative IP21.
The new software allows me to develop and
show more tools.
MOM(i) is the 65-dma daily rate of change
multiplied by 100.
Essentially, it is the derivative of the 65-dma.
There many more bearish
looking MINCPs than Bullish MAXCPs.
Stay hedged, but try to
stay long mainly stocks with a clearly rising
21-dma and positive
IP21. Avoid ones with head and shoulders
patterns.
|
|
| |
8/25/2026
2022 PEERLESS DJI, Signals, Indicators Daily DJI Volume
10-DayUp/Down Vol Stoch-20 CCI RSI Pct of All Stocks above 65-dma
Inverted Traders Index
DJI-IPA DJI-OBV
NASDAQ S&P OEX NYSE DJ-15 DJ-20 DJI-30
Old Peerless- 2006
version
Tiger Index of Big
Banks Bond Funds Gold Stocks Housing Stocks
Insurance-Stocks
Regional
Banks Russell-1000
Semi Conductors
ETFs: DIA QQQ SPY IWM MDY
TNA Short-Term Rates Ten Year Rates PST (Short Treasuries)
DOLLAR-UUP
ALLSTOCKs
COIN (Bit
Coin ETF)
USO-CrudeOil DBO BLDP FAS GLD HD IBB JETS JNUG KOL NAIL
NUGT NRGU OIH PALL RSX RETL SDS AGQ SLV SOXL TAN |
TECL TLT TMF TNA UGA USO
China: YINN
CHAU BABA BIDU
Commodities:
CANE
COCO CORN DBC CORN, CUT (paper)
MOO, NRGU
SOYB WEAT UUP (Dollar) LIT
(Lithium) PALL
(Palladium)
Stocks: AA AAPL ADBE AMAT AMGN AMD AMZN ANET AXP BA BAC
BSX CAT CDNS CHKP CNX CPB CRM CVX CMG DE DIS ENPH FB
FSLR FTNT GILD GME GOOG GS HD IBM INTU JPM KO KR LRCX
MRK MRNA MOS MSFT NEM NFLX NKE NOC NUE NVDA PANW PG
PYPL QCOM QDEL REGN REV RE SCHW SNOW SO SQUARE TSLA
TXN XOM V VRTX WFC WMT XLE ZM ZOM
SEMI-Condctors in SOXL:
NVDA. AVGO, AMD. INTC LRCX TXN MCHP NXPI AMAT ON AAOI TSM
HOMEBUILDERS: BLDP NAIL
BZH HOV LEN MHO MTH PHM -
REGIONAL BANKS:
EGBN
FFIC GBCI HMST
Carl Icahn and associates: IEP
MS
JEF
Leveraged Short ETFs:
FAZ - financials, TZA and SRTY- small caps, MZZ - mid caps, TECS -Techs,
SOXS -
semi-conductors LABD
- Biotechs
Bullish MAXCPs http://tigersoftware.com/upping/8-25-2023/Bullish.htm
Bearish MINCPs www.tigersoftware.com/downing/8-25-2023/Bearish.htm |
|
 |
 |
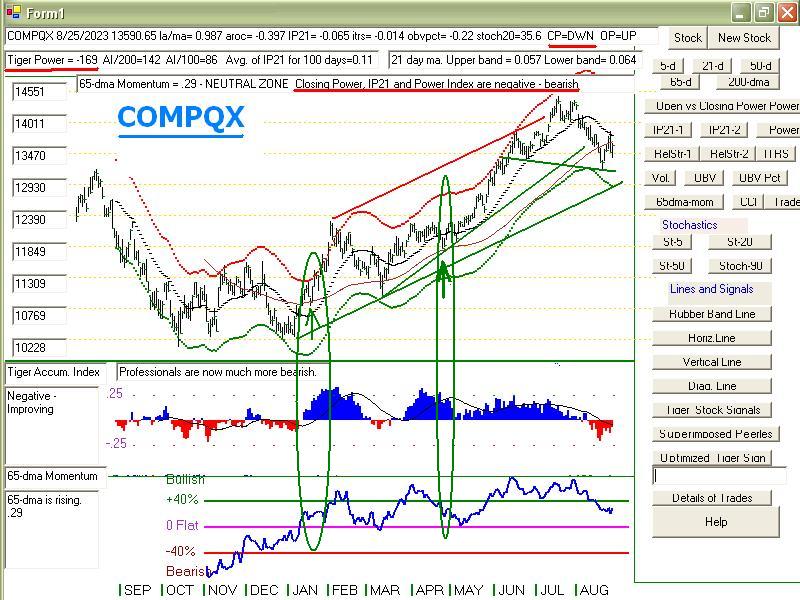 |
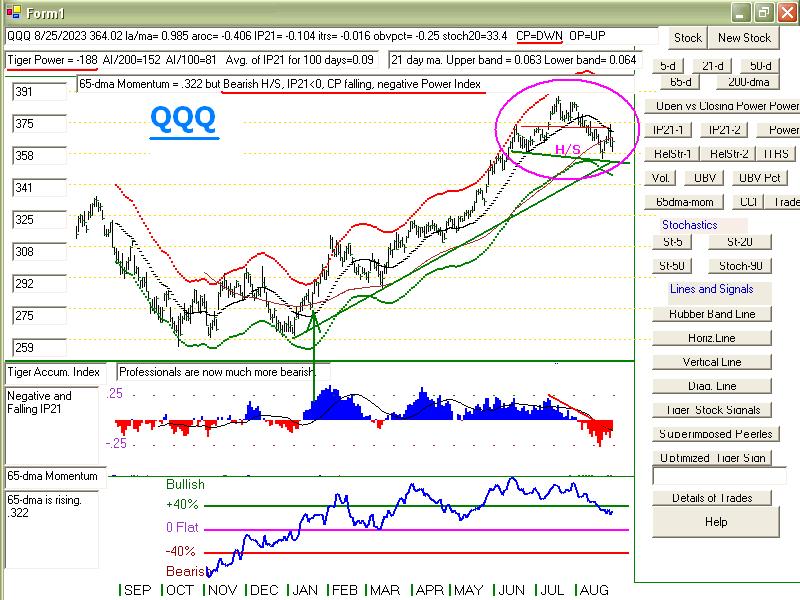 |
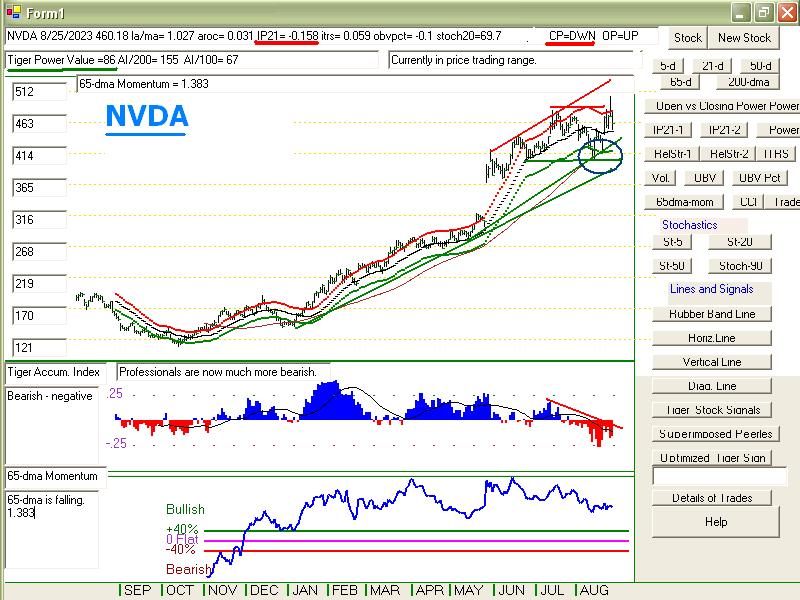 |
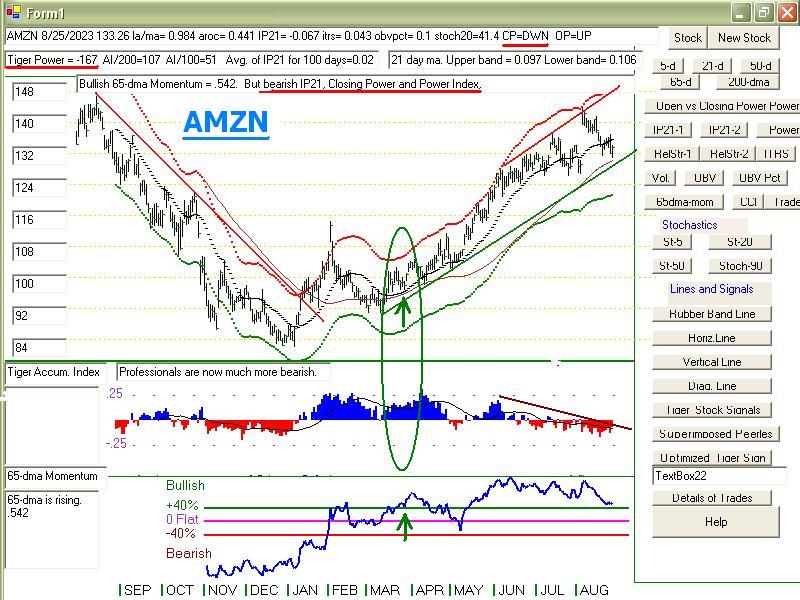 |
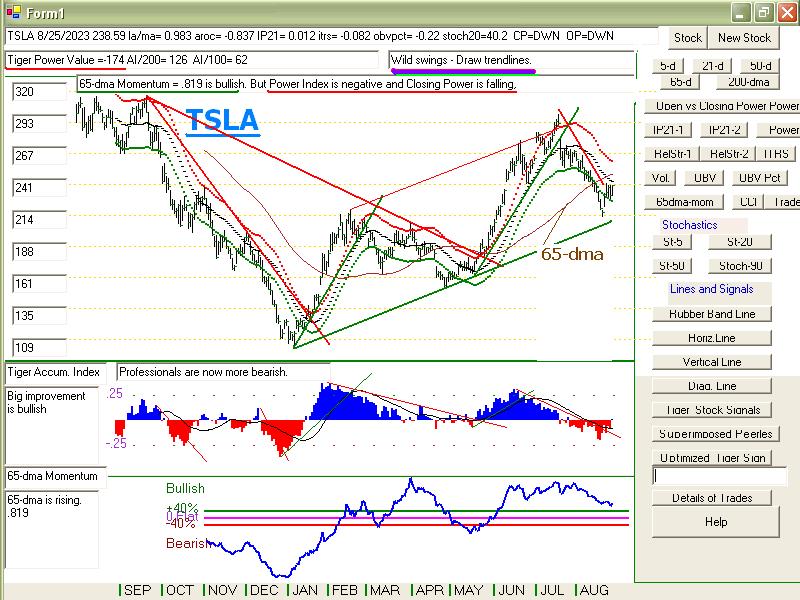 |
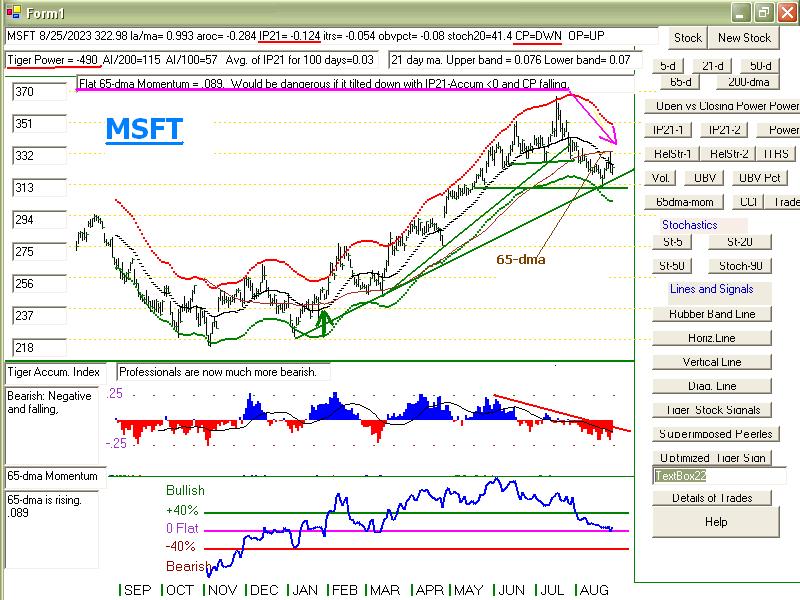 |
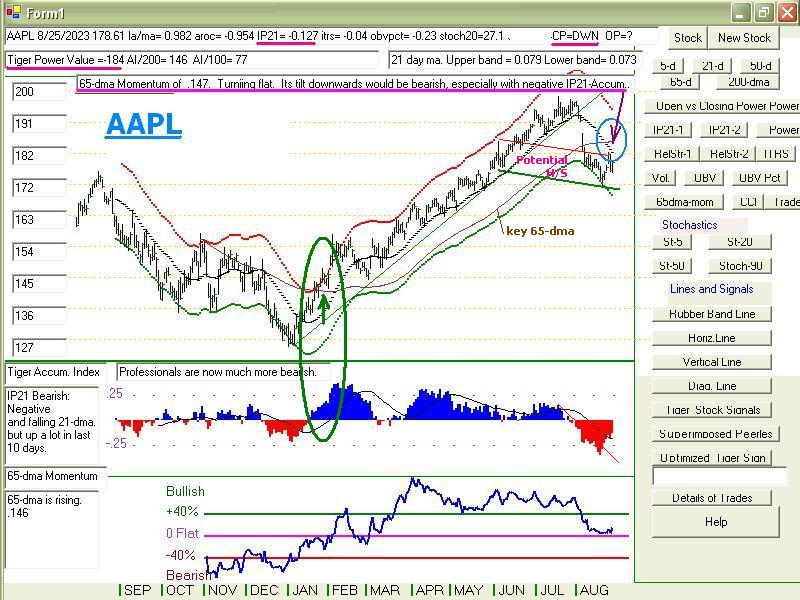 |
 |
 |
 |
Table 1 - Daily Breadth and Volume Statistics
| NYSE |
Latest
Close |
Previous
Close |
Week
Ago |
| Issues
traded |
2,988 |
2,998 |
2,995 |
| Advances |
1,715 |
728 |
1,618 |
| Declines |
1,133 |
2,174 |
1,243 |
| Unchanged |
140 |
96 |
134 |
| New
highs |
25 |
32 |
16 |
| New
lows |
66 |
75 |
92 |
| Adv.
volume* |
451,469,168 |
391,703,132 |
573,494,361 |
| Decl.
volume* |
276,562,838 |
597,928,728 |
343,863,593 |
| Total
volume* |
742,383,629 |
1,009,340,149 |
937,388,762 |
| Closing
Arms (TRIN)† |
0.93 |
0.81 |
0.91 |
| Block
trades* |
3,369 |
4,060 |
4,664 |
| Adv.
volume |
1,990,023,668 |
1,068,526,498 |
2,247,126,102 |
| Decl.
volume |
1,226,091,480 |
2,594,092,249 |
1,574,707,119 |
| Total
volume |
3,296,182,945 |
3,723,470,724 |
3,940,404,137 |
| NASDAQ |
Latest
Close |
Previous
Close |
Week
Ago |
| Issues
traded |
4,450 |
4,475 |
4,434 |
| Advances |
2,325 |
1,209 |
2,306 |
| Declines |
1,917 |
3,101 |
1,950 |
| Unchanged |
208 |
165 |
178 |
| New
highs |
33 |
45 |
32 |
| New
lows |
211 |
225 |
262 |
| Closing
Arms (TRIN)† |
0.73 |
1.69 |
1.00 |
| Block
trades |
26,661 |
32,901 |
37,980 |
| Adv.
volume |
2,446,791,394 |
812,939,799 |
2,585,925,621 |
| Decl.
volume |
1,467,389,182 |
3,530,201,745 |
2,183,940,294 |
| Total
volume |
3,970,063,909 |
4,383,829,114 |
4,801,913,192 |
|
Table 2 TIGER QUICKSILVER on ETFS - 8/25/2023 ---
Bullish = 1 UUP
Bearish = 4 SOXL GLD TAN (-.481) CORN
ETF       CLOSE     CHANGE    PIVOT-PT  5-dma AROC   CL-PWR  CANDLE  IP21    ITRS  POWER INDEX
=================================================================================================
DIA       343.5   2.47       344.67       -23.6%     Bearish  BLUE  -.146    0       ------
---------------------------------------------------------------------------------------------
COMPQX    13590.65   126.68  13497.59      111.1%    -------  BLUE  -.065   -.012    -.077
---------------------------------------------------------------------------------------------
SPY       439.97   3.08      439.34        39.5%     Bearish  BLUE  -.091   -.003    -.094
---------------------------------------------------------------------------------------------
QQQ       364.02   2.8       363.9         81.1%     Bearish  BLUE  -.103   -.014    -.117
---------------------------------------------------------------------------------------------
MDY       471.68   1.95      471.76        3.3%      -------  RED   -.026   -.005    -.031
---------------------------------------------------------------------------------------------
IWM       184   .78          184.38       -17.6%     -------  ----   .03    -.019     .011
---------------------------------------------------------------------------------------------
FAS       63.5   .61         63.48        -8.7%      -------  ----  -.027    .029     .002
---------------------------------------------------------------------------------------------
RETL      6.27   .09         7.05         -708.7%    -------  ----   .016   -.073    -.057
---------------------------------------------------------------------------------------------
SOXL      20.66   .25        21.88         119.8%    Bearish  BLUE  -.043   -.234    -.277
---------------------------------------------------------------------------------------------
TECL      47.71   1.45       47.44         303.5%    -------  BLUE  -.138   -.106    -.244
---------------------------------------------------------------------------------------------
IBB       127.58   .72       127.23        85.5%     Bullish  BLUE  -.141   -.03     -.171
---------------------------------------------------------------------------------------------
GLD       177.62  -.23       175.81        64.8%     Bearish  ----  -.317   -.026    -.343
---------------------------------------------------------------------------------------------
DBO       16   .23           16.04        -25.1%     -------  ----   .064    .156     .22
---------------------------------------------------------------------------------------------
OIH       331.14  -.3        336.39       -113%      -------  RED   -.001    .203     .202
---------------------------------------------------------------------------------------------
CPER     23.24  -.03         23.1          55.9%     Bullish  ----  -.048   -.028    -.076
---------------------------------------------------------------------------------------------
TAN     56.17   .67          56.38        -74.6%     -------  BLUE  -.256   -.225    -.481
---------------------------------------------------------------------------------------------
UUP       29.01   .04        28.74         41.6%     Bullish  ----   .185    .017     .202
---------------------------------------------------------------------------------------------
CORN      22.29  -.07        22.1         -51.7%     -------  RED   -.177   -.088    -.265
---------------------------------------------------------------------------------------------
WEAT      6.14  -.11         6.15         -120.4%    Bearish  RED   -.093   -.042    -.135
---------------------------------------------------------------------------------------------
YINN      30.71  -.16        28.73         306.3%    -------  ----   .005   -.245    -.24
|
Table 3       RANKING OF KEY DIRECTORIES BASED PCT.OF STOCKS ABOVE 65-DMA
              8/25/23
Bullish = 7
Bearish = 43
---------------------------------------------------------------------------------------
Directory     Current       day-1         day-2         day-3         day-4         day-5
----------------------------------------------------------------------------------------
COAL           1             1             1             1             1             1
EDU            .666          .833          .833          .833          .833          .833
OILGAS         .659          .618          .67           .701          .69           .711
DJI-13         .615          .461          .615          .615          .615          .615
INSURANC       .6            .64           .6            .56           .64           .68
BEVERAGE       .571          .5            .642          .5            .5            .5
FOOD           .551          .53           .53           .428          .428          .428
COMODITY       .526          .5            .526          .394          .394          .394
==============================================================================================
DOWJONES       .466          .433          .533          .433          .5            .466
SOFTWARE       .446          .339          .392          .321          .303          .303
INDMATER       .444          .402          .444          .444          .458          .5
HACKERS        .437          .375          .437          .312          .312          .312
HIGHPRIC       .432          .367          .558          .406          .428          .372
GUNS           .428          .428          .642          .428          .571          .571
INFRA          .419          .387          .548          .387          .419          .451
CHEM           .418          .395          .372          .395          .418          .465
FIDSTKS        .414          .437          .473          .426          .437          .443
RETAIL         .413          .456          .521          .5            .608          .652
SP-100         .411          .388          .433          .4            .444          .455
RUS-1000       .404          .392          .447          .392          .413          .42
GREEN          .388          .277          .333          .277          .277          .277
NASD-100       .386          .356          .514          .396          .425          .366
SP500          .382          .378          .437          .368          .401          .411
TRANSP         .368          .368          .368          .368          .368          .368
NIFTY          .363          .272          .409          .295          .318          .295
INDEXES        .356          .329          .502          .351          .432          .389
FINANCE        .325          .337          .337          .225          .375          .425
HOMEBLDG       .321          .321          .5            .357          .25           .357
AUTO           .32           .339          .358          .32           .339          .339
HOSPITAL       .307          .307          .384          .384          .384          .384
MARIJUAN       .3            .3            .3            .3            .3            .4
LOWPRICE       .296          .278          .319          .278          .284          .31
BIOTECH        .294          .281          .327          .291          .286          .263
REGBANKS       .289          .394          .421          .289          .526          .552
REIT           .286          .295          .327          .213          .204          .278
ELECTRON       .27           .285          .345          .278          .315          .27
MILITARY       .269          .269          .384          .307          .23           .269
EAT            .268          .341          .39           .317          .317          .341
COMPUTER       .25           .35           .35           .35           .35           .35
SEMI           .228          .239          .326          .228          .282          .195
GAMING         .21           .157          .315          .21           .263          .263
ETFS           .2            .163          .29           .181          .145          .109
CHINA          .195          .17           .219          .195          .195          .219
GOLD           .155          .222          .222          .111          .088          .088
JETS           .153          .076          .153          .153          .153          .153
UTILITY        .153          .153          .179          .128          .153          .153
BIGBANKS       .142          .285          .285          .142          .285          .285
COPPER         .142          .142          .285          .142          .142          .142
BONDFUND       .068          .068          .114          .057          .045          .034
SOLAR          0             0             0             0             0             0
|
====================================================================================
Friday 8/25/2023 6:06 AM Data used
here is from 8/24/2023
DJI Futures + 158 NASDAQ Futures + 45
| |
8/24/2023
|
|
| |
Daily Comments
Today is Powell's big
day. Expect lots of volatility. Hedging
with Bearish MINCPs is
advised..
One expects
profit-taking when much expected bullish news comes
out. Certainly,
after a three-day rally, traders were bound
to do some selling in
NVDA and other semi-conductors and
tech stocks.
Yesterday's very big drop in the tech sector also
owed to the potential
head/shoulders patterns in QQQ, the
NASDAQ, SPY and NYSE.
Why was the decline so much
bigger?.
Traders, I think, are
worried that Fed Chairman Powell will remain
very hawkish. See
how "toppy" the bond funds look
below:. Note the
heavy red distribution and prices breaking below
support. Next
look at the Tiger chart of the Ten Tear Rates. The
Closing Power is rising
and there is Blue Accumulation. Professionals
are expecting a
breakout to new highs, and quite likely a 5%
yield on the 10-year
bond. That's why the market sold
off so badly and the
DJI fell below its 65-dma support.
This also explains the
many "horrid" looking bearish MINCPs
we see now.
Retailers and movie stocks were hit hard again
today. Solar
energy stocks fell, too. Unless Powell and his
acolytes do something
"dovish" quickly, the ratio of new lows
to new highs will be a
lot more than 5:1 on the NASDAQ. Already,
we see in Table 3 below
only 4 stock groups that have a majority of
constituents above
their 65-dma support.
Watch the bank
stocks tomorrow, too. JPM has pulled back to
its
uptrend-support. Will Powell let this occur?
Peerless remains on its
Sell-S9V. The DJI is in danger of
now breaking its own
year-long uptrend-line, thereby breaking
down from its bearish
rising wedge pattern. Going into
the bearish month of
September, this poses real dangers
for investors.
Sell more bearish MINCPs short. Sell
QQQ and SPY if they
rally back to their falling 65-dma or
if they break the
necklines in their head/shoulders patterns.
|
|
| |
8/24/2026
2022 PEERLESS DJI, Signals, Indicators Daily DJI Volume
10-DayUp/Down Vol Stoch-20 CCI RSI Pct of All Stocks above 65-dma
Inverted Traders Index
DJI-IPA DJI-OBV
NASDAQ S&P OEX NYSE DJ-15 DJ-20 DJI-30
Old Peerless- 2006
version
Tiger Index of Big
Banks Bond Funds Gold Stocks Housing Stocks
Insurance-Stocks
Regional
Banks Russell-1000
Semi Conductors
ETFs: DIA QQQ SPY IWM MDY
TNA Short-Term Rates Ten Year Rates PST (Short Treasuries)
DOLLAR-UUP
ALLSTOCKs
COIN (Bit
Coin ETF)
USO-CrudeOil DBO BLDP FAS GLD HD IBB JETS JNUG KOL NAIL
NUGT NRGU OIH PALL RSX RETL SDS AGQ SLV SOXL TAN |
TECL TLT TMF TNA UGA USO
China: YINN
CHAU BABA BIDU
Commodities:
CANE
COCO CORN DBC CORN, CUT (paper)
MOO, NRGU
SOYB WEAT UUP (Dollar) LIT
(Lithium) PALL
(Palladium)
Stocks: AA AAPL ADBE AMAT AMGN AMD AMZN ANET AXP BA BAC
BSX CAT CDNS CHKP CNX CPB CRM CVX CMG DE DIS ENPH FB
FSLR FTNT GILD GME GOOG GS HD IBM INTU JPM KO KR LRCX
MRK MRNA MOS MSFT NEM NFLX NKE NOC NUE NVDA PANW PG
PYPL QCOM QDEL REGN REV RE SCHW SNOW SO SQUARE TSLA
TXN XOM V VRTX WFC WMT XLE ZM ZOM
SEMI-Condctors in SOXL:
NVDA. AVGO, AMD. INTC LRCX TXN MCHP NXPI AMAT ON AAOI TSM
HOMEBUILDERS: BLDP NAIL
BZH HOV LEN MHO MTH PHM -
REGIONAL BANKS:
EGBN
FFIC GBCI HMST
Carl Icahn and associates: IEP
MS
JEF
Leveraged Short ETFs:
FAZ - financials, TZA and SRTY- small caps, MZZ - mid caps, TECS -Techs,
SOXS -
semi-conductors LABD
- Biotechs
Bullish MAXCPs http://tigersoftware.com/upping/8-24-2023/Bullish.htm
Bearish MINCPs www.tigersoftware.com/downing/8-24-2023/Bearish.htm |
|
|
 |
 |
 |
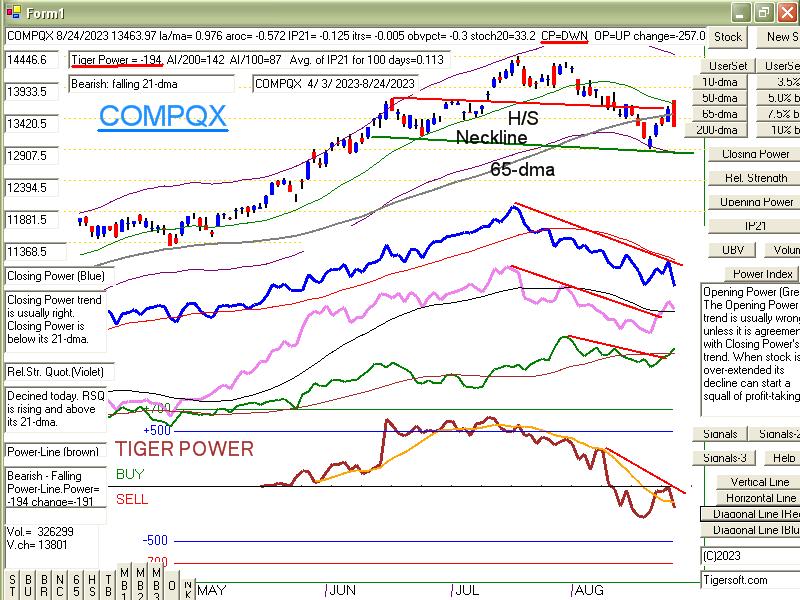 |
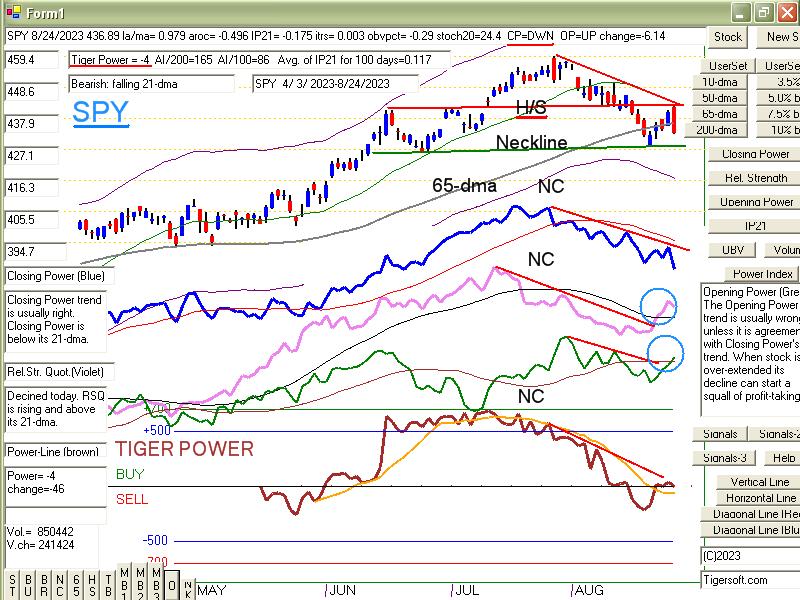 |
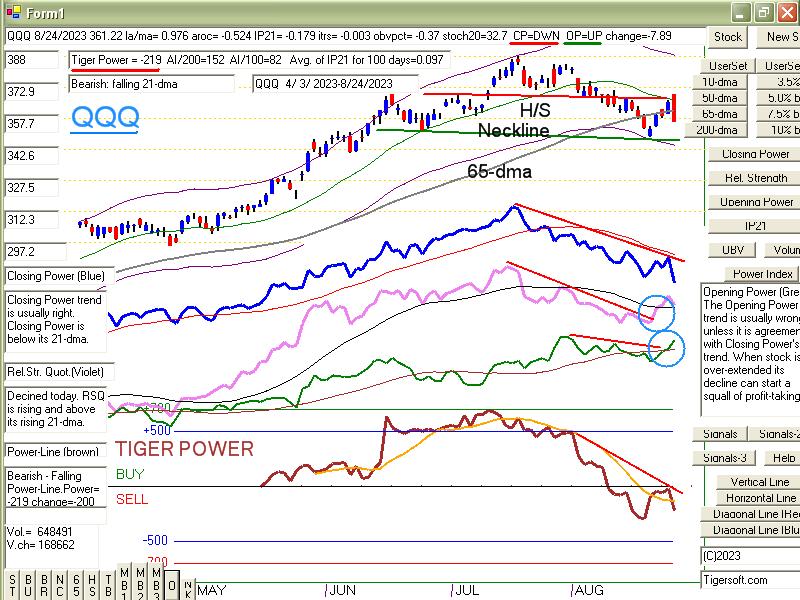 |
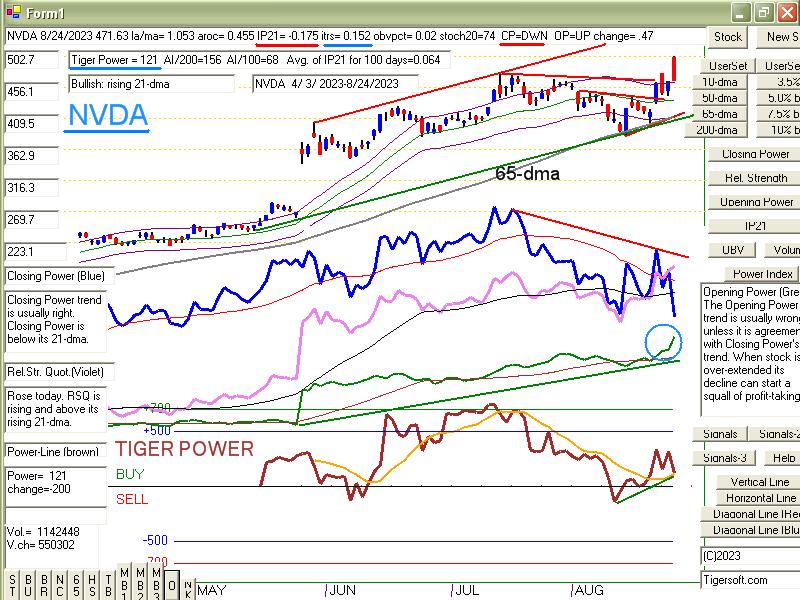 |
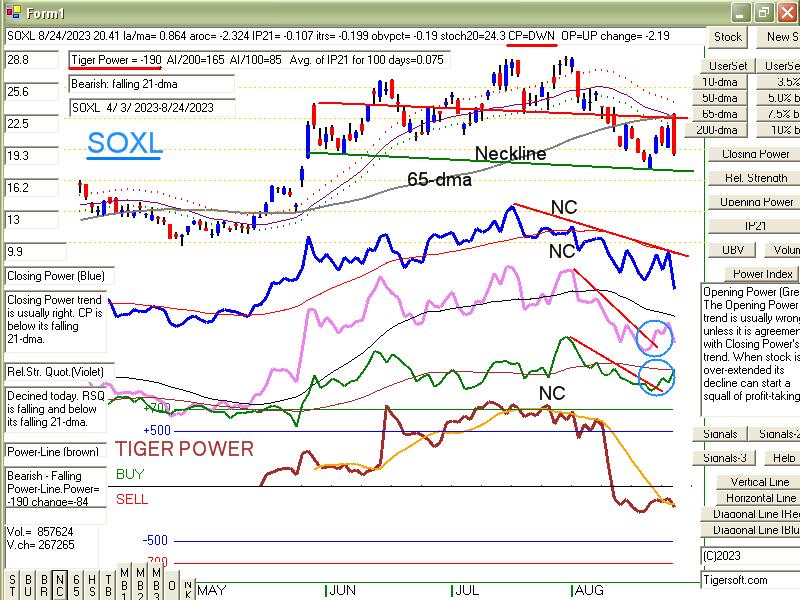 |
 |
 |
 |
 |
Table 1
| NYSE |
Latest
Close |
Previous
Close |
Week
Ago |
| Issues
traded |
2,998 |
3,024 |
3,022 |
| Advances |
728 |
2,287 |
897 |
| Declines |
2,174 |
663 |
2,017 |
| Unchanged |
96 |
74 |
108 |
| New
highs |
32 |
43 |
19 |
| New
lows |
75 |
62 |
88 |
| Adv.
volume* |
391,703,132 |
546,877,078 |
330,043,918 |
| Decl.
volume* |
597,928,728 |
300,113,788 |
527,148,924 |
| Total
volume* |
1,009,340,149 |
853,125,797 |
871,033,126 |
| Closing
Arms (TRIN)† |
0.81 |
2.11 |
0.70 |
| Block
trades* |
4,060 |
4,280 |
4,249 |
| Adv.
volume |
1,068,526,498 |
2,363,485,168 |
1,507,458,203 |
| Decl.
volume |
2,594,092,249 |
1,444,043,363 |
2,365,469,553 |
| Total
volume |
3,723,470,724 |
3,837,272,575 |
3,943,708,929 |
| NASDAQ |
Latest
Close |
Previous
Close |
Week
Ago |
| Issues
traded |
4,475 |
4,511 |
4,509 |
| Advances |
1,209 |
2,878 |
1,448 |
| Declines |
3,101 |
1,430 |
2,864 |
| Unchanged |
165 |
203 |
197 |
| New
highs |
45 |
57 |
30 |
| New
lows |
225 |
167 |
288 |
| Closing
Arms (TRIN)† |
1.69 |
0.90 |
1.52 |
| Block
trades |
32,901 |
30,798 |
48,611 |
| Adv.
volume |
812,939,799 |
2,795,076,527 |
1,306,735,501 |
| Decl.
volume |
3,530,201,745 |
1,247,024,867 |
3,933,452,190 |
| Total
volume |
4,383,829,114 |
4,127,853,401 |
5,280,182,006 |
|
Table 2 TIGER QUICKSILVER on ETFS - 8/24/2023 ---
Bullish = 1 UUP
Bearish = 4 SOXL, TECL, GLD TAN (-.46)
ETF       CLOSE     CHANGE    PIVOT-PT  5-dma AROC   CL-PWR  CANDLE  IP21    ITRS  POWER INDEX
=================================================================================================
DIA       341.03  -3.8       345.12       -58.5%     Bearish  RED   -.216    ==============
---------------------------------------------------------------------------------------------
COMPQX    13463.97  -257.06  13290.78      54.6%     Bearish  RED   -.125   -.003    -.128
---------------------------------------------------------------------------------------------
SPY       436.89  -6.14      436.5         6.8%      Bearish  RED   -.174    .005    -.169
---------------------------------------------------------------------------------------------
QQQ       361.22  -7.89      358.13        36.4%     Bearish  RED   -.178   -.001    -.179
---------------------------------------------------------------------------------------------
MDY       469.73  -5.14      471.37       -.2%       -------  RED   -.088   -.001    -.089
---------------------------------------------------------------------------------------------
IWM       183.22  -2.57      184.65       -11.7%     -------  RED   -.035   -.02     -.055
---------------------------------------------------------------------------------------------
FAS       62.89  -.49        63.61        -74.4%     -------  RED   -.126    .021    -.105
---------------------------------------------------------------------------------------------
RETL      6.18  -.45         7.22         -561.6%    -------  RED   -.052   -.107    -.159
---------------------------------------------------------------------------------------------
SOXL      20.41  -2.19       20.15         118%      Bearish  RED   -.106   -.197    -.303
---------------------------------------------------------------------------------------------
TECL      46.26  -3.52       44.85         163.4%    Bearish  RED   -.2   -.094      -.294
---------------------------------------------------------------------------------------------
IBB       126.86  -1.17      125.41        51.3%     -------  RED   -.199   -.03     -.229
---------------------------------------------------------------------------------------------
GLD       177.85  -.04       175.33        72.4%     Bearish  BLUE  -.372   -.01     -.382
---------------------------------------------------------------------------------------------
DBO       15.77   .01        16.08        -40.8%     Bullish  BLUE   .003    .149     .152
---------------------------------------------------------------------------------------------
OIH       331.44  -3.91      338.71       -60.8%     -------  RED   -.027    .208     .181
---------------------------------------------------------------------------------------------
CPER     23.27  -.27         22.98         90.7%     Bullish  RED   -.05   -.008     -.058
---------------------------------------------------------------------------------------------
TAN     55.5  -1.26          57.01        -156.2%    Bearish  RED   -.284   -.228    -.512
---------------------------------------------------------------------------------------------
UUP       28.97   .23        28.77         38.2%     Bullish  BLUE   .272    .025     .297
---------------------------------------------------------------------------------------------
CORN      22.36   .04        22.52         13.5%     -------  BLUE  -.16    -.07      -.23
---------------------------------------------------------------------------------------------
WEAT      6.25  -.04         6.29          137.2%    -------  ----  -.1    -.023     -.123
---------------------------------------------------------------------------------------------
YINN      30.87   .36        28.9         -55.7%     -------  RED   -.036   -.198    -.234
|
 Table 3      RANKING OF KEY DIRECTORIES BASED PCT.OF STOCKS ABOVE 65-DMA
              8/24/23
 Bullish = 4
 Bearish = 44
---------------------------------------------------------------------------------------
Directory     Current       day-1         day-2         day-3         day-4         day-5
----------------------------------------------------------------------------------------
COAL           1             1             1             1             1             1
EDU            .833          .833          .833          .833          .833          .666
INSURANC       .64           .6            .56           .64           .68           .64
OILGAS         .618          .67           .701          .69           .711          .701
FOOD           .53           .551          .408          .428          .428          .428
=============================================================================================
BEVERAGE       .5            .642          .5            .5            .5            .428
COMODITY       .5            .552          .368          .394          .394          .368
=============================================================================================
DJI-13         .461          .615          .615          .615          .615          .615
RETAIL         .456          .521          .5            .608          .652          .608
FIDSTKS        .437          .473          .426          .437          .443          .42
DOWJONES       .433          .533          .433          .5            .466          .466
GUNS           .428          .642          .428          .571          .571          .642
INDMATER       .402          .444          .444          .458          .5            .472
CHEM           .395          .372          .395          .418          .465          .418
REGBANKS       .394          .421          .289          .526          .552          .605
RUS-1000       .393          .447          .391          .413          .42           .412
SP-100         .388          .433          .4            .444          .455          .433
INFRA          .387          .548          .387          .419          .451          .483
SP500          .378          .437          .368          .399          .411          .393
HACKERS        .375          .437          .312          .312          .25           .25
TRANSP         .368          .368          .368          .368          .368          .368
HIGHPRIC       .367          .558          .406          .428          .372          .372
SOFTWARE       .357          .41           .321          .303          .285          .285
NASD-100       .356          .514          .396          .425          .366          .336
COMPUTER       .35           .35           .35           .35           .35           .35
EAT            .341          .39           .317          .317          .341          .292
AUTO           .339          .377          .32           .339          .339          .301
FINANCE        .337          .337          .225          .362          .425          .45
INDEXES        .329          .502          .351          .432          .394          .383
HOMEBLDG       .321          .5            .357          .25           .357          .357
HOSPITAL       .307          .384          .384          .384          .384          .384
MARIJUAN       .3            .3            .3            .3            .4            .4
REIT           .295          .311          .221          .213          .27           .278
BIGBANKS       .285          .285          .142          .285          .285          .285
ELECTRON       .285          .345          .278          .315          .27           .255
BIOTECH        .279          .324          .294          .286          .269          .274
LOWPRICE       .278          .322          .281          .284          .31           .304
GREEN          .277          .333          .277          .277          .277          .333
NIFTY          .272          .409          .295          .318          .295          .295
MILITARY       .269          .384          .307          .23           .269          .307
SEMI           .239          .326          .228          .282          .206          .195
GOLD           .222          .222          .111          .088          .088          .111
CHINA          .17           .219          .195          .195          .219          .292
ETFS           .163          .29           .181          .145          .127          .163
GAMING         .157          .315          .157          .315          .263          .263
UTILITY        .153          .179          .128          .153          .153          .128
COPPER         .142          .285          .142          .142          .142          .285
JETS           .076          .153          .153          .153          .153          .23
BONDFUND       .068          .103          .057          .057          .045          .045
SOLAR          0             0             0             0             0             0
|
====================================================================================
Thursday 8/24/2023 6:10 AM
Data used here is from 8/23/2023
DJI Futures - 66 NASDAQ
futures + 1%
| |
8/23/2023
|
|
| |
Market Comments
The DJI can't get up
from the floor of its 65-dma even with 10-year
rates falling
back from the resistance of their 12-month high. And
today, the DJI's
opening looks particularly uninspiring compared
to the over-night
one percent rise in the NASDAQ. NVDA's off-
the-charts
earnings and projections have brought the Public back
into this stock
like few others. Even big-money selling cannot seem
to stop NVDA's
rise. This, of course, has caused the NASDAQ,
QQQ and even SPY
to take off upwards, so that each is now
bullishly back
above its rising 65-dma. As you can see below,
this ascension
has caused the Closing Power and Relative Strength
Quotient to break
above their previous down-trends. This
constitutes a
trading Buy in the NASDAQ and QQQ. SPY rates
a Buy from the
Tiger POWER-Line shown in the newer Windows 10
charts. (I
will add this to the XP Tiger charts soon)
Expect the
blue-chips to stay in the doldrums. I take the Peerless
signal for them
still to be the Sell S9-V with keen overhead resistance
at 35000 in the
DJI from the recent failed breakout. The DJI's
rising wedge
pattern invites a breakdown. That could come next
in the bearish
month of September on into the first week or two
of October.
Powell will
probably not say anything new on Friday when he
speaks about his
battle with inflation. But even leaving rates
unchanged is
bearish for many stocks. Look at the breakdowns in
retail stocks
like Target and Macy's Dividend stocks like General Mills
have now made it
to our bearish list.
So, I continue to
believe hedging is the best strategy now, being long
Bullish MAXCPs
and leading semi-conductors while staying short
some of the most
bearish looking MINCPs, especially those showing
head/shoulders
tops, deep red-Distribution and a plunging Closing Power.
Look at the
examples below. |
|
| |
8/23/2023
2022 PEERLESS DJI, Signals, Indicators Daily DJI Volume
10-DayUp/Down Vol Stoch-20 CCI RSI Pct of All Stocks above 65-dma
Inverted Traders Index
DJI-IPA DJI-OBV
NASDAQ S&P OEX NYSE DJ-15 DJ-20 DJI-30
Old Peerless- 2006
version
Tiger Index of Big
Banks Bond Funds Gold Stocks Housing Stocks
Insurance-Stocks
Regional
Banks Russell-1000
Semi Conductors
ETFs: DIA QQQ SPY IWM MDY
TNA Short-Term Rates Ten Year Rates PST (Short Treasuries)
DOLLAR-UUP
ALLSTOCKs
COIN (Bit
Coin ETF)
USO-CrudeOil DBO BLDP FAS GLD HD IBB JETS JNUG KOL NAIL
NUGT NRGU OIH PALL RSX RETL SDS AGQ SLV SOXL TAN |
TECL TLT TMF TNA UGA USO
China: YINN
CHAU BABA BIDU
Commodities:
CANE
COCO CORN DBC CORN, CUT (paper)
MOO, NRGU
SOYB WEAT UUP (Dollar) LIT
(Lithium) PALL
(Palladium)
Stocks: AA AAPL ADBE AMAT AMGN AMD AMZN ANET AXP BA BAC
BSX CAT CDNS CHKP CNX CPB CRM CVX CMG DE DIS ENPH FB
FSLR FTNT GILD GME GOOG GS HD IBM INTU JPM KO KR LRCX
MRK MRNA MOS MSFT NEM NFLX NKE NOC NUE NVDA PANW PG
PYPL QCOM QDEL REGN REV RE SCHW SNOW SO SQUARE TSLA
TXN XOM V VRTX WFC WMT XLE ZM ZOM
SEMI-Condctors in SOXL:
NVDA. AVGO, AMD. INTC LRCX TXN MCHP NXPI AMAT ON AAOI TSM
HOMEBUILDERS: BLDP NAIL
BZH HOV LEN MHO MTH PHM -
REGIONAL BANKS:
EGBN
FFIC GBCI HMST
Carl Icahn and associates: IEP
MS
JEF
Leveraged Short ETFs:
FAZ - financials, TZA and SRTY- small caps, MZZ - mid caps, TECS -Techs,
SOXS -
semi-conductors LABD
- Biotechs
Bullish MAXCPs http://tigersoftware.com/upping/8-23-2023/Bullish.htm
Bearish MINCPs
www.tigersoftware.com/downing/8-23-2023/Bearish.htm |
|
 |
 |
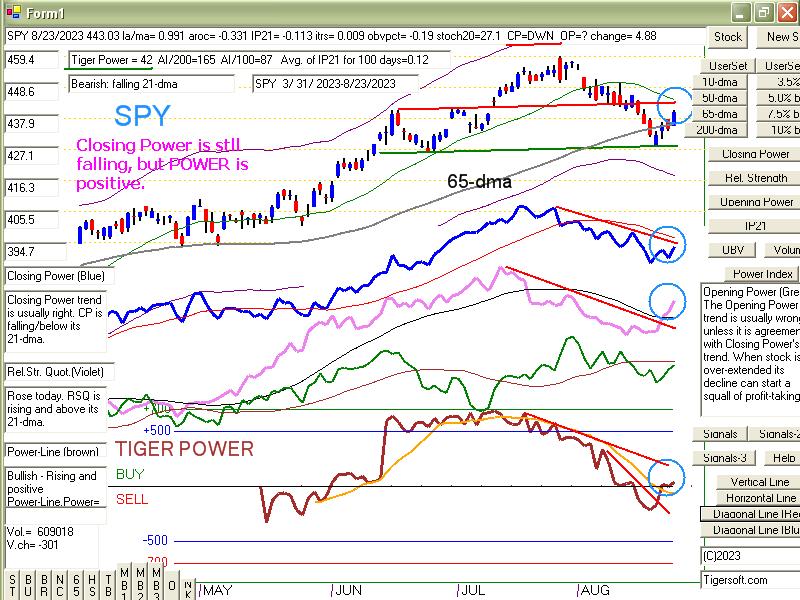 |
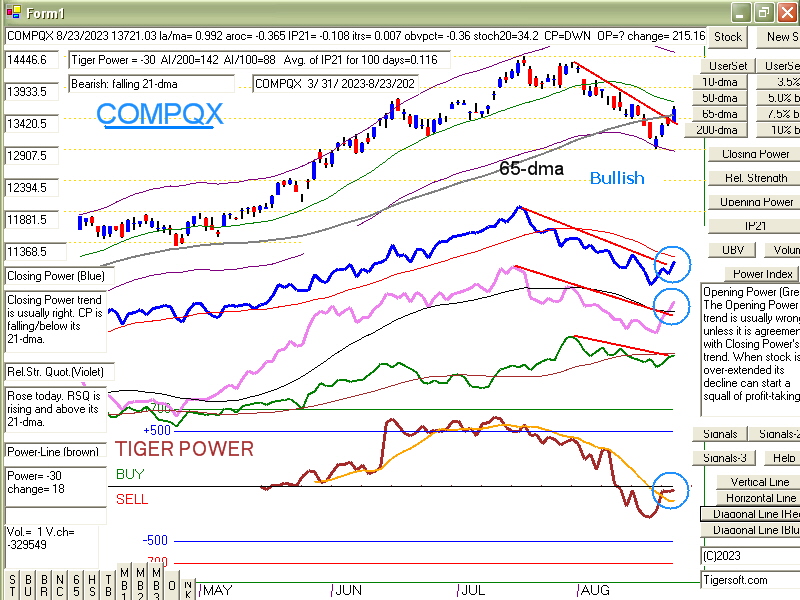 |
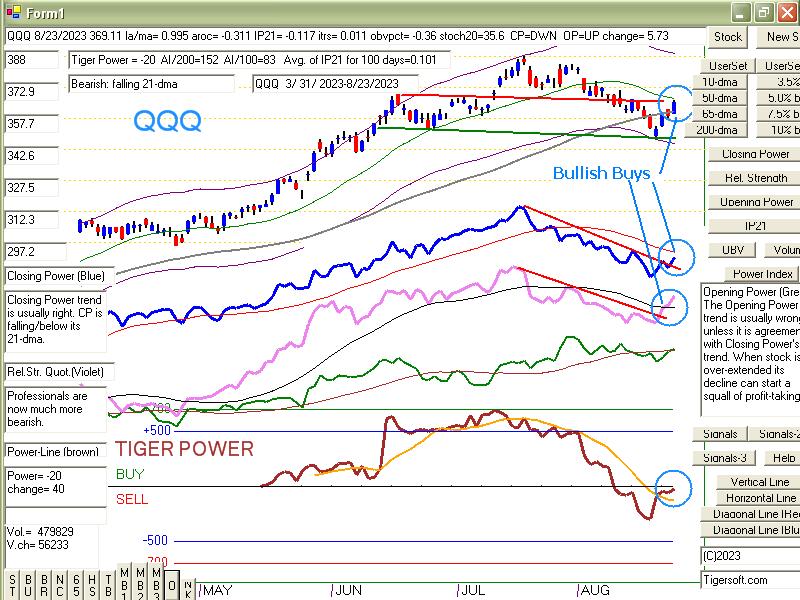 |
 |
 |
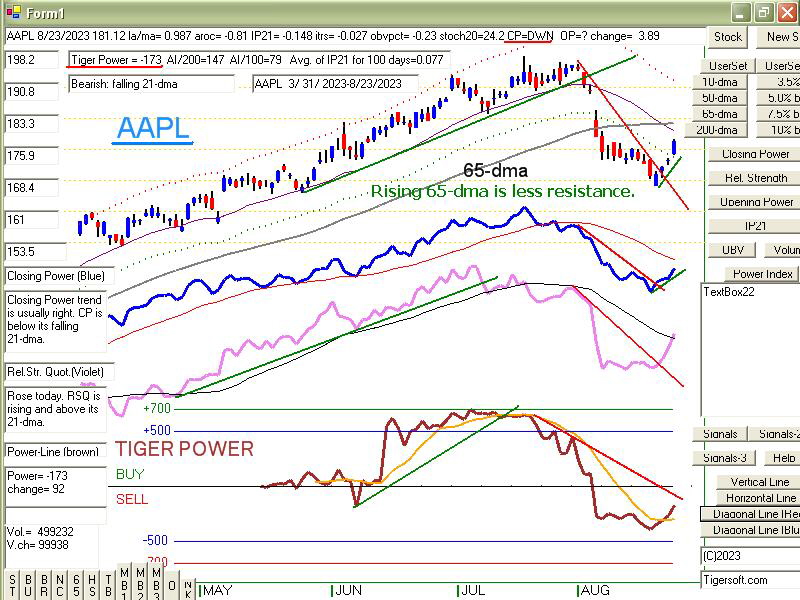 |
 |
 |
 |
 |
 |
 |
 |
| NYSE |
Latest
Close |
Previous
Close |
Week
Ago |
| Issues
traded |
3,024 |
3,023 |
3,017 |
| Advances |
2,287 |
1,238 |
760 |
| Declines |
663 |
1,672 |
2,155 |
| Unchanged |
74 |
113 |
102 |
| New
highs |
43 |
37 |
42 |
| New
lows |
62 |
81 |
95 |
| Adv.
volume* |
546,877,078 |
265,591,937 |
193,374,211 |
| Decl.
volume* |
300,113,788 |
468,978,054 |
587,716,911 |
| Total
volume* |
853,125,797 |
745,097,847 |
795,140,049 |
| Closing
Arms (TRIN)† |
2.11 |
1.28 |
1.02 |
| Block
trades* |
4,280 |
3,942 |
3,972 |
| Adv.
volume |
2,363,485,168 |
1,269,598,670 |
946,690,459 |
| Decl.
volume |
1,444,043,363 |
2,194,705,633 |
2,731,728,734 |
| Total
volume |
3,837,272,575 |
3,522,763,017 |
3,753,917,788 |
| NASDAQ |
Latest
Close |
Previous
Close |
Week
Ago |
| Issues
traded |
4,511 |
4,509 |
4,484 |
| Advances |
2,878 |
1,764 |
1,172 |
| Declines |
1,430 |
2,529 |
3,137 |
| Unchanged |
203 |
216 |
175 |
| New
highs |
57 |
43 |
45 |
| New
lows |
167 |
242 |
283 |
| Closing
Arms (TRIN)† |
0.90 |
1.11 |
0.39 |
| Block
trades |
30,798 |
35,601 |
73,590 |
| Adv.
volume |
2,795,076,527 |
1,624,749,569 |
3,025,999,460 |
| Decl.
volume |
1,247,024,867 |
2,587,717,583 |
3,172,403,988 |
| Total
volume |
4,127,853,401 |
4,282,431,362 |
6,243,761,551 |
|
Table 2 TIGER QUICKSILVER on ETFS - 8/23/2023 ---
Bullish = 0
Bearish = 3 GLD (-.37) TAN (-.46), CORN
ETF       CLOSE     CHANGE    PIVOT-PT  5-dma AROC   CL-PWR  CANDLE  IP21    ITRS  POWER INDEX
=================================================================================================
DIA       344.83   1.87      345.06       -42.6%     -------  BLUE  -.149    -------------
---------------------------------------------------------------------------------------------
COMPQX    13721.03   215.16  13316.93      91.8%     -------  BLUE  -.075    .009    -.066
---------------------------------------------------------------------------------------------
SPY       443.03   4.88      436.29        38.7%     -------  BLUE  -.112    .011    -.101
---------------------------------------------------------------------------------------------
QQQ       369.11   5.73      358.58        90.9%     -------  BLUE  -.117    .013    -.104
---------------------------------------------------------------------------------------------
MDY       474.87   5.28      469.75       -11.2%     -------  BLUE  -.024    .005    -.019
---------------------------------------------------------------------------------------------
IWM       185.79   1.96      183.65       -1.4%      -------  BLUE   .032   -.011     .021
---------------------------------------------------------------------------------------------
FAS       63.38   1.65       63.83        -120.4%    -------  BLUE  -.04    .032     -.008
---------------------------------------------------------------------------------------------
RETL      6.63   .2          6.95         -437.1%    -------  BLUE   .05    0         .05
---------------------------------------------------------------------------------------------
SOXL      22.6   1.25        19.91         498.5%    -------  BLUE  -.037   -.092    -.129
---------------------------------------------------------------------------------------------
TECL      49.78   2.54       44.73         399.4%    -------  BLUE  -.13   -.023     -.153
---------------------------------------------------------------------------------------------
IBB       128.03   .74       125.56        73.2%     Bullish  ----  -.144   -.025    -.169
---------------------------------------------------------------------------------------------
GLD       177.89   1.79      175.3         66.1%     Bearish  BLUE  -.337   -.033    -.37
---------------------------------------------------------------------------------------------
DBO       15.76  -.21        15.9         -9.4%      -------  BLUE  -.058    .168     .11
---------------------------------------------------------------------------------------------
OIH       335.35   3.12      335.52       -20.1%     Bullish  BLUE   .011    .234     .245
---------------------------------------------------------------------------------------------
CPER     23.54   .23         22.85         193.7%    -------  BLUE  -.042    .007    -.035
---------------------------------------------------------------------------------------------
TAN     56.76   .97          57.27        -125.6%    -------  BLUE  -.243   -.217    -.46
---------------------------------------------------------------------------------------------
UUP       28.74  -.1         28.75        -3.5%      Bullish  RED    .179   -.002     .177
---------------------------------------------------------------------------------------------
CORN      22.32   .39        22.3          56.3%     -------  BLUE  -.213   -.083    -.296
---------------------------------------------------------------------------------------------
WEAT      6.29   .13         6.08          105.4%    Bearish  BLUE  -.12   -.031     -.151
---------------------------------------------------------------------------------------------
YINN      30.51   1.8        31.2         -11.8%     -------  BLUE   .004   -.194    -.19
|
 TABLE 3      RANKING OF KEY DIRECTORIES BASED PCT.OF STOCKS ABOVE 65-DMA
              8/23/23
 Bullish = 15
 Bearish = 34
---------------------------------------------------------------------------------------
Directory     Current       day-1         day-2         day-3         day-4         day-5
----------------------------------------------------------------------------------------
COAL           1             1             1             1             1             1
EDU            .833          .833          .833          .833          .666          .666
OILGAS         .67           .701          .69           .711          .711          .68
BEVERAGE       .642          .5            .5            .5            .428          .5
GUNS           .642          .428          .571          .571          .642          .714
DJI-13         .615          .615          .615          .615          .615          .615
INSURANC       .6            .56           .64           .68           .64           .72
HIGHPRIC       .558          .406          .428          .372          .367          .515
COMODITY       .552          .394          .368          .394          .394          .421
FOOD           .551          .428          .408          .428          .428          .448
INFRA          .548          .387          .419          .451          .483          .612
DOWJONES       .533          .433          .5            .466          .466          .5
RETAIL         .521          .5            .608          .652          .608          .739
NASD-100       .514          .396          .425          .366          .336          .415
INDEXES        .502          .351          .432          .394          .394          .491
================================================================================================
HOMEBLDG       .5            .357          .25           .357          .357          .857
================================================================================================
FIDSTKS        .473          .426          .437          .443          .42           .479
RUS-1000       .448          .391          .412          .42           .417          .476
INDMATER       .444          .444          .458          .5            .472          .444
HACKERS        .437          .312          .312          .25           .25           .437
SP500          .437          .368          .399          .409          .397          .466
SP-100         .433          .4            .444          .455          .433          .477
SOFTWARE       .428          .339          .303          .285          .267          .392
REGBANKS       .421          .289          .526          .552          .605          .578
NIFTY          .409          .295          .318          .295          .295          .295
EAT            .39           .317          .317          .341          .292          .365
HOSPITAL       .384          .384          .384          .384          .384          .461
MILITARY       .384          .307          .23           .269          .307          .346
AUTO           .377          .339          .339          .339          .32           .396
CHEM           .372          .395          .418          .465          .418          .372
TRANSP         .368          .368          .368          .368          .368          .421
COMPUTER       .35           .35           .35           .35           .35           .45
ELECTRON       .345          .278          .315          .27           .27           .308
FINANCE        .337          .225          .362          .412          .475          .437
GREEN          .333          .277          .277          .277          .333          .388
SEMI           .326          .228          .282          .206          .217          .25
BIOTECH        .322          .291          .289          .269          .274          .302
LOWPRICE       .322          .284          .287          .31           .299          .325
GAMING         .315          .157          .263          .315          .263          .263
REIT           .311          .204          .221          .278          .278          .344
MARIJUAN       .3            .3            .3            .4            .4            .3
ETFS           .29           .181          .145          .127          .181          .127
BIGBANKS       .285          .142          .285          .285          .285          .285
COPPER         .285          .142          .142          .142          .285          .142
GOLD           .222          .111          .088          .088          .111          .088
CHINA          .219          .195          .195          .219          .292          .195
UTILITY        .179          .128          .153          .153          .128          .179
JETS           .153          .153          .153          .153          .23           .153
BONDFUND       .103          .045          .057          .057          .057          .068
SOLAR          0             0             0             0             0             0
|
====================================================================================
Wednesday 8/23/2023 5:37 AM
Data used here is from 8/22/2023
See latest futures: https://www.wsj.com/market-data/quotes/futures/YM00
| |
8/22/2023
|
|
| |
In keeping with its failling Closing Power trend, DIA
and the DJI opened
up on Tuesday but
sold off most of the rest of the day. But boosting the
market in early
trading was optimizism that NVDA would on
Wednesday
announce another
huge jump in projected and real earnings. The same
forces are again
at work this morning. In fact, bullishness about NVDA
is eclipsing even
Fed Chairman Jerome Powell's speech. Who can blame
the bulls?
This is the dawning of the Age of Artificial Intelligence and
NVDA is its
leader by a wide margin. As NVDA goes, so will lots
of other
semi-conductor stocks as well as SOXL, NVDA, QQQ, the
NASDAQ and
of course SPY, too.
I suggested
hedging by buying leading Semi-conductors and holding
short some of the
weakest Bearish MINCPs. Among the latter are
lots of solar
energy stocks. Has the "Green Revolution" has turned "brown"?..
Rising carbon
dioxide and climate change are hard to deny. Solar
energy stocks
will undoubtedly get another run. Their technology
will come back
and be in vogue again. But not yet. if we judge
from their
representaives among the Bearish MINCPs. They
still look like
profitable shorts.
Elsewhere,
we see from Table 2 and 3 below very few industries
that look
bullish. In fact, only 34% of all the stocks and ETFs we
follow are
still above the support of their 65-dma. Performance
investors
have little choice, except the semi-conductors. NVDA
had better
come out with some pretty amazing projections
and
earnings.
When you
look at the tech ETFs shown below, you will see
a lot of
similarity in their charts. They are each rising up from
what could
be "neckline" support if their present rally does
not take
them above red resistance lines that parallel the
necklines
and start at a left shoulder peak. This is a
pattern
which can move mightily away from its potential
right
shoulder apex. Really good news from NVDA will
send them
much higher, but any disappointment would
turn them
down and complete ugly head and shoulders
patterns.
At present,
we can hedge as suggested. But we can also
wait and
see which way QQQ and COMPQX (the NASDAQ)
go from
their potential right shoulder apexes.
As for the
DJI, it seems to have good support at its rising 65-dma.
But it
suffers from the diet of higher and higher interest rates. Big money
and
professionals are quickly selling into rallies. No doubt, they
are worried
about 5% Ten Year-Bond yields and a September
sell-off if
the rising wedge in the DJI has its uptrend-line broken.
I consider
Peerless to have a Sell S9-V still active. I pay limited
attention
to the 2006-version of Peerless and its recent Buys.
The curent
version was tested over 36 years before 1965
and for 16
more year after 2006 and after. I like to think that
this labor
was worth the extra time.
|
|
| |
8/22/2023
2022 PEERLESS DJI, Signals, Indicators Daily DJI Volume
10-DayUp/Down Vol Stoch-20 CCI RSI Pct of All Stocks above 65-dma
Inverted Traders Index
DJI-IPA DJI-OBV
NASDAQ S&P OEX NYSE DJ-15 DJ-20 DJI-30
Old Peerless 2006
version
Tiger Index of Big
Banks Bond Funds Gold Stocks Housing Stocks
Insurance-Stocks
Regional
Banks Russell-1000
Semi Conductors
ETFs: DIA QQQ SPY IWM MDY
TNA Short-Term Rates Ten Year Rates PST (Short Treasuries)
DOLLAR-UUP
ALLSTOCKs
COIN (Bit
Coin ETF)
USO-CrudeOil DBO BLDP FAS GLD HD IBB JETS JNUG KOL NAIL
NUGT NRGU OIH PALL RSX RETL SDS AGQ SLV SOXL TAN |
TECL TLT TMF TNA UGA USO
China: YINN
CHAU BABA BIDU
Commodities:
CANE
COCO CORN DBC CORN, CUT (paper)
MOO, NRGU
SOYB WEAT UUP (Dollar) LIT
(Lithium) PALL
(Palladium)
Stocks: AA AAPL ADBE AMAT AMGN AMD AMZN ANET AXP BA BAC
BSX CAT CDNS CHKP CNX CPB CRM CVX CMG DE DIS ENPH FB
FSLR FTNT GILD GME GOOG GS HD IBM INTU JPM KO KR LRCX
MRK MRNA MOS MSFT NEM NFLX NKE NOC NUE NVDA PANW PG
PYPL QCOM QDEL REGN REV RE SCHW SNOW SO SQUARE TSLA
TXN XOM V VRTX WFC WMT XLE ZM ZOM
SEMI-Condctors in SOXL:
NVDA. AVGO, AMD. INTC LRCX TXN MCHP NXPI AMAT ON AAOI TSM
HOMEBUILDERS: BLDP NAIL
BZH HOV LEN MHO MTH PHM -
REGIONAL BANKS:
EGBN
FFIC GBCI HMST
Carl Icahn and associates: IEP
MS
JEF
Leveraged Short ETFs:
FAZ - financials, TZA and SRTY- small caps, MZZ - mid caps, TECS -Techs,
SOXS -
semi-conductors LABD
- Biotechs
Bullish MAXCPs http://tigersoftware.com/upping/8-22-2023/Bullish.htm
Bearish MINCPs www.tigersoftware.com/downing/8-22-2023/Bearish.htm |
|
 |
| |
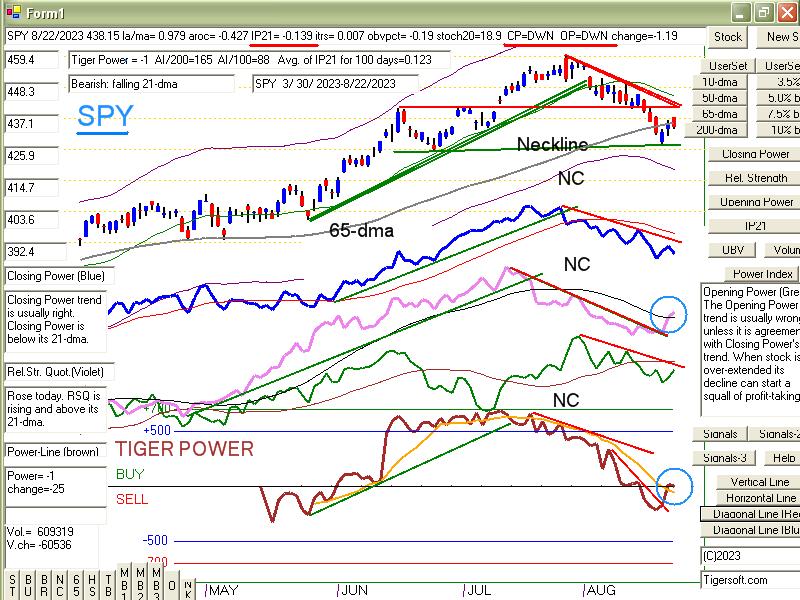
|
 |
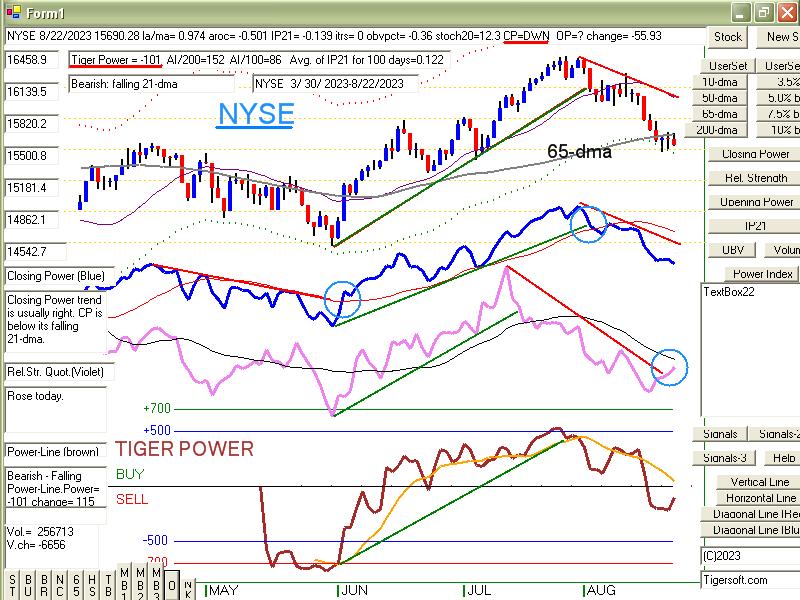 |
 |
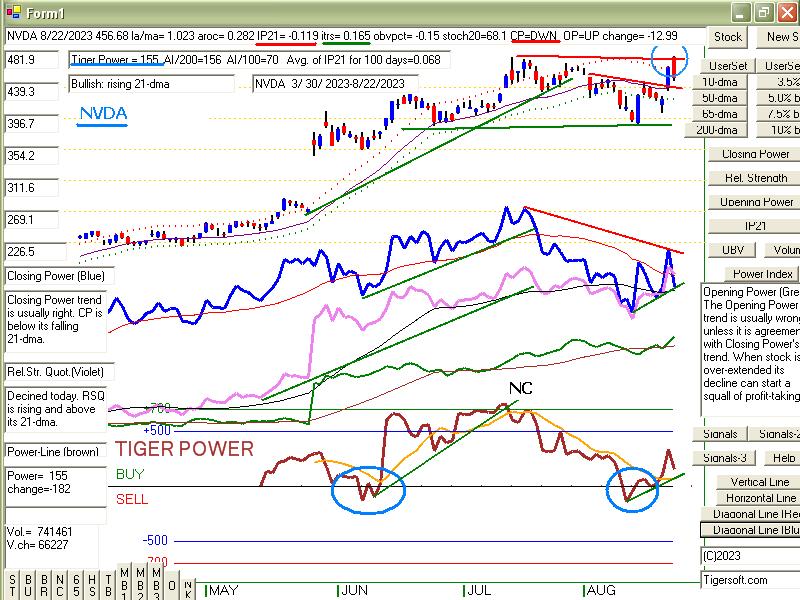 |
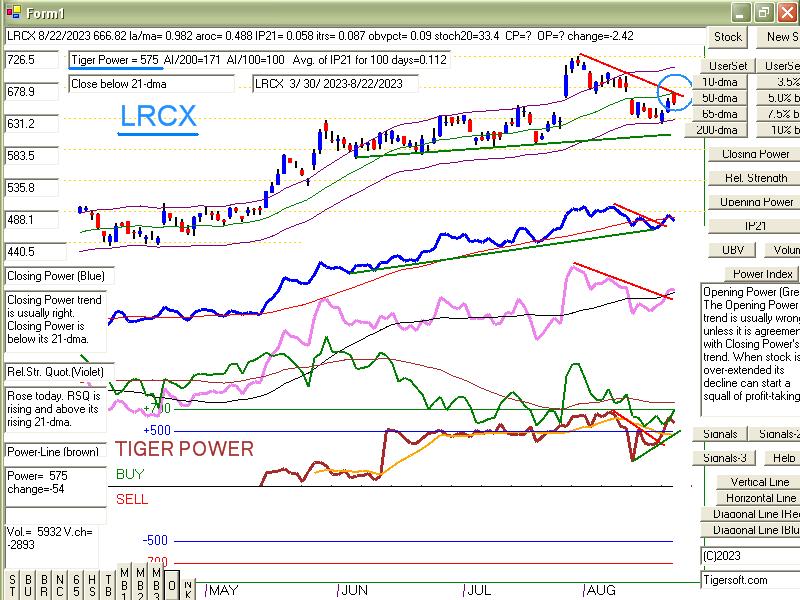 |
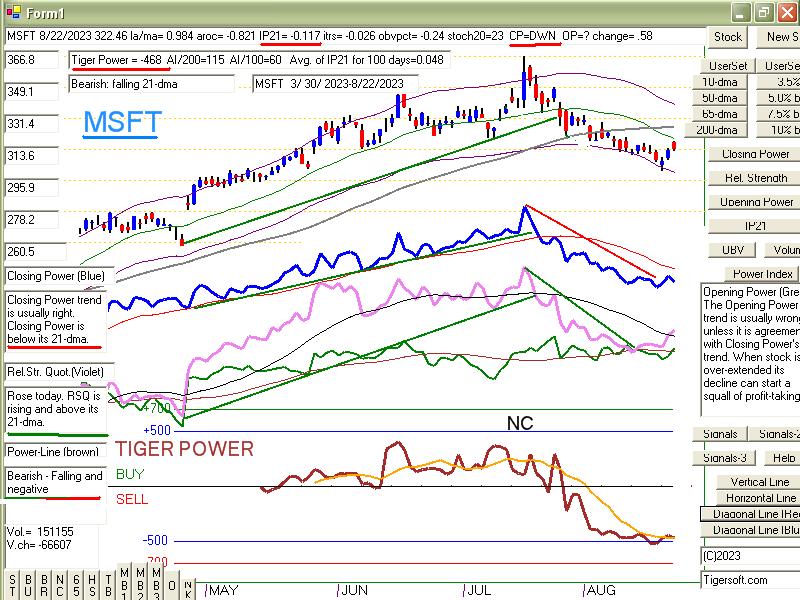 |
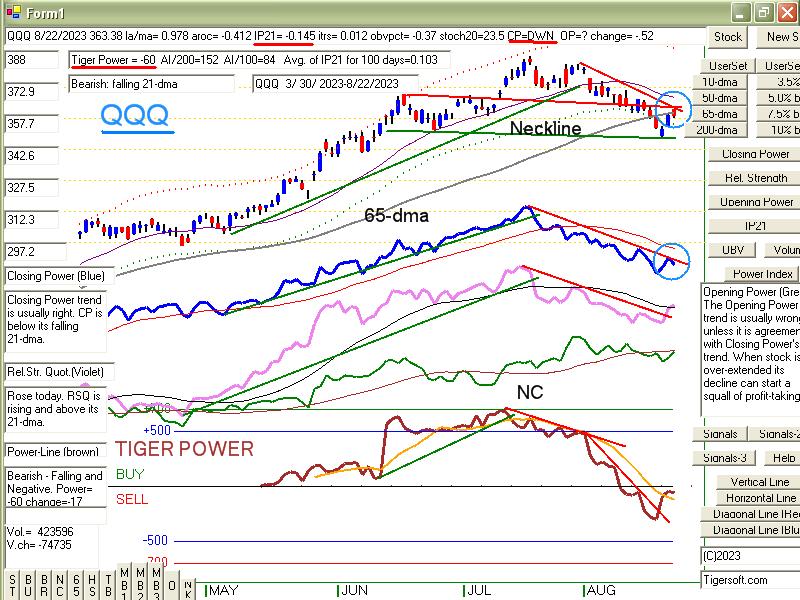 |
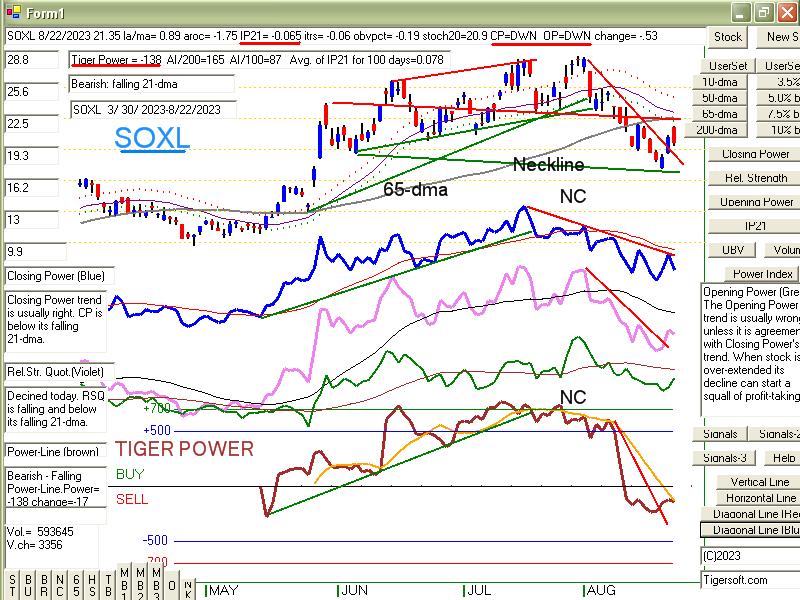
|
Table 1 - Daily Breadth and Volume
| NYSE |
Latest
Close |
Previous
Close |
Week
Ago |
| Issues
traded |
3,023 |
3,023 |
3,012 |
| Advances |
1,238 |
1,113 |
477 |
| Declines |
1,672 |
1,804 |
2,453 |
| Unchanged |
113 |
106 |
82 |
| New
highs |
37 |
31 |
34 |
| New
lows |
81 |
87 |
80 |
| Adv.
volume* |
265,591,937 |
369,863,789 |
102,246,273 |
| Decl.
volume* |
468,978,054 |
426,626,740 |
700,644,335 |
| Total
volume* |
745,097,847 |
805,236,928 |
808,869,537 |
| Closing
Arms (TRIN)† |
1.28 |
0.66 |
1.07 |
| Block
trades* |
3,942 |
4,074 |
4,014 |
| Adv.
volume |
1,269,598,670 |
1,776,635,483 |
584,376,527 |
| Decl.
volume |
2,194,705,633 |
1,895,554,544 |
3,208,856,941 |
| Total
volume |
3,522,763,017 |
3,726,855,043 |
3,832,252,540 |
| NASDAQ |
Latest
Close |
Previous
Close |
Week
Ago |
| Issues
traded |
4,509 |
4,531 |
4,538 |
| Advances |
1,764 |
2,072 |
1,231 |
| Declines |
2,529 |
2,262 |
3,125 |
| Unchanged |
216 |
197 |
182 |
| New
highs |
43 |
44 |
66 |
| New
lows |
242 |
215 |
222 |
| Closing
Arms (TRIN)† |
1.11 |
0.76 |
0.61 |
| Block
trades |
35,601 |
35,521 |
35,016 |
| Adv.
volume |
1,624,749,569 |
2,367,794,566 |
1,721,218,353 |
| Decl.
volume |
2,587,717,583 |
1,958,546,815 |
2,663,172,346 |
| Total
volume |
4,282,431,362 |
4,363,077,964 |
4,473,329,779 |
|
Table 2 TIGER QUICKSILVER on ETFS - 8/22/2023 ---
Bullish = 0
Bearish = 4 GLD (-.39) TAN (-.483), CORM, YINN
ETF       CLOSE     CHANGE    PIVOT-PT  5-dma AROC   CL-PWR  CANDLE  IP21    ITRS  POWER INDEX
=================================================================================================
DIA       342.96  -1.71      347.77       -96%       -------  RED   -.169    0      =====
---------------------------------------------------------------------------------------------
COMPQX    13505.87   8.28    13474.63     -46.6%    -------  RED   -.105    .008    -.097
---------------------------------------------------------------------------------------------
SPY       438.15  -1.19      439.64       -54%      -------  RED   -.139    .008    -.131
---------------------------------------------------------------------------------------------
QQQ       363.38  -.52       362.54       -42%      -------  RED   -.144    .014    -.13
---------------------------------------------------------------------------------------------
MDY       469.59  -2.17      475.93       -114%     -------  RED   -.06   -.001     -.061
---------------------------------------------------------------------------------------------
IWM       183.83  -.55       185.84       -116.3%   -------  RED   -.015   -.017    -.032
---------------------------------------------------------------------------------------------
FAS       61.73  -1.75       64.91        -279.5%   -------  RED   -.125    .002    -.123
---------------------------------------------------------------------------------------------
RETL      6.43  -.62         7.24         -689.8%   -------  RED   -.009    .01      .001
---------------------------------------------------------------------------------------------
SOXL      21.35  -.53        20.53        -107.9%   -------  RED   -.065   -.058    -.123
---------------------------------------------------------------------------------------------
TECL      47.24  -.2         46.1         -20.6%    -------  RED   -.162   -.013    -.175
---------------------------------------------------------------------------------------------
IBB       127.29   .06       126.18       -28.5%    Bullish  ----  -.114   -.023    -.137
---------------------------------------------------------------------------------------------
GLD       176.1   .29        175.57       -13.9%    Bearish  BLUE  -.346   -.044    -.39
---------------------------------------------------------------------------------------------
DBO       15.97  -.07        15.79        -21.9%    -------  RED   -.064    .137     .073
---------------------------------------------------------------------------------------------
OIH       332.23  -4.16      336.7        -84.7%    -------  RED   -.002    .191     .189
---------------------------------------------------------------------------------------------
CPER     23.31   .21         22.65         131.2%   -------  ----  -.057   -.01     -.067
---------------------------------------------------------------------------------------------
TAN     55.79  -.59          58.19        -328.5%   -------  RED   -.265   -.218    -.483
---------------------------------------------------------------------------------------------
UUP       28.84   .1         28.76         27.8%    Bullish  ----   .209    .002     .211
---------------------------------------------------------------------------------------------
CORN      21.93  -.17        22.07         29.3%    Bearish  RED   -.207   -.072    -.279
---------------------------------------------------------------------------------------------
WEAT      6.16   .01         6.16          16.2%    Bearish  ----  -.069   -.045    -.114
---------------------------------------------------------------------------------------------
YINN      28.71  -.02        30.58        -644.6%   -------  RED   -.055   -.248    -.303
|
TABLE 3       RANKING OF KEY DIRECTORIES BASED PCT.OF STOCKS ABOVE 65-DMA
              8/22/23
BULLISH = 5
BEARISH = 43
---------------------------------------------------------------------------------------
Directory     Current       day-1         day-2         day-3         day-4         day-5
----------------------------------------------------------------------------------------
COAL           1             1             1             1             1             1
EDU            .833          .833          .833          .666          .666          .833
OILGAS         .701          .69           .711          .711          .69           .69
DJI-13         .615          .615          .615          .615          .615          .615
INSURANC       .56           .64           .68           .64           .72           .68
===============================================================================================
BEVERAGE       .5            .5            .5            .428          .5            .5
RETAIL         .5            .608          .652          .608          .739          .782
===============================================================================================
INDMATER       .444          .458          .5            .472          .458          .458
DOWJONES       .433          .5            .466          .466          .5            .5
FOOD           .428          .428          .408          .428          .448          .448
GUNS           .428          .571          .571          .642          .714          .785
FIDSTKS        .426          .437          .443          .42           .485          .544
HIGHPRIC       .406          .428          .372          .367          .519          .61
SP-100         .4            .444          .455          .433          .477          .511
NASD-100       .396          .425          .366          .336          .425          .504
CHEM           .395          .418          .465          .418          .395          .418
COMODITY       .394          .394          .368          .394          .421          .421
RUS-1000       .392          .412          .419          .417          .482          .517
INFRA          .387          .419          .451          .483          .612          .612
HOSPITAL       .384          .384          .384          .384          .461          .461
SP500          .368          .399          .409          .395          .466          .511
TRANSP         .368          .368          .368          .368          .421          .473
HOMEBLDG       .357          .25           .357          .357          .857          .928
SOFTWARE       .357          .321          .285          .267          .375          .482
INDEXES        .351          .432          .394          .394          .497          .643
COMPUTER       .35           .35           .35           .35           .45           .5
AUTO           .339          .358          .339          .32           .396          .433
EAT            .317          .317          .341          .292          .365          .414
HACKERS        .312          .312          .25           .25           .437          .437
MILITARY       .307          .23           .269          .307          .346          .384
MARIJUAN       .3            .3            .4            .4            .3            .3
NIFTY          .295          .318          .295          .295          .295          .477
BIOTECH        .289          .286          .271          .274          .299          .35
REGBANKS       .289          .526          .552          .605          .578          .631
LOWPRICE       .284          .29           .313          .299          .328          .348
ELECTRON       .278          .315          .27           .27           .308          .39
GREEN          .277          .277          .277          .333          .388          .444
SEMI           .228          .282          .206          .217          .25           .347
FINANCE        .225          .362          .412          .462          .437          .5
REIT           .204          .204          .286          .286          .344          .409
CHINA          .195          .195          .219          .292          .195          .292
ETFS           .181          .145          .127          .181          .181          .236
GAMING         .157          .263          .263          .315          .263          .315
JETS           .153          .153          .153          .23           .153          .23
BIGBANKS       .142          .285          .285          .285          .285          .428
COPPER         .142          .142          .142          .285          .142          .285
UTILITY        .128          .153          .153          .128          .179          .153
GOLD           .111          .088          .088          .111          .088          .111
BONDFUND       .045          .045          .057          .068          .08           .103
SOLAR          0             0             0             0             0             .062
|
===================================================================================
Tuesday 8/22/2023 6:00 PM Futures DJI +112 NASDAQ +115 Data used here for 8/21/2023
https://www.wsj.com/market-data/quotes/futures/YM00
| |
8/21/2023
|
|
| |
Hedging with our Bullish MAXCPs and Bearish MINCPs should
be
profitable now. The rising 65-dma should prop the DJI up for
a while
longer. Meanwhile, the techs are clearly favored.
The DJI
seems ready to try to bounce up from its 65-dma. NVDA
is back to
its highs in just two day, as it anticipates another huge jump
in profits.
NVDA's amazing strength has sent many semi-conductors
up as well.
And with them has risen SOXL, QQQ and the NASDAQ.
These ETFs,
the NASDAQ and SPY are on the verge of having their
Closing
Power and Relative Strength Quotient trend-lines be penetrated
to the
upside. This would certainly be a trading Buy, especially since
SPY's Power
Index turned positive for a Buy at its close today.
All this is
pretty amazing, considering the way 10-year and short-term rates
have just
reached yearly new highs. In the old days, I might have dismissed
the rebound
as a form of sinsister manipulation by a coterie of insiders
and market
makers. After all, there were more than 600 decliners than
advancers
on the NYSE. But these days we can simply hedge. Instead
of staying
short the DJI, we can hold short some of the bearish MINCPs
and buy
some of the bullish MAXCPs. The solar energy short sales
keep
falling under the pressure of big money and Professional selling.
And the
leading semi-conductors are now market leaders. Performance
trading is
back!
The
Professionals who are sending the market up from the rising 65-day
ma of the
65-dma would not be doing this if they did not also believe
that Fed
Chairman Powell will not surprise the market when he speaks
from up
high in Wyoming. |
|
| |
8/21/2023
2022 PEERLESS DJI, Signals, Indicators Daily DJI Volume
10-DayUp/Down Vol Stoch-20 CCI RSI Pct of All Stocks above 65-dma
Inverted Traders Index
DJI-IPA DJI-OBV
NASDAQ S&P OEX NYSE DJ-15 DJ-20 DJI-30
Old Peerless 2006
version
Tiger Index of Big
Banks Bond Funds Gold Stocks Housing Stocks
Insurance-Stocks
Regional
Banks Russell-1000
Semi Conductors
ETFs: DIA QQQ SPY IWM MDY
TNA Short-Term Rates Ten Year Rates PST (Short Treasuries)
DOLLAR-UUP
ALLSTOCKs
COIN (Bit
Coin ETF)
USO-CrudeOil DBO BLDP FAS GLD HD IBB JETS JNUG KOL NAIL
NUGT NRGU OIH PALL RSX RETL SDS AGQ SLV SOXL TAN |
TECL TLT TMF TNA UGA USO
China: YINN
CHAU BABA BIDU
Commodities:
CANE
COCO CORN DBC CORN, CUT (paper)
MOO, NRGU
SOYB WEAT UUP (Dollar) LIT
(Lithium) PALL
(Palladium)
Stocks: AA AAPL ADBE AMAT AMGN AMD AMZN ANET AXP BA BAC
BSX CAT CDNS CHKP CNX CPB CRM CVX CMG DE DIS ENPH FB
FSLR FTNT GILD GME GOOG GS HD IBM INTU JPM KO KR LRCX
MRK MRNA MOS MSFT NEM NFLX NKE NOC NUE NVDA PANW PG
PYPL QCOM QDEL REGN REV RE SCHW SNOW SO SQUARE TSLA
TXN XOM V VRTX WFC WMT XLE ZM ZOM
SEMI-Condctors in SOXL:
NVDA. AVGO, AMD. INTC LRCX TXN MCHP NXPI AMAT ON AAOI TSM
HOMEBUILDERS: BLDP NAIL
BZH HOV LEN MHO MTH PHM -
REGIONAL BANKS:
EGBN
FFIC GBCI HMST
Carl Icahn and associates: IEP
MS
JEF
Leveraged Short ETFs:
FAZ - financials, TZA and SRTY- small caps, MZZ - mid caps, TECS -Techs,
SOXS -
semi-conductors LABD
- Biotechs
Bullish MAXCPs http://tigersoftware.com/upping/8-21-2023/Bullish.htm
Bearish MINCPs www.tigersoftware.com/downing/8-21-2023/Bearish.htm |
|
 |
 |
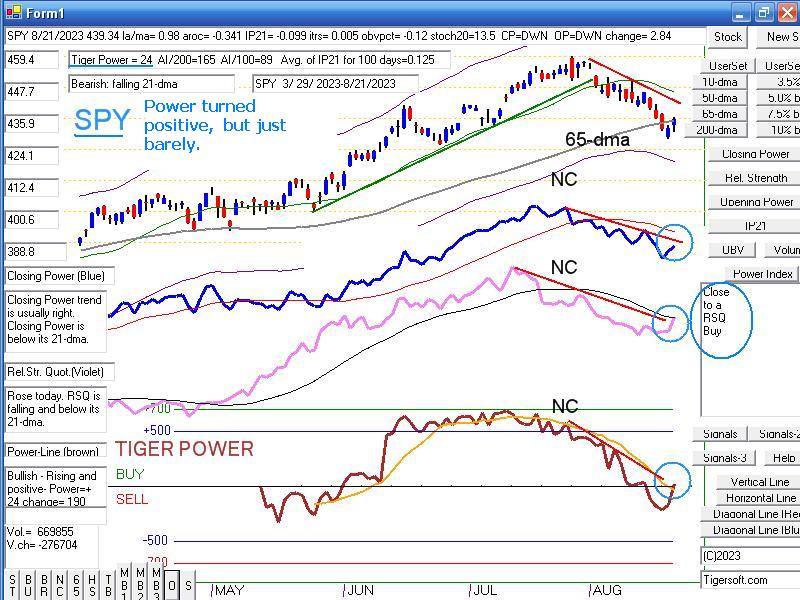 |
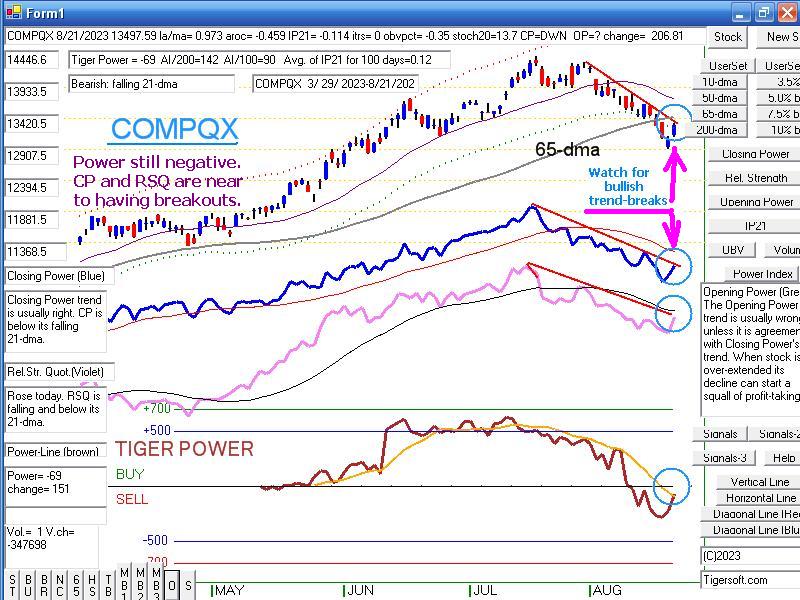 |
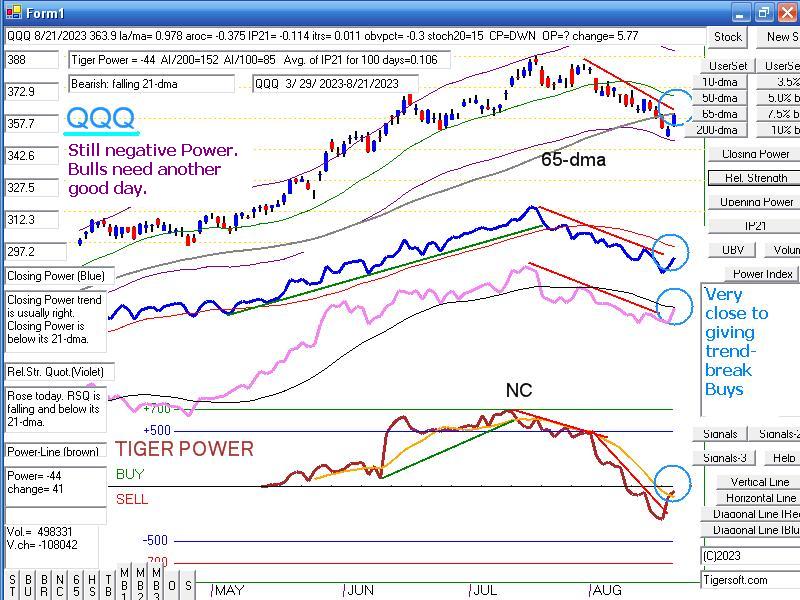 |
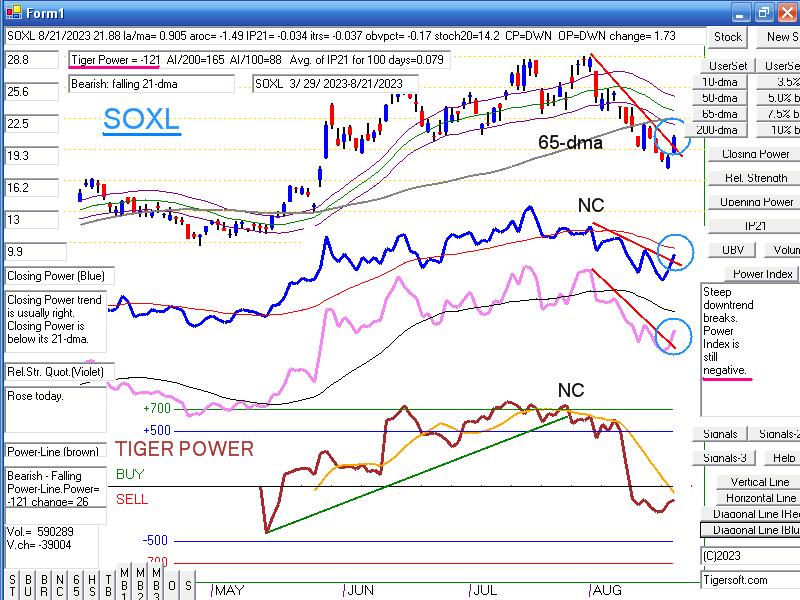 |
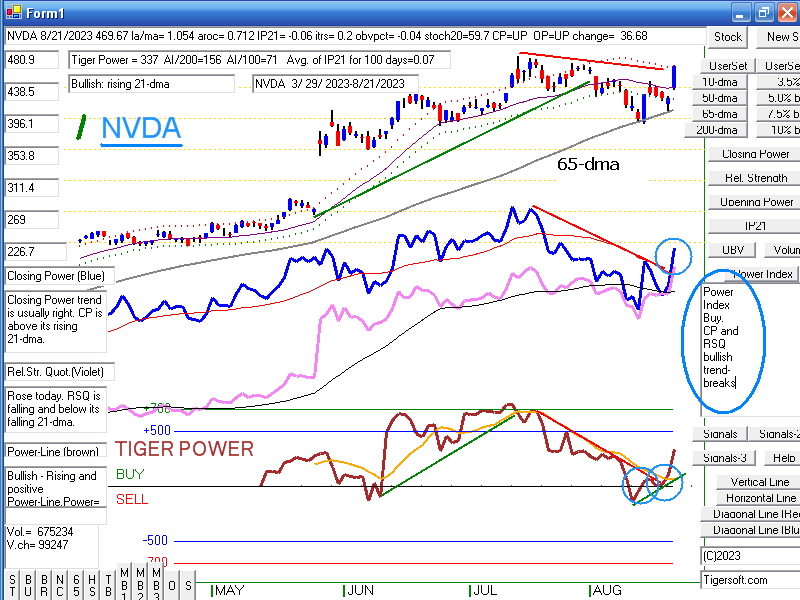 |
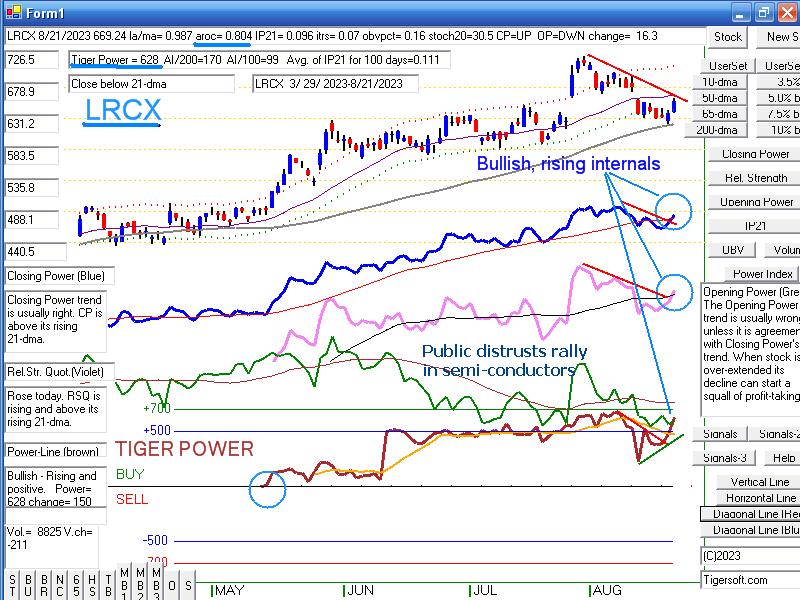 |
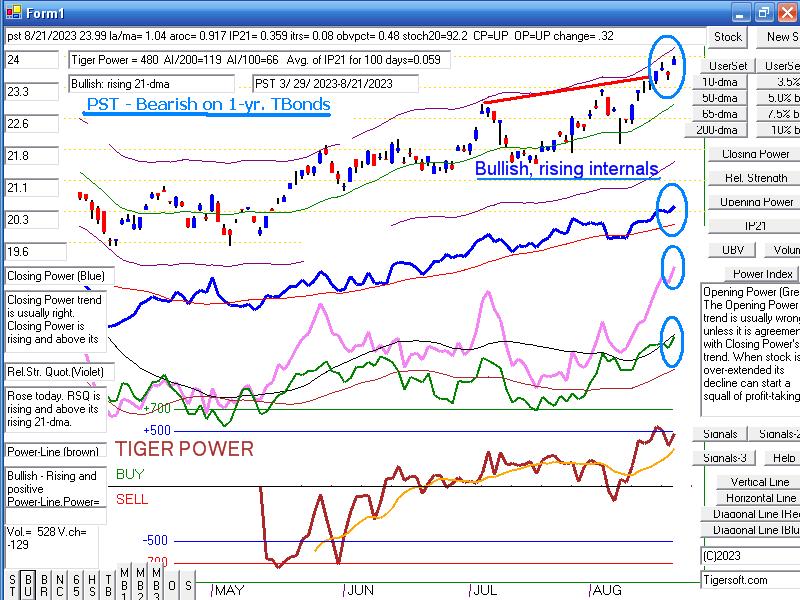 |
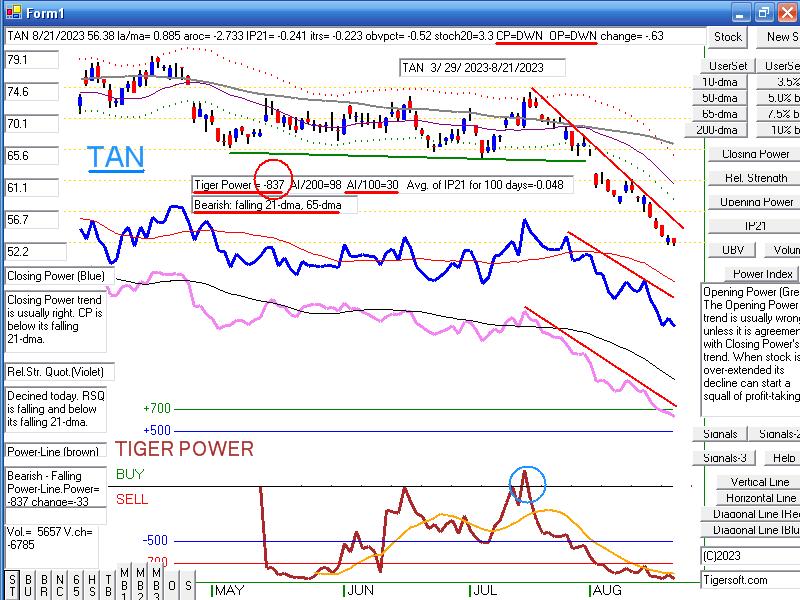 |
| NYSE |
Latest
Close |
Previous
Close |
Week
Ago |
| Issues
traded |
3,023 |
2,995 |
3,026 |
| Advances |
1,113 |
1,618 |
1,207 |
| Declines |
1,804 |
1,243 |
1,706 |
| Unchanged |
106 |
134 |
113 |
| New
highs |
31 |
16 |
47 |
| New
lows |
87 |
92 |
55 |
| Adv.
volume* |
369,863,789 |
573,494,361 |
306,259,645 |
| Decl.
volume* |
426,626,740 |
343,863,593 |
488,657,786 |
| Total
volume* |
805,236,928 |
937,388,762 |
808,449,190 |
| Closing
Arms (TRIN)† |
0.66 |
0.91 |
0.97 |
| Block
trades* |
4,074 |
4,664 |
4,315 |
| Adv.
volume |
1,776,635,483 |
2,247,126,102 |
1,609,428,611 |
| Decl.
volume |
1,895,554,544 |
1,574,707,119 |
2,215,393,512 |
| Total
volume |
3,726,855,043 |
3,940,404,137 |
3,896,417,705 |
| NASDAQ |
Latest
Close |
Previous
Close |
Week
Ago |
| Issues
traded |
4,531 |
4,434 |
4,537 |
| Advances |
2,072 |
2,306 |
1,812 |
| Declines |
2,262 |
1,950 |
2,533 |
| Unchanged |
197 |
178 |
192 |
| New
highs |
44 |
32 |
56 |
| New
lows |
215 |
262 |
205 |
| Closing
Arms (TRIN)† |
0.76 |
1.00 |
0.65 |
| Block
trades |
35,521 |
37,980 |
28,840 |
| Adv.
volume |
2,367,794,566 |
2,585,925,621 |
2,212,865,207 |
| Decl.
volume |
1,958,546,815 |
2,183,940,294 |
2,007,124,138 |
| Total
volume |
4,363,077,964 |
4,801,913,192 |
4,272,026,346 |
|
Table 2 TIGER QUICKSILVER on ETFS - 8/21/2023 ---
Bullish = 1 OIH
Bearish = 3 GLD (-.462) TAN (-.461), YINN
ETF       CLOSE     CHANGE    PIVOT-PT  5-dma AROC   CL-PWR  CANDLE  IP21    ITRS  POWER INDEX
=================================================================================================
DIA       344.67  -.45       349.61       -122.6%     -------  RED   -.117    0       =====
---------------------------------------------------------------------------------------------
COMPQX    13497.59   206.81  13631.05     -107.7%     -------  BLUE  -.074    .002    -.072
---------------------------------------------------------------------------------------------
SPY       439.34   2.84      442.89       -99.5%      -------  BLUE  -.099    .006     -.093
---------------------------------------------------------------------------------------------
QQQ       363.9   5.77       366.42       -88.8%      -------  BLUE  -.113    .013    -.1
---------------------------------------------------------------------------------------------
MDY       471.76   .39       480.39       -159.2%     -------  ----  -.032   -.009    -.041
---------------------------------------------------------------------------------------------
IWM       184.38  -.27       188.14       -168.3%     -------  RED   -.001   -.029    -.03
---------------------------------------------------------------------------------------------
FAS       63.48  -.13        65.32        -423.2%     -------  RED   -.057    .025    -.032
---------------------------------------------------------------------------------------------
RETL      7.05  -.17         7.42         -431.4%     -------  RED    .076    .048     .124
---------------------------------------------------------------------------------------------
SOXL      21.88   1.73       21.8         -249.2%     -------  BLUE  -.033   -.035    -.068
---------------------------------------------------------------------------------------------
TECL      47.44   2.59       47.43        -160.5%     -------  BLUE  -.123   -.001    -.124
---------------------------------------------------------------------------------------------
IBB       127.23   1.82      128.01       -47%        -------  BLUE  -.149   -.031    -.18
---------------------------------------------------------------------------------------------
GLD       175.81   .48       176.59       -35.5%      Bearish  RED   -.408   -.054    -.462
---------------------------------------------------------------------------------------------
DBO       16.04  -.04        16.04        -74.9%      -------  RED   -.015    .128     .113
---------------------------------------------------------------------------------------------
OIH       336.39  -2.32      337.94       -112.8%     Bullish  RED    .068    .192     .26
---------------------------------------------------------------------------------------------
CPER     23.1   .12          22.71         4.4%       -------  BLUE  -.113   -.026    -.139
---------------------------------------------------------------------------------------------
TAN     56.38  -.63          59.58        -479.5%     -------  RED   -.24   -.221     -.461
---------------------------------------------------------------------------------------------
UUP       28.74  -.03        28.68         12.2%      Bullish  ----   .239   -.005     .234
---------------------------------------------------------------------------------------------
CORN      22.1  -.42         21.8         -36.1%      Bearish  RED   -.124   -.078    -.202
---------------------------------------------------------------------------------------------
WEAT      6.15  -.14         6.14         -129.1%     Bearish  RED   -.011   -.05     -.061
---------------------------------------------------------------------------------------------
YINN      28.73  -.17        32.63        -880.4%      -------  BLUE  -.006   -.254    -.26
|
Table 3   RANKING OF KEY DIRECTORIES BASED PCT.OF STOCKS ABOVE 65-DMA
              8/21/23
Bullish = 8
Bearish = 40
---------------------------------------------------------------------------------------
Directory     Current       day-1         day-2         day-3         day-4         day-5
----------------------------------------------------------------------------------------
COAL           1             1             1             1             1             1
EDU            .833          .833          .666          .666          .666          .833
OILGAS         .69           .711          .711          .69           .69           .783
INSURANC       .64           .68           .64           .72           .68           .76
DJI-13         .615          .615          .615          .615          .615          .692
RETAIL         .608          .652          .608          .739          .782          .826
GUNS           .571          .571          .642          .714          .785          .785
REGBANKS       .526          .552          .605          .578          .657          .842
===============================================================================================
BEVERAGE       .5            .5            .428          .5            .5            .5
DOWJONES       .5            .466          .466          .5            .5            .566
===============================================================================================
INDMATER       .458          .5            .472          .458          .472          .569
SP-100         .444          .455          .433          .477          .522          .611
FIDSTKS        .437          .443          .42           .485          .556          .627
INDEXES        .432          .394          .394          .497          .648          .67
FOOD           .428          .428          .408          .448          .448          .469
HIGHPRIC       .428          .372          .367          .519          .623          .692
NASD-100       .425          .366          .336          .425          .524          .584
INFRA          .419          .451          .483          .612          .612          .612
CHEM           .418          .465          .418          .395          .441          .604
RUS-1000       .413          .419          .416          .482          .525          .594
SP500          .399          .409          .395          .464          .517          .59
COMODITY       .394          .394          .368          .421          .421          .447
HOSPITAL       .384          .384          .384          .461          .461          .461
TRANSP         .368          .368          .368          .421          .473          .631
FINANCE        .362          .412          .462          .425          .512          .637
AUTO           .358          .358          .32           .396          .433          .509
COMPUTER       .35           .35           .35           .45           .5            .55
SOFTWARE       .339          .303          .267          .375          .464          .517
NIFTY          .318          .295          .295          .295          .477          .5
EAT            .317          .341          .292          .365          .414          .487
ELECTRON       .315          .27           .27           .308          .39           .451
HACKERS        .312          .25           .25           .437          .437          .437
MARIJUAN       .3            .4            .4            .3            .3            .3
LOWPRICE       .29           .316          .302          .328          .348          .381
BIGBANKS       .285          .285          .285          .285          .571          .857
BIOTECH        .284          .269          .276          .299          .35           .36
SEMI           .282          .206          .217          .25           .358          .402
GREEN          .277          .277          .333          .388          .444          .611
GAMING         .263          .263          .263          .315          .315          .473
HOMEBLDG       .25           .357          .357          .857          .928          .857
MILITARY       .23           .269          .307          .346          .384          .423
REIT           .204          .27           .295          .352          .401          .467
CHINA          .195          .219          .292          .195          .292          .243
JETS           .153          .153          .23           .153          .23           .461
UTILITY        .153          .153          .128          .179          .153          .23
ETFS           .145          .127          .181          .181          .254          .327
COPPER         .142          .142          .285          .142          .285          .285
GOLD           .088          .088          .111          .088          .111          .2
BONDFUND       .045          .045          .068          .091          .114          .103
SOLAR          0             0             0             0             .062          .062
|
==================================================================================
Sunday 8/20/2023 6:23 PM Futures DJI + 50
NASDAQ +40 Data used here for 8/18/2023
https://www.wsj.com/market-data/quotes/futures/YM00
| |
8/18/2023
|
|
| |
Market Comments
DJI,
SP-500, NYSE and FAS are trying to bounce back up from
their
rising 65-dma even though all or most of their internal indicators
are
still falling. What happens to the 10-year rates, now that they
have
reached their year's highs, will be very important. See the
10-year bonds' yield chart, the first shown below. The 35000 broken
support will likely act as resistance and limit any rally. From the DJI
chart
below, we should notice how the volatily has narrowed because prices
seem
bounded by a green rising support-line and a red resistance-line
that
go back almost a year. Rising wedge patterns are distinctly
bearish when the uptrend is finally broken. We have to be fearful
that
this will happen in the often bearish month of September.
But
in the short-term, a recovery-effort seems most likely. See the
CCI,
Stochastic-20 and RSI Lines on the DJI charts. The 2006
version of Peerless did give a buy-at-the-lower-band Buy B2.
The
current version has not. Watch to see if the weaker tech sector
can
rebound very much. QQQ, TECL and the NASDAQ are now
well
below the support of their 65-dma. This line will act as resistance
when
they try to rebound. The real danger will be if the rally fails
badly
and Professionals resume their selling in the DJI, NYSE and
FAS
and the Closing Powers turn back down and their Accumulation
Indexes become more negative.
The
key charts' Closing Powers have fallen far enough below their
21-day ma, so there could be a few days' strength in their Closing
Powers and they would face the resistance of their falling 21-dma.
This
would allow them to rally as week. But then they would start
falling back from their falling Closing Power 21-day ma.
Tech
stocks have become weaker than the DJI. Thus, the falling
Closer Powers, negative Accumulation and negative Power-Line
readings below. MSFT and AAPL will need to turn up this coming
week.
NVDA reports earnngs. "Big money" has been a heavy selling
group
here. As the leader, of tech and chip stocks, this will be the
coming week's biggest event. Bullishly, its daily "Power-Line" did
turn
up on Friday.
Often
Friday is a low-trading day. It was not this Friday, as technical
traders have decided to "take a stand" with the DJI over-sold and
at
its rising 65-dma.
The
market to finds more and new leadership if it is going to make
a
meaningful recovery. Home-builders will need to turn back up
after
their sell-off. OIL will have to fight off its potential H/S,
as
will NFLX and VRTX, among the stocks we follow each night.
There
are plenty of Bearish MINCPs. Many are in Solar Energy.
Federal subsidies are ending here. Usually, before a good market
rally
is staged, professional shorts can be detected covering their
shorts among the weakest stocks. We don't see that yet.
New Visual Net Charts
As
you will see below, more emphasis is being placed on Power-Line
It is
a composite indicator. 19 different technical factors play a role.
The
more recent levels of accumulation are much more heavily weighted.
Moves
by prices above and below the 65-dma and Closing Power
above
and below its 21-dma are particularly important, hence how
quickly the Power-Line drops and rising. But before this happens
to
the downside, the Power-Line usually rolls over and fails to confirm
a new
high. |
|
| |
8/18/2023
2022 PEERLESS DJI, Signals, Indicators Daily DJI Volume
10-DayUp/Down Vol Stoch-20 CCI RSI Pct of All Stocks above 65-dma
Inverted Traders Index
DJI-IPA DJI-OBV
NASDAQ S&P OEX NYSE DJ-15 DJ-20 DJI-30
Old Peerless 2006
version
Tiger Index of Big
Banks Bond Funds Gold Stocks Housing Stocks
Insurance-Stocks
Regional
Banks Russell-1000
Semi Conductors
ETFs: DIA QQQ SPY IWM MDY
TNA Short-Term Rates Ten Year Rates PST (Short Treasuries)
DOLLAR-UUP
ALLSTOCKs
COIN (Bit
Coin ETF)
USO-CrudeOil DBO BLDP FAS GLD HD IBB JETS JNUG KOL NAIL
NUGT NRGU OIH PALL RSX RETL SDS AGQ SLV SOXL TAN |
TECL TLT TMF TNA UGA USO
China: YINN
CHAU BABA BIDU
Commodities:
CANE
COCO CORN DBC CORN, CUT (paper)
MOO, NRGU
SOYB WEAT UUP (Dollar) LIT
(Lithium) PALL
(Palladium)
Stocks: AA AAPL ADBE AMAT AMGN AMD AMZN ANET AXP BA BAC
BSX CAT CDNS CHKP CNX CPB CRM CVX CMG DE DIS ENPH FB
FSLR FTNT GILD GME GOOG GS HD IBM INTU JPM KO KR LRCX
MRK MRNA MOS MSFT NEM NFLX NKE NOC NUE NVDA PANW PG
PYPL QCOM QDEL REGN REV RE SCHW SNOW SO SQUARE TSLA
TXN XOM V VRTX WFC WMT XLE ZM ZOM
SEMI-Condctors in SOXL:
NVDA. AVGO, AMD. INTC LRCX TXN MCHP NXPI AMAT ON AAOI TSM
HOMEBUILDERS: BLDP NAIL
BZH HOV LEN MHO MTH PHM -
REGIONAL BANKS:
EGBN
FFIC GBCI HMST
Carl Icahn and associates: IEP
MS
JEF
Leveraged Short ETFs:
FAZ - financials, TZA and SRTY- small caps, MZZ - mid caps, TECS -Techs,
SOXS -
semi-conductors LABD
- Biotechs
Bullish MAXCPs http://tigersoftware.com/upping/8-18-2023/Bullish.htm
Bearish MINCPs www.tigersoftware.com/downing/8-18-2023/Bearish.htm |
|
Rates fell back on Friday, but they still are dangerously
close to making a new high. Based on the previous 1%
range, a breakout nw would set up a target of 5.3% for
the citically important 10-year Bonds.
 |


 |
 |
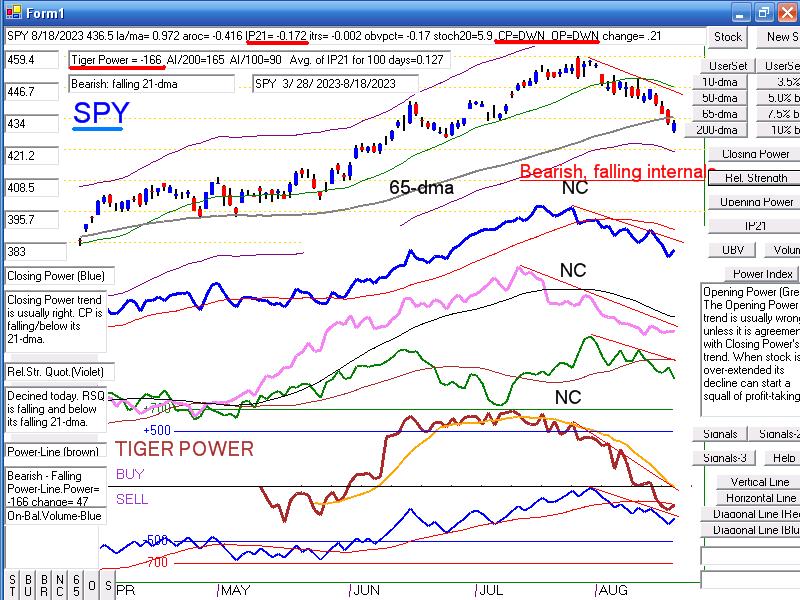 |
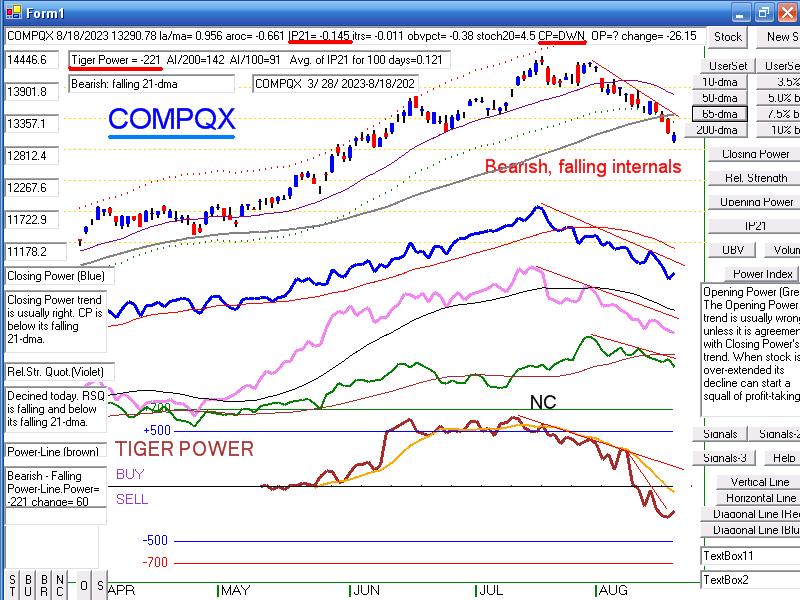 |
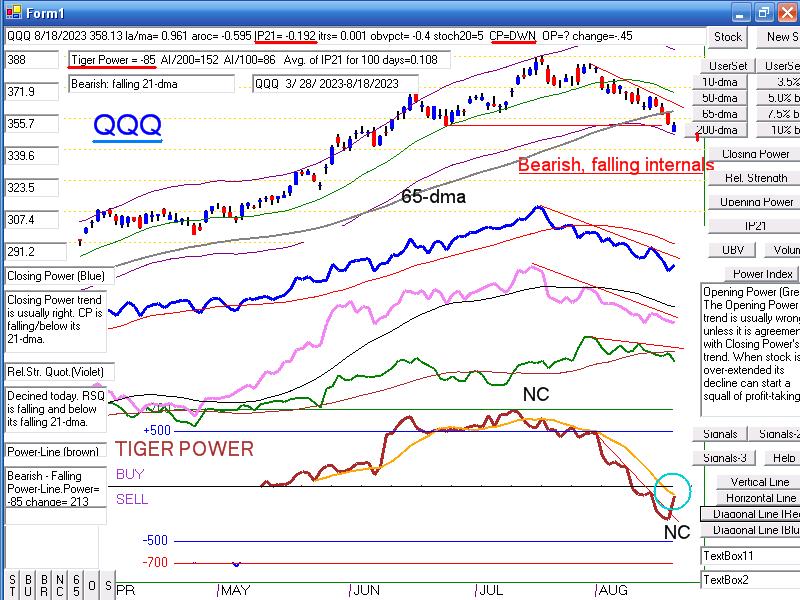 |
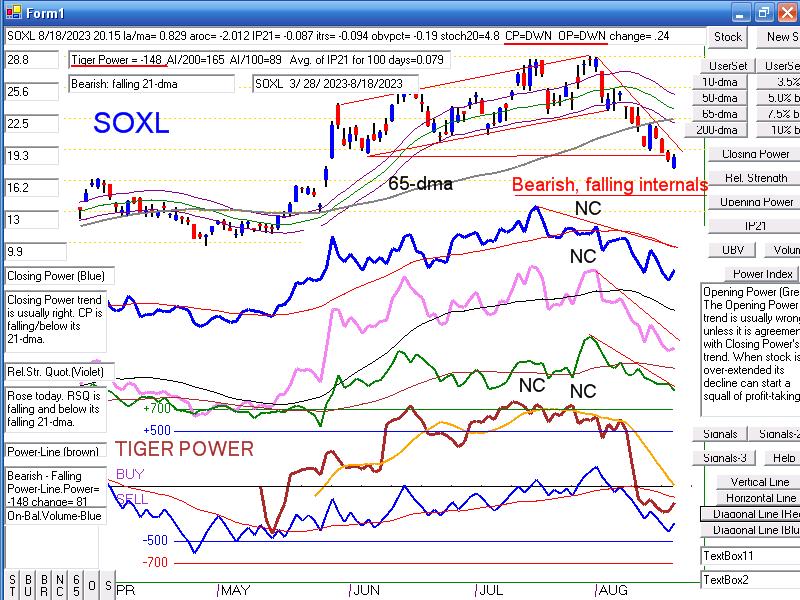 |
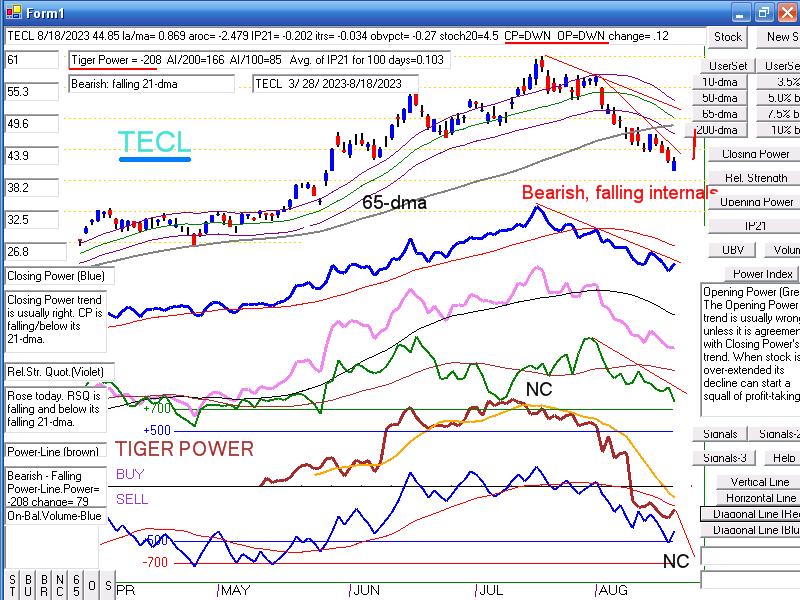 |
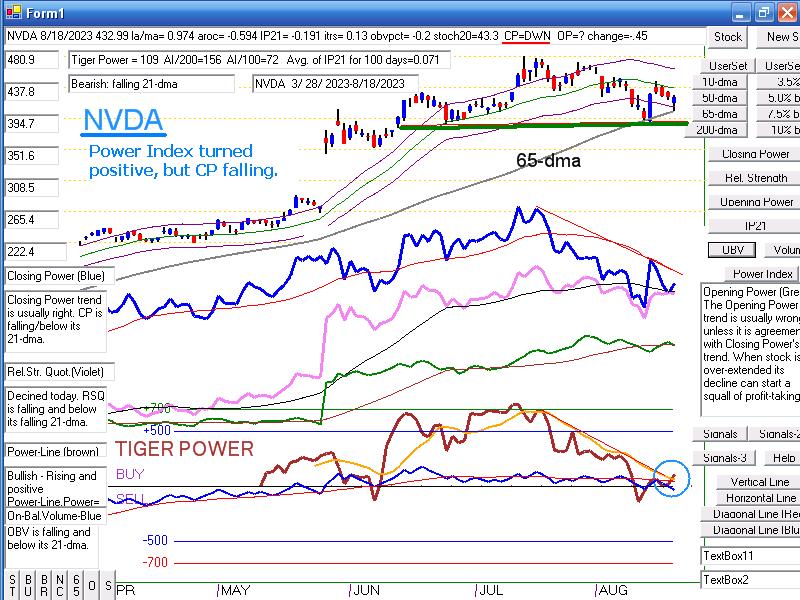 |
 |
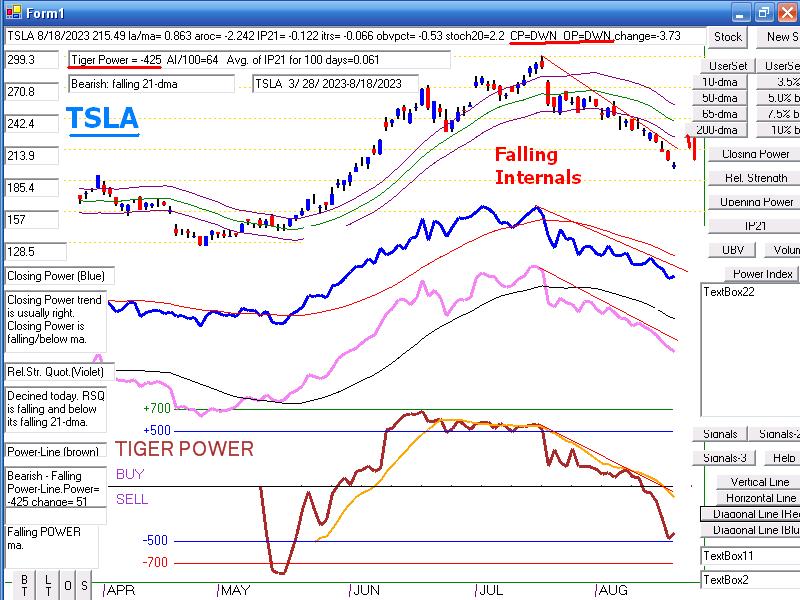 |
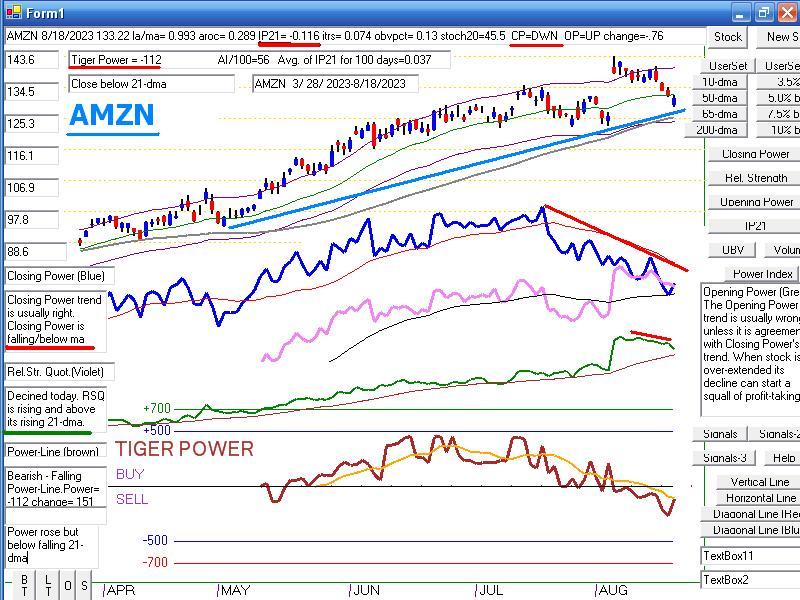

|
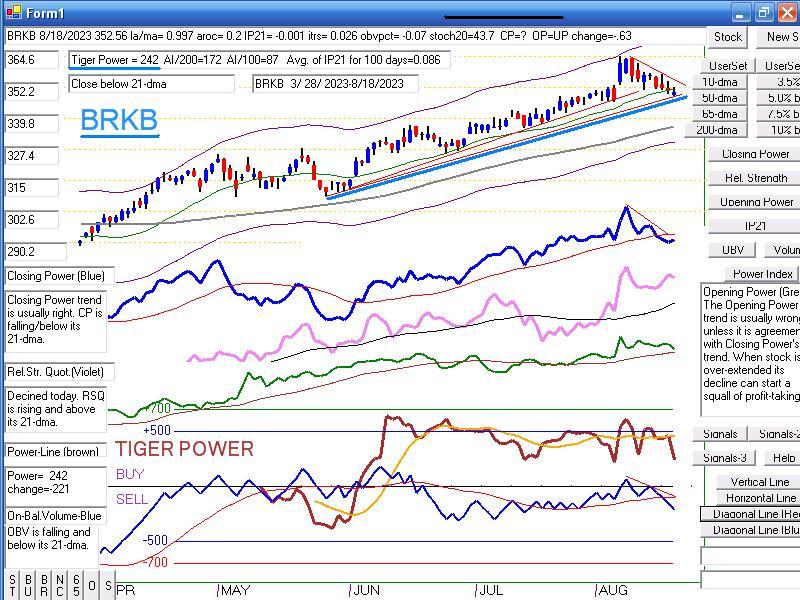 |
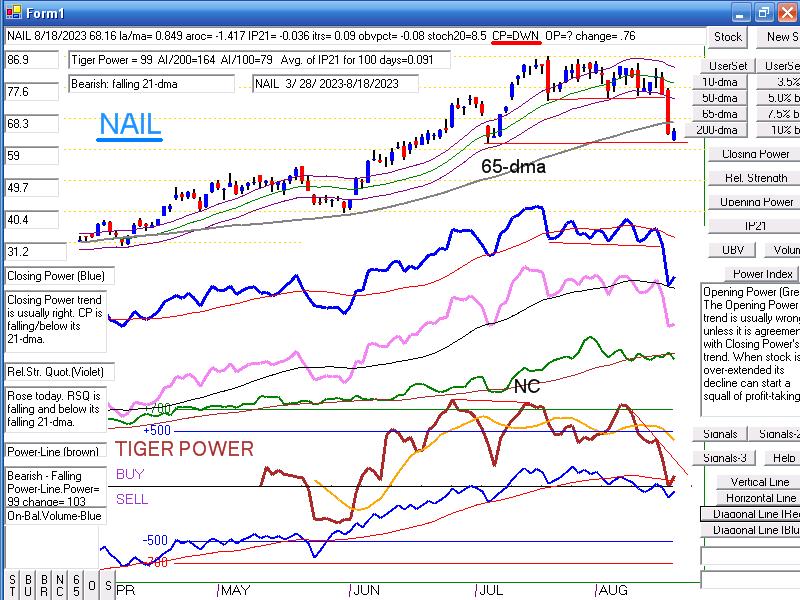 |
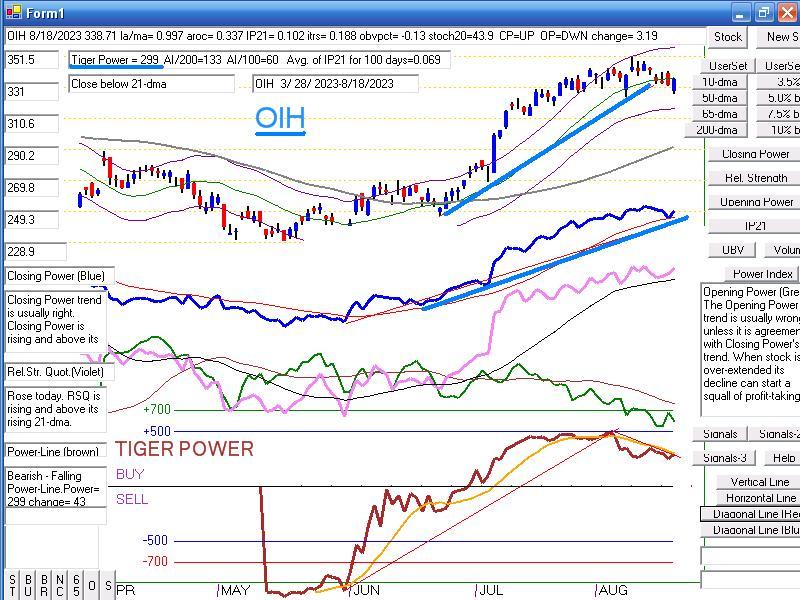 |
BEARISH SOLAR ENERGY
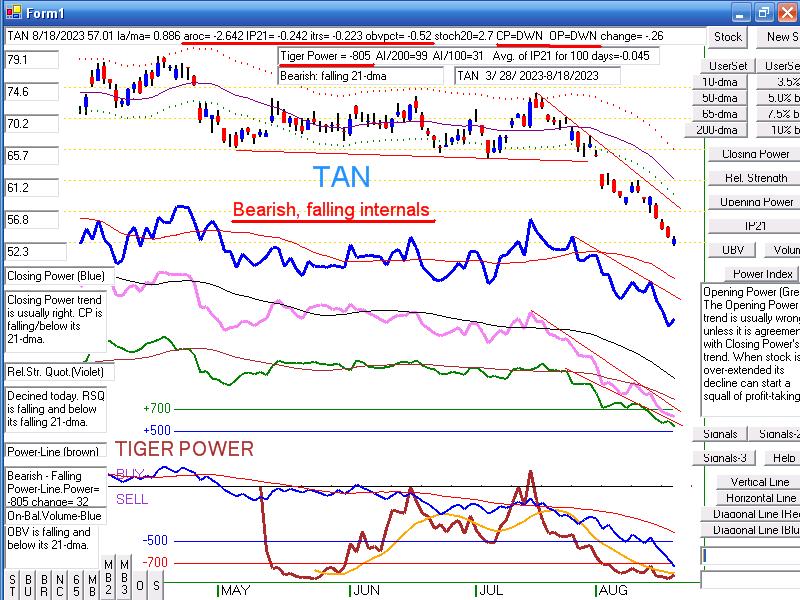
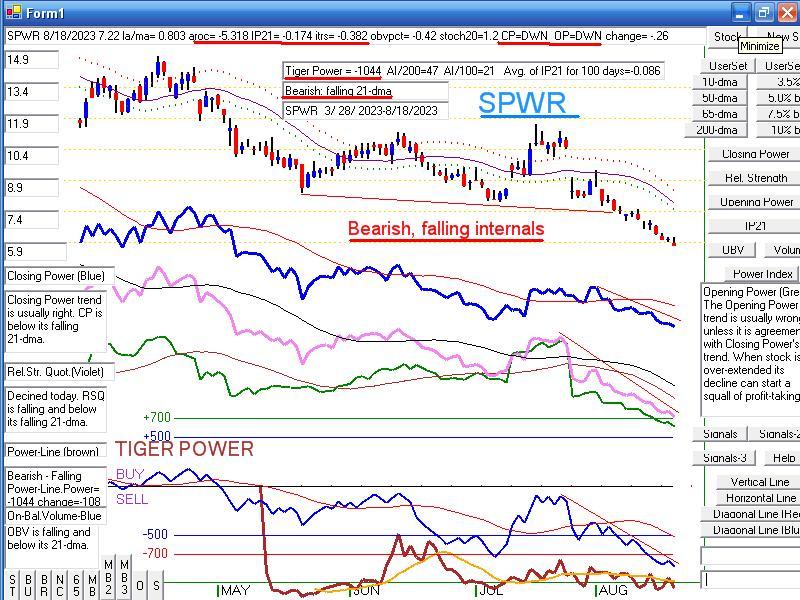 |
Table 1 - Breadth and Volume
| NYSE |
Latest
Close |
Previous
Close |
Week
Ago |
| Issues
traded |
2,995 |
3,022 |
3,022 |
| Advances |
1,618 |
897 |
1,498 |
| Declines |
1,243 |
2,017 |
1,376 |
| Unchanged |
134 |
108 |
148 |
| New
highs |
16 |
19 |
40 |
| New
lows |
92 |
88 |
37 |
| Adv.
volume* |
573,494,361 |
330,043,918 |
375,454,265 |
| Decl.
volume* |
343,863,593 |
527,148,924 |
341,562,190 |
| Total
volume* |
937,388,762 |
871,033,126 |
745,118,988 |
| Closing
Arms (TRIN)† |
0.91 |
0.70 |
0.98 |
| Block
trades* |
4,664 |
4,249 |
4,076 |
| Adv.
volume |
2,247,126,102 |
1,507,458,203 |
1,880,949,672 |
| Decl.
volume |
1,574,707,119 |
2,365,469,553 |
1,692,342,093 |
| Total
volume |
3,940,404,137 |
3,943,708,929 |
3,753,293,467 |
| NASDAQ |
Latest
Close |
Previous
Close |
Week
Ago |
| Issues
traded |
4,434 |
4,509 |
4,472 |
| Advances |
2,306 |
1,448 |
1,943 |
| Declines |
1,950 |
2,864 |
2,369 |
| Unchanged |
178 |
197 |
160 |
| New
highs |
32 |
30 |
59 |
| New
lows |
262 |
288 |
177 |
| Closing
Arms (TRIN)† |
1.00 |
1.52 |
0.78 |
| Block
trades |
37,980 |
48,611 |
38,925 |
| Adv.
volume |
2,585,925,621 |
1,306,735,501 |
2,348,180,166 |
| Decl.
volume |
2,183,940,294 |
3,933,452,190 |
2,231,889,815 |
| Total
volume |
4,801,913,192 |
5,280,182,006 |
4,638,889,885 |
|
Table 2 TIGER QUICKSILVER on ETFS - 8/17/2023 ---
Bullish = 1 OIH
Bearish = 3 GLD (-.475) TAN (-.462), YINN
ETF       CLOSE     CHANGE    PIVOT-PT  5-dma AROC   CL-PWR  CANDLE  IP21    ITRS  POWER INDEX
=================================================================================================
DIA       345.12   .06       353.21       -112.7%     -------  BLUE  -.153    0       =====
---------------------------------------------------------------------------------------------
COMPQX    13290.78  -26.15   13788.33     -130.4%     -------  BLUE  -.145   -.009    -.154
---------------------------------------------------------------------------------------------
SPY       436.5   .21        448.11       -103.4%     -------  BLUE  -.172    0       -.172
---------------------------------------------------------------------------------------------
QQQ       358.13  -.45       370.35       -111.1%     -------  BLUE  -.192    .003    -.189
---------------------------------------------------------------------------------------------
MDY       471.37   1.62      486.94       -153.7%     -------  BLUE  -.082   -.02     -.102
---------------------------------------------------------------------------------------------
IWM       184.65   1         190.66       -168.7%     -------  BLUE  -.047   -.037    -.084
---------------------------------------------------------------------------------------------
FAS       63.61  -.22        69.01        -439.8%     -------  BLUE  -.121    .018    -.103
---------------------------------------------------------------------------------------------
RETL      7.22   .27         7.68         -277.6%     -------  BLUE   .05    .108      .158
---------------------------------------------------------------------------------------------
SOXL      20.15   .24        22.93        -232.8%     -------  BLUE  -.086   -.092    -.178
---------------------------------------------------------------------------------------------
TECL      44.85   .12        48.93        -199.9%     -------  BLUE  -.201   -.033    -.234
---------------------------------------------------------------------------------------------
IBB       125.41  -.15       128.42       -124.1%     -------  BLUE  -.15   -.05      -.2
---------------------------------------------------------------------------------------------
GLD       175.33   .03       177.06       -64.3%      Bearish  RED   -.425   -.05    -.475
---------------------------------------------------------------------------------------------
DBO       16.08   .18        16.28        -93.3%      -------  BLUE   .029    .103    .132
---------------------------------------------------------------------------------------------
OIH       338.71   3.19      344.03       -125.6%     Bullish  BLUE   .102    .19     .292
---------------------------------------------------------------------------------------------
CPER     22.98   .13         23.08        -21.9%      -------  BLUE  -.137   -.03    -.167
---------------------------------------------------------------------------------------------
TAN     57.01  -.26          62.02        -402.3%     -------  BLUE  -.241   -.221   -.462
---------------------------------------------------------------------------------------------
UUP       28.77   .02        28.67         34.9%      Bullish  ----   .267   -.018    .249
---------------------------------------------------------------------------------------------
CORN      22.52   .22        22.26         51.9%      -------  BLUE  -.106   -.056   -.162
---------------------------------------------------------------------------------------------
WEAT      6.29   .21         6.31         -120.5%     Bearish  BLUE  -.029   -.016   -.045
---------------------------------------------------------------------------------------------
YINN      28.9  -2.3         34.28        -977.1%     Bearish  ----  -.071   -.232   -.303
|
Table 3 RANKING OF KEY DIRECTORIES BASED PCT.OF STOCKS ABOVE 65-DMA
8/18/23
Bullish = 8
Bearish = 40
---------------------------------------------------------------------------------------
Directory Current day-1 day-2 day-3 day-4 day-5
----------------------------------------------------------------------------------------
COAL 1 1 1 1 1 1
EDU .833 .666 .666 .666 .833 .833
OILGAS .711 .711 .69 .69 .783 .793
INSURANC .68 .64 .72 .68 .76 .72
RETAIL .652 .608 .739 .782 .826 .847
DJI-13 .615 .615 .615 .615 .692 .692
GUNS .571 .642 .714 .785 .785 .785
REGBANKS .552 .605 .578 .657 .842 .947
======================================================================================
BEVERAGE .5 .428 .5 .5 .5 .5
INDMATER .5 .472 .458 .472 .569 .541
=======================================================================================
DOWJONES .466 .466 .5 .5 .566 .566
CHEM .465 .418 .395 .441 .604 .627
SP-100 .455 .433 .477 .522 .611 .633
INFRA .451 .483 .612 .612 .612 .612
FIDSTKS .443 .42 .485 .556 .627 .633
FOOD .428 .428 .428 .448 .469 .51
RUS-1000 .42 .416 .481 .525 .596 .596
FINANCE .412 .462 .425 .5 .662 .7
SP500 .409 .395 .464 .515 .59 .596
MARIJUAN .4 .4 .3 .3 .3 .3
COMODITY .394 .394 .394 .421 .447 .5
INDEXES .394 .394 .497 .648 .675 .659
HOSPITAL .384 .384 .461 .461 .461 .461
HIGHPRIC .372 .367 .519 .623 .701 .666
TRANSP .368 .368 .421 .473 .631 .578
NASD-100 .366 .336 .425 .524 .584 .534
AUTO .358 .339 .396 .433 .528 .509
HOMEBLDG .357 .357 .857 .928 .857 .892
COMPUTER .35 .35 .45 .5 .55 .5
EAT .341 .292 .365 .414 .487 .512
SOFTWARE .321 .285 .375 .464 .5 .5
LOWPRICE .316 .304 .331 .348 .381 .392
NIFTY .295 .295 .295 .477 .5 .5
BIGBANKS .285 .285 .285 .571 .857 .857
GREEN .277 .333 .388 .444 .611 .555
ELECTRON .27 .27 .308 .39 .443 .406
REIT .27 .278 .36 .409 .467 .573
MILITARY .269 .307 .346 .384 .384 .461
BIOTECH .266 .274 .302 .35 .362 .35
GAMING .263 .263 .263 .368 .473 .368
HACKERS .25 .25 .437 .437 .437 .437
CHINA .219 .292 .195 .292 .243 .365
SEMI .206 .217 .25 .358 .402 .304
JETS .153 .23 .153 .23 .461 .384
UTILITY .153 .128 .179 .153 .23 .282
COPPER .142 .285 .142 .285 .285 .285
ETFS .127 .181 .181 .254 .345 .381
GOLD .088 .111 .088 .111 .2 .2
BONDFUND .045 .057 .091 .126 .114 .137
SOLAR 0 0 0 .062 .062 .062
|
==================================================================================
Friday 8/18/2023 6:06 AM Futures: DJI -177 Nasdaq -130 Data used here
for 8/17/2023
| |
8/17/2023
|
|
| |
Market Comments
This has been an easy decline to avoid. But do not let that cause you to
make the mistake of underestimating the current market's bearishness.
Or how easily the FED can over-stay and carry to excess its
"hawkishness".
Any uncertainty about the direction of interest rates has quickly disappeared
these last few days. While there are a few "doves" on the Fed's
policy-making
FOMC, they are in a distinct minority. Next week, Fed Chairman Powell is
expected to speak like a determined "hawk" when they all gather in Wyoming
and ponder their "work"
Keeping it simple, all we have had to do was to watch the change in direction
of the Closing Power and Relative Strength Lines of the most volatile sectors,
tech stocks, the NASDAQ, QQQ, TECL and finally SOXL, to see what
the FED was planning to do later this month and next. Now the same
ETFs and stocks like AAPL, MSFT and TSLA have knifed down right
through their 65-dma and are showing particularly heavy "Big Money"
selling in the form of 12-month lows by their IP21-Accumulation Index.
The DJI was slower to top out. It needed to complete a failed breakout
above 35000. This is itself a dangerous pattern. Its internal strength
indicators shown in the DJI chart below are now all fallng. So, it looks
like it must test its own 65-dma soon, just as the SP-500 and SPY are
doing now.
The speed with which the market has weakened is seen in a lot of ways.
Two weeks ago 60% of all stocks and ETFs were above their 65-dma.
Now the number is just 38%. See the rapidly growing negativity in
Tables 2 and 3. The 7% mortgage rates even forced the previously
strong hone-builders into a violent dive below support today.
The bearish MINCPs offer the best way to hedge or aggressively make
money in this environment. Riding out what could be a very big decline
will be difficult. Many times the more obvious tops turn out to be
the most bearish. From our vantage point, including watching
how the 10-year rate has been rising and may now make a new high, the
job of predicting a decline has been simple enough. That makes this top
more dangerous, not less.
|
|
| |
8/17/2023
2022 PEERLESS DJI, Signals, Indicators Daily DJI Volume
10-DayUp/Down Vol Stoch-20 CCI RSI Pct of All Stocks above 65-dma
Inverted Traders Index
DJI-IPA DJI-OBV Short-Term Rates
NASDAQ S&P OEX NYSE DJ-15 DJ-20 DJI-30 Old Peerless 2006 version
Tiger Index of Big
Banks Bond Funds Gold Stocks Housing Stocks
Insurance-Stocks
Regional
Banks Russell-1000
Semi Conductors
2006 vers-Peerless is no loner vailable.
Sorry. It is giving an error message and
without the code cannot be fixed.
ETFs: DIA QQQ SPY IWM MDY
TNA Short-Term Rates Ten Year Rates PST (Short Treasuries)
DOLLAR-UUP
ALLSTOCKs
COIN (Bit
Coin ETF)
USO-CrudeOil DBO BLDP FAS GLD HD IBB JETS JNUG KOL NAIL NUGT
NRGU OIH PALL RSX RETL SDS AGQ SLV SOXL TAN TECL TLT TMF TNA
UGA USO China:
YINN
CHAU
Commodities: CANE COCO CORN DBC JJC, NIB CORN, CUT (paper)
MOO, NRGU
SOYB WEAT UUP (Dollar) LIT
(Lithium) PALL
(Palladium)
Stocks
AA AAPL ADBE AMAT AMGN AMD AMZN ANET AXON AXP
BA BABA BAC BIDU BLDP BSX CAT CDNS CHKP CNX CPB CRM CVX CMG
DE DIS ENPH FB FSLR FTNT GILD GME GOOG GS HD IBM INTU JPM KO KR
LRCX MRK MRNA MOS MSFT NEM NFLX NKE NOC NUE NVDA PANW PG PYPL
QCOM QDEL REGN REV RE SCHW SNOW SO SQUARE TSLA TXN XOM V VRTX
WFC WMT XLE ZM ZOM
Biggest SEMI-Condctors in SOXL: NVDA. AVGO, AMD. INTC TXN MCHP NXPI AMAT ON
AAOI TSM
HOMEBUILDERS:
NAIL
BZH HOV MHO MTH PHM -
REGIONAL BANKS:
EGBN
FFIC GBCI HMST
Carl Icahn and associates: IEP
MS
JEF
Leveraged Short ETFs:
FAZ - financials, TZA and SRTY- small caps, MZZ - mid caps, TECS -Techs,
SOXS -
semi-conductors LABD
- Biotechs
Bullish MAXCPs http://tigersoftware.com/upping/8-17-2023/Bullish.htm
Bearish MINCPs
www.tigersoftware.com/downing/8-17-2023/Bearish.htm |
|
 |
 |
 |
 |
 |
 |
 |
 |
 |
 |
 |
 |
 |
 |
|
 |
 |
Table 1 - Daily/Breadth Volume Statistics
| NYSE |
Latest
Close |
Previous
Close |
Week
Ago |
| Issues
traded |
3,022 |
3,017 |
3,003 |
| Advances |
897 |
760 |
1,282 |
| Declines |
2,017 |
2,155 |
1,609 |
| Unchanged |
108 |
102 |
112 |
| New
highs |
19 |
42 |
72 |
| New
lows |
88 |
95 |
31 |
| Adv.
volume* |
330,043,918 |
193,374,211 |
382,072,098 |
| Decl.
volume* |
527,148,924 |
587,716,911 |
459,888,599 |
| Total
volume* |
871,033,126 |
795,140,049 |
851,098,465 |
| Closing
Arms (TRIN)† |
0.70 |
1.02 |
0.69 |
| Block
trades* |
4,249 |
3,972 |
4,424 |
| Adv.
volume |
1,507,458,203 |
946,690,459 |
2,388,367,572 |
| Decl.
volume |
2,365,469,553 |
2,731,728,734 |
2,075,102,194 |
| Total
volume |
3,943,708,929 |
3,753,917,788 |
4,504,373,967 |
| NASDAQ |
Latest
Close |
Previous
Close |
Week
Ago |
| Issues
traded |
4,509 |
4,484 |
4,497 |
| Advances |
1,448 |
1,172 |
1,990 |
| Declines |
2,864 |
3,137 |
2,294 |
| Unchanged |
197 |
175 |
213 |
| New
highs |
30 |
45 |
79 |
| New
lows |
288 |
283 |
180 |
| Closing
Arms (TRIN)† |
1.52 |
0.39 |
0.98 |
| Block
trades |
48,611 |
73,590 |
41,787 |
| Adv.
volume |
1,306,735,501 |
3,025,999,460 |
2,451,381,880 |
| Decl.
volume |
3,933,452,190 |
3,172,403,988 |
2,766,074,266 |
| Total
volume |
5,280,182,006 |
6,243,761,551 |
5,299,083,925 |
|
Table 2 TIGER QUICKSILVER on ETFS - 8/17/2023 ---
Bullish = 1 OIH
Bearish = 7 QQQ, SOXL, TECL, IBB, GLD TAN (-.514), YINN
ETF       CLOSE     CHANGE    PIVOT-PT  5-dma AROC   CL-PWR  CANDLE  IP21    ITRS  POWER INDEX
=================================================================================================
DIA       345.06  -2.71      353          -97.3%      -------  RED   -.186    0       ======
---------------------------------------------------------------------------------------------
COMPQX    13316.93  -157.7   13644.85     -154.2%     -------  RED   -.209   -.023    -.232
---------------------------------------------------------------------------------------------
SPY       436.29  -3.35      445.65       -108.2%     -------  RED   -.236   -.007    -.243
---------------------------------------------------------------------------------------------
QQQ       358.58  -3.96      366.24       -136.4%     -------  RED   -.264   -.016    -.28
---------------------------------------------------------------------------------------------
MDY       469.75  -6.18      486.12       -170.6%     -------  RED   -.138   -.012    -.15
---------------------------------------------------------------------------------------------
IWM       183.65  -2.19      190.99       -186.8%     -------  RED   -.11   -.03      -.14
---------------------------------------------------------------------------------------------
FAS       63.83  -1.08       69.46        -388.6%     -------  RED   -.048    .03     -.018
---------------------------------------------------------------------------------------------
RETL      6.95  -.29         7.63         -452.1%     -------  RED    .002    .128     .13
---------------------------------------------------------------------------------------------
SOXL      19.91  -.62        21.14        -663.9%     -------  RED   -.156   -.11     -.266
---------------------------------------------------------------------------------------------
TECL      44.73  -1.37       46.72        -327%       -------  RED   -.278   -.083    -.361
---------------------------------------------------------------------------------------------
IBB       125.56  -.62       128.57       -102.1%     -------  RED   -.215   -.054    -.269
---------------------------------------------------------------------------------------------
GLD       175.3  -.27        177.6        -65%        Bearish  RED   -.427   -.065    -.492
---------------------------------------------------------------------------------------------
DBO       15.9   .11         16.38        -142.2%     -------  RED    0    .104        .104
---------------------------------------------------------------------------------------------
OIH       335.52  -1.18      347.26       -117.6%     Bullish  RED    .049    .211     .26
---------------------------------------------------------------------------------------------
CPER     22.85   .2          23.08        -91.5%      -------  RED   -.156   -.04     -.196
---------------------------------------------------------------------------------------------
TAN     57.27  -.92          61.82        -452.5%     -------  RED   -.291   -.223    -.514
---------------------------------------------------------------------------------------------
UUP       28.75  -.01        28.57         41.9%      Bullish  BLUE   .29   -.022      .268
---------------------------------------------------------------------------------------------
CORN      22.3   .23         22.29        -69.8%      -------  BLUE  -.144   -.087    -.231
---------------------------------------------------------------------------------------------
WEAT      6.08  -.08         6.44         -332.8%     Bearish  ----  -.091   -.072    -.163
---------------------------------------------------------------------------------------------
YINN      31.2   .62         35.31        -1136.4%    Bearish  RED   -.063   -.2      -.263
|
Table 3      RANKING OF KEY DIRECTORIES BASED PCT.OF STOCKS ABOVE 65-DMA
             8/17/23
 Bullish = 8
 Bearish = 42
---------------------------------------------------------------------------------------
Directory     Current       day-1         day-2         day-3         day-4         day-5
----------------------------------------------------------------------------------------
COAL           1             1             1             1             1             1
OILGAS         .711          .69           .69           .783          .793          .773
EDU            .666          .666          .666          .833          .833          .833
GUNS           .642          .714          .785          .785          .785          .785
INSURANC       .64           .72           .68           .76           .72           .76
DJI-13         .615          .615          .615          .692          .692          .692
RETAIL         .608          .739          .782          .826          .847          .869
REGBANKS       .605          .578          .657          .842          .947          .894
================================================================================================
INFRA          .483          .612          .612          .612          .612          .612
INDMATER       .472          .458          .472          .569          .555          .541
DOWJONES       .466          .5            .5            .566          .566          .6
FINANCE        .462          .425          .5            .65           .7            .712
SP-100         .433          .477          .522          .611          .611          .633
BEVERAGE       .428          .5            .5            .5            .5            .5
FOOD           .428          .448          .428          .469          .51           .51
FIDSTKS        .42           .485          .556          .627          .627          .65
CHEM           .418          .395          .441          .604          .627          .604
RUS-1000       .417          .481          .524          .596          .596          .603
MARIJUAN       .4            .3            .3            .3            .3            .3
SP500          .395          .464          .515          .588          .594          .606
COMODITY       .394          .421          .394          .447          .5            .5
INDEXES        .394          .497          .648          .675          .659          .724
HOSPITAL       .384          .461          .461          .461          .461          .461
TRANSP         .368          .421          .473          .631          .578          .736
HIGHPRIC       .367          .519          .623          .701          .67           .675
HOMEBLDG       .357          .857          .928          .857          .892          .892
COMPUTER       .35           .45           .5            .55           .5            .5
AUTO           .339          .415          .433          .528          .528          .622
NASD-100       .336          .425          .524          .584          .524          .574
GREEN          .333          .388          .444          .611          .611          .555
MILITARY       .307          .346          .384          .384          .461          .461
LOWPRICE       .304          .334          .351          .381          .392          .395
SOFTWARE       .303          .392          .464          .5            .482          .464
NIFTY          .295          .295          .477          .5            .5            .522
CHINA          .292          .195          .292          .243          .365          .707
EAT            .292          .365          .414          .487          .512          .56
BIGBANKS       .285          .285          .571          .857          .857          .857
COPPER         .285          .142          .285          .285          .285          .285
REIT           .278          .352          .418          .475          .565          .549
BIOTECH        .271          .299          .352          .362          .35           .362
ELECTRON       .27           .308          .39           .443          .413          .481
GAMING         .263          .263          .315          .526          .368          .473
HACKERS        .25           .437          .437          .437          .437          .437
JETS           .23           .153          .23           .461          .384          .461
SEMI           .217          .25           .358          .402          .315          .423
ETFS           .181          .181          .254          .345          .4            .709
UTILITY        .128          .179          .153          .23           .282          .256
GOLD           .111          .088          .111          .2            .2            .177
BONDFUND       .057          .08           .126          .126          .149          .103
SOLAR          0             0             .062          .062          .062          .062
|
===============================================================================
Thursday 8/17/2023 6:19 AM Futures: DJI + 55 Nasdaq +
45 Data used here for 8/16/2023
| |
8/16/2023
|
|
| |
Market Comments
If this were a
"normal" market, we would make much more of the fact that
the DJI registers
oversold based on the Stochastic and CCI indicators and
the NASDAQ, SPY and QQQ
are close to good support from their rising
65-dma. See their
charts below. But 10-year rates are close to making
a breakout new high and
the majority on the FOMC are barking about how
they must do more
"work" because inflation above 3% could come back.
Showing that they are
probably quite serious, that their bite could be as
bad as their barking,
the internals we pay most attention to are all falling.
The Closing Powers and
RSQ-Lines are all falling for DIA, SPY, QQQ
SOXL and the NASDAQ.
So are their OBV Lines. Their Accumulation
Indexes are all
negative and falling, too. Breadth was quite negative yesterday.
And the DJI fell
further below the expected support at 35,000. "Expected"
provided the recent
breakout was authentic.
The failed
breakout above 35000 is highly significant. Now 35,000 is again
reistance and
breakout failures leave bad feelings in those who bought higher.
Breakout failures
can lead to very bad sell-offs. So, if there is even a little
more
"hawkish" talk from the FED, we may easily see the DJI sell off
much more,
especially as we get close to tthe normally bearish month of
September.
There are few
bullish MAXCPs that have not been run up to dangerous
heights at this
point. Meanwhile, the bearish MINCPs are doing what we
want of good
short "hedges", namely collapsing and making new lows.
Stay short them,
we must advise. They look more and more like the
most bearish
regional banks did about a month before they bottomed |
|
| |
8/16/2023
2022 PEERLESS DJI, Signals, Indicators Daily DJI Volume
10-DayUp/Down Vol Stoch-20 CCI RSI Pct of All Stocks above 65-dma
Inverted Traders Index
DJI-IPA DJI-OBV Short-Term Rates
NASDAQ S&P OEX NYSE DJ-15 DJ-20 DJI-30 Old Peerless 2006 version
Tiger Index of Big
Banks Bond Funds Gold Stocks Housing Stocks
Insurance-Stocks
Regional
Banks Russell-1000
Semi Conductors
2006 vers-Peerless is no loner vailable.
Sorry. It is giving an error message and
without the code cannot be fixed.
ETFs: DIA QQQ SPY IWM MDY
TNA Short-Term Rates Ten Year Rates PST (Short Treasuries)
DOLLAR-UUP
ALLSTOCKs
COIN (Bit
Coin ETF)
USO-CrudeOil DBO BLDP FAS GLD HD IBB JETS JNUG KOL NAIL NUGT
NRGU OIH PALL RSX RETL SDS AGQ SLV SOXL TAN TECL TLT TMF TNA
UGA USO China:
YINN
CHAU
Commodities: CANE COCO CORN DBC JJC, NIB CORN, CUT (paper)
MOO, NRGU
SOYB WEAT UUP (Dollar) LIT
(Lithium) PALL
(Palladium)
Stocks
AA AAPL ADBE AMAT AMGN AMD AMZN ANET AXON AXP
BA BABA BAC BIDU BLDP BSX CAT CDNS CHKP CNX CPB CRM CVX CMG
DE DIS ENPH FB FSLR FTNT GILD GME GOOG GS HD IBM INTU JPM KO KR
LRCX MRK MRNA MOS MSFT NEM NFLX NKE NOC NUE NVDA PANW PG PYPL
QCOM QDEL REGN REV RE SCHW SNOW SO SQUARE TSLA TXN XOM V VRTX
WFC WMT XLE ZM ZOM
Biggest SEMI-Condctors in SOXL: NVDA. AVGO, AMD. INTC TXN MCHP NXPI AMAT ON
AAOI TSM
HOMEBUILDERS:
NAIL
BZH HOV MHO MTH PHM -
REGIONAL BANKS:
EGBN
FFIC GBCI HMST
Carl Icahn and associates: IEP
MS
JEF
Leveraged Short ETFs:
FAZ - financials, TZA and SRTY- small caps, MZZ - mid caps, TECS -Techs,
SOXS -
semi-conductors LABD
- Biotechs
Bullish MAXCPs http://tigersoftware.com/upping/8-16-2023/Bullish.htm
Bearish MINCPs
www.tigersoftware.com/downing/8-16-2023/Bearish.htm |
|

 |
 |
 |
 |
 |
 |
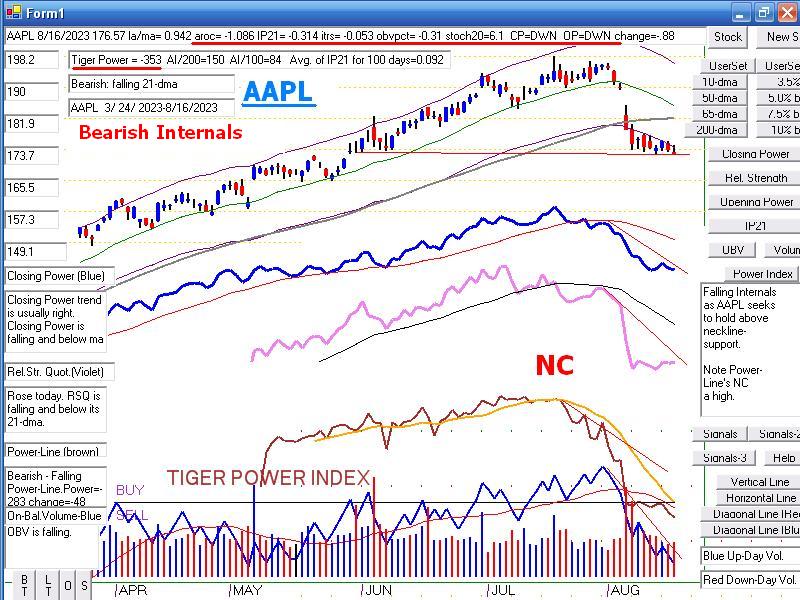 |
 |
 |
 |
 |
 |
Table 1 - Breadth/Volume Statistics
| NYSE |
Latest
Close |
Previous
Close |
Week
Ago |
| Issues
traded |
3,017 |
3,012 |
3,018 |
| Advances |
760 |
477 |
1,289 |
| Declines |
2,155 |
2,453 |
1,597 |
| Unchanged |
102 |
82 |
132 |
| New
highs |
42 |
34 |
77 |
| New
lows |
95 |
80 |
37 |
| Adv.
volume* |
193,374,211 |
102,246,273 |
328,052,324 |
| Decl.
volume* |
587,716,911 |
700,644,335 |
479,767,553 |
| Total
volume* |
795,140,049 |
808,869,537 |
821,958,120 |
| Closing
Arms (TRIN)† |
1.02 |
1.07 |
1.36 |
| Block
trades* |
3,972 |
4,014 |
3,819 |
| Adv.
volume |
946,690,459 |
584,376,527 |
1,390,861,473 |
| Decl.
volume |
2,731,728,734 |
3,208,856,941 |
2,342,625,460 |
| Total
volume |
3,753,917,788 |
3,832,252,540 |
3,803,106,342 |
| NASDAQ |
Latest
Close |
Previous
Close |
Week
Ago |
| Issues
traded |
4,484 |
4,538 |
4,515 |
| Advances |
1,172 |
1,231 |
1,644 |
| Declines |
3,137 |
3,125 |
2,687 |
| Unchanged |
175 |
182 |
184 |
| New
highs |
45 |
66 |
78 |
| New
lows |
283 |
222 |
187 |
| Closing
Arms (TRIN)† |
0.39 |
0.61 |
0.98 |
| Block
trades |
73,590 |
35,016 |
44,148 |
| Adv.
volume |
3,025,999,460 |
1,721,218,353 |
2,134,682,920 |
| Decl.
volume |
3,172,403,988 |
2,663,172,346 |
3,418,222,157 |
| Total
volume |
6,243,761,551 |
4,473,329,779 |
5,591,362,831 |
|
Table 2 -
Table 2 TIGER QUICKSILVER on ETFS - 8/14/2023 ---
Bullish = 2 RETL, OIH
Bearish = TECL, IBB, GLD TAN (-.454)
ETF       CLOSE     CHANGE    PIVOT-PT  5-dma AROC   CL-PWR  CANDLE  IP21    ITRS  POWER INDEX
=================================================================================================
DIA       347.77  -1.84      351.89       -49.9%     -------  RED   -.177    0      =====
---------------------------------------------------------------------------------------------
COMPQX    13474.63  -156.42  13737.99     -90.3%     -------  RED   -.176   -.016    -.192
---------------------------------------------------------------------------------------------
SPY       439.64  -3.25      445.91       -68.5%     -------  RED   -.194   -.005    -.199
---------------------------------------------------------------------------------------------
QQQ       362.54  -3.88      368.59       -73%       -------  RED   -.23   -.013     -.243
---------------------------------------------------------------------------------------------
MDY       475.93  -4.46      486.23       -112.7%    -------  RED   -.068    .015    -.053
---------------------------------------------------------------------------------------------
IWM       185.84  -2.3       190.72       -150.5%    -------  RED   -.058    0       -.058
---------------------------------------------------------------------------------------------
FAS       64.91  -.41        69.08        -294%      Bullish  BLUE  -.023    .081     .058
---------------------------------------------------------------------------------------------
RETL      7.24  -.18         7.63         -276.2%    -------  RED    .115    .277     .392
---------------------------------------------------------------------------------------------
SOXL      20.53  -1.27       22.81        -572.6%    -------  RED   -.157   -.056    -.213
---------------------------------------------------------------------------------------------
TECL      46.1  -1.33        47.83        -177%      -------  RED   -.249   -.063    -.312
---------------------------------------------------------------------------------------------
IBB       126.18  -1.83      128.17       -61.2%     -------  RED   -.197   -.06     -.257
---------------------------------------------------------------------------------------------
GLD       175.57  -1.02      177.6        -62.6%     Bearish  RED   -.383   -.071    -.454
---------------------------------------------------------------------------------------------
DBO       15.79  -.25        16.36        -232.8%    -------  RED    .002    .084     .086
---------------------------------------------------------------------------------------------
OIH       336.7  -1.24       343.56       -129.2%    Bullish  RED    .116    .223     .339
---------------------------------------------------------------------------------------------
CPER     22.65  -.06         23.27        -173%      -------  ----  -.137   -.056    -.193
---------------------------------------------------------------------------------------------
TAN     58.19  -1.39         62.78        -420.7%    -------  RED   -.268   -.224    -.492
---------------------------------------------------------------------------------------------
UUP       28.76   .08        28.51         52.5%     Bullish  BLUE   .259   -.026     .233
---------------------------------------------------------------------------------------------
CORN      22.07   .27        22.61        -118.8%    Bearish  BLUE  -.145   -.101    -.246
---------------------------------------------------------------------------------------------
WEAT      6.16   .02         6.5          -282%      Bearish  ----  -.026   -.063    -.089
---------------------------------------------------------------------------------------------
YINN      30.58  -2.05       39.01        -1040.3%   Bearish  RED   -.063   -.172    -.235
|
 Table 3      RANKING OF KEY DIRECTORIES BASED PCT.OF STOCKS ABOVE 65-DMA
              8/16/23
 Bullish = 11
 Bearish = 37
---------------------------------------------------------------------------------------
Directory     Current       day-1         day-2         day-3         day-4         day-5
----------------------------------------------------------------------------------------
COAL           1             1             1             1             1             1
HOMEBLDG       .857          .928          .857          .892          .892          .928
RETAIL         .739          .782          .826          .847          .869          .847
INSURANC       .72           .68           .76           .72           .76           .76
GUNS           .714          .785          .785          .785          .785          .785
OILGAS         .69           .69           .783          .793          .773          .804
EDU            .666          .666          .833          .833          .833          .833
DJI-13         .615          .615          .692          .692          .692          .692
INFRA          .612          .612          .612          .612          .612          .645
REGBANKS       .578          .657          .842          .947          .894          .921
HIGHPRIC       .519          .623          .701          .67           .683          .666
==============================================================================================
BEVERAGE       .5            .5            .5            .5            .5            .428
DOWJONES       .5            .5            .566          .566          .6            .566
==============================================================================================
INDEXES        .497          .648          .675          .659          .735          .735
FIDSTKS        .485          .556          .627          .627          .65           .621
RUS-1000       .482          .524          .595          .596          .607          .616
SP-100         .477          .522          .611          .611          .633          .611
SP500          .464          .515          .588          .592          .606          .613
HOSPITAL       .461          .461          .461          .461          .461          .461
INDMATER       .458          .472          .569          .555          .541          .583
COMPUTER       .45           .5            .55           .5            .5            .55
FOOD           .448          .448          .448          .51           .51           .51
HACKERS        .437          .437          .437          .437          .437          .375
FINANCE        .425          .5            .65           .687          .725          .737
NASD-100       .425          .524          .584          .524          .574          .564
COMODITY       .421          .421          .421          .5            .5            .526
TRANSP         .421          .473          .631          .578          .684          .736
AUTO           .415          .452          .528          .528          .641          .66
SOFTWARE       .41           .482          .5            .482          .446          .446
CHEM           .395          .441          .604          .627          .604          .627
GREEN          .388          .444          .611          .611          .555          .555
EAT            .365          .414          .487          .512          .585          .585
REIT           .352          .409          .483          .573          .54           .573
MILITARY       .346          .384          .384          .461          .461          .5
LOWPRICE       .334          .354          .384          .392          .392          .398
ELECTRON       .308          .39           .443          .413          .481          .541
MARIJUAN       .3            .3            .3            .3            .3            .3
BIOTECH        .296          .35           .365          .35           .362          .357
NIFTY          .295          .477          .5            .5            .522          .522
BIGBANKS       .285          .571          .857          .857          .857          .857
GAMING         .263          .315          .473          .421          .526          .421
SEMI           .25           .358          .402          .315          .434          .51
CHINA          .195          .292          .243          .365          .682          .682
ETFS           .181          .254          .345          .4            .745          .654
UTILITY        .179          .153          .23           .282          .256          .256
JETS           .153          .23           .461          .384          .461          .461
COPPER         .142          .285          .285          .285          .285          .428
GOLD           .088          .111          .2            .2            .177          .111
BONDFUND       .08           .114          .126          .16           .114          .126
SOLAR          0             .062          .062          .062          .062          .062
|
===============================================================================
NEW - Windows2010-VisualNet TgerSoft Charts here now
will start to show composite
Daily Power Ranking-Line, as in AAPL below. We will start to make a collection
of them,
so that we can see best how to use this composite tool. Presently, the
existing XP-2021 Power
Ranker lets you see their latest value for whatever group you like. The new
Windows10 already
does this in what I have programmed this Summer but also let you see a graph of the
"Power-Line"
on both the daily and a weekly charts, See how in AAPL's case the changes of
direction in the
10-dma of the Power-Line can be used to advantage for trading purposes. More on this to
come
each night here.
AAPL and New Tiger "Power-Line" - 7/15/2023
The important thing here is that the Power-Line turns down before prices.

==============================================================================
Wednesday
- 6:00 - 8/16/2023 - DJI Futures
-21 NASDAQ -17 Data Used - 8/15/2023
| |
8/15/2023
|
|
| |
Market Comments
On wrethched breadth of
nearly 2000 more down than up, the DJI fall back below its round number support and lost
its hold on the 21-dma. The NASD, SPY
and QQQ are still above the suport of their 65-dma, so they may still attempt
a recovery. But their Closing Powers and Relative Strength Lines are failling
and the IP21s are negative, showing "big money" is still prepared to blunt any
rallies. The 10-year rates rose again, but still have not made a new high.
As you can see from the DJI chart below, the NYSE A/D Line is clearly
in a falling trend and if you look at the individual charts on the Hotline,
we see that AAPL, CMG, DIS, MCD, MSFT, SOXL, TECL and TSLA
have each violated their key 65-dma support. Watch AMAT, AMD, ARKW,
CDNS, NASDAQ, FSLT, IBB, QQQ and TNA now to see if they follow
the others down and break this key support in their charts. The technical
situation is made worse by the number of stocks we follow nghtly that have
built bearish head/shoulders patterns: AXP, ECL, F, INTU, JETS, LEN.
MSFT, TXMand VRTX. In addition, the number of new lows on the
NYSE
is now double the new highs there. See the weakness in AA and NOC already.
Strength is still to be found in LLY, NAIL and OIH. All in all I would add
more short sales from our bearish MINCPs.
|
|
| |
8/15/2023
2022 PEERLESS DJI, Signals, Indicators Daily DJI Volume
10-DayUp/Down Vol Stoch-20 CCI RSI Pct of All Stocks above 65-dma
Inverted Traders Index
DJI-IPA DJI-OBV Short-Term Rates
NASDAQ S&P OEX NYSE DJ-15 DJ-20 DJI-30 Old Peerless 2006 version
Tiger Index of Big
Banks Bond Funds Gold Stocks Housing Stocks
Insurance-Stocks
Regional
Banks Russell-1000
Semi Conductors
2006 vers-Peerless is no loner vailable.
Sorry. It is giving an error message and
without the code cannot be fixed.
ETFs: DIA QQQ SPY IWM MDY
TNA Short-Term Rates Ten Year Rates PST (Short Treasuries)
DOLLAR-UUP
ALLSTOCKs
COIN (Bit
Coin ETF)
USO-CrudeOil DBO BLDP FAS GLD HD IBB JETS JNUG KOL NAIL NUGT
NRGU OIH PALL RSX RETL SDS AGQ SLV SOXL TAN TECL TLT TMF TNA
UGA USO China:
YINN
CHAU
Commodities: CANE COCO CORN DBC JJC, NIB CORN, CUT (paper)
MOO, NRGU
SOYB WEAT UUP (Dollar) LIT
(Lithium) PALL
(Palladium)
Stocks
AA AAPL ADBE AMAT AMGN AMD AMZN ANET AXON AXP
BA BABA BAC BIDU BLDP BSX CAT CDNS CHKP CNX CPB CRM CVX CMG
DE DIS ENPH FB FSLR FTNT GILD GME GOOG GS HD IBM INTU JPM KO KR
LRCX MRK MRNA MOS MSFT NEM NFLX NKE NOC NUE NVDA PANW PG PYPL
QCOM QDEL REGN REV RE SCHW SNOW SO SQUARE TSLA TXN XOM V VRTX
WFC WMT XLE ZM ZOM
Biggest SEMI-Condctors in SOXL: NVDA. AVGO, AMD. INTC TXN MCHP NXPI AMAT ON
AAOI TSM
HOMEBUILDERS:
NAIL
BZH HOV MHO MTH PHM -
REGIONAL BANKS:
EGBN
FFIC GBCI HMST
Carl Icahn and associates: IEP
MS
JEF
Leveraged Short ETFs:
FAZ - financials, TZA and SRTY- small caps, MZZ - mid caps, TECS -Techs,
SOXS -
semi-conductors LABD
- Biotechs
Bullish MAXCPs http://tigersoftware.com/upping/8-15-2023/Bullish.htm
Bearish MINCPs
www.tigersoftware.com/downing/8-15-2023/Bearish.htm |
|
The breakout over 35000 seems to have failed.
That restores the Peerless S9V as the active signal.

 |
 |
 |
 |
 |
 |
 |
Table 1 - Daily Breadth and Volume Statistics
| NYSE |
Latest
Close |
Previous
Close |
Week
Ago |
| Issues
traded |
3,012 |
3,026 |
3,018 |
| Advances |
477 |
1,207 |
1,088 |
| Declines |
2,453 |
1,706 |
1,813 |
| Unchanged |
82 |
113 |
117 |
| New
highs |
34 |
47 |
64 |
| New
lows |
80 |
55 |
65 |
| Adv.
volume* |
102,246,273 |
306,259,645 |
293,347,453 |
| Decl.
volume* |
700,644,335 |
488,657,786 |
538,633,220 |
| Total
volume* |
808,869,537 |
808,449,190 |
842,078,009 |
| Closing
Arms (TRIN)† |
1.07 |
0.97 |
1.19 |
| Block
trades* |
4,014 |
4,315 |
3,839 |
| Adv.
volume |
584,376,527 |
1,609,428,611 |
1,277,956,694 |
| Decl.
volume |
3,208,856,941 |
2,215,393,512 |
2,542,233,890 |
| Total
volume |
3,832,252,540 |
3,896,417,705 |
3,884,915,799 |
| NASDAQ |
Latest
Close |
Previous
Close |
Week
Ago |
| Issues
traded |
4,538 |
4,537 |
4,488 |
| Advances |
1,231 |
1,812 |
1,666 |
| Declines |
3,125 |
2,533 |
2,607 |
| Unchanged |
182 |
192 |
215 |
| New
highs |
66 |
56 |
62 |
| New
lows |
222 |
205 |
204 |
| Closing
Arms (TRIN)† |
0.61 |
0.65 |
0.82 |
| Block
trades |
35,016 |
28,840 |
39,047 |
| Adv.
volume |
1,721,218,353 |
2,212,865,207 |
2,294,175,332 |
| Decl.
volume |
2,663,172,346 |
2,007,124,138 |
2,931,083,948 |
| Total
volume |
4,473,329,779 |
4,272,026,346 |
5,284,559,809 |
|
Table 2
TIGER QUICKSILVER on ETFS - 8/15/2023 Bullish = 2 RETL, OIH
Bearish = 2 GLD TAN (-.495)
ETF       CLOSE     CHANGE    PIVOT-PT  5-dma AROC   CL-PWR  CANDLE  IP21    ITRS  POWER INDEX
=================================================================================================
DIA       349.61  -3.6       351.28       -48.4%     Bullish  RED   -.071    0       ======
---------------------------------------------------------------------------------------------
COMPQX    13631.05  -157.28  13722.02     -92.1%     -------  RED   -.086   -.005    -.091
---------------------------------------------------------------------------------------------
SPY       442.89  -5.22      445.75       -65.6%     -------  RED   -.107    .001    -.106
---------------------------------------------------------------------------------------------
QQQ       366.42  -3.93      367.91       -75.6%     -------  RED   -.152   -.001    -.153
---------------------------------------------------------------------------------------------
MDY       480.39  -6.55      486.87       -91.2%     -------  RED    .024    .014     .038
---------------------------------------------------------------------------------------------
IWM       188.14  -2.52      191.57       -129%      -------  RED    .033   -.001     .032
---------------------------------------------------------------------------------------------
FAS       65.32  -3.69       68.93        -376.8%    Bullish  RED    .059    .071     .13
---------------------------------------------------------------------------------------------
RETL      7.42  -.26         7.66         -195.7%    -------  RED    .171    .254     .425
---------------------------------------------------------------------------------------------
SOXL      21.8  -1.13        23.09        -581.1%    -------  RED   -.088   -.044    -.132
---------------------------------------------------------------------------------------------
TECL      47.43  -1.5        47.79        -240.6%    -------  RED   -.166   -.053    -.219
---------------------------------------------------------------------------------------------
IBB       128.01  -.41       127.75        26.6%     -------  BLUE  -.158   -.042    -.2
---------------------------------------------------------------------------------------------
GLD       176.59  -.47       177.79       -57.7%     -------  RED   -.298   -.059    -.357
---------------------------------------------------------------------------------------------
DBO       16.04  -.24        16.55        -91.6%     -------  RED    .132    .101     .233
---------------------------------------------------------------------------------------------
OIH       337.94  -6.09      345.58       -50.5%     Bullish  RED    .178    .206     .384
---------------------------------------------------------------------------------------------
CPER     22.71  -.37         23.45        -144.1%    -------  RED   -.053   -.046    -.099
---------------------------------------------------------------------------------------------
TAN     59.58  -2.44         63.4         -197.1%    -------  RED   -.288   -.207    -.495
---------------------------------------------------------------------------------------------
UUP       28.68   .01        28.46         42.1%     -------  BLUE   .226   -.03      .196
---------------------------------------------------------------------------------------------
CORN      21.8  -.46         22.6         -206.7%    Bearish  RED   -.099   -.119    -.218
---------------------------------------------------------------------------------------------
WEAT      6.14  -.17         6.52         -393.3%    Bearish  RED   -.017   -.063    -.08
---------------------------------------------------------------------------------------------
YINN      32.63  -1.65       38.04        -670.4%    Bearish  RED   -.036   -.119    -.155
|
Table 3       RANKING OF KEY DIRECTORIES BASED PCT.OF STOCKS ABOVE 65-DMA
              8/15/23
Bullish = 18
Bearish = 27
---------------------------------------------------------------------------------------
Directory     Current       day-1         day-2         day-3         day-4         day-5
----------------------------------------------------------------------------------------
COAL           1             1             1             1             1             1
HOMEBLDG       .928          .857          .892          .892          .928          .964
GUNS           .785          .785          .785          .785          .785          .857
RETAIL         .782          .826          .847          .869          .847          .847
OILGAS         .69           .783          .793          .773          .804          .804
INSURANC       .68           .76           .72           .76           .76           .76
EDU            .666          .833          .833          .833          .833          .833
REGBANKS       .657          .842          .947          .894          .947          .947
INDEXES        .648          .675          .659          .735          .74           .745
HIGHPRIC       .623          .701          .67           .683          .675          .688
DJI-13         .615          .692          .692          .692          .692          .692
INFRA          .612          .612          .612          .612          .645          .645
BIGBANKS       .571          .857          .857          .857          .857          .857
FIDSTKS        .556          .627          .627          .65           .621          .65
RUS-1000       .525          .595          .595          .607          .62           .632
NASD-100       .524          .584          .524          .574          .554          .574
SP-100         .522          .611          .611          .633          .611          .644
SP500          .515          .588          .592          .604          .617          .629
=============================================================================================
BEVERAGE       .5            .5            .5            .5            .428          .428
COMPUTER       .5            .55           .5            .5            .55           .5
DOWJONES       .5            .566          .566          .6            .566          .6
FINANCE        .5            .65           .687          .712          .737          .737
SOFTWARE       .5            .517          .482          .446          .428          .428
=============================================================================================
NIFTY          .477          .5            .5            .522          .522          .59
TRANSP         .473          .631          .578          .684          .736          .789
INDMATER       .472          .569          .555          .541          .583          .638
HOSPITAL       .461          .461          .461          .461          .461          .538
AUTO           .452          .547          .528          .641          .66           .679
FOOD           .448          .469          .489          .51           .51           .53
GREEN          .444          .611          .611          .555          .555          .611
CHEM           .441          .604          .627          .604          .627          .651
HACKERS        .437          .437          .437          .437          .375          .312
COMODITY       .421          .447          .473          .5            .526          .526
EAT            .414          .487          .512          .585          .585          .512
REIT           .409          .475          .581          .549          .565          .598
ELECTRON       .39           .443          .413          .481          .533          .556
MILITARY       .384          .384          .461          .461          .5            .5
SEMI           .358          .402          .315          .434          .51           .554
LOWPRICE       .354          .387          .395          .392          .395          .392
BIOTECH        .347          .362          .352          .362          .362          .36
GAMING         .315          .473          .368          .578          .421          .368
MARIJUAN       .3            .3            .3            .3            .3            .3
CHINA          .292          .243          .365          .682          .682          .634
COPPER         .285          .285          .285          .285          .428          .285
ETFS           .254          .345          .4            .745          .69           .563
JETS           .23           .461          .384          .461          .461          .461
UTILITY        .153          .23           .282          .256          .256          .256
BONDFUND       .114          .114          .16           .126          .137          .126
GOLD           .111          .2            .2            .177          .111          .111
SOLAR          .062          .062          .062          .062          .062          .062
|
==================================================================================
Tuesday - 6:00 - 8/15/2023 - DJI Futures -250 NASDAQ -68 Data Used - 8/14/2023
| |
8/14/2023
|
|
| |
Market Comments
Watch to see if
Professionals can hold the DJI above its 35000 support
once again.
NVDA's impressive
bounce up from its 65-dma shows us how many investors
still want to buy the
leading AI chipmaker. Other semi-conductors did well, too.
But Monday's rally was
particularly narrow. At the close, there were still 499
more down than up.
The primary reason for the rally's failure was the advance
of 10-year rates
towards their yearly highs. A new high at 4.4% will scare
the bulls and may send
the DJI below the 35,000 support, thereby telling us
that a much deeper
general market retreat is starting.
The tech leaders'
bounce up from their support still left most of them with negative
IP21 readings, showing
us that big money selling will continue to blunt and turn
back all rallies.
See the charts below. It would seem to be a good time to take
short positions in the
weakest bearish MINCPs. |
|
| |
8/14/2023
2022 PEERLESS DJI, Signals, Indicators Daily DJI Volume
10-DayUp/Down Vol Stoch-20 CCI RSI Pct of All Stocks above 65-dma
Inverted Traders Index
DJI-IPA DJI-OBV Short-Term Rates
NASDAQ S&P OEX NYSE DJ-15 DJ-20 DJI-30 Old Peerless 2006 version
Tiger Index of Big
Banks Bond Funds Gold Stocks Housing Stocks
Insurance-Stocks
Regional
Banks Russell-1000
Semi Conductors
2006 vers-Peerless is no loner vailable.
Sorry. It is giving an error message and
without the code cannot be fixed.
ETFs: DIA QQQ SPY IWM MDY
TNA Short-Term Rates Ten Year Rates PST (Short Treasuries)
DOLLAR-UUP
ALLSTOCKs
COIN (Bit
Coin ETF)
USO-CrudeOil DBO BLDP FAS GLD HD IBB JETS JNUG KOL NAIL NUGT
NRGU OIH PALL RSX RETL SDS AGQ SLV SOXL TAN TECL TLT TMF TNA
UGA USO China:
YINN
CHAU
Commodities: CANE COCO CORN DBC JJC, NIB CORN, CUT (paper)
MOO, NRGU
SOYB WEAT UUP (Dollar) LIT
(Lithium) PALL
(Palladium)
Stocks
AA AAPL ADBE AMAT AMGN AMD AMZN ANET AXON AXP
BA BABA BAC BIDU BLDP BSX CAT CDNS CHKP CNX CPB CRM CVX CMG
DE DIS ENPH FB FSLR FTNT GILD GME GOOG GS HD IBM INTU JPM KO KR
LRCX MRK MRNA MOS MSFT NEM NFLX NKE NOC NUE NVDA PANW PG PYPL
QCOM QDEL REGN REV RE SCHW SNOW SO SQUARE TSLA TXN XOM V VRTX
WFC WMT XLE ZM ZOM
Biggest SEMI-Condctors in SOXL: NVDA. AVGO, AMD. INTC TXN MCHP NXPI AMAT ON
AAOI TSM
HOMEBUILDERS:
NAIL
BZH HOV MHO MTH PHM -
REGIONAL BANKS:
EGBN
FFIC GBCI HMST
Carl Icahn and associates: IEP
MS
JEF
Leveraged Short ETFs:
FAZ - financials, TZA and SRTY- small caps, MZZ - mid caps, TECS -Techs,
SOXS -
semi-conductors LABD
- Biotechs
Bullish MAXCPs http://tigersoftware.com/upping/8-14-2023/Bullish.htm
Bearish MINCPs www.tigersoftware.com/downing/8-14-2023/Bearish.htm |
|
 
|
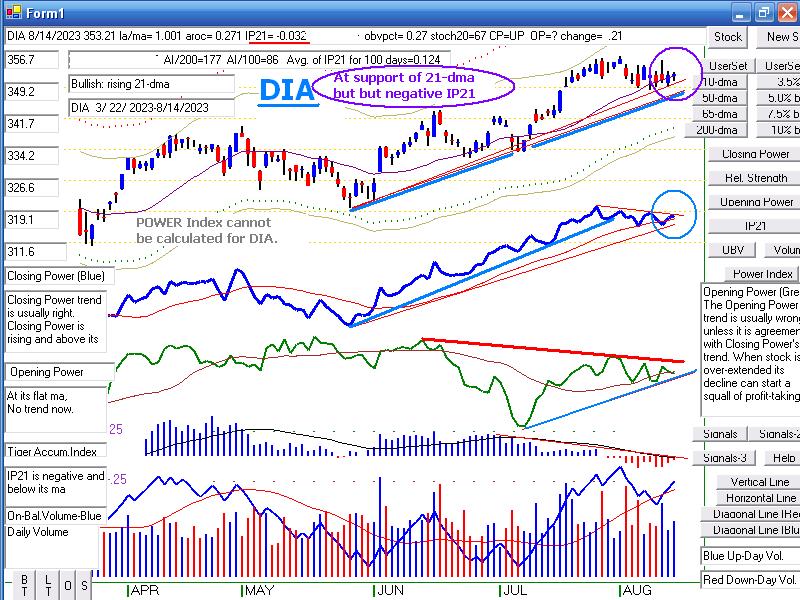 |
 |
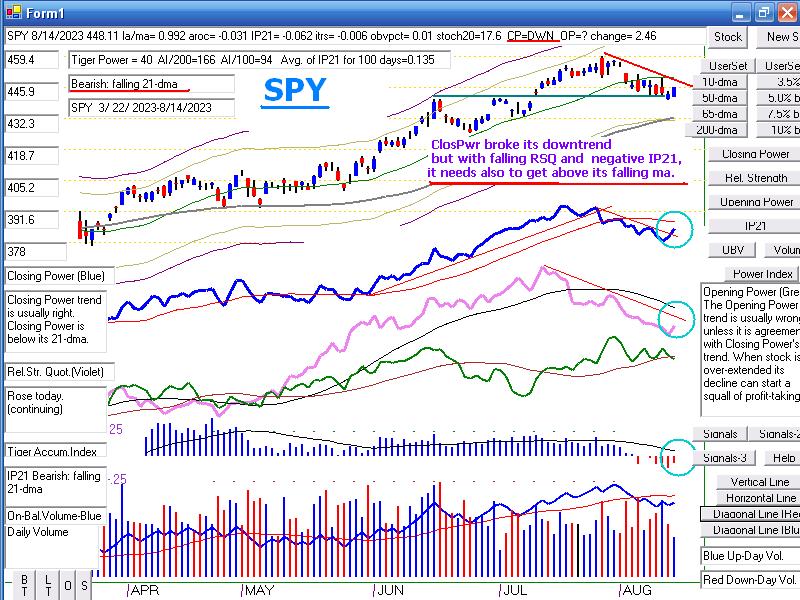 |
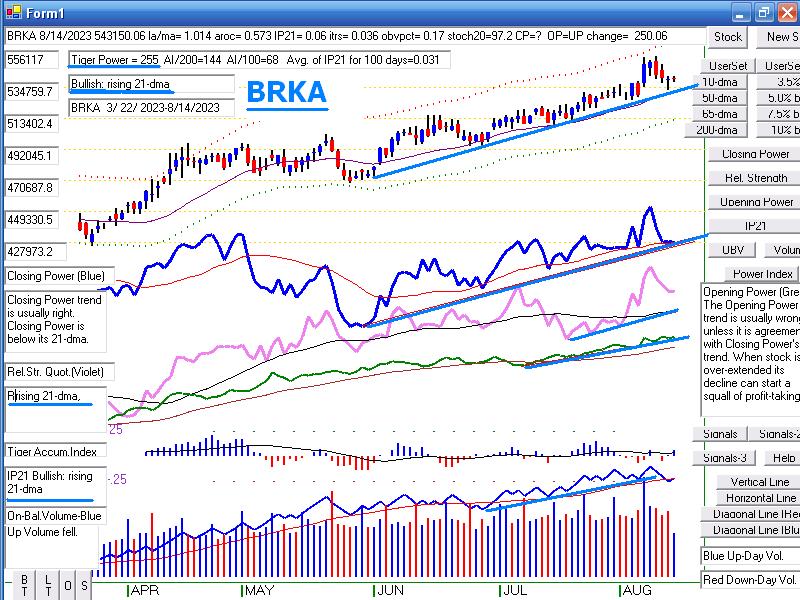 |
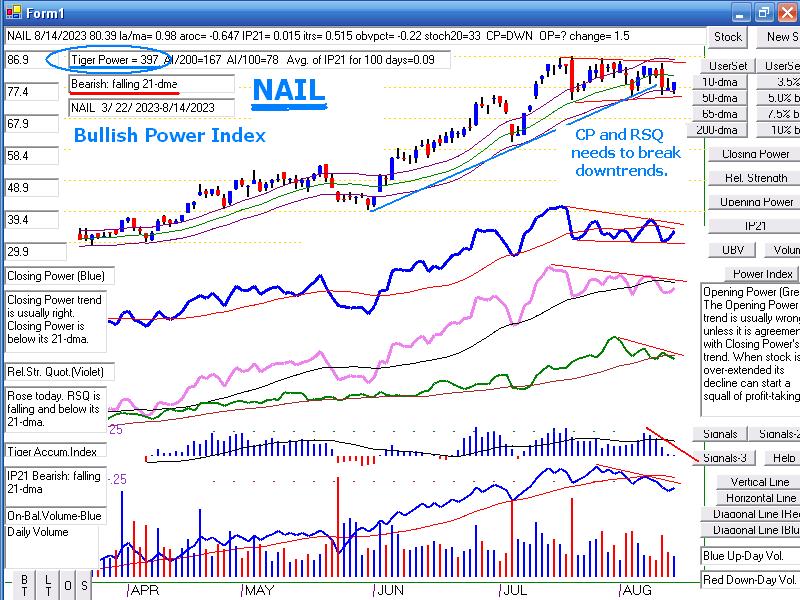 |
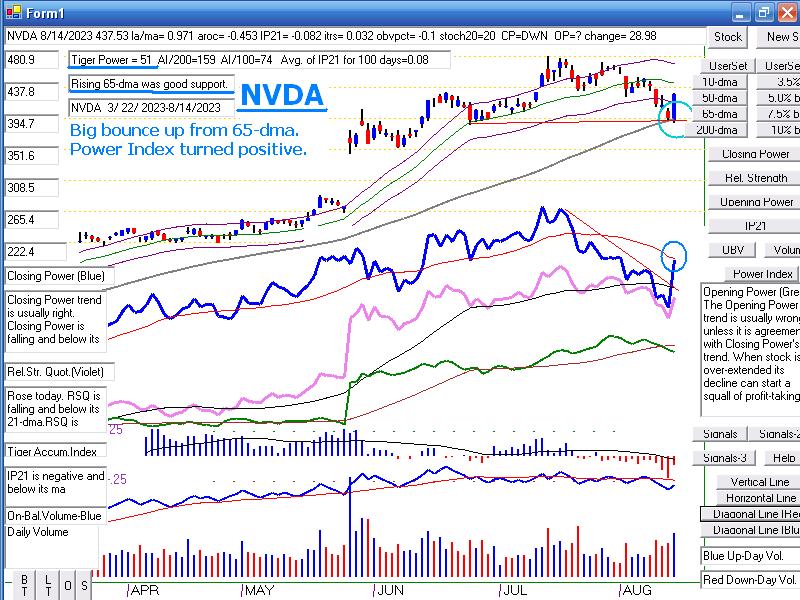 |
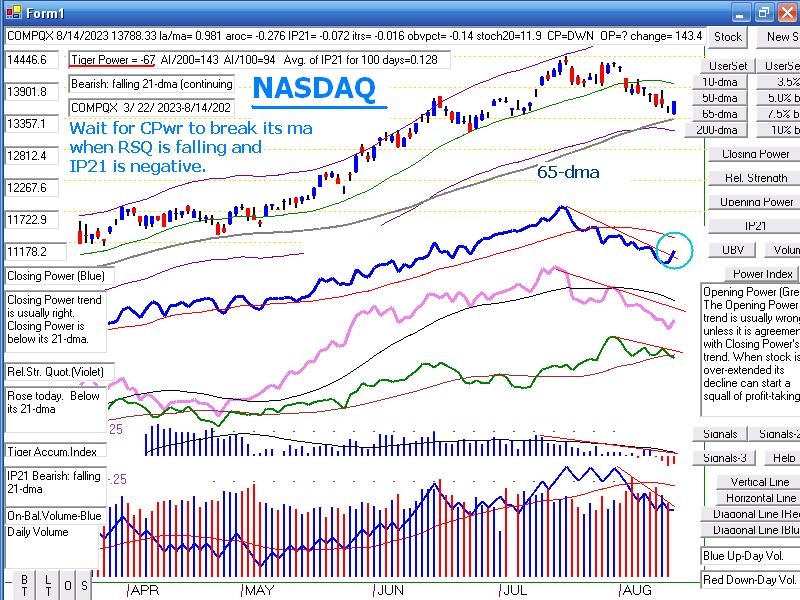 |
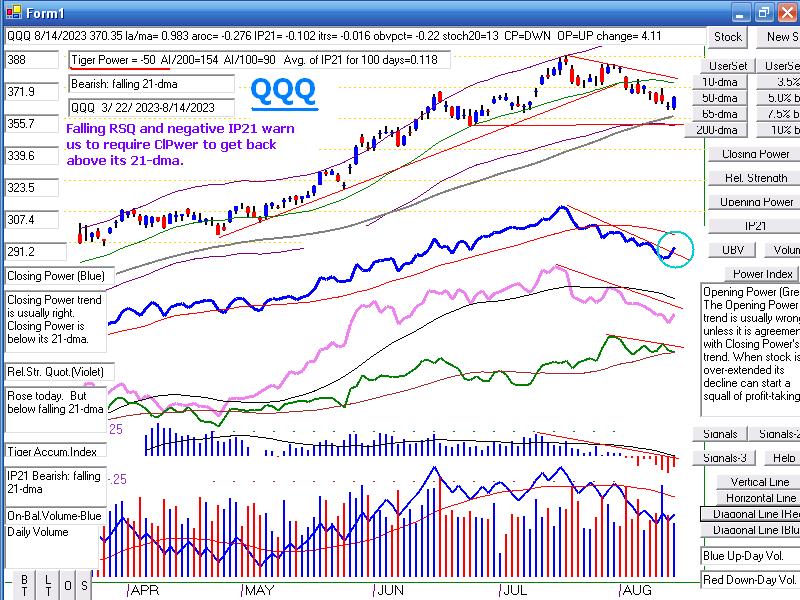 |
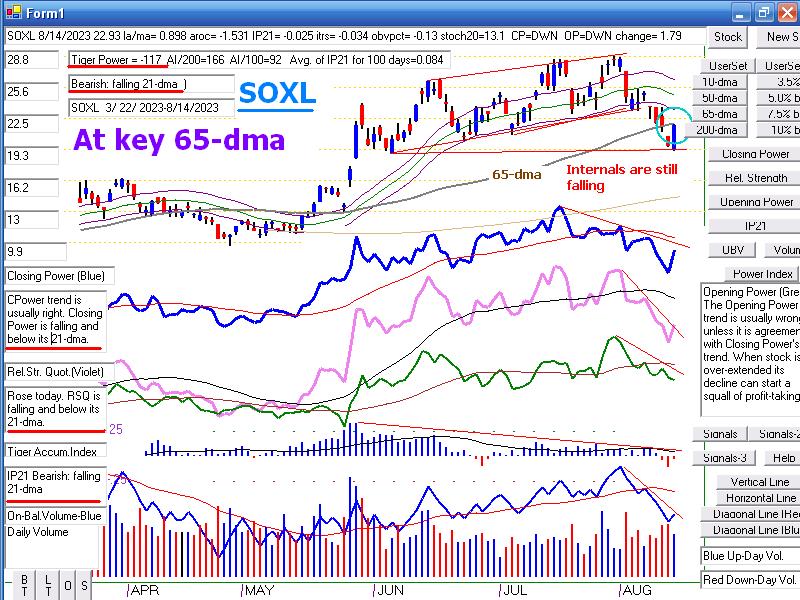 |
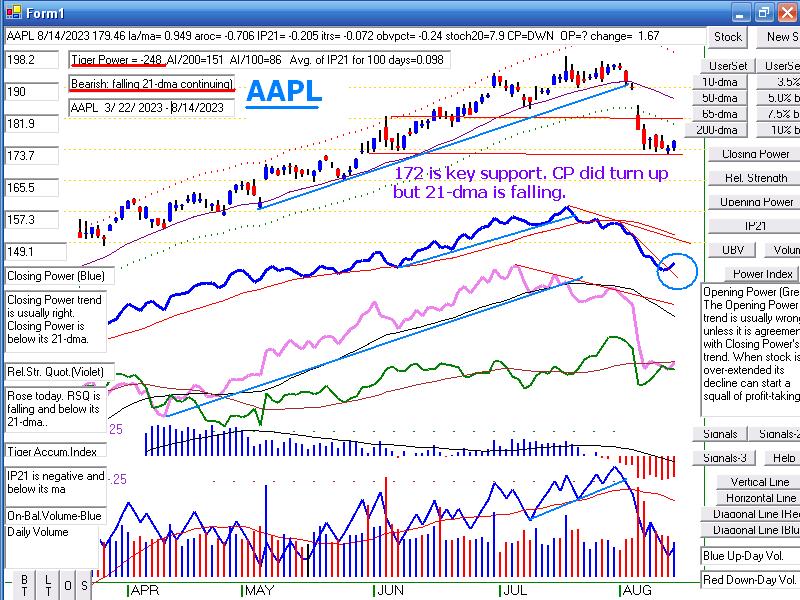 |
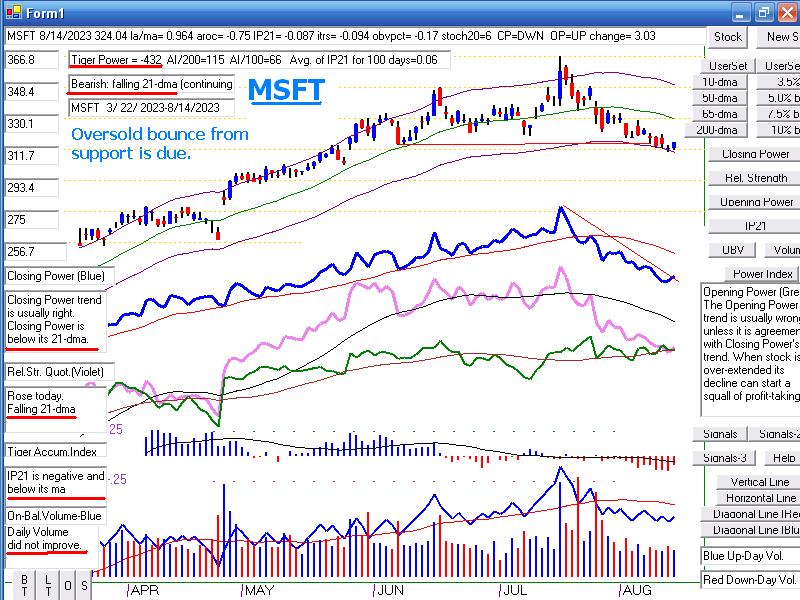 |
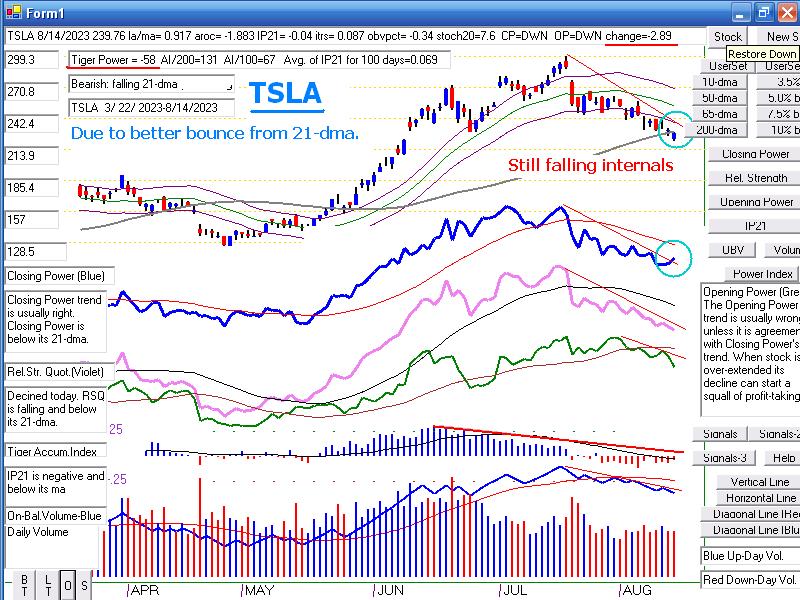 |
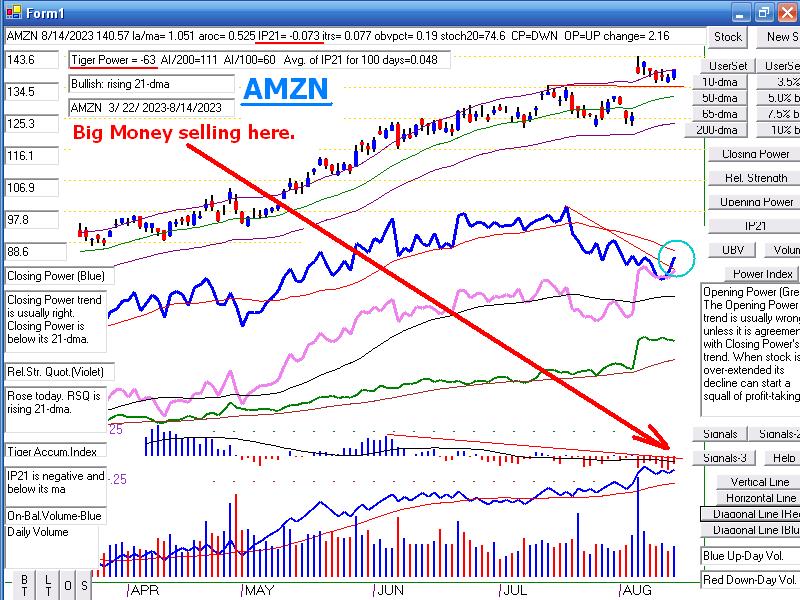 |
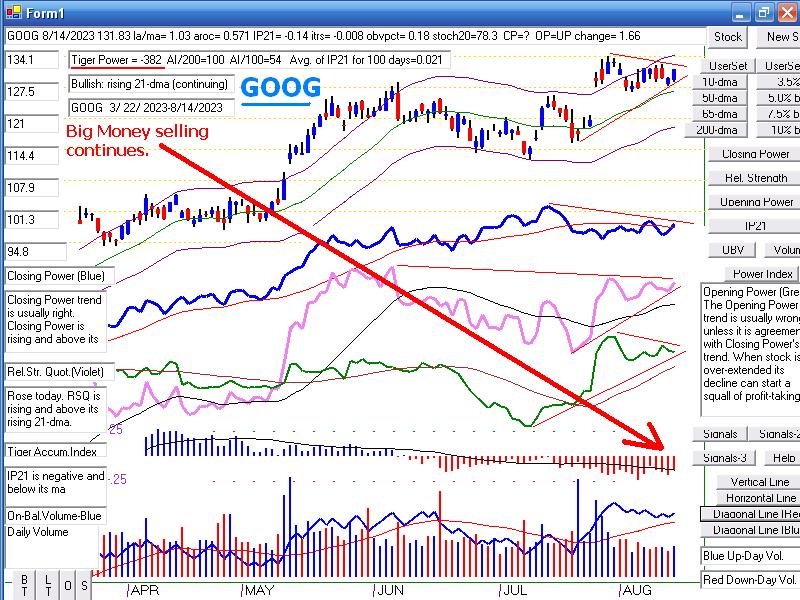 |
Table 1 -
Daily Breadth and Volume Statistics
| NYSE |
Latest
Close |
Previous
Close |
Week
Ago |
| Issues
traded |
3,026 |
3,022 |
3,013 |
| Advances |
1,207 |
1,498 |
1,851 |
| Declines |
1,706 |
1,376 |
1,074 |
| Unchanged |
114 |
148 |
88 |
| New
highs |
47 |
40 |
102 |
| New
lows |
55 |
37 |
36 |
| Adv.
volume* |
306,259,645 |
375,454,265 |
501,834,111 |
| Decl.
volume* |
488,657,786 |
341,562,190 |
256,180,579 |
| Total
volume* |
808,449,190 |
745,118,988 |
765,654,757 |
| Closing
Arms (TRIN)† |
0.97 |
0.98 |
1.04 |
| Block
trades* |
4,315 |
4,076 |
3,716 |
| Adv.
volume |
1,609,428,611 |
1,880,949,672 |
2,159,900,363 |
| Decl.
volume |
2,215,393,512 |
1,692,342,093 |
1,302,722,035 |
| Total
volume |
3,896,417,705 |
3,753,293,467 |
3,493,922,967 |
| NASDAQ |
Latest
Close |
Previous
Close |
Week
Ago |
| Issues
traded |
4,537 |
4,472 |
4,499 |
| Advances |
1,812 |
1,943 |
2,040 |
| Declines |
2,533 |
2,369 |
2,275 |
| Unchanged |
191 |
160 |
184 |
| New
highs |
56 |
59 |
74 |
| New
lows |
208 |
177 |
175 |
| Closing
Arms (TRIN)† |
0.65 |
0.78 |
1.24 |
| Block
trades |
28,840 |
38,925 |
32,206 |
| Adv.
volume |
2,212,865,207 |
2,348,180,166 |
2,039,672,871 |
| Decl.
volume |
2,007,124,138 |
2,231,889,815 |
2,819,335,702 |
| Total
volume |
4,272,026,346 |
4,638,889,885 |
4,892,332,328 |
|
Table 2 QUICKSILVER on ETFS - 8/14/2023 ---
Bullish = 3 FAS, RETL, OIH (.473)
Bearish = 2 GLD TAN (-.377)
ETF       CLOSE     CHANGE    PIVOT-PT  5-dma AROC   CL-PWR  CANDLE  IP21    ITRS  POWER INDEX
=================================================================================================
DIA       353.21   .21       353.02       -20%       Bullish  BLUE  -.031    0       =======
---------------------------------------------------------------------------------------------
COMPQX    13788.33   143.48  13884.32     -74.7%     -------  BLUE  -.024   -.015    -.039
---------------------------------------------------------------------------------------------
SPY       448.11   2.46      448.75       -29.1%     -------  BLUE  -.062   -.005    -.067
---------------------------------------------------------------------------------------------
QQQ       370.35   4.11      372          -65.4%     -------  BLUE  -.102   -.015    -.117
---------------------------------------------------------------------------------------------
MDY       486.94   .82       489.27       -66.5%     Bullish  BLUE   .083    .029     .112
---------------------------------------------------------------------------------------------
IWM       190.66  -.33       193.08       -94.7%     Bullish  BLUE   .1    .018       .118
---------------------------------------------------------------------------------------------
FAS       69.01  -.45        70.55        -245.4%    Bullish  BLUE   .114    .174     .288
---------------------------------------------------------------------------------------------
RETL      7.68   .05         7.72         -174.9%    Bullish  BLUE   .209    .43      .639
---------------------------------------------------------------------------------------------
SOXL      22.93   1.79       24.46        -582.5%    -------  BLUE  -.025   -.033    -.058
---------------------------------------------------------------------------------------------
TECL      48.93   2.21       49.75        -208.8%    -------  BLUE  -.115   -.037    -.152
---------------------------------------------------------------------------------------------
IBB       128.42  -.15       127.33        73.2%     -------  BLUE  -.16   -.054     -.214
---------------------------------------------------------------------------------------------
GLD       177.06  -.54       178.64       -76.3%     Bearish  BLUE  -.242   -.104    -.346
---------------------------------------------------------------------------------------------
DBO       16.28  -.1         16.34        -6.1%      Bullish  ----   .13    .111      .241
---------------------------------------------------------------------------------------------
OIH       344.03  -3.23      341.42        67.4%     Bullish  RED    .213    .26      .473
---------------------------------------------------------------------------------------------
CPER     23.08   0           23.38        -151.7%    -------  BLUE   .002   -.057    -.055
---------------------------------------------------------------------------------------------
TAN     62.02   .2           62.04        -15.2%     -------  BLUE  -.177   -.2      -.377
---------------------------------------------------------------------------------------------
UUP       28.67   .1         28.44         63.3%     -------  ----   .154   -.053     .101
---------------------------------------------------------------------------------------------
CORN      22.26  -.03        22.73        -86.4%     Bearish  ----  -.082   -.12     -.202
---------------------------------------------------------------------------------------------
WEAT      6.31  -.13         6.65         -259.5%    Bearish  ----  -.022   -.053    -.075
---------------------------------------------------------------------------------------------
YINN      34.28  -1.03       37.57        -728.6%    Bearish  BLUE   .019   -.021    -.002
|
 Table 3  RANKING OF KEY DIRECTORIES BASED PCT.OF STOCKS ABOVE 65-DMA
              8/14/23
 Bullish = 27
 Bearish = 20
---------------------------------------------------------------------------------------
Directory     Current       day-1         day-2         day-3         day-4         day-5
----------------------------------------------------------------------------------------
COAL           1             1             1             1             1             1
BIGBANKS       .857          .857          .857          .857          .857          .857
HOMEBLDG       .857          .892          .892          .928          .964          .928
REGBANKS       .842          .947          .894          .947          .947          .973
EDU            .833          .833          .833          .833          .833          .833
RETAIL         .826          .847          .869          .847          .847          .847
GUNS           .785          .785          .785          .785          .857          .857
OILGAS         .783          .793          .773          .804          .804          .824
INSURANC       .76           .72           .76           .76           .76           .8
HIGHPRIC       .701          .67           .683          .675          .688          .722
DJI-13         .692          .692          .692          .692          .692          .692
INDEXES        .675          .659          .735          .74           .745          .762
FINANCE        .65           .687          .712          .725          .737          .775
TRANSP         .631          .578          .684          .736          .789          .789
FIDSTKS        .627          .627          .65           .621          .656          .68
INFRA          .612          .612          .612          .645          .645          .741
GREEN          .611          .611          .555          .555          .611          .5
SP-100         .611          .611          .633          .611          .644          .7
CHEM           .604          .627          .604          .627          .651          .627
RUS-1000       .596          .595          .606          .62           .636          .683
SP500          .588          .592          .604          .615          .633          .668
NASD-100       .584          .524          .574          .554          .584          .683
INDMATER       .569          .555          .541          .583          .638          .666
DOWJONES       .566          .566          .6            .566          .6            .633
COMPUTER       .55           .5            .5            .55           .5            .5
AUTO           .547          .547          .641          .66           .679          .735
SOFTWARE       .535          .5            .446          .428          .41           .535
==============================================================================================
BEVERAGE       .5            .5            .5            .428          .428          .571
NIFTY          .5            .5            .522          .522          .59           .659
===============================================================================================
EAT            .487          .512          .585          .585          .536          .56
REIT           .475          .573          .557          .573          .59           .672
GAMING         .473          .368          .526          .473          .368          .421
FOOD           .469          .51           .489          .51           .53           .53
HOSPITAL       .461          .461          .461          .461          .538          .538
JETS           .461          .384          .461          .461          .461          .461
COMODITY       .447          .5            .473          .526          .526          .552
ELECTRON       .443          .413          .481          .533          .556          .586
HACKERS        .437          .437          .437          .375          .312          .437
SEMI           .402          .315          .434          .51           .565          .586
LOWPRICE       .387          .398          .395          .395          .395          .398
MILITARY       .384          .461          .461          .5            .5            .5
BIOTECH        .36           .35           .365          .362          .362          .362
ETFS           .345          .4            .745          .69           .581          .818
MARIJUAN       .3            .3            .3            .3            .3            .2
COPPER         .285          .285          .285          .428          .285          .714
CHINA          .243          .365          .682          .682          .609          .682
UTILITY        .23           .282          .256          .256          .256          .205
GOLD           .2            .2            .177          .111          .111          .133
BONDFUND       .114          .149          .126          .149          .137          .114
SOLAR          .062          .062          .062          .062          .062          .062
|
==============================================================================
Monday - 6:02 - 8/14/2023 - DJI Futures
-25 NASDAQ -11 Data Used - 8/11/2023
| |
8/11/2023
|
|
| |
Market Comments
While the
tech ETFs retrace their big gains under the pressure of Professional
and
"big money" sellng, the DJI sturdily stays above its 35000 support, thereby
keeping
alive the bullish scenario that it will be able to rally back up to its highs.
Its Closing
Power is still rising. So, Professionals have not abandoned it
or that
goal for the DJIA.
Whether it
will be able to hold up and there will be a tech rebound from its
over-sold
status will depend a lot on the FED and whether the 10-year
Treasury
Bond rates will not breakout and stay under 4.4%.
The bears
will point out the level of national indebtedness. But they
have a much
harder time making the case for a recession. The Jobs
numbers
still show respectable hiring gains. For now, Bonds and Utilities
have not
broken down. But watch most closely the Ten Year Rates.
There is
often a very close inverse ralationship between the direction of
its rate
movements and the NASDAQ and QQQ.
Look at the
charts below. See how the NASDAQ, NVDA and TSLA have
now reached
potential support at their rising 65-dma but still show falling
and
negative internals. AAPL has fallen to earlier support and its rising
100-day ma.
They may reverse. But we will need to see their Closing
Powers turn
up and break their downtrends to trust them enough to buy
them again.
If the 10-year Rates keep mving up, expect the tech sector
to be under
even more selling pressure.
While we
are waiting to see what develops with rates and in the tech sector,
consider buying OIH or GUSH. They can rally even when the DJI falls.
Right
now they show high levels of Accumulation and a very positive
Power
Ranking. There is also ample precedent for the oil sectors becoming
market leaders late in a bull market when Inflation is on the rise and
Stagflation threatens: 1968, 1973-1973, 1976-1977, 1980-1981.
See
also some of the bullish-looking oil stocks among our Bullish MAXCP
lists. There were very few others industries represented here.
BRKA
and NAIL are in uptrends, too. But again, we need to see their
Closing Powers turn up. Continue to stayed hedged with the most bearish
looking stocks among our Bearish MINCPs. |
|
| |
8/11/2023
2022 PEERLESS DJI, Signals, Indicators Daily DJI Volume
10-DayUp/Down Vol Stoch-20 CCI RSI Pct of All Stocks above 65-dma
Inverted Traders Index
DJI-IPA DJI-OBV Short-Term Rates
NASDAQ S&P OEX NYSE DJ-15 DJ-20 DJI-30 Old Peerless 2006 version
Tiger Index of Big
Banks Bond Funds Gold Stocks Housing Stocks
Insurance-Stocks
Regional
Banks Russell-1000
Semi Conductors
2006 vers-Peerless is no loner vailable.
Sorry. It is giving an error message and
without the code cannot be fixed.
ETFs: DIA QQQ SPY IWM MDY
TNA Short-Term Rates Ten Year Rates PST (Short Treasuries)
DOLLAR-UUP
ALLSTOCKs
COIN (Bit
Coin ETF)
USO-CrudeOil DBO BLDP FAS GLD HD IBB JETS JNUG KOL NAIL NUGT
NRGU OIH PALL RSX RETL SDS AGQ SLV SOXL TAN TECL TLT TMF TNA
UGA USO China:
YINN
CHAU
Commodities: CANE COCO CORN DBC JJC, NIB CORN, CUT (paper)
MOO, NRGU
SOYB WEAT UUP (Dollar) LIT
(Lithium) PALL
(Palladium)
Stocks
AA AAPL ADBE AMAT AMGN AMD AMZN ANET AXON AXP
BA BABA BAC BIDU BLDP BSX CAT CDNS CHKP CNX CPB CRM CVX CMG
DE DIS ENPH FB FSLR FTNT GILD GME GOOG GS HD IBM INTU JPM KO KR
LRCX MRK MRNA MOS MSFT NEM NFLX NKE NOC NUE NVDA PANW PG PYPL
QCOM QDEL REGN REV RE SCHW SNOW SO SQUARE TSLA TXN XOM V VRTX
WFC WMT XLE ZM ZOM
Biggest SEMI-Condctors in SOXL: NVDA. AVGO, AMD. INTC TXN MCHP NXPI AMAT ON
new AAOI
TSM
HOMEBUILDERS:
NAIL
BZH HOV MHO MTH PHM -
REGIONAL BANKS:
EGBN
FFIC GBCI HMST
Carl Icahn and associates: IEP
MS
JEF
Leveraged Short ETFs:
FAZ - financials, TZA and SRTY- small caps, MZZ - mid caps, TECS -Techs,
SOXS -
semi-conductors LABD
- Biotechs
Bullish MAXCPs http://tigersoftware.com/upping/8-11-2023/Bullish.htm
Bearish MINCPs www.tigersoftware.com/downing/8-11-2023/Bearish.htm |
|
 |

TEN YEAR RATES ARE THE KEY NOW.
 |
 |
 |
 |
 |
 |
 |
 |
 |
 |
 |
 |
 |
Table 1 - Daily Breadth and Volume Statistics
| NYSE |
Latest
Close |
Previous
Close |
Week
Ago |
| Issues
traded |
3,022 |
3,003 |
3,021 |
| Advances |
1,498 |
1,282 |
1,609 |
| Declines |
1,376 |
1,609 |
1,319 |
| Unchanged |
148 |
112 |
93 |
| New
highs |
40 |
72 |
111 |
| New
lows |
37 |
31 |
38 |
| Adv.
volume* |
375,454,265 |
382,072,098 |
350,361,363 |
| Decl.
volume* |
341,562,190 |
459,888,599 |
516,060,823 |
| Total
volume* |
745,118,988 |
851,098,465 |
881,626,866 |
| Closing
Arms (TRIN)† |
0.98 |
0.69 |
1.83 |
| Block
trades* |
4,076 |
4,424 |
4,270 |
| Adv.
volume |
1,880,949,672 |
2,388,367,572 |
1,621,724,913 |
| Decl.
volume |
1,692,342,093 |
2,075,102,194 |
2,438,788,944 |
| Total
volume |
3,753,293,467 |
4,504,373,967 |
4,143,310,378 |
| NASDAQ |
Latest
Close |
Previous
Close |
Week
Ago |
| Issues
traded |
4,472 |
4,497 |
4,456 |
| Advances |
1,943 |
1,990 |
2,003 |
| Declines |
2,369 |
2,294 |
2,272 |
| Unchanged |
160 |
213 |
181 |
| New
highs |
59 |
79 |
69 |
| New
lows |
177 |
180 |
113 |
| Closing
Arms (TRIN)† |
0.78 |
0.98 |
1.48 |
| Block
trades |
38,925 |
41,787 |
38,027 |
| Adv.
volume |
2,348,180,166 |
2,451,381,880 |
1,984,773,568 |
| Decl.
volume |
2,231,889,815 |
2,766,074,266 |
3,331,685,450 |
| Total
volume |
4,638,889,885 |
5,299,083,925 |
5,349,454,36 |
|
Table 2 QUICKSILVER on ETFS - 8/10/2023 ---
Bullish = 3 FAS, RETL, OIH (.518)
Bearish = 2 GLD TAN (-.432)
ETF       CLOSE     CHANGE    PIVOT-PT  5-dma AROC   CL-PWR  CANDLE  IP21    ITRS  POWER INDEX
=================================================================================================
DIA       353   1.11         354.62        33.4%     Bullish  BLUE  -.063    0
---------------------------------------------------------------------------------------------
COMPQX    13644.85  -93.14   13994.4      -95.5%     -------  BLUE  -.099   -.016    -.115
---------------------------------------------------------------------------------------------
SPY       445.65  -.26       450.71       -13%       -------  BLUE  -.115   -.005    -.12
---------------------------------------------------------------------------------------------
QQQ       366.24  -2.35      375.19       -78.1%     -------  BLUE  -.169   -.019    -.188
---------------------------------------------------------------------------------------------
MDY       486.12  -.11       493.44       -38.5%     -------  BLUE   .015    .033     .048
---------------------------------------------------------------------------------------------
IWM       190.99   .27       194.3        -82.5%     -------  BLUE   .046    .028     .074
---------------------------------------------------------------------------------------------
FAS       69.46   .38        72.45        -15.7%     Bullish  BLUE   .051    .22      .271
---------------------------------------------------------------------------------------------
RETL      7.63   0           7.95         -186.5%    -------  BLUE   .183    .425     .608
---------------------------------------------------------------------------------------------
SOXL      21.14  -1.67       25.66        -773.4%    -------  RED   -.103   -.072    -.175
---------------------------------------------------------------------------------------------
TECL      46.72  -1.11       50.96        -387.8%    -------  RED   -.184   -.058    -.242
---------------------------------------------------------------------------------------------
IBB       128.57   .4        126.55        47.9%     -------  BLUE  -.174   -.053    -.227
---------------------------------------------------------------------------------------------
GLD       177.6   0          179.78       -72.4%     Bearish  RED   -.267   -.097    -.364
---------------------------------------------------------------------------------------------
DBO       16.38   .02        16.3          30.6%     Bullish  ----   .056    .154     .21
---------------------------------------------------------------------------------------------
OIH       347.26   3.7       339.4         79.3%     Bullish  BLUE   .182    .336     .518
---------------------------------------------------------------------------------------------
CPER     23.08  -.19         23.79        -171.9%    -------  ----  -.031   -.051    -.082
---------------------------------------------------------------------------------------------
TAN     61.82  -.96          62.21        -71.9%     -------  RED   -.256   -.188    -.444
---------------------------------------------------------------------------------------------
UUP       28.57   .06        28.31         49.3%     Bullish  ----   .17   -.073      .097
---------------------------------------------------------------------------------------------
CORN      22.29  -.32        22.65        -99.3%     Bearish  RED   -.016   -.106    -.122
---------------------------------------------------------------------------------------------
WEAT      6.44  -.06         6.65         -53.3%     Bearish  ----  -.009   -.009    -.018
---------------------------------------------------------------------------------------------
YINN      35.31  -3.7        39.81        -653.1%    Bearish  RED   -.005    .088     .083
|
 Table 3      RANKING OF KEY DIRECTORIES BASED PCT.OF STOCKS ABOVE 65-DMA
              8/11/23
 Bullish = 29
 Bearish = 17
---------------------------------------------------------------------------------------
Directory     Current       day-1         day-2         day-3         day-4         day-5
----------------------------------------------------------------------------------------
COAL           1             1             1             1             1             1
REGBANKS       .947          .894          .947          .947          .973          .973
HOMEBLDG       .892          .892          .928          .964          .928          .928
BIGBANKS       .857          .857          .857          .857          .857          .857
RETAIL         .847          .869          .847          .847          .847          .826
EDU            .833          .833          .833          .833          .833          .833
OILGAS         .793          .773          .804          .804          .824          .824
GUNS           .785          .785          .785          .857          .857          .785
INSURANC       .72           .76           .76           .76           .8            .76
DJI-13         .692          .692          .692          .692          .692          .692
FINANCE        .687          .712          .725          .725          .775          .787
HIGHPRIC       .67           .683          .675          .688          .722          .705
INDEXES        .659          .735          .74           .745          .756          .735
CHEM           .627          .604          .627          .651          .627          .581
FIDSTKS        .627          .65           .621          .656          .674          .644
INFRA          .612          .612          .645          .645          .741          .677
GREEN          .611          .555          .555          .611          .555          .5
SP-100         .611          .633          .611          .644          .688          .666
RUS-1000       .596          .606          .619          .636          .687          .651
SP500          .592          .604          .615          .631          .668          .627
TRANSP         .578          .684          .736          .789          .789          .789
REIT           .573          .549          .581          .598          .672          .598
DOWJONES       .566          .6            .566          .6            .633          .633
INDMATER       .555          .541          .583          .638          .666          .638
AUTO           .547          .66           .66           .679          .735          .735
NASD-100       .524          .574          .554          .584          .673          .623
SOFTWARE       .517          .464          .428          .41           .5            .5
EAT            .512          .585          .585          .536          .56           .56
FOOD           .51           .51           .489          .53           .53           .51
=============================================================================================
BEVERAGE       .5            .5            .428          .428          .5            .428
COMODITY       .5            .5            .5            .526          .552          .5
COMPUTER       .5            .5            .55           .5            .5            .5
NIFTY          .5            .522          .522          .59           .681          .659
=============================================================================================
HOSPITAL       .461          .461          .461          .538          .615          .538
MILITARY       .461          .461          .5            .5            .5            .5
HACKERS        .437          .437          .375          .312          .437          .437
ELECTRON       .413          .481          .533          .556          .593          .593
ETFS           .4            .745          .69           .581          .818          .672
LOWPRICE       .398          .398          .398          .395          .392          .404
JETS           .384          .461          .461          .461          .461          .538
GAMING         .368          .526          .421          .421          .421          .421
CHINA          .365          .682          .682          .609          .634          .707
BIOTECH        .347          .362          .365          .362          .365          .39
SEMI           .315          .434          .51           .565          .597          .576
MARIJUAN       .3            .3            .3            .3            .2            .3
COPPER         .285          .285          .428          .285          .714          .571
UTILITY        .282          .256          .256          .256          .205          .205
GOLD           .2            .177          .111          .111          .133          .133
BONDFUND       .149          .114          .149          .149          .126          .16
SOLAR          .062          .062          .062          .062          .125          0
|
===================================================================================
Friday - 6:03 - 8/11/2023 - DJI
Futures -78 NASDAQ -99 Data Used - 8/10/2023
| |
8/10/2023
|
|
| |
Market Comments
The market could not hold its gains at mid-day and sold off. The
CPI numbers apparently are not low enough to guarantee the FED
will sit on its hands for a month or two and not raise rates. The
Ten Year Bond rates rose instead of falling. This made several
hundred more NYSE stocks fall than rise, including Warren Buffett's
BRKA which is shown below.
Once again we are seeing the magic of the Tiger Closing Power at
work in all the major tech ETFs and stocks like MSFT, AAPL and
NVDA, as these turned sharply down as the day ended. Professional
selling, as you can see in most of the charts below, remains a problem
for the market. Even the DJI which still has a rising Opening and
Closing Power could not power through the Big Money selling.
which our negative IP21 shows.. There was just too much overhead
resistance.
But optimists know that pull-backs from overhead reistance do not
necessarily bring deeper declines. As long the DJI can stay above
its 35000 resistance-turned-into-support, there is a chance that
the FED will choose to pause and not raise rates much higher,
thereby allowing the bullish inverted head and shoulders pattern
in the DJI to play put and bring a rally back to the 37000 high.
Unfortunately, I would now expect the techs to regain their strength
and the Closing Powers there to break their downtrends. Clearly
that has not happened. Watch NVDA, SOXL and TSLA to
see if they can show signs of a recovery from their uptrend-supports
and their rising 65-dma.
So more moving back and forth just above 35000 in the DJI
is the market-meal we are being served. Trading long the Bullish
MAXCPs and short the bearish MINCPs is probably our best
strategy now.
Note the appearance of Berskshire Hathaway (BRKA) below.
There are times when it can be bought for nice trading gains. See the
good move up recently when its Closing Power and Relative
Strength were rising..
I want to add the Power Ranker's daily values as well as the 65-dma
to the new Windows10 candle stick charts. Let's see if I can get that
done this weekend. |
|
| |
8/10/2023
2022 PEERLESS DJI, Signals, Indicators Daily DJI Volume
10-DayUp/Down Vol Stoch-20 CCI RSI Pct of All Stocks above 65-dma
Inverted Traders Index
DJI-IPA DJI-OBV Short-Term Rates
NASDAQ S&P OEX NYSE DJ-15 DJ-20 DJI-30 Old Peerless 2006 version
Tiger Index of Big
Banks Bond Funds Gold Stocks Housing Stocks
Insurance-Stocks
Regional
Banks Russell-1000
Semi Conductors
2006 vers-Peerless is no loner vailable.
Sorry. It is giving an error message and
without the code cannot be fixed.
ETFs: DIA QQQ SPY IWM MDY
TNA Short-Term Rates Ten Year Rates PST (Short Treasuries)
DOLLAR-UUP
ALLSTOCKs
COIN (Bit
Coin ETF)
USO-CrudeOil DBO BLDP FAS GLD HD IBB JETS JNUG KOL NAIL NUGT
NRGU OIH PALL RSX RETL SDS AGQ SLV SOXL TAN TECL TLT TMF TNA
UGA USO China:
YINN
CHAU
Commodities: CANE COCO CORN DBC JJC, NIB CORN, CUT (paper)
MOO, NRGU
SOYB WEAT UUP (Dollar) LIT
(Lithium) PALL
(Palladium)
Stocks
AA AAPL ADBE AMAT AMGN AMD AMZN ANET AXON AXP
BA BABA BAC BIDU BLDP BSX CAT CDNS CHKP CNX CPB CRM CVX CMG
DE DIS ENPH FB FSLR FTNT GILD GME GOOG GS HD IBM INTU JPM KO KR
LRCX MRK MRNA MOS MSFT NEM NFLX NKE NOC NUE NVDA PANW PG PYPL
QCOM QDEL REGN REV RE SCHW SNOW SO SQUARE TSLA TXN XOM V VRTX
WFC WMT XLE ZM ZOM
Biggest SEMI-Condctors in SOXL: NVDA. AVGO, AMD. INTC TXN MCHP NXPI AMAT ON
new AAOI
TSM
HOMEBUILDERS:
NAIL
BZH HOV MHO MTH PHM -
REGIONAL BANKS:
EGBN
FFIC GBCI HMST
Carl Icahn and associates: IEP
MS
JEF
Leveraged Short ETFs:
FAZ - financials, TZA and SRTY- small caps, MZZ - mid caps, TECS -Techs,
SOXS -
semi-conductors LABD
- Biotechs
Bullish MAXCPs http://tigersoftware.com/upping/8-10-2023/Bullish.htm
Bearish MINCPs www.tigersoftware.com/downing/8-10-2023/Bearish.htm |
|
 |
 |
 |
 |
 |
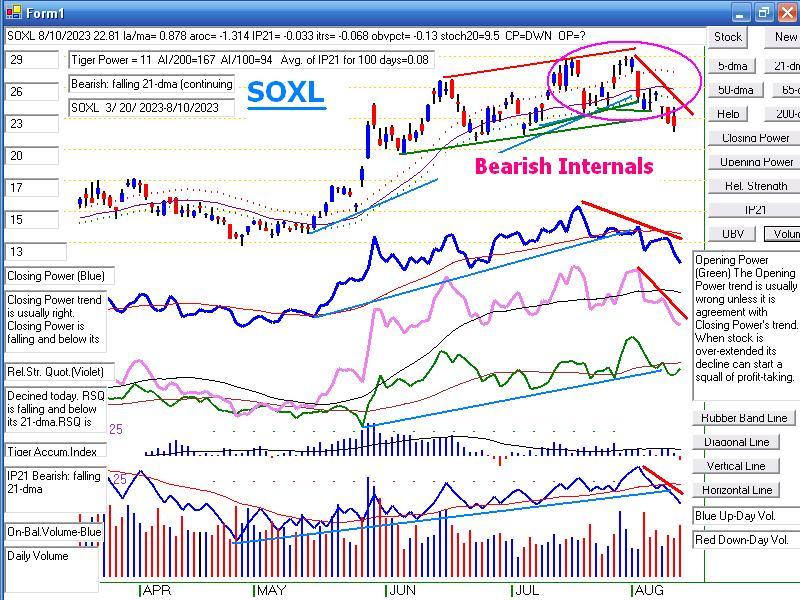 |
 |
 |
 |
 |
 |
 |
| |
Table 1 - Daily Breadth and Volume Statistics
| NYSE |
Latest
Close |
Previous
Close |
Week
Ago |
| Issues
traded |
3,003 |
3,018 |
3,016 |
| Advances |
1,282 |
1,289 |
1,117 |
| Declines |
1,609 |
1,597 |
1,820 |
| Unchanged |
112 |
132 |
79 |
| New
highs |
72 |
77 |
76 |
| New
lows |
31 |
37 |
46 |
| Adv.
volume* |
382,072,098 |
328,052,324 |
386,539,851 |
| Decl.
volume* |
459,888,599 |
479,767,553 |
488,656,339 |
| Total
volume* |
851,098,465 |
821,958,120 |
880,090,876 |
| Closing
Arms (TRIN)† |
0.69 |
1.36 |
0.81 |
| Block
trades* |
4,424 |
3,819 |
4,081 |
| Adv.
volume |
2,388,367,572 |
1,390,861,473 |
1,773,001,301 |
| Decl.
volume |
2,075,102,194 |
2,342,625,460 |
2,341,837,820 |
| Total
volume |
4,504,373,967 |
3,803,106,342 |
4,149,123,790 |
| NASDAQ |
Latest
Close |
Previous
Close |
Week
Ago |
| Issues
traded |
4,497 |
4,515 |
4,582 |
| Advances |
1,990 |
1,644 |
1,992 |
| Declines |
2,294 |
2,687 |
2,395 |
| Unchanged |
213 |
184 |
195 |
| New
highs |
79 |
78 |
60 |
| New
lows |
180 |
187 |
107 |
| Closing
Arms (TRIN)† |
0.98 |
0.98 |
0.42 |
| Block
trades |
41,787 |
44,148 |
56,559 |
| Adv.
volume |
2,451,381,880 |
2,134,682,920 |
3,959,045,638 |
| Decl.
volume |
2,766,074,266 |
3,418,222,157 |
2,006,443,215 |
| Total
volume |
5,299,083,925 |
5,591,362,831 |
6,036,970,006 |
|
Table 2 QUICKSILVER on ETFS - 8/10/2023 ---
Bullish = 3 RETL, DBO, OIH (.453)
Bearish = 3 IBB GLD TAN (-.432)
ETF       CLOSE     CHANGE    PIVOT-PT  5-dma AROC   CL-PWR  CANDLE  IP21    ITRS  POWER INDEX
=================================================================================================
DIA       351.89   .61       350.65       -1.4%      Bullish  RED   -.104    0       =====
---------------------------------------------------------------------------------------------
COMPQX    13737.99   15.97   13909.24     -79.8%     -------  RED   -.051   -.009    -.06
---------------------------------------------------------------------------------------------
SPY       445.91   .16       446.81       -32.7%     -------  RED   -.11   -.003     -.113
---------------------------------------------------------------------------------------------
QQQ       368.59   .68       372.04       -69.9%     -------  RED   -.139   -.011    -.15
---------------------------------------------------------------------------------------------
MDY       486.23  -.64       489.89       -35.3%     -------  RED    .025    .025     .05
---------------------------------------------------------------------------------------------
IWM       190.72  -.85       194.17       -99.2%     -------  RED    .067    .022     .089
---------------------------------------------------------------------------------------------
FAS       69.08   .15        69.68        -100.1%    Bullish  RED    .05    .176      .226
---------------------------------------------------------------------------------------------
RETL      7.63  -.03         7.92         -235.7%    -------  RED    .13    .303      .433
---------------------------------------------------------------------------------------------
SOXL      22.81  -.28        24.88        -474.7%    -------  RED   -.033   -.067     -.1
--------------------------------------------------------------------------------------------
TECL      47.83   .04        50.55        -492.4%    Bearish  RED   -.153   -.054    -.207
---------------------------------------------------------------------------------------------
IBB       128.17   .42       127.35        50.3%     Bearish  RED   -.204   -.049    -.253
---------------------------------------------------------------------------------------------
GLD       177.6  -.19        180.19       -54.1%     Bearish  RED   -.209   -.089    -.298
---------------------------------------------------------------------------------------------
DBO       16.36  -.19        16.28         67.4%     Bullish  RED    .165    .124     .289
---------------------------------------------------------------------------------------------
OIH       343.56  -2.02      341.83        19%       Bullish  RED    .176    .277     .453
---------------------------------------------------------------------------------------------
CPER     23.27  -.18         23.89        -174.9%    Bearish  RED    .008   -.033    -.025
---------------------------------------------------------------------------------------------
TAN     62.78  -.62          62.72        -67.7%     -------  RED   -.254   -.178    -.432
---------------------------------------------------------------------------------------------
UUP       28.51   .05        28.29         14.1%     Bullish  BLUE   .108   -.066     .042
---------------------------------------------------------------------------------------------
CORN      22.61   .01        22.74         26.5%     -------  BLUE   .124   -.09      .034
---------------------------------------------------------------------------------------------
WEAT      6.5  -.02          6.51          22.9%     Bearish  ----   .011    .012     .023
---------------------------------------------------------------------------------------------
YINN      39.01   .97        40.4         -380.4%    Bearish  RED    .013    .204     .217
|
 Table 3      RANKING OF KEY DIRECTORIES BASED PCT.OF STOCKS ABOVE 65-DMA
              8/10/23
 Bullish = 32
 Bearish = 15
---------------------------------------------------------------------------------------
Directory     Current       day-1         day-2         day-3         day-4         day-5
----------------------------------------------------------------------------------------
COAL           1             1             1             1             1             1
REGBANKS       .894          .947          .947          .973          .973          .973
HOMEBLDG       .892          .928          .964          .928          .928          .821
RETAIL         .869          .847          .847          .847          .826          .826
BIGBANKS       .857          .857          .857          .857          .857          .857
EDU            .833          .833          .833          .833          .833          .833
=============================================================================================
GUNS           .785          .785          .857          .857          .785          .785
OILGAS         .773          .804          .804          .824          .824          .845
INSURANC       .76           .76           .76           .8            .76           .8
ETFS           .745          .69           .581          .818          .69           .618
INDEXES        .724          .74           .745          .756          .735          .735
FINANCE        .712          .725          .725          .762          .787          .762
DJI-13         .692          .692          .692          .692          .692          .846
TRANSP         .684          .736          .789          .789          .789          .842
HIGHPRIC       .683          .675          .688          .722          .705          .696
CHINA          .682          .682          .609          .634          .707          .731
AUTO           .66           .679          .679          .735          .735          .735
FIDSTKS        .65           .621          .656          .674          .644          .68
SP-100         .633          .611          .644          .688          .666          .722
INFRA          .612          .645          .645          .741          .677          .709
RUS-1000       .606          .619          .636          .687          .653          .677
CHEM           .604          .627          .651          .627          .581          .581
SP500          .604          .615          .631          .665          .627          .659
DOWJONES       .6            .566          .6            .633          .633          .7
EAT            .585          .585          .536          .56           .585          .634
NASD-100       .574          .554          .584          .673          .623          .702
GREEN          .555          .555          .611          .555          .5            .611
REIT           .549          .573          .606          .68           .59           .573
INDMATER       .541          .583          .638          .666          .638          .666
GAMING         .526          .421          .368          .473          .421          .473
NIFTY          .522          .522          .59           .681          .659          .772
FOOD           .51           .51           .51           .53           .51           .51
============================================================================================
BEVERAGE       .5            .428          .428          .5            .428          .571
COMODITY       .5            .526          .5            .552          .5            .5
COMPUTER       .5            .55           .5            .5            .5            .55
============================================================================================
SOFTWARE       .482          .446          .41           .5            .482          .589
ELECTRON       .481          .533          .556          .593          .586          .631
HOSPITAL       .461          .461          .538          .615          .538          .615
JETS           .461          .461          .461          .461          .538          .615
MILITARY       .461          .5            .5            .5            .5            .538
HACKERS        .437          .375          .312          .437          .437          .562
SEMI           .434          .51           .565          .597          .576          .608
LOWPRICE       .398          .401          .398          .392          .404          .436
BIOTECH        .36           .362          .365          .365          .395          .413
MARIJUAN       .3            .3            .3            .2            .3            .6
COPPER         .285          .428          .285          .714          .571          .571
UTILITY        .256          .256          .256          .205          .23           .282
GOLD           .177          .111          .111          .133          .133          .111
BONDFUND       .114          .137          .149          .137          .172          .08
SOLAR          .062          .062          .062          .125          0             .125
|
===================================================================================
Thursday - 5:57 - 8/10/2023 - DJI Futures +240 NASDAQ +161 Data Used - 8/9/2023
| |
|
|
| |
Market Comments
Again the DJI held just above its support at 35000. Unable to break
below it, we should see it, merely on a technical basis, rally. And that
advance could be a very good one, since the CPI numbers were close to
last month's despite the recent strength in oil prices. If it can match the
0.2% June increase for the next 12 months, the rate of yearly inflation
will drop to 2.4%. That is the FED's stated target for inflation. One might
therefore reason that the FED will thus have no need to raise rates any
higher. But this, of course, assumes that US Goverment borrowing
will be adequate. The 10-year rate is back down to almost 4%. This
should allow a blue chip rally, wherein the DJI goes back up to 37000.
Such a rally would be in keeping with the still rising NYSE AD Line, the
DIA's rising Opening Power and Closing Power and Augusts when
there has been an old-fashioned Buy B18.
Oil stocks and home-builders are the best suited for new investments,
if we trust Tables 2 and 3. Note the still falling Closing Power for
the NASDAQ, QQQ and SPY. Watch to see if the AI leaders
MSFT and NVDA can rebound today. NVDA has dropped to
a neckline in its head/shoulder pattern while MSFT and TECL
have slightly penetrated their recent lows. For the first time in
a long while SOXL no longer shows a Power Index (IP21 + ITRS)
score above +.25. A DJI resumption of its advance should allow
the volatile techs to go back to their highs.
CONSUMER PRICE INDEX - JULY 2023
The Consumer Price Index for All Urban Consumers (CPI-U) rose 0.2 percent in July on a
seasonally
adjusted basis, the same increase as in June, the U.S. Bureau of Labor Statistics reported
today.
Over the last 12 months, the all items index increased 3.2 percent before seasonal
adjustment.
The index for shelter was by far the largest contributor to the monthly all items
increase,
accounting for over 90 percent of the increase, with the index for motor vehicle insurance
also
contributing. The food index increased 0.2 percent in July after increasing 0.1 percent
the previous
month. The index for food at home increased 0.3 percent over the month while the index for
food away
from home rose 0.2 percent in July. The energy index rose 0.1 percent in July as the major
energy
component indexes were mixed. |
|
| |
8/9/2023
2022 PEERLESS DJI, Signals, Indicators Daily DJI Volume
10-DayUp/Down Vol Stoch-20 CCI RSI Pct of All Stocks above 65-dma
Inverted Traders Index
DJI-IPA DJI-OBV Short-Term Rates
NASDAQ S&P OEX NYSE DJ-15 DJ-20 DJI-30 Old Peerless 2006 version
Tiger Index of Big
Banks Bond Funds Gold Stocks Housing Stocks
Insurance-Stocks
Regional
Banks Russell-1000
Semi Conductors
2006 vers-Peerless is no loner vailable.
Sorry. It is giving an error message and
without the code cannot be fixed.
ETFs: DIA QQQ SPY IWM MDY
TNA Short-Term Rates Ten Year Rates PST (Short Treasuries)
DOLLAR-UUP
ALLSTOCKs
COIN (Bit
Coin ETF)
USO-CrudeOil DBO BLDP FAS GLD HD IBB JETS JNUG KOL NAIL NUGT
NRGU OIH PALL RSX RETL SDS AGQ SLV SOXL TAN TECL TLT TMF TNA
UGA USO China:
YINN
CHAU
Commodities: CANE COCO CORN DBC JJC, NIB CORN, CUT (paper)
MOO, NRGU
SOYB WEAT UUP (Dollar) LIT
(Lithium) PALL
(Palladium)
Stocks
AA AAPL ADBE AMAT AMGN AMD AMZN ANET AXON AXP
BA BABA BAC BIDU BLDP BSX CAT CDNS CHKP CNX CPB CRM CVX CMG
DE DIS ENPH FB FSLR FTNT GILD GME GOOG GS HD IBM INTU JPM KO KR
LRCX MRK MRNA MOS MSFT NEM NFLX NKE NOC NUE NVDA PANW PG PYPL
QCOM QDEL REGN REV RE SCHW SNOW SO SQUARE TSLA TXN XOM V VRTX
WFC WMT XLE ZM ZOM
Biggest SEMI-Condctors in SOXL: NVDA. AVGO, AMD. INTC TXN MCHP NXPI AMAT ON
new AAOI
TSM
HOMEBUILDERS:
NAIL
BZH HOV MHO MTH PHM -
REGIONAL BANKS:
EGBN
FFIC GBCI HMST
Carl Icahn and associates: IEP
MS
JEF
Leveraged Short ETFs:
FAZ - financials, TZA and SRTY- small caps, MZZ - mid caps, TECS -Techs,
SOXS -
semi-conductors LABD
- Biotechs
Bullish MAXCPs http://tigersoftware.com/upping/8-09-2023/Bullish.htm
Bearish MINCPs www.tigersoftware.com/downing/8-09-2023/Bearish.htm |
|
 |
 |
 |
 |
 |
 |
 |
 |
 |
 |
Table 1
| NYSE |
Latest
Close |
Previous
Close |
Week
Ago |
| Issues
traded |
3,018 |
3,018 |
3,027 |
| Advances |
1,289 |
1,088 |
664 |
| Declines |
1,597 |
1,813 |
2,280 |
| Unchanged |
132 |
117 |
83 |
| New
highs |
77 |
64 |
65 |
| New
lows |
37 |
65 |
33 |
| Adv.
volume* |
328,052,324 |
293,347,453 |
202,248,740 |
| Decl.
volume* |
479,767,553 |
538,633,220 |
737,167,249 |
| Total
volume* |
821,958,120 |
842,078,009 |
945,006,841 |
| Closing
Arms (TRIN)† |
1.36 |
1.19 |
1.06 |
| Block
trades* |
3,819 |
3,839 |
4,195 |
| Adv.
volume |
1,390,861,473 |
1,277,956,694 |
918,604,162 |
| Decl.
volume |
2,342,625,460 |
2,542,233,890 |
3,330,669,589 |
| Total
volume |
3,803,106,342 |
3,884,915,799 |
4,270,711,191 |
| NASDAQ |
Latest
Close |
Previous
Close |
Week
Ago |
| Issues
traded |
4,515 |
4,488 |
4,536 |
| Advances |
1,644 |
1,666 |
1,226 |
| Declines |
2,687 |
2,607 |
3,137 |
| Unchanged |
184 |
215 |
173 |
| New
highs |
78 |
62 |
56 |
| New
lows |
187 |
204 |
123 |
| Closing
Arms (TRIN)† |
0.98 |
0.82 |
0.93 |
| Block
trades |
44,148 |
39,047 |
37,617 |
| Adv.
volume |
2,134,682,920 |
2,294,175,332 |
1,615,950,350 |
| Decl.
volume |
3,418,222,157 |
2,931,083,948 |
3,832,820,244 |
| Total
volume |
5,591,362,831 |
5,284,559,809 |
5,481,962,062 |
|
Table 2 QUICKSILVER on ETFS - 8/9/2023 ---
Bullish = 3 RETL, DBO, OIH (.455)
Bearish = 1 TAN (-.435)
ETF       CLOSE     CHANGE    PIVOT-PT  5-dma AROC   CL-PWR  CANDLE  IP21    ITRS  POWER INDEX
=================================================================================================
DIA       351.28  -1.74      351.99       -20.7%     Bullish  RED   -.101    0        ====
---------------------------------------------------------------------------------------------
COMPQX    13722.02  -162.3   13959.72     -90.2%     -------  RED   -.005   -.004    -.009
---------------------------------------------------------------------------------------------
SPY       445.75  -3         448.84       -48.8%     -------  RED   -.077   -.001    -.078
---------------------------------------------------------------------------------------------
QQQ       367.91  -4.09      373.79       -86.8%     -------  RED   -.085   -.006    -.091
---------------------------------------------------------------------------------------------
MDY       486.87  -2.4       489.69       -44.3%     -------  RED    .034    .028     .062
---------------------------------------------------------------------------------------------
IWM       191.57  -1.51      194.56       -91.1%     -------  RED    .069    .026     .095
---------------------------------------------------------------------------------------------
FAS       68.93  -1.62       70.49        -103.2%    Bullish  RED    .056    .177     .233
---------------------------------------------------------------------------------------------
RETL      7.66  -.06         8            -189.6%    -------  RED    .094    .313     .407
---------------------------------------------------------------------------------------------
SOXL      23.09  -1.37       25.15        -436.5%    -------  RED    .03   -.053     -.023
---------------------------------------------------------------------------------------------
TECL      47.79  -1.96       52.79        -547.6%    Bearish  RED   -.094   -.036    -.13
---------------------------------------------------------------------------------------------
IBB       127.75   .42       126.89        15.3%     -------  BLUE  -.179   -.057    -.236
---------------------------------------------------------------------------------------------
GLD       177.79  -.85       179.54       -50.4%     Bearish  RED   -.106   -.079    -.185
---------------------------------------------------------------------------------------------
DBO       16.55   .21        16.14         231.9%    Bullish  BLUE   .265    .098     .363
---------------------------------------------------------------------------------------------
OIH       345.58   4.16      342.26        92.9%     Bullish  BLUE   .187    .268     .455
---------------------------------------------------------------------------------------------
CPER     23.45   .07         24.1         -65.2%     Bullish  ----   .03   -.025      .005
---------------------------------------------------------------------------------------------
TAN     63.4   1.36          63.63         1.6%      -------  BLUE  -.215   -.166    -.381
---------------------------------------------------------------------------------------------
UUP       28.46   .02        28.43         1.8%      Bearish  ----   .013   -.066    -.053
---------------------------------------------------------------------------------------------
CORN      22.6  -.13         22.49        -15.4%     Bearish  RED    .062   -.105    -.043
---------------------------------------------------------------------------------------------
WEAT      6.52  -.13         6.47          7.6%      Bearish  RED   -.001   -.02    -.021
---------------------------------------------------------------------------------------------
YINN      38.04   .47        42.02        -129.5%    -------  RED    .086    .069     .155
|
 Table 3    RANKING OF KEY DIRECTORIES BASED PCT.OF STOCKS ABOVE 65-DMA
             8/9/23
 Bullish = 35
 Bearish = 14
---------------------------------------------------------------------------------------
Directory     Current       day-1         day-2         day-3         day-4         day-5
----------------------------------------------------------------------------------------
COAL           1             1             1             1             1             1
REGBANKS       .947          .947          .973          .973          .973          .973
HOMEBLDG       .928          .964          .928          .928          .821          .928
BIGBANKS       .857          .857          .857          .857          .857          .857
RETAIL         .847          .847          .847          .826          .826          .847
EDU            .833          .833          .833          .833          .833          .833
OILGAS         .804          .804          .824          .824          .845          .804
==============================================================================================
GUNS           .785          .857          .857          .785          .785          .714
INSURANC       .76           .76           .8            .76           .8            .8
INDEXES        .74           .745          .756          .735          .735          .778
TRANSP         .736          .789          .789          .789          .842          .894
FINANCE        .725          .725          .762          .775          .762          .812
DJI-13         .692          .692          .692          .692          .846          .846
ETFS           .69           .581          .818          .69           .654          .672
CHINA          .682          .609          .634          .707          .731          .707
AUTO           .679          .698          .735          .735          .735          .754
HIGHPRIC       .675          .688          .722          .705          .696          .735
INFRA          .645          .645          .741          .677          .709          .709
CHEM           .627          .651          .627          .581          .581          .697
FIDSTKS        .621          .656          .674          .644          .674          .692
RUS-1000       .619          .636          .687          .653          .674          .726
SP500          .615          .631          .665          .625          .653          .72
SP-100         .611          .644          .688          .666          .7            .733
EAT            .585          .536          .56           .585          .634          .634
INDMATER       .583          .638          .666          .638          .666          .75
REIT           .573          .598          .688          .598          .565          .672
DOWJONES       .566          .6            .633          .633          .7            .7
GREEN          .555          .611          .555          .5            .611          .611
NASD-100       .554          .584          .673          .623          .693          .712
COMPUTER       .55           .5            .5            .5            .55           .7
ELECTRON       .533          .556          .593          .586          .624          .639
COMODITY       .526          .526          .526          .5            .5            .5
NIFTY          .522          .59           .681          .659          .772          .75
FOOD           .51           .53           .51           .51           .51           .51
SEMI           .51           .565          .597          .576          .608          .597
============================================================================================
MILITARY       .5            .5            .5            .5            .538          .5
============================================================================================
SOFTWARE       .464          .428          .5            .482          .571          .625
HOSPITAL       .461          .538          .615          .538          .615          .461
JETS           .461          .461          .461          .538          .615          .692
BEVERAGE       .428          .428          .5            .428          .5            .571
COPPER         .428          .285          .714          .571          .571          .571
GAMING         .421          .368          .421          .473          .421          .473
LOWPRICE       .401          .401          .395          .404          .434          .463
HACKERS        .375          .312          .437          .437          .562          .562
BIOTECH        .36           .362          .368          .395          .418          .406
MARIJUAN       .3            .3            .2            .3            .6            .4
UTILITY        .256          .256          .205          .23           .307          .615
BONDFUND       .137          .137          .137          .183          .091          .482
GOLD           .111          .111          .133          .133          .111          .155
SOLAR          .062          .062          .125          0             .125          0
|
=================================================================================
Wednesday - 5:55 - 8/9/2023 - DJI Futures +67 NASDAQ +57 Data Used - 8/8/2023
|
8/8/2023
|
|
|
The FOMC is divided about the need for more rate hikes. Both "hawks"
and "doves"
spoke out yesterday. The market chose to listen to the doves
as Professionals
quickly turned the DJI up as soon as it reached the 35,000
support. But the
DJI still closed down more than 150 points and breadth
remained negative with
725 more decliners than advancers on the NYSE.
Our Closing Powers are
falling for SPY and QQQ. "Big Money", as shown
by a negative
IP21/Accumulation Index, continues to sell into intra-day rallies.
Watch TECL to see if it
can rebound now that it has reached its rising 65-dma.
But don't count on it
yet. Value-based stocks, not tech growth stocks, are
more favored right now.
See in the NASDAQ chart below how its NASDJI
(relative strengh line)
is stll falling.
Inflaton numbers are
widely expected to show further subsidence. But be
skeptcal of this.
Oil stocks and OIH are on the rise. Housing prices
should be falling
because of how much more expensive financing new
home sales has become.
But these are not ordinary times. There is
a big shortage in
"affordable" housing and rentals. Higher rates just
make home construction
more expensive. This worsens the need for more
housing. It is a
testament to that shortage that we are seeing a housing
construction boom now
because of the shortage. Hence NAIL,
MHO and PHM are the
strongest among the nearly 200 ETFs and stocks
we show each night
here..
Government spending on
the military and on solar energy is being
curtailed in the name
of economy and a more balanced budget. Many
investors view the
enormous size of the U.S. Government and personal
debt represents the
biggest potential threat to the market. Unless the FED
prints a lot more
money, interest rates seemingly must go high enough to
attract those who will
buy gvernment debt. That puts the currenti 4% rate
on 10- year bonds in
jeopardy. Watch the news to see which path
the FED takes, higher
rates or printing more money. At this point,
Professionals are
betting on the latter alternative.
As I said last night,
the DJI seems to be at a "high inflecton" point.
It could spring mch
higher as it has done in those Augusts when
we got a Buy B18.
Or it could collapse, as it did in 1929, 1937
and 1987 when the FED
takes a very hawkish stance too long. Hedging
with our Bullish MAXCPs
and Bearish MINCPs seems appropriate in this
environment. |
|
|
8/8/2023
2022 PEERLESS DJI, Signals, Indicators Daily DJI Volume
10-DayUp/Down Vol Stoch-20 CCI RSI Pct of All Stocks above 65-dma
Inverted Traders Index
DJI-IPA DJI-OBV Short-Term Rates
NASDAQ S&P OEX NYSE DJ-15 DJ-20 DJI-30 Old Peerless 2006 version
Tiger Index of Big
Banks Bond Funds Gold Stocks Housing Stocks
Insurance-Stocks
Regional
Banks Russell-1000
Semi Conductors
2006 vers-Peerless is no loner vailable.
Sorry. It is giving an error message and
without the code cannot be fixed.
ETFs: DIA QQQ SPY IWM MDY
TNA Short-Term Rates Ten Year Rates PST (Short Treasuries)
DOLLAR-UUP
ALLSTOCKs
COIN (Bit
Coin ETF)
USO-CrudeOil DBO BLDP FAS GLD HD IBB JETS JNUG KOL NAIL NUGT
NRGU OIH PALL RSX RETL SDS AGQ SLV SOXL TAN TECL TLT TMF TNA
UGA USO China:
YINN
CHAU
Commodities: CANE COCO CORN DBC JJC, NIB CORN, CUT (paper)
MOO, NRGU
SOYB WEAT UUP (Dollar) LIT
(Lithium) PALL
(Palladium)
Stocks
AA AAPL ADBE AMAT AMGN AMD AMZN ANET AXON AXP
BA BABA BAC BIDU BLDP BSX CAT CDNS CHKP CNX CPB CRM CVX CMG
DE DIS ENPH FB FSLR FTNT GILD GME GOOG GS HD IBM INTU JPM KO KR
LRCX MRK MRNA MOS MSFT NEM NFLX NKE NOC NUE NVDA PANW PG PYPL
QCOM QDEL REGN REV RE SCHW SNOW SO SQUARE TSLA TXN XOM V VRTX
WFC WMT XLE ZM ZOM
Biggest SEMI-Condctors in SOXL: NVDA. AVGO, AMD. INTC TXN MCHP NXPI AMAT ON
new AAOI
TSM
HOMEBUILDERS:
NAIL
BZH HOV MHO MTH PHM -
REGIONAL BANKS:
EGBN
FFIC GBCI HMST
Carl Icahn and associates: IEP
MS
JEF
Leveraged Short ETFs:
FAZ - financials, TZA and SRTY- small caps, MZZ - mid caps, TECS -Techs,
SOXS -
semi-conductors LABD
- Biotechs
Bullish MAXCPs http://tigersoftware.com/upping/8-08-2023/Bullish.htm
Bearish MINCPs www.tigersoftware.com/downing/8-08-2023/Bearish.htm |
|
35000 support held again.
 |
Falling NASDJI shows NASDAQ is now weaker than DJIA
 |
DIA's Closing Power is still rising.

|
 |
 |
 |
 |
 |
 |
 |
 |
|
 |
Table 1
Daily Breadth and Volume Statistics
| NYSE |
Latest
Close |
Previous
Close |
Week
Ago |
| Issues
traded |
3,018 |
3,013 |
3,038 |
| Advances |
1,088 |
1,851 |
996 |
| Declines |
1,813 |
1,074 |
1,934 |
| Unchanged |
117 |
88 |
108 |
| New
highs |
64 |
102 |
107 |
| New
lows |
65 |
36 |
17 |
| Adv.
volume* |
293,347,453 |
501,834,111 |
260,657,595 |
| Decl.
volume* |
538,633,220 |
256,180,579 |
601,923,441 |
| Total
volume* |
842,078,009 |
765,654,757 |
867,950,936 |
| Closing
Arms (TRIN)† |
1.19 |
1.04 |
1.04 |
| Block
trades* |
3,839 |
3,716 |
4,155 |
| Adv.
volume |
1,277,956,694 |
2,159,900,363 |
1,324,897,295 |
| Decl.
volume |
2,542,233,890 |
1,302,722,035 |
2,687,716,405 |
| Total
volume |
3,884,915,799 |
3,493,922,967 |
4,042,375,848 |
| NASDAQ |
Latest
Close |
Previous
Close |
Week
Ago |
| Issues
traded |
4,488 |
4,499 |
4,576 |
| Advances |
1,666 |
2,040 |
1,652 |
| Declines |
2,607 |
2,275 |
2,752 |
| Unchanged |
215 |
184 |
172 |
| New
highs |
62 |
74 |
98 |
| New
lows |
204 |
175 |
93 |
| Closing
Arms (TRIN)† |
0.82 |
1.24 |
0.77 |
| Block
trades |
39,047 |
32,206 |
29,423 |
| Adv.
volume |
2,294,175,332 |
2,039,672,871 |
2,011,923,365 |
| Decl.
volume |
2,931,083,948 |
2,819,335,702 |
2,577,780,057 |
| Total
volume |
5,284,559,809 |
4,892,332,328 |
4,633,772,547 |
|
Table 2 QUICKSILVER on ETFS - 8/8/2023 ---
Bullish = 6 FAS, RETL, SOXL (+287), DBO, OIH (.526)
Bearish = 1 TAN (-.435)
ETF       CLOSE     CHANGE    PIVOT-PT  5-dma AROC   CL-PWR  CANDLE  IP21    ITRS  POWER INDEX
=================================================================================================
DIA       353.02  -1.6       352.74       -45%       Bullish  BLUE  -.052    0        ====
---------------------------------------------------------------------------------------------
COMPQX    13884.32  -110.08  13973.45     -142.5%    -------  BLUE   .073    .016     .089
---------------------------------------------------------------------------------------------
SPY       448.75  -1.96      450.13       -85.8%     -------  BLUE  -.012    .005    -.007
---------------------------------------------------------------------------------------------
QQQ       372  -3.19         374.39       -143.6%    -------  RED   -.025    .018    -.007
---------------------------------------------------------------------------------------------
MDY       489.27  -4.17      491.22       -78.1%     Bullish  BLUE   .078    .029     .107
---------------------------------------------------------------------------------------------
IWM       193.08  -1.22      195.11       -120.9%    Bullish  BLUE   .116    .031     .147
---------------------------------------------------------------------------------------------
FAS       70.55  -1.9        70.39        -125.9%    Bullish  BLUE   .106    .217     .323
---------------------------------------------------------------------------------------------
RETL      7.72  -.23         7.96         -293.6%    -------  ----   .152    .342     .494
---------------------------------------------------------------------------------------------
SOXL      24.46  -1.2        25.28        -785.7%    -------  ----   .087    .2       .287
---------------------------------------------------------------------------------------------
TECL      49.75  -1.21       53.43        -753.4%    -------  RED   -.029    .08     .051
---------------------------------------------------------------------------------------------
IBB       127.33   .78       127.36       -28.3%     Bearish  BLUE  -.147   -.073    -.22
---------------------------------------------------------------------------------------------
GLD       178.64  -1.14      179.6        -50.6%     Bearish  ----  -.064   -.086    -.15
---------------------------------------------------------------------------------------------
DBO       16.34   .04        15.8          68.2%     Bullish  BLUE   .281    .082    .363
---------------------------------------------------------------------------------------------
OIH       341.42   2.02      339.25       -4.1%      Bullish  BLUE   .296    .23     .526
---------------------------------------------------------------------------------------------
CPER     23.38  -.41         23.76        -171.2%    Bullish  BLUE   .09   -.022     .068
---------------------------------------------------------------------------------------------
TAN     62.04  -.17          63.38        -393.4%    -------  BLUE  -.236   -.199    -.435
---------------------------------------------------------------------------------------------
UUP       28.44   .13        28.45         15.9%     Bearish  ----  -.061   -.083    -.144
---------------------------------------------------------------------------------------------
CORN      22.73   .08        22.67        -44.1%     -------  BLUE   .066   -.084    -.018
---------------------------------------------------------------------------------------------
WEAT      6.65   0           6.51          15.3%     Bearish  ----   .028    .008     .036
---------------------------------------------------------------------------------------------
YINN      37.57  -2.24       39.07        -657.3%    -------  BLUE   .105    .093     .198
|
TABLE 3        RANKING OF KEY DIRECTORIES BASED PCT.OF STOCKS ABOVE 65-DMA
               8/8/23
BULLISH - 35
BEARISH - 13
---------------------------------------------------------------------------------------
Directory     Current       day-1         day-2         day-3         day-4         day-5
----------------------------------------------------------------------------------------
COAL           1             1             1             1             1             1
HOMEBLDG       .964          .928          .928          .821          .928          .964
REGBANKS       .947          .973          .973          .973          .973          .973
BIGBANKS       .857          .857          .857          .857          .857          1
GUNS           .857          .857          .785          .785          .714          .857
RETAIL         .847          .847          .826          .826          .847          .826
EDU            .833          .833          .833          .833          .833          .833
----------------------------------------------------------------------------------------------
OILGAS         .804          .824          .824          .845          .814          .855
TRANSP         .789          .789          .789          .842          .894          .894
INSURANC       .76           .8            .76           .8            .8            .84
INDEXES        .745          .756          .735          .735          .772          .74
FINANCE        .725          .762          .775          .75           .812          .875
AUTO           .698          .754          .735          .735          .754          .849
DJI-13         .692          .692          .692          .846          .846          .846
HIGHPRIC       .688          .722          .705          .696          .735          .783
FIDSTKS        .656          .674          .644          .674          .692          .769
CHEM           .651          .627          .581          .581          .674          .79
INFRA          .645          .741          .677          .709          .709          .838
SP-100         .644          .688          .666          .7            .733          .766
INDMATER       .638          .666          .638          .666          .736          .847
RUS-1000       .636          .687          .653          .674          .723          .785
SP500          .631          .665          .625          .651          .714          .759
GREEN          .611          .555          .5            .611          .611          .666
CHINA          .609          .634          .707          .731          .707          .731
DOWJONES       .6            .633          .633          .7            .7            .733
REIT           .598          .68           .606          .573          .647          .713
NIFTY          .59           .681          .659          .772          .75           .863
NASD-100       .584          .673          .623          .693          .712          .772
ETFS           .581          .818          .69           .654          .709          .945
SEMI           .565          .597          .576          .608          .597          .739
ELECTRON       .556          .593          .586          .624          .631          .714
HOSPITAL       .538          .615          .538          .615          .461          .538
EAT            .536          .56           .585          .634          .634          .634
FOOD           .53           .53           .489          .51           .51           .632
COMODITY       .526          .552          .473          .5            .5            .657
---------------------------------------------------------------------------------------------
COMPUTER       .5            .5            .5            .55           .7            .7
MILITARY       .5            .5            .5            .538          .5            .576
----------------------------------------------------------------------------------------------
JETS           .461          .461          .538          .615          .692          .692
SOFTWARE       .446          .517          .482          .571          .607          .714
BEVERAGE       .428          .5            .428          .5            .571          .642
LOWPRICE       .401          .398          .407          .434          .46           .478
GAMING         .368          .421          .421          .473          .473          .684
BIOTECH        .36           .365          .398          .418          .408          .467
HACKERS        .312          .437          .437          .562          .562          .625
MARIJUAN       .3            .2            .3            .6            .4            .7
COPPER         .285          .714          .571          .571          .571          1
UTILITY        .256          .205          .23           .307          .538          .615
BONDFUND       .137          .126          .183          .103          .471          .609
GOLD           .111          .133          .133          .111          .155          .288
SOLAR          .062          .125          0             .125          0             .25
|
==============================================================================
Tuesday - 6:13 - 8/8/2023 - DJI
Futures -267 NASDAQ -142 Data Used - 8/7/2023
| |
8/7/2023
|
|
| |
The judged Breakout Buy B10 may fail if the DJI drops back much
below 35000. Naturally, we worry when we see Closing Power
downtrends in SPY, QQQ and the NASDAQ and negative IP21s.
I even suggested adding some short sales from our Bearish MINCP
stocks because they had become quite plentiful. TAN is among the
lowest Power Ranked and Solar Energy stocks as a group are at
the bottom of Table 3. While the DIA shows rising Opening and
Closing Power moving averages, its IP21 is negative. This means
"Big Money" is selling it on strength.
But at the risk of sounding like a typical two-handed economist,
I have to note the still rising NYSE A/D Line and the Buy B18 that
was given by the 2006 version of Peerless on Sunday night. Our
current version did not produce this signal, which is based on
42 straight days in a rising 21-day moving average, because
the newer version of Peerless requires the V-Indicator to be
positive and does not allow a Buy B18 so soon after a Sell S9-V.
Still, we should note that August B18s have been particularly
bullish in the past.
Past B18s
8/4/42 +34.8% gain when reversed.
8/29/49 +24.1% gain when reversed.
8/2/54 +34.0% gain when reversed.
8/1/58 +28.7% gain when reversed
8/1/95 +18.1% gain when reversed,
While we did not get a Buy B18 from the current Peerless
chart, these bullish numbers show that the inverted head and
shoulders DJI pattern has lots of bullish potential if interest rates
were to fall instead of being lifted higher by the Fed and by the
huge level of Federal debt that must be financed.
The 1937 market top study highlights 4 factors behind that year's
46% Crash in the DJI. Two of the four are present now.
#1 Cut-backs in Federal Spending; #2 Heightening of Bank
Reserve Requirements. Interest rates were not going up back
then. Back then, the FED considered Inflation a bigger risk than
the 13% unemployment. They are now. So, rising rates are
an additional bearish factor at the present time..
The third factor, dealing with going back on the Gold standard
does not apply now. And labor aggressiveness, the fourth factor,
is nothing like what it was in 1937, when there were a record number of
strikes for union recognition and better pay.
The level of Government indebtedness is the wild card now.
We just don't know if the need to refinance the Government's
massive indebedness will cause the rates on the 10-year bond
to rise to new highs above 4.4%. If it does, the stock market
will likely be in real trouble.
For now, I would treat the current decline as something to be
played by traders using bearish MINCP shorts. It is likely
35000 on the DJI will hold and at some point I would think
Professionals will resume buying SPY, QQQ and tech stocks
generally. If the market was in real danger now, I would
think that big bank stocks would show more signs of weakness.
|
|
| |
8/7/2023
2022 PEERLESS DJI, Signals, Indicators Daily DJI Volume
10-DayUp/Down Vol Stoch-20 CCI RSI Pct of All Stocks above 65-dma
Inverted Traders Index
DJI-IPA DJI-OBV Short-Term Rates
NASDAQ S&P OEX NYSE DJ-15 DJ-20 DJI-30 Old Peerless 2006 version
Tiger Index of Big
Banks Bond Funds Gold Stocks Housing Stocks
Insurance-Stocks
Regional
Banks Russell-1000
Semi Conductors
2006 vers-Peerless is no loner vailable.
Sorry. It is giving an error message and
without the code cannot be fixed.
ETFs: DIA QQQ SPY IWM MDY
TNA Short-Term Rates Ten Year Rates PST (Short Treasuries)
DOLLAR-UUP
ALLSTOCKs
COIN (Bit
Coin ETF)
USO-CrudeOil DBO BLDP FAS GLD HD IBB JETS JNUG KOL NAIL NUGT
NRGU OIH PALL RSX RETL SDS AGQ SLV SOXL TAN TECL TLT TMF TNA
UGA USO China:
YINN
CHAU
Commodities: CANE COCO CORN DBC JJC, NIB CORN, CUT (paper)
MOO, NRGU
SOYB WEAT UUP (Dollar) LIT
(Lithium) PALL
(Palladium)
Stocks
AA AAPL ADBE AMAT AMGN AMD AMZN ANET AXON AXP
BA BABA BAC BIDU BLDP BSX CAT CDNS CHKP CNX CPB CRM CVX CMG
DE DIS ENPH FB FSLR FTNT GILD GME GOOG GS HD IBM INTU JPM KO KR
LRCX MRK MRNA MOS MSFT NEM NFLX NKE NOC NUE NVDA PANW PG PYPL
QCOM QDEL REGN REV RE SCHW SNOW SO SQUARE TSLA TXN XOM V VRTX
WFC WMT XLE ZM ZOM
Biggest SEMI-Condctors in SOXL: NVDA. AVGO, AMD. INTC TXN MCHP NXPI AMAT ON
new AAOI
TSM
HOMEBUILDERS:
NAIL
BZH HOV MHO MTH PHM -
REGIONAL BANKS:
EGBN
FFIC GBCI HMST
Carl Icahn and associates: IEP
MS
JEF
Leveraged Short ETFs:
FAZ - financials, TZA and SRTY- small caps, MZZ - mid caps, TECS -Techs,
SOXS -
semi-conductors LABD
- Biotechs
Bullish MAXCPs http://tigersoftware.com/upping/8-07-2023/Bullish.htm
Bearish MINCPs www.tigersoftware.com/downing/8-07-2023/Bearish.htm |
|
 |
 |
SPY
 |
 |
 |
 |
 |
 |
 |
 |
 |
 |
| |
Table 1 - Breadth and Volume Statistics
| NYSE |
Latest
Close |
Previous
Close |
Week
Ago |
| Issues
traded |
3,013 |
3,021 |
3,066 |
| Advances |
1,851 |
1,609 |
2,150 |
| Declines |
1,074 |
1,319 |
807 |
| Unchanged |
88 |
93 |
109 |
| New
highs |
102 |
111 |
152 |
| New
lows |
36 |
38 |
8 |
| Adv.
volume* |
501,834,111 |
350,361,363 |
811,499,106 |
| Decl.
volume* |
256,180,579 |
516,060,823 |
385,048,529 |
| Total
volume* |
765,654,757 |
881,626,866 |
1,205,629,959 |
| Closing
Arms (TRIN)† |
1.04 |
1.83 |
0.95 |
| Block
trades* |
3,716 |
4,270 |
4,466 |
| Adv.
volume |
2,159,900,363 |
1,621,724,913 |
3,285,291,336 |
| Decl.
volume |
1,302,722,035 |
2,438,788,944 |
1,166,915,660 |
| Total
volume |
3,493,922,967 |
4,143,310,378 |
4,503,600,183 |
| NASDAQ |
Latest
Close |
Previous
Close |
Week
Ago |
| Issues
traded |
4,499 |
4,456 |
4,587 |
| Advances |
2,040 |
2,003 |
2,832 |
| Declines |
2,275 |
2,272 |
1,572 |
| Unchanged |
184 |
181 |
183 |
| New
highs |
74 |
69 |
142 |
| New
lows |
175 |
113 |
64 |
| Closing
Arms (TRIN)† |
1.24 |
1.48 |
0.48 |
| Block
trades |
32,206 |
38,027 |
34,952 |
| Adv.
volume |
2,039,672,871 |
1,984,773,568 |
3,867,417,391 |
| Decl.
volume |
2,819,335,702 |
3,331,685,450 |
1,021,826,152 |
| Total
volume |
4,892,332,328 |
5,349,454,363 |
4,934,441,750 |
|
Table 2
QUICKSILVER on ETFS - 8/7/2023 --- Bullish = 4 FAS, RETL, SOXL (+597), DBO, OIH (.614)
Bearish = 1 TAN (-.436)
ETF       CLOSE     CHANGE    PIVOT-PT  5-dma AROC   CL-PWR  CANDLE  IP21    ITRS  POWER INDEX
=================================================================================================
DIA       354.62   3.97      356.2        -13.4%     Bullish  BLUE  -.053    0        ---
---------------------------------------------------------------------------------------------
COMPQX    13994.4   85.16    14283.91     -124.7%    -------  BLUE   .081    .04      .121
---------------------------------------------------------------------------------------------
SPY       450.71   3.9       456.48       -78.3%     -------  BLUE   .008    .015     .023
---------------------------------------------------------------------------------------------
QQQ       375.19   3.15      382.79       -112.5%    -------  BLUE  -.024    .05      .026
---------------------------------------------------------------------------------------------
MDY       493.44   3.55      496.96       -49.6%     Bullish  BLUE   .068    .034     .102
---------------------------------------------------------------------------------------------
IWM       194.3   .13        197.8        -112.5%    Bullish  RED    .123    .026     .149
---------------------------------------------------------------------------------------------
FAS       72.45   2.77       72.34         4.2%      Bullish  BLUE   .068    .247     .315
---------------------------------------------------------------------------------------------
RETL      7.95   .03         8.19         -210.6%    Bullish  ----   .165    .29      .455
---------------------------------------------------------------------------------------------
SOXL      25.66   .78        28.53        -519.8%    Bullish  BLUE   .077    .52      .597
---------------------------------------------------------------------------------------------
TECL      50.96   .41        57.75        -597.5%    -------  RED   -.068    .24      .172
---------------------------------------------------------------------------------------------
IBB       126.55  -.8        128.05       -108%      Bearish  RED   -.119   -.102    -.221
---------------------------------------------------------------------------------------------
GLD       179.78  -.41       180.46       -71.2%     -------  RED   -.015   -.093    -.108
---------------------------------------------------------------------------------------------
DBO       16.3   .02         16.12         43.5%     Bullish  ----   .232    .048     .28
---------------------------------------------------------------------------------------------
OIH       339.4  -2.43       341.7        -63.5%     Bullish  RED    .283    .186     .469
---------------------------------------------------------------------------------------------
CPER     23.79  -.1          24.2         -213.2%    Bullish  RED    .093    .003     .096
---------------------------------------------------------------------------------------------
TAN     62.21  -.51          67.06        -486.4%    -------  RED   -.233   -.203    -.436
---------------------------------------------------------------------------------------------
UUP       28.31   .02        28.35         15.9%     Bearish  ----  -.076   -.087    -.163
---------------------------------------------------------------------------------------------
CORN      22.65  -.09        22.93        -96.6%     -------  BLUE   .052   -.098    -.046
---------------------------------------------------------------------------------------------
WEAT      6.65   .14         6.63         -45.7%     Bearish  ----  -.014    .004    -.01
---------------------------------------------------------------------------------------------
YINN      39.81  -.59        42.94        -778%      -------  RED    .079    .08     .159
|
TABLE 3       RANKING OF KEY DIRECTORIES BASED PCT.OF STOCKS ABOVE 65-DMA
              8/7/23
Bearish = 11
Bullish = 36
---------------------------------------------------------------------------------------
Directory     Current       day-1         day-2         day-3         day-4         day-5
----------------------------------------------------------------------------------------
COAL           1             1             1             1             1             1
REGBANKS       .973          .973          .973          .973          .973          .973
HOMEBLDG       .928          .928          .821          .928          .964          .964
BIGBANKS       .857          .857          .857          .857          1             1
GUNS           .857          .785          .785          .714          .857          .785
RETAIL         .847          .826          .826          .847          .826          .826
EDU            .833          .833          .833          .833          .833          .833
OILGAS         .824          .824          .845          .814          .845          .876
ETFS           .818          .69           .654          .709          .963          .963
INSURANC       .8            .76           .8            .8            .84           .84
TRANSP         .789          .789          .842          .894          .894          1
FINANCE        .762          .775          .75           .8            .875          .912
INDEXES        .756          .735          .735          .772          .745          .821
AUTO           .754          .754          .735          .754          .83           .83
INFRA          .741          .677          .709          .709          .838          .903
HIGHPRIC       .722          .705          .696          .735          .783          .792
COPPER         .714          .571          .571          .571          1             .857
DJI-13         .692          .692          .846          .846          .846          .923
SP-100         .688          .666          .7            .733          .766          .8
RUS-1000       .687          .653          .674          .723          .784          .81
NIFTY          .681          .659          .772          .75           .863          .84
REIT           .68           .598          .581          .655          .696          .77
FIDSTKS        .674          .644          .674          .692          .763          .81
NASD-100       .673          .623          .693          .712          .772          .792
INDMATER       .666          .638          .666          .736          .833          .861
SP500          .665          .625          .651          .712          .757          .79
CHINA          .634          .707          .731          .707          .731          .829
DOWJONES       .633          .633          .7            .7            .733          .766
CHEM           .627          .581          .581          .674          .79           .813
HOSPITAL       .615          .538          .615          .461          .538          .461
SEMI           .597          .576          .608          .597          .739          .771
ELECTRON       .593          .586          .624          .631          .706          .774
EAT            .56           .585          .634          .634          .634          .78
GREEN          .555          .5            .611          .611          .666          .611
COMODITY       .552          .5            .473          .5            .657          .763
SOFTWARE       .535          .5            .571          .607          .714          .678
FOOD           .53           .51           .489          .51           .632          .714
=================================================================================================
BEVERAGE       .5            .428          .5            .571          .571          .714
COMPUTER       .5            .5            .55           .7            .7            .8
MILITARY       .5            .5            .538          .5            .576          .576
==================================================================================================
JETS           .461          .538          .615          .692          .692          .846
HACKERS        .437          .437          .562          .562          .625          .625
GAMING         .421          .421          .421          .526          .684          .684
LOWPRICE       .398          .41           .436          .46           .472          .478
BIOTECH        .362          .395          .421          .408          .467          .502
UTILITY        .205          .23           .307          .538          .589          .82
MARIJUAN       .2            .3            .6            .4            .7            .7
GOLD           .133          .133          .111          .155          .288          .444
BONDFUND       .126          .172          .103          .482          .62           .735
SOLAR .125 0 .125 0 .25 .375
|
========================================================================
Monday - 6:15 - 8/7/2023 - DJI
Futures +60 NASDAQ +60
Data Used - 8/4/2023
| |
8/4/2023
|
|
| |
Market Comments
The 10-year rates are the key now I would suggest. As long as they stay about where
they are now, just above 4%, the DJI should be able to stay above its 35000
support. On Friday, AAPL, which is watched as much as any stock these days,
fell nine points, having earlier broken its Closing Power and Rel Strength uptrend-lines.
This is exactly what happens when a long, well tested uptrendline is broken. But
other key stocks like MSFT and NVDA did not sell off and SOXL held just above
its key support. This resiliency should entitle us to a rally. But there are
lots of head
and shoulders patterns in the making out there and SPY and QQQ have falling Closing
Powers.
So, we have to doubt if Professionals will permit much of a bounce, especially
since we see negative Accumulation, too. Abide by the Closing Power trends.
Short more of the many bearish MINCPs. Keep in mind that August is quite
capable of bring a very significant top, when as now we see rising rates, fiscal
contraction and an increase in required bank reserves. 1937 is long ago and
we have a much stronger economy now as well as a much more quiescent labor
movement. But, even so, the bearish MINCPs look more attractive as short
sales than do the over-extended stocks shown among the Bullish stocks.
VB Net TigerSoft Progress Report
August brought awesome tops for short sellers in 1929 and 1987. Read about
the 1938 top in the link above. I have written chapters like this about each of
the years from 1885 to 1950. When the Window10 Peerless is done, I will publish
the book Peerless: 1885-1950 next. The VBNet Tiger
keeps advancing. This
weekend I finished the Power-Ranker Grid. Re-doing VBNet-2002 charts in the
current VBNet should not take much time. Then, I will turn to the Flagging
Programs and finally the many signals. Stay tuned. |
|
| |
8/4/2023
2022 PEERLESS DJI, Signals, Indicators Daily DJI Volume
10-DayUp/Down Vol Stoch-20 CCI RSI Pct of All Stocks above 65-dma
Inverted Traders Index
DJI-IPA DJI-OBV Short-Term Rates
NASDAQ S&P OEX NYSE DJ-15 DJ-20 DJI-30 Old Peerless 2006 version
Tiger Index of Big
Banks Bond Funds Gold Stocks Housing Stocks
Insurance-Stocks
Regional
Banks Russell-1000
Semi Conductors
2006 vers-Peerless is no loner vailable.
Sorry. It is giving an error message and
without the code cannot be fixed.
ETFs: DIA QQQ SPY IWM MDY
TNA Short-Term Rates Ten Year Rates PST (Short Treasuries)
DOLLAR-UUP
ALLSTOCKs
COIN (Bit
Coin ETF)
USO-CrudeOil DBO BLDP FAS GLD HD IBB JETS JNUG KOL NAIL NUGT
NRGU OIH PALL RSX RETL SDS AGQ SLV SOXL TAN TECL TLT TMF TNA
UGA USO China:
YINN
CHAU
Commodities: CANE COCO CORN DBC JJC, NIB CORN, CUT (paper)
MOO, NRGU
SOYB WEAT UUP (Dollar) LIT
(Lithium) PALL
(Palladium)
Stocks
AA AAPL ADBE AMAT AMGN AMD AMZN ANET AXON AXP
BA BABA BAC BIDU BLDP BSX CAT CDNS CHKP CNX CPB CRM CVX CMG
DE DIS ENPH FB FSLR FTNT GILD GME GOOG GS HD IBM INTU JPM KO KR
LRCX MRK MRNA MOS MSFT NEM NFLX NKE NOC NUE NVDA PANW PG PYPL
QCOM QDEL REGN REV RE SCHW SNOW SO SQUARE TSLA TXN XOM V VRTX
WFC WMT XLE ZM ZOM
Biggest SEMI-Condctors in SOXL: NVDA. AVGO, AMD. INTC TXN MCHP NXPI AMAT ON
HOMEBUILDERS:
NAIL
BZH HOV MHO MTH PHM -
REGIONAL BANKS:
EGBN
FFIC GBCI HMST
Carl Icahn and associates: IEP
MS
JEF
Leveraged Short ETFs:
FAZ - financials, TZA and SRTY- small caps, MZZ - mid caps, TECS -Techs,
SOXS -
semi-conductors LABD
- Biotechs
Bullish MAXCPs http://tigersoftware.com/upping/8-04-2023/Bullish.htm
Bearish MINCPs www.tigersoftware.com/downing/8-04-2023/Bearish.htm |
|
 |
 |
 |
 |
 |
 |
 |
 |
 |
 |
 |
| NYSE |
Latest
Close |
Previous
Close |
Week
Ago |
| Issues
traded |
3,021 |
3,016 |
3,048 |
| Advances |
1,609 |
1,117 |
2,106 |
| Declines |
1,319 |
1,820 |
863 |
| Unchanged |
93 |
79 |
79 |
| New
highs |
111 |
76 |
119 |
| New
lows |
38 |
46 |
12 |
| Adv.
volume* |
350,361,363 |
386,539,851 |
611,914,522 |
| Decl.
volume* |
516,060,823 |
488,656,339 |
246,929,255 |
| Total
volume* |
881,626,866 |
880,090,876 |
861,347,464 |
| Closing
Arms (TRIN)† |
1.83 |
0.81 |
0.88 |
| Block
trades* |
4,270 |
4,081 |
4,238 |
| Adv.
volume |
1,621,724,913 |
1,773,001,301 |
2,915,668,844 |
| Decl.
volume |
2,438,788,944 |
2,341,837,820 |
1,053,439,202 |
| Total
volume |
4,143,310,378 |
4,149,123,790 |
3,981,013,886 |
| NASDAQ |
Latest
Close |
Previous
Close |
Week
Ago |
| Issues
traded |
4,456 |
4,582 |
4,541 |
| Advances |
2,003 |
1,992 |
3,217 |
| Declines |
2,272 |
2,395 |
1,146 |
| Unchanged |
181 |
195 |
178 |
| New
highs |
69 |
60 |
125 |
| New
lows |
113 |
107 |
85 |
| Closing
Arms (TRIN)† |
1.48 |
0.42 |
0.61 |
| Block
trades |
38,027 |
56,559 |
27,079 |
| Adv.
volume |
1,984,773,568 |
3,959,045,638 |
3,493,608,589 |
| Decl.
volume |
3,331,685,450 |
2,006,443,215 |
757,311,064 |
| Total
volume |
5,349,454,363 |
6,036,970,006 |
4,453,525,521 |
|
Table 2 QUICKSILVER on ETFS - 8/4/2023 ---
Bullish = 4 RETL, SOXL (+430), DBO, OIH (.614)
Bearish = 1 TAN (newly here)
ETF       CLOSE     CHANGE    PIVOT-PT  5-dma AROC   CL-PWR  CANDLE  IP21    ITRS  POWER INDEX
=================================================================================================
DIA       350.65  -1.34      355.57       -54.1%      Bullish  RED   -.114    0        ====
---------------------------------------------------------------------------------------------
COMPQX    13909.24  -50.48   14346.02     -143.7%     -------  RED   -.023    .047     .024
---------------------------------------------------------------------------------------------
SPY       446.81  -2.03      457.79       -111.3%     -------  RED   -.075    .018    -.057
---------------------------------------------------------------------------------------------
QQQ       372.04  -1.75      383.68       -150.7%     -------  RED   -.096    .055    -.041
---------------------------------------------------------------------------------------------
MDY       489.89   .2        498.33       -60.7%      Bullish  RED    .043    .036     .079
---------------------------------------------------------------------------------------------
IWM       194.17  -.39       198.71       -57.5%      Bullish  RED    .107    .034     .141
---------------------------------------------------------------------------------------------
FAS       69.68  -.81        72.39        -128.8%     Bullish  RED    .048    .167     .215
---------------------------------------------------------------------------------------------
RETL      7.92  -.08         8.29         -117.1%     Bullish  RED    .152    .298     .45
---------------------------------------------------------------------------------------------
SOXL      24.88  -.27        28.41        -603.2%     -------  BLUE   .02    .41       .43
---------------------------------------------------------------------------------------------
TECL      50.55  -2.24       57.46        -587.9%     -------  RED   -.117    .221     .104
---------------------------------------------------------------------------------------------
IBB       127.35   .46       129.31       -97.8%      Bearish  BLUE  -.14   -.089    -.229
---------------------------------------------------------------------------------------------
GLD       180.19   .65       182.35       -46.2%      Bullish  ----  -.048   -.078    -.126
---------------------------------------------------------------------------------------------
DBO       16.28   .14        16.16         106%       Bullish  BLUE   .253    .082     .335
---------------------------------------------------------------------------------------------
OIH       341.83  -.43       343.74        63.5%      Bullish  RED    .388    .226     .614
---------------------------------------------------------------------------------------------
CPER     23.89  -.21         24.82        -90.8%      Bullish  ----   .101    .006     .107
---------------------------------------------------------------------------------------------
TAN     62.72  -.91          68.54        -418.6%     -------  RED   -.219   -.179    -.398
---------------------------------------------------------------------------------------------
UUP       28.29  -.14        28.22         21.2%      Bearish  ----  -.125   -.063    -.188
---------------------------------------------------------------------------------------------
CORN      22.74   .25        23.09        -226.2%     Bearish  ----   .003   -.072    -.069
---------------------------------------------------------------------------------------------
WEAT      6.51   .04         6.71         -360.3%     Bearish  RED   -.068   -.026    -.094
---------------------------------------------------------------------------------------------
YINN      40.4  -1.62        46.37        -500.9%     Bullish  RED    .103    .045     .148
|
 Table 3      RANKING OF KEY DIRECTORIES BASED PCT.OF STOCKS ABOVE 65-DMA
               8/4/23
 Bullish = 36
 Bearish = 10
---------------------------------------------------------------------------------------
Directory     Current       day-1         day-2         day-3         day-4         day-5
----------------------------------------------------------------------------------------
COAL           1             1             1             1             1             1
REGBANKS       .973          .973          .973          .973          .973          .947
HOMEBLDG       .928          .821          .928          .964          .964          .964
               ====
BIGBANKS       .857          .857          .857          1             1             1
               ====
EDU            .833          .833          .833          .833          .833          1
RETAIL         .826          .826          .847          .826          .826          .804
OILGAS         .824          .845          .814          .845          .876          .855
               ====
==============================================================================================
TRANSP         .789          .842          .894          .894          1             .947
GUNS           .785          .785          .714          .857          .857          .785
FINANCE        .775          .75           .8            .862          .912          .85
INSURANC       .76           .8            .8            .84           .84           .84
AUTO           .754          .754          .754          .83           .83           .773
INDEXES        .735          .735          .772          .745          .821          .789
CHINA          .707          .731          .707          .731          .829          .78
HIGHPRIC       .705          .696          .735          .783          .787          .809
DJI-13         .692          .846          .846          .846          .923          .923
ETFS           .69           .654          .709          .963          .981          .963
INFRA          .677          .709          .709          .838          .903          .806
SP-100         .666          .7            .733          .766          .8            .811
NIFTY          .659          .772          .75           .863          .84           .886
RUS-1000       .653          .674          .723          .784          .809          .798
FIDSTKS        .644          .674          .692          .763          .804          .816
INDMATER       .638          .666          .736          .833          .861          .833
DOWJONES       .633          .7            .7            .733          .766          .766
SP500          .625          .651          .712          .755          .786          .796
NASD-100       .623          .693          .712          .772          .792          .821
REIT           .598          .573          .663          .704          .762          .745
ELECTRON       .586          .624          .631          .706          .774          .759
EAT            .585          .634          .634          .634          .78           .707
CHEM           .581          .581          .674          .79           .813          .813
SEMI           .576          .608          .597          .739          .782          .739
COPPER         .571          .571          .571          1             .857          .857
HOSPITAL       .538          .615          .461          .538          .461          .461
JETS           .538          .615          .692          .692          .846          .769
SOFTWARE       .517          .589          .607          .714          .66           .66
FOOD           .51           .51           .489          .632          .714          .673
===============================================================================================
COMODITY       .5            .5            .473          .657          .763          .71
COMPUTER       .5            .55           .7            .7            .8            .8
GREEN          .5            .611          .611          .666          .611          .611
MILITARY       .5            .538          .5            .576          .576          .615
===============================================================================================
HACKERS        .437          .562          .562          .625          .625          .562
BEVERAGE       .428          .5            .571          .571          .714          .928
GAMING         .421          .421          .473          .736          .684          .578
LOWPRICE       .41           .439          .463          .472          .472          .454
BIOTECH        .393          .418          .411          .467          .505          .479
MARIJUAN       .3            .6            .4            .7            .7            .6
UTILITY        .23           .307          .538          .589          .82           .82
BONDFUND       .172          .091          .482          .632          .747          .735
GOLD           .133          .111          .155          .288          .444          .288
SOLAR          0             .125          0             .25           .375          .125
|
=======================================================================
Friday - 6:15 - 8/4/2023 - DJI
Futures +50 NASDAQ +10 Data Used - 8/3/2023
| |
8/3/2023 |
|
| |
Market Comments
The DJI began to find buyers as it neared its breakout-point near 35000.
A red optimized trading Buy was given to SOXL. NVDA rose a little
from its lower band. But the real news remains the rapid rise in the 10-year
rates as the Government seeks to fund its immense deficit through borrowing
at higher and higher interest rates. The Fitch downgrade of their safety
rating for US Treasuries was not rescinded as JPM President Jamie Dimon
wanted. Since higher taxes on the wealthy is outside the realm of political
possibilities, no one really knows what level interest rates it will take to
sell all the new Government debt instruments. This is the real danger now
as we enter August just before the often bearish months of September
and October. Immediately, we see how badly bonds and
utilities are
reacting to this situation.
With the NASDAQ up more than 40% and the QQQ up 50%, there
would seem to be lots of overhead selling if the recent tech weakness
invites Public buying. The problem here is that the QQQ and NASDAQ
show Closing Power downtends. Professionals will probably not
be aggressive buyers. Moreover, their leader in the DJI-30, MSFT
now shows a bearish head and shoulders top. Any decline from
here would violate its best support. And already, both its Opening
and Closing Power are falling. Going back to the NASDAQ chart,
note the rare "hands above the head" pattern in the NASDAQ. This
only occurs when there is a high level of public speculation. It is
a danger sign.
The 35000 support in the DJI may hold up for a while, but this will
not change the bearish forces of rising rates, over which the FED
now has little control. And with oil prices on the rise, it looks like
there will be a higher level of inflation ahead this Autumn. Oil stocks
and OIH look good enough to buy. TAN is most bearish ETF on Table 2
It's true many groups are above their 65-dma, as shown in Table 3.
But the number of stocks still above that level has fallen rapidly this
week. Moreover, the number of new lows is higher than the number
of new highs on the NASDAQ. This would seem to be a good time
to hedge with some bearish MINCPs. |
|
| |
Daily Charts - 8/3/2023
2022 PEERLESS DJI, Signals, Indicators Daily DJI Volume
10-DayUp/Down Vol Stoch-20 CCI RSI Pct of All Stocks above 65-dma
Inverted Traders Index
DJI-IPA DJI-OBV Short-Term Rates
NASDAQ S&P OEX NYSE DJ-15 DJ-20 DJI-30 Old Peerless 2006 version
Tiger Index of Big
Banks Bond Funds Gold Stocks Housing Stocks
Insurance-Stocks
Regional
Banks Russell-1000
Semi Conductors
2006 vers-Peerless is no loner vailable.
Sorry. It is giving an error message and
without the code cannot be fixed.
ETFs: DIA QQQ SPY IWM MDY
TNA Short-Term Rates Ten Year Rates PST (Short Treasuries)
DOLLAR-UUP
ALLSTOCKs
COIN (Bit
Coin ETF)
USO-CrudeOil DBO BLDP FAS GLD HD IBB JETS JNUG KOL NAIL NUGT
NRGU OIH PALL RSX RETL SDS AGQ SLV SOXL TAN TECL TLT TMF TNA
UGA USO China:
YINN
CHAU
Commodities: CANE COCO CORN DBC JJC, NIB CORN, CUT (paper)
MOO, NRGU
SOYB WEAT UUP (Dollar) LIT
(Lithium) PALL
(Palladium)
Stocks
AA AAPL ADBE AMAT AMGN AMD AMZN ANET AXON AXP
BA BABA BAC BIDU BLDP BSX CAT CDNS CHKP CNX CPB CRM CVX CMG
DE DIS ENPH FB FSLR FTNT GILD GME GOOG GS HD IBM INTU JPM KO KR
LRCX MRK MRNA MOS MSFT NEM NFLX NKE NOC NUE NVDA PANW PG PYPL
QCOM QDEL REGN REV RE SCHW SNOW SO SQUARE TSLA TXN XOM V VRTX
WFC WMT XLE ZM ZOM
Biggest SEMI-Condctors in SOXL: NVDA. AVGO, AMD. INTC TXN MCHP NXPI AMAT ON
HOMEBUILDERS:
NAIL
BZH HOV MHO MTH PHM -
REGIONAL BANKS:
EGBN
FFIC GBCI HMST
Carl Icahn and associates: IEP
MS
JEF
Leveraged Short ETFs:
FAZ - financials, TZA and SRTY- small caps, MZZ - mid caps, TECS -Techs,
SOXS -
semi-conductors LABD
- Biotechs
Bullish MAXCPs http://tigersoftware.com/upping/8-03-2023/Bullish.htm
Bearish MINCPs www.tigersoftware.com/downing/8-03-2023/Bearish.htm |
|
 |
Old Peerless - 2006 version.
Note how good as Sells are the breaks in the PI-Indicator
 |
The 21-day ma of Opening and Closing Power
are both rising for DIA. But Big Money (IP21)
has turned negative,
 |
 |
 |
 |
 |
 |
 |
 |
 |
 |
 |
 |
Table 1 - Breadth and Volume Statistics
| NYSE |
Latest
Close |
Previous
Close |
Week
Ago |
| Issues
traded |
3,016 |
3,027 |
3,049 |
| Advances |
1,117 |
664 |
713 |
| Declines |
1,820 |
2,280 |
2,251 |
| Unchanged |
79 |
83 |
85 |
| New
highs |
76 |
65 |
151 |
| New
lows |
46 |
33 |
17 |
| Adv.
volume* |
386,539,851 |
202,248,740 |
239,265,379 |
| Decl.
volume* |
488,656,339 |
737,167,249 |
718,921,397 |
| Total
volume* |
880,090,876 |
945,006,841 |
965,098,244 |
| Closing
Arms (TRIN)† |
0.81 |
1.06 |
0.77 |
| Block
trades* |
4,081 |
4,195 |
4,314 |
| Adv.
volume |
1,773,001,301 |
918,604,162 |
1,312,462,117 |
| Decl.
volume |
2,341,837,820 |
3,330,669,589 |
3,204,829,753 |
| Total
volume |
4,149,123,790 |
4,270,711,191 |
4,553,214,364 |
| NASDAQ |
Latest
Close |
Previous
Close |
Week
Ago |
| Issues
traded |
4,582 |
4,536 |
4,559 |
| Advances |
1,992 |
1,226 |
1,250 |
| Declines |
2,395 |
3,137 |
3,145 |
| Unchanged |
195 |
173 |
164 |
| New
highs |
60 |
56 |
171 |
| New
lows |
107 |
123 |
108 |
| Closing
Arms (TRIN)† |
0.42 |
0.93 |
0.86 |
| Block
trades |
56,559 |
37,617 |
32,746 |
| Adv.
volume |
3,959,045,638 |
1,615,950,350 |
1,608,908,265 |
| Decl.
volume |
2,006,443,215 |
3,832,820,244 |
3,464,201,561 |
| Total
volume |
6,036,970,006 |
5,481,962,062 |
5,115,842,094 |
|
Table 2 QUICKSILVER on ETFS - 8/2/2023 ---
Bullish = 4 RETL, SOXL (+446), DBO, OIH (.661)
Bearish = 1 TAN (newly here)
ETF       CLOSE     CHANGE    PIVOT-PT  5-dma AROC   CL-PWR  CANDLE  IP21    ITRS  POWER INDEX
=================================================================================================
DIA       351.99  -.75       354.48       -11%       Bullish  BLUE  -.068    0      -.068
---------------------------------------------------------------------------------------------
COMPQX    13959.72  -13.73   14316.66     -31.8%     -------  BLUE   .075    .04     .115
---------------------------------------------------------------------------------------------
SPY       448.84  -1.29      456.92       -40.1%     Bullish  BLUE   .021    .014     .035
---------------------------------------------------------------------------------------------
QQQ       373.79  -.6        383.48       -37.2%     -------  BLUE  -.014    .05      .036
---------------------------------------------------------------------------------------------
MDY       489.69  -1.53      495.89       -22.3%     Bullish  BLUE   .115    .028     .143
---------------------------------------------------------------------------------------------
IWM       194.56  -.55       196.43        16.3%     Bullish  BLUE   .16    .034     .194
---------------------------------------------------------------------------------------------
FAS       70.49   .1         71.52        -48.9%     Bullish  BLUE   .095    .139     .234
---------------------------------------------------------------------------------------------
RETL      8   .04            8.11          99%       Bullish  BLUE   .182    .294     .476
---------------------------------------------------------------------------------------------
SOXL      25.15  -.13        28.15        -239.3%    Bullish  BLUE   .069    .377     .446
---------------------------------------------------------------------------------------------
TECL      52.79  -.64        57.1         -188%      -------  BLUE   .003    .222     .225
---------------------------------------------------------------------------------------------
IBB       126.89  -.47       129.86       -39.7%     Bearish  RED   -.084   -.09     -.174
---------------------------------------------------------------------------------------------
GLD       179.54  -.06       181.86       -24.3%     -------  BLUE  -.028   -.077    -.105
---------------------------------------------------------------------------------------------
DBO       16.14   .34        15.94         115.9%    Bullish  BLUE   .289    .091     .38
---------------------------------------------------------------------------------------------
OIH       342.26   3.01      337.5         142.2%    Bullish  BLUE   .426    .235     .661
---------------------------------------------------------------------------------------------
CPER     24.1   .34          24.33         70.3%     Bullish  BLUE   .142    .007     .149
---------------------------------------------------------------------------------------------
TAN     63.63   .25          68.26        -335.5%    Bearish  ----  -.179   -.165    -.344
---------------------------------------------------------------------------------------------
UUP       28.43  -.02        28.17         38.9%     Bearish  RED   -.167   -.052    -.219
---------------------------------------------------------------------------------------------
CORN      22.49  -.18        23.78        -372.8%    Bearish  RED    .034   -.064    -.03
---------------------------------------------------------------------------------------------
WEAT      6.47  -.04         6.99         -435.1%    Bearish  ----  -.07   -.002     -.072
---------------------------------------------------------------------------------------------
YINN      42.02   2.95       44.71         405.1%    -------  BLUE   .122   -.008     .114
|
TABLE 3      RANKING OF KEY DIRECTORIES BASED PCT.OF STOCKS ABOVE 65-DMA
             8/3/23
BULLISH - 41
BEARISH = 7
---------------------------------------------------------------------------------------
Directory     Current       day-1         day-2         day-3         day-4         day-5
----------------------------------------------------------------------------------------
COAL           1             1             1             1             1             1
REGBANKS       .973          .973          .973          .973          .947          .947
BIGBANKS       .857          .857          1             1             1             1
DJI-13         .846          .846          .846          .923          .923          .923
OILGAS         .845          .814          .845          .876          .855          .804
TRANSP         .842          .894          .894          1             .947          .947
EDU            .833          .833          .833          .833          .666          .666
RETAIL         .826          .847          .826          .826          .804          .76
HOMEBLDG       .821          .928          .964          .964          .964          .928
INSURANC       .8            .8            .84           .84           .84           .84
----------------------------------------------------------------------------------------------
GUNS           .785          .714          .857          .857          .785          .857
NIFTY          .772          .75           .863          .84           .886          .863
AUTO           .754          .773          .83           .83           .792          .792
FINANCE        .75           .8            .862          .9            .85           .875
INDEXES        .735          .772          .745          .821          .789          .778
CHINA          .731          .707          .731          .829          .756          .536
INFRA          .709          .709          .838          .903          .806          .838
DOWJONES       .7            .7            .733          .766          .766          .733
SP-100         .7            .733          .766          .8            .822          .8
HIGHPRIC       .696          .735          .783          .787          .809          .783
NASD-100       .693          .712          .772          .792          .821          .762
FIDSTKS        .674          .692          .763          .804          .816          .786
RUS-1000       .674          .723          .784          .809          .798          .771
INDMATER       .666          .736          .833          .861          .833          .777
ETFS           .654          .709          .963          .981          .981          .909
SP500          .651          .712          .755          .784          .798          .775
EAT            .634          .634          .634          .78           .707          .731
ELECTRON       .624          .631          .706          .774          .751          .729
HOSPITAL       .615          .461          .538          .461          .461          .384
JETS           .615          .692          .692          .846          .769          .769
GREEN          .611          .611          .666          .611          .611          .611
SEMI           .608          .597          .739          .782          .739          .728
SOFTWARE       .607          .625          .714          .66           .642          .642
MARIJUAN       .6            .4            .7            .7            .6            .4
CHEM           .581          .674          .79           .813          .813          .767
REIT           .573          .655          .713          .77           .745          .745
COPPER         .571          .571          1             .857          .857          .857
HACKERS        .562          .562          .625          .625          .562          .625
COMPUTER       .55           .7            .7            .8            .8            .8
MILITARY       .538          .5            .576          .576          .615          .615
FOOD           .51           .51           .612          .714          .673          .653
--------------------------------------------------------------------------------------------
BEVERAGE       .5            .571          .571          .714          .928          .714
COMODITY       .5            .5            .631          .763          .71           .684
--------------------------------------------------------------------------------------------
LOWPRICE       .439          .466          .475          .472          .448          .404
GAMING         .421          .473          .684          .736          .578          .631
BIOTECH        .416          .408          .469          .505          .477          .388
UTILITY        .307          .538          .589          .82           .82           .82
SOLAR          .125          0             .25           .375          .125          .187
GOLD           .111          .155          .288          .444          .266          .2
BONDFUND       .091          .471          .632          .758          .735          .609
|
=======================================================================
Thursday - 6:15 - 8/3/2023 - DJI Futures -51 NASDAQ -75 Data Used - 8/2/2023
|
8/2/2023
|
|
|
Jamie Diamon was not happy with Fisk's downgrade of US Treasuries'
rating this week, out
of concern for the size of US debts, Congress'es
many past flirtations
with refusing to honor previous indebtedness
by not raising the debt
ceiling and how wide is the current political chasm
in Congress and in the
country. Diamon expects such announcements to
be "run by"
him for his approval, apparently, especially now given the
Federal Government's
immense borrowing needs. That was the thing
that set off today's
decline. How can all this debt be financed as usual,
by borrowing, without a
big spike up in the yield of the 10-year rates.
Hence, that rate rose
Tuesday further above 4%. This is starting to "put
a squeeze" on
stocks. There were 1616 more down than up on the
NYSE. The only
way NYS dividends can match the Treasuries' yields
will be if the
underlying stocks become cheaper.
The technical damage
done by Tuesday's sell-off was greatest among many
NASDAQ stocks where the
number of new lows overtook the number
of new highs.
Moreover, with the NASDAQ up 40% just this year and the
NASDAQ's IP21 dropping
below its 21-day ma, we are reminded of the
Sell S4 Peerless rule,
when a similar development occurs after a DJI advance
of 15%. Sell S4s
in the DJI are quite reliable. The DJI is not up enough
to generate one.
But the same rule could now be applied to the NASDAQ,
SPY and QQQ.
We had hoped that the
Public would not become bearish so soon and that
their bullishness would
hold the tech stocks up. But they have become sellers,
too, judging from the
weak opening today and the break in the previously
rising Openng Powers.
All in all, the falling
Closing Power and Relative Strenght trends gave
us ample fair warning a
week ago. But with the Public now selling, prices
fell particularly hard
today on the NASDAQ and QQQ.
The Semi-conductors, as a
group, were sold off badly today. This may
be more than simple
profit-taking. Solar panels are a big part of their
business. Now TAN
(shown below) is testing its year's lows and is
the lowest ranked ETF in
Table 2. See if they can hold above their
lows of a few days ago.
The Housing and Oil
Service stocks are sill in rising uptrends. But there
are many new bearish
MINCPs to choose from for hedging purposes. |
|
|
Daily Charts - 8/2/2023
2022 PEERLESS DJI, Signals, Indicators Daily DJI Volume
10-DayUp/Down Vol Stoch-20 CCI RSI Pct of All Stocks above 65-dma
Inverted Traders Index
DJI-IPA DJI-OBV Short-Term Rates
NASDAQ S&P OEX NYSE DJ-15 DJ-20 DJI-30 Old Peerless 2006 version
Tiger Index of Big
Banks Bond Funds Gold Stocks Housing Stocks
Insurance-Stocks
Regional
Banks Russell-1000
Semi Conductors
2006 vers-Peerless is no loner vailable.
Sorry. It is giving an error message and
without the code cannot be fixed.
ETFs: DIA QQQ SPY IWM MDY
TNA Short-Term Rates Ten Year Rates PST (Short Treasuries)
DOLLAR-UUP
ALLSTOCKs
COIN (Bit
Coin ETF)
USO-CrudeOil DBO BLDP FAS GLD HD IBB JETS JNUG KOL NAIL NUGT
NRGU OIH PALL RSX RETL SDS AGQ SLV SOXL TAN TECL TLT TMF TNA
UGA USO China:
YINN
CHAU
Commodities: CANE COCO CORN DBC JJC, NIB CORN, CUT (paper)
MOO, NRGU
SOYB WEAT UUP (Dollar) LIT
(Lithium) PALL
(Palladium)
Stocks
AA AAPL ADBE ALXN AMAT AMGN AMD AMZN ANET AXON AXP
BA BABA BAC BIDU BLDP BSX CAT CDNS CHKP CNX CPB CRM CVX CMG
DE DIS ENPH FB FSLR FTNT GILD GME GOOG GS HD IBM INTU JPM KO KR
LRCX MRK MRNA MOS MSFT NEM NFLX NKE NOC NUE NVDA PANW PG PYPL
QCOM QDEL REGN REV RE SCHW SNOW SO SQUARE TSLA TXN XOM V VRTX
WFC WMT XLE ZM ZOM
Biggest SEMI-Condctors in SOXL: NVDA. AVGO, AMD. INTC TXN MCHP NXPI AMAT ON
HOMEBUILDERS:
NAIL
BZH HOV MHO MTH PHM -
REGIONAL BANKS:
EGBN
FFIC GBCI HMST
Carl Icahn and associates: IEP
MS
JEF
Leveraged Short ETFs:
FAZ - financials, TZA and SRTY- small caps, MZZ - mid caps, TECS -Techs,
SOXS -
semi-conductors LABD
- Biotechs
Bullish MAXCPs http://tigersoftware.com/upping/8-02-2023/Bullish.htm
Bearish MINCPs www.tigersoftware.com/downing/8-02-2023/Bearish.htm |
|


 |
 |
 |
 |
 |
 |
 |
 |
 |
 |
Table 1
Daily Breadth and Volume Statistics
| NYSE |
Latest
Close |
Previous
Close |
Week
Ago |
| Issues
traded |
3,027 |
3,038 |
3,038 |
| Advances |
664 |
996 |
1,846 |
| Declines |
2,280 |
1,934 |
1,056 |
| Unchanged |
83 |
108 |
136 |
| New
highs |
65 |
107 |
113 |
| New
lows |
33 |
17 |
6 |
| Adv.
volume* |
202,248,740 |
260,657,595 |
536,989,753 |
| Decl.
volume* |
737,167,249 |
601,923,441 |
313,669,182 |
| Total
volume* |
945,006,841 |
867,950,936 |
861,900,387 |
| Closing
Arms (TRIN)† |
1.06 |
1.04 |
0.93 |
| Block
trades* |
4,195 |
4,155 |
4,019 |
| Adv.
volume |
918,604,162 |
1,324,897,295 |
2,572,533,224 |
| Decl.
volume |
3,330,669,589 |
2,687,716,405 |
1,361,487,589 |
| Total
volume |
4,270,711,191 |
4,042,375,848 |
3,990,290,094 |
| NASDAQ |
Latest
Close |
Previous
Close |
Week
Ago |
| Issues
traded |
4,536 |
4,576 |
4,563 |
| Advances |
1,226 |
1,652 |
2,720 |
| Declines |
3,137 |
2,752 |
1,663 |
| Unchanged |
173 |
172 |
180 |
| New
highs |
56 |
98 |
122 |
| New
lows |
123 |
93 |
104 |
| Closing
Arms (TRIN)† |
0.93 |
0.77 |
0.90 |
| Block
trades |
37,617 |
29,423 |
27,413 |
| Adv.
volume |
1,615,950,350 |
2,011,923,365 |
2,761,697,526 |
| Decl.
volume |
3,832,820,244 |
2,577,780,057 |
1,527,439,609 |
| Total
volume |
5,481,962,062 |
4,633,772,547 |
4,322,008,130 |
|
Table 2 QUICKSILVER on ETFS - 8/2/2023 ---
Bullish = 4 RETL, SOXL (+412), DBO, OIH (.656)
Bearish = 1 TAN (newly here)
ETF       CLOSE     CHANGE    PIVOT-PT  5-dma AROC   CL-PWR  CANDLE  IP21    ITRS  POWER INDEX
=================================================================================================
DIA       352.74  -3.46      352.77       -35.4%     Bullish  RED   -.068    0        =====
---------------------------------------------------------------------------------------------
COMPQX    13973.45  -310.46  14050.11     -54.1%     -------  RED    .056    .048     .104
---------------------------------------------------------------------------------------------
SPY       450.13  -6.35      452.49       -59%       Bullish  RED    .036    .02      .056
---------------------------------------------------------------------------------------------
QQQ       374.39  -8.4       376.62       -41.1%     -------  RED   -.014    .057     .043
---------------------------------------------------------------------------------------------
MDY       491.22  -5.74      491.9        -68.7%     Bullish  RED    .078    .039     .117
---------------------------------------------------------------------------------------------
IWM       195.11  -2.69      193.92       -34.3%     Bullish  RED    .127    .052     .179
---------------------------------------------------------------------------------------------
FAS       70.39  -1.95       71.19        -262.7%    Bullish  RED    .095    .146     .241
---------------------------------------------------------------------------------------------
RETL      7.96  -.23         7.84         -98.6%     Bullish  ----   .193    .301     .494
---------------------------------------------------------------------------------------------
SOXL      25.28  -3.25       26.46         40.3%     -------  RED    .014    .398     .412
---------------------------------------------------------------------------------------------
TECL      53.43  -4.32       54.9         -176%      -------  RED   -.023    .246     .223
---------------------------------------------------------------------------------------------
IBB       127.36  -.69       127.91       -57.5%     Bearish  RED   -.032   -.076    -.108
---------------------------------------------------------------------------------------------
GLD       179.6  -.86        180.42       -101.8%    Bearish  RED   -.068   -.078    -.146
---------------------------------------------------------------------------------------------
DBO       15.8  -.32         15.77         59.7%     Bullish  RED    .265    .068     .333
---------------------------------------------------------------------------------------------
OIH       339.25  -2.45      332.62        23.9%     Bullish  BLUE   .407    .249     .656
---------------------------------------------------------------------------------------------
CPER     23.76  -.44         23.76        -84.5%     -------  RED    .12   -.019      .101
---------------------------------------------------------------------------------------------
TAN     63.38  -3.68         68.13        -485.4%    -------  RED   -.161   -.151    -.312
---------------------------------------------------------------------------------------------
UUP       28.45   .1         28.21         88.7%     Bearish  ----  -.133   -.049    -.182
---------------------------------------------------------------------------------------------
CORN      22.67  -.26        24.23        -363.1%    Bearish  RED    .026   -.038    -.012
---------------------------------------------------------------------------------------------
WEAT      6.51  -.12         7.06         -427.7%    Bearish  RED   -.044    .005    -.039
---------------------------------------------------------------------------------------------
YINN      39.07  -3.87       38.59        -158.4%    -------  RED    .11   -.034     .076
|
Table 3      RANKING OF KEY DIRECTORIES BASED PCT.OF STOCKS ABOVE 65-DMA
             8/2/23
Bullish = 40
Bearish = 8
---------------------------------------------------------------------------------------
Directory     Current       day-1         day-2         day-3         day-4         day-5
----------------------------------------------------------------------------------------
COAL           1             1             1             1             1             1
REGBANKS       .973          .973          .973          .947          .947          .973
HOMEBLDG       .928          .964          .964          .964          .892          .964
              ======
TRANSP         .894          .894          1             .947          .947          .947
BIGBANKS       .857          1             1             1             1             1
RETAIL         .847          .826          .826          .804          .76           .826
DJI-13         .846          .846          .923          .923          .923          .846
EDU            .833          .833          .833          .666          .666          .666
OILGAS         .814          .845          .876          .855          .804          .886
              =======
FINANCE        .8            .862          .9            .837          .875          .9
INSURANC       .8            .84           .84           .84           .84           .88
----------------------------------------------------------------------------------------------
AUTO           .773          .849          .83           .792          .792          .867
INDEXES        .772          .745          .821          .789          .778          .8
NIFTY          .75           .863          .84           .886          .863          .886
INDMATER       .736          .833          .861          .833          .777          .833
HIGHPRIC       .735          .783          .787          .809          .774          .809
SP-100         .733          .766          .8            .822          .8            .833
RUS-1000       .723          .784          .809          .798          .773          .833
GUNS           .714          .857          .857          .785          .857          .928
NASD-100       .712          .772          .792          .821          .762          .831
SP500          .712          .755          .784          .796          .778          .832
ETFS           .709          .963          .981          .981          .927          .945
INFRA          .709          .838          .903          .806          .838          .903
CHINA          .707          .731          .829          .756          .536          .658
COMPUTER       .7            .7            .8            .8            .8            .75
DOWJONES       .7            .733          .766          .766          .733          .766
FIDSTKS        .692          .763          .804          .816          .786          .816
JETS           .692          .692          .846          .769          .769          .769
CHEM           .674          .79           .813          .813          .767          .79
REIT           .655          .704          .778          .754          .745          .852
EAT            .634          .634          .78           .707          .731          .756
ELECTRON       .631          .706          .774          .751          .714          .744
SOFTWARE       .625          .732          .66           .642          .642          .714
GREEN          .611          .666          .611          .611          .611          .611
SEMI           .597          .739          .782          .739          .728          .771
BEVERAGE       .571          .571          .714          .928          .714          .785
COPPER         .571          1             .857          .857          .857          .857
HACKERS        .562          .625          .625          .562          .562          .625
UTILITY        .538          .589          .82           .82           .82           .871
FOOD           .51           .632          .693          .673          .653          .755
==============================================================================================
COMODITY       .5            .657          .736          .71           .684          .815
MILITARY       .5            .576          .576          .615          .615          .73
==============================================================================================
GAMING         .473          .684          .684          .631          .631          .684
BONDFUND       .471          .62           .758          .747          .609          .735
LOWPRICE       .466          .478          .475          .448          .413          .442
HOSPITAL       .461          .538          .461          .461          .384          .538
BIOTECH        .406          .467          .507          .477          .388          .426
MARIJUAN       .4            .7            .7            .6            .4            .4
GOLD           .155          .288          .444          .266          .177          .511
SOLAR          0             .25           .375          .125          .187          .5
|
====================================================================
Tuesday - 6:31 - 8/2/2023 - DJI Futures -86 NASDAQ -84 Data Used - 8/1/2023
| |
8/1/2023 |
|
| |
The rate on 10-year bonds moving back above 4% spooked not only
bonds,
utilities, banks and regional banks, it sent some disturbance to MSFT,
and even
some tech stocks. The weakness was disguised in the D JI by the 20+
jump in
CAT. As you can sse from Table 1, there were almost 1000 more down
than up on
the NYSE. In addition, our P-Indicator (the 21-day ma of NYSE
Advances
less Declines) has nearly broken its uptrend. This has been a reliable Sell
for the
last year. All this makes me concerned that the DJI has stalled at the
rising
resistance-line shown in the first chart below. With rates rising, due to massive
borrowing
by the Federal Government and seasonality not at all bullish in August
in the
thrid years of the PE -4-yr cycle, it is likely the DJI will now retreat to35000
and test
the support there, Traders should do some selling in the tech sector
where the
Closing Powers are falling and the Relative Stength Lines have broken their
uptrends, |
|
| |
Daily Charts - 8/1/2023
2022 PEERLESS DJI, Signals, Indicators Daily DJI Volume
10-DayUp/Down Vol Stoch-20 CCI RSI Pct of All Stocks above 65-dma
Inverted Traders Index
DJI-IPA DJI-OBV Short-Term Rates
NASDAQ S&P OEX NYSE DJ-15 DJ-20 DJI-30 Old Peerless 2006 version
Tiger Index of Big
Banks Bond Funds Gold Stocks Housing Stocks
Insurance-Stocks
Regional
Banks Russell-1000
Semi Conductors
2006 vers-Peerless is no loner vailable.
Sorry. It is giving an error message and
without the code cannot be fixed.
ETFs: DIA QQQ SPY IWM MDY
TNA Short-Term Rates Ten Year Rates PST (Short Treasuries)
DOLLAR-UUP
ALLSTOCKs
COIN (Bit
Coin ETF)
USO-CrudeOil DBO BLDP FAS GLD HD IBB JETS JNUG KOL NAIL NUGT
NRGU OIH PALL RSX RETL SDS AGQ SLV SOXL TAN TECL TLT TMF TNA
UGA USO China:
YINN
CHAU
Commodities: CANE COCO CORN DBC JJC, NIB CORN, CUT (paper)
MOO, NRGU
SOYB WEAT UUP (Dollar) LIT
(Lithium) PALL
(Palladium)
Stocks
AA AAPL ADBE ALXN AMAT AMGN AMD AMZN ANET AXON AXP
BA BABA BAC BIDU BLDP BSX CAT CDNS CHKP CNX CPB CRM CVX CMG
DE DIS ENPH FB FSLR FTNT GILD GME GOOG GS HD IBM INTU JPM KO KR
LRCX MRK MRNA MOS MSFT NEM NFLX NKE NOC NUE NVDA PANW PG PYPL
QCOM QDEL REGN REV RE SCHW SNOW SO SQUARE TSLA TXN XOM V VRTX
WFC WMT XLE ZM ZOM
Biggest SEMI-Condctors in SOXL: NVDA. AVGO, AMD. INTC TXN MCHP NXPI AMAT ON
HOMEBUILDERS:
NAIL
BZH HOV MHO MTH PHM -
REGIONAL BANKS:
EGBN
FFIC GBCI HMST
Carl Icahn and associates: IEP
MS
JEF
Leveraged Short ETFs:
FAZ - financials, TZA and SRTY- small caps, MZZ - mid caps, TECS -Techs,
SOXS -
semi-conductors LABD
- Biotechs
Bullish MAXCPs http://tigersoftware.com/upping/8-01-2023/Bullish.htm
Bearish MINCPs www.tigersoftware.com/downing/8-01-2023/Bearish.htm |
|
 |
 |
 |
 |
 |
 |
 |
 |
 |
 |
 |
| NYSE |
Latest
Close |
Previous
Close |
Week
Ago |
| Issues
traded |
3,038 |
3,066 |
3,030 |
| Advances |
996 |
2,150 |
1,481 |
| Declines |
1,934 |
807 |
1,420 |
| Unchanged |
108 |
109 |
129 |
| New
highs |
107 |
152 |
123 |
| New
lows |
17 |
8 |
15 |
| Adv.
volume* |
260,657,595 |
811,499,106 |
380,748,648 |
| Decl.
volume* |
601,923,441 |
385,048,529 |
430,739,657 |
| Total
volume* |
867,950,936 |
1,205,629,959 |
819,833,247 |
| Closing
Arms (TRIN)† |
1.04 |
0.95 |
1.24 |
| Block
trades* |
4,155 |
4,466 |
4,059 |
| Adv.
volume |
1,324,897,295 |
3,285,291,336 |
1,721,298,368 |
| Decl.
volume |
2,687,716,405 |
1,166,915,660 |
2,046,476,801 |
| Total
volume |
4,042,375,848 |
4,503,600,183 |
3,812,476,887 |
| NASDAQ |
Latest
Close |
Previous
Close |
Week
Ago |
| Issues
traded |
4,576 |
4,587 |
4,583 |
| Advances |
1,652 |
2,832 |
1,992 |
| Declines |
2,752 |
1,572 |
2,406 |
| Unchanged |
172 |
183 |
185 |
| New
highs |
98 |
142 |
129 |
| New
lows |
93 |
64 |
106 |
| Closing
Arms (TRIN)† |
0.77 |
0.48 |
0.99 |
| Block
trades |
29,423 |
34,952 |
33,543 |
| Adv.
volume |
2,011,923,365 |
3,867,417,391 |
2,041,829,338 |
| Decl.
volume |
2,577,780,057 |
1,021,826,152 |
2,449,602,395 |
| Total
volume |
4,633,772,547 |
4,934,441,750 |
4,513,696,203 |
|
Table 2 QUICKSILVER on ETFS - 8/1/2023 ---
Bullish = 6 FAS, RETL, SOXL (+637), TECL (+.392), DBO, OIH (.651)
Bearish = 0
ETF       CLOSE     CHANGE    PIVOT-PT  5-dma AROC   CL-PWR  CANDLE  IP21    ITRS  POWER INDEX
=================================================================================================
DIA       356.2   .63        355.25        26.5%     Bullish  BLUE  -.015    0       -.015
--------------------------------------------------------------------------------------------
COMPQX    14283.91  -62.11   14127.28      49.1%     -------  BLUE   .091    .066     .157
---------------------------------------------------------------------------------------------
SPY       456.48  -1.31      455.51        11.4%     Bullish  BLUE   .094    .029     .123
---------------------------------------------------------------------------------------------
QQQ       382.79  -.89       377.52        52.8%     Bullish  BLUE   .034    .075     .109
---------------------------------------------------------------------------------------------
MDY       496.96  -1.37      498.04        15.3%     Bullish  BLUE   .099    .037     .136
---------------------------------------------------------------------------------------------
IWM       197.8  -.91        196.46        73.4%     Bullish  BLUE   .125    .056     .181
---------------------------------------------------------------------------------------------
FAS       72.34  -.05        74.19        -25.6%     Bullish  BLUE   .107    .16      .267
---------------------------------------------------------------------------------------------
RETL      8.19  -.1          8.12          255.4%    Bullish  ----   .195    .189     .384
---------------------------------------------------------------------------------------------
SOXL      28.53   .12        25.06         447.1%    Bullish  BLUE   .082    .555     .637
---------------------------------------------------------------------------------------------
TECL      57.75   .29        55.42         .9%       Bullish  BLUE   .049    .343     .392
---------------------------------------------------------------------------------------------
IBB       128.05  -1.26      128.84       -41.1%     Bullish  RED    .007   -.067    -.06
---------------------------------------------------------------------------------------------
GLD       180.46  -1.89      183.3        -53.6%     -------  RED   -.064   -.068    -.132
---------------------------------------------------------------------------------------------
DBO       16.12  -.04        15.61         135.8%    Bullish  BLUE   .292    .083     .375
---------------------------------------------------------------------------------------------
OIH       341.7  -2.04       337.63        43.8%     Bullish  BLUE   .393    .258     .651
---------------------------------------------------------------------------------------------
CPER     24.2  -.62          24.17        -14.4%     Bullish  RED    .18    .003      .183
---------------------------------------------------------------------------------------------
TAN     67.06  -1.48         70.02        -287.6%    -------  ----  -.117   -.112    -.229
---------------------------------------------------------------------------------------------
UUP       28.35   .13        27.95         56.9%     Bearish  ----  -.118   -.06    -.178
---------------------------------------------------------------------------------------------
CORN      22.93  -.16        24.39        -429.5%    Bearish  RED    .033   -.028     .005
---------------------------------------------------------------------------------------------
WEAT      6.63  -.08         7.1          -545.9%    Bearish  ----  -.02    .015      -.005
---------------------------------------------------------------------------------------------
YINN      42.94  -3.43       40.42         489.4%    Bullish  RED    .151    .041     .192
|
Table 3        RANKING OF KEY DIRECTORIES BASED PCT.OF STOCKS ABOVE 65-DMA
               8/1/23
 Bullish = 46
 Bearish = 4
---------------------------------------------------------------------------------------
Directory     Current       day-1         day-2         day-3         day-4         day-5
----------------------------------------------------------------------------------------
BIGBANKS       1             1             1             1             1             1
COAL           1             1             1             1             1             1
COPPER         1             .857          .857          .857          .857          .857
REGBANKS       .973          .973          .947          .947          .973          .947
HOMEBLDG       .964          .964          .964          .892          .964          .964
ETFS           .963          .981          .981          .927          .963          .909
TRANSP         .894          1             .947          .947          .947          1
NIFTY          .863          .84           .886          .863          .886          .84
FINANCE        .862          .9            .837          .862          .912          .887
GUNS           .857          .857          .785          .857          .928          .857
AUTO           .849          .849          .792          .792          .886          .83
DJI-13         .846          .923          .923          .923          .846          .846
OILGAS         .845          .876          .855          .804          .865          .855
INSURANC       .84           .84           .84           .84           .88           .84
INFRA          .838          .903          .806          .838          .903          .935
EDU            .833          .833          .666          .666          .666          .666
INDMATER       .833          .861          .833          .777          .819          .819
RETAIL         .826          .826          .804          .76           .826          .847
CHEM           .79           .813          .813          .767          .79           .79
RUS-1000       .784          .809          .798          .773          .832          .84
HIGHPRIC       .783          .787          .809          .774          .805          .809
NASD-100       .772          .792          .821          .762          .831          .831
SP-100         .766          .8            .822          .8            .833          .844
FIDSTKS        .763          .804          .816          .786          .816          .834
SP500          .755          .784          .796          .775          .83           .851
INDEXES        .745          .821          .789          .778          .8            .821
SEMI           .739          .782          .739          .728          .771          .782
DOWJONES       .733          .766          .766          .733          .766          .766
SOFTWARE       .732          .678          .642          .642          .714          .714
CHINA          .731          .829          .756          .536          .658          .585
ELECTRON       .706          .774          .751          .714          .736          .751
REIT           .704          .77           .762          .754          .844          .844
COMPUTER       .7            .8            .8            .8            .75           .7
MARIJUAN       .7            .7            .6            .4            .4            .3
JETS           .692          .846          .769          .769          .769          .846
GAMING         .684          .684          .578          .684          .684          .684
GREEN          .666          .611          .611          .611          .611          .611
COMODITY       .657          .763          .684          .684          .815          .763
EAT            .634          .78           .707          .731          .756          .707
FOOD           .632          .714          .653          .653          .755          .714
HACKERS        .625          .625          .562          .562          .625          .625
BONDFUND       .62           .747          .747          .62           .747          .747
UTILITY        .589          .82           .82           .82           .871          .897
MILITARY       .576          .576          .615          .615          .73           .692
BEVERAGE       .571          .714          .928          .714          .785          .714
HOSPITAL       .538          .461          .461          .384          .538          .769
----------------------------------------------------------------------------------------------------
LOWPRICE       .478          .478          .451          .413          .436          .434
BIOTECH        .464          .505          .479          .388          .434          .428
GOLD           .288          .444          .266          .177          .511          .488
SOLAR          .25           .375          .125          .187          .5            .687
|
====================================================================
Tuesday - 6:22 - 8/1/2023 - DJI
Futures -86 NASDAQ
-84 Data Used - 7/31/2023
| |
7/31/2023
|
|
| |
Augusts in the third year of the Presidential cycle tend on average to be
unusually flat. So, it will be the market's internal rotation that will give
nimble traders the most opportunities.
Big profits have been made in the tech sector and in home-builders.
But now we are see that many of the techs starting to show falling Closing
Powers. Professionals are selling them to the Public, jusging by the now
rising Opening Powers. The new buyers should be able to hold QQQ,
SOXL, TECL and NVDA up. But for now these groups need to rest
and regain Professional buying.
In their place are the Bullish MAXCP special situations and oil stocks
and drillers, as a group, particularly OIH. See below its high IP21,
rising Closing Power and Relative strength.
The prospects of an economic recovery when the FED stops raising rates
constitutes the basis of the attraction here. But if the oil stocks' recovery
becomes too strong or too exckusive, that will create the problem of
inflation all over again.
So, buy some of the beaten down oil stocks and OIH, but not for a
long term investments. Watch to see if IWM can make a
breakout.
This would show that smaller companies' stocks are finally starting
to join the party.
Unless you are very nimble, hold onto the tech and housing leaders. Their
upwards momentum will sustain them. Note how high the ITRS readings
still are for SOXL and T ECL in Table 2. |
|
| |
Daily Charts - 7/31/2023
2022 PEERLESS DJI, Signals, Indicators Daily DJI Volume
10-DayUp/Down Vol Stoch-20 CCI RSI Pct of All Stocks above 65-dma
Inverted Traders Index
DJI-IPA DJI-OBV Short-Term Rates
NASDAQ S&P OEX NYSE DJ-15 DJ-20 DJI-30 Old Peerless 2006 version
Tiger Index of Big
Banks Bond Funds Gold Stocks Housing Stocks
Insurance-Stocks
Regional
Banks Russell-1000
Semi Conductors
2006 vers-Peerless is no loner vailable.
Sorry. It is giving an error message and
without the code cannot be fixed.
ETFs: DIA QQQ SPY IWM MDY
TNA Short-Term Rates Ten Year Rates PST (Short Treasuries)
DOLLAR-UUP
ALLSTOCKs
COIN (Bit
Coin ETF)
USO-CrudeOil DBO BLDP FAS GLD HD IBB JETS JNUG KOL NAIL NUGT
NRGU OIH PALL RSX RETL SDS AGQ SLV SOXL TAN TECL TLT TMF TNA
UGA USO China:
YINN
CHAU
Commodities: CANE COCO CORN DBC JJC, NIB CORN, CUT (paper)
MOO, NRGU
SOYB WEAT UUP (Dollar) LIT
(Lithium) PALL
(Palladium)
Stocks
AA AAPL ADBE ALXN AMAT AMGN AMD AMZN ANET AXON AXP
BA BABA BAC BIDU BLDP BSX CAT CDNS CHKP CNX CPB CRM CVX CMG
DE DIS ENPH FB FSLR FTNT GILD GME GOOG GS HD IBM INTU JPM KO KR
LRCX MRK MRNA MOS MSFT NEM NFLX NKE NOC NUE NVDA PANW PG PYPL
QCOM QDEL REGN REV RE SCHW SNOW SO SQUARE TSLA TXN XOM V VRTX
WFC WMT XLE ZM ZOM
Biggest SEMI-Condctors in SOXL: NVDA. AVGO, AMD. INTC TXN MCHP NXPI AMAT ON
HOMEBUILDERS:
NAIL
BZH HOV MHO MTH PHM -
REGIONAL BANKS:
EGBN
FFIC GBCI HMST
Carl Icahn and associates: IEP
MS
JEF
Leveraged Short ETFs:
FAZ - financials, TZA and SRTY- small caps, MZZ - mid caps, TECS -Techs,
SOXS -
semi-conductors LABD
- Biotechs
Bullish MAXCPs http://tigersoftware.com/upping/7-31-2023/Bullish.htm
Bearish MINCPs
www.tigersoftware.com/downing/7-31-2023/Bearish.htm |
|
 |
 |
 |
 |
 |
 |
Table 1 - Daily Breadth and
Volume Statistics
| NYSE |
Latest
Close |
Previous
Close |
Week
Ago |
| Issues
traded |
3,066 |
3,048 |
3,048 |
| Advances |
2,150 |
2,106 |
1,810 |
| Declines |
807 |
863 |
1,126 |
| Unchanged |
109 |
79 |
112 |
| New
highs |
152 |
119 |
103 |
| New
lows |
8 |
12 |
10 |
| Adv.
volume* |
811,499,106 |
611,914,522 |
530,034,168 |
| Decl.
volume* |
385,048,529 |
246,929,255 |
242,020,448 |
| Total
volume* |
1,205,629,959 |
861,347,464 |
786,939,133 |
| Closing
Arms (TRIN)† |
0.95 |
0.88 |
0.67 |
| Block
trades* |
4,466 |
4,238 |
4,162 |
| Adv.
volume |
3,285,291,336 |
2,915,668,844 |
2,660,645,640 |
| Decl.
volume |
1,166,915,660 |
1,053,439,202 |
1,104,061,182 |
| Total
volume |
4,503,600,183 |
3,981,013,886 |
3,856,259,477 |
| NASDAQ |
Latest
Close |
Previous
Close |
Week
Ago |
| Issues
traded |
4,587 |
4,541 |
4,622 |
| Advances |
2,832 |
3,217 |
2,127 |
| Declines |
1,572 |
1,146 |
2,313 |
| Unchanged |
183 |
178 |
182 |
| New
highs |
142 |
125 |
93 |
| New
lows |
64 |
85 |
97 |
| Closing
Arms (TRIN)† |
0.48 |
0.61 |
1.09 |
| Block
trades |
34,952 |
27,079 |
25,275 |
| Adv.
volume |
3,867,417,391 |
3,493,608,589 |
1,846,531,725 |
| Decl.
volume |
1,021,826,152 |
757,311,064 |
2,192,032,110 |
| Total
volume |
4,934,441,750 |
4,453,525,521 |
4,083,076,465 |
|
Table 2 QUICKSILVER on ETFS - 7/28/2023 ---
Bullish =8 FAS, RETL, SOXL (+765), TECL (+.481), DBO, OIH (.656),CPER, YINN
Bearish = 0
ETF       CLOSE     CHANGE    PIVOT-PT  5-dma AROC   CL-PWR  CANDLE  IP21    ITRS  POWER INDEX
=================================================================================================
DIA       355.57   1.09      354.32        21.2%     Bullish  BLUE  -.019    0       -.019
---------------------------------------------------------------------------------------------
COMPQX    14346.02   29.36   14144.56      101.5%    Bullish  BLUE   .087    .085     .172
---------------------------------------------------------------------------------------------
SPY       457.79   .87       455.44        39.5%     Bullish  BLUE   .11    .04       .15
---------------------------------------------------------------------------------------------
QQQ       383.68   .2        378.78        98.4%     Bullish  RED    .034    .096     .13
---------------------------------------------------------------------------------------------
MDY       498.33   2.44      495.44        37.9%     Bullish  BLUE   .088    .047     .135
---------------------------------------------------------------------------------------------
IWM       198.71   2.28      194.92        96.5%     Bullish  BLUE   .052    .066     .118
---------------------------------------------------------------------------------------------
FAS       72.39   .87        72.71        -132.6%    Bullish  BLUE   .084    .183     .267
---------------------------------------------------------------------------------------------
RETL      8.29   .18         7.78          258%      Bullish  BLUE   .208    .211     .419
---------------------------------------------------------------------------------------------
SOXL      28.41   .26        26.13         671.4%    Bullish  RED    .067    .698     .765
---------------------------------------------------------------------------------------------
TECL      57.46   .36        57.74         138.8%    Bullish  BLUE   .062    .419     .481
---------------------------------------------------------------------------------------------
IBB       129.31  -.55       129.11       -4.3%      Bullish  RED    .019   -.063    -.044
---------------------------------------------------------------------------------------------
GLD       182.35   .49       182.41        26.1%     -------  RED    .003   -.073    -.07
---------------------------------------------------------------------------------------------
DBO       16.16   .22        15.69         174.9%    Bullish  BLUE   .262    .074     .336
---------------------------------------------------------------------------------------------
OIH       343.74   6.24      338.74        107.5%    Bullish  BLUE   .373    .282     .655
---------------------------------------------------------------------------------------------
CPER     24.82   .49         24.27         220.3%    Bullish  BLUE   .314    .014     .328
---------------------------------------------------------------------------------------------
TAN     68.54   .28          71.04        -170.8%    Bullish  BLUE  -.043   -.106    -.149
---------------------------------------------------------------------------------------------
UUP       28.22   .05        28.03         28.5%     Bearish  ----  -.136   -.06     -.196
---------------------------------------------------------------------------------------------
CORN      23.09  -.69        25           -424.2%    Bearish  RED    .007   -.023    -.016
---------------------------------------------------------------------------------------------
WEAT      6.71  -.28         7.4          -466.2%    Bearish  RED   -.067    .004    -.063
---------------------------------------------------------------------------------------------
YINN      46.37   1.66       38.85         1111%     Bullish  BLUE   .197    .079     .276
|
 Table 3      RANKING OF KEY DIRECTORIES BASED PCT.OF STOCKS ABOVE 65-DMA
              7/31/23
 Bullish = 46
 Bearish = 4
---------------------------------------------------------------------------------------
Directory     Current       day-1         day-2         day-3         day-4         day-5
----------------------------------------------------------------------------------------
BIGBANKS       1             1             1             1             1             1
COAL           1             1             1             1             1             1
TRANSP         1             .947          .947          .947          1             1
ETFS           .981          .981          .927          .963          .927          .89
REGBANKS       .973          .947          .947          .973          .947          .973
HOMEBLDG       .964          .964          .892          .964          .964          .964
DJI-13         .923          .923          .923          .846          .846          .923
INFRA          .903          .806          .838          .903          .935          .935
FINANCE        .9            .837          .862          .9            .887          .9
OILGAS         .876          .855          .804          .865          .855          .876
INDMATER       .861          .833          .777          .819          .819          .805
COPPER         .857          .857          .857          .857          .857          .857
GUNS           .857          .785          .857          .928          .857          .857
AUTO           .849          .811          .792          .886          .83           .849
JETS           .846          .769          .769          .769          .846          .846
INSURANC       .84           .84           .84           .88           .84           .88
NIFTY          .84           .886          .863          .886          .84           .863
EDU            .833          .666          .666          .666          .666          .666
CHINA          .829          .756          .536          .658          .585          .487
RETAIL         .826          .804          .76           .826          .847          .847
INDEXES        .821          .789          .778          .8            .81           .805
UTILITY        .82           .82           .82           .871          .871          .897
CHEM           .813          .813          .767          .79           .79           .744
RUS-1000       .809          .798          .773          .832          .84           .843
FIDSTKS        .804          .816          .786          .816          .834          .852
COMPUTER       .8            .8            .8            .75           .7            .7
SP-100         .8            .822          .8            .833          .844          .844
==============================================================================================
NASD-100       .792          .821          .762          .831          .831          .841
HIGHPRIC       .787          .809          .774          .805          .809          .822
SP500          .784          .796          .775          .828          .851          .849
SEMI           .782          .739          .728          .771          .782          .793
EAT            .78           .707          .731          .756          .707          .756
ELECTRON       .774          .751          .714          .736          .751          .766
REIT           .77           .754          .762          .852          .836          .86
DOWJONES       .766          .766          .733          .766          .766          .766
               =====
COMODITY       .763          .71           .657          .815          .763          .71
BONDFUND       .747          .735          .62           .758          .758          .77
BEVERAGE       .714          .928          .714          .785          .714          .785
FOOD           .714          .673          .632          .755          .693          .653
MARIJUAN       .7            .6            .4            .4            .3            .4
GAMING         .684          .578          .631          .736          .684          .684
SOFTWARE       .678          .66           .642          .714          .732          .714
HACKERS        .625          .562          .562          .625          .625          .625
GREEN          .611          .611          .611          .611          .611          .666
MILITARY       .576          .615          .615          .73           .692          .807
BIOTECH        .502          .477          .39           .434          .426          .461
=================================================================================================
LOWPRICE       .478          .454          .416          .436          .434          .425
HOSPITAL       .461          .461          .384          .538          .769          .692
GOLD           .444          .266          .177          .511          .488          .333
SOLAR          .375          .125          .187          .5            .687          .625
|
=================================================================================
Monday - 6:15 - 7/31/2023 - DJI Futures +63 NASDAQ + 47 Data Used - 7/28/2023
| |
7/28/2023
|
|
| |
Nightly Comments
The DJI's big base and breakout B10 are sending the DJI back up to
its old highs near 37000. The Closing Powers are faltering for some
big techs like AAPL and MSFT, as well as for QQQ. But both
Opening and Closing Power are rising for DIA. SOXL is approaching
its recent peak. We will have to wait and see if its rising Opening Power
can take it to new highs. Within the Semi-conductor group the rally has
become far less in unison.
Group strength is very important, of course. The top groups in Table 3
are always our favorites. When the whole group is so strong, as with
housing now, there is much less of a chance for a quick collapse. But we
still have to watch their leaders for a false blow-off or buying climax. BZH
shown below would be such a case if it suddenly showed three straight days of
heavy Professional selling. This is best seen in three straight red candle-stick
days. Look at the chart of SAGE below. See how SAGE quickly went from
making new highs to making new lows. First, Professionals took it up. Then
they became heavy sellers all the way down. This is why we must always
watch for Closing Power and Relative Strength trend-breaks if we buy the
strongest groups. If big heavy red Distribution is present on a price support
failure, it becomes an ideal short sale. |
|
| |
Daily Charts - 7/28/2023
2022 PEERLESS DJI, Signals, Indicators Daily DJI Volume
10-DayUp/Down Vol Stoch-20 CCI RSI Pct of All Stocks above 65-dma
Inverted Traders Index
DJI-IPA DJI-OBV Short-Term Rates
NASDAQ S&P OEX NYSE DJ-15 DJ-20 DJI-30 Old Peerless 2006 version
Tiger Index of Big
Banks Bond Funds Gold Stocks Housing Stocks
Insurance-Stocks
Regional
Banks Russell-1000
Semi Conductors
2006 vers-Peerless is no loner vailable.
Sorry. It is giving an error message and
without the code cannot be fixed.
ETFs: DIA QQQ SPY IWM MDY
TNA Short-Term Rates Ten Year Rates PST (Short Treasuries)
DOLLAR-UUP
ALLSTOCKs
COIN (Bit
Coin ETF)
USO-CrudeOil DBO BLDP FAS GLD HD IBB JETS JNUG KOL NAIL NUGT
NRGU OIH PALL RSX RETL SDS AGQ SLV SOXL TAN TECL TLT TMF TNA
UGA USO China:
YINN
CHAU
Commodities: CANE COCO CORN DBC JJC, NIB CORN, CUT (paper)
MOO, NRGU
SOYB WEAT UUP (Dollar) LIT
(Lithium) PALL
(Palladium)
Stocks
AA AAPL ADBE ALXN AMAT AMGN AMD AMZN ANET AXON AXP
BA BABA BAC BIDU BLDP BSX CAT CDNS CHKP CNX CPB CRM CVX CMG
DE DIS ENPH FB FSLR FTNT GILD GME GOOG GS HD IBM INTU JPM KO KR
LRCX MRK MRNA MOS MSFT NEM NFLX NKE NOC NUE NVDA PANW PG PYPL
QCOM QDEL REGN REV RE SCHW SNOW SO SQUARE TSLA TXN XOM V VRTX
WFC WMT XLE ZM ZOM
Biggest SEMI-Condctors in SOXL: NVDA. AVGO, AMD. INTC TXN MCHP NXPI AMAT ON
HOMEBUILDERS:
NAIL
BZH HOV MHO MTH PHM -
REGIONAL BANKS:
EGBN
FFIC GBCI HMST
Carl Icahn and associates: IEP
MS
JEF
Leveraged Short ETFs:
FAZ - financials, TZA and SRTY- small caps, MZZ - mid caps, TECS -Techs,
SOXS -
semi-conductors LABD
- Biotechs
Bullish MAXCPs http://tigersoftware.com/upping/7-28-2023/Bullish.htm
Bearish MINCPs
www.tigersoftware.com/downing/7-28-2023/Bearish.htm |
|
 |
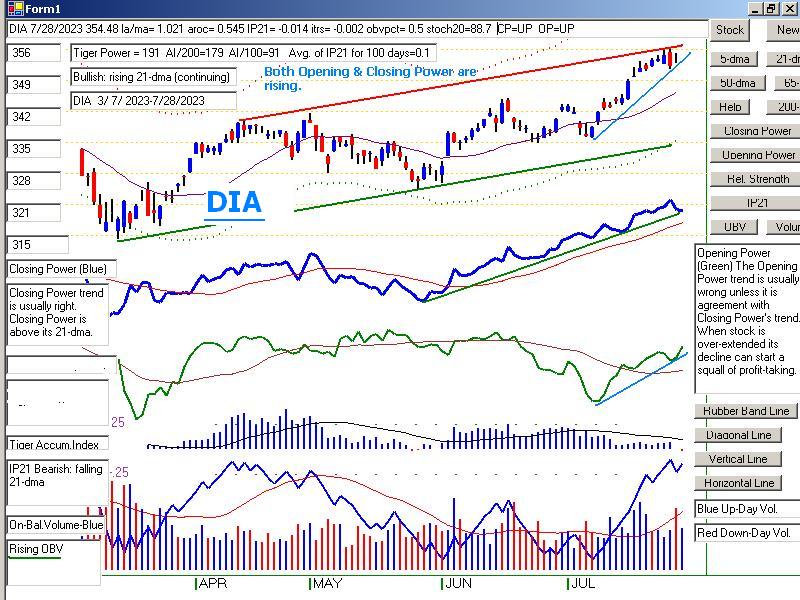 |
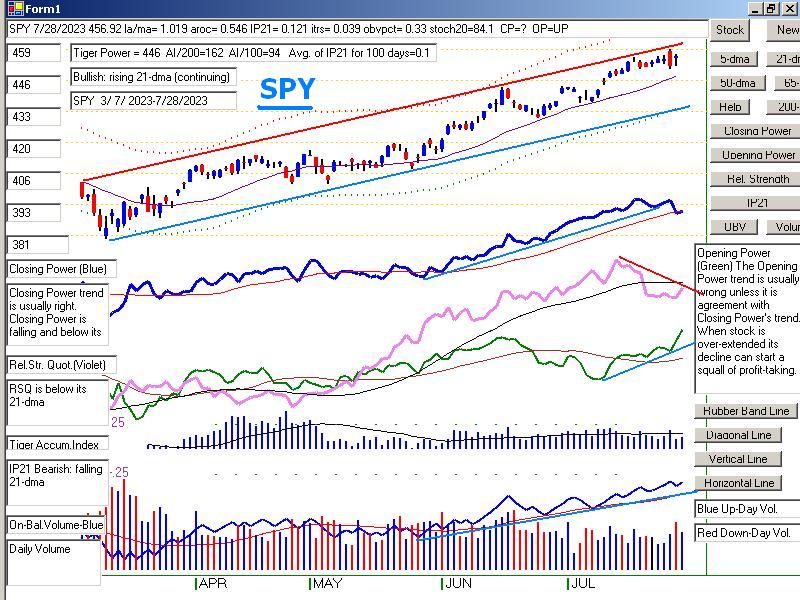 |
 |
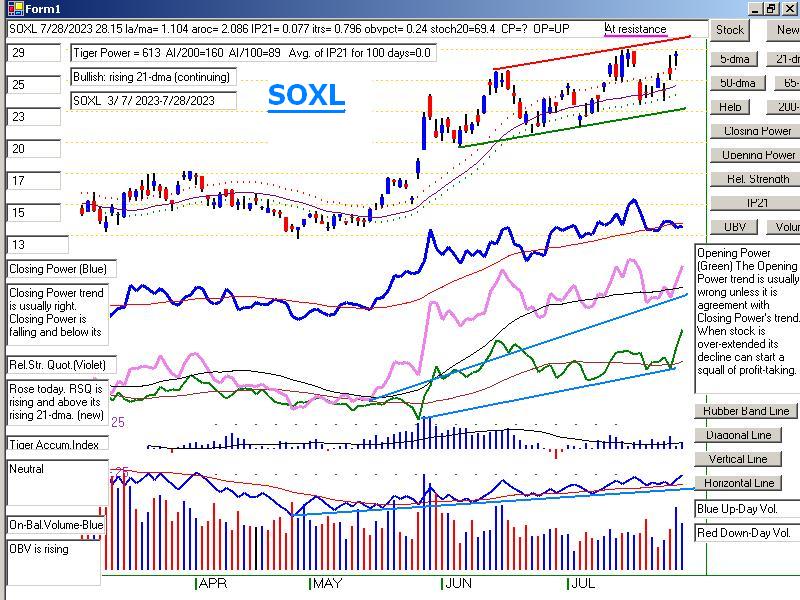 |
 |
 |
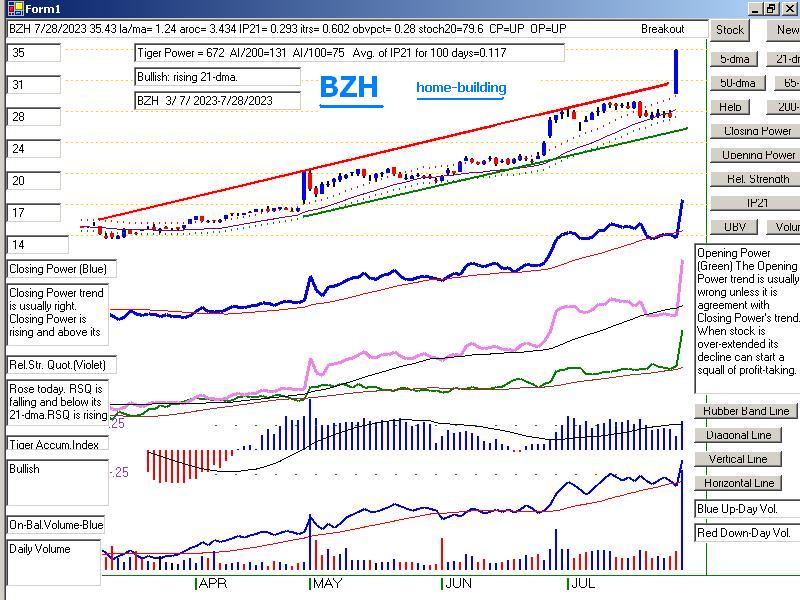 |
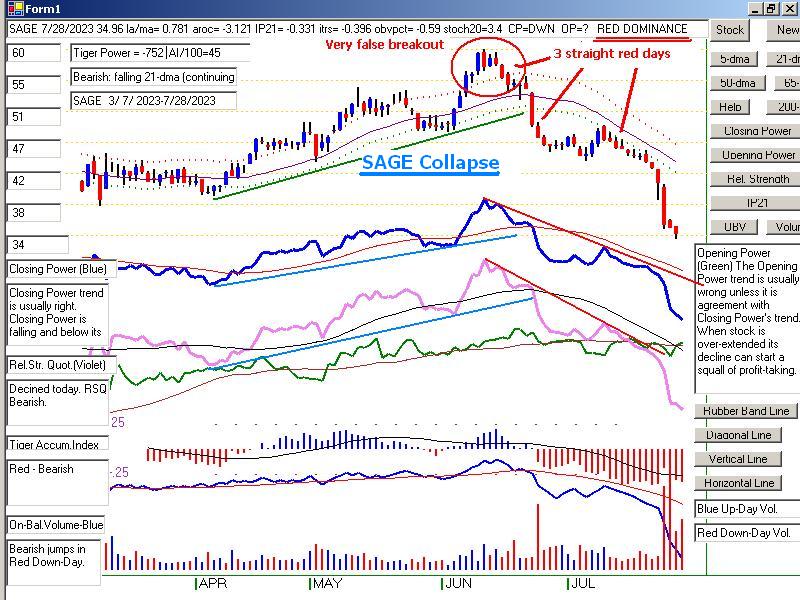 |
Table 2 QUICKSILVER on ETFS - 7/28/2023 ---
Bullish =6 (+0 change) FAS, RETL, SOXL (+874), TECL (+.525), DBO, OIH (.666)
Bearish = 0
ETF       CLOSE     CHANGE    PIVOT-PT  5-dma AROC   CL-PWR  CANDLE  IP21    ITRS  POWER INDEX
==================================================================================================
DIA       354.48   1.71      354.07        33.1%     Bullish  RED   -.014    0       -.014
---------------------------------------------------------------------------------------------
COMPQX    14316.66   266.55  14058.87      100.8%    Bullish  BLUE   .089    .087     .176
---------------------------------------------------------------------------------------------
SPY       456.92   4.43      454.2         52.2%     Bullish  BLUE   .122    .041     .163
---------------------------------------------------------------------------------------------
QQQ       383.48   6.86      376.23        104.1%    Bullish  BLUE   .042    .099     .141
---------------------------------------------------------------------------------------------
MDY       495.89   3.99      494.58        20.7%     Bullish  RED    .103    .05      .153
---------------------------------------------------------------------------------------------
IWM       196.43   2.51      194.94        50.5%     Bullish  BLUE   .039    .067     .106
---------------------------------------------------------------------------------------------
FAS       71.52   .33        74.32        -44.6%     Bullish  RED    .125    .233     .358
---------------------------------------------------------------------------------------------
RETL      8.11   .27         7.88          235%      Bullish  BLUE   .158    .276     .434
---------------------------------------------------------------------------------------------
SOXL      28.15   1.69       24.9          633.5%    Bullish  BLUE   .077    .797     .874
---------------------------------------------------------------------------------------------
TECL      57.1   2.2         55.9          138.6%    Bullish  BLUE   .068    .457     .525
---------------------------------------------------------------------------------------------
IBB       129.86   1.95      129.42       -62.2%     Bullish  BLUE   .034   -.067    -.033
---------------------------------------------------------------------------------------------
GLD       181.86   1.44      181.4        -8.8%      -------  BLUE   .074   -.089    -.015
---------------------------------------------------------------------------------------------
DBO       15.94   .17        15.61         218.1%    Bullish  BLUE   .231    .085     .316
---------------------------------------------------------------------------------------------
OIH       337.5   4.88       336.5         126%      Bullish  BLUE   .384    .282     .666
---------------------------------------------------------------------------------------------
CPER     24.33   .57         23.76         161.1%    Bullish  BLUE   .184    .008     .192
---------------------------------------------------------------------------------------------
TAN     68.26   .13          70.92        -205.7%    Bullish  ----  -.065   -.111    -.176
---------------------------------------------------------------------------------------------
UUP       28.17  -.04        28.06         37.4%     Bearish  ----  -.142   -.07     -.212
---------------------------------------------------------------------------------------------
CORN      23.78  -.45        25.17        -36.7%     Bearish  RED   -.014   -.021    -.035
---------------------------------------------------------------------------------------------
WEAT      6.99  -.07         7.38          76.8%     Bearish  BLUE  -.034    .004    -.03
---------------------------------------------------------------------------------------------
YINN      44.71   6.12       37.48         1260.2%   Bullish  BLUE   .158   -.008     .15
|
 Table 3      RANKING OF KEY DIRECTORIES BASED PCT.OF STOCKS ABOVE 65-DMA
              7/28/23
 Bullish = 45
 Bearish = 5
---------------------------------------------------------------------------------------
Directory     Current       day-1         day-2         day-3         day-4         day-5
----------------------------------------------------------------------------------------
BIGBANKS       1             1             1             1             1             1
COAL           1             1             1             1             1             1
ETFS           .981          .927          .963          .927          .909          .818
HOMEBLDG       .964          .892          .964          .964          .964          .964
REGBANKS       .947          .947          .973          .947          .973          .947
TRANSP         .947          .947          .947          1             1             1
BEVERAGE       .928          .714          .785          .714          .785          .785
DJI-13         .923          .923          .846          .846          .923          .923
NIFTY          .886          .863          .886          .84           .863          .863
COPPER         .857          .857          .857          .857          .857          .857
OILGAS         .855          .804          .865          .855          .876          .835
INSURANC       .84           .84           .88           .84           .88           .8
FINANCE        .837          .862          .9            .875          .9            .875
INDMATER       .833          .777          .819          .819          .805          .791
SP-100         .822          .8            .833          .844          .844          .844
NASD-100       .821          .762          .831          .831          .841          .841
UTILITY        .82           .82           .871          .871          .897          .897
FIDSTKS        .816          .786          .816          .834          .852          .857
CHEM           .813          .767          .79           .79           .744          .79
AUTO           .811          .811          .886          .83           .849          .83
HIGHPRIC       .809          .774          .805          .809          .822          .831
INFRA          .806          .838          .903          .935          .935          .838
RETAIL         .804          .76           .826          .847          .847          .76
COMPUTER       .8            .8            .75           .7            .7            .75
------------------------------------------------------------------------------------------------
RUS-1000       .798          .773          .832          .84           .842          .838
SP500          .796          .775          .828          .849          .849          .841
INDEXES        .789          .778          .8            .81           .805          .816
GUNS           .785          .857          .928          .857          .857          .785
JETS           .769          .769          .769          .846          .846          .846
DOWJONES       .766          .733          .766          .766          .766          .8
CHINA          .756          .536          .658          .585          .487          .341
REIT           .754          .754          .86           .844          .852          .852
ELECTRON       .751          .714          .736          .751          .759          .789
SEMI           .739          .728          .771          .782          .793          .836
BONDFUND       .735          .609          .758          .77           .781          .758
COMODITY       .725          .7            .8            .775          .7            .725
EAT            .707          .731          .756          .707          .756          .756
FOOD           .673          .653          .734          .693          .632          .653
EDU            .666          .666          .666          .666          .666          .666
SOFTWARE       .66           .66           .714          .732          .714          .767
MILITARY       .615          .615          .73           .692          .769          .73
GREEN          .611          .611          .611          .611          .666          .666
MARIJUAN       .6            .4            .4            .3            .4            .4
GAMING         .578          .631          .684          .736          .684          .684
HACKERS        .562          .562          .625          .625          .625          .562
============================================================================================
BIOTECH        .474          .388          .436          .426          .454          .502
HOSPITAL       .461          .384          .538          .769          .692          .769
LOWPRICE       .454          .419          .439          .434          .425          .428
GOLD           .266          .177          .511          .488          .333          .355
SOLAR          .125          .187          .5            .687          .625          .687
|
====================================================================================
Friday - 6:15 - 7/27/2023 - DJI
Futures +151 NASDAQ
+ 161 Data Used - 7/27/2023
| |
7/27/2023
|
|
| |
Market Comments
The afternoon sell-off was like a Summer squall briefly making "picnickers"
run for cover. It was caused by 10-year rates rising above 4% and the FED
discussing their plan to increase reserve requirments. Judging just by the strong
opening today, these events will not prevent the B10 run to 37000. But technical
damage was done. Look at the tech EFTs below and stocks like MSFT, NVDA
and AAPL.
Professionals have turned quite cautious, but the Public, as measured by our
Opening Power. has turned bullish. Watch to see whether Professionals chose
to sell on strength or rejoin the bullish picnic. the DJI may need to pause.
But its bullish pattern still governs my view of the market.
The
threat of an increase in bank reserve requirements is real, but judging from the
one
case where it clearly had a bearish impact, 1937 and the 45% DJI decline
that
followed nine months later, the increase will not have much immediate effect
on
the market. And a lot more technical weakness, especially by the A/D Line
will
be needed.
1937 is a
fascinating year to study. It shows how wrong policy-makers can be.
And if they
all make mistakes, the consequences will be dire. I will post my
1937 Study
this weekend.
For
now, traders must give the various ETFs a chance to rally back up to their
recent highs. There some profit-taking would seem appropriate. We will need
to
see Professionals resume their buying by seeing a strong close Friday
and a
follow-through advance on Monday./ |
|
| |
Daily Charts - 7/27/2023
2022 PEERLESS DJI, Signals, Indicators Daily DJI Volume
10-DayUp/Down Vol Stoch-20 CCI RSI Pct of All Stocks above 65-dma
Inverted Traders Index
DJI-IPA DJI-OBV Short-Term Rates
NASDAQ S&P OEX NYSE DJ-15 DJ-20 DJI-30 Old Peerless 2006 version
Tiger Index of Big
Banks Bond Funds Gold Stocks Housing Stocks
Insurance-Stocks
Regional
Banks Russell-1000
Semi Conductors
2006 vers-Peerless is no loner vailable.
Sorry. It is giving an error message and
without the code cannot be fixed.
ETFs: DIA QQQ SPY IWM MDY
TNA Short-Term Rates Ten Year Rates PST (Short Treasuries)
DOLLAR-UUP
ALLSTOCKs
COIN (Bit
Coin ETF)
USO-CrudeOil DBO BLDP FAS GLD HD IBB JETS JNUG KOL NAIL NUGT
NRGU OIH PALL RSX RETL SDS AGQ SLV SOXL TAN TECL TLT TMF TNA
UGA USO China:
YINN
CHAU
Commodities: CANE COCO CORN DBC JJC, NIB CORN, CUT (paper)
MOO, NRGU
SOYB WEAT UUP (Dollar) LIT
(Lithium) PALL
(Palladium)
Stocks
AA AAPL ADBE ALXN AMAT AMGN AMD AMZN ANET AXON AXP
BA BABA BAC BIDU BLDP BSX CAT CDNS CHKP CNX CPB CRM CVX CMG
DE DIS ENPH FB FSLR FTNT GILD GME GOOG GS HD IBM INTU JPM KO KR
LRCX MRK MRNA MOS MSFT NEM NFLX NKE NOC NUE NVDA PANW PG PYPL
QCOM QDEL REGN REV RE SCHW SNOW SO SQUARE TSLA TXN XOM V VRTX
WFC WMT XLE ZM ZOM
Biggest SEMI-Condctors in SOXL: NVDA. AVGO, AMD. INTC TXN MCHP NXPI AMAT ON
HOMEBUILDERS:
NAIL
BZH HOV MHO MTH PHM -
REGIONAL BANKS:
EGBN
FFIC GBCI HMST
Carl Icahn and associates: IEP
MS
JEF
Leveraged Short ETFs:
FAZ - financials, TZA and SRTY- small caps, MZZ - mid caps, TECS -Techs,
SOXS -
semi-conductors LABD
- Biotechs
Bullish MAXCPs http://tigersoftware.com/upping/7-27-2023/Bullish.htm
Bearish MINCPs www.tigersoftware.com/downing/7-27-2023/Bearish.htm |
|
 |
 |
 |
 |
 |
 |
 |
 |
| |
 |
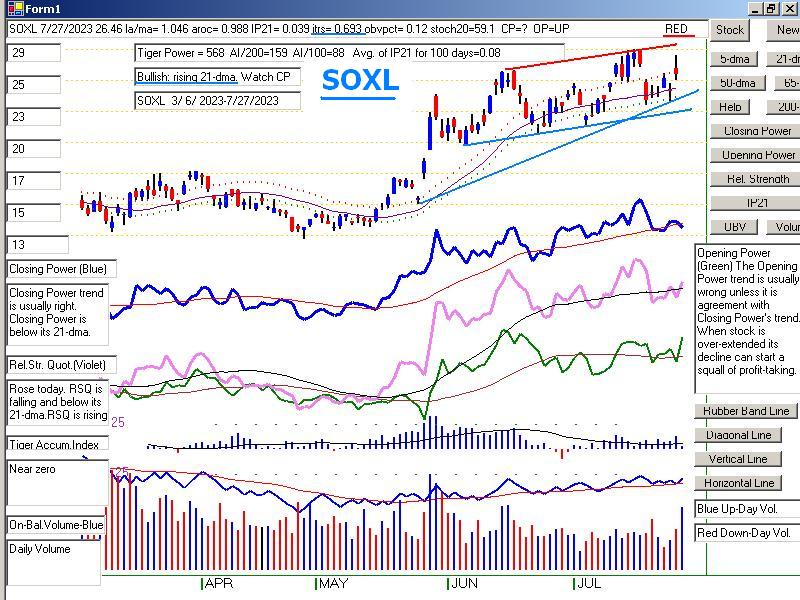 |
| NYSE |
Latest
Close |
Previous
Close |
Week
Ago |
| Issues
traded |
3,049 |
3,038 |
3,032 |
| Advances |
713 |
1,846 |
1,231 |
| Declines |
2,251 |
1,056 |
1,694 |
| Unchanged |
85 |
136 |
107 |
| New
highs |
151 |
113 |
101 |
| New
lows |
17 |
6 |
10 |
| Adv.
volume* |
239,265,379 |
536,989,753 |
374,018,282 |
| Decl.
volume* |
718,921,397 |
313,669,182 |
434,467,987 |
| Total
volume* |
965,098,244 |
861,900,387 |
818,780,646 |
| Closing
Arms (TRIN)† |
0.77 |
0.93 |
0.94 |
| Block
trades* |
4,314 |
4,019 |
3,983 |
| Adv.
volume |
1,312,462,117 |
2,572,533,224 |
1,613,881,444 |
| Decl.
volume |
3,204,829,753 |
1,361,487,589 |
2,077,935,040 |
| Total
volume |
4,553,214,364 |
3,990,290,094 |
3,761,773,015 |
| NASDAQ |
Latest
Close |
Previous
Close |
Week
Ago |
| Issues
traded |
4,559 |
4,563 |
4,555 |
| Advances |
1,250 |
2,720 |
1,521 |
| Declines |
3,145 |
1,663 |
2,863 |
| Unchanged |
164 |
180 |
171 |
| New
highs |
171 |
122 |
87 |
| New
lows |
108 |
104 |
74 |
| Closing
Arms (TRIN)† |
0.86 |
0.90 |
1.24 |
| Block
trades |
32,746 |
27,413 |
33,699 |
| Adv.
volume |
1,608,908,265 |
2,761,697,526 |
1,525,825,256 |
| Decl.
volume |
3,464,201,561 |
1,527,439,609 |
3,562,663,475 |
| Total
volume |
5,115,842,094 |
4,322,008,130 |
5,128,028,439 |
|
Table 2 QUICKSILVER on ETFS - 7/27/2023 ---
Bullish =6 (+0 change) FAS, RETL, SOXL (+734), TECL (+.480), DBO, OIH (.614)
Bearish = 0
ETF       CLOSE     CHANGE    PIVOT-PT  5-dma AROC   CL-PWR  CANDLE  IP21    ITRS  POWER INDEX
==================================================================================================
DIA       352.77  -2.48      352.14        4.8%      Bullish  RED    .007    0        .007
---------------------------------------------------------------------------------------------
COMPQX    14050.11  -77.17   14032.81     -4.7%      Bullish  RED    .067    .079     .146
---------------------------------------------------------------------------------------------
SPY       452.49  -3.02      452.18        3.4%      Bullish  RED    .103    .039     .142
---------------------------------------------------------------------------------------------
QQQ       376.62  -.9        375.63       -1.9%      Bullish  RED    .019    .096     .115
---------------------------------------------------------------------------------------------
MDY       491.9  -6.14       493.84       -30.1%     Bullish  RED    .147    .041     .188
---------------------------------------------------------------------------------------------
IWM       193.92  -2.54      194.46       -29.7%     Bullish  RED    .064    .052     .116
---------------------------------------------------------------------------------------------
FAS       71.19  -3          72.17        -118.7%    Bullish  RED    .151    .206     .357
---------------------------------------------------------------------------------------------
RETL      7.84  -.28         7.74         -88.6%     Bullish  RED    .162    .149     .311
---------------------------------------------------------------------------------------------
SOXL      26.46   1.4        24.92         433%      Bullish  RED    .04    .694      .734
---------------------------------------------------------------------------------------------
TECL      54.9  -.52         55.55        -71.3%     Bullish  RED    .06    .42       .48
---------------------------------------------------------------------------------------------
IBB       127.91  -.93       131.47       -90.5%     Bullish  RED    .024   -.086    -.062
---------------------------------------------------------------------------------------------
GLD       180.42  -2.88      182.18       -63.6%     -------  RED    .075   -.093    -.018
---------------------------------------------------------------------------------------------
DBO       15.77   .16        15.26         226.6%    -------  BLUE   .239    .08      .319
---------------------------------------------------------------------------------------------
OIH       332.62  -5.01      329.06        52.7%     Bullish  RED    .371    .243     .614
---------------------------------------------------------------------------------------------
CPER     23.76  -.41         23.56         23%       Bullish  RED    .119   -.024     .095
---------------------------------------------------------------------------------------------
TAN     68.13  -1.89         71.15        -233.4%    Bullish  RED   -.097   -.12     -.217
---------------------------------------------------------------------------------------------
UUP       28.21   .26        27.96         59%       Bearish  BLUE  -.163   -.05     -.213
---------------------------------------------------------------------------------------------
CORN      24.23  -.16        23.96        -24.4%     Bearish  RED   -.029   -.007    -.036
---------------------------------------------------------------------------------------------
WEAT      7.06  -.04         6.88         -27.9%     Bearish  ----  -.086    .006    -.08
---------------------------------------------------------------------------------------------
YINN      38.59  -1.83       35.11         466.7%    Bullish  RED    .111   -.163    -.052
|
 Table 3      RANKING OF KEY DIRECTORIES BASED PCT.OF STOCKS ABOVE 65-DMA
              7/27/23
 Bullish = 44
 Bearish = 6
---------------------------------------------------------------------------------------
Directory     Current       day-1         day-2         day-3         day-4         day-5
----------------------------------------------------------------------------------------
BIGBANKS       1             1             1             1             1             1
COAL           1             1             1             1             1             1
REGBANKS       .947          .973          .947          .973          .947          .973
TRANSP         .947          .947          1             1             1             1
ETFS           .927          .963          .927          .909          .836          .818
DJI-13         .923          .846          .846          .923          .923          .846
HOMEBLDG       .892          .964          .964          .964          .964          1
NIFTY          .863          .886          .84           .863          .863          .863
FINANCE        .862          .9            .875          .887          .875          .912
COPPER         .857          .857          .857          .857          .857          .857
GUNS           .857          .928          .857          .857          .785          .928
INSURANC       .84           .88           .84           .88           .8            .88
INFRA          .838          .903          .935          .935          .838          .87
UTILITY        .82           .871          .871          .897          .897          .794
AUTO           .811          .905          .83           .849          .83           .83
OILGAS         .804          .865          .855          .876          .835          .824
COMPUTER       .8            .75           .7            .7            .75           .75
SP-100         .8            .833          .844          .844          .844          .822
==============================================================================================
FIDSTKS        .786          .816          .834          .852          .857          .834
INDEXES        .778          .8            .81           .805          .816          .805
INDMATER       .777          .819          .819          .805          .791          .791
SP500          .775          .828          .849          .847          .839          .82
HIGHPRIC       .774          .805          .809          .822          .826          .813
RUS-1000       .773          .832          .84           .842          .838          .825
JETS           .769          .769          .846          .846          .846          .846
CHEM           .767          .79           .79           .744          .79           .79
NASD-100       .762          .831          .831          .841          .841          .801
RETAIL         .76           .826          .847          .847          .76           .804
REIT           .754          .852          .852          .86           .836          .803
DOWJONES       .733          .766          .766          .766          .8            .766
EAT            .731          .756          .707          .756          .756          .756
SEMI           .728          .771          .782          .793          .836          .771
BEVERAGE       .714          .785          .714          .785          .785          .714
ELECTRON       .714          .736          .751          .759          .781          .744
COMODITY       .7            .825          .75           .7            .725          .8
EDU            .666          .666          .666          .666          .666          .5
SOFTWARE       .66           .732          .732          .714          .75           .75
FOOD           .653          .755          .673          .632          .653          .714
GAMING         .631          .684          .684          .736          .684          .736
MILITARY       .615          .73           .692          .769          .73           .769
GREEN          .611          .611          .611          .666          .666          .666
BONDFUND       .609          .747          .77           .793          .77           .758
HACKERS        .562          .625          .625          .625          .562          .5
CHINA          .536          .658          .585          .487          .341          .341
==================================================================================================
LOWPRICE       .419          .442          .436          .425          .425          .463
MARIJUAN       .4            .4            .3            .4            .4            .5
BIOTECH        .385          .434          .428          .454          .497          .484
HOSPITAL       .384          .538          .769          .692          .769          .769
SOLAR          .187          .5            .687          .625          .625          .687
GOLD           .177          .511          .488          .333          .355          .466
|
====================================================================================
Thursday - 6:15 - 7/27/2023 - DJI
Futures +181 Data Used - 7/26/2023
|
7/26/2023
|
|
|
Market Comments
Fed Chairman did not disappoint the bulls. He talked only about the
possibility of one more rate hike in September if Inflation does not
further abate. He might have tried to scare Wall Street. But he did not.
And now the DJI has clearly broken above its long base just below 35000.
It is now moving up to quickly test its old high at 37000. Rails made a
nice breakout. Boesing took off and Google and MSFT advanced smartly.
This should allow the broad advance that Table 3 shows:. See how there
are only 3 groups with the majority f their stocks beliw the 65-dma.
The leaders out of the gate are where we should place our money. The
main focus is still technology, artificial intelligence and semi-consuctors
with housing stocks showing this is the real thing, a new bull market.
I have tried to argue the breakout above a long base with confirming breadth
is more important than the VI remaining negative. NYSE Volume just has not
been so trustworthhy in the "new" 24-hour market place. Now watch to see
if the Russell-2000 can make as own decisive breakout. Professionals
(our CLosing Powers on the key ETFs below) remain much more bullish
than the Public does (as shown by the Opening Power. Closing Power
works! We should trust it now, as ,uch as ever.
Go back over the regular charts we show. See the many clusters of Buy B7s
(bullish Closing Power divergences) appeared near many of the bottoms
in the biggest advancers amont these charts. Eventually, the Pros will turn
bearish and we will get S7 clusters. But for now, it looks like we are in
the take-off phase of a new bull market.
|
|
|
Daily Charts - 7/26/2023
2022 PEERLESS DJI, Signals, Indicators Daily DJI Volume
10-DayUp/Down Vol Stoch-20 CCI RSI Pct of All Stocks above 65-dma
Inverted Traders Index
DJI-IPA DJI-OBV Short-Term Rates
NASDAQ S&P OEX NYSE DJ-15 DJ-20 DJI-30 Old Peerless 2006 version
Tiger Index of Big
Banks Bond Funds Gold Stocks Housing Stocks
Insurance-Stocks
Regional
Banks Russell-1000
Semi Conductors
2006 vers-Peerless is no loner vailable.
Sorry. It is giving an error message and
without the code cannot be fixed.
ETFs: DIA QQQ SPY IWM MDY
TNA Short-Term Rates Ten Year Rates PST (Short Treasuries)
DOLLAR-UUP
ALLSTOCKs
COIN (Bit
Coin ETF)
USO-CrudeOil DBO BLDP FAS GLD HD IBB JETS JNUG KOL NAIL NUGT
NRGU OIH PALL RSX RETL SDS AGQ SLV SOXL TAN TECL TLT TMF TNA
UGA USO China:
YINN
CHAU
Commodities: CANE COCO CORN DBC JJC, NIB CORN, CUT (paper)
MOO, NRGU
SOYB WEAT UUP (Dollar) LIT
(Lithium) PALL
(Palladium)
Stocks
AA AAPL ADBE ALXN AMAT AMGN AMD AMZN ANET AXON AXP
BA BABA BAC BIDU BLDP BSX CAT CDNS CHKP CNX CPB CRM CVX CMG
DE DIS ENPH FB FSLR FTNT GILD GME GOOG GS HD IBM INTU JPM KO KR
LRCX MRK MRNA MOS MSFT NEM NFLX NKE NOC NUE NVDA PANW PG PYPL
QCOM QDEL REGN REV RE SCHW SNOW SO SQUARE TSLA TXN XOM V VRTX
WFC WMT XLE ZM ZOM
Biggest SEMI-Condctors in SOXL: NVDA. AVGO, AMD. INTC TXN MCHP NXPI AMAT ON
HOMEBUILDERS:
NAIL
BZH HOV MHO MTH PHM -
REGIONAL BANKS:
EGBN
FFIC GBCI HMST
Carl Icahn and associates: IEP
MS
JEF
Leveraged Short ETFs:
FAZ - financials, TZA and SRTY- small caps, MZZ - mid caps, TECS -Techs,
SOXS -
semi-conductors LABD
- Biotechs
Bullish MAXCPs http://tigersoftware.com/upping/7-26-2023/Bullish.htm
Bearish MINCPs www.tigersoftware.com/downing/7-26-2023/Bearish.htm |
|
 |
 |
 |
 |
 |
 |
 |

 |
| NYSE |
Latest
Close |
Previous
Close |
Week
Ago |
| Issues
traded |
3,038 |
3,030 |
3,047 |
| Advances |
1,846 |
1,481 |
1,919 |
| Declines |
1,056 |
1,420 |
1,018 |
| Unchanged |
136 |
129 |
110 |
| New
highs |
113 |
123 |
162 |
| New
lows |
6 |
15 |
8 |
| Adv.
volume* |
536,989,753 |
380,748,648 |
601,213,769 |
| Decl.
volume* |
313,669,182 |
430,739,657 |
273,380,159 |
| Total
volume* |
861,900,387 |
819,833,247 |
891,256,922 |
| Closing
Arms (TRIN)† |
0.93 |
1.24 |
0.88 |
| Block
trades* |
4,019 |
4,059 |
4,408 |
| Adv.
volume |
2,572,533,224 |
1,721,298,368 |
2,746,262,010 |
| Decl.
volume |
1,361,487,589 |
2,046,476,801 |
1,275,202,033 |
| Total
volume |
3,990,290,094 |
3,812,476,887 |
4,115,674,912 |
| NASDAQ |
Latest
Close |
Previous
Close |
Week
Ago |
| Issues
traded |
4,563 |
4,583 |
4,606 |
| Advances |
2,720 |
1,992 |
2,500 |
| Declines |
1,663 |
2,406 |
1,900 |
| Unchanged |
180 |
185 |
206 |
| New
highs |
122 |
129 |
266 |
| New
lows |
104 |
106 |
70 |
| Closing
Arms (TRIN)† |
0.90 |
0.99 |
0.93 |
| Block
trades |
27,413 |
33,543 |
35,941 |
| Adv.
volume |
2,761,697,526 |
2,041,829,338 |
2,835,398,574 |
| Decl.
volume |
1,527,439,609 |
2,449,602,395 |
1,999,646,848 |
| Total
volume |
4,322,008,130 |
4,513,696,203 |
5,112,427,542 |
|
Table 2 QUICKSILVER on ETFS - 7/26/2023 ---
Bullish =6 (+0 change) MDY, FAS, RETL, SOXL (+859), TECL (+.592), OIH (.690)
Bearish = 1 UUP
ETF       CLOSE     CHANGE    PIVOT-PT  5-dma AROC   CL-PWR  CANDLE  IP21    ITRS  POWER INDEX
==================================================================================================
DIA       355.25   .93       352.43        64.6%     Bullish  BLUE   .074    0        =======
---------------------------------------------------------------------------------------------
COMPQX    14127.28  -17.28   14063.31     -81.6%     Bullish  BLUE   .144    .084     .228
---------------------------------------------------------------------------------------------
SPY       455.51   .07       452.18        3.4%      Bullish  BLUE   .194    .041     .235
---------------------------------------------------------------------------------------------
QQQ       377.52  -1.26      376.76       -107.4%    Bullish  RED    .102    .095     .197
---------------------------------------------------------------------------------------------
MDY       498.04   2.6       494.88        3.7%      Bullish  BLUE   .232    .055     .287
---------------------------------------------------------------------------------------------
IWM       196.46   1.54      195.08       -8.7%      Bullish  BLUE   .136    .071     .207
---------------------------------------------------------------------------------------------
FAS       74.19   1.48       72.93         184.2%    Bullish  BLUE   .221    .282     .503
---------------------------------------------------------------------------------------------
RETL      8.12   .34         7.98         -94.6%     Bullish  BLUE   .251    .217     .468
---------------------------------------------------------------------------------------------
SOXL      25.06  -1.07       24.29        -437.2%    Bullish  RED    .138    .721     .859
---------------------------------------------------------------------------------------------
TECL      55.42  -2.32       55.7         -342.2%    Bullish  RED    .132    .46      .592
---------------------------------------------------------------------------------------------
IBB       128.84  -.27       130.26       -60.3%     Bullish  BLUE  -.001   -.076    -.077
---------------------------------------------------------------------------------------------
GLD       183.3   .89        182.74       -10.1%     -------  BLUE   .104   -.085     .019
---------------------------------------------------------------------------------------------
DBO       15.61  -.08        15.07         195.7%    -------  ----   .202    .078     .28
---------------------------------------------------------------------------------------------
OIH       337.63  -1.11      329.1         102.3%    Bullish  BLUE   .422    .268     .69
---------------------------------------------------------------------------------------------
CPER     24.17  -.1          23.65         130.5%    Bullish  RED    .132   -.011     .121
---------------------------------------------------------------------------------------------
TAN     70.02  -1.02         71.44        -209.1%    Bullish  BLUE  -.024   -.093    -.117
---------------------------------------------------------------------------------------------
UUP       27.95  -.08        27.88         41.2%     Bearish  RED   -.268   -.072    -.34
---------------------------------------------------------------------------------------------
CORN      24.39  -.61        24.35        -40.6%     Bearish  RED   -.024    .006    -.018
---------------------------------------------------------------------------------------------
WEAT      7.1  -.3           7.1          -7%        Bearish  RED   -.094    .045    -.049
---------------------------------------------------------------------------------------------
YINN      40.42   1.57       35.1          677.1%    Bullish  BLUE   .169   -.01     .159
|
 Table 3      RANKING OF KEY DIRECTORIES BASED PCT.OF STOCKS ABOVE 65-DMA
              7/26/23
 Bullish = 46
 Bearish = 3
---------------------------------------------------------------------------------------
Directory     Current       day-1         day-2         day-3         day-4         day-5
----------------------------------------------------------------------------------------
BIGBANKS       1             1             1             1             1             1
COAL           1             1             1             1             1             .666
REGBANKS       .973          .947          .973          .947          .947          .947
HOMEBLDG       .964          .964          .964          .964          1             1
ETFS           .963          .927          .909          .836          .836          .836
TRANSP         .947          1             1             1             1             1
GUNS           .928          .857          .857          .785          .928          .785
AUTO           .905          .849          .849          .83           .83           .849
INFRA          .903          .935          .935          .838          .87           .87
FINANCE        .9            .875          .887          .862          .912          .925
NIFTY          .886          .84           .863          .863          .863          .84
INSURANC       .88           .84           .88           .8            .88           .64
UTILITY        .871          .871          .897          .897          .794          .538
OILGAS         .865          .855          .876          .835          .814          .762
COPPER         .857          .857          .857          .857          .857          1
REIT           .852          .844          .868          .844          .786          .852
DJI-13         .846          .846          .923          .923          .846          .692
SP-100         .833          .844          .844          .844          .811          .722
RUS-1000       .832          .84           .842          .838          .821          .808
NASD-100       .831          .831          .841          .841          .811          .801
SP500          .828          .849          .847          .837          .814          .775
RETAIL         .826          .847          .847          .76           .804          .782
COMODITY       .825          .775          .675          .725          .8            .775
INDMATER       .819          .819          .805          .791          .791          .791
FIDSTKS        .816          .834          .852          .857          .822          .751
HIGHPRIC       .805          .809          .822          .826          .809          .818
INDEXES        .8            .81           .805          .816          .805          .783
-------------------------------------------------------------------------------------------
CHEM           .79           .79           .744          .79           .79           .79
BEVERAGE       .785          .714          .785          .785          .714          .571
SEMI           .771          .782          .793          .836          .782          .847
JETS           .769          .846          .846          .846          .846          .846
DOWJONES       .766          .766          .766          .8            .766          .666
EAT            .756          .707          .756          .756          .731          .78
FOOD           .755          .693          .612          .653          .714          .693
COMPUTER       .75           .7            .7            .75           .75           .75
BONDFUND       .747          .758          .793          .781          .77           .816
ELECTRON       .736          .751          .759          .781          .744          .789
SOFTWARE       .732          .75           .714          .75           .75           .785
MILITARY       .73           .692          .769          .73           .769          .692
GAMING         .684          .684          .684          .736          .736          .736
EDU            .666          .666          .666          .666          .5            .5
CHINA          .658          .585          .487          .341          .341          .341
HACKERS        .625          .625          .625          .562          .5            .5
GREEN          .611          .611          .666          .666          .666          .666
HOSPITAL       .538          .769          .692          .769          .769          .769
GOLD           .511          .488          .333          .355          .466          .755
==================================================================================================
SOLAR          .5            .687          .625          .625          .687          .687
==================================================================================================
LOWPRICE       .445          .439          .428          .425          .463          .466
BIOTECH        .431          .426          .456          .497          .487          .497
MARIJUAN       .4            .3            .4            .4            .5            .5
|
====================================================================================
Wednesday - 6:09 - 7/26/2023 - DJI
Futures -90 NASDAQ Futures -44
Data Used - 7/25/2023
| |
7/25/2023
|
|
| |
This morning the market is bracing itself for Powell's remarks about
how much more ":work" he and the FED must do to bring inflation down
to 2% and keep it there. Austerity in all its ugly detail may be what
bond salesmen and bond holders want to hear, but it could spook the
market for a few days. After all, the DJI has risen 6 days in a row.
In addition, we can't help but note that oil and cmmodities have bounced
up considerably in the last month. Inflation is far from defeated.
But harsh as Powell's words are apt to sound, keep in mind that the FED's
actions are not going to be nearly as severe as his words. That is why Professionals
have been so busy buying dividend stocks for the last two weeks. It is
why Utilies have ralled and why bnds have stabalized. It is why the
home-builders remain so strong. And most important, it is why the
Ten Year Treasuries still pay less than 4%.
So the DJI should have lots of support just below 35,000.
It is also
why we should keep buying the leading sectors' ETFs when their
Closing Powers hook back up from a rising 21-day ma.
See below how OIH has just made a new high with very bullish intenrals.
Climate change not withstanding, this looks like a good group to buy
into. |
|
| |
Daily Charts - 7/25/2023
2022 PEERLESS DJI, Signals, Indicators Daily DJI Volume
10-DayUp/Down Vol Stoch-20 CCI RSI Pct of All Stocks above 65-dma
Inverted Traders Index
DJI-IPA DJI-OBV Short-Term Rates
NASDAQ S&P OEX NYSE DJ-15 DJ-20 DJI-30 Old Peerless 2006 version
Tiger Index of Big
Banks Bond Funds Gold Stocks Housing Stocks
Insurance-Stocks
Regional
Banks Russell-1000
Semi Conductors
2006 vers-Peerless is no loner vailable.
Sorry. It is giving an error message and
without the code cannot be fixed.
ETFs: DIA QQQ SPY IWM MDY
TNA Short-Term Rates Ten Year Rates PST (Short Treasuries)
DOLLAR-UUP
ALLSTOCKs
COIN (Bit
Coin ETF)
USO-CrudeOil DBO BLDP FAS GLD HD IBB JETS JNUG KOL NAIL NUGT
NRGU OIH PALL RSX RETL SDS AGQ SLV SOXL TAN TECL TLT TMF TNA
UGA USO China:
YINN
CHAU
Commodities: CANE COCO CORN DBC JJC, NIB CORN, CUT (paper)
MOO, NRGU
SOYB WEAT UUP (Dollar) LIT
(Lithium) PALL
(Palladium)
Stocks
AA AAPL ADBE ALXN AMAT AMGN AMD AMZN ANET AXON AXP
BA BABA BAC BIDU BLDP BSX CAT CDNS CHKP CNX CPB CRM CVX CMG
DE DIS ENPH FB FSLR FTNT GILD GME GOOG GS HD IBM INTU JPM KO KR
LRCX MRK MRNA MOS MSFT NEM NFLX NKE NOC NUE NVDA PANW PG PYPL
QCOM QDEL REGN REV RE SCHW SNOW SO SQUARE TSLA TXN XOM V VRTX
WFC WMT XLE ZM ZOM
Biggest SEMI-Condctors in SOXL: NVDA. AVGO, AMD. INTC TXN MCHP NXPI AMAT ON
HOMEBUILDERS:
NAIL
BZH HOV MHO MTH PHM -
REGIONAL BANKS:
EGBN
FFIC GBCI HMST
Carl Icahn and associates: IEP
MS
JEF
Leveraged Short ETFs:
FAZ - financials, TZA and SRTY- small caps, MZZ - mid caps, TECS -Techs,
SOXS -
semi-conductors LABD
- Biotechs
Bullish MAXCPs http://tigersoftware.com/upping/7-25-2023/Bullish.htm
Bearish MINCPs www.tigersoftware.com/downing/7-25-2023/Bearish.htm |
|
 |
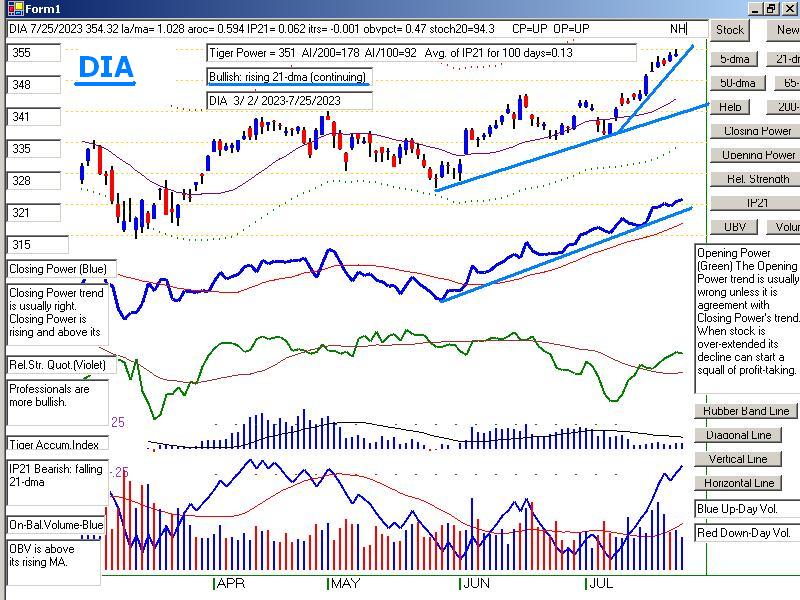 |
 |
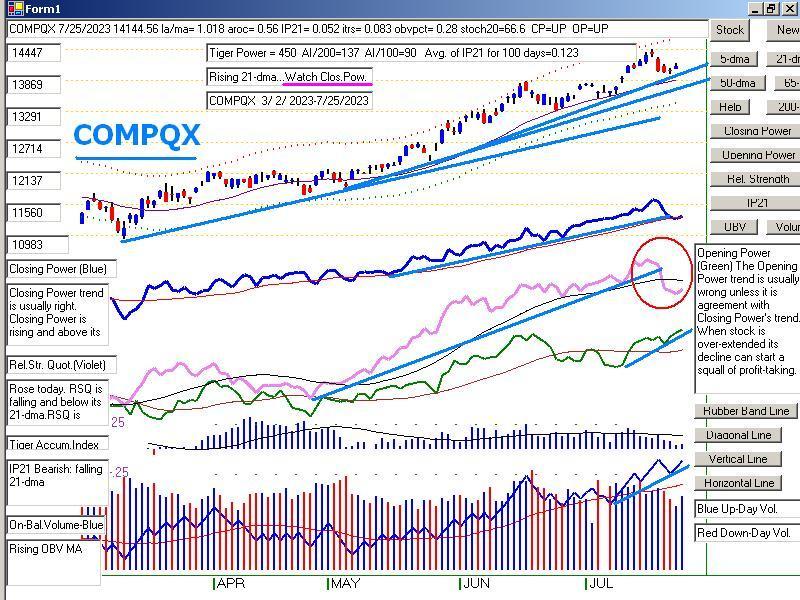 |
 |
 |
 |
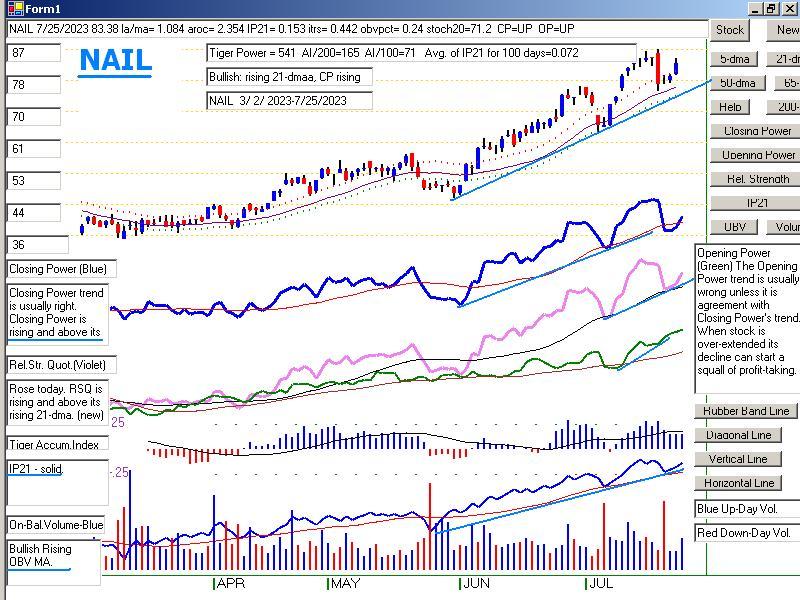 |
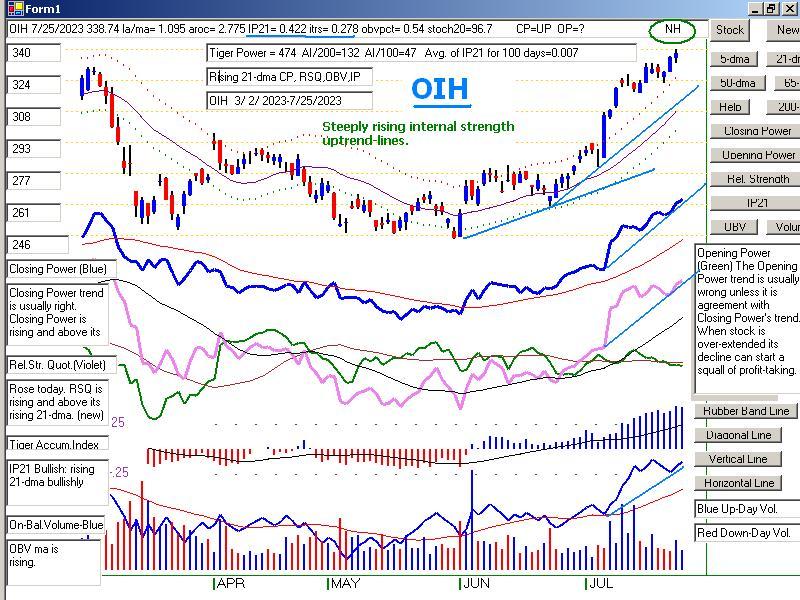 |
Table 1
| NYSE |
Latest
Close |
Previous
Close |
Week
Ago |
| Issues
traded |
3,030 |
3,048 |
3,047 |
| Advances |
1,481 |
1,810 |
2,103 |
| Declines |
1,420 |
1,126 |
844 |
| Unchanged |
129 |
112 |
100 |
| New
highs |
123 |
103 |
202 |
| New
lows |
15 |
10 |
16 |
| Adv.
volume* |
380,748,648 |
530,034,168 |
609,465,260 |
| Decl.
volume* |
430,739,657 |
242,020,448 |
255,738,251 |
| Total
volume* |
819,833,247 |
786,939,133 |
871,986,575 |
| Closing
Arms (TRIN)† |
1.24 |
0.67 |
1.09 |
| Block
trades* |
4,059 |
4,162 |
4,272 |
| Adv.
volume |
1,721,298,368 |
2,660,645,640 |
2,820,658,461 |
| Decl.
volume |
2,046,476,801 |
1,104,061,182 |
1,236,988,333 |
| Total
volume |
3,812,476,887 |
3,856,259,477 |
4,090,019,323 |
| NASDAQ |
Latest
Close |
Previous
Close |
Week
Ago |
| Issues
traded |
4,583 |
4,622 |
4,569 |
| Advances |
1,992 |
2,127 |
2,692 |
| Declines |
2,406 |
2,313 |
1,689 |
| Unchanged |
185 |
182 |
188 |
| New
highs |
129 |
93 |
270 |
| New
lows |
106 |
97 |
99 |
| Closing
Arms (TRIN)† |
0.99 |
1.09 |
0.94 |
| Block
trades |
33,543 |
25,275 |
32,800 |
| Adv.
volume |
2,041,829,338 |
1,846,531,725 |
2,994,646,327 |
| Decl.
volume |
2,449,602,395 |
2,192,032,110 |
1,769,899,690 |
| Total
volume |
4,513,696,203 |
4,083,076,465 |
4,824,073,039 |
|
Table 2 QUICKSILVER on ETFS - 7/20/2023 ---
Bullish =6 (+1 change) MDY, FAS, RETL, SOXL (+88), TECL (+.615), OIH (.701)
Bearish = 1 UUP
ETF       CLOSE     CHANGE    PIVOT-PT  5-dma AROC   CL-PWR  CANDLE  IP21    ITRS  POWER INDEX
==================================================================================================
DIA       354.32   .25       350.69        67.4%     Bullish  BLUE   .063    0        ----
---------------------------------------------------------------------------------------------
COMPQX    14144.56   85.69   14358.02     -73.8%     Bullish  BLUE   .096    .084     .18
---------------------------------------------------------------------------------------------
SPY       455.44   1.24      455.2         13.8%     Bullish  BLUE   .139    .042     .181
---------------------------------------------------------------------------------------------
QQQ       378.78   2.55      385.65       -91.6%     Bullish  BLUE   .044    .098     .142
---------------------------------------------------------------------------------------------
MDY       495.44   .86       497.67       -5.8%      Bullish  BLUE   .22    .052      .272
---------------------------------------------------------------------------------------------
IWM       194.92  -.02       196.8        -26.9%     Bullish  BLUE   .081    .063     .144
---------------------------------------------------------------------------------------------
FAS       72.71  -1.61       71.51         141%      Bullish  RED    .187    .241     .428
---------------------------------------------------------------------------------------------
RETL      7.78  -.1          8.27         -31.5%     Bullish  RED    .192    .141     .333
---------------------------------------------------------------------------------------------
SOXL      26.13   1.23       27.29        -410.7%    Bullish  BLUE   .086    .794     .88
---------------------------------------------------------------------------------------------
TECL      57.74   1.84       59.31        -178.2%    Bullish  BLUE   .094    .521     .615
---------------------------------------------------------------------------------------------
IBB       129.11  -.31       130.41       -23.4%     -------  ----  -.037   -.073    -.11
---------------------------------------------------------------------------------------------
GLD       182.41   1.01      183.67       -33.7%     -------  BLUE   .055   -.088    -.033
---------------------------------------------------------------------------------------------
DBO       15.69   .08        15.01         217.2%    -------  BLUE   .231    .065     .296
---------------------------------------------------------------------------------------------
OIH       338.74   2.24      330.82        109.4%    Bullish  BLUE   .422    .279     .701
---------------------------------------------------------------------------------------------
CPER     24.27   .51         23.55         131.2%    Bullish  RED    .13    .004      .134
---------------------------------------------------------------------------------------------
TAN     71.04   .12          73.01        -128.7%    Bullish  ----  -.066   -.045    -.111
---------------------------------------------------------------------------------------------
UUP       28.03  -.03        27.72         75.4%     Bearish  RED   -.236   -.059    -.295
---------------------------------------------------------------------------------------------
CORN      25  -.17           24.59         237.9%    Bearish  BLUE  -.003    .026     .023
---------------------------------------------------------------------------------------------
WEAT      7.4   .02          7.11          533.9%    Bearish  BLUE  -.108    .104    -.004
---------------------------------------------------------------------------------------------
YINN      38.85   1.37       35.49         554.5%    Bullish  RED    .123   -.126    -.003
|
Table 3      RANKING OF KEY DIRECTORIES BASED PCT.OF STOCKS ABOVE 65-DMA
             7/25/23
 Bullish - 46
 Bearish - 4
---------------------------------------------------------------------------------------
Directory     Current       day-1         day-2         day-3         day-4         day-5
----------------------------------------------------------------------------------------
BIGBANKS       1             1             1             1             1             1
COAL           1             1             1             1             .666          .5
TRANSP         1             1             1             1             1             .947
HOMEBLDG       .964          .964          .964          1             1             1
REGBANKS       .947          .973          .947          .947          .947          .947
INFRA          .935          .935          .838          .87           .87           .806
ETFS           .927          .909          .836          .836          .854          .818
FINANCE        .875          .887          .862          .9            .925          .912
UTILITY        .871          .897          .897          .794          .538          .41
COPPER         .857          .857          .857          .857          1             1
GUNS           .857          .857          .785          .928          .785          .785
OILGAS         .855          .876          .835          .814          .762          .773
AUTO           .849          .867          .83           .83           .849          .849
SP500          .849          .847          .837          .812          .773          .747
RETAIL         .847          .847          .76           .804          .782          .782
DJI-13         .846          .923          .923          .846          .692          .692
JETS           .846          .846          .846          .846          .846          .846
REIT           .844          .86           .852          .795          .836          .803
SP-100         .844          .844          .844          .811          .722          .7
INSURANC       .84           .88           .8            .88           .64           .64
NIFTY          .84           .863          .863          .863          .84           .84
RUS-1000       .84           .842          .838          .821          .806          .772
FIDSTKS        .834          .852          .857          .822          .751          .745
NASD-100       .831          .841          .841          .811          .801          .782
INDMATER       .819          .805          .791          .791          .777          .777
INDEXES        .81           .805          .816          .805          .783          .794
HIGHPRIC       .809          .822          .826          .809          .818          .813
------------------------------------------------------------------------------------------------
CHEM           .79           .744          .79           .79           .767          .767
SEMI           .782          .793          .836          .782          .847          .847
COMODITY       .775          .7            .7            .8            .775          .75
HOSPITAL       .769          .692          .769          .769          .769          .769
DOWJONES       .766          .766          .8            .766          .666          .666
BONDFUND       .758          .781          .781          .781          .827          .724
ELECTRON       .751          .759          .781          .744          .781          .781
SOFTWARE       .75           .732          .75           .75           .767          .785
BEVERAGE       .714          .785          .785          .714          .571          .357
EAT            .707          .756          .756          .731          .78           .756
COMPUTER       .7            .7            .75           .75           .75           .75
FOOD           .693          .632          .632          .714          .693          .693
MILITARY       .692          .769          .73           .769          .692          .653
SOLAR          .687          .625          .625          .687          .687          .687
GAMING         .684          .684          .684          .789          .736          .684
EDU            .666          .666          .666          .5            .5            .5
HACKERS        .625          .625          .562          .5            .5            .437
GREEN          .611          .666          .666          .666          .666          .722
CHINA          .585          .487          .341          .341          .341          .365
================================================================================================
GOLD           .488          .333          .355          .466          .755          .755
LOWPRICE       .439          .431          .428          .463          .46           .457
BIOTECH        .423          .454          .5            .487          .492          .482
MARIJUAN       .3            .4            .4            .5            .5            .4
|
====================================================================================
Tuesday - 6:09 -
7/25/2023 - DJI Futures -10 NASDAQ Futures +45 Data Used -
7/24/2023
| |
7/24/2023
|
|
| |
Now the market waits quietly for the real master of the economy and
the market to speak Wednesday after the FOMC meeting ends and the
FED decides to raise rates by 1/4%, if all goes as expected. Unelected,
Powell is more powerful than the President or the House Speaker. So,
we study his past behavior closely.
One thing he seems to like to do is pull verbal surprises on the market. We'll
soon see. In 2018 and 2020 he veered to the "dovish" side of federal
banking.
Now he will not have the arch hawk, St. Louis Fed Governor Ballard to deal
with. The market likes all this. And the bulls especially are comforted by
the sharp drop in recent CPI and Producer Price Index numbers.
But these good tidings about inflation may not last. Look at the charts
below for Crude Oil (UCO) and OIH (oil service stocks). UCO
has broken an 11-month downtrend and OIH is even threatening
to make a new high. The drought and heat are having a terrible effect on
farming. Wheat, corn and soybeans could easily go back to their yearly
highs. The prices of homes and rents will not moderate until a lot more
housing is built. But the FED's higher rates work against that, thus actually
making housing inflation a natural consequence of fed tightening. Moreove,
the biggest corporations don't seem much affected by higher rates. They
just use inflation and higher costs to raise the prices they charge their
consumers. So, getting the rate of inflation to 2% and keeping it there,
will take a long, long time.
As long as the NYSE and the DJI keep rising... No problem. Investors
won't buy 10year bonds that yield less than 4%. They'll mainly buy DIA
and SPY, or the like. That, at least, is why I believe the DJI is now headed
back to its highs near 37000.
The outlook for chip and tech stocks remains very bullish. Some of
their Rel Str. Quotient uptrend-lines have been broken. So, they may dip
a little lower. But such a decline will be a buying opportunity when
their Closing Powers turn sharply up again.
One more thing, I have always had trouble programming the computer
to find head and shoulders patterns. I think the best way to find them
them is still the old fashioned way, looking at a lot of charts. But we
can speed up the process if I can write new software to screen for
recent turns down by the 65-dma and a deepening red IP21. See the
three bearish H/S tops shown below.
|
|
| |
Daily Charts - 7/21/2023
2022 PEERLESS DJI, Signals, Indicators Daily DJI Volume
10-DayUp/Down Vol Stoch-20 CCI RSI Pct of All Stocks above 65-dma
Inverted Traders Index
DJI-IPA DJI-OBV Short-Term Rates
NASDAQ S&P OEX NYSE DJ-15 DJ-20 DJI-30
Tiger Index of Big
Banks Bond Funds Gold Stocks Housing Stocks
Insurance-Stocks
Regional
Banks Russell-1000
Semi Conductors
2006 vers-Peerless is no loner vailable.
Sorry. It is giving an error message and
without the code cannot be fixed.
ETFs: DIA QQQ SPY IWM MDY
TNA Short-Term Rates Ten Year Rates PST (Short Treasuries)
DOLLAR-UUP
ALLSTOCKs
COIN (Bit
Coin ETF)
USO-CrudeOil DBO BLDP FAS GLD HD IBB JETS JNUG KOL NAIL NUGT
NRGU OIH PALL RSX RETL SDS AGQ SLV SOXL TAN TECL TLT TMF TNA
UGA USO China:
YINN
CHAU
Commodities: CANE COCO CORN DBC JJC, NIB CORN, CUT (paper)
MOO, NRGU
SOYB WEAT UUP (Dollar) LIT
(Lithium) PALL
(Palladium)
Stocks
AA AAPL ADBE ALXN AMAT AMGN AMD AMZN ANET AXON AXP
BA BABA BAC BIDU BLDP BSX CAT CDNS CHKP CNX CPB CRM CVX CMG
DE DIS ENPH FB FSLR FTNT GILD GME GOOG GS HD IBM INTU JPM KO KR
LRCX MRK MRNA MOS MSFT NEM NFLX NKE NOC NUE NVDA PANW PG PYPL
QCOM QDEL REGN REV RE SCHW SNOW SO SQUARE TSLA TXN XOM V VRTX
WFC WMT XLE ZM ZOM
Biggest SEMI-Condctors in SOXL: NVDA. AVGO, AMD. INTC TXN MCHP NXPI AMAT ON
HOMEBUILDERS:
NAIL
BZH HOV MHO MTH PHM -
REGIONAL BANKS:
EGBN
FFIC GBCI HMST
Carl Icahn and associates: IEP
MS
JEF
Leveraged Short ETFs:
FAZ - financials, TZA and SRTY- small caps, MZZ - mid caps, TECS -Techs,
SOXS -
semi-conductors LABD
- Biotechs
Bullish MAXCPs http://tigersoftware.com/upping/7-24-2023/Bullish.htm
Bearish MINCPs www.tigersoftware.com/downing/7-24-2023/Bearish.htm |
|
 |
 |
 |
 |
 |
 |
 |
 |
 |
 |
 |
 |
Table 1 Daily Breadth and Volume
Statistics
| NYSE |
Latest
Close |
Previous
Close |
Week
Ago |
| Issues
traded |
3,048 |
3,041 |
3,056 |
| Advances |
1,810 |
1,466 |
1,664 |
| Declines |
1,126 |
1,462 |
1,292 |
| Unchanged |
112 |
113 |
100 |
| New
highs |
103 |
94 |
138 |
| New
lows |
10 |
7 |
21 |
| Adv.
volume* |
530,034,168 |
458,228,735 |
432,212,756 |
| Decl.
volume* |
242,020,448 |
420,666,247 |
335,480,786 |
| Total
volume* |
786,939,133 |
894,055,195 |
778,422,041 |
| Closing
Arms (TRIN)† |
0.67 |
0.92 |
1.08 |
| Block
trades* |
4,162 |
4,497 |
3,890 |
| Adv.
volume |
2,660,645,640 |
1,824,942,032 |
1,887,344,319 |
| Decl.
volume |
1,104,061,182 |
1,681,553,419 |
1,589,469,089 |
| Total
volume |
3,856,259,477 |
3,570,190,197 |
3,538,242,953 |
| NASDAQ |
Latest
Close |
Previous
Close |
Week
Ago |
| Issues
traded |
4,622 |
4,551 |
4,524 |
| Advances |
2,127 |
2,019 |
2,765 |
| Declines |
2,313 |
2,303 |
1,599 |
| Unchanged |
182 |
229 |
160 |
| New
highs |
93 |
106 |
221 |
| New
lows |
97 |
68 |
88 |
| Closing
Arms (TRIN)† |
1.09 |
1.01 |
1.02 |
| Block
trades |
25,275 |
29,360 |
31,697 |
| Adv.
volume |
1,846,531,725 |
2,407,744,640 |
2,864,323,061 |
| Decl.
volume |
2,192,032,110 |
2,761,513,406 |
1,682,088,984 |
| Total
volume |
4,083,076,465 |
5,254,182,107 |
4,593,167,946 |
|
Table 2 QUICKSILVER on ETFS - 7/20/2023 ---
Bullish = 5 (0 change) FAS, RETL, SOXL (+758), TECL (+.523), OIH (.673)
Bearish = 0
ETF       CLOSE     CHANGE    PIVOT-PT  5-dma AROC   CL-PWR  CANDLE  IP21    ITRS  POWER INDEX
==================================================================================================
DIA       354.07   1.93      349.58        117.4%    Bullish  BLUE   .061    0     .  ====
---------------------------------------------------------------------------------------------
COMPQX    14058.87   26.06   14353.64     -65.5%     Bullish  RED    .087    .087     .174
---------------------------------------------------------------------------------------------
SPY       454.2   2.02       454.19        37.1%     Bullish  BLUE   .104    .045     .149
---------------------------------------------------------------------------------------------
QQQ       376.23   .6        385.74       -83.7%     Bullish  RED    .034    .102     .136
---------------------------------------------------------------------------------------------
MDY       494.58   .74       496.01        34.6%     Bullish  BLUE   .161    .05      .211
---------------------------------------------------------------------------------------------
IWM       194.94   .48       195.97        34.8%     Bullish  BLUE   .045    .062     .107
---------------------------------------------------------------------------------------------
FAS       74.32   2.15       70.67         427.5%    Bullish  BLUE   .251    .269     .52
---------------------------------------------------------------------------------------------
RETL      7.88   .14         7.83          190.4%    -------  BLUE   .178    .157     .335
---------------------------------------------------------------------------------------------
SOXL      24.9  -.02         28.26        -594.8%    Bullish  ----   .073    .685     .758
---------------------------------------------------------------------------------------------
TECL      55.9   .35         59.78        -167.4%    Bullish  RED    .067    .456     .523
---------------------------------------------------------------------------------------------
IBB       129.42  -2.05      129.72        6.9%      -------  RED   -.064   -.068    -.132
---------------------------------------------------------------------------------------------
GLD       181.4  -.78        183.64       -4.4%      Bearish  RED   -.026   -.094    -.12
---------------------------------------------------------------------------------------------
DBO       15.61   .35        15.03         286.2%    -------  BLUE   .269    .048     .317
---------------------------------------------------------------------------------------------
OIH       336.5   7.44       331.49        197.2%    Bullish  BLUE   .433    .24      .673
---------------------------------------------------------------------------------------------
CPER     23.76   .2          23.65         10.6%     -------  BLUE   .216   -.05      .166
---------------------------------------------------------------------------------------------
TAN     70.92  -.23          72.89        -181.6%    Bullish  ----  -.033   -.041    -.074
---------------------------------------------------------------------------------------------
UUP       28.06   .1         27.61         84.7%     Bearish  ----  -.174   -.044    -.218
---------------------------------------------------------------------------------------------
CORN      25.17   1.21       23.84         495.6%    Bearish  BLUE  -.07    .029     -.041
---------------------------------------------------------------------------------------------
WEAT      7.38   .5          6.65          642.5%    Bearish  BLUE  -.155    .092    -.063
---------------------------------------------------------------------------------------------
YINN      37.48   2.37       34.9          12.6%     Bullish  BLUE   .158   -.123     .035
|
 Table 3      RANKING OF KEY DIRECTORIES BASED PCT.OF STOCKS ABOVE 65-DMA
              7/24/23
 Bullish = 45    of whixh 27 are above 80%
 Bearish = 5
---------------------------------------------------------------------------------------
Directory     Current       day-1         day-2         day-3         day-4         day-5
----------------------------------------------------------------------------------------
BIGBANKS       1             1             1             1             1             .714
COAL           1             1             1             .666          .5            .5
TRANSP         1             1             1             1             .947          .947
REGBANKS       .973          .947          .947          .947          .947          .842
HOMEBLDG       .964          .964          1             1             1             .964
INFRA          .935          .838          .87           .87           .806          .838
DJI-13         .923          .923          .846          .692          .692          .538
ETFS           .909          .836          .836          .854          .818          .818
UTILITY        .897          .897          .794          .538          .41           .435
FINANCE        .887          .862          .9            .912          .912          .85
INSURANC       .88           .8            .88           .64           .64           .6
OILGAS         .876          .835          .814          .762          .773          .68
AUTO           .867          .849          .83           .849          .849          .83
NIFTY          .863          .863          .863          .84           .84           .909
REIT           .86           .844          .803          .844          .803          .811
COPPER         .857          .857          .857          1             1             .857
GUNS           .857          .785          .928          .785          .785          .785
FIDSTKS        .852          .857          .822          .751          .739          .715
RETAIL         .847          .76           .804          .782          .782          .76
SP500          .847          .837          .812          .771          .745          .729
JETS           .846          .846          .846          .846          .846          .846
SP-100         .844          .844          .811          .722          .7            .655
RUS-1000       .842          .838          .821          .806          .77           .754
NASD-100       .841          .841          .811          .801          .782          .782
HIGHPRIC       .822          .826          .809          .818          .809          .796
INDMATER       .805          .791          .791          .777          .75           .694
INDEXES        .805          .816          .805          .783          .794          .751
----------------------------------------------------------------------------------------------------
SEMI           .793          .836          .782          .847          .847          .858
BEVERAGE       .785          .785          .714          .571          .357          .428
BONDFUND       .781          .77           .781          .839          .735          .655
MILITARY       .769          .73           .769          .692          .653          .73
DOWJONES       .766          .8            .766          .666          .666          .566
ELECTRON       .759          .781          .744          .781          .766          .759
EAT            .756          .756          .731          .78           .756          .707
CHEM           .744          .79           .79           .767          .744          .697
SOFTWARE       .732          .767          .75           .767          .767          .767
COMODITY       .7            .725          .775          .775          .725          .65
COMPUTER       .7            .75           .75           .75           .75           .8
HOSPITAL       .692          .769          .769          .769          .769          .615
GAMING         .684          .684          .736          .789          .684          .631
EDU            .666          .666          .5            .5            .333          .166
GREEN          .666          .666          .666          .666          .722          .666
FOOD           .632          .653          .693          .693          .693          .612
HACKERS        .625          .562          .5            .5            .437          .437
SOLAR          .625          .625          .687          .687          .687          .75
-------------------------------------------------------------------------------------------------
CHINA          .487          .341          .341          .341          .365          .439
BIOTECH        .451          .497          .489          .492          .477          .461
LOWPRICE       .431          .431          .466          .46           .451          .416
MARIJUAN       .4            .4            .5            .5            .4            .4
GOLD           .333          .355          .466          .755          .755          .466
|
===================================================================
Monday - 6:05 -
7/24/2023 - DJI Futures +44 NASDAQ Futures
+32 Data Used - 7/21/2023
| |
7/21/2023
|
|
| |
Nightly Comments
Judged Buy B10 Breakout versus S9-V. I
would bet on the Breakout.
http://tigersoft.com/PeerInst-2012-2013/-Buy-B10.htm
The new Peerless Sell S9-v is confronting an impressive DJI
breakout above well-tested, flat resistance that goes back
eight months. Such a breakout is impressive, especially since
it is occurring despite a lot of talk from the FED about how
they must fight inflation. Technically, the breakout is most likely
the more powerfful development. The S9-Vs are based on
the V-Indicator lagging. But the volume indicators are working
less and less well, especially with Fed Chairman Powell in charge.
Too much trading now takes place away from the NYSE and
Powell has been known to suddenly swerve into the dovish camp.
As technical tools go, the A/D Line remains number 1.
When asked
back in 1980 what was the single most important technical tool,
Joe Granville, the creator of On-Balance-Voume, said without
even a moment's pause, breadth and the NYSE A?D Line were
number 1 in his book. Why so, Joe? Their successful track
record goes back to 1929, he might have said. But why does
the A/D Line work so well. It's because, it reflects ALL the stocks
on the NYSE, not just 30 blue chips. When orders stop coming
in for all these stocks, taken as a whole, it is much more significant
than what the DJIA-30 may be showing when one or two of
their highest priced members are being artificially run up.
When most NYSE stocks are advancing, the interest rate outlook
must be favorable or, at least, tolerable AND their dividends
can compete with the powerful alternative investment, the 10-
year rate on Treasuries. And that's the case now. The A/D Line
is in an uptrend and the 10-year Treasuries are not even yielding
3.9% now.
OK. So, we should let the DJI go back to 37000. That's where
the real resistance should be any way. And we should not worry
much about the DJI's breakout now being false. And we probably
should not expect much more than a cautious rate hike or two
more. Only talk of 6% rates or a breakout failure should worry
us.
But what about the techs. Holdings must be reduced when their
Closing Power and Relative Strength Quotient uptrends are
broken. That has not yet happened in the big ETFs shown below.
But stay vigilant. They have given traders big profits and they
may sell off clumsily. Abide by these trendlines. See their charts
below.
Windows 10 - Update Report.
I got a new fast desktop with WIN-10 and maximum speed
and memory. I loaded up Visual Net 2017-2019. MSFT
wants too much for the virtually similar version of 2021-2022.
All the graphing programs I have written this Summer on
Visual Net 2003 on my XP work fine in the new computer.
No unpleasant surprises. So, I feel like I am ahead of a
schedule that will permit the Windows10 TigerSoft release at the end
of September. Stay tumed.
|
|
| |
Daily Charts - 7/21/2023
2022 PEERLESS DJI, Signals, Indicators Daily DJI Volume
10-DayUp/Down Vol Stoch-20 CCI RSI Pct of All Stocks above 65-dma
Inverted Traders Index
DJI-IPA DJI-OBV Short-Term Rates
NASDAQ S&P OEX NYSE DJ-15 DJ-20 DJI-30
Tiger Index of Big
Banks Bond Funds Gold Stocks Housing Stocks
Insurance-Stocks
Regional
Banks Russell-1000
Semi Conductors
2006 vers-Peerless is no loner vailable.
Sorry. It is giving an error message and
without the code cannot be fixed.
ETFs: DIA QQQ SPY IWM MDY
TNA Short-Term Rates Ten Year Rates PST (Short Treasuries)
DOLLAR-UUP
ALLSTOCKs
COIN (Bit
Coin ETF)
USO-CrudeOil DBO BLDP FAS GLD HD IBB JETS JNUG KOL NAIL NUGT
NRGU OIH PALL RSX RETL SDS AGQ SLV SOXL TAN TECL TLT TMF TNA
UGA USO China:
YINN
CHAU
Commodities: CANE COCO CORN DBC JJC, NIB CORN, CUT (paper)
MOO, NRGU
SOYB WEAT UUP (Dollar) LIT
(Lithium) PALL
(Palladium)
Stocks
AA AAPL ADBE ALXN AMAT AMGN AMD AMZN ANET AXON AXP
BA BABA BAC BIDU BLDP BSX CAT CDNS CHKP CNX CPB CRM CVX CMG
DE DIS ENPH FB FSLR FTNT GILD GME GOOG GS HD IBM INTU JPM KO KR
LRCX MRK MRNA MOS MSFT NEM NFLX NKE NOC NUE NVDA PANW PG PYPL
QCOM QDEL REGN REV RE SCHW SNOW SO SQUARE TSLA TXN XOM V VRTX
WFC WMT XLE ZM ZOM
Biggest SEMI-Condctors in SOXL: NVDA. AVGO, AMD. INTC TXN MCHP NXPI AMAT ON
HOMEBUILDERS:
NAIL
BZH HOV MHO MTH PHM -
REGIONAL BANKS:
EGBN
FFIC GBCI HMST
Carl Icahn and associates: IEP
MS
JEF
Leveraged Short ETFs:
FAZ - financials, TZA and SRTY- small caps, MZZ - mid caps, TECS -Techs,
SOXS -
semi-conductors LABD
- Biotechs
Bullish MAXCPs http://tigersoftware.com/upping/7-21-2023/Bullish.htm
Bearish MINCPs www.tigersoftware.com/downing/7-21-2023/Bearish.htm |
|
 |
 |
 |
 |
 |
 |
 |
 |
| |
Table 1 - Daily Breadth and Volume Statistics
| NYSE |
Latest
Close |
Previous
Close |
Week
Ago |
| Issues
traded |
3,041 |
3,032 |
3,035 |
| Advances |
1,466 |
1,231 |
734 |
| Declines |
1,462 |
1,694 |
2,224 |
| Unchanged |
113 |
107 |
77 |
| New
highs |
94 |
101 |
112 |
| New
lows |
7 |
10 |
24 |
| Adv.
volume* |
458,228,735 |
374,018,282 |
148,547,177 |
| Decl.
volume* |
420,666,247 |
434,467,987 |
654,416,041 |
| Total
volume* |
894,055,195 |
818,780,646 |
807,490,807 |
| Closing
Arms (TRIN)† |
0.92 |
0.94 |
1.65 |
| Block
trades* |
4,497 |
3,983 |
3,807 |
| Adv.
volume |
1,824,942,032 |
1,613,881,444 |
605,704,178 |
| Decl.
volume |
1,681,553,419 |
2,077,935,040 |
3,023,726,919 |
| Total
volume |
3,570,190,197 |
3,761,773,015 |
3,647,457,047 |
| NASDAQ |
Latest
Close |
Previous
Close |
Week
Ago |
| Issues
traded |
4,551 |
4,555 |
4,603 |
| Advances |
2,019 |
1,521 |
1,344 |
| Declines |
2,303 |
2,863 |
3,099 |
| Unchanged |
229 |
171 |
160 |
| New
highs |
106 |
87 |
185 |
| New
lows |
68 |
74 |
77 |
| Closing
Arms (TRIN)† |
1.01 |
1.24 |
0.64 |
| Block
trades |
29,360 |
33,699 |
40,457 |
| Adv.
volume |
2,407,744,640 |
1,525,825,256 |
1,999,205,571 |
| Decl.
volume |
2,761,513,406 |
3,562,663,475 |
2,957,987,247 |
| Total
volume |
5,254,182,107 |
5,128,028,439 |
5,366,893,388 |
|
Table 2 QUICKSILVER on ETFS - 7/20/2023 ---
Bullish = 5 (-1) FAS, RETL, SOXL (+829), TECL (+.628), OIH (.585)
Bearish = 0
ETF       CLOSE     CHANGE    PIVOT-PT  5-dma AROC   CL-PWR  CANDLE  IP21    ITRS  POWER INDEX
==================================================================================================
DIA       352.14  -.29       345.85        99.9%     Bullish  RED    .049    0         ----
---------------------------------------------------------------------------------------------
COMPQX    14032.81  -30.5    14244.95     -28.4%     Bullish  RED    .126    .103     .229
---------------------------------------------------------------------------------------------
SPY       452.18   0         450.84        32.1%     Bullish  RED    .134    .052     .186
---------------------------------------------------------------------------------------------
QQQ       375.63  -1.13      382.61       -45%       Bullish  RED    .072    .119     .191
---------------------------------------------------------------------------------------------
MDY       493.84  -1.04      491.16        60.3%     Bullish  RED    .175    .057     .232
---------------------------------------------------------------------------------------------
IWM       194.46  -.62       193.58        75.3%     Bullish  RED    .046    .072     .118
---------------------------------------------------------------------------------------------
FAS       72.17  -.76        68.24         416.1%    Bullish  RED    .197    .215     .412
---------------------------------------------------------------------------------------------
RETL      7.74  -.24         7.58          185.4%    -------  RED    .191    .14      .331
---------------------------------------------------------------------------------------------
SOXL      24.92   .63        28.06        -244.2%    Bullish  RED    .1      .739     .839
---------------------------------------------------------------------------------------------
TECL      55.55  -.15        57.83        -10.4%     Bullish  RED    .121    .507     .628
---------------------------------------------------------------------------------------------
IBB       131.47   1.21      129.24        124.6%    Bullish  BLUE  -.021   -.042    -.063
---------------------------------------------------------------------------------------------
GLD       182.18  -.56       181.56        20.5%     Bearish  BLUE  -.053   -.085    -.138
---------------------------------------------------------------------------------------------
DBO       15.26   .19        14.75         113.7%    -------  BLUE   .199    .022     .221
---------------------------------------------------------------------------------------------
OIH       329.06  -.04       323.53        128.2%    Bullish  BLUE   .383    .202     .585
---------------------------------------------------------------------------------------------
CPER     23.56  -.09         23.71        -134.7%    -------  RED    .182   -.068     .114
---------------------------------------------------------------------------------------------
TAN     71.15  -.29          73.55         29.7%     Bullish  RED   -.03   -.021     -.051
---------------------------------------------------------------------------------------------
UUP       27.96   .08        27.59         61.4%     Bearish  ----  -.188   -.043    -.231
---------------------------------------------------------------------------------------------
CORN      23.96  -.39        22.8          168.4%    Bearish  BLUE  -.108   -.014    -.122
---------------------------------------------------------------------------------------------
WEAT      6.88  -.22         6.5           235.8%    Bearish  ----  -.2    .015      -.185
---------------------------------------------------------------------------------------------
YINN      35.11   .01        37.39        -396.7%    Bullish  RED    .125   -.192    -.067
|
 Table 3     RANKING OF KEY DIRECTORIES BASED PCT.OF STOCKS ABOVE 65-DMA
             7/21/23
 Bullish = 45
 Bearish = 5
---------------------------------------------------------------------------------------
Directory     Current       day-1         day-2         day-3         day-4         day-5
----------------------------------------------------------------------------------------
BIGBANKS       1             1             1             1             .714          .714
COAL           1             1             .666          .5            .5            .5
TRANSP         1             1             1             .947          .947          .947
HOMEBLDG       .964          1             1             1             .964          .964
REGBANKS       .947          .947          .947          .947          .842          .736
DJI-13         .923          .846          .692          .692          .538          .461
UTILITY        .897          .794          .538          .41           .435          .564
NIFTY          .863          .863          .84           .84           .909          .84
FINANCE        .862          .9            .912          .9            .85           .8
COPPER         .857          .857          1             1             .857          1
FIDSTKS        .857          .822          .751          .739          .721          .751
AUTO           .849          .849          .849          .849          .83           .867
JETS           .846          .846          .846          .846          .846          .846
REIT           .844          .795          .852          .811          .803          .836
SP-100         .844          .811          .722          .7            .655          .677
NASD-100       .841          .811          .801          .782          .792          .801
INFRA          .838          .87           .87           .806          .806          .87
RUS-1000       .838          .821          .806          .77           .753          .758
SP500          .837          .812          .771          .743          .729          .749
ETFS           .836          .836          .854          .818          .836          .818
SEMI           .836          .782          .847          .847          .847          .804
OILGAS         .835          .814          .762          .773          .67           .68
HIGHPRIC       .826          .809          .818          .809          .792          .779
INDEXES        .816          .805          .783          .794          .751          .767
DOWJONES       .8            .766          .666          .666          .566          .533
INSURANC       .8            .88           .64           .64           .6            .52
==================================================================================================
INDMATER       .791          .791          .777          .75           .694          .694
CHEM           .79           .79           .767          .744          .697          .697
BEVERAGE       .785          .714          .571          .357          .5            .571
GUNS           .785          .928          .785          .785          .785          .785
ELECTRON       .781          .744          .781          .766          .751          .736
BONDFUND       .77           .77           .839          .747          .643          .609
HOSPITAL       .769          .769          .769          .769          .615          .692
SOFTWARE       .767          .767          .767          .767          .767          .714
RETAIL         .76           .804          .782          .782          .76           .739
EAT            .756          .731          .78           .756          .682          .756
COMPUTER       .75           .75           .75           .75           .8            .8
MILITARY       .73           .769          .692          .653          .73           .692
COMODITY       .725          .8            .75           .725          .625          .675
GAMING         .684          .736          .736          .736          .631          .631
EDU            .666          .5            .5            .333          .166          .166
GREEN          .666          .666          .666          .722          .666          .555
FOOD           .653          .714          .673          .693          .591          .653
SOLAR          .625          .687          .687          .687          .687          .437
HACKERS        .562          .5            .5            .437          .437          .437
=============================================================================================
BIOTECH        .494          .487          .494          .477          .459          .423
LOWPRICE       .431          .469          .463          .451          .422          .416
MARIJUAN       .4            .5            .5            .4            .4            .3
GOLD           .355          .466          .755          .755          .466          .4
CHINA          .341          .341          .341          .365          .439          .487
|
==================================================================================
Friday
AM Market Comments
Take partial profits in QQQ tech stocks at the close. Hold others.
Some investors were put into panic mode by today's 2% bout of selling in
the NASDAQ. Others took some inviting profits in the NASDAQ and tech
stocks that face a coming shakeup in how high capitalization techs are
going to weighted in the QQQ. Accordingly, this shook up the complacency
in stocks like MSFT, NVDA, AAPL, TSLA and GOOG.
While this was going on, some Professionals switched their own portfolio
weighting and bought blue chips. The DJI's breakout above 35000
looked inviting enough to buy the big banks like GS, JPM and WFC.
If this is a new bull market, the DJI should rally much more and quickly
get back to 37000.
At the end of the day, the blue-chip buying drove the DJI up to its 2.8% band with
the Peerless V-Indicator still negative. This additional surge in the DJI brought us
a Peerless Sell S9-V. These can occur if the DJI is far enough above the
21-dma and the V-I is negative, breadth is weakening on a daily basic,
the IP21 is not much above 0, and even when the P-Indicator is clearly positive.
The Sell S9-V was just barely achieved today. If the DJI had closed 25 points lower,
there would have been no Sell S9-V.
S9-Vs occurring with the P-Indicator still quite positive have been reliably
bearish.
Below are the 6 instances in the last 30 years. Five brought tradeable declines.
You may want to count the 2011 S9-Vs as a single occurrent. Either way,
the odds of a DJI drop to the lower band after a small additional advance are 80%
if we trust Peerless. But Peerless has a difficult time keeping up when the
FED's suddenly turns "dovish" and the DJI becomes very bullish.
Accordingly,
move slowly now on account of Peerless.
S9-Vs with Positive PI since 1980
Date LA/MA V-I
P-I Result
-----------------------------------------------------------------------
7/13/2007 1.026 -15
+192 Peerless
trading gain 4.4%
Maximun Paper loss of 0.7%
------------------------------------------------------------------------
7/26/2010 1.041 -11
+442 Peerless
trading gain 2.6%
Maximun Paper loss of 1.5%
------------------------------------------------------------------------
7/5/2011 1.037 -48
+239 Peerless
trading gain 8.6%
Maximun Paper loss of 1.0%
------------------------------------------------------------------------
7/21/2011 1.025 -51
+269 Peerless
trading gain 9.8%
Maximun Paper loss of 1.0%
------------------------------------------------------------------------
7/11/2013 1.025 -25
+258 Peerless
trading gain 3.2%
Maximun Paper loss of 1.3%
------------------------------------------------------------------------
7/15/2020 1.035 -134
+138 Peerless trading loss =
2.1%
Maximun Paper loss of 2.1%
------------------------------------------------------------------------
What to do about the weak techs? First, expect profit-taking after a red
candle-stick followed by a Relative Strength Quotient trend-break. Where
the IP21-Accumulation Index is negative, a deeper decline often follows.
Where the IP21 is clearly positive, look for a recovery from support like
the 21-day or at rising uptrend-lines. Where the IP21 is dropping and
drooping, support will not be so forthcoming. Look at the charts shown
below and see how they fared this past year when their Rel Str. Quotient
uptrend-lines were broken.
Given the Sell S9-V, it will probably be best to take trading profits on
a recovery in QQQ and SOXL late Friday. We cannot know how they
will react to the re-balancing do be done on the QQQ on Monday.
There are too few bearish MINCPs to recommend any shorting just
now. Note also that the DJI is apt to find good support at 34700-34800
because of its recent breakout above well-tested resistance.
| |
7/20/2023
2022 PEERLESS DJI, Signals, Indicators Daily DJI Volume
10-DayUp/Down Vol Stoch-20 CCI RSI Pct of All Stocks above 65-dma
Inverted Traders Index
DJI-IPA DJI-OBV Short-Term Rates
NASDAQ S&P OEX NYSE DJ-15 DJ-20 DJI-30
Tiger Index of Big
Banks Bond Funds Gold Stocks Housing Stocks
Insurance-Stocks
Regional
Banks Russell-1000
Semi Conductors
2006 vers-Peerless is no loner vailable.
Sorry. It is giving an error message and
without the code cannot be fixed.
ETFs: DIA QQQ SPY IWM MDY
TNA Short-Term Rates Ten Year Rates PST (Short Treasuries)
DOLLAR-UUP
ALLSTOCKs
COIN (Bit
Coin ETF)
USO-CrudeOil DBO BLDP FAS GLD HD IBB JETS JNUG KOL NAIL NUGT
NRGU OIH PALL RSX RETL SDS AGQ SLV SOXL TAN TECL TLT TMF TNA
UGA USO China:
YINN
CHAU
Commodities: CANE COCO CORN DBC JJC, NIB CORN, CUT (paper)
MOO, NRGU
SOYB WEAT UUP (Dollar) LIT
(Lithium) PALL
(Palladium)
Stocks
AA AAPL ADBE ALXN AMAT AMGN AMD AMZN ANET AXON AXP
BA BABA BAC BIDU BLDP BSX CAT CDNS CHKP CNX CPB CRM CVX CMG
DE DIS ENPH FB FSLR FTNT GILD GME GOOG GS HD IBM INTU JPM KO KR
LRCX MRK MRNA MOS MSFT NEM NFLX NKE NOC NUE NVDA PANW PG PYPL
QCOM QDEL REGN REV RE SCHW SNOW SO SQUARE TSLA TXN XOM V VRTX
WFC WMT XLE ZM ZOM
Biggest SEMI-Condctors in SOXL: NVDA. AVGO, AMD. INTC TXN MCHP NXPI AMAT ON
HOMEBUILDERS:
NAIL
BZH HOV MHO MTH PHM -
REGIONAL BANKS:
EGBN
FFIC GBCI HMST
Carl Icahn and associates: IEP
MS
JEF
Leveraged Short ETFs:
FAZ - financials, TZA and SRTY- small caps, MZZ - mid caps, TECS -Techs,
SOXS -
semi-conductors LABD
- Biotechs
Bullish MAXCPs http://tigersoftware.com/upping/7-20-2023/Bullish.htm
Bearish MINCPs www.tigersoftware.com/downing/7-20-2023/Bearish.htm |
|
Continued at www.tigersoftware.com/707/INDEX.htm
==================================================================================


