SOME APPLICATIONS
OF THE TIGER POWER STOCK RANKER
A New Bull Market in Low Priced Stocks Is Starting.
Here Is How To Use Tiger Soft's Power Ranker
in a Stealth Bull Market for Low Priced Stocks.
See also
Tiger's Power Stock Ranker.
December 31, 2007 What Distinguished Early-on The Stocks about To Rise The Most in 2007
June 18, 2008 Picking the Best Performing Stocks of 2008
Introductory Articles
The 80 Best Performing Stocks since the November Bottom
Demonstration of TigerSoft Trading with Automatic Buys
November 6, 2007 Lots of Stocks Look Like Good Short Sales
On-Line Manuals that come with the Software.
by William Schmidt, Ph.D.
 |
Tiger
Software
Research on Individual Stocks upon Request: Composite Seasonality Graph
|
|
SOME APPLICATIONS OF THE TIGER POWER RANKER TODAY 1. HEDGING AGAINST A WEAK DOLLAR 2. SCANNING FOR BULLISH SPECIAL SITUATIONS 3. FINDING VERY STRONG NASDAQ-100 STOCKS 4. FINDING LONGER-TERM INVESTMENTS AMONG "FIDSTKS" 5. FIRST OUT OF THE GATE AS A BULL MARKET STARTS 6. "ACROSS THE BOARD" HIGH STRENGTH 7. "NEW HIGHS" 8. "BOTH UP by William Schmidt, Ph.D. The intention here is to show users some of the ways that they might use TigerSoft's Power-Ranker. The exercises here will be used for the creation of Tiger's Elite Stock Professional today. They are performed given the backdrop of a possible turn upwards in the stock market, to the point where it may well have seen a bottom for some time, depending on whether breadth can stay strong and volume can expand to keep eating up overhead supply of stock. In addition, Obama has accepted this weekend the Chinese contention about the desirability of working towards an international currency that is based on a basket of currencies.. We might begin by looking at precious metals' stocks, since they might be expected to rise if the US Dollar weakens. 1. HEDGING AGAINST A WEAK DOLLAR Using the Power-Ranker, we will analyze the stocks in c:\gold, which may be downloaded from our TigerSoft data page. Use Peercomm + TigerSoft Chart + Run/Setups + Run Nightly Analysis + OK When it is done, click OK. Now let's see what we can find for a gold stock that would make a good trade when Gold turns up. (It has been declining in the last few days as people have taken profits in it and pured that money into stocks that are currently rallying.) Use Peercomm + Peerless-2008/9 + Tiger Selections + #1 Indicators Results Scan the resulting table's columns, "Best Performing Indicator" and "Gain". Find a high gain number over 100(%) and a Best Performing Indicator" that is Stochastic Based. When I do that today, 4/3/2009, I find quite a few. So, let's tighten the screen to include only stocks over $15.that make a Gain be over 200 with the optimum trading system for the last year. That yields: AEM - 5 day Stochastic, gain 222,2% and ut closed at 51,28, now on Sell (See Status column) ASA - 14 day Stochasti, gain 241.8% and it closed at 51.68, now on Sell. GG - 14 day Stochastic, gain 252.8% and it closed at 31.12, now on Sell. PAAS - 14-day Stochastic, gain 325.8% and it closed at 16.69, now on Sell. RGLD - 50-day Stochastic, 198.5% amd it closed at 43.42, now on Sell. We might decide to watch these would be a good Buy on the next optimized Buy signal. The length of the Stochastic will give you a sense of how long a trade might last. AEM makes very good quick-trades. RGLD trades take much longer to reach their optimum. PAAS is mainly a silver stock and the Closing Power for Silver (SLV) is in a distinct downtrend, so we would want to wait for that downtrend to end. Chart SLV to see this yourself. By clicking on the row of Power Ranker spreadsheet on your screen and then Graph at the top, you can see these stock's chartsand do further analysis. To save time we might simply note which of them have the highest IP21 (current Accumulation Index score.) and where they are in relationship to their 50-day ma AEM - IP21=.10 BR (below rising 50-day ma) ASA - IP21=-.09 AR (above rising 50-day ma) GG - IP21=.10 BR (below rising 50-day ma) PAAS - IP21=.18 AR (above rising 50-day ma) RGLD - IP21=.23 BR (below rising 50-day ma) RGLD has the highest IP21 score, so that is the stock I would look at. it most closely. Below is the.chart. With the chart on the screen I can also get the optimized trading results for other length stochastics, besides th 50-day (which has traded best for the year). To do this with a graph on the screen, go to Indic 3 + 7th item down (Performance of 5-20 day Stochastics.) That shows that a 20-day Stochastic-K turning up below 20 has given good Buys for the last year. The bottom of the Tiger chart also shows this performance data. That 20-day Stochastic's system's gain is a respectable 86.3%. We will watch it closely, as RGLD may be setting up for a nice run past 50, so long as its Accumulation Index stays above its MA. To see where the stock's 20-day Stochastic is simplify the chart: Operations + Restore Simple Bar Chart and the choose Indic-1 + Stoch.20. : 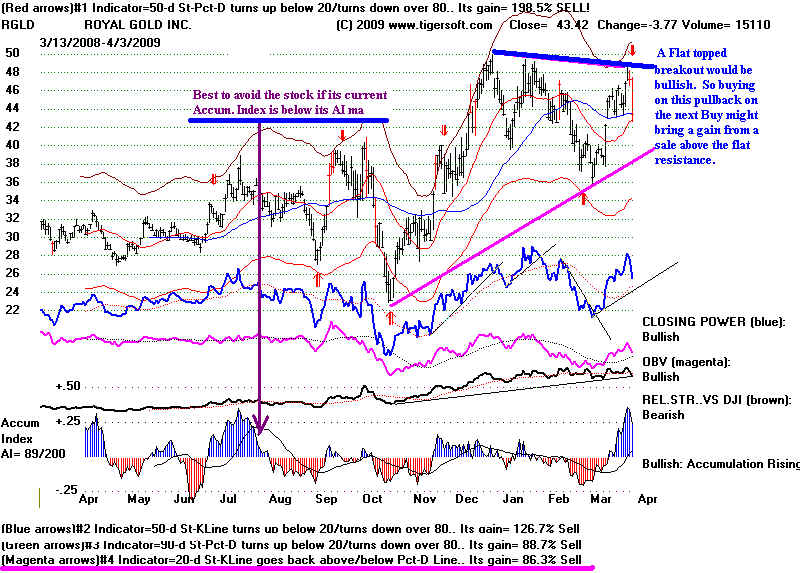
2. SCANNING FOR BULLISH SPECIAL SITUATIONS Most of the time, there are special situations that move up even in bad market environments. It could be because of a take-over, a new product or medical breakthrough. Here is how to scan for such stocks using TigerSoft. Know that all the news has probably not come out about these stocks. After you've found some candidates for special situations, do some investigating, too, about the company. If a takeover has already been announced, then I would look elsewhere. Using the Power-Ranker, we will analyze the stocks in c:\hotstks, which may be downloaded from our TigerSoft data page. These are mostly stocks that are showing unusual relative strength and have been making new 12-month highs. Click Peercomm + TigerSoft Chart + Run/Setups + Run Nightly Analysis + OK When this is done, click OK. Let's see what we can find for some Bullish Special Situations. Use Peercomm + Peerless-2008/9 + Tiger Selections + Bullish Stocks for 3 Months. These are very high Power-Ranked stocks. They show very high long-term Accumulation (AI/200). usually a positive divergence between price and OBV for the last 100-days, a high current IP21 (Accumulation) and are usually above their 50-day ma. Producing the charts for those stocks with a current IP21 above .25 woild mean charting OCN, HBE, ARST, DUC, EEI, ATSI and IMGN. And if we look to the far right of the grid-display, we see TGR-Sig. In that column a U!U as OCN tells us that the Opening Power has just turned up above its rising ma while the Closing Power contines to rise. Clicking on the Grid's row for OCN and then Graph lets us see the graph. I have shown on the graph where we made this tha night's bullish special situation. Not the wonderfully bullish Accumulation.and rising trends, especially the blue Closing Power. By using Signals(1),and (1) Major Buys we can put the most important signals on the screen. See how there were a series of nested major Buys back in September. The market's great weakness was only a short-term drag int he stock. This proved to be very bullish. Note how there were many bulges of big money Accumulation over +.50. This shows significant insider buying. When the stock makes new highs subsequently, the insiders are shown to be shrewd and savvy, as well. With this much Accumulation and relative strength, there is little need to be concerned about sell signals on the stock. The stock is shown to be very tightly held by so much Blue Accumulation. 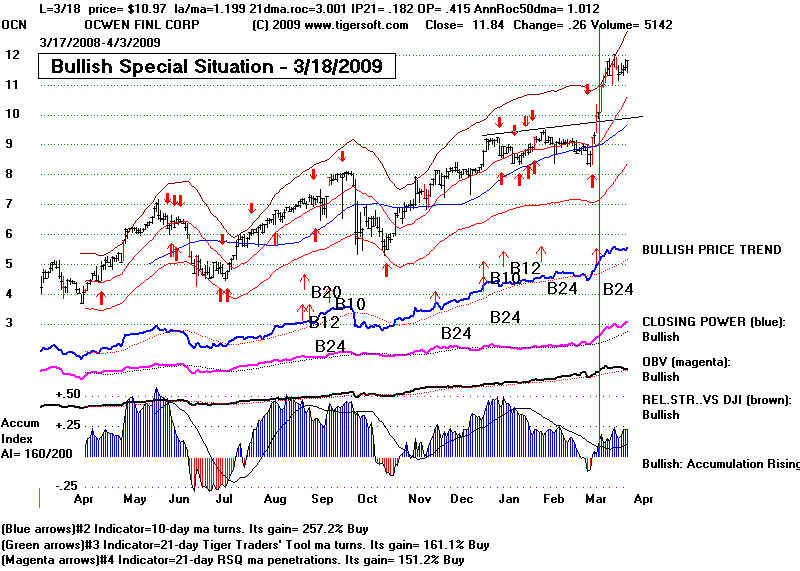 OCN, HBE, ARST, DUC, EEI, ATSI and IMGN. Continuing with this list of "3-Months' Bullish" stocks we see HBE, but it is very thinly traded. ARST looks good. too. DUC lacks volatility.. 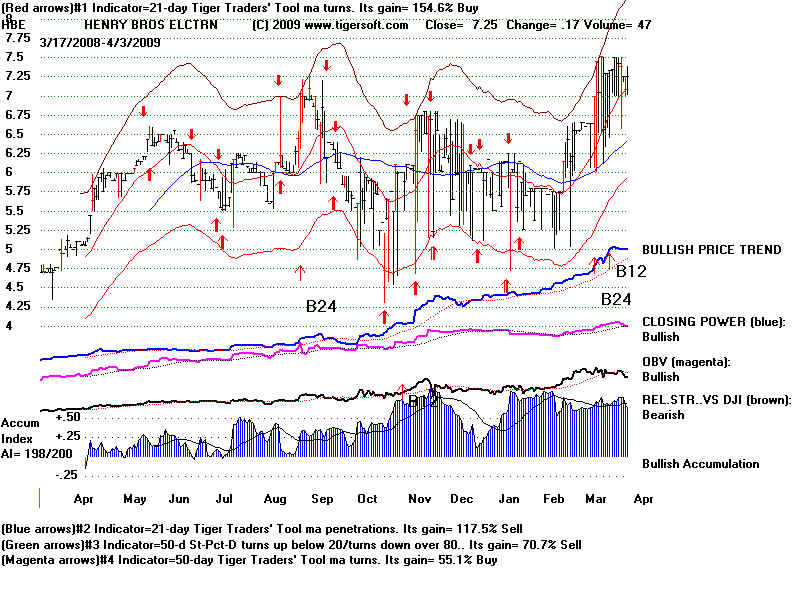 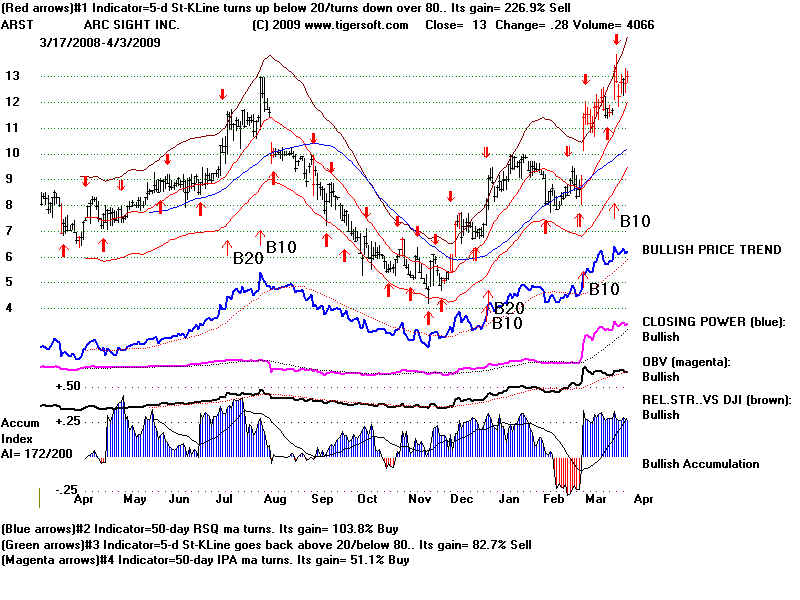 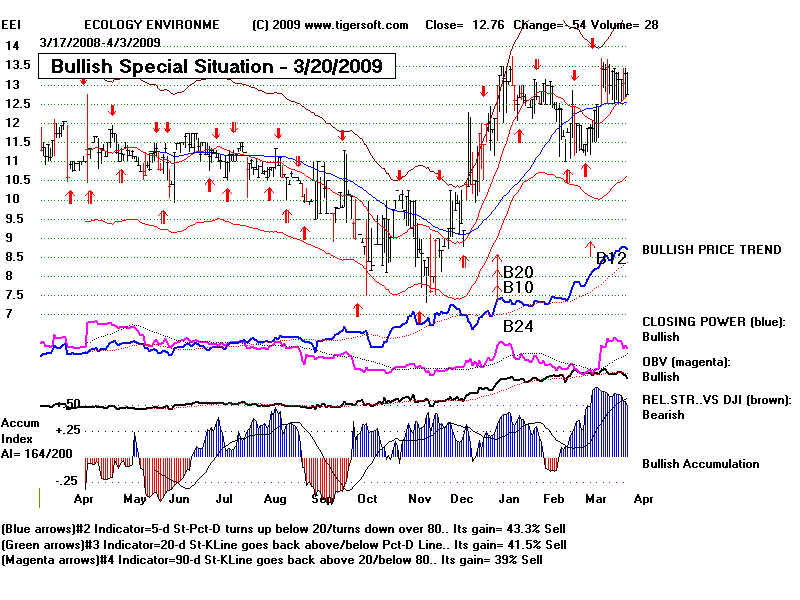 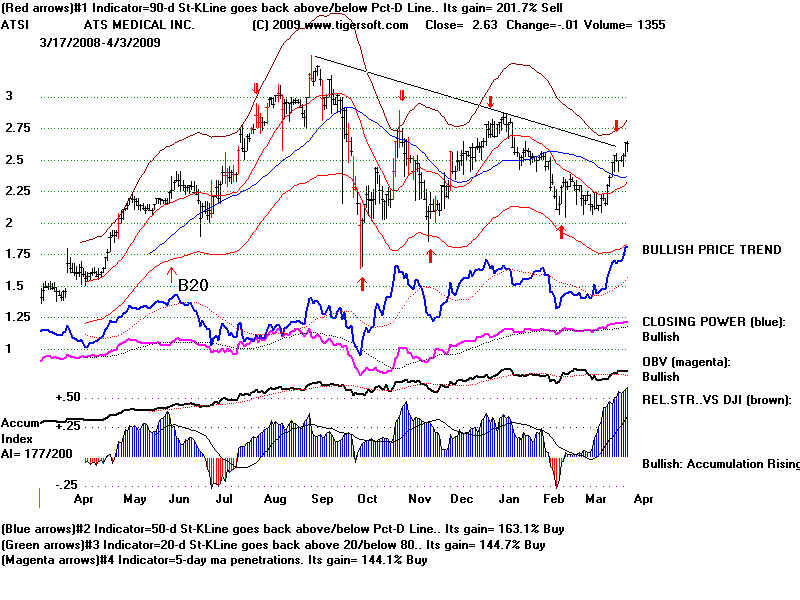 |
|
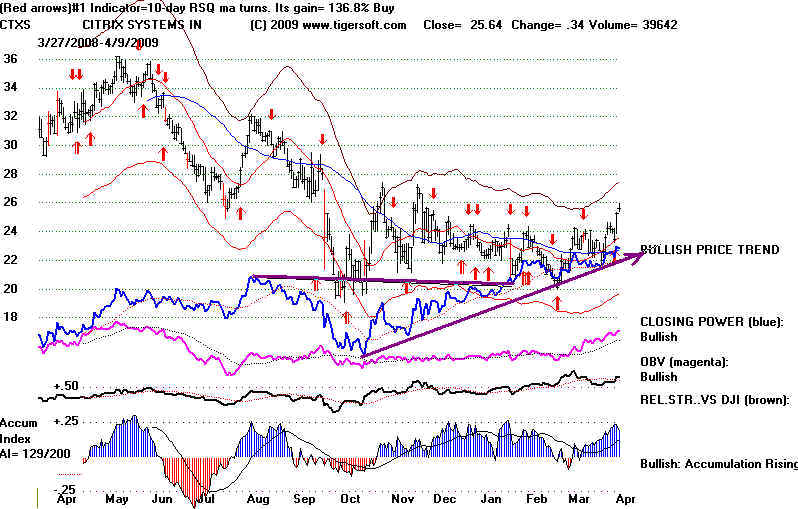
3. FINDING VERY STRONG NASDAQ-100 STOCKS Using the Power-Ranker, we will analyze the stocks in c:\nasd-100, which may be downloaded from our TigerSoft data page. Use Peercomm + TigerSoft Chart + Run/Setups + Run Nightly Analysis + OK When it is done, click OK. Now let's see what we can find as the strongest NASDAQ-100 stocks to Buy. When this is done, click OK and then start Peercomm + Peerless-2008/9 + Tiger Selections + Bullish Stocks for 3 Months. Again, these are very high Power-Ranked stocks. They show very high long-term Accumulation (AI/200). usually a positive divergence between price and OBV for the last 100-days, a high current IP21 (Accumulation) and are usually above their 50-day ma. The highest ranked "Bullish" stock with an IP21 greater than .20 is CTXS. Being the top stock in this screening is significanlty bullish, provided its OBV%-Pr% is not -30 or lower. That last condition is a "killer" condition. Its presence should eliminate a stock from consideration. On the other hand, that CTXS's evaluation of its Opening Power gives it only a "Q" instead of a "U" is less important than the fact that the stock is #1 and the Closing Power is rated a "U". The stock's chart shows it next needs to breakout to a new recovery high. A breakout would be a new bullish Buy for the stock. The red Buy based on the 14-day Stochastic-K-Line should have been taken for a Buy late last week. 04/03/2009 Symbol Power AI/200 OBV%-Pr% IPA%-Pr% Current IP21 Close Trend-50 Cl/21dma Up% MACD Tgr Sig CTXS 346 125 39 39 .21 24.35 AR 1.05 50.4% Buy ?U 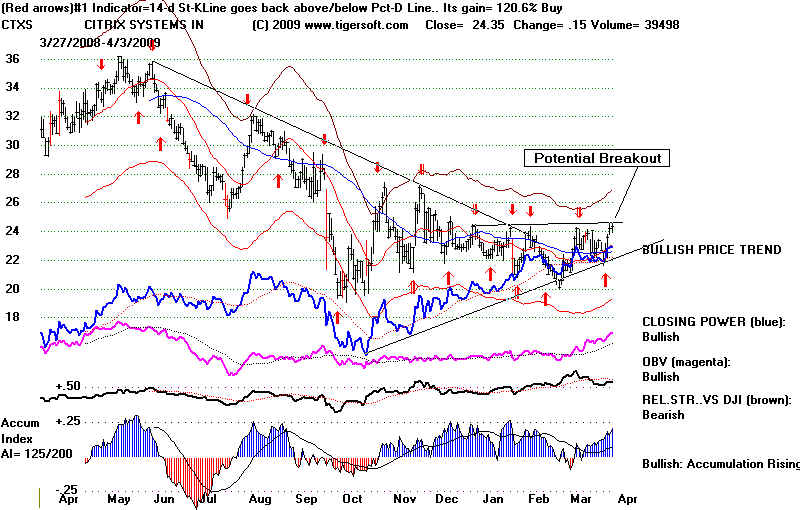 I recommend looking at only the stocks with a current IP21 above .20 where both Opening and Closing Power are rising ("UU)". That gives woild mean charting SNPS, HANS, NTAP and CTAS. Here are their charts. 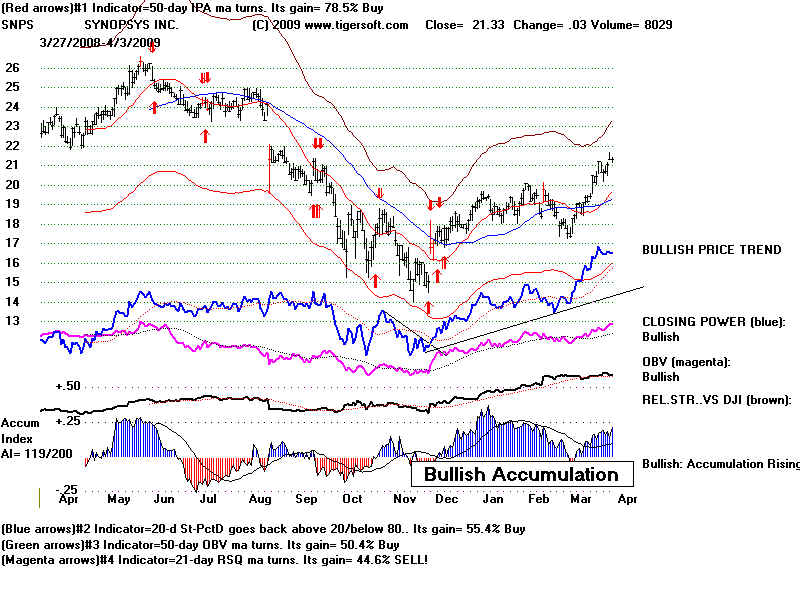 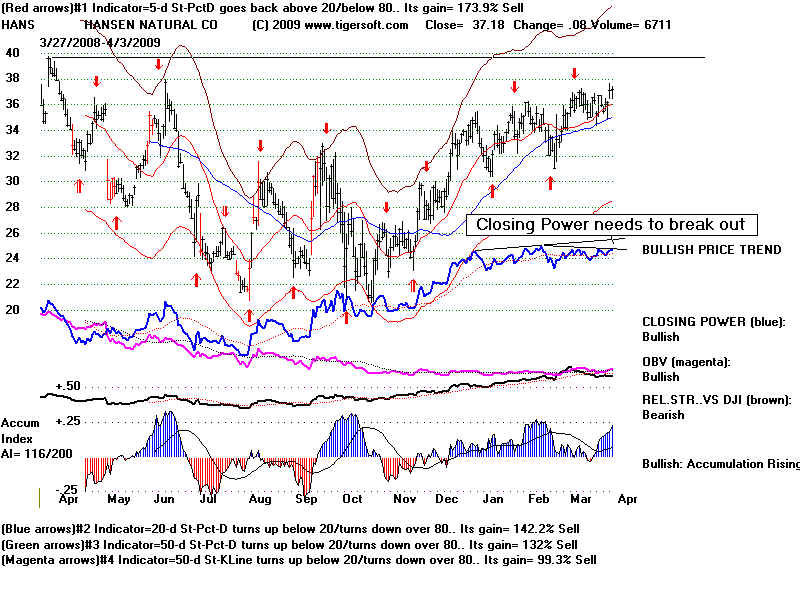 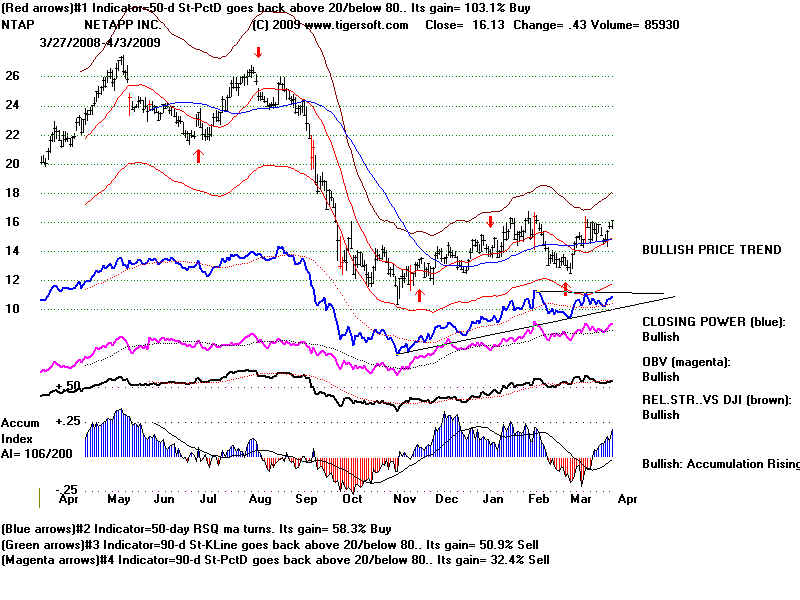 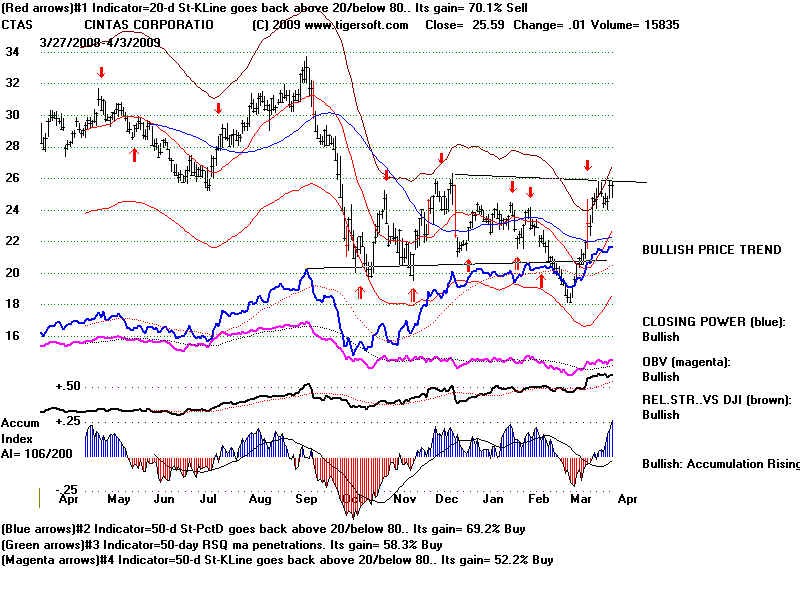 |
|
4. FINDING LONGER-TERM INVESTMENTS AMONG FIDSTKS The Tiger Tahiti system buys the highest AI/200 stock in the DJI provided certain conditions are met. The system is explained in our book: Tiger's Tahiti System: 24.4%/Yr: 1970-2007: Buying the Most Accumulated DJI-30 Stock. Sometimes, like now, no stock in the DJI-30 qualifies. In that case, apply the rules to another larger universe of stocks. You might use Oil Stocks or NASDAQ-100 stocks. Here we look at the highest Accumulation Stocks, but the highest Power Ranked Stocks would also do fine. Here we will use the Power Ranker to sort the FIDSTKS' data (stocks held by the Fidelity Sector funds). Run the Analysis as above: Use Peercomm + TigerSoft Chart + Run/Setups + Run Nightly Analysis + OK When it is done, click OK. Now let's see what we find to be the highest Accumulation stocks among all those held by the FIdelity Sector funds. Start Peercomm + Peerless-2008/9 + Ranking Results + Tiger Accumulation Index Rankings. Here are the top 5 stocks and their most important key values. FCN would be considered the best, but for the fact that its current IP21 is only +04. We want to see +.20 or higher. GS meets that standard and is AR )abve its rising 0-day ma) and has the "UU" designation under TgrSig to show that both Opening and CLosing Power are rising. Symbol AI/200 OBV%-Pr% Current IP21 Close Trend-50 TgrSig FCN 165 -3 .04 47.5 AR UD GHL 163 -2 .16 75.15 AR UU IMA 163 -47 .16 27.72 AR ?U RYN 153 49 .27 32.39 AR UU GS 149 -11 .20 119.4 AR UU 5. FIRST OUT OF THE GATE AS A BULL MARKET STARTS Just as the first horse out of the gate at a horse race tends to do well, so, too, when the stock market starts up off a major bottom. The bottom on this last decline was 20 trading days. The simplest way to see the stocks leading the race at this point is to pick a group of stocks you like to trade or invest in. Let's pick a cyclical group, as cyclicals tend to do well at a market bottom, as do airlines, electronics and brokerage stocks. Here we will take the airlines's stocks in the set of data we call "TRANSP", which is gathered from our Tiger Data page. Use Peercomm + TigerSoft Chart + Ranking Results + User Set Rankings + 20 +1 Now look for those stocks at the top of the ranking to be sure the stocks have an IP21 above .25. The top stocks are YRCW +262% IP21=.34 VTNC +137% IP21=. 47 By using Peercomm + TigerSoft Chart + Ranking Results + User Set Rankings + 20 + 3 we get a listing that shows the highest IP21 stocks. Those are VTNC, TMM, ACU and HA. VTNC is the best choice, I think. 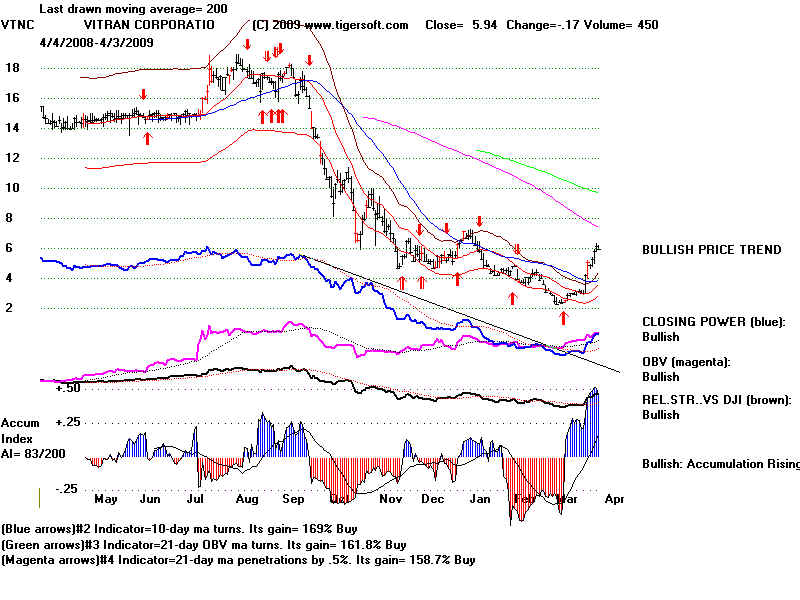 6. "ACROSS THE BOARD" HIGH STRENGTH A different way to seeing which stocks are the first out of the gate with across-the-board strength, Having run the nightly analysis program, one can compare the rankings of price for 21 days (extrernal strength) and OBV and IP21 (internal strength). Use Peercomm + TigerSoft Chart + Ranking Results + 21-day Pct Change and Rank Divergences + OK Compare the Pct Change Rank with the On-Balance-Vol.-Rank and Intra-Day-Volume Rank. Find a stock near the top that has across-the-board rankings: Example: Pct Change Rank On-Balance-Vol.-Rank Intra-Day-Volume Rank. TMM 97 of 104 94 of 104 103 of 194 JBLU 91 of 104 95 of 104 102 of 104 Here the highest and most bullish possible rank is 104 for each of the 3 variables. High as JBLU's percent change rank is, the OBV and Intrra-Day Volume ranks are even higher for JBLU. A move by JBLU will be a bullish breakout backed by very good internals. 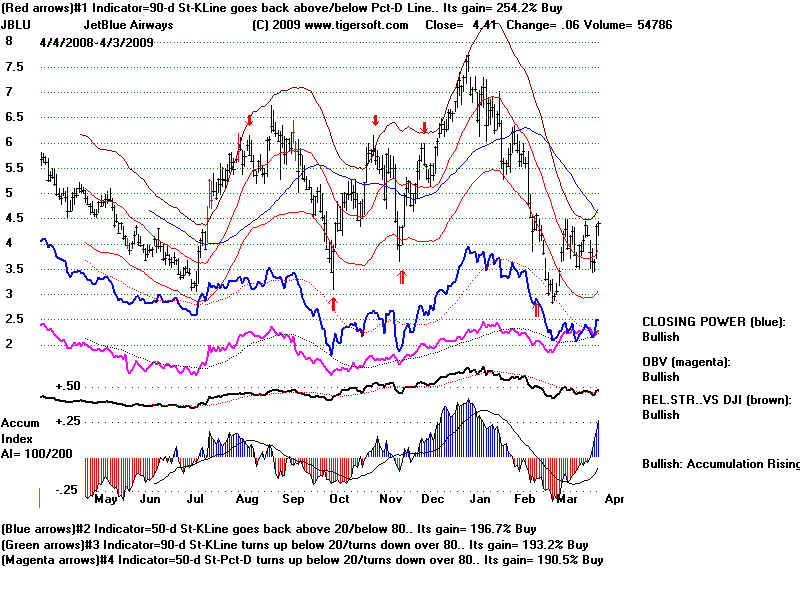 |
|
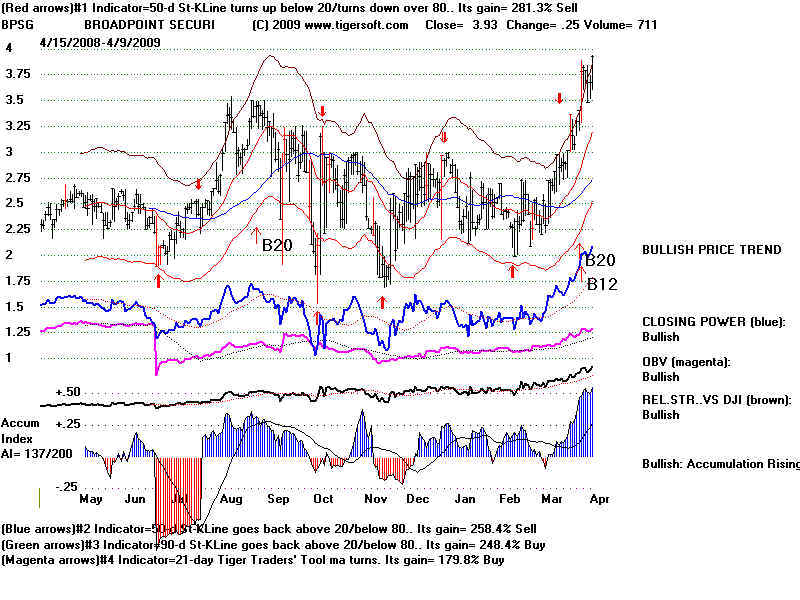
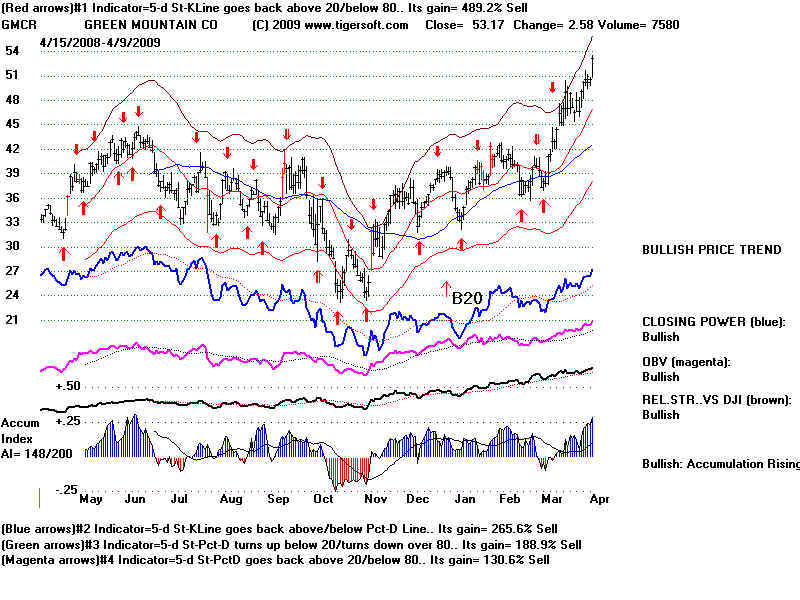
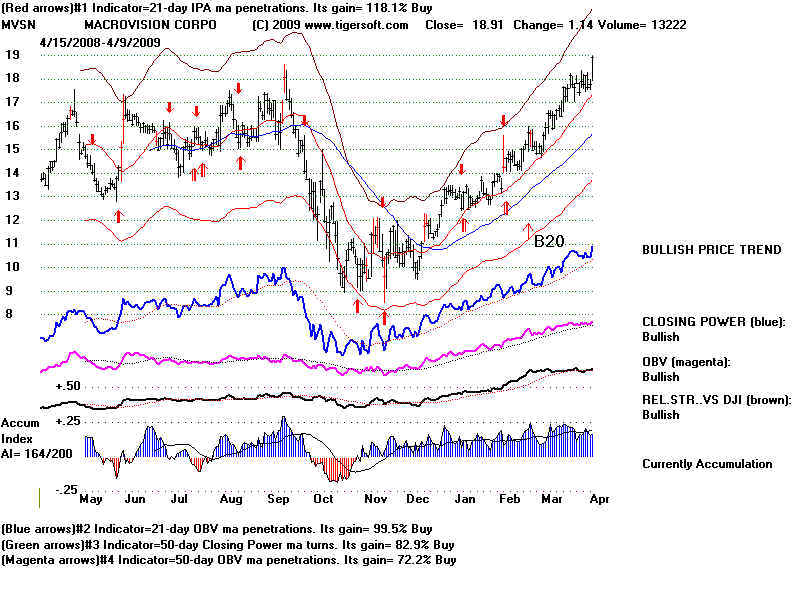
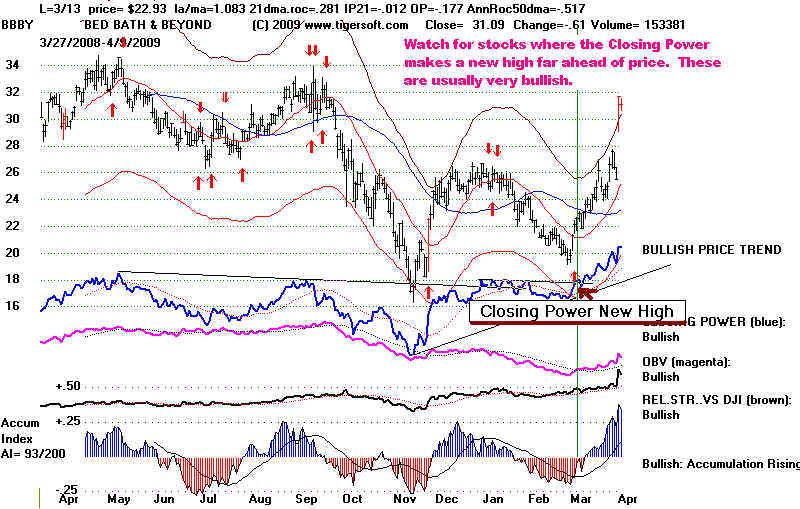
After running the Power-Ranker-FLagger, use the following commands : 7. "NEW HIGH" Use Peercomm + Peerless 2008/2009t + Daily Stocks + "New High - 15. 250 day price high" (in the middle section) ... Click the down-arrow key on the right side of the key board to go to the next stock. We are looking for stocks not only making new price highs, but ones where the CLosing Power, OBV, Relative Strength and Accumulation Index are rising and above their moving averages. Interesting New Highs: 4/9/2009 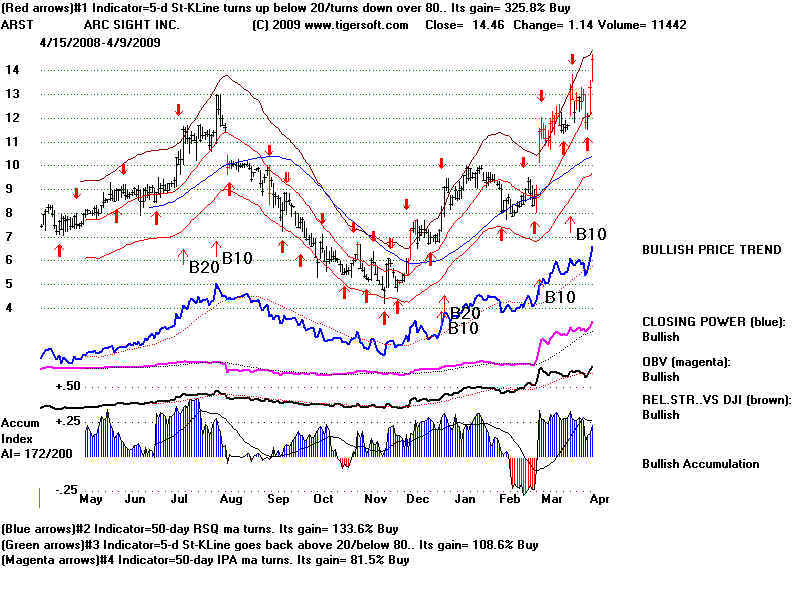
|
