NEW HOTLINE 7-21-2023 Tiger
Software (C) 2023
Hotline Address will change Sunday.
Look for email from us giving new address on Saturday.
---------------------------------------------------------------------------
The Hotline's price
is now $440 for a year. To renew please send a check
to William Schmidt, 5834 Kantor STREET, San Diego, CA 92122.
Visa or MC Credit Cards seem to be working again. But checks are
desired,
as the banks are declining too many cards even when the card numbers we
enter are correct. The Data Page for a year is now $240.
william_schmidt@hotmail.com
Recent Peerless Hotlines http://tigersoftware.com/707/oldindex.htm
www.tigersoftware.com/sage22/INDEX.htm
www.tigersoftware.com/dante43/INDEX.htm
www.tigersoftware.com/5HLM/INDEX.htm
-----------------------------------------------------------------------------------------
New Free Book -
DJI History by Decade: 1950-2020: Technicals, Signals
and Events
Events will be added soon for each decade. See 1950-1960 now..
Emphasis is on how FED and also political events shaped market trends.
1950 to 1959-1960 http://tigersoftware.com/z/HISTORY/1950s/decade.htm
1960 to 1969-1970 http://tigersoftware.com/z/HISTORY/1960s/deca-60s.htm
1970 to 1979-1980 http://tigersoftware.com/z/HISTORY/1970s/deca-70s.htm
1980 to 1989-1990 http://tigersoftware.com/z/HISTORY/1980s/decad80s.htm
1990 to 1999-2000 http://tigersoftware.com/z/HISTORY/1990s/deca-90s.htm
2000 to 2009-2010 http://tigersoftware.com/z/HISTORY/2000s/d-2000s.htm
2010 to 2019-2020 http://tigersoftware.com/z/HISTORY/2010s/d-2010s.htm
-------------------------------------------------------------------------------------------------------------------------------------------------
Trading SPY with Tigersoft: 1986-2023
http://www.tigersoftware.com/SPY-book-1989-2023/SPY-Book.htm
===================================================================
Friday
- 6:08 AM - 7/21/2023 - DJI
Futures +58 NASDAQ Futures +100 Data Used - 7/20/2023
| |
7/20/2023
|
|
| |
Market Comments
Take partial profits in QQQ tech stocks at the close. Hold others.
Some investors were put into panic mode by today's 2% bout of selling in
the NASDAQ. Others took some inviting profits in the NASDAQ and tech
stocks that face a coming shakeup in how high capitalization techs are
going to weighted in the QQQ. Accordingly, this shook up the complacency
in stocks like MSFT, NVDA, AAPL, TSLA and GOOG.
While this was going on, some Professionals switched their own portfolio
weighting and bought blue chips. The DJI's breakout above 35000
looked inviting enough to buy the big banks like GS, JPM and WFC.
If this is a new bull market, the DJI should rally much more and quickly
get back to 37000.
At the end of the day, the blue-chip buying drove the DJI up to its 2.8% band with
the Peerless V-Indicator still negative. This additional surge in the DJI brought us
a Peerless Sell S9-V. These can occur if the DJI is far enough above the
21-dma and the V-I is negative, breadth is weakening on a daily basic,
the IP21 is not much above 0, and even when the P-Indicator is clearly positive.
The Sell S9-V was just barely achieved today. If the DJI had closed 25 points lower,
there would have been no Sell S9-V.
S9-Vs occurring with the P-Indicator still quite positive have been reliably
bearish.
Below are the 6 instances in the last 30 years. Five brought tradeable declines.
You may want to count the 2011 S9-Vs as a single occurrent. Either way,
the odds of a DJI drop to the lower band after a small additional advance are 80%
if we trust Peerless. But Peerless has a difficult time keeping up when the
FED's suddenly turns "dovish" and the DJI becomes very bullish.
Accordingly,
move
slowly now on account of Peerless.
S9-Vs with Positive PI since 1980
Date LA/MA V-I
P-I Result
-----------------------------------------------------------------------
7/13/2007 1.026 -15
+192 Peerless
trading gain 4.4%
Maximun Paper loss of 0.7%
------------------------------------------------------------------------
7/26/2010 1.041 -11
+442 Peerless
trading gain 2.6%
Maximun Paper loss of 1.5%
------------------------------------------------------------------------
7/5/2011 1.037 -48
+239 Peerless
trading gain 8.6%
Maximun Paper loss of 1.0%
------------------------------------------------------------------------
7/21/2011 1.025 -51
+269 Peerless
trading gain 9.8%
Maximun Paper loss of 1.0%
------------------------------------------------------------------------
7/11/2013 1.025 -25
+258 Peerless
trading gain 3.2%
Maximun Paper loss of 1.3%
------------------------------------------------------------------------
7/15/2020 1.035 -134
+138 Peerless trading loss =
2.1%
Maximun Paper loss of 2.1%
------------------------------------------------------------------------
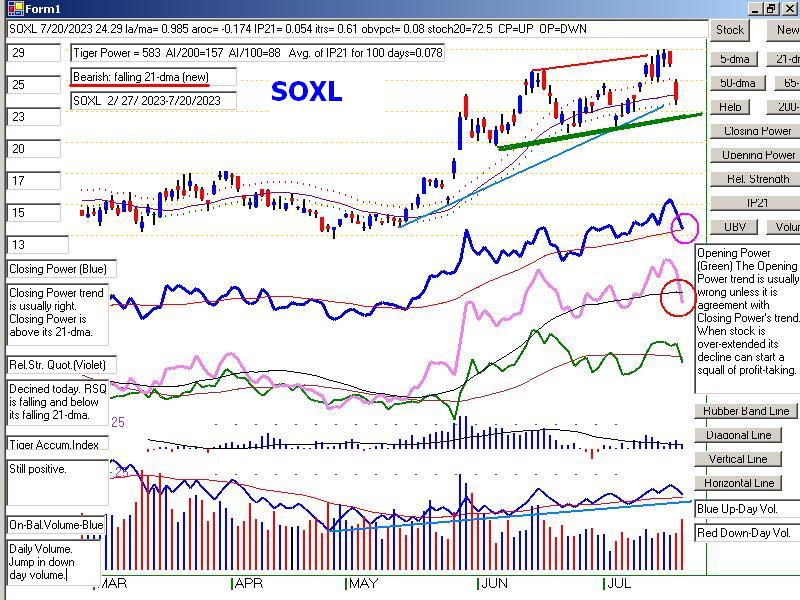
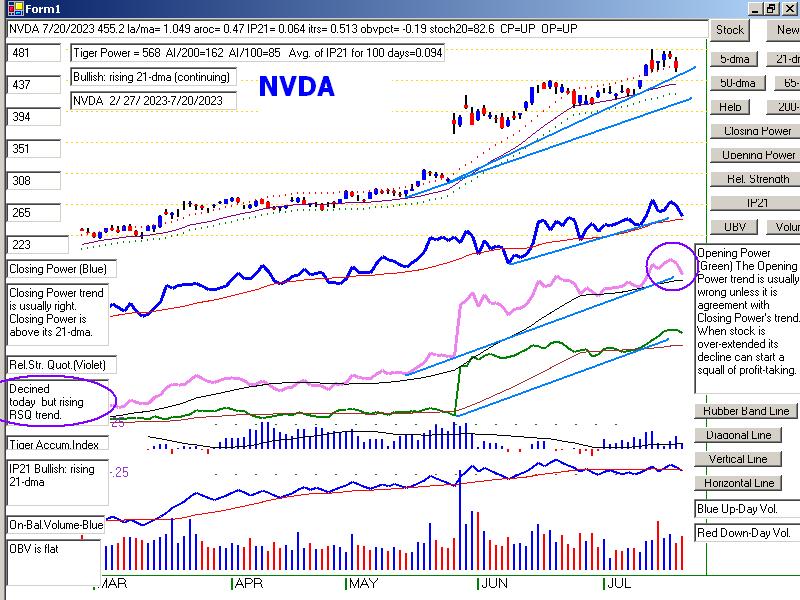
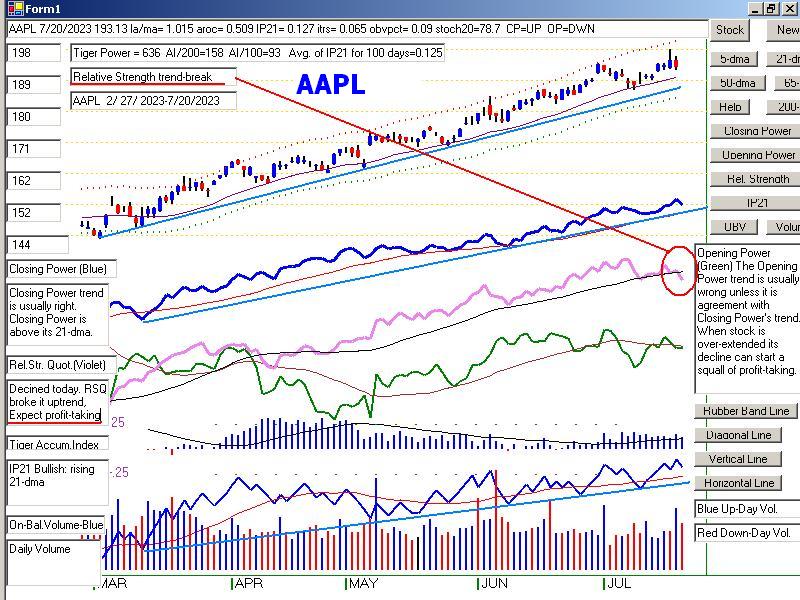
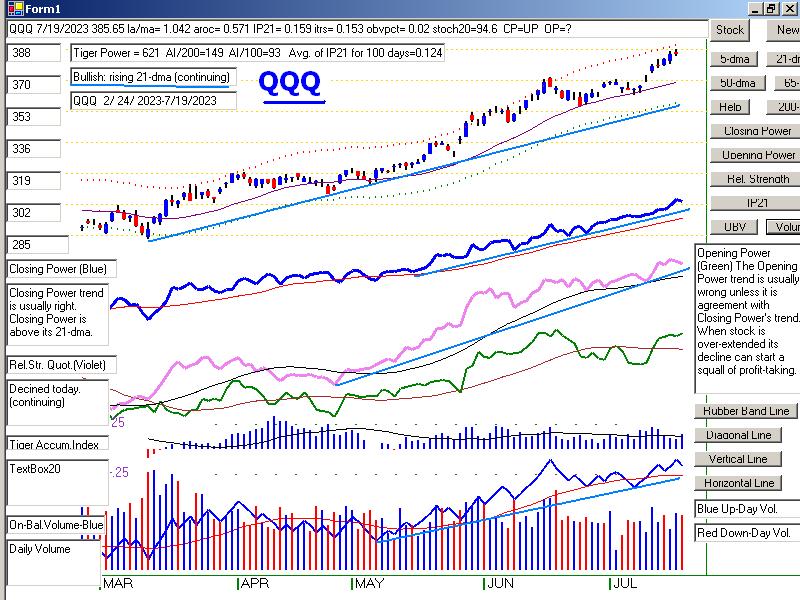
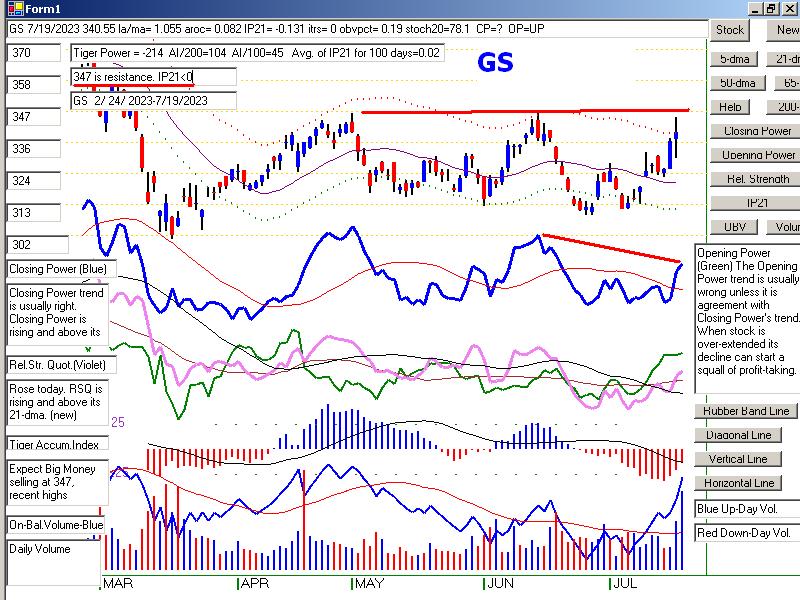
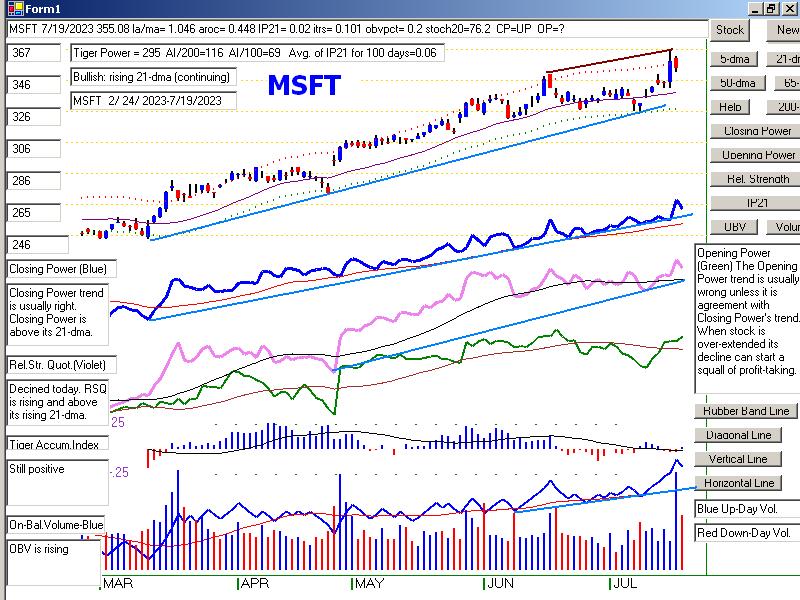
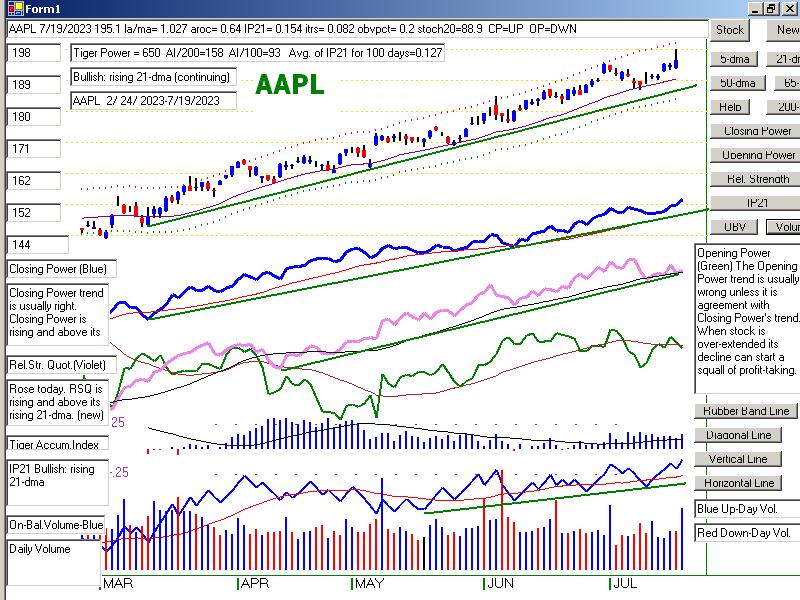
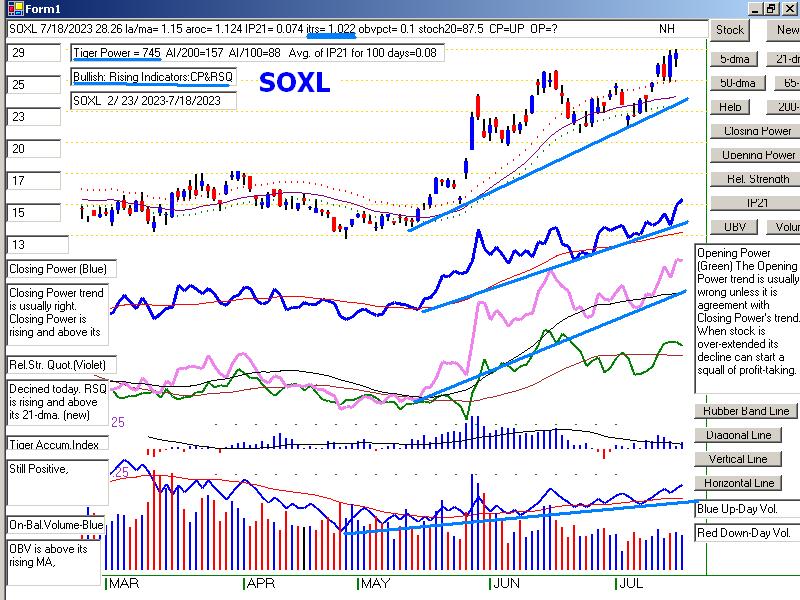
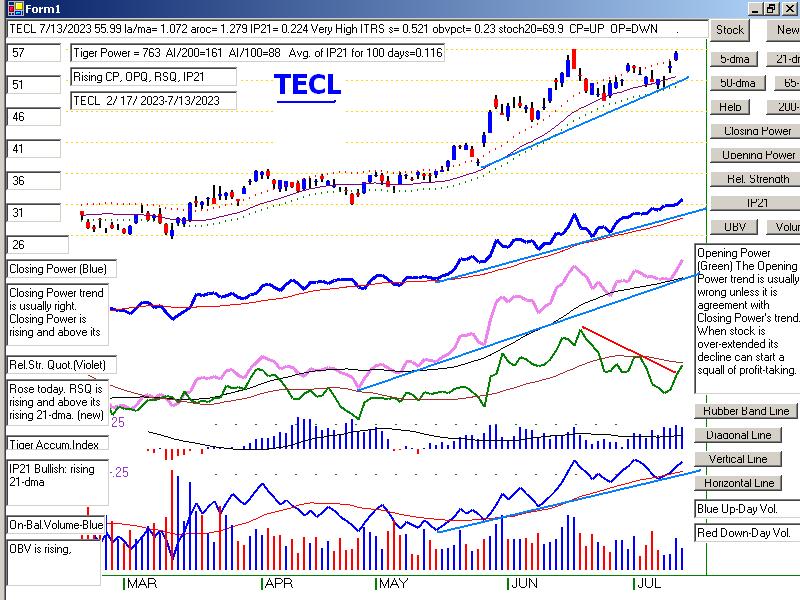
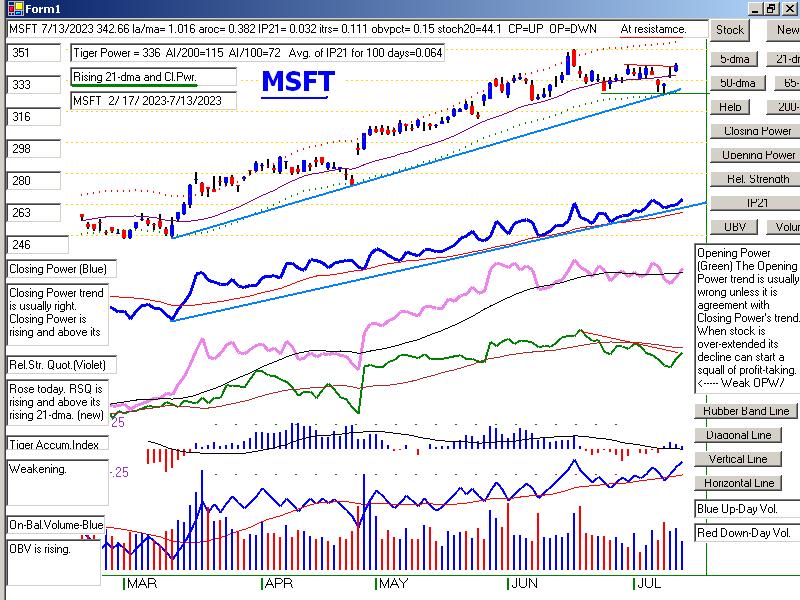
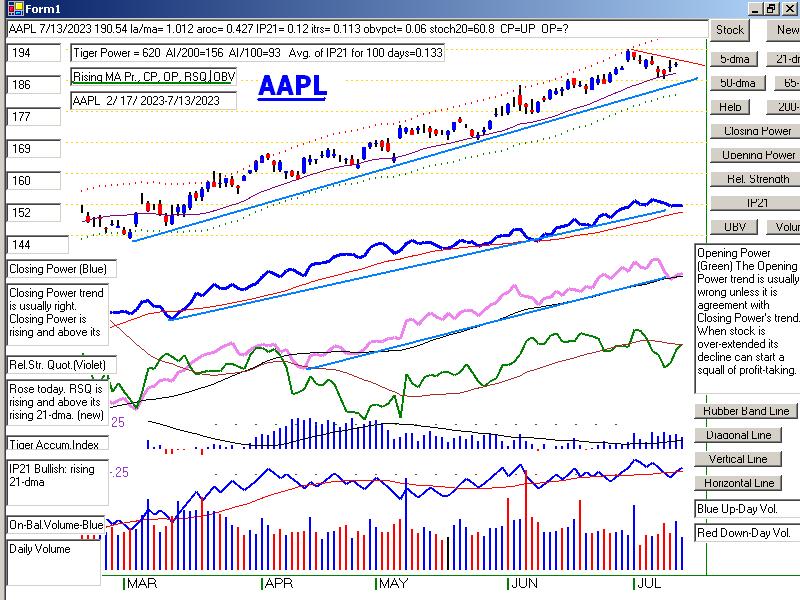
What to do about the weak techs? First, expect profit-taking after a red
candle-stick followed by a Relative Strength Quotient trend-break. Where
the IP21-Accumulation Index is negative, a deeper decline often follows.
Where the IP21 is clearly positive, look for a recovery from support like
the 21-day or at rising uptrend-lines. Where the IP21 is dropping and
drooping, support will not be so forthcoming. Look at the charts shown
below and see how they fared this past year when their Rel Str. Quotient
uptrend-lines were broken.
Given the Sell S9-V, it will probably be best to take trading profits on
a recovery in QQQ and SOXL late Friday. We cannot know how they
will react to the re-balancing do be done on the QQQ on Monday.
There are too few bearish MINCPs to recommend any shorting just
now. Note also that the DJI is apt to find good support at 34700-34800
because of its recent breakout above well-tested resistance.
|
|
| |
7/20/2023
2022 PEERLESS DJI, Signals, Indicators Daily DJI Volume
10-DayUp/Down Vol Stoch-20 CCI RSI Pct of All Stocks above 65-dma
Inverted Traders Index
DJI-IPA DJI-OBV Short-Term Rates
NASDAQ S&P OEX NYSE DJ-15 DJ-20 DJI-30
Tiger Index of Big
Banks Bond
Funds Gold Stocks
Housing Stocks
Insurance-Stocks
Regional Banks
Russell-1000
Semi Conductors
2006 vers-Peerless is no loner
vailable. Sorry. It is giving an error message and
without the code cannot be fixed.
ETFs: DIA QQQ SPY IWM MDY
TNA Short-Term Rates Ten Year Rates PST (Short Treasuries)
DOLLAR-UUP
ALLSTOCKs
COIN (Bit
Coin ETF)
USO-CrudeOil DBO
BLDP FAS GLD HD IBB JETS JNUG KOL NAIL NUGT
NRGU OIH PALL RSX RETL SDS AGQ SLV SOXL TAN TECL TLT TMF TNA
UGA USO China: YINN CHAU
Commodities: CANE COCO CORN DBC JJC, NIB CORN, CUT (paper)
MOO, NRGU
SOYB WEAT UUP (Dollar) LIT
(Lithium) PALL
(Palladium)
Stocks
AA AAPL ADBE ALXN AMAT AMGN AMD AMZN ANET AXON AXP
BA BABA BAC BIDU BLDP BSX CAT CDNS CHKP CNX CPB CRM CVX CMG
DE DIS ENPH FB FSLR FTNT GILD GME GOOG GS HD IBM INTU JPM KO KR
LRCX MRK MRNA MOS MSFT NEM NFLX NKE NOC NUE NVDA PANW PG PYPL
QCOM QDEL REGN REV RE SCHW SNOW SO SQUARE TSLA TXN XOM V VRTX
WFC WMT XLE ZM ZOM
Biggest SEMI-Condctors in SOXL: NVDA. AVGO, AMD. INTC TXN MCHP NXPI AMAT ON
HOMEBUILDERS:
NAIL
BZH HOV MHO MTH PHM -
REGIONAL BANKS:
EGBN FFIC GBCI HMST
Carl Icahn and associates: IEP
MS JEF
Leveraged Short ETFs:
FAZ - financials, TZA and SRTY- small caps, MZZ - mid caps, TECS -Techs,
SOXS -
semi-conductors LABD
- Biotechs
Bullish MAXCPs http://tigersoftware.com/upping/7-20-2023/Bullish.htm
Bearish MINCPs www.tigersoftware.com/downing/7-20-2023/Bearish.htm |
|
 |
 |
 |
 |
 |
 |
 |
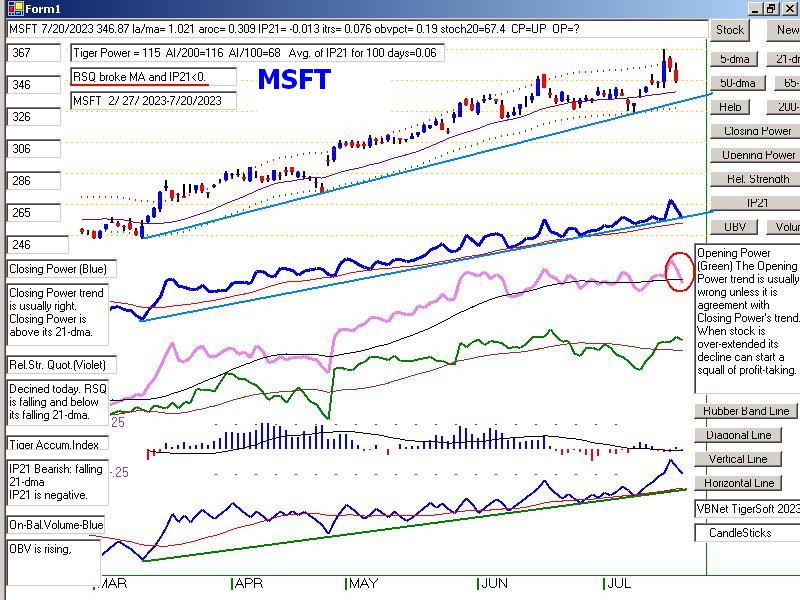 |
Table 1 - Daily Breadth and Volume Statistics
| NYSE |
Latest
Close |
Previous
Close |
Week
Ago |
| Issues
traded |
3,032 |
3,047 |
3,045 |
| Advances |
1,231 |
1,919 |
2,061 |
| Declines |
1,694 |
1,018 |
876 |
| Unchanged |
107 |
110 |
108 |
| New
highs |
101 |
162 |
173 |
| New
lows |
10 |
8 |
12 |
| Adv.
volume* |
374,018,282 |
601,213,769 |
579,837,448 |
| Decl.
volume* |
434,467,987 |
273,380,159 |
224,471,779 |
| Total
volume* |
818,780,646 |
891,256,922 |
828,429,787 |
| Closing
Arms (TRIN)† |
0.94 |
0.88 |
0.94 |
| Block
trades* |
3,983 |
4,408 |
4,024 |
| Adv.
volume |
1,613,881,444 |
2,746,262,010 |
2,652,391,667 |
| Decl.
volume |
2,077,935,040 |
1,275,202,033 |
1,060,100,661 |
| Total
volume |
3,761,773,015 |
4,115,674,912 |
3,839,532,858 |
| NASDAQ |
Latest
Close |
Previous
Close |
Week
Ago |
| Issues
traded |
4,555 |
4,606 |
4,613 |
| Advances |
1,521 |
2,500 |
2,904 |
| Declines |
2,863 |
1,900 |
1,523 |
| Unchanged |
171 |
206 |
186 |
| New
highs |
87 |
266 |
272 |
| New
lows |
74 |
70 |
47 |
| Closing
Arms (TRIN)† |
1.24 |
0.93 |
0.68 |
| Block
trades |
33,699 |
35,941 |
37,524 |
| Adv.
volume |
1,525,825,256 |
2,835,398,574 |
3,797,678,953 |
| Decl.
volume |
3,562,663,475 |
1,999,646,848 |
1,344,514,178 |
| Total
volume |
5,128,028,439 |
5,112,427,542 |
5,183,568,173 |
|
Table 2 QUICKSILVER on ETFS - 7/20/2023 ---
Bullish = 6 (-4) MDY, FAS, RETL, SOXL (+665), TECL (+.584), OIH (.575)
Bearish = 1 UUP
ETF CLOSE CHANGE PIVOT-PT 5-dma AROC CL-PWR CANDLE IP21 ITRS POWER INDEX
==================================================================================================
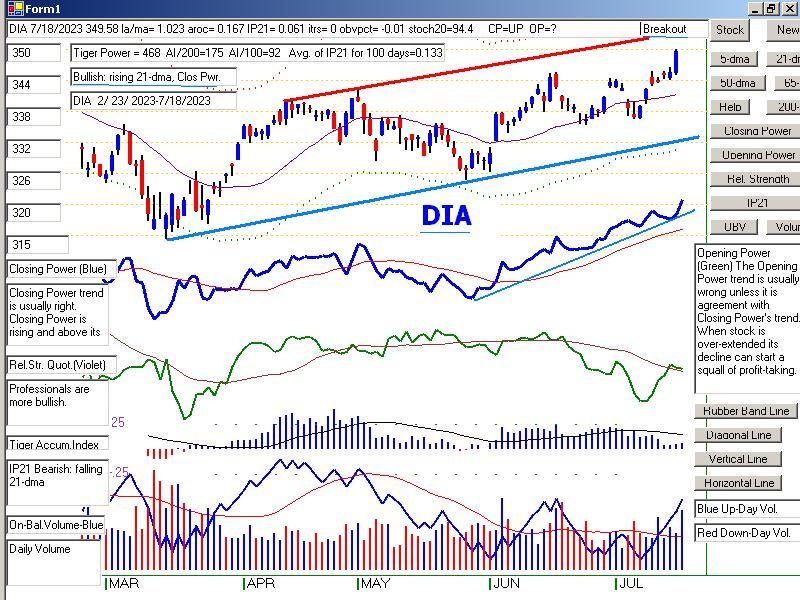
DIA 352.43 1.74 345.17 122.6% Bullish BLUE .055 0 ------
---------------------------------------------------------------------------------------------
COMPQX 14063.31 -294.71 14113.7 -26.4% Bullish RED .133 .099 .232
---------------------------------------------------------------------------------------------
SPY 452.18 -3.02 449.28 29% Bullish RED .148 .047 .195
---------------------------------------------------------------------------------------------
QQQ 376.76 -8.89 379.07 -31.2% Bullish RED .087 .116 .203
---------------------------------------------------------------------------------------------
MDY 494.88 -2.79 487.89 22.4% Bullish RED .202 .056 .258
---------------------------------------------------------------------------------------------
IWM 195.08 -1.72 191.53 42.7% Bullish RED .076 .073 .149
---------------------------------------------------------------------------------------------
FAS 72.93 1.42 66.35 377.4% Bullish BLUE .264 .214 .478
---------------------------------------------------------------------------------------------
RETL 7.98 -.29 7.45 199.7% Bullish RED .224 .17 .394
---------------------------------------------------------------------------------------------
SOXL 24.29 -3 26.23 -545.1% Bullish RED .055 .61 .665
---------------------------------------------------------------------------------------------
TECL 55.7 -3.61 55.67 -25.1% Bullish RED .109 .475 .584
---------------------------------------------------------------------------------------------
IBB 130.26 -.15 128.24 75.9% Bullish RED -.036 -.053 -.089
---------------------------------------------------------------------------------------------
GLD 182.74 -.93 181.43 20% Bearish RED -.033 -.075 -.108
---------------------------------------------------------------------------------------------
DBO 15.07 .06 14.92 -63.4% ------- RED .216 .021 .237
---------------------------------------------------------------------------------------------
OIH 329.1 -1.72 320.67 48.7% Bullish RED .368 .207 .575
---------------------------------------------------------------------------------------------
CPER 23.65 .1 24.2 -148.6% Bullish RED .19 -.066 .124
---------------------------------------------------------------------------------------------
TAN 71.44 -1.57 70.72 -46.9% Bullish RED -.042 -.027 -.069
---------------------------------------------------------------------------------------------
UUP 27.88 .16 27.62 56.1% Bearish BLUE -.225 -.042 -.267
---------------------------------------------------------------------------------------------
CORN 24.35 -.24 23.16 367.5% Bearish RED -.042 -.016 -.058
---------------------------------------------------------------------------------------------
WEAT 7.1 -.01 6.56 534.5% Bearish RED -.107 .034 -.073
---------------------------------------------------------------------------------------------
YINN 35.1 -.39 37.98 -672.5% Bullish BLUE .134 -.236 -.102
|
 Table 3      RANKING OF KEY DIRECTORIES BASED PCT.OF STOCKS ABOVE 65-DMA
              7/20/23
 Bullish = 44
 Bearish = 3
---------------------------------------------------------------------------------------
Directory     Current       day-1         day-2         day-3         day-4         day-5
----------------------------------------------------------------------------------------
BIGBANKS       1             1             1             .714          .714          1
COAL           1             .666          .5            .5            .5            .5
HOMEBLDG       1             1             1             .964          .964          1
TRANSP         1             1             .947          .947          .947          1
REGBANKS       .947          .947          .947          .842          .736          .894
GUNS           .928          .785          .785          .785          .785          .785
FINANCE        .9            .912          .9            .837          .8            .837
INSURANC       .88           .64           .64           .6            .48           .52
INFRA          .87           .87           .806          .806          .838          .935
NIFTY          .863          .84           .84           .909          .84           .954
COPPER         .857          1             1             .857          1             1
AUTO           .849          .867          .849          .83           .867          .867
DJI-13         .846          .692          .692          .538          .461          .538
JETS           .846          .846          .846          .846          .846          .846
ETFS           .836          .854          .818          .836          .836          .872
FIDSTKS        .822          .751          .739          .721          .745          .786
RUS-1000       .821          .806          .77           .753          .758          .795
OILGAS         .814          .762          .773          .67           .68           .814
SP500          .812          .771          .743          .727          .747          .792
NASD-100       .811          .801          .782          .792          .801          .801
SP-100         .811          .722          .7            .655          .677          .744
HIGHPRIC       .809          .818          .809          .792          .783          .779
INDEXES        .805          .783          .794          .751          .762          .778
RETAIL         .804          .782          .782          .76           .739          .804
COMODITY       .8            .775          .7            .625          .65           .65
-------------------------------------------------------------------------------------------------
REIT           .795          .844          .819          .811          .819          .877
UTILITY        .794          .538          .41           .435          .564          .641
INDMATER       .791          .777          .75           .694          .694          .708
CHEM           .79           .767          .744          .697          .674          .744
SEMI           .782          .847          .847          .847          .804          .88
BONDFUND       .77           .827          .747          .655          .586          .712
HOSPITAL       .769          .769          .769          .615          .692          .692
MILITARY       .769          .692          .653          .73           .692          .769
SOFTWARE       .767          .785          .767          .767          .732          .785
DOWJONES       .766          .666          .666          .566          .533          .6
COMPUTER       .75           .75           .75           .8            .8            .85
ELECTRON       .744          .781          .766          .751          .729          .789
GAMING         .736          .736          .684          .684          .631          .736
EAT            .731          .78           .756          .682          .756          .78
BEVERAGE       .714          .571          .357          .5            .642          .428
FOOD           .714          .693          .673          .591          .632          .632
SOLAR          .687          .687          .687          .687          .437          .687
GREEN          .666          .666          .722          .666          .555          .666
==================================================================================================
EDU            .5            .5            .333          .166          .166          .166
HACKERS        .5            .5            .437          .437          .437          .625
MARIJUAN       .5            .5            .4            .4            .3            .5
==================================================================================================
BIOTECH        .484          .492          .479          .459          .426          .454
LOWPRICE       .469          .466          .454          .422          .413          .495
GOLD           .466          .755          .755          .466          .4            .4
CHINA          .341          .341          .365          .439          .463          .56
|
=================================================================================
Thursday
- 6:08 AM - 7/20/2023 - DJI
Futures +18 NASDAQ Futures -100 Data
Used - 7/19/2023
| |
|
|
| |
The DJI is now above the psychological resistance of 35000. It did this
in part
because Professionals believe the FED has become more dovish
as a result
of falling inflation numbers and the coming resignation of St.Louis
Regional
Fed Chairman Ballard (the super hawk on the FOMC). It also made
its
breakout in no small measure because of how easily Professionals
can
minipulate the DJI, as they please.
We may not
like it, but we can better trade by watching them and seeing what
they are
tryng to accomplish. Thus, it is significant how easily they ran
up the
highest priced DJI-30 stock, UNH, when they were ready for a
breakout in
the DJI. UNH jumped up 54 points this last week. This had
the effect
of raising the DJI by 362 points. all by itelf.
Professionals run the market to make more money. That the Closing Powers
of DIA,
SPY, QQQ, he NASDAQ, TECL, SOXL are all now rising tells
us what to
do. While this is true, stay long the techs, NVDA and SOXL.
Any retreat
is apt to be minor. As for the DJI, it has achieved a flat-topped
breakout
with confirming breadth. This is more important than the volume
non-confirmations. The target now for the DJI is its old highs near 37000.
|
|
| |
7/19/2023
2022 PEERLESS DJI, Signals, Indicators Daily DJI Volume
10-DayUp/Down Vol Stoch-20 CCI RSI Pct of All Stocks above 65-dma
Inverted Traders Index
DJI-IPA DJI-OBV Short-Term Rates
NASDAQ S&P OEX NYSE DJ-15 DJ-20 DJI-30
Tiger Index of Big
Banks Bond
Funds Gold Stocks
Housing Stocks
Insurance-Stocks
Regional Banks
Russell-1000
Semi Conductors
Recent 2006 vers-Peerless signals http://tigersoftware.com/oldpeer/UPD90719.bmp
Note the old Buy "b" trading signals. They are not safe to use when
A/D Line
is below its 21-dma: See OLD06
OLD0607
OLD07 OLD0708 OLD08 OLD0809
ETFs: DIA QQQ SPY IWM MDY
TNA Short-Term Rates Ten Year Rates PST (Short Treasuries)
DOLLAR-UUP
ALLSTOCKs
COIN (Bit
Coin ETF)
USO-CrudeOil DBO
BLDP FAS GLD HD IBB JETS JNUG KOL NAIL NUGT
NRGU OIH PALL RSX RETL SDS AGQ SLV SOXL TAN TECL TLT TMF TNA
UGA USO China: YINN CHAU
Commodities: CANE CORN DBC JJC, NIB CORN, CUT (paper)
MOO, NRGU
SOYB WEAT UUP (Dollar) LIT
(Lithium) PALL
(Palladium)
Stocks
AA AAPL ADBE ALXN AMAT AMGN AMD AMZN ANET AXON AXP
BA BABA BAC BIDU BLDP BSX CAT CDNS CHKP CNX CPB CRM CVX CMG
DE DIS ENPH FB FSLR FTNT GILD GME GOOG GS HD IBM INTU JPM KO KR
LRCX MRK MRNA MOS MSFT NEM NFLX NKE NOC NUE NVDA PANW PG PYPL
QCOM QDEL REGN REV RE SCHW SNOW SO SQUARE TSLA TXN XOM V VRTX
WFC WMT XLE ZM ZOM
HOMEBUILDERS:
NAIL
BZH HOV MHO MTH PHM -
REGIONAL BANKS: EGBN FFIC GBCI HMST
Carl Icahn and
associates: IEP MS JEF
Leveraged Short ETFs:
FAZ - financials, TZA and SRTY- small caps, MZZ - mid caps, TECS -Techs,
SOXS -
semi-conductors LABD
- Biotechs
Bullish MAXCPs http://tigersoftware.com/upping/7-19-2023/Bullish.htm
Bearish MINCPs www.tigersoftware.com/downing/7-19-2023/Bearish.htm |
|
 |
 |
 |
 |
SOXL
 |
 |
 |
 |
 |
| NYSE |
Latest
Close |
Previous
Close |
Week
Ago |
| Issues
traded |
3,047 |
3,047 |
3,036 |
| Advances |
1,919 |
2,103 |
2,136 |
| Declines |
1,018 |
844 |
816 |
| Unchanged |
110 |
100 |
84 |
| New
highs |
162 |
202 |
216 |
| New
lows |
8 |
16 |
10 |
| Adv.
volume* |
601,213,769 |
609,465,260 |
592,978,611 |
| Decl.
volume* |
273,380,159 |
255,738,251 |
276,313,291 |
| Total
volume* |
891,256,922 |
871,986,575 |
874,027,340 |
| Closing
Arms (TRIN)† |
0.88 |
1.09 |
1.13 |
| Block
trades* |
4,408 |
4,272 |
4,211 |
| Adv.
volume |
2,746,262,010 |
2,820,658,461 |
2,723,590,320 |
| Decl.
volume |
1,275,202,033 |
1,236,988,333 |
1,174,341,830 |
| Total
volume |
4,115,674,912 |
4,090,019,323 |
3,920,298,203 |
| NASDAQ |
Latest
Close |
Previous
Close |
Week
Ago |
| Issues
traded |
4,606 |
4,569 |
4,573 |
| Advances |
2,500 |
2,692 |
2,893 |
| Declines |
1,900 |
1,689 |
1,506 |
| Unchanged |
206 |
188 |
174 |
| New
highs |
266 |
270 |
225 |
| New
lows |
70 |
99 |
52 |
| Closing
Arms (TRIN)† |
0.93 |
0.94 |
1.14 |
| Block
trades |
35,941 |
32,800 |
37,679 |
| Adv.
volume |
2,835,398,574 |
2,994,646,327 |
3,236,162,650 |
| Decl.
volume |
1,999,646,848 |
1,769,899,690 |
1,918,434,775 |
| Total
volume |
5,112,427,542 |
4,824,073,039 |
5,230,624,543 |
|
Table 2 QUICKSILVER on ETFS - 7/19/2023 ---
     Bullish = 10   COMPQX, SPY, QQQ, MDY, FAS, RETL, SOXL (+.937), TECL (+.732), DBO, OIH
                                           -------------
     Bearish = 1   UUP
ETF       CLOSE     CHANGE    PIVOT-PT  5-dma AROC    CL-PWR  CANDLE  IP21    ITRS  POWER INDEX
==================================================================================================
DIA       350.69   1.11      343.92        102.1%     Bullish  BLUE   .072    0        -----
---------------------------------------------------------------------------------------------
COMPQX    14358.02   4.38    14138.57      155.1%     Bullish  RED    .192    .132     .324
---------------------------------------------------------------------------------------------
SPY       455.2   1.01       449.56        102%       Bullish  BLUE   .188    .062     .25
---------------------------------------------------------------------------------------------
QQQ       385.65  -.09       379.15        168.9%     Bullish  RED    .159    .153     .312
---------------------------------------------------------------------------------------------
MDY       497.67   1.66      492.67        76.5%      Bullish  ----   .235    .066     .301
---------------------------------------------------------------------------------------------
IWM       196.8   .83        193.42        127.5%     Bullish  BLUE   .119    .087     .206
---------------------------------------------------------------------------------------------
FAS       71.51   .84        67.73         326.4%     Bullish  BLUE   .216    .205     .421
---------------------------------------------------------------------------------------------
RETL      8.27   .44         7.67          247.3%     Bullish  BLUE   .242    .243     .485
---------------------------------------------------------------------------------------------
SOXL      27.29  -.97        27.28         295.2%     Bullish  RED    .092    .845     .937
---------------------------------------------------------------------------------------------
TECL      59.31  -.47        55.99         475.8%     Bullish  RED    .154    .578     .732
---------------------------------------------------------------------------------------------
IBB       130.41   .69       128.3         95.2%      Bullish  BLUE   .014   -.053    -.039
---------------------------------------------------------------------------------------------
GLD       183.67   .03       182.01        49.1%      Bearish  BLUE   .008   -.062    -.054
---------------------------------------------------------------------------------------------
DBO       15.01  -.02        15.26         6.7%       -------  RED    .252    .044     .296
---------------------------------------------------------------------------------------------
OIH       330.82  -.67       325.92        108.1%     Bullish  BLUE   .391    .223     .614
---------------------------------------------------------------------------------------------
CPER     23.55  -.1          24.36        -46%        -------  BLUE   .233   -.057     .176
---------------------------------------------------------------------------------------------
TAN     73.01   .12          72.12         117.2%     Bullish  RED   -.057   -.002    -.059
---------------------------------------------------------------------------------------------
UUP       27.72   .11        27.57        -7.2%       Bearish  ----  -.317   -.039    -.356
---------------------------------------------------------------------------------------------
CORN      24.59   .75        22.63         603.9%     Bearish  RED   -.011   -.007    -.018
---------------------------------------------------------------------------------------------
WEAT      7.11   .46         6.39          617.1%     Bearish  BLUE  -.034    .034     0
---------------------------------------------------------------------------------------------
YINN      35.49   .59        40.1         -280.6%     Bullish  RED    .072   -.2      -.128
|
 Table 3    RANKING OF KEY DIRECTORIES BASED PCT.OF STOCKS ABOVE 65-DMA
            7/19/23
 Bullish = 44
 Bearish = 3
---------------------------------------------------------------------------------------
Directory     Current       day-1         day-2         day-3         day-4         day-5
----------------------------------------------------------------------------------------
BIGBANKS       1             1             .714          .714          1             .857
COPPER         1             1             .857          1             1             .857
HOMEBLDG       1             1             .964          .964          1             1
TRANSP         1             .947          .947          .947          1             1
REGBANKS       .947          .947          .842          .736          .894          .736
FINANCE        .912          .9            .837          .787          .837          .762
INFRA          .87           .806          .806          .838          .935          .806
AUTO           .867          .867          .83           .867          .867          .849
ETFS           .854          .818          .836          .836          .89           .763
JETS           .846          .846          .846          .846          .846          .846
SEMI           .846          .846          .846          .802          .868          .835
REIT           .844          .811          .819          .827          .868          .86
NIFTY          .84           .84           .909          .84           .954          .909
BONDFUND       .827          .735          .655          .597          .712          .586
HIGHPRIC       .818          .809          .792          .783          .779          .766
RUS-1000       .806          .77           .753          .758          .79           .779
NASD-100       .801          .782          .792          .801          .792          .772
GUNS           .785          .785          .785          .785          .785          .785
SOFTWARE       .785          .785          .767          .732          .767          .732
INDEXES        .783          .794          .751          .762          .778          .74
RETAIL         .782          .782          .76           .739          .782          .782
ELECTRON       .781          .766          .751          .729          .781          .766
EAT            .78           .756          .682          .756          .78           .756
INDMATER       .777          .75           .694          .694          .708          .68
COMODITY       .775          .725          .6            .65           .65           .55
SP500          .771          .743          .727          .745          .79           .763
HOSPITAL       .769          .769          .615          .692          .692          .615
CHEM           .767          .744          .697          .674          .744          .767
OILGAS         .762          .773          .67           .68           .814          .773
GOLD           .755          .755          .466          .4            .355          .333
FIDSTKS        .751          .739          .721          .745          .786          .775
COMPUTER       .75           .75           .8            .8            .85           .85
GAMING         .736          .684          .631          .684          .736          .736
SP-100         .722          .7            .655          .677          .744          .711
FOOD           .693          .693          .571          .632          .632          .53
DJI-13         .692          .692          .538          .461          .538          .538
MILITARY       .692          .653          .73           .692          .769          .769
SOLAR          .687          .687          .687          .437          .625          .437
COAL           .666          .5            .5            .5            .5            .5
DOWJONES       .666          .666          .566          .533          .6            .6
GREEN          .666          .722          .666          .555          .666          .611
INSURANC       .64           .64           .6            .48           .52           .52
BEVERAGE       .571          .357          .5            .642          .428          .357
UTILITY        .538          .41           .435          .564          .641          .564
=================================================================================================
EDU            .5            .333          .166          .166          .166          .166
HACKERS        .5            .437          .437          .437          .625          .625
MARIJUAN       .5            .4            .4            .3            .5            .4
=================================================================================================
BIOTECH        .489          .477          .461          .426          .454          .459
LOWPRICE       .466          .457          .425          .413          .48           .448
CHINA          .341          .365          .439          .463          .56           .463
|
===================================================================================
Wednesday - 6:03
AM - 7/19/2023 - DJI Futures +1
NASDAQ Futures +34 Data
Used - 7/18/2023
| |
7/18/2023
|
|
| |
Market Comments
Give the DJI more time to get above the psychological resistance at 35000.
It turns out that the Peerless system is pretty smart. We did not get a Sell S9-v
or an S12 signal on the 18th because the P-Indicator was not below +199.
(You can prove this if you have the programs. If you change the declines for
18th from 844 to 2103, then the P-I falls to 198 and a S9V occurs.)
Breadth at the current levels outweighs volume as measured by the V-Indicator,
IP21 and OBVPct. The DJI may be the forgotten index, while the NASDAQ, SPY,
QQQ, TECL, SOXL and many tech stocks roar higher. But that does not mean
those who are loyal to the blue chips are willing to sell them. After all, what
choice
do they have. 10-Year Treasury bonds now yield less than 3.8%, hardly keeping
pace with inflation.
Meanwhile, the Closing Power uptrends show us how bullish Professionals
are and how confident they are that the FED will not dare raise rates much higher
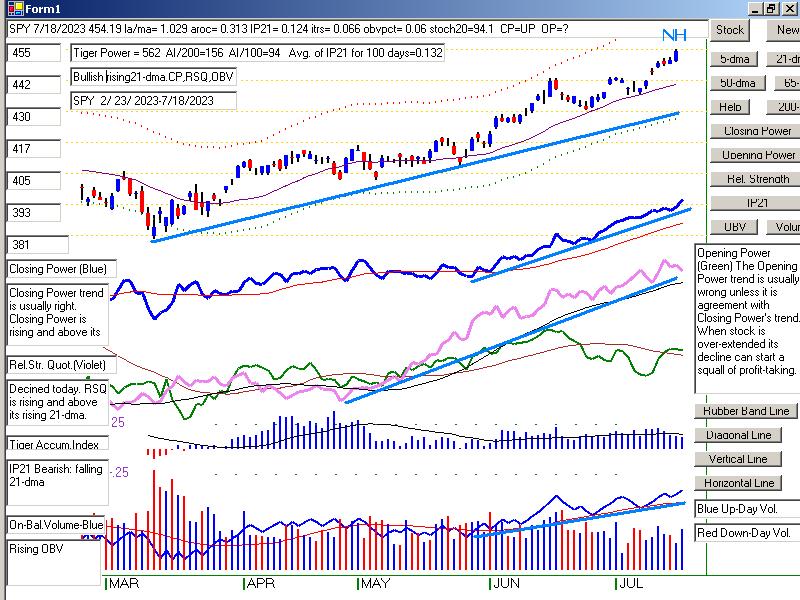
with Inflation falling and down to 3%. The Relative Strength and Power Index
Lines show us where to put money, as it's usually a very good idea to bet on
"the first out of the gate" when a new bull market starts. I've seen this
strategy
work time after time, 1967, 1970, 1975, 1983, 1993-5, 2009 and 2020.
Stay long the strong. Their charts are shown below. The recovery in bank
stocks, including regional banks, shows us that bulls are now betting confidently
against the remaining "hawks" on the FOMC.
|
|
| |
7/18/2023
2022 PEERLESS DJI, Signals, Indicators Daily DJI Volume
10-DayUp/Down Vol Stoch-20 CCI RSI Pct of All Stocks above 65-dma
Inverted Traders Index
DJI-IPA DJI-OBV Short-Term Rates
NASDAQ S&P OEX NYSE DJ-15 DJ-20 DJI-30
Tiger Index of Big
Banks Bond
Funds Gold Stocks
Housing Stocks
Insurance-Stocks
Regional Banks
Russell-1000
Semi Conductors
Recent 2006 vers-Peerless signals http://tigersoftware.com/oldpeer/UPD90718.bmp
Note the old Buy "b" trading signals. They are not safe to use when
A/D Line
is below its 21-dma: See OLD06
OLD0607
OLD07 OLD0708 OLD08 OLD0809
ETFs: DIA QQQ SPY IWM MDY
TNA Short-Term Rates Ten Year Rates PST (Short Treasuries)
DOLLAR-UUP
ALLSTOCKs
COIN (Bit
Coin ETF)
USO-CrudeOil DBO
BLDP FAS GLD HD IBB JETS JNUG KOL NAIL NUGT
NRGU OIH PALL RSX RETL SDS AGQ SLV SOXL TAN TECL TLT TMF TNA
UGA USO China: YINN CHAU
Commodities: CANE CORN DBC JJC, NIB CORN, CUT (paper)
MOO, NRGU
SOYB WEAT UUP (Dollar) LIT
(Lithium) PALL
(Palladium)
Stocks
AA AAPL ADBE ALXN AMAT AMGN AMD AMZN ANET AXON AXP
BA BABA BAC BIDU BLDP BSX CAT CDNS CHKP CNX CPB CRM CVX CMG
DE DIS ENPH FB FSLR FTNT GILD GME GOOG GS HD IBM INTU JPM KO KR
LRCX MRK MRNA MOS MSFT NEM NFLX NKE NOC NUE NVDA PANW PG PYPL
QCOM QDEL REGN REV RE SCHW SNOW SO SQUARE TSLA TXN XOM V VRTX
WFC WMT XLE ZM ZOM
HOMEBUILDERS:
NAIL
BZH HOV MHO MTH PHM -
REGIONAL BANKS: EGBN FFIC GBCI HMST
Carl Icahn and
associates: IEP MS JEF
Leveraged Short ETFs:
FAZ - financials, TZA and SRTY- small caps, MZZ - mid caps, TECS -Techs,
SOXS -
semi-conductors LABD
- Biotechs
Bullish MAXCPs http://tigersoftware.com/upping/7-18-2023/Bullish.htm
Bearish MINCPs www.tigersoftware.com/downing/7-18-2023/Bearish.htm |
|
 |
 |
 |
 |
 |
 |
 |
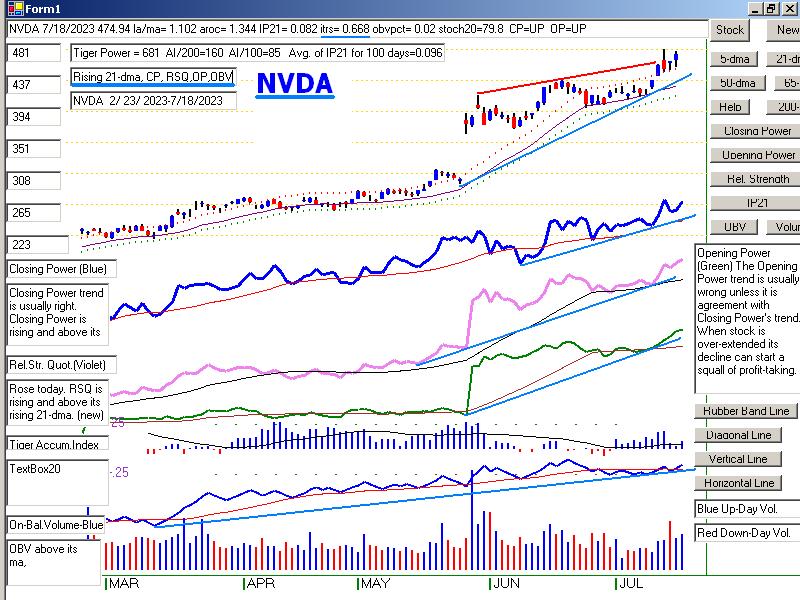 |
Table 1 - Daily Breadth and Volume Statistics
| NYSE |
Latest
Close |
Previous
Close |
Week
Ago |
| Issues
traded |
3,047 |
3,056 |
3,053 |
| Advances |
2,103 |
1,664 |
2,280 |
| Declines |
844 |
1,292 |
691 |
| Unchanged |
100 |
100 |
82 |
| New
highs |
202 |
138 |
148 |
| New
lows |
16 |
21 |
9 |
| Adv.
volume* |
609,465,260 |
432,212,756 |
652,194,837 |
| Decl.
volume* |
255,738,251 |
335,480,786 |
129,979,169 |
| Total
volume* |
871,986,575 |
778,422,041 |
788,659,326 |
| Closing
Arms (TRIN)† |
1.09 |
1.08 |
0.72 |
| Block
trades* |
4,272 |
3,890 |
3,950 |
| Adv.
volume |
2,820,658,461 |
1,887,344,319 |
2,953,533,165 |
| Decl.
volume |
1,236,988,333 |
1,589,469,089 |
642,296,447 |
| Total
volume |
4,090,019,323 |
3,538,242,953 |
3,624,223,769 |
| NASDAQ |
Latest
Close |
Previous
Close |
Week
Ago |
| Issues
traded |
4,569 |
4,524 |
4,572 |
| Advances |
2,692 |
2,765 |
2,807 |
| Declines |
1,689 |
1,599 |
1,570 |
| Unchanged |
188 |
160 |
195 |
| New
highs |
270 |
221 |
136 |
| New
lows |
99 |
88 |
49 |
| Closing
Arms (TRIN)† |
0.94 |
1.02 |
0.89 |
| Block
trades |
32,800 |
31,697 |
34,532 |
| Adv.
volume |
2,994,646,327 |
2,864,323,061 |
3,207,190,850 |
| Decl.
volume |
1,769,899,690 |
1,682,088,984 |
1,594,047,668 |
| Total
volume |
4,824,073,039 |
4,593,167,946 |
4,840,955,881 |
|
Table 2 QUICKSILVER on ETFS - 7/18/2023 ---
     Bullish = 8   COMPQX, QQQ, FAS, RETL, SOXL (+1.097), TECL (+.811), DBO, OIH (.624)
                                           -------------
     Bearish = 1   UUP
ETF       CLOSE     CHANGE    PIVOT-PT  5-dma AROC    CL-PWR  CANDLE  IP21    ITRS  POWER INDEX
==================================================================================================
DIA       349.58   3.73      343.63        100.8%     Bullish  BLUE   .062    0     ---------
---------------------------------------------------------------------------------------------
COMPQX    14353.64   108.69  13918.96      211.2%     Bullish  BLUE   .154    .144     .298
---------------------------------------------------------------------------------------------
SPY       454.19   3.35      446.02        131%       Bullish  BLUE   .125    .066     .191
---------------------------------------------------------------------------------------------
QQQ       385.74   3.13      372.82        233.4%     Bullish  BLUE   .106    .165     .271
---------------------------------------------------------------------------------------------
MDY       496.01   4.85      490.15        97.2%      Bullish  BLUE   .167    .072     .239
---------------------------------------------------------------------------------------------
IWM       195.97   2.39      191.87        160.6%     Bullish  BLUE   .077    .095     .172
---------------------------------------------------------------------------------------------
FAS       70.67   2.43       67.07         362.5%     Bullish  BLUE   .195    .264     .459
---------------------------------------------------------------------------------------------
RETL      7.83   .25         7.89         -26%        Bullish  BLUE   .117    .259     .376
---------------------------------------------------------------------------------------------
SOXL      28.26   .2         25.69         744.7%     Bullish  BLUE   .074    1.023     1.097
                                                                                        very high
---------------------------------------------------------------------------------------------
TECL      59.78   1.95       53.92         690.4%     Bullish  BLUE   .114    .697     .811
---------------------------------------------------------------------------------------------
IBB       129.72   .48       127.96        117.1%     -------  BLUE  -.009   -.06     -.069
---------------------------------------------------------------------------------------------
GLD       183.64   2.08      181.88        115.6%     Bearish  BLUE  -.061   -.091    -.152
---------------------------------------------------------------------------------------------
DBO       15.03   .28        14.99         73.6%      -------  BLUE   .307    .069     .376
---------------------------------------------------------------------------------------------
OIH       331.49   7.96      323.79        158.5%     Bullish  BLUE   .377    .247     .624
---------------------------------------------------------------------------------------------
CPER     23.65  -.06         23.77         81.7%      -------  BLUE   .13   -.055      .075
---------------------------------------------------------------------------------------------
TAN     72.89  -.66          71.32         247.2%     Bullish  RED   -.052    .013    -.039
---------------------------------------------------------------------------------------------
UUP       27.61   .02        27.76        -86.6%      Bearish  ----  -.286   -.058    -.344
---------------------------------------------------------------------------------------------
CORN      23.84   1.04       21.83         285.5%     Bearish  BLUE   .029   -.039    -.01
---------------------------------------------------------------------------------------------
WEAT      6.65   .15         6.31          85.1%      Bearish  ----  -.098   -.027    -.125
---------------------------------------------------------------------------------------------
YINN      34.9  -2.49        37.6          54.6%      Bullish  RED    .132   -.194    -.062
|
TABLE 3       RANKING OF KEY DIRECTORIES BASED PCT.OF STOCKS ABOVE 65-DMA
              7/18/23
Bullish = 42
Bearish = 7
---------------------------------------------------------------------------------------
Directory     Current       day-1         day-2         day-3         day-4         day-5
----------------------------------------------------------------------------------------
BIGBANKS       1             .714          .714          1             .857          .571
COPPER         1             .857          1             1             .857          .428
HOMEBLDG       1             .964          .964          1             1             .928
REGBANKS       .947          .842          .736          .894          .736          .605
TRANSP         .947          .947          .947          1             1             1
FINANCE        .9            .837          .787          .825          .762          .65
AUTO           .867          .849          .867          .867          .849          .849
JETS           .846          .846          .846          .846          .846          .846
SEMI           .846          .846          .802          .868          .835          .802
NIFTY          .84           .909          .84           .954          .886          .909
ETFS           .818          .836          .836          .89           .763          .563
REIT           .811          .811          .836          .877          .852          .795
HIGHPRIC       .809          .792          .783          .779          .761          .753
INFRA          .806          .806          .838          .935          .806          .741
================================================================================================
INDEXES        .794          .751          .762          .778          .74           .724
GUNS           .785          .785          .785          .785          .785          .714
SOFTWARE       .785          .785          .732          .767          .732          .696
NASD-100       .782          .792          .801          .792          .772          .772
RETAIL         .782          .76           .739          .782          .782          .76
OILGAS         .773          .67           .68           .814          .762          .742
RUS-1000       .77           .753          .758          .79           .777          .751
HOSPITAL       .769          .615          .692          .692          .615          .692
ELECTRON       .766          .751          .729          .781          .759          .744
EAT            .756          .682          .756          .78           .756          .756
GOLD           .755          .466          .4            .355          .333          .111
COMPUTER       .75           .8            .8            .85           .85           .8
INDMATER       .75           .694          .694          .708          .68           .625
CHEM           .744          .697          .674          .744          .767          .72
SP500          .743          .727          .745          .788          .759          .741
FIDSTKS        .739          .721          .745          .786          .775          .751
BONDFUND       .735          .643          .597          .724          .597          .367
COMODITY       .725          .625          .625          .65           .55           .5
GREEN          .722          .666          .555          .666          .611          .555
SP-100         .7            .655          .677          .744          .711          .7
FOOD           .693          .591          .612          .632          .53           .51
DJI-13         .692          .538          .461          .538          .538          .461
SOLAR          .687          .687          .437          .625          .437          .312
GAMING         .684          .631          .631          .789          .736          .631
DOWJONES       .666          .566          .533          .6            .6            .566
MILITARY       .653          .73           .692          .769          .73           .807
INSURANC       .64           .6            .48           .52           .52           .48
=====================================================================================================
COAL           .5            .5            .5            .5            .5            .666
=====================================================================================================
BIOTECH        .474          .459          .428          .454          .464          .431
LOWPRICE       .457          .428          .416          .48           .439          .407
HACKERS        .437          .437          .437          .625          .625          .625
UTILITY        .41           .435          .564          .641          .564          .41
MARIJUAN       .4            .4            .3            .5            .4            .4
CHINA          .365          .439          .463          .56           .463          .439
BEVERAGE       .357          .5            .642          .428          .357          .357
EDU            .333          .166          .166          .166          .166          .166
|
===================================================================================
Tuesday - 6:18 AM - 7/18/2023 - DJI Futures -16 NASDAQ Futures -31 Data Used - 7/17/2023
| |
7/17/2023
|
|
| |
Market Comments
The DJI keeps trying to surpass its well-tested, flat resistance at 34500.
It lacks the volume to get past the heavy public selling there. But Professionals,
as measured by the steady rise of our Closing Power keep the rally going
there. Now the DJI is within 1% of producing a Sell S9-V because the
V-I, IP21 and OBVPct are all still negative with the DJI 1.3% over the
21-dma. If we do get a Sell S9-V, it will because the Professionals are,
more and more as a group, going off on vacation. We see this in the
aggregate, when we look at the bearish seasonality for the DJI after July
17th in the third years of the four-year Presidential cycle. The odds
of a DJI rally for the next month ordinarily drop to only 42.9% if we
use the seasonality statistics since 1967 as our guide.
But the Professionals (or their Summer replacements) are showing no
sign of backing away from their buying. Presumably, they are confident
that the FED will not soon be raising rates after the sharp recent drops in
the CPI and Producer Price numbers.
The battle in the DJI between the Professionals and the Publc make
for interesting drama. But that is not where the big profits have been
and where they are likely to continue to be. As we have been saying for
weeks, perhaps even months, stay long the AI stocks, the semi-conductors
and bullish MAXCP for as long as their Closing Powers and Relative
Strength Quoients are rising. These uptrends continue.
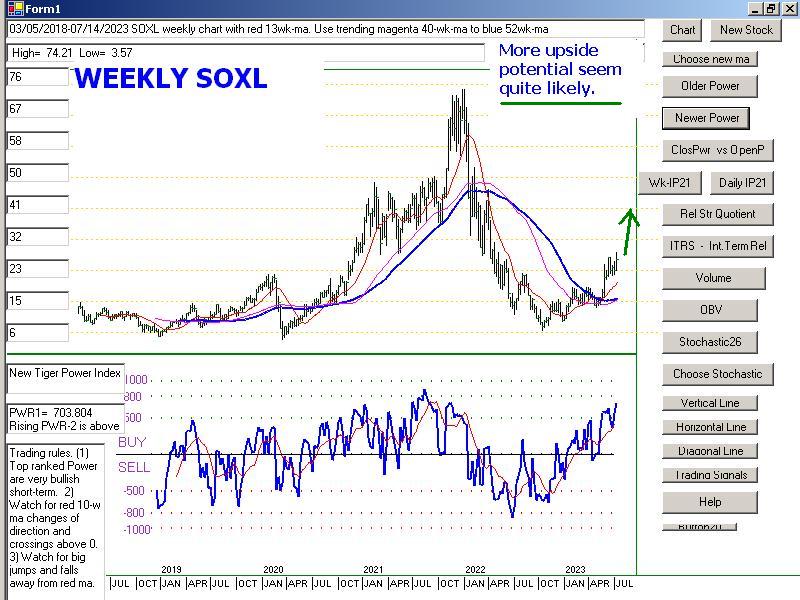
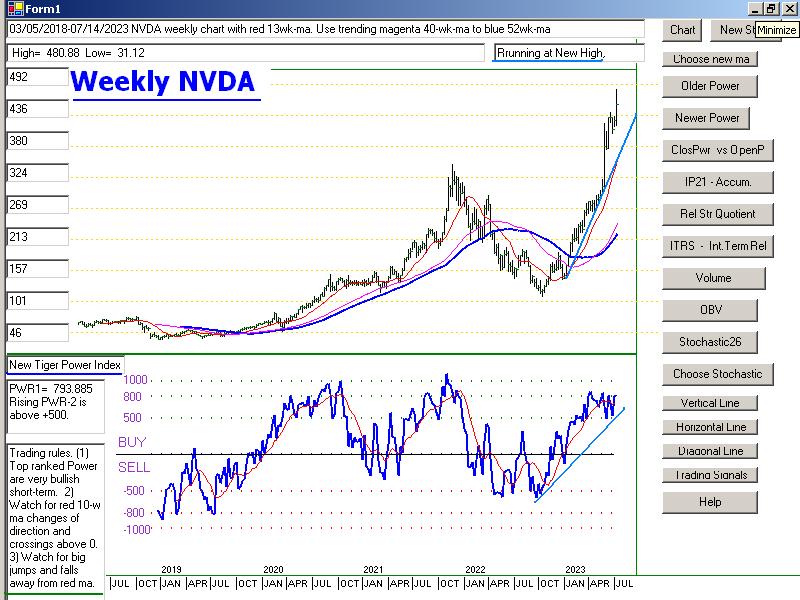
Now our Weekly charts, as developed with Visual Net, give use more
reasons to be bullish the Semi-conductors, AI stocks like NVDA and
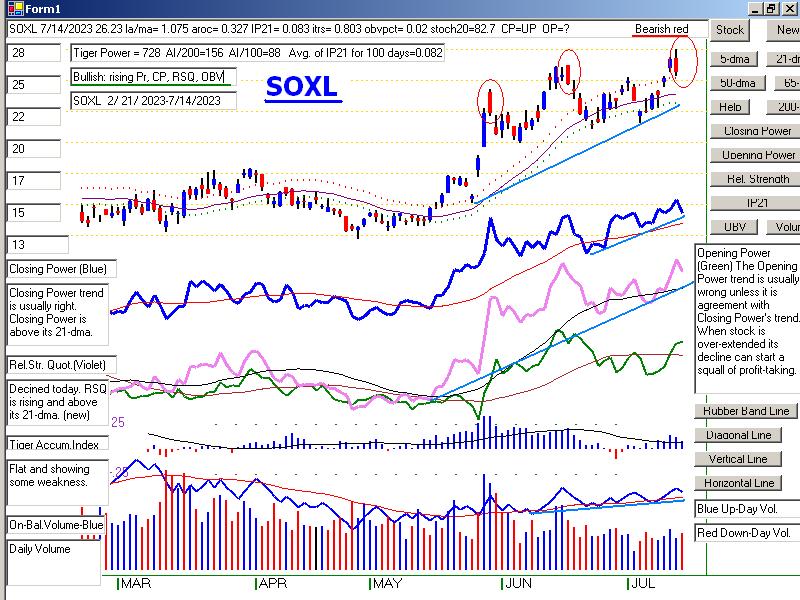
also Housing Stocks. First, see in the charts of SOXL and NAIL
how their present prices are still far below their five year highs. This means
they could still rally much more. And see something new, how their Tiger Power
Index (2021, slghtly revised) readings are rising far above their red 13-week ma
in their charts below. This is a most bullish sign.
Finally check out how bearish the negative leveraged ETFS look
among the bearish MINCPs. This has to be a bullish sign for the market. |
|
| |
7/17/2023
2022 PEERLESS DJI, Signals, Indicators Daily DJI Volume
10-DayUp/Down Vol Stoch-20 CCI RSI Pct of All Stocks above 65-dma
Inverted Traders Index
DJI-IPA DJI-OBV Short-Term Rates
NASDAQ S&P OEX NYSE DJ-15 DJ-20 DJI-30
Tiger Index of Big
Banks Bond
Funds Gold Stocks
Housing Stocks
Insurance-Stocks
Regional Banks
Russell-1000
Semi Conductors
Recent 2006 vers-Peerless signals http://tigersoftware.com/oldpeer/UPD90717.bmp
Note the old Buy "b" trading signals. They are not safe to use when
A/D Line
is below its 21-dma: See OLD06
OLD0607
OLD07 OLD0708 OLD08 OLD0809
ETFs: DIA QQQ SPY IWM MDY
TNA Short-Term Rates Ten Year Rates PST (Short Treasuries)
DOLLAR-UUP
ALLSTOCKs
COIN (Bit
Coin ETF)
USO-CrudeOil DBO
BLDP FAS GLD HD IBB JETS JNUG KOL NAIL NUGT
NRGU OIH PALL RSX RETL SDS AGQ SLV SOXL TAN TECL TLT TMF TNA
UGA USO China: YINN CHAU
Commodities: CANE CORN DBC JJC, NIB CORN, CUT (paper)
MOO, NRGU
SOYB WEAT UUP (Dollar) LIT
(Lithium) PALL
(Palladium)
Stocks
AA AAPL ADBE ALXN AMAT AMGN AMD AMZN ANET AXON AXP
BA BABA BAC BIDU BLDP BSX CAT CDNS CHKP CNX CPB CRM CVX CMG
DE DIS ENPH FB FSLR FTNT GILD GME GOOG GS HD IBM INTU JPM KO KR
LRCX MRK MRNA MOS MSFT NEM NFLX NKE NOC NUE NVDA PANW PG PYPL
QCOM QDEL REGN REV RE SCHW SNOW SO SQUARE TSLA TXN XOM V VRTX
WFC WMT XLE ZM ZOM
HOMEBUILDERS:
NAIL
BZH HOV MHO MTH PHM -
REGIONAL BANKS: EGBN FFIC GBCI HMST
Carl Icahn and
associates: IEP MS JEF
Leveraged Short ETFs:
FAZ - financials, TZA and SRTY- small caps, MZZ - mid caps, TECS -Techs,
SOXS -
semi-conductors LABD
- Biotechs
Bullish MAXCPs http://tigersoftware.com/upping/7-17-2023/Bullish.htm
Bearish MINCPs www.tigersoftware.com/downing/7-17-2023/Bearish.htm |
|
 |
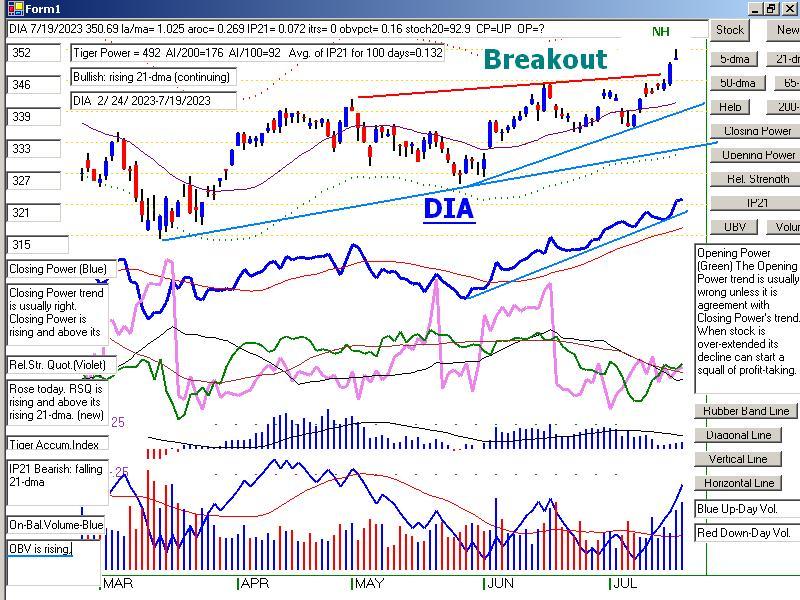
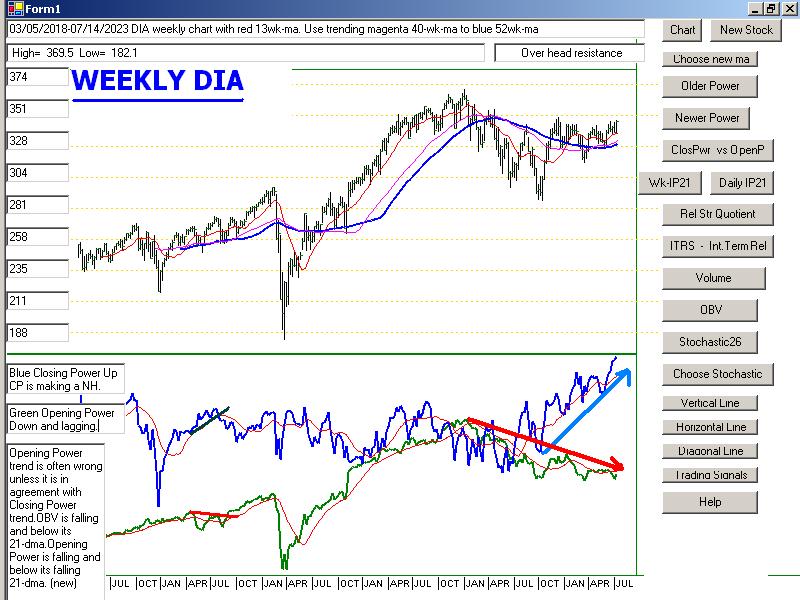
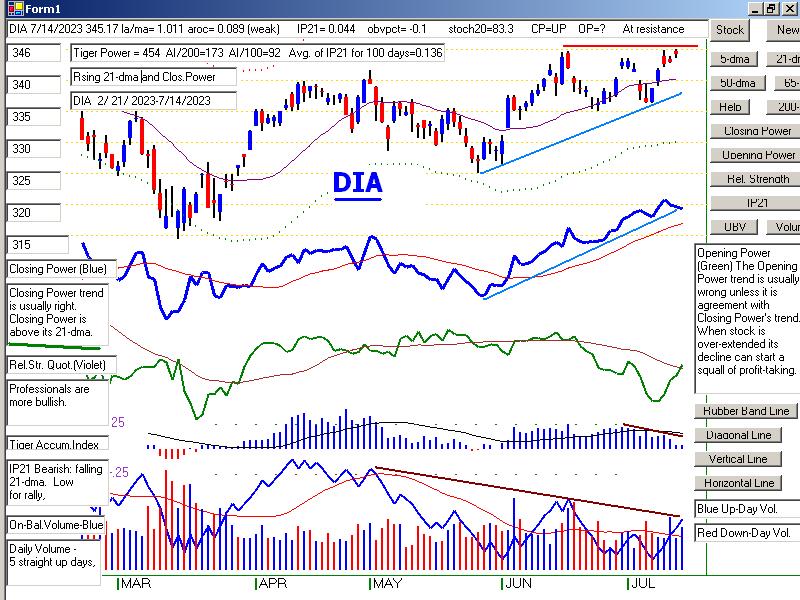
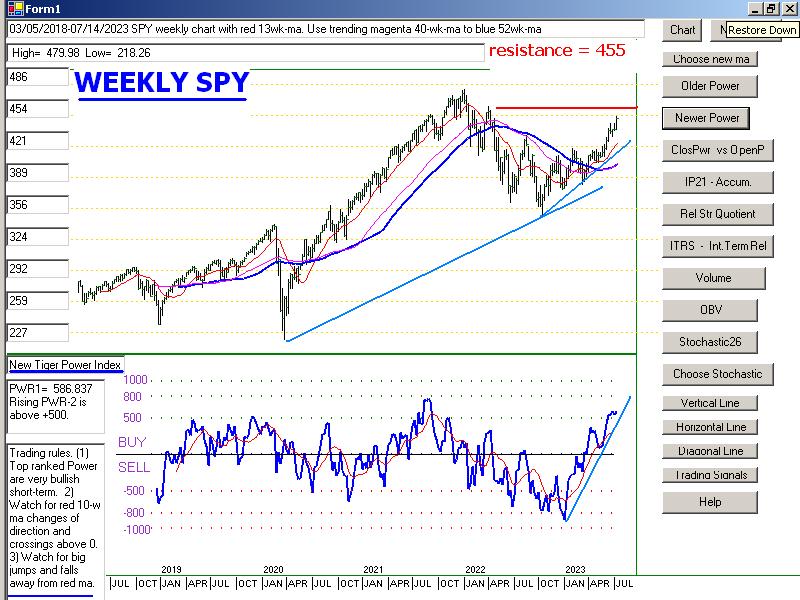
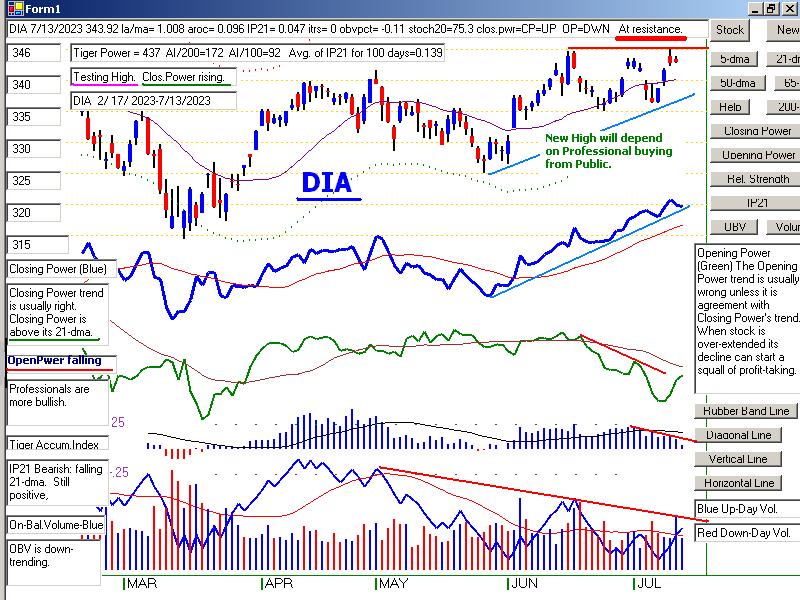
See the battle between Professionals and the Public on Weekly DIA chart.
The divergence is unmatched at any time in last five years,
 |
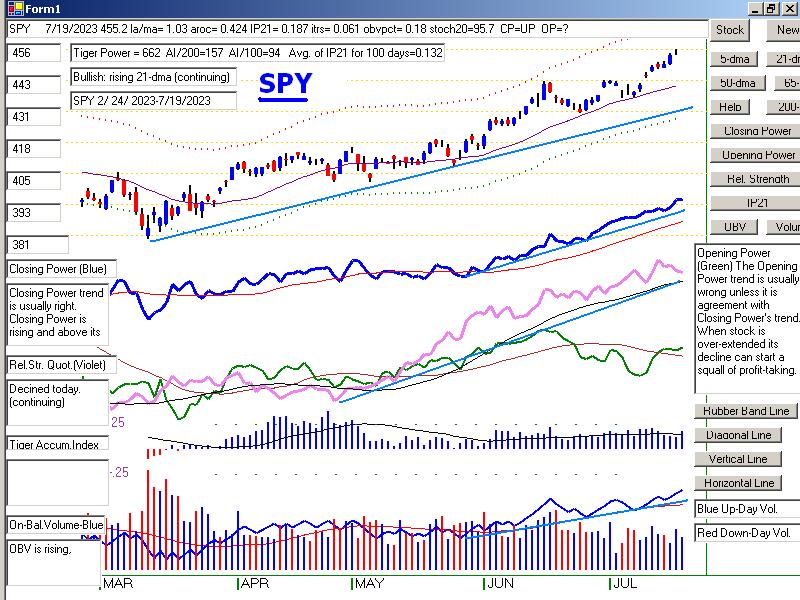
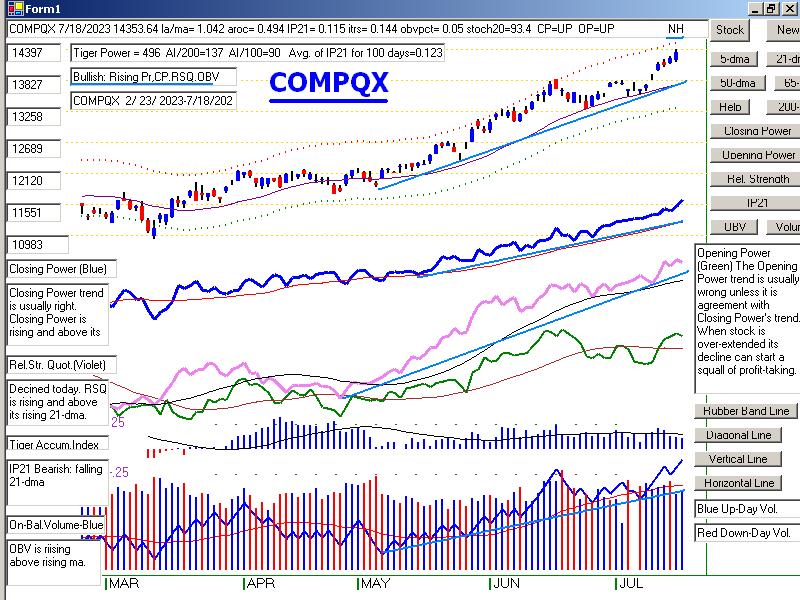
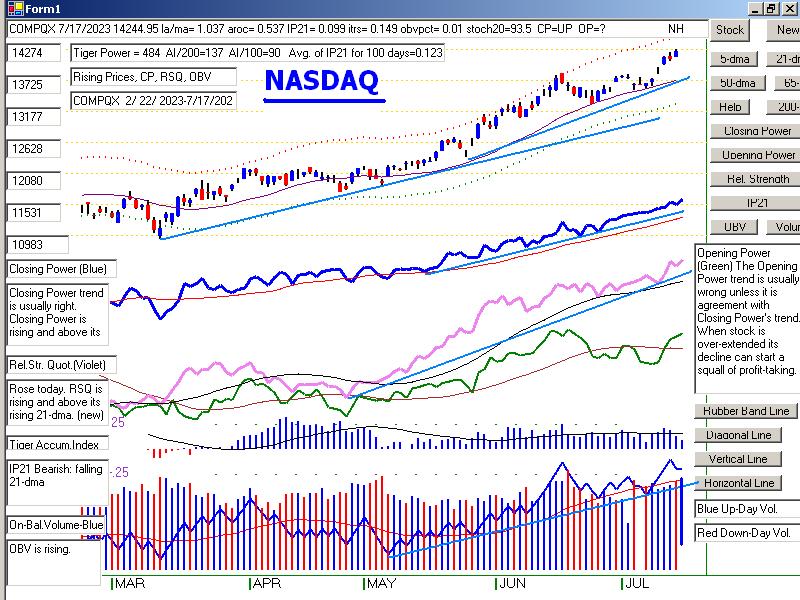
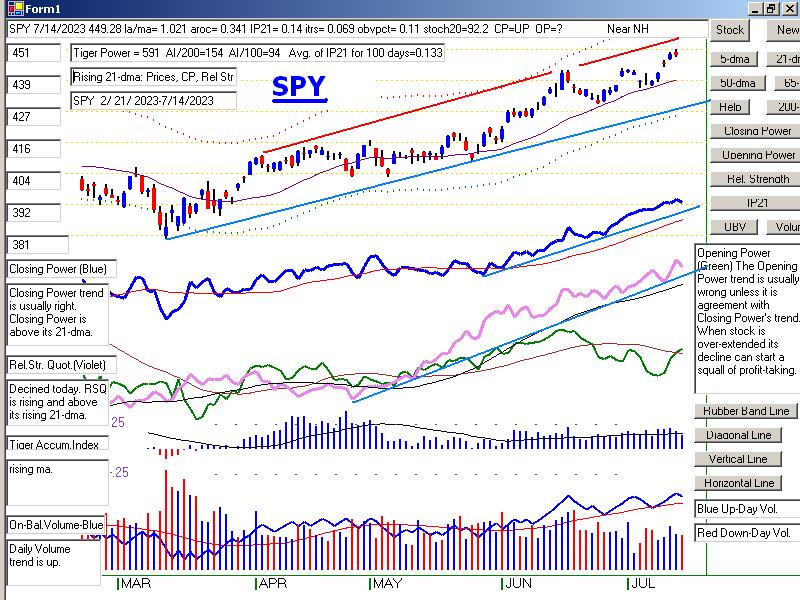
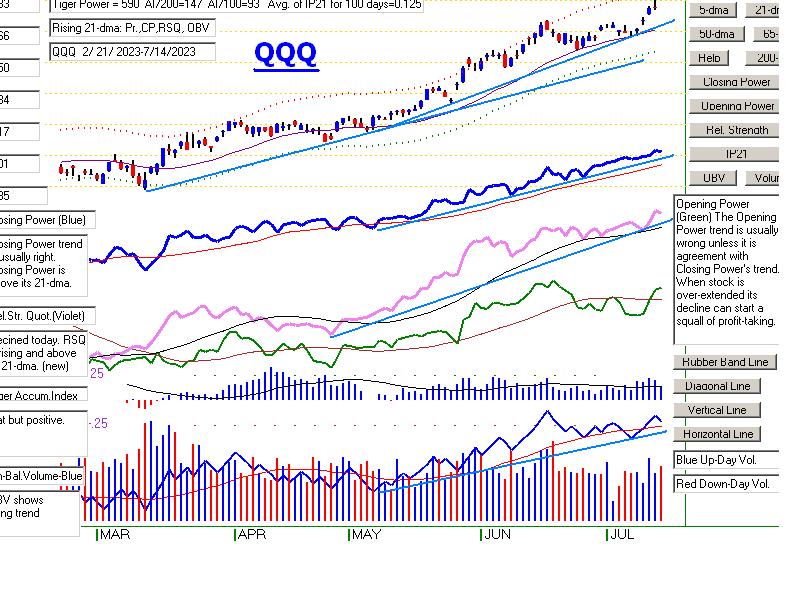
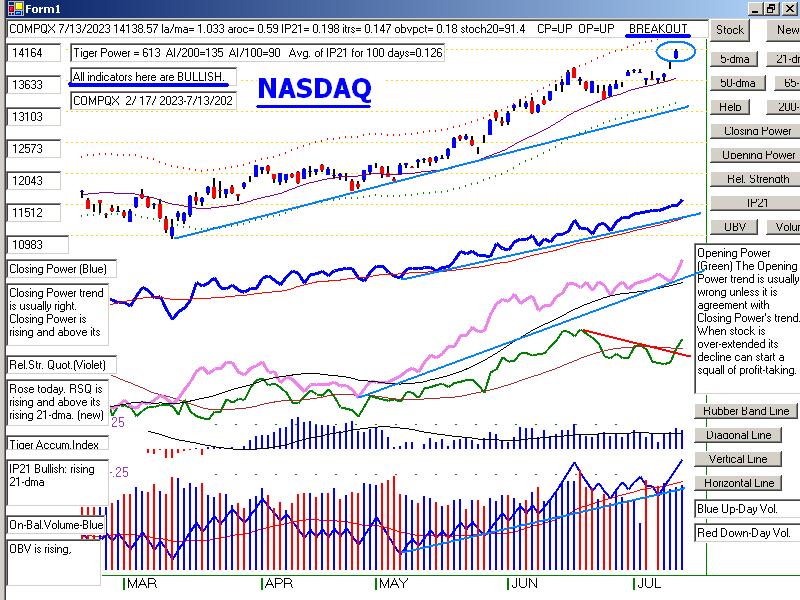
The NASDAQ's advance is supported by upwards Price, CP, RSQ and OBV momentum.
 |
 |
 |
| |
 |
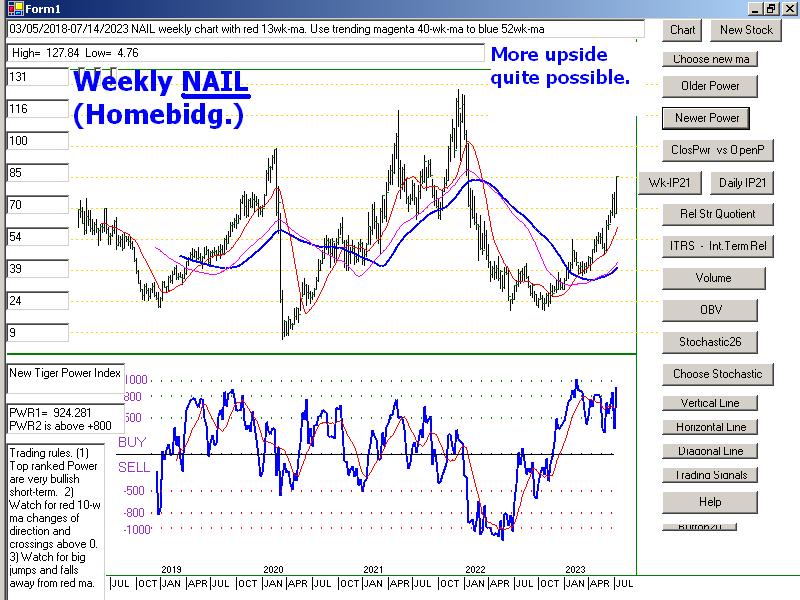 |
Table 1 - Daily Breadth and Volume Statistics
| NYSE |
Latest
Close |
Previous
Close |
Week
Ago |
| Issues
traded |
3,056 |
3,035 |
3,049 |
| Advances |
1,664 |
734 |
2,049 |
| Declines |
1,292 |
2,224 |
899 |
| Unchanged |
100 |
77 |
101 |
| New
highs |
138 |
112 |
81 |
| New
lows |
21 |
24 |
25 |
| Adv.
volume* |
432,212,756 |
148,547,177 |
562,565,023 |
| Decl.
volume* |
335,480,786 |
654,416,041 |
240,906,675 |
| Total
volume* |
778,422,041 |
807,490,807 |
812,609,429 |
| Closing
Arms (TRIN)† |
1.08 |
1.65 |
0.91 |
| Block
trades* |
3,890 |
3,807 |
3,844 |
| Adv.
volume |
1,887,344,319 |
605,704,178 |
2,409,569,232 |
| Decl.
volume |
1,589,469,089 |
3,023,726,919 |
959,859,670 |
| Total
volume |
3,538,242,953 |
3,647,457,047 |
3,429,609,476 |
| NASDAQ |
Latest
Close |
Previous
Close |
Week
Ago |
| Issues
traded |
4,524 |
4,603 |
4,578 |
| Advances |
2,765 |
1,344 |
2,924 |
| Declines |
1,599 |
3,099 |
1,445 |
| Unchanged |
160 |
160 |
209 |
| New
highs |
221 |
185 |
73 |
| New
lows |
88 |
77 |
58 |
| Closing
Arms (TRIN)† |
1.02 |
0.64 |
0.55 |
| Block
trades |
31,697 |
40,457 |
41,170 |
| Adv.
volume |
2,864,323,061 |
1,999,205,571 |
4,116,120,602 |
| Decl.
volume |
1,682,088,984 |
2,957,987,247 |
1,122,154,752 |
| Total
volume |
4,593,167,946 |
5,366,893,388 |
5,275,394,582 |
|
Table 2 QUICKSILVER on ETFS - 7/17/2023
     Bullish = 8   COMPQX, QQQ, FAS, RETL, SOXL (+1.032), TECL (+.767), DBO, OIH
                                           -------------
     Bearish = 1   UUP
ETF       CLOSE     CHANGE    PIVOT-PT  5-dma AROC    CL-PWR  CANDLE  IP21    ITRS  POWER INDEX
==================================================================================================
DIA       345.85   .68       342.64        91.4%      Bullish  BLUE   .052    0        ----
---------------------------------------------------------------------------------------------
COMPQX    14244.95   131.25  13760.7       200.9%     Bullish  BLUE   .163    .149     .312
---------------------------------------------------------------------------------------------
SPY       450.84   1.56      442.46        125.5%     Bullish  BLUE   .133    .07      .203
---------------------------------------------------------------------------------------------
QQQ       382.61   3.54      368.17        217.8%     Bullish  BLUE   .113    .171     .284
---------------------------------------------------------------------------------------------
MDY       491.16   3.27      486.49        101.5%     Bullish  BLUE   .181    .062     .243
---------------------------------------------------------------------------------------------
IWM       193.58   2.05      189.8         149.6%     Bullish  BLUE   .096    .088     .184
---------------------------------------------------------------------------------------------
FAS       68.24   1.89       65.81         354%       Bullish  BLUE   .152    .19      .342
---------------------------------------------------------------------------------------------
RETL      7.58   .13         7.87          111%       Bullish  BLUE   .165    .18      .345
---------------------------------------------------------------------------------------------
SOXL      28.06   1.83       24.34         731.3%     Bullish  BLUE   .04    .992     1.032
---------------------------------------------------------------------------------------------
TECL      57.83   2.16       52.17         556.4%     Bullish  BLUE   .131    .636     .767
---------------------------------------------------------------------------------------------
IBB       129.24   1         126.72        101.5%     Bullish  BLUE   .024   -.046    -.022
---------------------------------------------------------------------------------------------
GLD       181.56   .13       179.45        76.9%      Bearish  BLUE  -.04   -.075     -.115
---------------------------------------------------------------------------------------------
DBO       14.75  -.17        14.81         87.3%      -------  ----   .296    .073     .369
---------------------------------------------------------------------------------------------
OIH       323.53   2.86      321.25        203.5%     Bullish  BLUE   .367    .241     .608
---------------------------------------------------------------------------------------------
CPER     23.71  -.49         23.26         63%        -------  ----   .104   -.03      .074
---------------------------------------------------------------------------------------------
TAN     73.55   2.83         69.36         296.1%     Bullish  BLUE   .078    .035     .113
---------------------------------------------------------------------------------------------
UUP       27.59  -.03        28.09        -102.4%     Bearish  RED   -.328   -.038    -.366
---------------------------------------------------------------------------------------------
CORN      22.8  -.36         22.55         75.5%      Bearish  RED    .042   -.065    -.023
---------------------------------------------------------------------------------------------
WEAT      6.5  -.06          6.54          62.1%      Bearish  RED   -.09   -.026     -.116
---------------------------------------------------------------------------------------------
YINN      37.39  -.59        34.49         486.5%     Bullish  BLUE   .207   -.042     .165
|
 Table 3     RANKING OF KEY DIRECTORIES BASED PCT.OF STOCKS ABOVE 65-DMA
              7/17/23
 Bullish = 40
 Bearish = 8
---------------------------------------------------------------------------------------
Directory     Current       day-1         day-2         day-3         day-4         day-5
----------------------------------------------------------------------------------------
HOMEBLDG       .964          .964          1             1             .928          .928
TRANSP         .947          .947          1             1             1             .947
NIFTY          .909          .84           .954          .886          .909          .795
COPPER         .857          1             1             .857          .428          .285
AUTO           .849          .886          .867          .849          .849          .792
JETS           .846          .846          .846          .846          .846          .846
SEMI           .846          .802          .868          .835          .813          .78
REGBANKS       .842          .736          .894          .736          .605          .578
FINANCE        .837          .787          .825          .75           .65           .625
ETFS           .836          .836          .89           .763          .581          .454
REIT           .811          .827          .885          .86           .786          .729
INFRA          .806          .838          .935          .806          .741          .709
COMPUTER       .8            .8            .85           .85           .8            .75
-----------------------------------------------------------------------------------------------
HIGHPRIC       .792          .783          .779          .761          .748          .727
NASD-100       .792          .801          .792          .772          .762          .742
GUNS           .785          .785          .785          .785          .714          .571
SOFTWARE       .785          .75           .767          .732          .696          .678
RETAIL         .76           .739          .782          .782          .76           .673
RUS-1000       .753          .758          .79           .777          .749          .698
ELECTRON       .751          .729          .781          .759          .736          .736
INDEXES        .751          .762          .778          .74           .729          .724
MILITARY       .73           .692          .769          .73           .769          .576
SP500          .727          .745          .788          .757          .741          .676
FIDSTKS        .721          .745          .786          .775          .745          .662
BIGBANKS       .714          .714          1             .857          .571          .571
CHEM           .697          .674          .744          .767          .72           .674
INDMATER       .694          .694          .708          .68           .625          .583
SOLAR          .687          .437          .625          .437          .312          .25
EAT            .682          .756          .78           .756          .756          .756
OILGAS         .67           .68           .814          .762          .742          .587
GREEN          .666          .555          .666          .611          .555          .555
SP-100         .655          .677          .744          .711          .7            .611
BONDFUND       .643          .586          .724          .609          .379          .356
GAMING         .631          .631          .736          .789          .631          .631
COMODITY       .625          .65           .625          .55           .475          .375
HOSPITAL       .615          .692          .692          .615          .692          .692
INSURANC       .6            .48           .52           .52           .44           .44
FOOD           .591          .632          .612          .53           .489          .387
DOWJONES       .566          .533          .6            .6            .566          .533
DJI-13         .538          .461          .538          .538          .461          .461
=============================================================================================
BEVERAGE       .5            .642          .428          .357          .357          .428
COAL           .5            .5            .5            .5            .666          .5
=============================================================================================
GOLD           .466          .4            .355          .333          .111          .111
BIOTECH        .456          .426          .456          .464          .431          .428
CHINA          .439          .463          .56           .463          .439          .439
HACKERS        .437          .437          .625          .625          .625          .562
UTILITY        .435          .564          .641          .564          .41           .307
LOWPRICE       .428          .419          .483          .439          .407          .401
MARIJUAN       .4            .3            .5            .4            .4            .2
EDU            .166          .166          .166          .166          .333          .166
|
===================================================================================
Monday - 6:01 AM - 7/17/2023 - DJI Futures -69 NASDAQ
Futures +1 Data Used - 7/14/2023
| |
7/14/2023
|
|
| |
Market Comments
The DJI again challenged its well-tested, flat resistance at 34500, thanks
to the 200-point lift giveni it by UNH's 31-point bounce off an opversold
condition. If there had not been a late sell-off in the DJI, Peerless might
have closed 2.4% over its 21-day ma with the Peerless V-Indicator in
negative terrtory. This would have produced a Summer-time Sell S9-V.
As it was, instead, we are likely to see another challow retreat by the DJI
because all the volume based indicators on the DJI chart are negative
and show a lack of sufficient buying power to allow the DJI's overhead
resistance to be eaten through.
Elsewhere home-building stocks were strong. But big ol looks vulnerable/
And semi-conductors are due for some profit-taking. The tech ETFs
and SPY still show rising Closing Powers and Relative Strength Lines.
So, we should just continue to hold them,
We have a few more bearish MINCPs. But breadth has been good
and the number of new lows not large enough to allow much shorting.
Weekly Charts.
I am a little ahead of schedule in the conversion of Tiger VB Basic
charts to Visual Net so that they can run on Wondows 10 machines.
I produced weekly charts this weekend using Visual Net for the first
time. For the first time, we will able to compare the trends of
Opening and Closing Power over a four and a half year period.
And for the first time, we will be able to look at the Power values
shown in the 2021 Ranking over a five year span. See them below.
I make brief mention of some of their trading rules on their charts
below. |
|
| |
7/14/2023
2022 PEERLESS DJI, Signals, Indicators Daily DJI Volume
10-DayUp/Down Vol Stoch-20 CCI RSI Pct of All Stocks above 65-dma
Inverted Traders Index
DJI-IPA DJI-OBV Short-Term Rates
NASDAQ S&P OEX NYSE DJ-15 DJ-20 DJI-30
Tiger Index of Big
Banks Bond
Funds Gold Stocks
Housing Stocks
Insurance-Stocks
Regional Banks
Russell-1000
Semi Conductors
Recent 2006 vers-Peerless signals http://tigersoftware.com/oldpeer/UPD90714.bmp
Note the old Buy "b" trading signals. They are not safe to use when
A/D Line
is below its 21-dma: See OLD06
OLD0607
OLD07 OLD0708 OLD08 OLD0809
ETFs: DIA QQQ SPY IWM MDY
TNA Short-Term Rates Ten Year Rates PST (Short Treasuries)
DOLLAR-UUP
ALLSTOCKs
COIN (Bit
Coin ETF)
USO-CrudeOil DBO
BLDP FAS GLD HD IBB JETS JNUG KOL NAIL NUGT
NRGU OIH PALL RSX RETL SDS AGQ SLV SOXL TAN TECL TLT TMF TNA
UGA USO China: YINN CHAU
Commodities: CANE CORN DBC JJC, NIB CORN, CUT (paper)
MOO, NRGU
SOYB WEAT UUP (Dollar) LIT
(Lithium) PALL
(Palladium)
Stocks
AA AAPL ADBE ALXN AMAT AMGN AMD AMZN ANET AXON AXP
BA BABA BAC BIDU BLDP BSX CAT CDNS CHKP CNX CPB CRM CVX CMG
DE DIS ENPH FB FSLR FTNT GILD GME GOOG GS HD IBM INTU JPM KO KR
LRCX MRK MRNA MOS MSFT NEM NFLX NKE NOC NUE NVDA PANW PG PYPL
QCOM QDEL REGN REV RE SCHW SNOW SO SQUARE TSLA TXN XOM V VRTX
WFC WMT XLE ZM ZOM
HOMEBUILDERS:
NAIL
BZH HOV MHO MTH PHM -
REGIONAL BANKS: EGBN FFIC GBCI HMST
Carl Icahn and
associates: IEP MS JEF
Leveraged Short ETFs:
FAZ - financials, TZA and SRTY- small caps, MZZ - mid caps, TECS -Techs,
SOXS -
semi-conductors LABD
- Biotechs
Bullish MAXCPs http://tigersoftware.com/upping/7-14-2023/Bullish.htm
Bearish MINCPs
www.tigersoftware.com/downing/7-14-2023/Bearish.htm
|
|
 |
 |
 |
 |
 |
 |
 |
New VB Net Weekly Charts
---- TigerSoft 2021 Power Index (improved)
SPY and NVDA
---- Closing Power versus Opening Power |
 |
 |
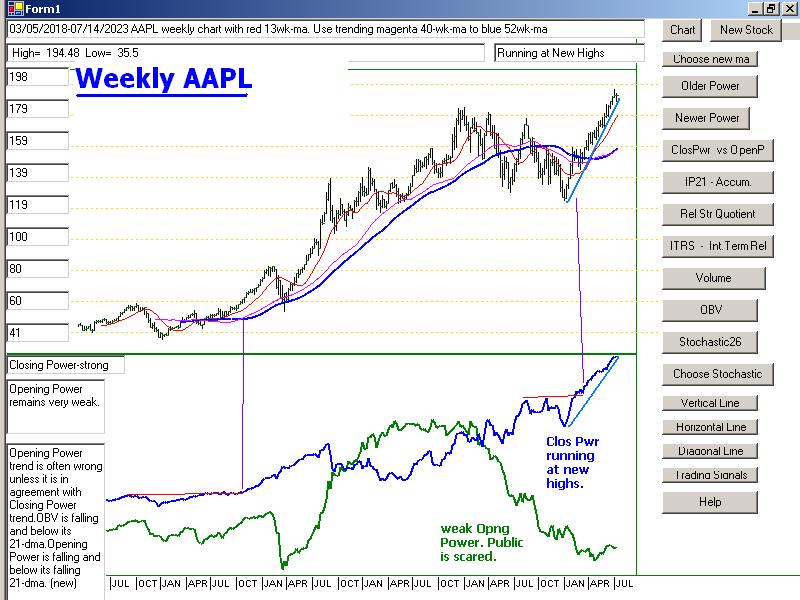 |
Table 1
| NYSE |
Latest Close |
Previous Close |
Week Ago |
| Issues traded |
3,035 |
3,045 |
3,043 |
| Advances |
734 |
2,061 |
2,108 |
| Declines |
2,224 |
876 |
821 |
| Unchanged |
77 |
108 |
114 |
| New highs |
112 |
173 |
54 |
| New lows |
24 |
12 |
21 |
| Adv. volume* |
148,547,177 |
579,837,448 |
675,401,900 |
| Decl. volume* |
654,416,041 |
224,471,779 |
247,274,619 |
| Total volume* |
807,490,807 |
828,429,787 |
934,517,413 |
| Closing Arms (TRIN)† |
1.65 |
0.94 |
0.86 |
| Block trades* |
3,807 |
4,024 |
4,147 |
| Adv. volume |
605,704,178 |
2,652,391,667 |
2,656,424,392 |
| Decl. volume |
3,023,726,919 |
1,060,100,661 |
893,879,217 |
| Total volume |
3,647,457,047 |
3,839,532,858 |
3,630,485,582 |
| NASDAQ |
Latest Close |
Previous Close |
Week Ago |
| Issues traded |
4,603 |
4,613 |
4,503 |
| Advances |
1,344 |
2,904 |
2,878 |
| Declines |
3,099 |
1,523 |
1,445 |
| Unchanged |
160 |
186 |
180 |
| New highs |
185 |
272 |
57 |
| New lows |
77 |
47 |
66 |
| Closing Arms (TRIN)† |
0.64 |
0.68 |
1.29 |
| Block trades |
40,457 |
37,524 |
41,934 |
| Adv. volume |
1,999,205,571 |
3,797,678,953 |
3,072,507,227 |
| Decl. volume |
2,957,987,247 |
1,344,514,178 |
1,991,239,107 |
| Total volume |
5,366,893,388 |
5,183,568,173 |
5,098,120,228 |
|
Table 2
Table 2 QUICKSILVER on ETFS - 7/14/2023 ---
     Bullish = 6   COMPQX, QQQ, SOXL (+.886), TECL (+.726), DBO, OIH
     Bearish = 1   UUP
ETF       CLOSE     CHANGE    PIVOT-PT  5-dma AROC    CL-PWR  CANDLE  IP21    ITRS  POWER INDEX
==================================================================================================
DIA       345.17   1.25      339.58        113.3%     Bullish  RED    .044    0      --------
---------------------------------------------------------------------------------------------
COMPQX    14113.7  -24.87    13685.48      163.7%     Bullish  RED    .169    .144     .313
---------------------------------------------------------------------------------------------
SPY       449.28  -.28       439.66        121%       Bullish  RED    .141    .069     .21
---------------------------------------------------------------------------------------------
QQQ       379.07  -.08       366.36        173.1%     Bullish  RED    .147    .162     .309
---------------------------------------------------------------------------------------------
MDY       487.89  -4.78      481.26        130.8%     Bullish  RED    .13    .065      .195
---------------------------------------------------------------------------------------------
IWM       191.53  -1.89      187.87        179.9%     Bullish  RED    .053    .091     .144
---------------------------------------------------------------------------------------------
FAS       66.35  -1.38       63.56         276.8%     Bullish  RED    .088    .124     .212
---------------------------------------------------------------------------------------------
RETL      7.45  -.22         7.41          270.6%     Bullish  RED    .1    .149       .249
---------------------------------------------------------------------------------------------
SOXL      26.23  -1.05       24.32         656.2%     Bullish  RED    .083    .803     .886
---------------------------------------------------------------------------------------------
TECL      55.67  -.32        51.83         401.4%     Bullish  RED    .184    .542     .726
---------------------------------------------------------------------------------------------
IBB       128.24  -.06       126.65        152.2%     -------  ----   .014   -.037    -.023
---------------------------------------------------------------------------------------------
GLD       181.43  -.58       178.78        77.4%      Bearish  RED   -.094   -.057    -.151
---------------------------------------------------------------------------------------------
DBO       14.92  -.34        14.49         128.2%     -------  RED    .291    .054     .345
---------------------------------------------------------------------------------------------
OIH       320.67  -5.25      310.49        204%       Bullish  RED    .339    .224     .563
---------------------------------------------------------------------------------------------
CPER     24.2  -.16          23.41         188.4%     -------  RED    .047   -.004     .043
---------------------------------------------------------------------------------------------
TAN     70.72  -1.4          69.37         190.6%     -------  RED   -.001    .003     .002
---------------------------------------------------------------------------------------------
UUP       27.62   .05        28.16        -109.1%     Bearish  ----  -.388   -.032    -.42
---------------------------------------------------------------------------------------------
CORN      23.16   .53        22.46         181.1%     Bearish  BLUE   .068   -.02      .048
---------------------------------------------------------------------------------------------
WEAT      6.56   .17         6.42          85.6%      -------  BLUE  -.036    .042     .006
---------------------------------------------------------------------------------------------
YINN      37.98  -2.12       33.81         561.3%     Bullish  RED    .196   -.024     .172
|
 Table 3      RANKING OF KEY DIRECTORIES BASED PCT.OF STOCKS ABOVE 65-DMA
              7/14/23
 Bullish = 39
 Bearish = 10
---------------------------------------------------------------------------------------
Directory     Current       day-1         day-2         day-3         day-4         day-5
----------------------------------------------------------------------------------------
COPPER         1             1             .857          .428          .285          .285
HOMEBLDG       .964          1             1             .928          .928          .892
TRANSP         .947          1             1             1             .947          .947
AUTO           .886          .886          .849          .849          .792          .773
JETS           .846          .846          .846          .846          .846          .846
NIFTY          .84           .954          .886          .909          .795          .772
INFRA          .838          .935          .806          .741          .709          .709
ETFS           .836          .89           .763          .581          .472          .454
REIT           .827          .877          .868          .795          .721          .688
SEMI           .802          .868          .835          .813          .78           .736
NASD-100       .801          .792          .772          .762          .742          .683
COMPUTER       .8            .85           .85           .8            .75           .75
--------------------------------------------------------------------------------------------------------------
FINANCE        .787          .825          .75           .637          .625          .587
GUNS           .785          .785          .785          .714          .642          .5
HIGHPRIC       .783          .779          .761          .748          .727          .683
INDEXES        .762          .778          .74           .729          .718          .686
RUS-1000       .758          .79           .777          .749          .7            .667
EAT            .756          .78           .756          .756          .756          .682
SOFTWARE       .75           .785          .732          .696          .696          .66
FIDSTKS        .745          .786          .775          .745          .656          .633
SP500          .745          .788          .757          .739          .676          .651
RETAIL         .739          .782          .782          .76           .673          .608
REGBANKS       .736          .894          .736          .605          .552          .526
ELECTRON       .729          .781          .759          .736          .721          .699
BIGBANKS       .714          1             .857          .571          .571          .428
INDMATER       .694          .708          .68           .625          .583          .583
HOSPITAL       .692          .692          .615          .692          .692          .692
MILITARY       .692          .769          .73           .769          .576          .576
OILGAS         .68           .814          .762          .742          .577          .567
SP-100         .677          .744          .711          .7            .611          .566
CHEM           .674          .744          .767          .72           .651          .604
COMODITY       .65           .65           .525          .475          .4            .35
BEVERAGE       .642          .428          .357          .357          .428          .428
FOOD           .632          .632          .51           .489          .408          .367
GAMING         .631          .736          .736          .684          .631          .526
BONDFUND       .586          .712          .609          .39           .344          .252
UTILITY        .564          .641          .564          .41           .307          .358
GREEN          .555          .666          .611          .555          .555          .555
DOWJONES       .533          .6            .6            .566          .533          .5
=================================================================================================
COAL           .5            .5            .5            .666          .5            .5
=================================================================================================
INSURANC       .48           .52           .52           .44           .44           .44
CHINA          .463          .56           .463          .439          .439          .39
DJI-13         .461          .538          .538          .461          .461          .461
HACKERS        .437          .625          .625          .625          .562          .5
SOLAR          .437          .625          .437          .312          .25           .187
BIOTECH        .423          .454          .467          .431          .431          .357
LOWPRICE       .419          .486          .442          .407          .401          .39
GOLD           .4            .355          .333          .111          .111          .111
MARIJUAN       .3            .5            .4            .4            .2            .2
EDU            .166          .166          .166          .333          .166          .333
|
===================================================================================
Friday - 4:16 AM - 7/14/2023 - DJI Futures +139 NASDAQ Futures
-12 Data Used - 7/13/2023
| |
7/13/2023
|
|
| |
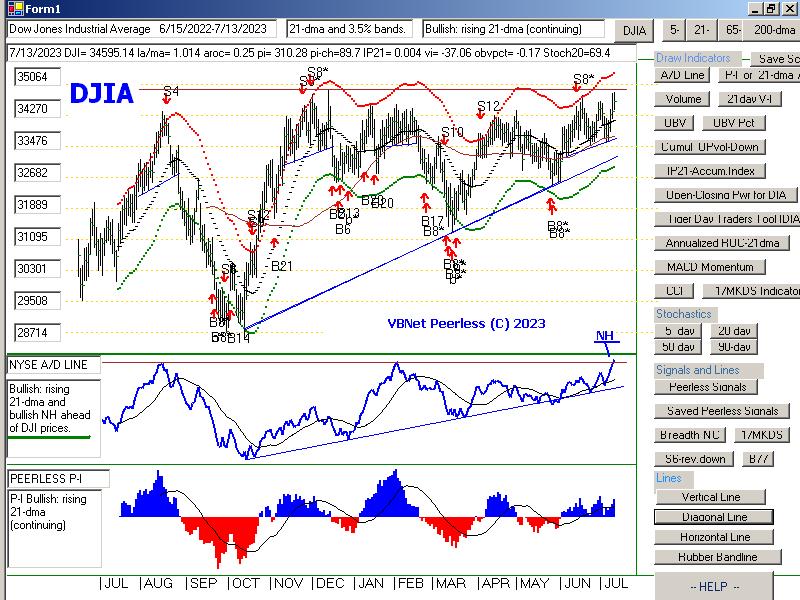
Market Comments
The DJI may or may not be able to surpass the round number resistance
at 35000 on this run. On the one hand, breadth has become very good -
it reflects the bulls' hopes for a pause in the FED rush to raise interest rates -
on the other hand, big volume is clearly missing on the rally. According
to most books on technical analysis (starting with Edwards and Magee),
rising volume is considered a necessity for successful head and shoulders
patternbreakouts. The idea here is simple. It takes rising volume to eat
up the supplies of stock overhead at the neckline of the formation. In the
present case, here, the OBV is badly lagging on the DJI chart and the
V-Indicator is still negative, thus making a Sell S9V a possibility if the
DJI closes up 1% higher today or Monday.
But is that so important? Our take on the market right now is that the DJI
is a distraction from the best way to make money, namely in semi-conductors
and AI leaders like NVDA and MSFT. See our Tiger Index of 91-semi
below. These stocks along with SOXL, TECL, QQQ, SPY and COMPQZ
(the NASDAQ) still show rising Closing Power and Relative Strength Lines.
So, hold them tightly. We are in the begiining of a new industrial eveolution,
of sorts, only this one uses artificial brain power and is not measured in
pyhsical (horse) power.
I preach that Professionals are usually correct in their assessments
of the market and individual stocks, especially when the Public,
as measured by our Opening Power, is still fearful and even bearish.
I have shown how often this lesson work outs in my Closing Power book.
First hand, I have seen play new bull market leadership take the form of semi-
conductors back in early 1967, when I first became interested in the market.
Next I saw it in August of 1982, in 2003, 2009 and 2020 when a new bull
market was just starting. Each time, Professionals eagerly bought the most
volatile tech growth-stocks they could find. It didn't hurt that they had the
inside track when it came to Fed-watching.
Perhaps, the FED will remain more stubborn and obdurate. Perhaps, it
will over-shoot the market this time to make up for their being so far behind
the curve as Inflation grew in 2021. But clearly, that is not how most
Professionals are playing the market. Nor should we. |
|
| |
7/13/2023
2022 PEERLESS DJI, Signals, Indicators Daily DJI Volume
10-DayUp/Down Vol Stoch-20 CCI RSI Pct of All Stocks above 65-dma
Inverted Traders Index
DJI-IPA DJI-OBV Short-Term Rates
NASDAQ S&P OEX NYSE DJ-15 DJ-20 DJI-30
Tiger Index of Big
Banks Bond
Funds Gold Stocks
Housing Stocks
Insurance-Stocks
Regional Banks
Russell-1000
Semi Conductors
Recent 2006 vers-Peerless signals http://tigersoftware.com/oldpeer/UPD90713.bmp
Note the old Buy "b" trading signals. They are not safe to use when
A/D Line
is below its 21-dma: See OLD06
OLD0607
OLD07 OLD0708 OLD08 OLD0809
ETFs: DIA QQQ SPY IWM MDY
TNA Short-Term Rates Ten Year Rates PST (Short Treasuries)
DOLLAR-UUP
ALLSTOCKs
COIN (Bit
Coin ETF)
USO-CrudeOil DBO
BLDP FAS GLD HD IBB JETS JNUG KOL NAIL NUGT
NRGU OIH PALL RSX RETL SDS AGQ SLV SOXL TAN TECL TLT TMF TNA
UGA USO China: YINN CHAU
Commodities: CANE CORN DBC JJC, NIB CORN, CUT (paper)
MOO, NRGU
SOYB WEAT UUP (Dollar) LIT
(Lithium) PALL
(Palladium)
Stocks
AA AAPL ADBE ALXN AMAT AMGN AMD AMZN ANET AXON AXP
BA BABA BAC BIDU BLDP BSX CAT CDNS CHKP CNX CPB CRM CVX CMG
DE DIS ENPH FB FSLR FTNT GILD GME GOOG GS HD IBM INTU JPM KO KR
LRCX MRK MRNA MOS MSFT NEM NFLX NKE NOC NUE NVDA PANW PG PYPL
QCOM QDEL REGN REV RE SCHW SNOW SO SQUARE TSLA TXN XOM V VRTX
WFC WMT XLE ZM ZOM
HOMEBUILDERS:
NAIL
BZH HOV MHO MTH PHM -
REGIONAL BANKS: EGBN FFIC GBCI HMST
Carl Icahn and
associates: IEP MS JEF
Leveraged Short ETFs:
FAZ - financials, TZA and SRTY- small caps, MZZ - mid caps, TECS -Techs,
SOXS -
semi-conductors LABD
- Biotechs
Bullish MAXCPs http://tigersoftware.com/upping/7-13-2023/Bullish.htm
Bearish MINCPs
www.tigersoftware.com/downing/7-13-2023/Bearish.htm
|
|
 |
AI is in the beginning phase of a new Industrial
Revolution.
Semi-conductor chips are at tis center.
|
 |
 |
 |
 |
 |
 |
| NYSE |
Latest
Close |
Previous
Close |
Week
Ago |
| Issues
traded |
3,045 |
3,036 |
3,041 |
| Advances |
2,061 |
2,136 |
462 |
| Declines |
876 |
816 |
2,521 |
| Unchanged |
108 |
84 |
58 |
| New
highs |
173 |
216 |
28 |
| New
lows |
12 |
10 |
34 |
| Adv.
volume* |
579,837,448 |
592,978,611 |
96,480,498 |
| Decl.
volume* |
224,471,779 |
276,313,291 |
792,742,249 |
| Total
volume* |
828,429,787 |
874,027,340 |
893,306,527 |
| Closing
Arms (TRIN)† |
0.94 |
1.13 |
1.58 |
| Block
trades* |
4,024 |
4,211 |
4,172 |
| Adv.
volume |
2,652,391,667 |
2,723,590,320 |
380,688,749 |
| Decl.
volume |
1,060,100,661 |
1,174,341,830 |
3,279,897,404 |
| Total
volume |
3,839,532,858 |
3,920,298,203 |
3,682,029,802 |
| NASDAQ |
Latest
Close |
Previous
Close |
Week
Ago |
| Issues
traded |
4,613 |
4,573 |
4,558 |
| Advances |
2,904 |
2,893 |
1,033 |
| Declines |
1,523 |
1,506 |
3,350 |
| Unchanged |
186 |
174 |
175 |
| New
highs |
272 |
225 |
36 |
| New
lows |
47 |
52 |
140 |
| Closing
Arms (TRIN)† |
0.68 |
1.14 |
0.33 |
| Block
trades |
37,524 |
37,679 |
64,447 |
| Adv.
volume |
3,797,678,953 |
3,236,162,650 |
2,945,937,000 |
| Decl.
volume |
1,344,514,178 |
1,918,434,775 |
3,125,786,967 |
| Total
volume |
5,183,568,173 |
5,230,624,543 |
6,113,085,949 |
|
Table 2 QUICKSILVER on ETFS - 7/13/2023 ---
     Bullish = 10   COMPQX, SPY, QQQ, MDY, FAS, RETL,
                    SOXL (+.98), TECL (+.746), DBO(, OIH
     Bearish = 0
ETF       CLOSE     CHANGE    PIVOT-PT  5-dma AROC    CL-PWR  CANDLE  IP21    ITRS  POWER INDEX
==================================================================================================
DIA       343.92   .29       337.43        68.9%      Bullish  RED    .048    ----     ----- ---[--[---------------------------------------------------------------------------------------------
COMPQX    14138.57   219.61  13660.72      167.2%     Bullish  BLUE   .232    .147     .379
---------------------------------------------------------------------------------------------
SPY       449.56   3.54      438.55        112.2%     Bullish  BLUE   .187    .071     .258
---------------------------------------------------------------------------------------------
QQQ       379.15   6.33      366.24        158.7%     Bullish  BLUE   .209    .166     .375
---------------------------------------------------------------------------------------------
MDY       492.67   2.52      475.2         230.5%     Bullish  BLUE   .18    .074      .254
---------------------------------------------------------------------------------------------
IWM       193.42   1.55      184.71        283.9%     Bullish  BLUE   .075    .093     .168
---------------------------------------------------------------------------------------------
FAS       67.73   .66        62.73         407.3%     Bullish  BLUE   .179    .081     .26
---------------------------------------------------------------------------------------------
RETL      7.67  -.22         7.04          539.4%     Bullish  RED    .159    .179     .338
---------------------------------------------------------------------------------------------
SOXL      27.28   1.59       22.96         893.7%     Bullish  BLUE   .13     .85      .98
---------------------------------------------------------------------------------------------
TECL      55.99   2.07       51.41         369.1%     Bullish  BLUE   .225    .521     .746
---------------------------------------------------------------------------------------------
IBB       128.3   .34        124.38        112.9%     Bullish  RED    .029   -.035    -.006
---------------------------------------------------------------------------------------------
GLD       182.01   .13       178.64        131.1%     Bearish  ----  -.105   -.021    -.126
---------------------------------------------------------------------------------------------
DBO       15.26   .27        14.54         345.5%     -------  BLUE   .334    .039     .373
---------------------------------------------------------------------------------------------
OIH       325.92   2.13      307.7         610.8%     Bullish  BLUE   .311    .182     .493
---------------------------------------------------------------------------------------------
CPER     24.36   .59         23.31         267.4%     -------  BLUE   .092   -.001     .091
---------------------------------------------------------------------------------------------
TAN     72.12   .8           68.05         344.5%     Bullish  BLUE   .017    .003     .02
---------------------------------------------------------------------------------------------
UUP       27.57  -.19        28.23        -159.9%     Bearish  RED   -.379    -.022    -.401
---------------------------------------------------------------------------------------------
CORN      22.63   .8         22.35        -26.8%      Bearish  BLUE   0       -.036    -.036
---------------------------------------------------------------------------------------------
WEAT      6.39   .08         6.45         -93.1%      -------  BLUE  -.095     .019    -.076
---------------------------------------------------------------------------------------------
YINN      40.1   2.5         33.94         1190.6%     Bullish  BLUE   .179   -.017     .162
|
 Table 3     RANKING OF KEY DIRECTORIES BASED PCT.OF STOCKS ABOVE 65-DMA
             7/13/23
 Bullish = 44
 Bearish = 4
---------------------------------------------------------------------------------------
Directory     Current       day-1         day-2         day-3         day-4         day-5
----------------------------------------------------------------------------------------
BIGBANKS       1             .857          .571          .571          .428          .428
COPPER         1             .857          .428          .285          .285          .142
HOMEBLDG       1             1             .928          .928          .892          .857
TRANSP         1             1             1             .947          .947          .947
NIFTY          .954          .886          .909          .795          .772          .772
INFRA          .935          .806          .741          .709          .709          .58
REGBANKS       .894          .736          .605          .552          .526          .394
ETFS           .89           .763          .581          .472          .472          .29
AUTO           .886          .867          .849          .792          .773          .754
REIT           .877          .86           .803          .729          .68           .614
SEMI           .868          .835          .813          .78           .736          .758
COMPUTER       .85           .85           .8            .75           .75           .75
JETS           .846          .846          .846          .846          .846          .846
FINANCE        .825          .75           .637          .612          .575          .5
OILGAS         .814          .762          .742          .577          .556          .371
============================================================================================
NASD-100       .792          .772          .762          .742          .693          .673
RUS-1000       .79           .777          .749          .7            .67           .64
SP500          .788          .757          .739          .674          .651          .635
FIDSTKS        .786          .775          .745          .656          .644          .621
GUNS           .785          .785          .714          .642          .5            .571
SOFTWARE       .785          .75           .696          .696          .66           .66
RETAIL         .782          .782          .76           .673          .586          .608
ELECTRON       .781          .759          .736          .721          .699          .706
EAT            .78           .756          .756          .756          .682          .634
HIGHPRIC       .779          .761          .748          .727          .688          .688
INDEXES        .778          .74           .729          .718          .686          .643
MILITARY       .769          .73           .769          .576          .576          .653
CHEM           .744          .767          .72           .651          .604          .558
SP-100         .744          .711          .7            .611          .566          .566
GAMING         .736          .736          .631          .684          .526          .421
BONDFUND       .712          .597          .39           .356          .252          .114
INDMATER       .708          .68           .625          .583          .569          .472
HOSPITAL       .692          .615          .692          .692          .692          .692
GREEN          .666          .611          .555          .555          .555          .555
COMODITY       .65           .55           .45           .4            .35           .325
UTILITY        .641          .564          .41           .307          .358          .307
FOOD           .632          .53           .469          .408          .367          .326
HACKERS        .625          .625          .625          .562          .5            .5
SOLAR          .625          .437          .312          .25           .187          .125
DOWJONES       .6            .6            .566          .533          .5            .6
CHINA          .56           .463          .439          .439          .39           .341
DJI-13         .538          .538          .461          .461          .461          .538
INSURANC       .52           .52           .44           .44           .44           .4
=================================================================================================
COAL           .5            .5            .666          .5            .5            .5
MARIJUAN       .5            .4            .4            .2            .2            .2
=================================================================================================
LOWPRICE       .486          .445          .41           .401          .387          .343
BIOTECH        .46           .472          .442          .44           .37           .373
BEVERAGE       .428          .357          .357          .428          .428          .5
GOLD           .355          .333          .111          .111          .088          .066
EDU            .166          .166          .333          .166          .333          .166
|
===================================================================================
Thursday - 5:40AM - 7/13/2023 - DJI Futures +60 NASDAQ
Futures +111 Data Used - 7/12/2023
| |
7/12/2023
|
|
| |
Market Comments
Breadth,
Closing Powera, Relative Strength lines and the nature of the market's
leadership
now are all bullish. There is no point in being hedged or short. The
tech
stocks, especially semi-condictors and AI stocks should stay strong.
The new
strength elsewhere is inviting, but I prefer to see that as confirmation
that a new
bull market may be starting, in which case the leading semi-conductors,
especially
NVDA and SOXL, can only go higher, quite possibly much higher.
The poet
William Carlos Williams wrote a cryptic four line poem in which
he
declared: "It all depends on a red wheel-barrow". What did he mean?.
That we
should appreciate farmers, chicken and rain more. Possibly.
Who really
knows? But regarding the stock market, as always,
"It all depends on the Federal Reserve"
And how
they will nterpret the latest 3% CPI numner.
A
DJI breakout next above 35000 would signal the completion of a very
bullish inverted head and shoulders pattern. The tech group leadership
and
impressive relative strength continues. As at the start of other
bull
markets, we not only see Semi-conductors and techs turning up first,
we
also see impressive advances in our Closing Power while the
Opening Powers lag noticeably. In essence, Professionals are buying
shares aggressively from a more cautious and even still timid Public.
While
it's true the DJI's volume indicators, especially OBV, is badly
lagging, the A/D Line has turned up very strongly and we are seeing a broad
rally
because bulls hope that the lastest 3% CPI 12-month number will bring
a
lasting pause in the FED's rush to raise rates and to sell off its massive
inventory of debts. See in Table 3 that the leaders now include more
cyclical airlines, autos, copper and Infrastructure as well as housing and
banking. The 10 year bond rates even fell below 4% today. Bomds
jumped up broadly...
All
this was because a more "dovish:" set of monetary policies can
now
be argued for persusasively when next the FED meets. We may even
hope
that Powell, a politically astute DC milionaire, will decide to join with
the
President in claiming a "soft landing" has been achieved.
Of
course, this may prove premature. But not in the short- to intermediate-run,
while
our Closing Powers are bullishly rising.
|
|
| |
7/12/2023
2022 PEERLESS DJI, Signals, Indicators Daily DJI Volume
10-DayUp/Down Vol Stoch-20 CCI RSI Pct of All Stocks above 65-dma
Inverted Traders Index
DJI-IPA DJI-OBV Short-Term Rates
NASDAQ S&P OEX NYSE DJ-15 DJ-20 DJI-30
Tiger Index of Big
Banks Bond
Funds Gold Stocks
Housing Stocks
Insurance-Stocks
Regional Banks
Russell-1000
Semi Conductors
Recent 2006 vers-Peerless signals http://tigersoftware.com/oldpeer/UPD90712.bmp
Note the old Buy "b" trading signals. They are not safe to use when
A/D Line
is below its 21-dma: See OLD06
OLD0607
OLD07 OLD0708 OLD08 OLD0809
ETFs: DIA QQQ SPY IWM MDY
TNA Short-Term Rates Ten Year Rates PST (Short Treasuries)
DOLLAR-UUP
ALLSTOCKs
COIN (Bit
Coin ETF)
USO-CrudeOil DBO
BLDP FAS GLD HD IBB JETS JNUG KOL NAIL NUGT
NRGU OIH PALL RSX RETL SDS AGQ SLV SOXL TAN TECL TLT TMF TNA
UGA USO China: YINN CHAU
Commodities: CANE CORN DBC JJC, NIB CORN, CUT (paper)
MOO, NRGU
SOYB WEAT UUP (Dollar) LIT
(Lithium) PALL
(Palladium)
Stocks
AA AAPL ADBE ALXN AMAT AMGN AMD AMZN ANET AXON AXP
BA BABA BAC BIDU BLDP BSX CAT CDNS CHKP CNX CPB CRM CVX CMG
DE DIS ENPH FB FSLR FTNT GILD GME GOOG GS HD IBM INTU JPM KO KR
LRCX MRK MRNA MOS MSFT NEM NFLX NKE NOC NUE NVDA PANW PG PYPL
QCOM QDEL REGN REV RE SCHW SNOW SO SQUARE TSLA TXN XOM V VRTX
WFC WMT XLE ZM ZOM
HOMEBUILDERS:
NAIL
BZH HOV MHO MTH PHM -
REGIONAL BANKS: EGBN FFIC GBCI HMST
Carl Icahn and
associates: IEP MS JEF
Leveraged Short ETFs:
FAZ - financials, TZA and SRTY- small caps, MZZ - mid caps, TECS -Techs,
SOXS -
semi-conductors LABD
- Biotechs
Bullish MAXCPs http://tigersoftware.com/upping/7-12-2023/Bullish.htm
Bearish MINCPs
www.tigersoftware.com/downing/7-12-2023/Bearish.htm
|
|

 |
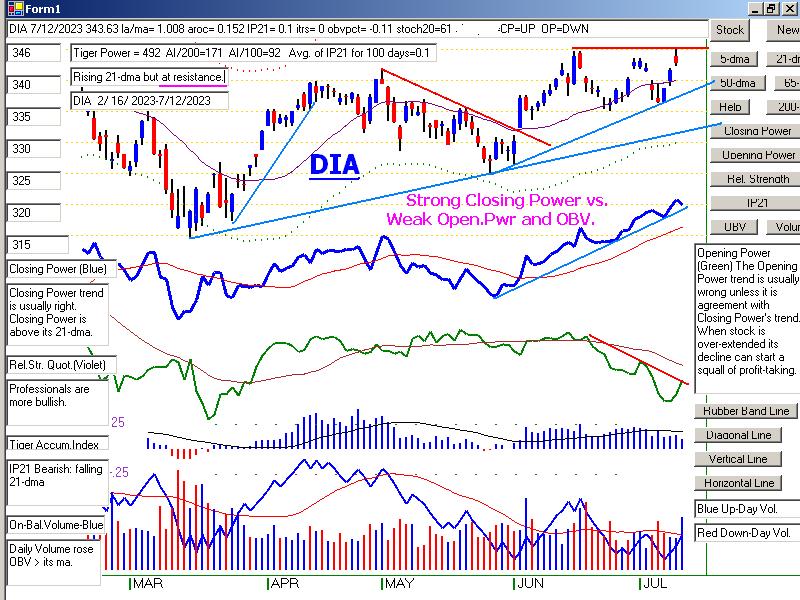 |
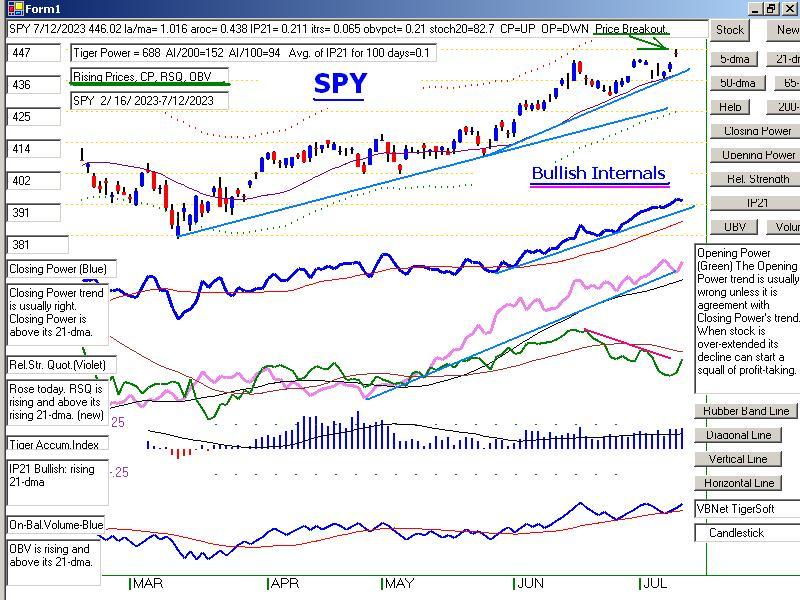 |
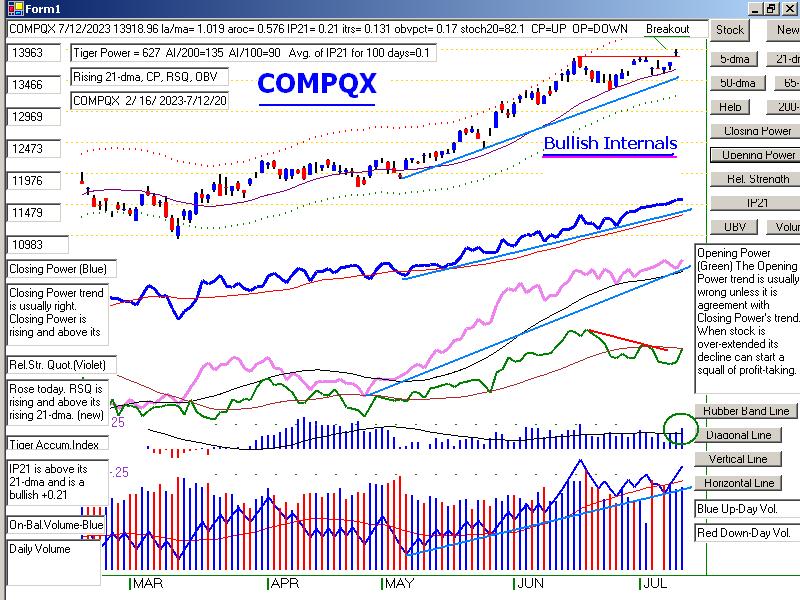 |
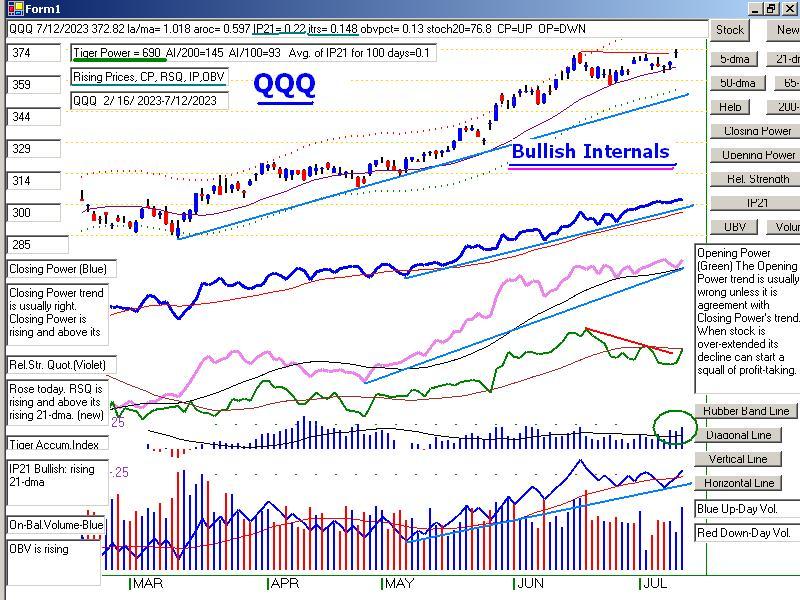 |
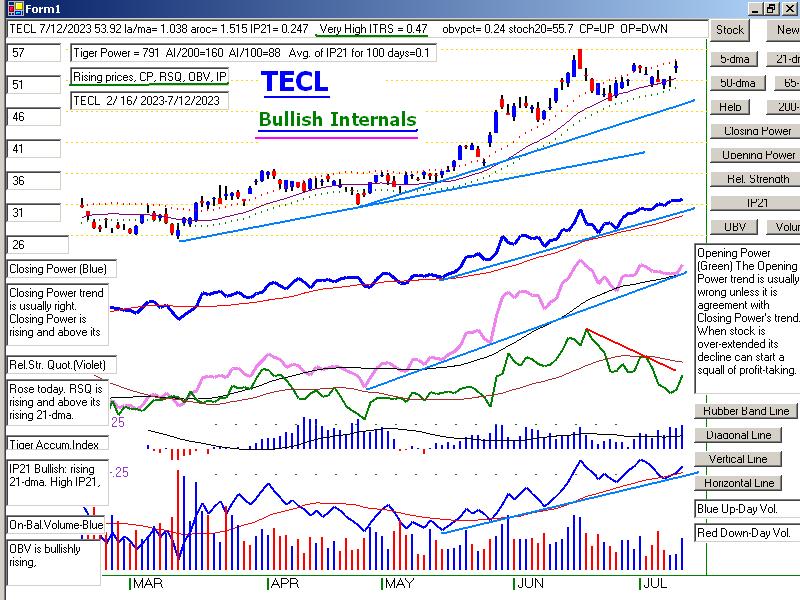 |
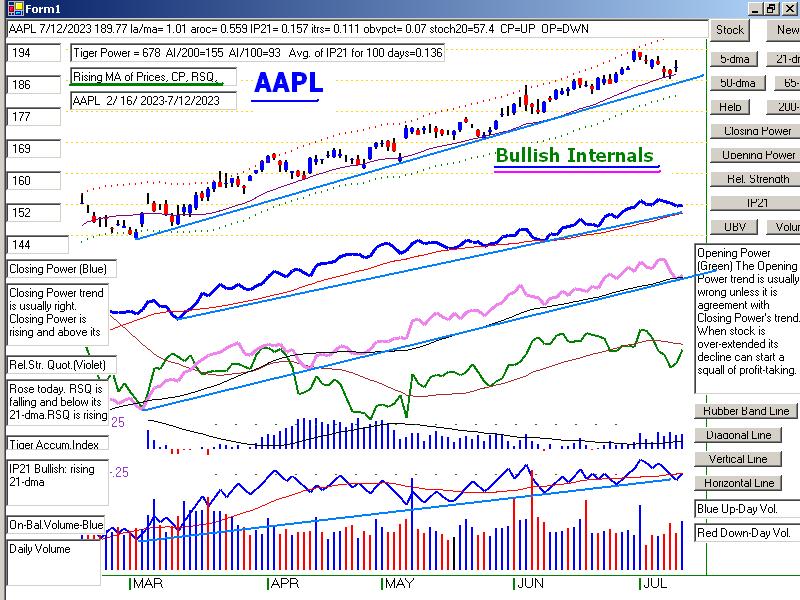 |
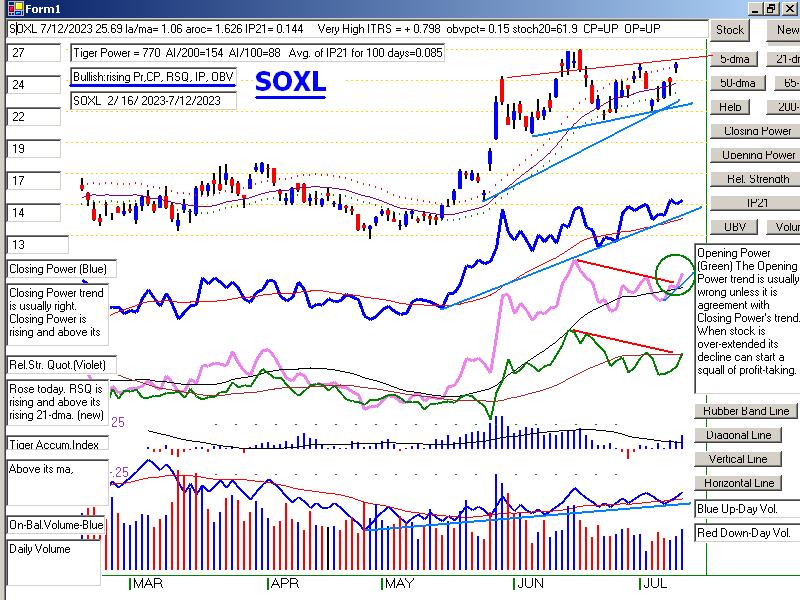 |
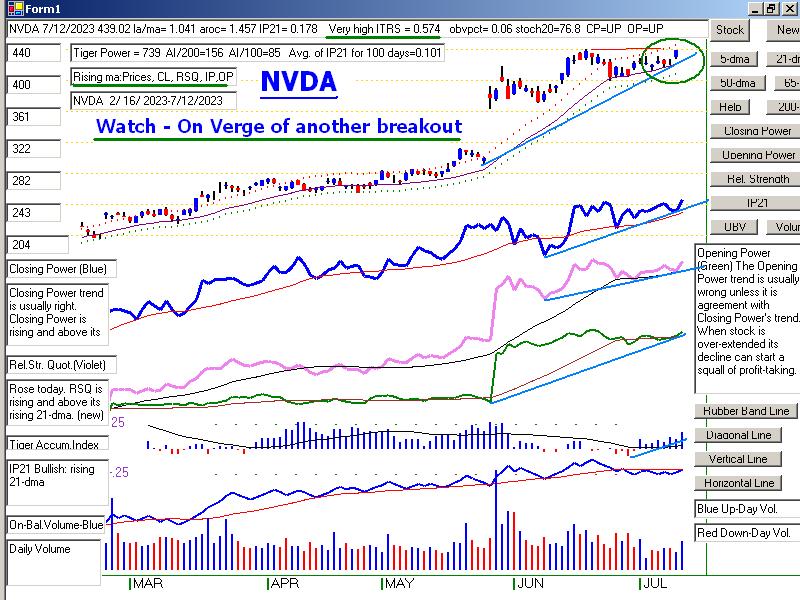 |
| |
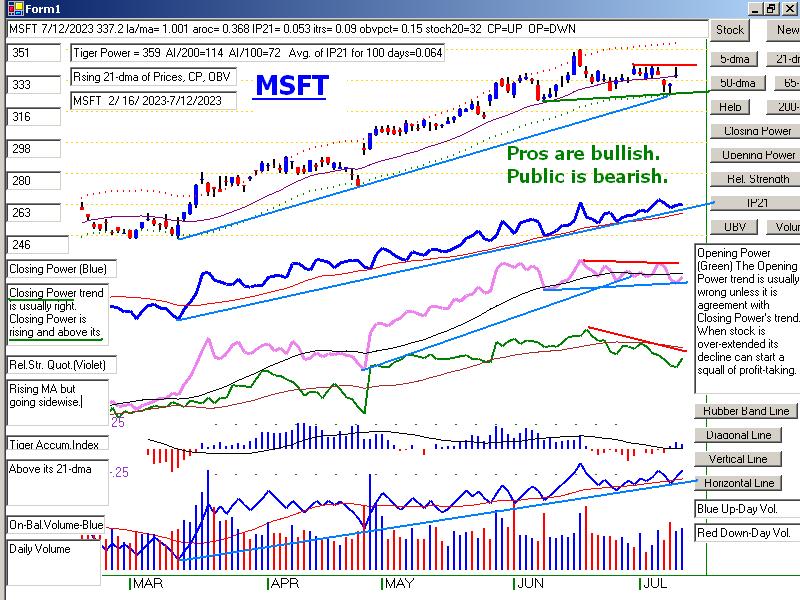 |
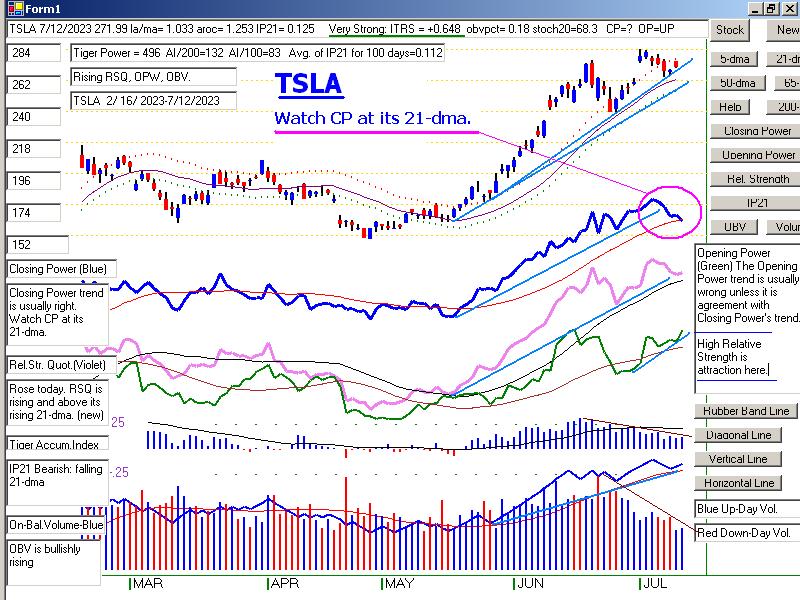 |
Table 1 - Daily Breadth and Volume Statistics
| NYSE |
Latest
Close |
Previous
Close |
Week
Ago |
| Issues
traded |
3,036 |
3,053 |
3,039 |
| Advances |
2,136 |
2,280 |
869 |
| Declines |
816 |
691 |
2,066 |
| Unchanged |
84 |
82 |
104 |
| New
highs |
216 |
148 |
53 |
| New
lows |
10 |
9 |
13 |
| Adv.
volume* |
592,978,611 |
652,194,837 |
288,041,474 |
| Decl.
volume* |
276,313,291 |
129,979,169 |
538,414,522 |
| Total
volume* |
874,027,340 |
788,659,326 |
836,159,294 |
| Closing
Arms (TRIN)† |
1.13 |
0.72 |
0.68 |
| Block
trades* |
4,211 |
3,950 |
4,050 |
| Adv.
volume |
2,723,590,320 |
2,953,533,165 |
1,309,228,678 |
| Decl.
volume |
1,174,341,830 |
642,296,447 |
2,131,233,872 |
| Total
volume |
3,920,298,203 |
3,624,223,769 |
3,482,620,879 |
| NASDAQ |
Latest
Close |
Previous
Close |
Week
Ago |
| Issues
traded |
4,573 |
4,572 |
4,556 |
| Advances |
2,893 |
2,807 |
1,539 |
| Declines |
1,506 |
1,570 |
2,838 |
| Unchanged |
174 |
195 |
179 |
| New
highs |
225 |
136 |
67 |
| New
lows |
52 |
49 |
66 |
| Closing
Arms (TRIN)† |
1.14 |
0.89 |
0.32 |
| Block
trades |
37,679 |
34,532 |
51,531 |
| Adv.
volume |
3,236,162,650 |
3,207,190,850 |
3,273,159,663 |
| Decl.
volume |
1,918,434,775 |
1,594,047,668 |
1,911,845,639 |
| Total
volume |
5,230,624,543 |
4,840,955,881 |
5,339,342,066 |
|
Table 2 QUICKSILVER on ETFS - 7/12/2023 ---
     Bullish = 9   COMPQX, SPY, QQQ, MDY, RETL, SOXL (+.942), TECL (+.718), DBO(.265), OIH
     Bearish = 0
ETF       CLOSE     CHANGE    PIVOT-PT  5-dma AROC   CL-PWR  CANDLE  IP21    ITRS  POWER INDEX
==================================================================================================
DIA       343.63   .99       339.23        12%     Bullish  RED    .1    0    -----   -----
---------------------------------------------------------------------------------------------
COMPQX    13918.96   158.26  13679.04      46.4%     Bullish  BLUE   .243    .131     .374
---------------------------------------------------------------------------------------------
SPY       446.02   3.56      439.66        32.8%     Bullish  RED    .212    .065     .277
---------------------------------------------------------------------------------------------
QQQ       372.82   4.65      367.46        34.5%     Bullish  BLUE   .221    .148     .369
---------------------------------------------------------------------------------------------
MDY       490.15   3.66      470.51        149.5%     Bullish  RED    .189    .07     .259
---------------------------------------------------------------------------------------------
IWM       191.87   2.07      182.78        163.5%     Bullish  RED    .061    .088     .149
---------------------------------------------------------------------------------------------
FAS       67.07   1.26       62.49         219.5%     Bullish  RED    .176    .065     .241
---------------------------------------------------------------------------------------------
RETL      7.89   .02         6.87          523.1%     Bullish  RED    .244    .191     .435
---------------------------------------------------------------------------------------------
SOXL      25.69   1.35       22.98         388.3%     Bullish  BLUE   .144    .798     .942
---------------------------------------------------------------------------------------------
TECL      53.92   1.75       52.13         122%     Bullish  BLUE   .248    .47        .718
---------------------------------------------------------------------------------------------
IBB       127.96   1.24      125.45        36.9%     Bullish  RED    .071   -.027      .044
---------------------------------------------------------------------------------------------
GLD       181.88   2.43      177.31        113.2%     Bearish  BLUE  -.091   -.023    -.114
---------------------------------------------------------------------------------------------
DBO       14.99   .18        14.25         234.8%     -------  ----   .256    .009     .265
---------------------------------------------------------------------------------------------
OIH       323.79   2.54      288.02        551.1%     Bullish  RED    .258    .174     .432
---------------------------------------------------------------------------------------------
CPER     23.77   .51         23.11         129%     -------  BLUE   .011     -.011       0
---------------------------------------------------------------------------------------------
TAN     71.32   1.96         67.36         111.2%     Bullish  BLUE   .039   -.017     .022
---------------------------------------------------------------------------------------------
UUP       27.76  -.33        28.47        -137.8%     Bearish  RED   -.364   -.007    -.371
---------------------------------------------------------------------------------------------
CORN      21.83  -.72        22.75        -73.5%     Bearish  RED   -.082   -.074     -.156
---------------------------------------------------------------------------------------------
WEAT      6.31  -.23         6.51         -268.6%     -------  RED   -.104   -.019    -.123
---------------------------------------------------------------------------------------------
YINN      37.6   3.11        31.92         394.8%     Bullish  BLUE   .111   -.086     .025
|
Table 3      RANKING OF KEY DIRECTORIES BASED PCT.OF STOCKS ABOVE 65-DMA
             7/12/23
Bullish = 41
Bearish = 8
---------------------------------------------------------------------------------------
Directory     Current       day-1         day-2         day-3         day-4         day-5
----------------------------------------------------------------------------------------
HOMEBLDG       1             .928          .928          .892          .857          .892
TRANSP         1             1             .947          .947          .947          .947
NIFTY          .886          .909          .795          .772          .772          .795
AUTO           .867          .867          .792          .773          .754          .792
REIT           .86           .795          .737          .688          .606          .721
BIGBANKS       .857          .571          .571          .428          .428          .714
             Big Jump
COPPER         .857          .428          .285          .285          .142          .285
COMPUTER       .85           .8            .75           .75           .75           .75
JETS           .846          .846          .846          .846          .846          .846
SEMI           .835          .813          .78           .736          .758          .769
INFRA          .806          .741          .709          .709          .58           .741
-------------------------------------------------------------------------------------------------
GUNS           .785          .714          .642          .5            .571          .642
RETAIL         .782          .76           .673          .586          .608          .608
RUS-1000       .777          .749          .7            .67           .639          .693
FIDSTKS        .775          .745          .656          .644          .621          .704
NASD-100       .772          .762          .742          .693          .683          .762
CHEM           .767          .72           .651          .604          .558          .558
ETFS           .763          .581          .472          .472          .309          .527
OILGAS         .762          .742          .577          .556          .36           .505
HIGHPRIC       .761          .748          .727          .688          .683          .718
ELECTRON       .759          .736          .721          .699          .699          .714
SP500          .757          .739          .674          .649          .635          .694
EAT            .756          .756          .756          .682          .634          .658
FINANCE        .75           .637          .612          .562          .5            .65
SOFTWARE       .75           .714          .696          .66           .66           .696
INDEXES        .74           .729          .718          .686          .643          .691
GAMING         .736          .631          .631          .578          .421          .526
REGBANKS       .736          .605          .552          .526          .394          .447
MILITARY       .73           .769          .576          .576          .653          .692
SP-100         .711          .7            .611          .566          .577          .655
INDMATER       .68           .625          .583          .569          .472          .513
HACKERS        .625          .625          .562          .5            .5            .5
HOSPITAL       .615          .692          .692          .692          .692          .769
GREEN          .611          .555          .555          .555          .555          .555
DOWJONES       .6            .566          .533          .5            .6            .633
BONDFUND       .597          .379          .356          .264          .126          .436
UTILITY        .564          .41           .307          .358          .307          .461
COMODITY       .55           .475          .375          .35           .325          .35
DJI-13         .538          .461          .461          .461          .538          .538
FOOD           .53           .489          .387          .367          .346          .367
INSURANC       .52           .44           .44           .44           .4            .4
--------------------------------------------------------------------------------------------------
COAL           .5            .666          .5            .5            .5            .5
--------------------------------------------------------------------------------------------------
BIOTECH        .47           .44           .442          .37           .378          .398
CHINA          .463          .439          .439          .39           .341          .341
LOWPRICE       .445          .413          .404          .387          .337          .384
SOLAR          .437          .312          .25           .187          .125          .187
MARIJUAN       .4            .4            .2            .2            .2            .2
BEVERAGE       .357          .357          .428          .428          .571          .5
GOLD           .333          .111          .111          .088          .066          .066
EDU            .166          .333          .166          .333          .166          .166
|
====================================================================================
Wednesday
- 6:12 AM - 7/12/2023 - DJI
Futures +20 NASDAQ Futures +30 Data Used - 7/11/2023
| |
7/11/202
|
|
| |
Market Comments
The CPI numbers released today show that the yearly rate of Inflation has fallen to 3%.
If the FED wanted to, it could pause for several months and await the evidence of
the next few CPI monthly numbers before raising rates. Seems reasonable. And
that's
why the DJI has been rising along with the NYSE, SPY, QQQ, TECL... It why they
are all challenging their highs. It's why breadth has become so positive. It's
why home-building
and oil service stocks, airlines and consumer stocks of all sorts are so strong. And
it's
why the DJI may even complete an inverted head and shoulders pattern and launch
a new bull market.
But all this depends on the FED now. Will it keep selling off its massive
quantitites
of debt instruments? Will it not be happy until Unemployment goes back up to 5%?
We must wait to find out. But in the meantime, stay long stocks in the strongest
sectors
shown in Table 3. Watch the Closing Power uptrends of the key stocks and the major
ETFs.
We should be very bullish now, if we judge by how much more bullish Professionals
are than the Public, as measured by the falling Opening Power. This is a bullish
divergence or juxtaposition. It is reminiscent of the start of the bull markets back
in
2003, 2009 and 2020. Will professionals be right again this time? The weak OBV
Line for for DJI say's "No', if its a powerful new bull market you want. But if
its still
more big gains in the leading stocks and sectors, I'd have to say "Yes", so long
as the
key Closing Powers are rising. CONSUMER PRICE INDEX - JUNE 2023
The Consumer Price Index for All Urban Consumers (CPI-U) rose 0.2 percent in June on a seasonally
adjusted basis, after increasing 0.1 percent in May, the U.S. Bureau of Labor Statistics reported
today. Over the last 12 months, the all items index increased 3.0 percent before seasonal
adjustment.
The index for shelter was the largest contributor to the monthly all items increase, accounting
for over 70 percent of the increase, with the index for motor vehicle insurance also contributing.
The food index increased 0.1 percent in June after increasing 0.2 percent the previous month. The
index for food at home was unchanged over the month while the index for food away from home rose
0.4 percent in June. The energy index rose 0.6 percent in June as the major energy component
indexes were mixed.
|
|
| |
7/11/2023
2022 PEERLESS DJI, Signals, Indicators Daily DJI Volume
10-DayUp/Down Vol Stoch-20 CCI RSI Pct of All Stocks above 65-dma
Inverted Traders Index
DJI-IPA DJI-OBV Short-Term Rates
NASDAQ S&P OEX NYSE DJ-15 DJ-20 DJI-30
Tiger Index of Big
Banks Bond
Funds Gold Stocks
Housing Stocks
Insurance-Stocks
Regional Banks
Russell-1000
Semi Conductors
Recent 2006 vers-Peerless signals http://tigersoftware.com/oldpeer/UPD90711.bmp
Note the old Buy "b" trading signals. They are not safe to use when
A/D Line
is below its 21-dma: See OLD06
OLD0607
OLD07 OLD0708 OLD08 OLD0809
ETFs: DIA QQQ SPY IWM MDY
TNA Short-Term Rates Ten Year Rates PST (Short Treasuries)
DOLLAR-UUP
ALLSTOCKs
COIN (Bit
Coin ETF)
USO-CrudeOil DBO
BLDP FAS GLD HD IBB JETS JNUG KOL NAIL NUGT
NRGU OIH PALL RSX RETL SDS AGQ SLV SOXL TAN TECL TLT TMF TNA
UGA USO China: YINN CHAU
Commodities: CANE
CORN DBC JJC, NIB CORN, CUT (paper)
MOO, NRGU
SOYB WEAT UUP (Dollar) LIT
(Lithium) PALL
(Palladium)
Stocks
AA AAPL ADBE ALXN AMAT AMGN AMD AMZN ANET AXON AXP
BA BABA BAC BIDU BLDP BSX CAT CDNS CHKP CNX CPB CRM CVX CMG
DE DIS ENPH FB FSLR FTNT GILD GME GOOG GS HD IBM INTU JPM KO KR
LRCX MRK MRNA MOS MSFT NEM NFLX NKE NOC NUE NVDA PANW PG PYPL
QCOM QDEL REGN REV RE SCHW SNOW SO SQUARE TSLA TXN XOM V VRTX
WFC WMT XLE ZM ZOM
HOMEBUILDERS:
NAIL
BZH HOV MHO MTH PHM -
REGIONAL BANKS: EGBN FFIC GBCI HMST
Carl Icahn and
associates: IEP MS JEF
Leveraged Short ETFs:
FAZ - financials, TZA and SRTY- small caps, MZZ - mid caps, TECS -Techs,
SOXS -
semi-conductors LABD
- Biotechs
Bullish MAXCPs http://tigersoftware.com/upping/7-11-2023/Bullish.htm
Bearish MINCPs www.tigersoftware.com/downing/7-11-2023/Bearish.htm |
|
 |
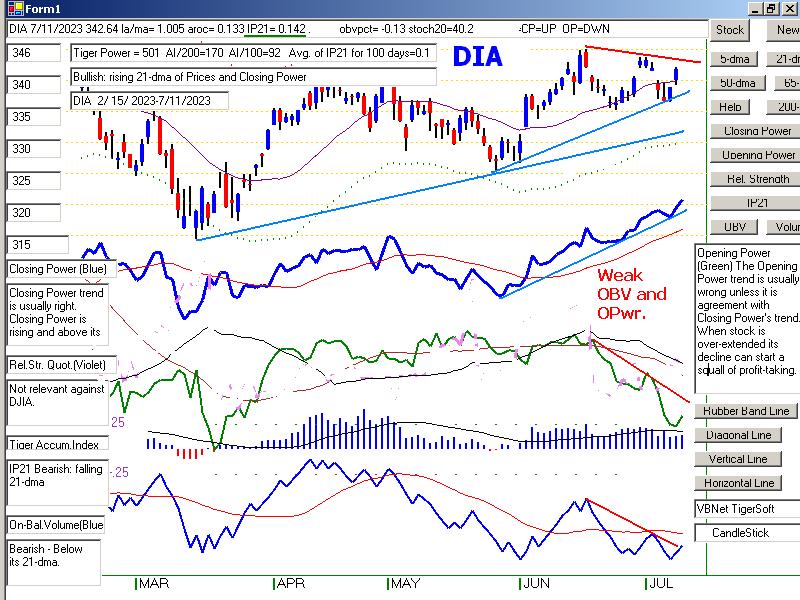 |
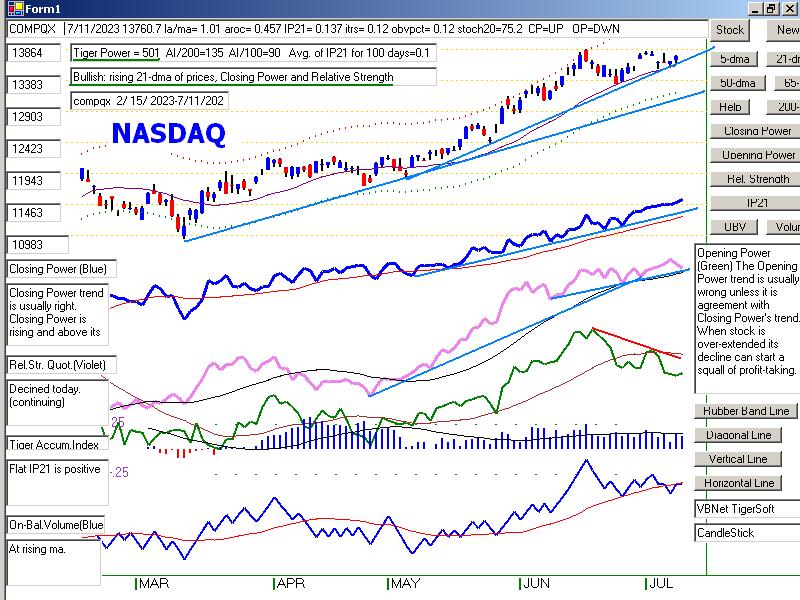 |
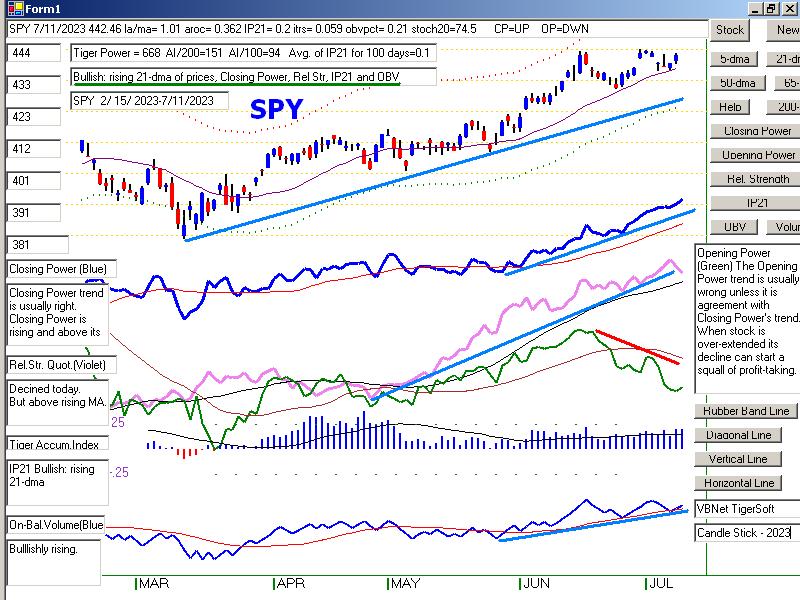 |
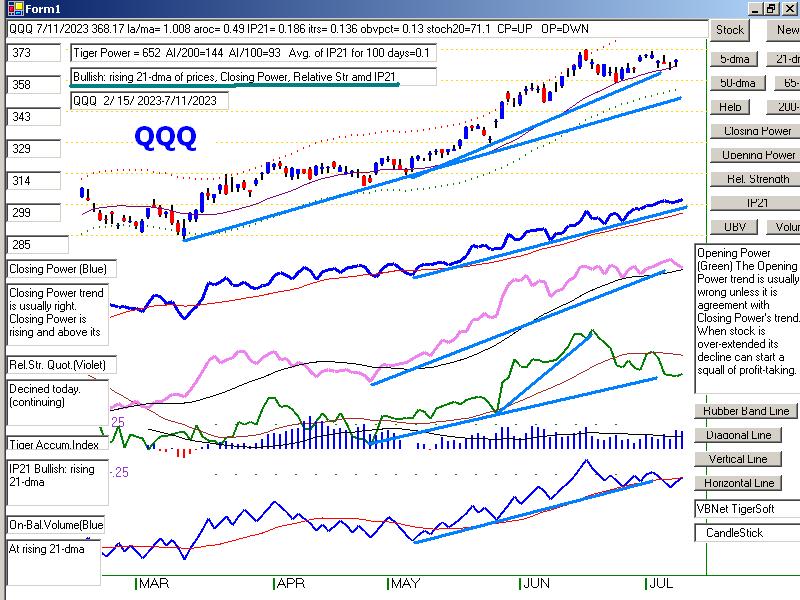 |
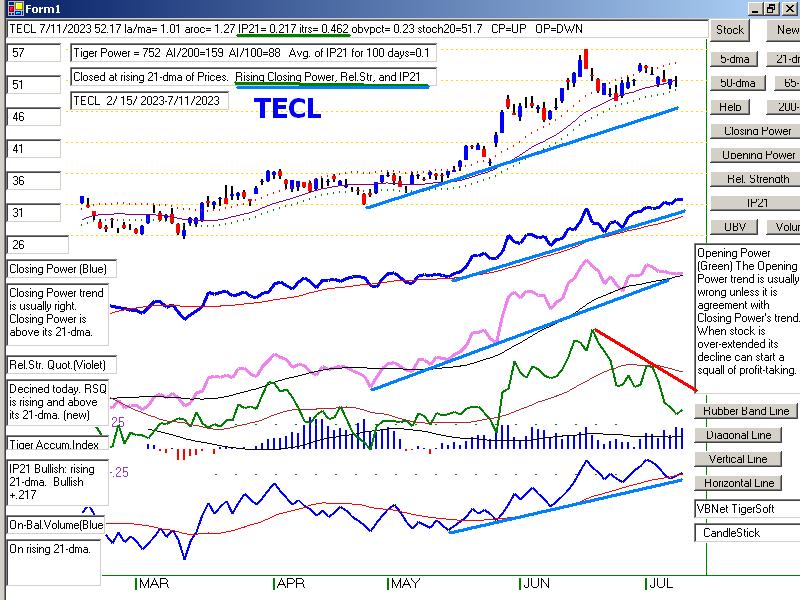 |
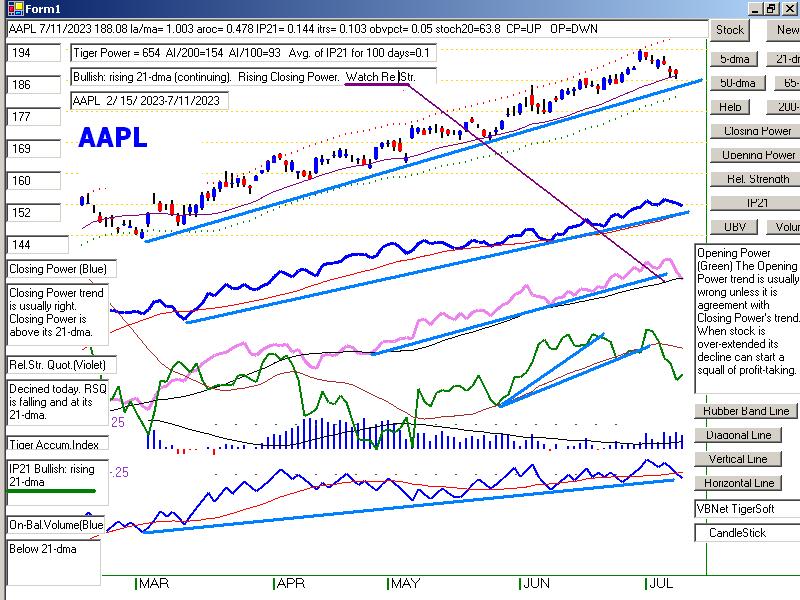 |
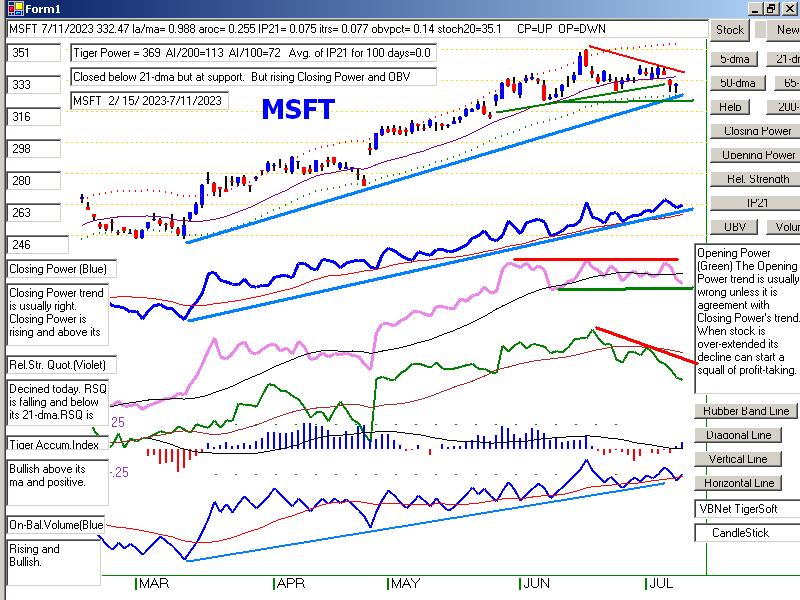 |
 |
 |
 |
| NYSE |
Latest
Close |
Previous
Close |
Week
Ago |
| Issues
traded |
3,053 |
3,049 |
3,018 |
| Advances |
2,280 |
2,049 |
2,033 |
| Declines |
691 |
899 |
890 |
| Unchanged |
82 |
101 |
95 |
| New
highs |
148 |
81 |
93 |
| New
lows |
9 |
25 |
7 |
| Adv.
volume* |
652,194,837 |
562,565,023 |
340,351,448 |
| Decl.
volume* |
129,979,169 |
240,906,675 |
113,910,323 |
| Total
volume* |
788,659,326 |
812,609,429 |
460,443,231 |
| Closing
Arms (TRIN)† |
0.72 |
0.91 |
0.69 |
| Block
trades* |
3,950 |
3,844 |
3,498 |
| Adv.
volume |
2,953,533,165 |
2,409,569,232 |
1,538,490,013 |
| Decl.
volume |
642,296,447 |
959,859,670 |
466,961,319 |
| Total
volume |
3,624,223,769 |
3,429,609,476 |
2,034,289,064 |
| NASDAQ |
Latest
Close |
Previous
Close |
Week
Ago |
| Issues
traded |
4,572 |
4,578 |
4,372 |
| Advances |
2,807 |
2,924 |
2,520 |
| Declines |
1,570 |
1,445 |
1,673 |
| Unchanged |
195 |
209 |
179 |
| New
highs |
136 |
73 |
85 |
| New
lows |
49 |
58 |
60 |
| Closing
Arms (TRIN)† |
0.89 |
0.55 |
0.72 |
| Block
trades |
34,532 |
41,170 |
22,200 |
| Adv.
volume |
3,207,190,850 |
4,116,120,602 |
1,943,638,732 |
| Decl.
volume |
1,594,047,668 |
1,122,154,752 |
929,500,839 |
| Total
volume |
4,840,955,881 |
5,275,394,582 |
2,902,307,829 |
|
Table 2 QUICKSILVER on ETFS - 7/11/2023 ---
     Bullish = 9   COMPQX, SPY, QQQ,  FAS, RETL,   SOXL (+.872), TECL (+.679), OIH(+.446)
     Bearish = 1   UUP
ETF       CLOSE     CHANGE    PIVOT-PT  5-dma AROC   CL-PWR  CANDLE  IP21    ITRS  POWER INDEX
==================================================================================================
DIA       342.64   3.06      342.81       -21%       Bullish  BLUE   .143    0     --------
---------------------------------------------------------------------------------------------
COMPQX    13760.7   75.22    13791.65     -20.4%     Bullish  BLUE   .208    .12     .328
---------------------------------------------------------------------------------------------
SPY       442.46   2.8       443.13       -15.1%     Bullish  BLUE   .201    .06     .261
---------------------------------------------------------------------------------------------
QQQ       368.17   1.81      370.28       -28.8%     Bullish  BLUE   .187    .136    .323
---------------------------------------------------------------------------------------------
MDY       486.49   5.23      475.86        72.3%     Bullish  BLUE   .187    .067    .254
---------------------------------------------------------------------------------------------
IWM       189.8   1.93       185.78        57.9%     Bullish  BLUE   .065    .08     .145
---------------------------------------------------------------------------------------------
FAS       65.81   2.25       64.27         79.4%     Bullish  BLUE   .205    .077    .282
---------------------------------------------------------------------------------------------
RETL      7.87   .46         7.13          477%      Bullish  BLUE   .229    .185    .414
---------------------------------------------------------------------------------------------
SOXL      24.34   .02        23.85        -240.4%    -------  RED    .087    .785    .872
---------------------------------------------------------------------------------------------
TECL      52.17   .34        52.65        -139.5%    Bullish  ----   .217    .462    .679
---------------------------------------------------------------------------------------------
IBB       126.72   .07       127.03       -3.6%      Bullish  BLUE   .096   -.032    .064
---------------------------------------------------------------------------------------------
GLD       179.45   .67       177.84        27.5%     Bearish  ----  -.158   -.042    -.2
---------------------------------------------------------------------------------------------
DBO       14.81   .32        14.31         254.6%    -------  BLUE   .193    .017     .21
---------------------------------------------------------------------------------------------
OIH       321.25   10.76     290.33        514%      -------  BLUE   .261    .185     .446
---------------------------------------------------------------------------------------------
CPER     23.26  -.15         23.17        -17.2%     -------  RED   -.045   -.037    -.082
---------------------------------------------------------------------------------------------
TAN     69.36  -.01          69.79        -148.8%    Bullish  BLUE  -.013   -.06     -.073
---------------------------------------------------------------------------------------------
UUP       28.09  -.07        28.54        -56.4%     Bearish  ----  -.3    .001      -.299
---------------------------------------------------------------------------------------------
CORN      22.55   .09        22.16         33.4%     Bearish  RED   -.03   -.052     -.082
---------------------------------------------------------------------------------------------
WEAT      6.54   .12         6.66          77%       -------  ----  -.049    .015    -.034
---------------------------------------------------------------------------------------------
YINN      34.49   .68        34.93        -256.1%    -------  BLUE   .017   -.158    -.141
---------------------------------------------------------------------------------------------
CORN      22.55   .09        22.16         33.4%     Bearish  RED   -.03   -.052     -.082
---------------------------------------------------------------------------------------------
WEAT      6.54   .12         6.66          77%       -------  ----  -.049    .015    -.034
---------------------------------------------------------------------------------------------
YINN      34.49   .68        34.93        -256.1%    -------  BLUE   .017   -.158    -.141
|
Table 3       RANKING OF KEY DIRECTORIES BASED PCT.OF STOCKS ABOVE 65-DMA
               7/11/23
Bullish = 35
Bearish = 15
---------------------------------------------------------------------------------------
Directory     Current       day-1         day-2         day-3         day-4         day-5
----------------------------------------------------------------------------------------
TRANSP         1             .947          .947          .947          .947          .947
HOMEBLDG       .928          .928          .892          .857          .892          .928
NIFTY          .909          .795          .772          .772          .795          .818
AUTO           .867          .811          .773          .754          .792          .811
JETS           .846          .846          .846          .846          .846          .846
SEMI           .813          .78           .736          .758          .769          .791
COMPUTER       .8            .75           .75           .75           .75           .7
----------------------------------------------------------------------------------------------------
REIT           .795          .729          .696          .614          .704          .762
MILITARY       .769          .576          .576          .653          .692          .73
NASD-100       .762          .742          .693          .683          .772          .752
RETAIL         .76           .673          .586          .608          .608          .63
EAT            .756          .756          .682          .634          .658          .707
RUS-1000       .749          .7            .67           .639          .693          .711
HIGHPRIC       .748          .727          .688          .683          .714          .735
FIDSTKS        .745          .656          .644          .621          .71           .686
OILGAS         .742          .577          .556          .36           .494          .577
INFRA          .741          .709          .709          .58           .741          .806
SP500          .739          .674          .649          .633          .696          .7
ELECTRON       .736          .721          .699          .699          .706          .766
INDEXES        .729          .718          .686          .643          .691          .708
CHEM           .72           .651          .604          .558          .558          .744
GUNS           .714          .642          .5            .571          .642          .714
SOFTWARE       .714          .714          .66           .66           .696          .714
SP-100         .7            .611          .566          .577          .677          .655
HOSPITAL       .692          .692          .692          .692          .769          .769
COAL           .666          .5            .5            .5            .5            .5
FINANCE        .637          .612          .562          .487          .65           .762
GAMING         .631          .631          .526          .473          .526          .684
HACKERS        .625          .562          .5            .5            .5            .562
INDMATER       .625          .583          .569          .472          .513          .597
REGBANKS       .605          .552          .526          .394          .447          .552
ETFS           .581          .472          .472          .309          .545          .6
BIGBANKS       .571          .571          .428          .428          .714          .714
DOWJONES       .566          .533          .5            .6            .633          .666
GREEN          .555          .555          .555          .555          .555          .611
================================================================================================
FOOD           .489          .408          .346          .346          .367          .367
COMODITY       .475          .4            .325          .325          .35           .35
DJI-13         .461          .461          .461          .538          .538          .538
INSURANC       .44           .44           .44           .4            .4            .48
CHINA          .439          .439          .39           .341          .341          .341
BIOTECH        .437          .44           .373          .378          .398          .422
COPPER         .428          .285          .285          .142          .285          .571
LOWPRICE       .413          .407          .39           .337          .372          .401
UTILITY        .41           .307          .358          .307          .487          .333
MARIJUAN       .4            .2            .2            .2            .2            .4
BONDFUND       .379          .344          .264          .137          .425          .528
BEVERAGE       .357          .428          .428          .571          .571          .5
EDU            .333          .166          .333          .166          .166          .333
SOLAR          .312          .25           .187          .125          .187          .25
GOLD           .111          .111          .088          .066          .066          .111
|
===================================================================================
Tuesday
- 6:08 AM - 7/11/2023 - DJI
Futures +115 NASDAQ Futures +38 Data Used - 7/10/2023
| |
7/10/2023
|
|
| |
Market Comments
The A/D Line has been strong of late. Fear of the FED is diminishing.
And the DJI wants to go back to its recent highs, even though it will do
so on volume that is unconvincing. But that is not the big story.
The big story is not even the next CPI number which comes out tomorrow
morning or even how FED will choose to interpret it.
The big story is the wild advance in semi-conductors, the brains behind the
Artificial Intelligence revolution we are in the beginning stages of.
.
The first chart shown below is not the DJI today. It is our Tiger Index of
91 semi-conductors. The second chart is the QQQ's from back in 1999-2000.
Despite Sell S9 signals on the DJI in December and January back then, the QQQ
rose 100% between October 1999 and March 2000. One of the best
bullish clues that we had back then was how the QQQ's 'ITRS rose above +.20.
In other words, for the first since as far back as 1970 at the least, the tech
stocks out-performed the DJI's blue chip index by more than 20% over
a fifty day period.
There's much more to this story. On July 3rd of this year, the five biggest
components
of the QQQ, APPL, GOOG, MSFT, NVDA and TSLA, just by themselves,
comprised 51% of the QQQ. As we have been pointing out, these are
also the biggest components of the SP-500. They are its advance's main locomotives,
too. If you look at the A/D Line for the QQQ (shown below), you will see that
it
has been lagging the index for some time. We've pointed this out in previous SP-500
charts .
But this internal weakness in the QQQ, if that's what it is, will probably not soon
stop the semi-conductor rally or the strong advance in TECL, SOXL or even
in SPY and the NASDAQ. That is because they are all capitalization weighted.
The best performing components thus quite naturally are the most heavily
weighted. Until these leaders, QQQ, APPL, GOOG, MSFT and TSLA
go into reverse, the indexes and ETFs must go higher unless the very
mechanism of weighting is changed.
Today, the Gods of the QQQ Index decided they must put a check on this
internally reinforcing mechanism. They are now planning to reduce the
weight of these five stocks down from 51% to 40% at the end of the month.
It's not at all clear how this will affect the QQQ. On the one hand, it may
cause a lot of short-term selling in these Big 5 stocks by those who trade
the QQQ against their holding of its components. On the other hand, it
calls attention to the special bullishness of these five stocks and it also may
really be pointing out how hard-pressed these same arbitrage-minded traders
are trying to keep up with the demand for these stocks. Their shorts may be in
them may be in for big trouble.
I think the best thing we can do now is to be very bullish regarding SOXL, but
treat each of these 5 stocks separately and hold them simply so long as their
Closing Powers and Relative Strength Lines are rising. See their candle-stick
charts below. GOOG does not look so good. MSFT needs to rally
immediately.
But TSLA, NVDA and AAPL still look very good. |
|
| |
7/10/2023
2022 PEERLESS DJI, Signals, Indicators Daily DJI Volume
10-DayUp/Down Vol Stoch-20 CCI RSI Pct of All Stocks above 65-dma
Inverted Traders Index
DJI-IPA DJI-OBV Short-Term Rates
NASDAQ S&P OEX NYSE DJ-15 DJ-20 DJI-30
Tiger Index of Big
Banks Bond
Funds Gold Stocks
Housing Stocks
Insurance-Stocks
Regional Banks
Russell-1000
Semi Conductors
Recent 2006 vers-Peerless signals http://tigersoftware.com/oldpeer/UPD90710.bmp
ETFs: DIA QQQ SPY IWM MDY
TNA Short-Term Rates Ten Year Rates PST (Short Treasuries)
DOLLAR-UUP
ALLSTOCKs
COIN (Bit
Coin ETF)
USO-CrudeOil DBO
BLDP FAS GLD HD IBB JETS JNUG KOL NAIL NUGT
NRGU OIH PALL RSX RETL SDS AGQ SLV SOXL TAN TECL TLT TMF TNA
UGA USO China: YINN
Commodities: CANE
CORN DBC NIB CORN, CUT (paper)
MOO, NRGU
SOYB WEAT UUP (Dollar) LIT
(Lithium) PALL
(Palladium)
Stocks
AA AAPL ADBE ALXN AMAT AMGN AMD AMZN ANET AXON AXP
BA BABA BAC BIDU BLDP BSX CAT CDNS CHKP CNX CPB CRM CVX CMG
DE DIS ENPH FB FSLR FTNT GILD GME GOOG GS HD IBM INTU JPM KO KR
LRCX MRK MRNA MOS MSFT NEM NFLX NKE NOC NUE NVDA PANW PG PYPL
QCOM QDEL REGN REV RE SCHW SNOW SO SQUARE TSLA TXN XOM V VRTX
WFC WMT XLE ZM ZOM
HOMEBUILDERS:
NAIL
BZH HOV MHO MTH PHM -
REGIONAL BANKS: EGBN FFIC GBCI HMST
Carl Icahn and
associates: IEP MS JEF
Leveraged Short ETFs:
FAZ - financials, TZA and SRTY- small caps TECS -Techs,
SOXS -
semi-conductors LABD
- Biotechs
Bullish MAXCPs http://tigersoftware.com/upping/7-10-2023/Bullish.htm
Bearish MINCPs www.tigersoftware.com/downing/7-10-2023/Bearish.htm
|
|
| The take-off in Semi-conductors looks like the take-off of
QQQ in 1999-2000. |
 |
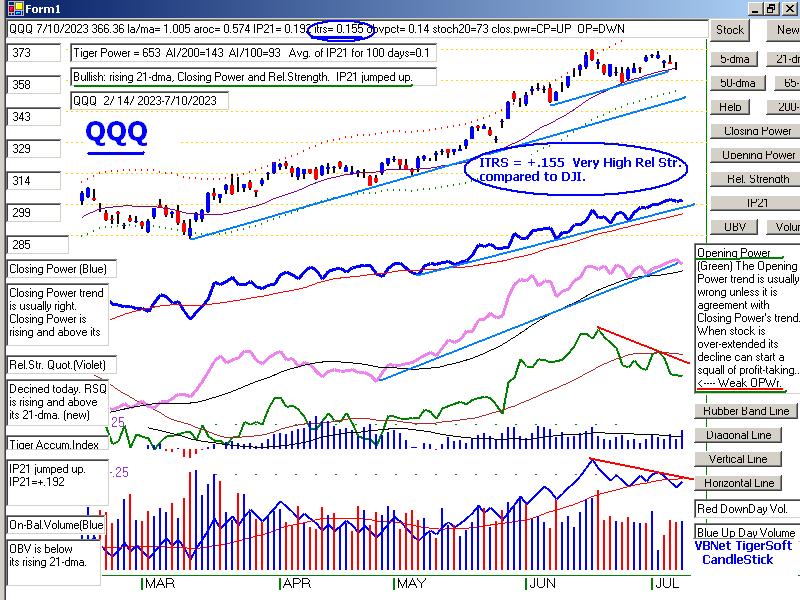 |
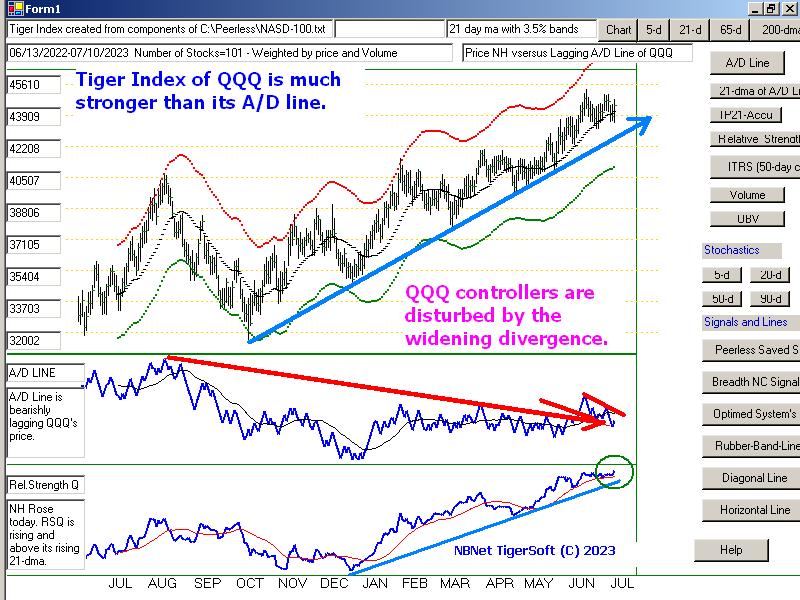 |
| |
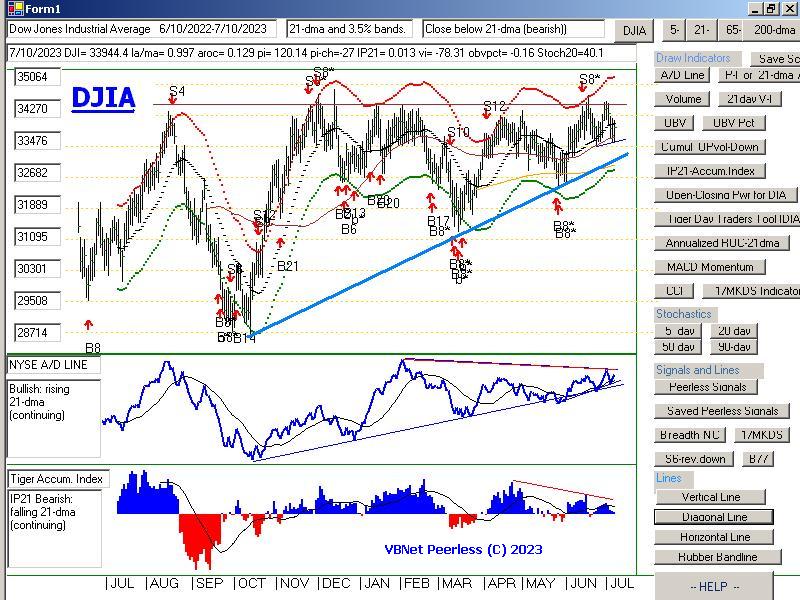
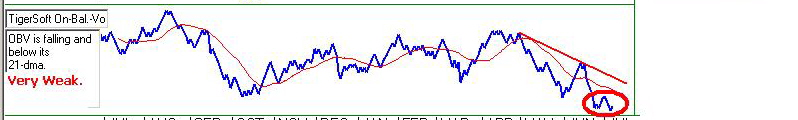 |
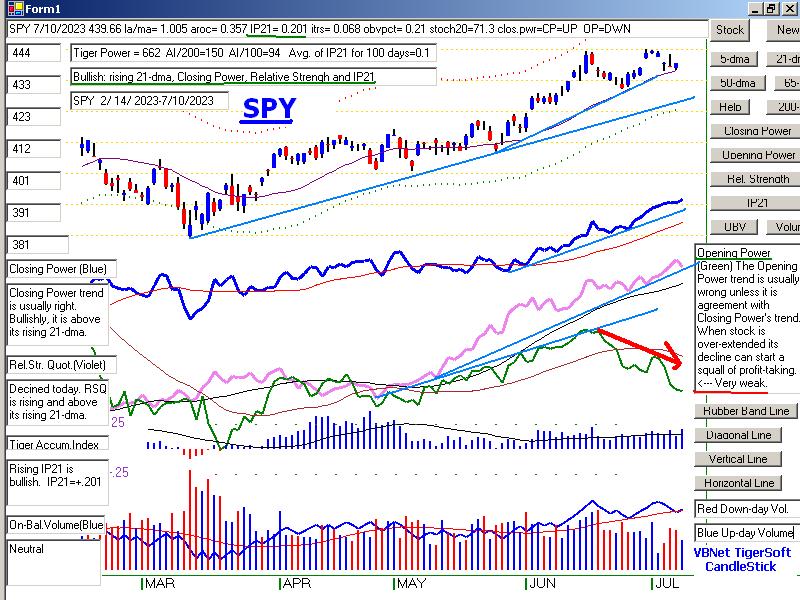 |
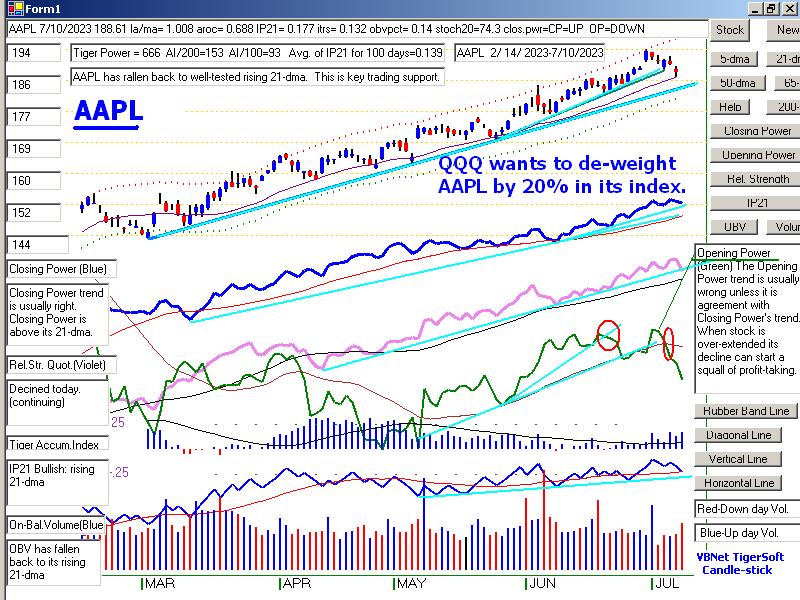 |
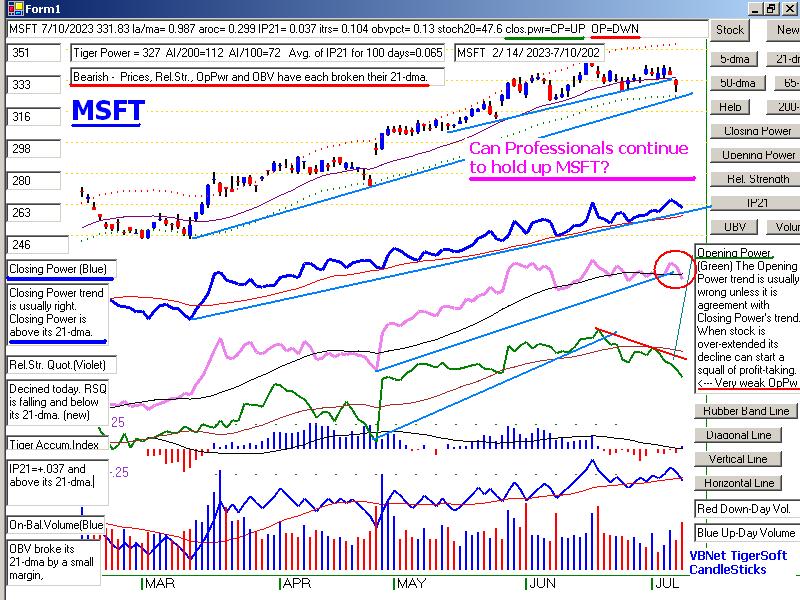 |
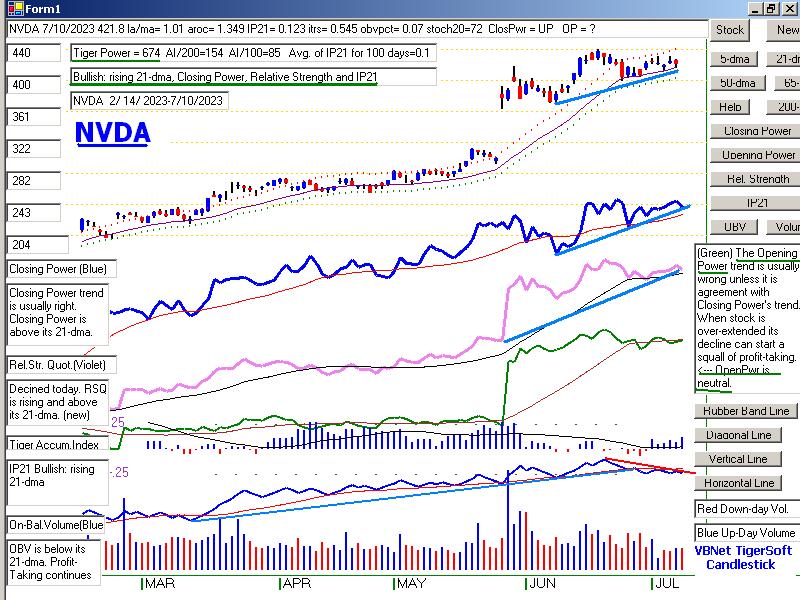 |
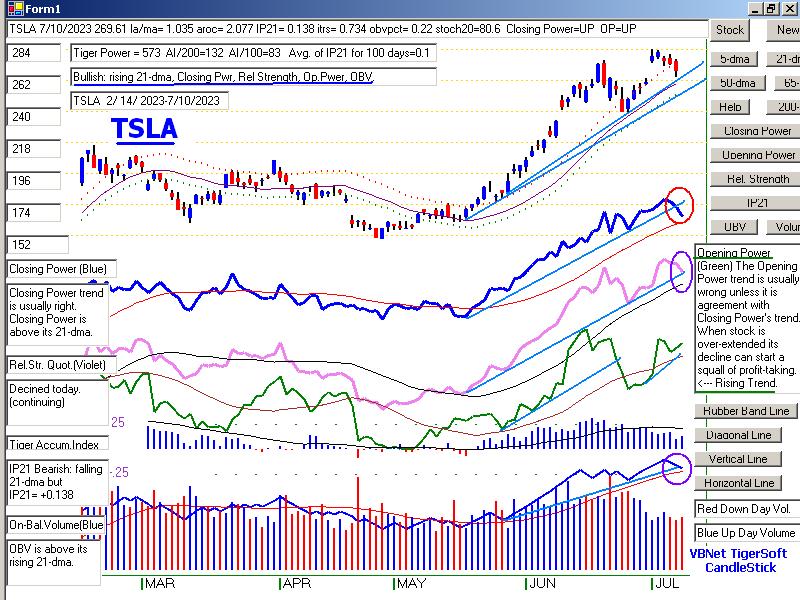 |
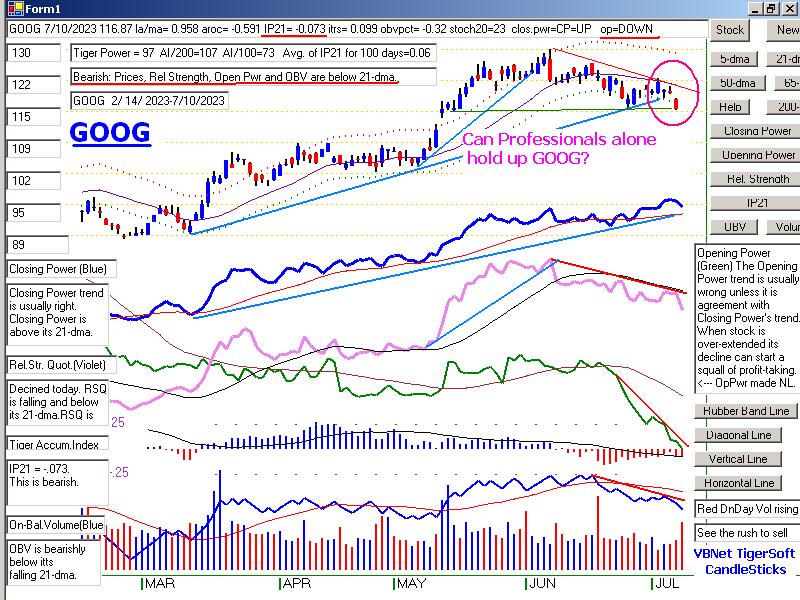 |
Table 1
Daily Breadth and Volume Statistics
| NYSE |
Latest
Close |
Previous
Close |
Week
Ago |
| Issues
traded |
3,049 |
3,043 |
3,018 |
| Advances |
2,049 |
2,108 |
2,033 |
| Declines |
899 |
821 |
890 |
| Unchanged |
101 |
114 |
95 |
| New
highs |
81 |
54 |
93 |
| New
lows |
25 |
21 |
7 |
| Adv.
volume* |
562,565,023 |
675,401,900 |
340,351,448 |
| Decl.
volume* |
240,906,675 |
247,274,619 |
113,910,323 |
| Total
volume* |
812,609,429 |
934,517,413 |
460,443,231 |
| Closing
Arms (TRIN)† |
0.91 |
0.86 |
0.69 |
| Block
trades* |
3,844 |
4,147 |
3,498 |
| Adv.
volume |
2,409,569,232 |
2,656,424,392 |
1,538,490,013 |
| Decl.
volume |
959,859,670 |
893,879,217 |
466,961,319 |
| Total
volume |
3,429,609,476 |
3,630,485,582 |
2,034,289,064 |
| NASDAQ |
Latest
Close |
Previous
Close |
Week
Ago |
| Issues
traded |
4,578 |
4,503 |
4,372 |
| Advances |
2,924 |
2,878 |
2,520 |
| Declines |
1,445 |
1,445 |
1,673 |
| Unchanged |
209 |
180 |
179 |
| New
highs |
73 |
57 |
85 |
| New
lows |
58 |
66 |
60 |
| Closing
Arms (TRIN)† |
0.55 |
1.29 |
0.72 |
| Block
trades |
41,170 |
41,934 |
22,200 |
| Adv.
volume |
4,116,120,602 |
3,072,507,227 |
1,943,638,732 |
| Decl.
volume |
1,122,154,752 |
1,991,239,107 |
929,500,839 |
| Total
volume |
5,275,394,582 |
5,098,120,228 |
2,902,307,829 |
|
Table 2 QUICKSILVER on ETFS - 7/10/2023 ---
Bullish = 8   COMPQX, QQQ,  FAS, RETL,   SOXL (+.893), TECL (+.76), OIH
Bearish = 1   UUP
ETF       CLOSE     CHANGE    PIVOT-PT  5-dma AROC     CL-PWR  CANDLE  IP21    ITRS  POWER INDEX
==================================================================================================
DIA       339.58     2.15      344.07       -62.5%     Bullish  BLUE   .138    0        -----
---------------------------------------------------------------------------------------------
COMPQX    13685.48   24.76   13816.77       -37.3%     Bullish  BLUE   .205    .135     .34
---------------------------------------------------------------------------------------------
SPY       439.66     1.11      443.79       -41%       Bullish  BLUE   .202    .067     .269
---------------------------------------------------------------------------------------------
QQQ       366.36      .12      370.29       -41.5%     Bullish  BLUE   .193    .155     .348
---------------------------------------------------------------------------------------------
MDY       481.26     6.06      479.6         24.7%     Bullish  BLUE   .156    .065     .221
---------------------------------------------------------------------------------------------
IWM       187.87     3.16      187.65        16.2%     Bullish  BLUE   .05    .076     .126
---------------------------------------------------------------------------------------------
FAS       63.56       .83       64.8         -1.6%     Bullish  BLUE   .199    .083     .282
---------------------------------------------------------------------------------------------
RETL      7.41        .37       7.19          276.6%   Bullish  BLUE   .241    .149     .39
---------------------------------------------------------------------------------------------
SOXL      24.32      1.36       25.49        -106.2%   -------  BLUE   .094    .799     .893
---------------------------------------------------------------------------------------------
TECL      51.83       .42       53.63        -207.5%   Bullish  BLUE   .223    .537     .76
---------------------------------------------------------------------------------------------
IBB       126.65     2.27      126.81       -12.3%     Bullish  BLUE   .095   -.036     .059
---------------------------------------------------------------------------------------------
GLD       178.78      .14      178.47        14.3%     Bearish  BLUE  -.153   -.052    -.205
---------------------------------------------------------------------------------------------
DBO       14.49      -.05       14.08         129.7%   -------  ----   .147   -.007     .14
---------------------------------------------------------------------------------------------
OIH       310.49     2.79      290.67        390.8%    -------  BLUE   .168    .135     .303
---------------------------------------------------------------------------------------------
CPER     23.41        .1        23.34         45.2%    -------  BLUE  -.024   -.028    -.052
---------------------------------------------------------------------------------------------
TAN     69.37        1.32       71.42        -147.3%   -------  BLUE  -.026   -.049    -.075
---------------------------------------------------------------------------------------------
UUP       28.16      -.07        28.41        -38.7%   Bearish  RED   -.324   -.003    -.327
---------------------------------------------------------------------------------------------
CORN      22.46       .11        22.4          60.3%   Bearish  ----  -.009   -.088    -.097
---------------------------------------------------------------------------------------------
WEAT      6.42       -.03         6.44         -15.4%  -------  ----  -.041   -.028    -.069
---------------------------------------------------------------------------------------------
YINN      33.81      -.13        36.24        -65.7%   Bearish  BLUE  -.019   -.144    -.163
|
Table 3       RANKING OF KEY DIRECTORIES BASED PCT.OF STOCKS ABOVE 65-DMA
               7/10/23
 Bullish = 33
 Bearish = 16
---------------------------------------------------------------------------------------
Directory     Current       day-1         day-2         day-3         day-4         day-5
----------------------------------------------------------------------------------------
TRANSP         .947          .947          .947          .947          .947          .947
HOMEBLDG       .928          .892          .857          .892          .928          .928
JETS           .846          .846          .846          .846          .846          .846
AUTO           .811          .792          .754          .792          .811          .792
-------------------------------------------------------------------------------------------------------
NIFTY          .795          .772          .772          .795          .818          .818
SEMI           .78           .736          .758          .769          .791          .791
EAT            .756          .682          .634          .658          .707          .707
COMPUTER       .75           .75           .75           .75           .7            .7
NASD-100       .742          .693          .683          .772          .752          .732
REIT           .729          .688          .622          .713          .754          .688
HIGHPRIC       .727          .688          .683          .714          .735          .744
ELECTRON       .721          .699          .699          .706          .751          .729
INDEXES        .718          .686          .643          .691          .708          .713
SOFTWARE       .714          .678          .66           .696          .714          .696
INFRA          .709          .709          .58           .741          .806          .741
RUS-1000       .7            .67           .639          .693          .71           .693
HOSPITAL       .692          .692          .692          .769          .769          .923
SP500          .674          .649          .633          .694          .696          .678
RETAIL         .673          .586          .608          .608          .63           .608
FIDSTKS        .656          .644          .621          .71           .686          .68
CHEM           .651          .604          .558          .558          .72           .674
GUNS           .642          .5            .571          .642          .714          .642
GAMING         .631          .526          .421          .578          .684          .631
FINANCE        .612          .562          .487          .637          .75           .637
SP-100         .611          .566          .577          .677          .655          .644
INDMATER       .583          .569          .472          .513          .597          .527
OILGAS         .577          .556          .36           .494          .577          .515
MILITARY       .576          .576          .653          .692          .73           .73
BIGBANKS       .571          .428          .428          .714          .714          .571
HACKERS        .562          .5            .5            .5            .562          .562
GREEN          .555          .555          .555          .555          .611          .611
REGBANKS       .552          .526          .394          .447          .526          .394
DOWJONES       .533          .5            .6            .633          .666          .666
====================================================================================================
COAL           .5            .5            .5            .5            .5            .5
====================================================================================================
ETFS           .472          .472          .309          .545          .618          .527
DJI-13         .461          .461          .538          .538          .538          .538
INSURANC       .44           .44           .4            .4            .48           .52
CHINA          .439          .39           .341          .341          .317          .317
BIOTECH        .437          .37           .38           .398          .417          .407
BEVERAGE       .428          .428          .571          .571          .5            .5
FOOD           .408          .367          .326          .367          .367          .326
LOWPRICE       .407          .392          .34           .372          .398          .363
COMODITY       .4            .35           .3            .35           .35           .3
BONDFUND       .344          .252          .137          .436          .54           .413
UTILITY        .307          .358          .307          .487          .333          .307
COPPER         .285          .285          .142          .285          .571          .285
SOLAR          .25           .187          .125          .187          .25           .187
MARIJUAN       .2            .2            .2            .2            .4            .3
EDU            .166          .333          .166          .166          .333          .333
GOLD           .111          .088          .066          .066          .111          .088
|
==================================================================================
Monday - 6:00 AM - 710/2023
- DJI Futures +12 NASDAQ Futures -24 Data Used - 7/7/2023
| |
7/7/2023
|
|
| |
Market Comments
A bounce
back up to 34000 seems to be shaping up this morning. Big bank earnings
seldom disappoint. A DJI
rally should help keep the tech advance going. Major
tech stocks (like AMAT, AAPL, LRCX,
NVDA, PANW, and TSLA) and our most
important tech ETFS (QQQ, TECL and
SOXL) all show very positive Closing Power
readings and uptrending Relative
Strength. The artificial intelligence revolution requires
lots and lots of smarter and
smarter chips. The FED cannot hold them back.
But the rest of the market is
considerably weaker. This is the body of the market
that will feel most directly the
effects of more interest rate increases and a continuation
by the FED of its unloading its
trillions of dollars worth of debt instruments.
Seasonality is very slightly
bullish for the DJI over the next two weeks. But since
1967, the DJI has thereafter tended
to fall back for the full next 21-trading days.
It has only been able to
advance 28.6% of the time over the month following
July 9th in the third years
of the 4-year Presidential cycle. This bearishness will
probably coincide with more
"hawkish" talk from the FED when next they meet.
It also fits neatly in with
the seemingly dim prospects for a really good rally while the
daily volume remains weak on
up-days.
We usually expect
Professional bulliahness to win out over Public bearishness
like we see now when we
contrast the uptrending Closing Powers and falling
Opening Powers. But not
always, as when the FED turns very "hawkish" or
when in the Summer,
Professionals tend to leave town, thus limiting their bullish
influence just when Big Money
as represented by our IP21-Accumulation Index
turns negative and net
bearish. This last concern now has started to be a problem
in the charts of such
previously strong stocks as ADBE, AMD, CDNS, FSLR,
GOOG, MSFT and home-builder
leader LEN. So, now we want to watch these to
see if the big-money selling
bullishly dries up.
The DJI remains boring, to be
blunt. Its moves are too smal to give it much
appeal. The SP-500 is
much better. And even better have been the longs in
QQQ, TECL and SOXL. I
don't see anything yet to change this. On the short
side, we have a few more
bearish MINCPs. But as long as the FED is doing its
bearish strut, the pressure
will remain on bonds and regional banks. If you want
to hedge, this is where I
would look.
VB Net Progress
See among the charts tonight
some of the new 6-month candle-stick charts
done with Visual Net Basic.
They may seem "crowded" with various indicators,
but undertand, when running
them you can apply whichever indicators you want.
This weekend I will start
working on longer term 5-year charts.
|
|
| |
7/7/2023
2022 PEERLESS DJI, Signals, Indicators Daily DJI Volume
10-DayUp/Down Vol Stoch-20 CCI RSI Pct of All Stocks above 65-dma
Inverted Traders Index
DJI-IPA DJI-OBV Short-Term Rates
NASDAQ S&P OEX NYSE DJ-15 DJ-20 DJI-30
Tiger Index of Big
Banks Bond
Funds Gold Stocks
Housing Stocks
Insurance-Stocks
Regional Banks
Russell-1000
Semi Conductors
Recent 2006 vers-Peerless signals http://tigersoftware.com/oldpeer/UPD90707.bmp
ETFs: DIA QQQ SPY IWM MDY
TNA Short-Term Rates Ten Year Rates PST (Short Treasuries)
DOLLAR-UUP
ALLSTOCKs
COIN (Bit
Coin ETF)
USO-CrudeOil DBO
BLDP FAS GLD HD IBB JETS JNUG KOL NAIL NUGT
NRGU OIH PALL RSX RETL SDS AGQ SLV SOXL TAN TECL TLT TMF TNA
UGA USO China: YINN
Commodities: CANE
CORN DBC NIB CORN, CUT (paper)
MOO, NRGU
SOYB WEAT UUP (Dollar) LIT
(Lithium) PALL
(Palladium)
Stocks
AA AAPL ADBE ALXN AMAT AMGN AMD AMZN ANET AXON AXP
BA BABA BAC BIDU BLDP BSX CAT CDNS CHKP CNX CPB CRM CVX CMG
DE DIS ENPH FB FSLR FTNT GILD GME GOOG GS HD IBM INTU JPM KO KR
LRCX MRK MRNA MOS MSFT NEM NFLX NKE NOC NUE NVDA PANW PG PYPL
QCOM QDEL REGN REV RE SCHW SNOW SO SQUARE TSLA TXN XOM V VRTX
WFC WMT XLE ZM ZOM
HOMEBUILDERS:
NAIL
BZH HOV MHO MTH PHM -
REGIONAL BANKS: EGBN FFIC GBCI HMST
Carl Icahn and
associates: IEP MS JEF
Leveraged Short ETFs:
FAZ - financials, TZA and SRTY- small caps TECS -Techs,
SOXS -
semi-conductors LABD
- Biotechs
Bullish MAXCPs http://tigersoftware.com/upping/7-07-2023/Bullish.htm
Bearish MINCPs www.tigersoftware.com/downing/7-07-2023/Bearish.htm
|
|
 |
 |
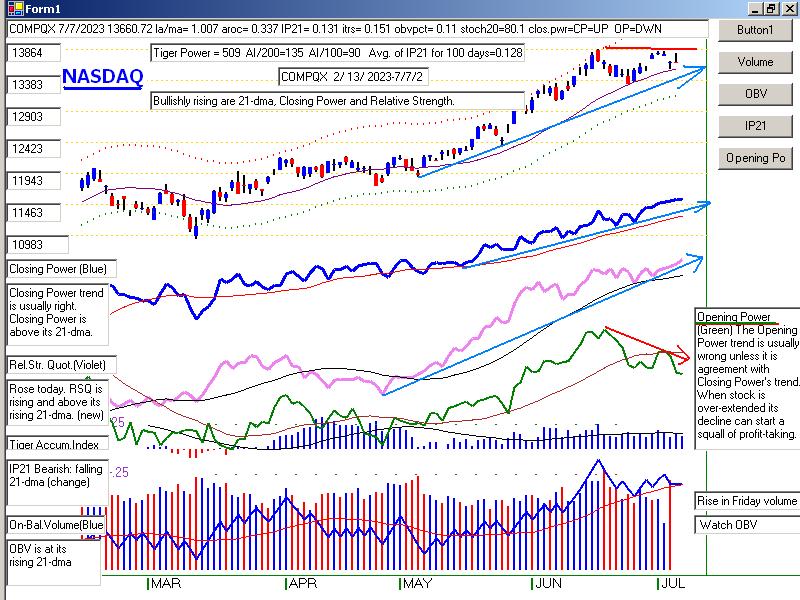 |
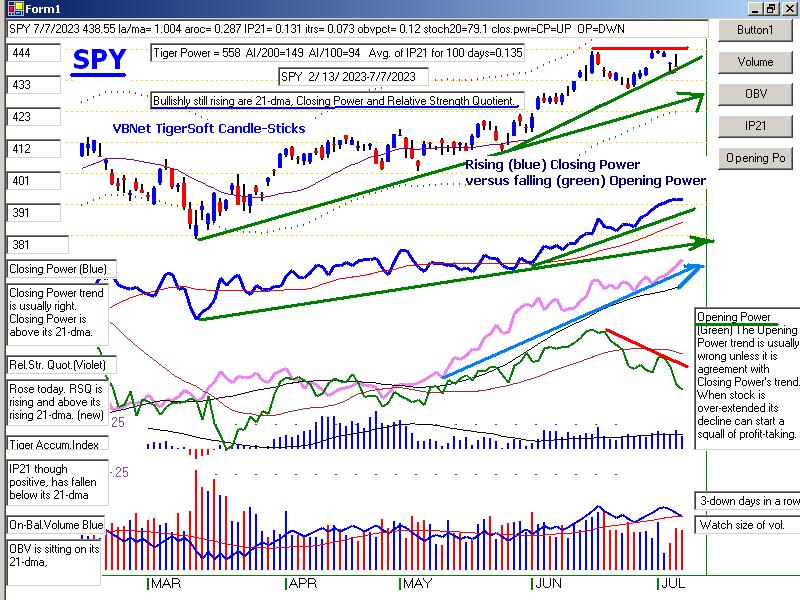 |
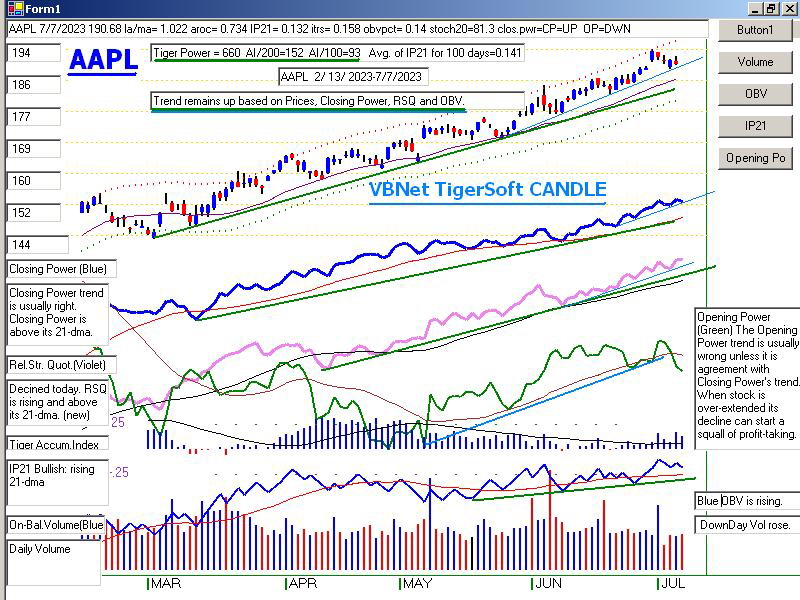 |
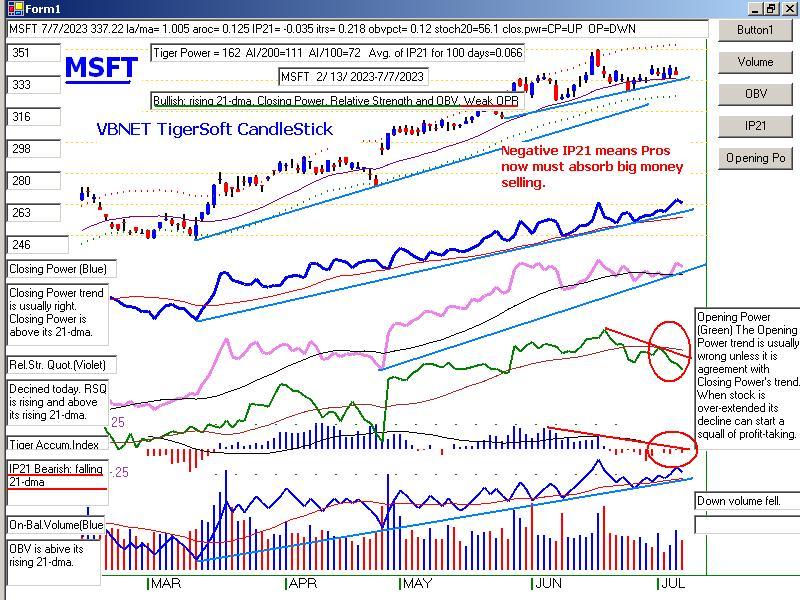 |
 |
 |
 |
Table 1 - Daily Breadth and Volume Statistics
| NYSE |
Latest
Close |
Previous
Close |
Week
Ago |
| Issues
traded |
3,043 |
3,041 |
3,053 |
| Advances |
2,108 |
462 |
2,100 |
| Declines |
821 |
2,521 |
855 |
| Unchanged |
114 |
58 |
98 |
| New
highs |
54 |
28 |
225 |
| New
lows |
21 |
34 |
16 |
| Adv.
volume* |
675,401,900 |
96,480,498 |
761,951,528 |
| Decl.
volume* |
247,274,619 |
792,742,249 |
232,494,195 |
| Total
volume* |
934,517,413 |
893,306,527 |
1,008,736,411 |
| Closing
Arms (TRIN)† |
0.86 |
1.58 |
0.79 |
| Block
trades* |
4,147 |
4,172 |
4,474 |
| Adv.
volume |
2,656,424,392 |
380,688,749 |
2,923,781,381 |
| Decl.
volume |
893,879,217 |
3,279,897,404 |
935,856,978 |
| Total
volume |
3,630,485,582 |
3,682,029,802 |
3,923,455,074 |
| NASDAQ |
Latest
Close |
Previous
Close |
Week
Ago |
| Issues
traded |
4,503 |
4,558 |
4,538 |
| Advances |
2,878 |
1,033 |
2,583 |
| Declines |
1,445 |
3,350 |
1,752 |
| Unchanged |
180 |
175 |
203 |
| New
highs |
57 |
36 |
168 |
| New
lows |
66 |
140 |
76 |
| Closing
Arms (TRIN)† |
1.29 |
0.33 |
0.75 |
| Block
trades |
41,934 |
64,447 |
28,844 |
| Adv.
volume |
3,072,507,227 |
2,945,937,000 |
3,058,089,007 |
| Decl.
volume |
1,991,239,107 |
3,125,786,967 |
1,545,791,956 |
| Total
volume |
5,098,120,228 |
6,113,085,949 |
4,661,127,576 |
|
Table 2 QUICKSILVER on ETFS - 7/7/2023 ---
     Bullish = 7   COMPQX, QQQ,  FAS, RETL,   SOXL (+.746), TECL (+.754), OIH
     Bearish = 2   GLD, UUP
ETF       CLOSE     CHANGE    PIVOT-PT  5-dma AROC   CL-PWR  CANDLE  IP21    ITRS  POWER INDEX
==================================================================================================
DIA       337.43  -1.8       343.85       -54.5%     Bullish  RED    .124    0         ====
---------------------------------------------------------------------------------------------
COMPQX    13660.72  -18.32   13787.92      25.3%     Bullish  RED    .111    .152     .263
---------------------------------------------------------------------------------------------
SPY       438.55  -1.11      443.28        5%        Bullish  RED    .131    .074     .205
---------------------------------------------------------------------------------------------
QQQ       366.24  -1.22      369.42        33%       Bullish  RED    .107    .175     .282
---------------------------------------------------------------------------------------------
MDY       475.2   4.69       478.91       -4.5%      -------  BLUE   .166    .056     .222
---------------------------------------------------------------------------------------------
IWM       184.71   1.93      187.27       -44.9%     -------  BLUE   .065    .061     .126
---------------------------------------------------------------------------------------------
FAS       62.73   .24        63.58         55.2%     -------  BLUE   .226    .051     .277
---------------------------------------------------------------------------------------------
RETL      7.04   .17         7.02          78.3%     Bullish  BLUE   .235    .106     .341
---------------------------------------------------------------------------------------------
SOXL      22.96  -.02        24.83        -175.7%    -------  RED    .013    .733     .746
---------------------------------------------------------------------------------------------
TECL      51.41  -.72        54.02        -20.8%     Bullish  RED    .147    .607     .754
---------------------------------------------------------------------------------------------
IBB       124.38  -1.07      126.96       -62.1%     -------  RED    .055   -.053     .002
---------------------------------------------------------------------------------------------
GLD       178.64   1.33      178.27        43.6%     Bearish  BLUE  -.232   -.045    -.277
---------------------------------------------------------------------------------------------
DBO       14.54   .29        14.12         183.7%    -------  BLUE   .165   -.02      .145
---------------------------------------------------------------------------------------------
OIH       307.7   19.68      287.6         434.4%    -------  BLUE   .158    .115     .273
---------------------------------------------------------------------------------------------
CPER     23.31   .2          23.2          121.1%    -------  BLUE  -.074   -.021    -.095
---------------------------------------------------------------------------------------------
TAN     68.05   .69          71.42        -62.3%     Bearish  BLUE  -.093   -.106    -.199
---------------------------------------------------------------------------------------------
UUP       28.23  -.24        28.38        -47.4%     Bearish  RED   -.272    .01     -.262
---------------------------------------------------------------------------------------------
CORN      22.35  -.4         22.19        -234.7%    Bearish  RED   -.022   -.083    -.105
---------------------------------------------------------------------------------------------
WEAT      6.45  -.06         6.44         -107.2%    -------  ----  -.031   -.025    -.056
---------------------------------------------------------------------------------------------
YINN      33.94   2.02       34.26         87.9%     Bearish  BLUE  -.076   -.087    -.163
|
Table 3       RANKING OF KEY DIRECTORIES BASED PCT.OF STOCKS ABOVE 65-DMA
              7/7/23
 Bullish = 29
 Bearish = 17
---------------------------------------------------------------------------------------
Directory     Current       day-1         day-2         day-3         day-4         day-5
----------------------------------------------------------------------------------------
TRANSP         .947          .947          .947          .947          .947          .894
HOMEBLDG       .892          .857          .892          .928          .928          .964
JETS           .846          .846          .846          .846          .846          .846
AUTO           .792          .773          .792          .811          .792          .773
NIFTY          .772          .772          .795          .818          .818          .795
COMPUTER       .75           .75           .75           .7            .7            .65
SEMI           .736          .758          .769          .791          .791          .78
INFRA          .709          .58           .741          .806          .741          .741
ELECTRON       .699          .699          .706          .751          .721          .721
HOSPITAL       .692          .692          .769          .769          .923          .846
NASD-100       .69           .68           .77           .75           .73           .72
HIGHPRIC       .688          .683          .714          .735          .744          .709
REIT           .688          .614          .721          .762          .696          .688
INDEXES        .686          .643          .691          .708          .713          .664
EAT            .682          .634          .658          .707          .707          .658
SOFTWARE       .678          .678          .696          .714          .696          .714
RUS-1000       .67           .639          .693          .71           .693          .653
SP500          .649          .633          .694          .694          .676          .631
FIDSTKS        .644          .621          .71           .686          .68           .627
CHEM           .604          .558          .558          .72           .674          .604
RETAIL         .586          .608          .608          .63           .586          .586
MILITARY       .576          .653          .692          .73           .73           .576
INDMATER       .569          .472          .513          .597          .527          .527
SP-100         .566          .577          .677          .655          .644          .6
FINANCE        .562          .487          .637          .737          .65           .65
OILGAS         .556          .36           .494          .577          .515          .474
GREEN          .555          .555          .555          .611          .611          .611
GAMING         .526          .421          .526          .736          .631          .578
REGBANKS       .526          .394          .447          .526          .394          .447
==================================================================================================
COAL           .5            .5            .5            .5            .5            .5
DOWJONES       .5            .6            .633          .666          .666          .6
GUNS           .5            .571          .642          .714          .642          .642
HACKERS        .5            .5            .5            .562          .562          .562
==================================================================================================
ETFS           .472          .309          .545          .618          .545          .4
DJI-13         .461          .538          .538          .538          .538          .538
INSURANC       .44           .4            .4            .48           .52           .52
BEVERAGE       .428          .571          .571          .5            .5            .428
BIGBANKS       .428          .428          .714          .714          .571          .571
LOWPRICE       .392          .343          .375          .398          .366          .354
CHINA          .39           .341          .341          .317          .317          .317
BIOTECH        .368          .378          .4            .417          .41           .373
FOOD           .367          .346          .346          .367          .326          .306
UTILITY        .358          .307          .487          .333          .333          .282
COMODITY       .35           .325          .325          .35           .3            .275
EDU            .333          .166          .166          .333          .333          .333
COPPER         .285          .142          .285          .571          .285          .428
BONDFUND       .252          .126          .436          .551          .425          .356
MARIJUAN       .2            .2            .2            .4            .3            .2
SOLAR          .187          .125          .187          .25           .187          .187
GOLD           .088          .066          .066          .111          .066          .088
|
====================================================================================
Friday - 6:04 AM - 7/7/2023 - DJI Futures -69 NASDAQ Futures -5 Data Used
- 7/6/2023
| |
7/6/2023
|
|
| |
Market Comments
With the June Jobs numbers coming in at +209,000, a "soft
landing"
would seem still to be in sight. But the "hawks" on the FOMC will
probably use this as an excuse to raise interest rates even if the
annual rate of inflation drops down to 3.5%-4% when the CPI is reported
next week. That and the DJI's well-tested resistance at 34000 which will
act as a ceiling again on the next rally should restrain the bulls among
the Professionals. But not so much as to get them to sell their
performance-favorites: QQQ, TECL, MSFT, NVDA and TSLA.
And this elite group's continuing strength should make it seem that any
drop now will be modest sized and keep the DJI within its normal 3%
bands. But from a broader perspective, their strength will likely be
misleading. Selectivity in even the techs will now be required going
forward.
Breadth today was much worse than one might expect from a normal
and safe retreat. New lows were greater than new highs despite the
key averages being so close to their highs. This demonstrates that
the weakest stocks which will need to borrow the most to stay afloat
will be hurt the most by more rate increases. Of course, it is the same
for those already exhausted by the treadmill of working two or more jobs.
But for the FED to really fight inflation and do its job, it will need to
push up rates much higher. Will it dare push them above 6% and cause
the big indexes to fall by more than 20%?.
The Professionals, judging from the still rising Closing Powers for DIA,
SPY, QQQ and TECL, do not think the FED will dare do this, especially
going into a Presidential Election Year when they themselves could become
political targets.
The DJI has now fallen to a point just above its 65-dma. It and
its A/D Line
have fallen below their 21-dma. Another good Jobs Report "should" hold
up the DJI andthe other key indexes unless Professionals now perceive
that the FED will use continuing economic strength as an escuse to push
rates up close to 6%. How the Professionals will react to today's good
Job Report will tell us whether they intend to turn the market back up for
another advance in the weeks before there is another rate hike.
While a rising 65-dma can be good support for the DJI, we see too
many cautionary volume signs to encourage us to be buyers again. See
the wide OBV non-confimrations below in the DJI chart. Elsewhere, too
much now depends on fewer and fewer pockets of strength. The Home-
builders got sold off h ard today. See also below how many of the
Semi-Conductors have weakened appreciably, so much so that.
the A/D Line for the 90 semi-conductors we track has started to widely
lag its leaders. Watch the breadth there and also QualComm which
now exhibits a bearish looking head and shoulders pattern.
|
|
| |
7/6/2023
2022 PEERLESS DJI, Signals, Indicators Daily DJI Volume
10-DayUp/Down Vol Stoch-20 CCI RSI Pct of All Stocks above 65-dma
Inverted Traders Index
DJI-IPA DJI-OBV Short-Term Rates
NASDAQ S&P OEX NYSE DJ-15 DJ-20 DJI-30
Tiger Index of Big
Banks Bond
Funds Gold Stocks
Housing Stocks
Insurance-Stocks
Regional Banks
Russell-1000
Semi Conductors
Recent 2006 vers-Peerless signals http://tigersoftware.com/oldpeer/UPD90706.bmp
ETFs: DIA QQQ SPY IWM MDY
TNA Short-Term Rates Ten Year Rates PST (Short Treasuries)
DOLLAR-UUP
ALLSTOCKs
COIN (Bit
Coin ETF)
USO-CrudeOil DBO
BLDP FAS GLD HD IBB JETS JNUG KOL NAIL NUGT
NRGU OIH PALL RSX RETL SDS AGQ SLV SOXL TAN TECL TLT TMF TNA
UGA USO China: YINN
Commodities: CANE
CORN DBC NIB CORN, CUT (paper)
MOO, NRGU
SOYB WEAT UUP (Dollar) LIT
(Lithium) PALL
(Palladium)
Stocks
AA AAPL ADBE ALXN AMAT AMGN AMD AMZN ANET AXON AXP
BA BABA BAC BIDU BLDP BSX CAT CDNS CHKP CNX CPB CRM CVX CMG
DE DIS ENPH FB FSLR FTNT GILD GME GOOG GS HD IBM INTU JPM KO KR
LRCX MRK MRNA MOS MSFT NEM NFLX NKE NOC NUE NVDA PANW PG PYPL
QCOM QDEL REGN REV RE SCHW SNOW SO SQUARE TSLA TXN XOM V VRTX
WFC WMT XLE ZM ZOM
HOMEBUILDERS:
NAIL
BZH HOV MHO MTH PHM -
REGIONAL BANKS: EGBN FFIC GBCI HMST
Carl Icahn and
associates: IEP MS JEF
Leveraged Short ETFs:
FAZ - financials, TZA and SRTY- small caps TECS -Techs,
SOXS -
semi-conductors LABD
- Biotechs
Bullish MAXCPs http://tigersoftware.com/upping/7-06-2023/Bullish.htm
Bearish MINCPs
www.tigersoftware.com/downing/7-06-2023/Bearish.htm |
|
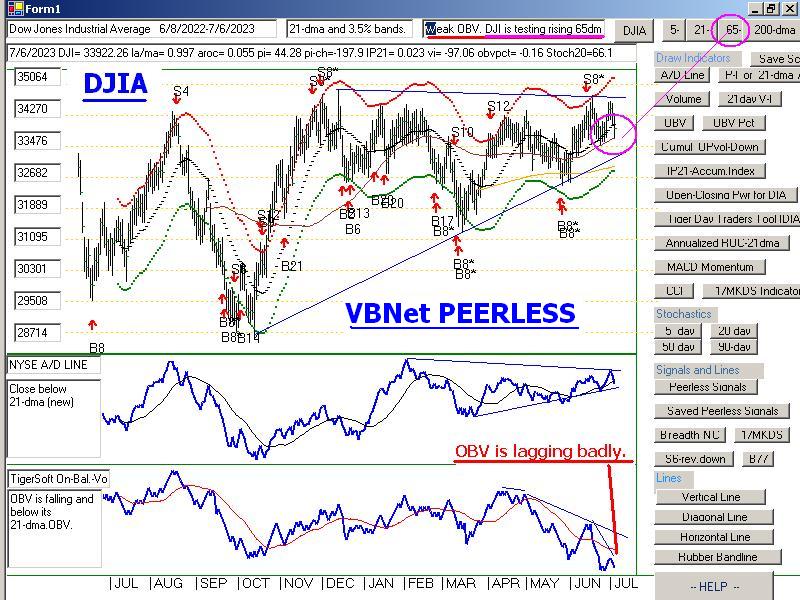 |
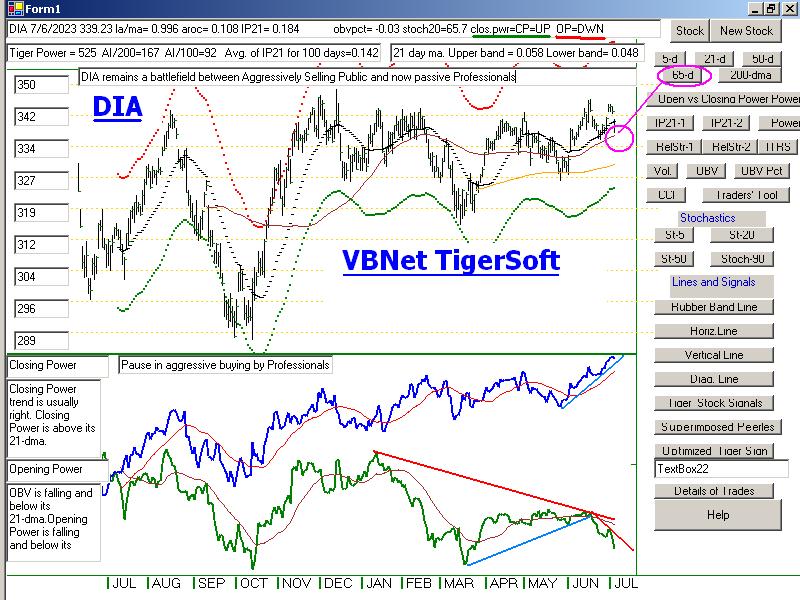 |
 |
|
 |
 |
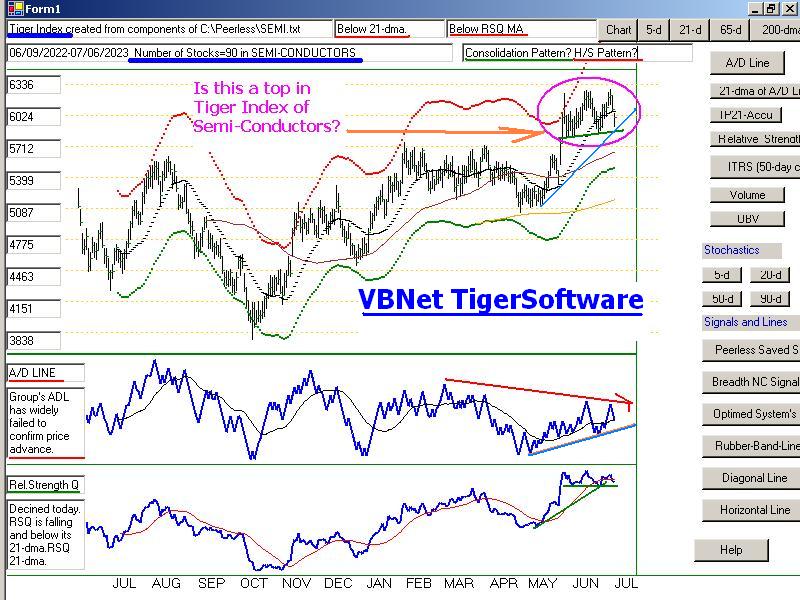 |
Table 1 - Daily Breadth and Volume Statistics
| NYSE |
Latest Close |
Previous Close |
Week Ago |
| Issues traded |
3,041 |
3,039 |
3,060 |
| Advances |
462 |
869 |
2,022 |
| Declines |
2,521 |
2,066 |
941 |
| Unchanged |
58 |
104 |
97 |
| New highs |
28 |
53 |
149 |
| New lows |
34 |
13 |
19 |
| Adv. volume* |
96,480,498 |
288,041,474 |
613,735,475 |
| Decl. volume* |
792,742,249 |
538,414,522 |
193,588,784 |
| Total volume* |
893,306,527 |
836,159,294 |
816,323,392 |
| Closing Arms (TRIN)† |
1.58 |
0.68 |
0.77 |
| Block trades* |
4,172 |
4,050 |
4,082 |
| Adv. volume |
380,688,749 |
1,309,228,678 |
2,687,490,706 |
| Decl. volume |
3,279,897,404 |
2,131,233,872 |
964,864,326 |
| Total volume |
3,682,029,802 |
3,482,620,879 |
3,696,669,401 |
| NASDAQ |
Latest Close |
Previous Close |
Week Ago |
| Issues traded |
4,558 |
4,556 |
4,594 |
| Advances |
1,033 |
1,539 |
2,602 |
| Declines |
3,350 |
2,838 |
1,777 |
| Unchanged |
175 |
179 |
215 |
| New highs |
36 |
67 |
110 |
| New lows |
140 |
66 |
120 |
| Closing Arms (TRIN)† |
0.33 |
0.32 |
0.97 |
| Block trades |
64,447 |
51,531 |
29,303 |
| Adv. volume |
2,945,937,000 |
3,273,159,663 |
2,607,615,028 |
| Decl. volume |
3,125,786,967 |
1,911,845,639 |
1,727,916,232 |
| Total volume |
6,113,085,949 |
5,339,342,066 |
4,388,140,699 |
|
Table 2 QUICKSILVER on ETFS - 7/6/2023 ---
     Bullish = 7   COMPQX, SPY, QQQ,  FAS, RETL,   SOXL (+.638), TECL (+.726)
     Bearish = 2   GLD, YINN
ETF       CLOSE     CHANGE    PIVOT-PT  5-dma AROC   CL-PWR  CANDLE  IP21    ITRS  POWER INDEX
==================================================================================================
DIA       339.23  -3.58      341.16        8.8%      -------  RED    .184    0         ====
---------------------------------------------------------------------------------------------
COMPQX    13679.04  -112.61  13591.33      31.8%     -------  BLUE   .191    .135     .326
---------------------------------------------------------------------------------------------
SPY       439.66  -3.47      438.11        37.1%     -------  BLUE   .196    .064     .26
---------------------------------------------------------------------------------------------
QQQ       367.46  -2.82      363.81        39.7%     -------  BLUE   .159    .162     .321
---------------------------------------------------------------------------------------------
MDY       470.51  -5.35      475.63        6.2%      -------  RED    .218    .03      .248
---------------------------------------------------------------------------------------------
IWM       182.78  -3         186.38       -39.7%     -------  RED    .124    .029     .153
---------------------------------------------------------------------------------------------
FAS       62.49  -1.78       62.03         269.3%    -------  RED    .266   -.004     .262
---------------------------------------------------------------------------------------------
RETL      6.87  -.26         6.93          28.5%     -------  ----   .284   -.023     .261
---------------------------------------------------------------------------------------------
SOXL      22.98  -.87        23.81        -152%      -------  BLUE   .069    .569     .638
---------------------------------------------------------------------------------------------
TECL      52.13  -.52        51.63         76.9%     Bullish  BLUE   .197    .529     .726
---------------------------------------------------------------------------------------------
IBB       125.45  -1.58      125.95       -31.6%     -------  RED    .061   -.059     .002
---------------------------------------------------------------------------------------------
GLD       177.31  -.53       177.09        .8%       Bearish  RED   -.192   -.042    -.234
---------------------------------------------------------------------------------------------
DBO       14.25  -.06        14.02         110%      -------  ----   .118   -.06      .058
---------------------------------------------------------------------------------------------
OIH       288.02  -2.31      282.69        186.5%    -------  BLUE   .121    .005     .126
---------------------------------------------------------------------------------------------
CPER     23.11  -.06         22.75         39%       Bearish  ----  -.074   -.052    -.126
---------------------------------------------------------------------------------------------
TAN     67.36  -2.43         68.92        -161.6%    Bearish  RED   -.092   -.134    -.226
---------------------------------------------------------------------------------------------
UUP       28.47  -.07        28.5          15.8%     -------  ----  -.238    .028     -.21
---------------------------------------------------------------------------------------------
CORN      22.75   .59        23.41        -217.3%     Bearish  BLUE   .007   -.065    -.058
---------------------------------------------------------------------------------------------
WEAT      6.51  -.15         6.59         -68.7%     -------  RED   -.027   -.017     -.044
---------------------------------------------------------------------------------------------
YINN      31.92  -3.01       33.34        -441.7%     Bearish  RED   -.071   -.209    -.28
|
 Table 3      RANKING OF KEY DIRECTORIES BASED PCT.OF STOCKS ABOVE 65-DMA
               7/6/23
 Bullish = 28
 Bearish = 20
---------------------------------------------------------------------------------------
Directory     Current       day-1         day-2         day-3         day-4         day-5
----------------------------------------------------------------------------------------
TRANSP         .947          .947          .947          .947          .894          .894
HOMEBLDG       .857          .892          .928          .928          .964          .964
JETS           .846          .846          .846          .846          .846          .846
-----------------------------------------------------------------------------------------------------
AUTO           .773          .811          .811          .792          .773          .754
NIFTY          .772          .795          .818          .818          .795          .772
SEMI           .758          .769          .791          .791          .78           .747
COMPUTER       .75           .75           .7            .7            .65           .6
ELECTRON       .699          .706          .751          .721          .714          .691
HOSPITAL       .692          .769          .769          .923          .846          .692
HIGHPRIC       .683          .714          .735          .744          .709          .688
NASD-100       .68           .77           .75           .73           .72           .73
               ====
SOFTWARE       .678          .714          .714          .696          .714          .696
MILITARY       .653          .692          .73           .73           .615          .5
INDEXES        .643          .691          .708          .713          .67           .643
RUS-1000       .639          .693          .71           .693          .653          .613
EAT            .634          .658          .707          .707          .658          .658
SP500          .633          .694          .694          .674          .629          .602
               =====
FIDSTKS        .621          .71           .686          .68           .627          .568
REIT           .614          .713          .77           .704          .68           .622
RETAIL         .608          .608          .63           .586          .586          .586
DOWJONES       .6            .633          .666          .666          .6            .5
               =====
INFRA          .58           .741          .806          .741          .774          .677
SP-100         .577          .677          .655          .644          .6            .533
BEVERAGE       .571          .571          .5            .5            .428          .428
GUNS           .571          .642          .714          .642          .642          .642
CHEM           .558          .558          .72           .674          .604          .488
GREEN          .555          .555          .611          .611          .611          .5
DJI-13         .538          .538          .538          .538          .538          .538
===================================================================================================
COAL           .5            .5            .5            .5            .5            .333
HACKERS        .5            .5            .562          .562          .562          .5
===================================================================================================
FINANCE        .487          .637          .737          .637          .65           .512
INDMATER       .472          .513          .597          .527          .527          .444
BIGBANKS       .428          .714          .714          .571          .571          .285
GAMING         .421          .526          .684          .684          .578          .473
INSURANC       .4            .4            .48           .52           .52           .36
REGBANKS       .394          .447          .526          .394          .447          .315
BIOTECH        .375          .398          .42           .41           .378          .395
OILGAS         .36           .494          .577          .515          .463          .422
FOOD           .346          .367          .346          .326          .306          .326
LOWPRICE       .343          .378          .401          .366          .36           .346
CHINA          .341          .341          .317          .317          .317          .317
ETFS           .309          .545          .618          .545          .436          .454
COMODITY       .307          .333          .307          .282          .256          .282
UTILITY        .307          .487          .333          .333          .282          .282
MARIJUAN       .2            .2            .4            .3            .2            .2
EDU            .166          .166          .333          .333          .333          .166
COPPER         .142          .285          .571          .285          .428          .285
BONDFUND       .126          .425          .551          .436          .367          .655
SOLAR          .125          .187          .25           .187          .187          .125
GOLD           .066          .066          .111          .066          .066          .066
|
==================================================================================
Thursday -6:07 AM - 7/6/2023 - DJI Futures -220 NASDAQ Futures -87 Data
Used - 7/5/2023
| |
7/5/2023
|
|
| |
Market Comments
Take
profits in the Home-Building sector. See our chart of the group
below. The group
is "over-bought" if we judge matters using the
number of tests already
of the upper band and the price channel-line
in the Tiger Index
chart of the group. But hold the strong semi-conductors
and QQQ and TECL as
well as the AI leaders. The DJI's weakness
is not yet able to hurt
the tech sector.
The DJI is again backing away from its well-tested overhead resistance
above 34000. This
is no surprise given the low-volume close at a nominal
new high on the day
before the Fourth of July and the numerous volume-based
non-confirmations of
that apparent strength. The weakest indicator of all
was and is the DJI's
OBV Line, which is shown in the first chart below. Such an
extreme
non-confirmation is rare. It tells us that the DJI has been run up
artificially and far
too quickly, without allowing most traders much opportunity
to participate in the
advance. In this sense, the advance was "unratified".
It was achieved by
Professional or "Quant" manipulation.
Professionals usually
know what they are doing. And the market dutifully
follows in the
direction of their net buying or net selling, even if the openings go
in a different
direction. But not always. And now, we see a battle between
the apprently widely
different sentiments of the Publc via our Opening
Powers and the
Professionals via our Closing Powers. Look at the DIA and
SPY charts just below.
The Closing Powers are still making new highs,
but the Openng Powers
are falling faster.
If the Professionals do
not come in and bring the market back up from
early losses, the weak
openings will win out. As Summer begins, we have
to expect Professional
participation to be weaker in part because this is when
they tend to go
off on vacation. But also because, there is no point in fighting
the FED just at the
moment. It will better serve the Professionals' purposes
to buy on a pullback to
the DJI's rising 200-day ma or even to the round
number support at
33000. That way there is "head-room" for a rally.
In terms of news, the
DJI's sell-off is being triggered by the expectation
that the FED will
continue to make "hawkish" remarks to try to drive
the markets down.
They try to do this to stop rallies. And then they
are most apt to be
silent or even "dovish: after there has been a sell-off.
Professionals are aware
of these Fed' "mood-changes" and play the
broader market and the
DJI accordingly. We should, too.
|
|
| |
7/5/2023
2022 PEERLESS DJI, Signals, Indicators Daily DJI Volume
10-DayUp/Down Vol Stoch-20 CCI RSI Pct of All Stocks above 65-dma
Inverted Traders Index
DJI-IPA DJI-OBV Short-Term Rates
NASDAQ S&P OEX NYSE DJ-15 DJ-20 DJI-30
Tiger Index of Big
Banks Bond
Funds Gold Stocks
Housing Stocks
Insurance-Stocks
Regional Banks
Russell-1000
Semi Conductors
Recent 2006 vers-Peerless signals http://tigersoftware.com/oldpeer/UPD90705.bmp
ETFs: DIA QQQ SPY IWM MDY
TNA Short-Term Rates Ten Year Rates PST (Short Treasuries)
DOLLAR-UUP
ALLSTOCKs
COIN (Bit
Coin ETF)
USO-CrudeOil DBO
BLDP FAS GLD HD IBB JETS JNUG KOL NAIL NUGT
NRGU OIH PALL RSX RETL SDS AGQ SLV SOXL TAN TECL TLT TMF TNA
UGA USO China: YINN
Commodities: CANE
CORN DBC NIB CORN, CUT (paper)
MOO, NRGU
SOYB WEAT UUP (Dollar) LIT
(Lithium) PALL
(Palladium)
Stocks
AA AAPL ADBE ALXN AMAT AMGN AMD AMZN ANET AXON AXP
BA BABA BAC BIDU BLDP BSX CAT CDNS CHKP CNX CPB CRM CVX CMG
DE DIS ENPH FB FSLR FTNT GILD GME GOOG GS HD IBM INTU JPM KO KR
LRCX MRK MRNA MOS MSFT NEM NFLX NKE NOC NUE NVDA PANW PG PYPL
QCOM QDEL REGN REV RE SCHW SNOW SO SQUARE TSLA TXN XOM V VRTX
WFC WMT XLE ZM ZOM
HOMEBUILDERS:
NAIL
BZH HOV MHO MTH PHM -
REGIONAL BANKS: EGBN FFIC GBCI HMST
Carl Icahn and
associates: IEP MS JEF
Leveraged Short ETFs:
FAZ - financials, TZA and SRTY- small caps TECS -Techs,
SOXS -
semi-conductors LABD
- Biotechs
Bullish MAXCPs http://tigersoftware.com/upping/7-05-2023/Bullish.htm
Bearish MINCPs www.tigersoftware.com/downing/7-05-2023/Bearish.htm |
|
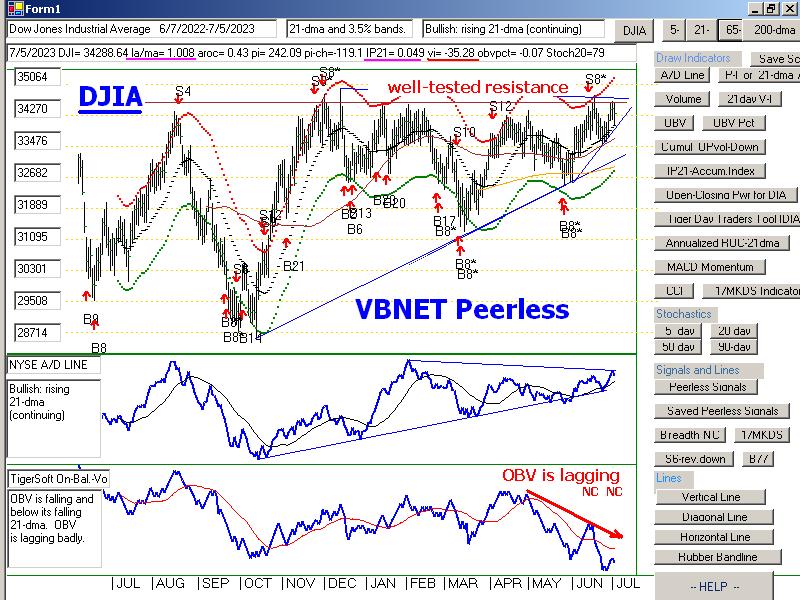 |
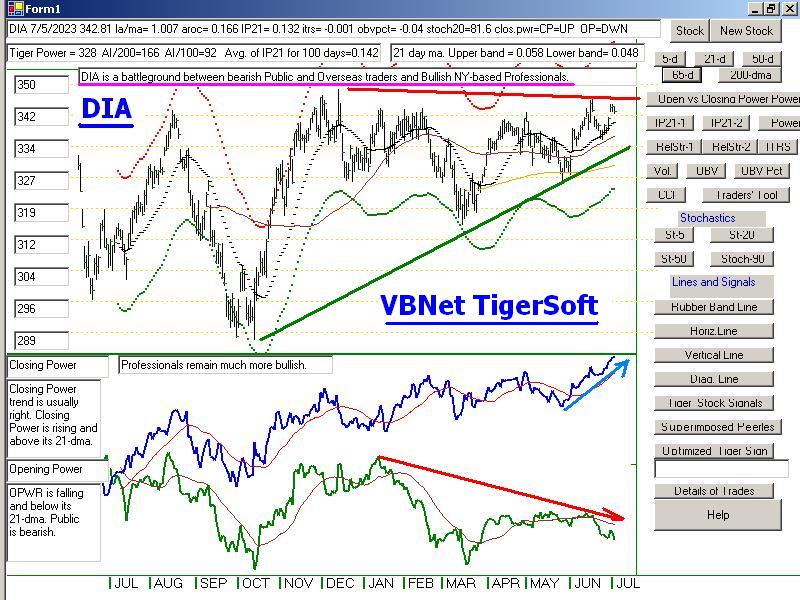 |
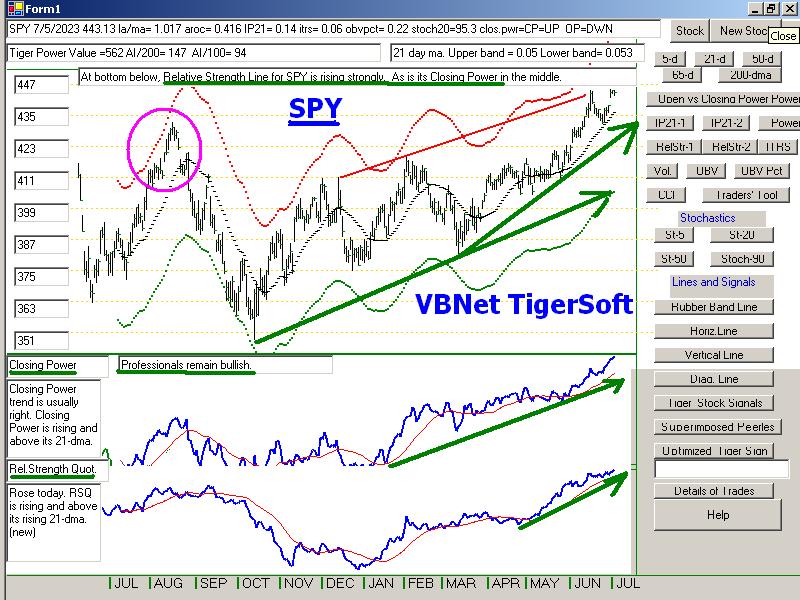 |
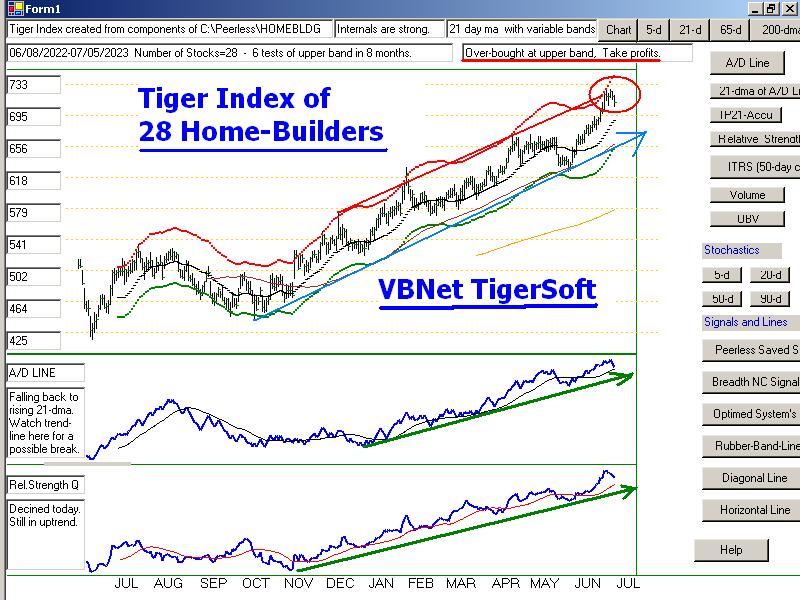 |
 |
 |
 |
 |
 |
 |
 |
|
Table 1 - Daily Breadth and Volume
Statistics
| NYSE |
Latest
Close |
Previous
Close |
Week
Ago |
| Issues
traded |
3,039 |
3,018 |
3,044 |
| Advances |
869 |
2,033 |
1,620 |
| Declines |
2,066 |
890 |
1,320 |
| Unchanged |
104 |
95 |
104 |
| New
highs |
53 |
93 |
115 |
| New
lows |
13 |
7 |
34 |
| Adv.
volume* |
288,041,474 |
340,351,448 |
409,366,414 |
| Decl.
volume* |
538,414,522 |
113,910,323 |
416,408,898 |
| Total
volume* |
836,159,294 |
460,443,231 |
830,972,290 |
| Closing
Arms (TRIN)† |
0.68 |
0.69 |
1.02 |
| Block
trades* |
4,050 |
3,498 |
3,938 |
| Adv.
volume |
1,309,228,678 |
1,538,490,013 |
2,027,728,927 |
| Decl.
volume |
2,131,233,872 |
466,961,319 |
1,687,042,872 |
| Total
volume |
3,482,620,879 |
2,034,289,064 |
3,739,335,689 |
| NASDAQ |
Latest
Close |
Previous
Close |
Week
Ago |
| Issues
traded |
4,556 |
4,372 |
4,558 |
| Advances |
1,539 |
2,520 |
2,293 |
| Declines |
2,838 |
1,673 |
2,071 |
| Unchanged |
179 |
179 |
194 |
| New
highs |
67 |
85 |
86 |
| New
lows |
66 |
60 |
126 |
| Closing
Arms (TRIN)† |
0.32 |
0.72 |
0.92 |
| Block
trades |
51,531 |
22,200 |
29,795 |
| Adv.
volume |
3,273,159,663 |
1,943,638,732 |
2,451,582,454 |
| Decl.
volume |
1,911,845,639 |
929,500,839 |
2,040,096,440 |
| Total
volume |
5,339,342,066 |
2,902,307,829 |
4,533,271,493 |
|
Table 2 QUICKSILVER on ETFS - 7/5/2023 ---
     Bullish = 6   COMPQX, QQQ,  RETL,  SOXL (+.607), TECL (+.630)
     Bearish = 1   UUP
ETF       CLOSE     CHANGE    PIVOT-PT  5-dma AROC   CL-PWR  CANDLE  IP21    ITRS  POWER INDEX
==================================================================================================
DIA       342.81  -1.26      338.63        52.4%     -------  BLUE   .132    0        ------
---------------------------------------------------------------------------------------------
COMPQX    13791.65  -25.12   13591.75      86.3%     -------  BLUE   .139    .129     .268
---------------------------------------------------------------------------------------------
SPY       443.13  -.66       436.39        79.2%     -------  BLUE   .14    .061      .201
---------------------------------------------------------------------------------------------
QQQ       370.28  -.01       364.54        88%       -------  BLUE   .107    .156     .263
---------------------------------------------------------------------------------------------
MDY       475.86  -3.74      469.92        63.6%     -------  RED    .177    .029     .206
---------------------------------------------------------------------------------------------
IWM       185.78  -1.87      184.26        65.1%     -------  RED    .092    .032     .124
---------------------------------------------------------------------------------------------
FAS       64.27  -.53        59.11         397.4%    -------  BLUE   .227    .005     .232
---------------------------------------------------------------------------------------------
RETL      7.13  -.06         6.83          237.3%    Bullish  ----   .245    .019     .264
---------------------------------------------------------------------------------------------
SOXL      23.85  -1.64       23.72        -106.4%    -------  RED    .016    .591     .607
---------------------------------------------------------------------------------------------
TECL      52.65  -.98        51.32         131.7%    -------  BLUE   .118    .512     .63
---------------------------------------------------------------------------------------------
IBB       127.03   .22       126.25        59.4%     -------  BLUE   .068   -.062     .006
---------------------------------------------------------------------------------------------
GLD       177.84  -.63       177.28        4.2%      Bearish  RED   -.163   -.049    -.212
---------------------------------------------------------------------------------------------
DBO       14.31   .23        13.94         225.5%    -------  ----   .023   -.055    -.032
---------------------------------------------------------------------------------------------
OIH       290.33  -.34       277.36        234.4%    -------  RED    .071    .031     .102
---------------------------------------------------------------------------------------------
CPER     23.17  -.17         22.93        -43.3%     -------  RED   -.077   -.065    -.142
---------------------------------------------------------------------------------------------
TAN     69.79  -1.63         69.63         42.1%     Bearish  RED   -.059   -.116    -.175
---------------------------------------------------------------------------------------------
UUP       28.54   .13        28.38         51.1%     -------  BLUE  -.273    .015    -.258
---------------------------------------------------------------------------------------------
CORN      22.16  -.24        23.74        -511.7%    Bearish  RED   -.045   -.106    -.151
---------------------------------------------------------------------------------------------
WEAT      6.66   .22         6.6          -151.8%    -------  BLUE  -.002   -.026    -.028
---------------------------------------------------------------------------------------------
YINN      34.93  -1.31       34.99        -131.7%    -------  RED   -.03   -.173     -.203
|
Table 3       RANKING OF KEY DIRECTORIES BASED PCT.OF STOCKS ABOVE 65-DMA
              7/5/23
 Bullish = 33
 Bearish = 15
---------------------------------------------------------------------------------------
Directory     Current       day-1         day-2         day-3         day-4         day-5
----------------------------------------------------------------------------------------
TRANSP         .947          .947          .947          .894          .894          .894
HOMEBLDG       .892          .928          .928          .964          .964          .964
JETS           .846          .846          .846          .846          .846          .846
AUTO           .811          .83           .792          .773          .754          .754
----------------------------------------------------------------------------------------------------
NIFTY          .795          .818          .818          .795          .772          .772
NASD-100       .77           .75           .73           .72           .73           .75
               -----
HOSPITAL       .769          .769          .923          .846          .769          .692
SEMI           .765          .787          .787          .776          .744          .787
COMPUTER       .75           .7            .7            .65           .6            .55
INFRA          .741          .806          .741          .774          .677          .709
BIGBANKS       .714          .714          .571          .571          .285          .285
HIGHPRIC       .714          .735          .744          .709          .688          .701
SOFTWARE       .714          .732          .696          .714          .696          .678
REIT           .713          .762          .713          .688          .614          .647
FIDSTKS        .71           .686          .68           .627          .579          .568
ELECTRON       .706          .751          .721          .714          .684          .736
SP500          .694          .694          .674          .627          .604          .608
               -----
RUS-1000       .693          .71           .693          .653          .613          .623
MILITARY       .692          .73           .73           .615          .5            .538
INDEXES        .686          .708          .713          .67           .654          .659
SP-100         .677          .655          .644          .6            .533          .544
EAT            .658          .707          .707          .658          .658          .634
GUNS           .642          .714          .642          .642          .642          .642
FINANCE        .637          .737          .637          .637          .5            .525
DOWJONES       .633          .666          .666          .6            .5            .533
               -----
RETAIL         .608          .63           .586          .586          .586          .63
BEVERAGE       .571          .5            .5            .428          .428          .5
CHEM           .558          .72           .674          .604          .488          .488
GREEN          .555          .611          .611          .611          .5            .555
ETFS           .545          .618          .545          .436          .472          .454
DJI-13         .538          .538          .538          .538          .538          .538
GAMING         .526          .684          .631          .631          .473          .526
INDMATER       .513          .597          .527          .527          .444          .472
==========================================================================================================
COAL           .5            .5            .5            .5            .333          .333
HACKERS        .5            .562          .562          .562          .5            .5
==========================================================================================================
OILGAS         .494          .577          .515          .463          .422          .391
UTILITY        .487          .333          .333          .282          .282          .307
REGBANKS       .447          .526          .394          .447          .342          .394
BONDFUND       .425          .54           .436          .379          .666          .471
INSURANC       .4            .48           .52           .52           .4            .44
BIOTECH        .395          .417          .412          .378          .402          .38
LOWPRICE       .378          .404          .369          .36           .346          .351
FOOD           .367          .367          .306          .306          .326          .367
CHINA          .341          .317          .317          .317          .317          .317
COMODITY       .333          .333          .256          .256          .282          .333
COPPER         .285          .571          .285          .428          .285          .571
-----------------------------------------------------------------------------------------------------------
MARIJUAN       .2            .4            .3            .2            .2            .2
SOLAR          .187          .25           .187          .187          .125          .125
EDU            .166          .333          .333          .333          .166          .166
GOLD           .066          .111          .066          .066          .066          .088
|
===================================================================================
Wednesday -5:48
AM - 7/5/2023 - DJI
Futures -160 NASDAQ Futures -80 Data Used - 7/3/2023
| |
7/3/2023
|
|
| |
Market Outlook:
Professionals have quite
properly seen through Fed Chairman Powell's pretense of
hawkishness and stuck with the rallying
techs, home-builders and even consumer and
transportation issues. Now the DJI
has made a nominal closing high with volume
indicators like OBV and V-I lagging.
Perhaps, this means that it may be time for
Professionals to take a brief Summer
recess and let the FED scare the Public into
some ill-timed selling. That would
seem to be the meaning of the falling Opening
Power for DIA and SPY. This is a
week when FOMC minutes and the Jobs'
numbers come out.
But Peerless has given no new
intermediate-term or short-term Sell signal. And
Professionals, as we've seen, usually end
up being correct when they are bullish
and the Public is bearish.
Moreover, 60% of all stocks are now above their
65-dma support levels. And what is
there for us to go short? The most bearish plays
among our Bearish MINCPs are shorts on
the negative ETFs of the DJI, SP-500,
QQQ, TECL and SOXL. To the extent
these negative ETFs look like excellent
short-plays, I think we have to actually
be bullish. Even this year's favorite group for
shorting, the regional banks, now show an
automatic TigerSoft Buy.
My conclusion: disregard minor selling in
the DJI this week as it retreats from
well-tested resistance and hold the
tech and housing leaders while their Closing
Power and Relative Strength Lines
stay well above their 21-day moving averages. |
|
| |
7/3/2023
2022 PEERLESS DJI, Signals, Indicators Daily DJI Volume
10-DayUp/Down Vol Stoch-20 CCI RSI Pct of All Stocks above 65-dma
Inverted Traders Index
DJI-IPA DJI-OBV Short-Term Rates
NASDAQ S&P OEX NYSE DJ-15 DJ-20 DJI-30
Tiger Index of Big
Banks Bond
Funds Gold Stocks
Housing Stocks
Insurance-Stocks
Regional Banks
Russell-1000
Semi Conductors
Recent 2006 vers-Peerless signals http://tigersoftware.com/oldpeer/UPD90703.bmp
Note the old Buy "b" trading signals. They are not safe to use when
A/D Line
is below its 21-dma: See OLD06
OLD0607
OLD07 OLD0708 OLD08 OLD0809
ETFs: DIA QQQ SPY IWM MDY
TNA Short-Term Rates Ten Year Rates PST (Short Treasuries)
DOLLAR-UUP
ALLSTOCKs
COIN (Bit
Coin ETF)
USO-CrudeOil DBO
BLDP FAS GLD HD IBB JETS JNUG KOL NAIL NUGT
NRGU OIH PALL RSX RETL SDS AGQ SLV SOXL TAN TECL TLT TMF TNA
UGA USO China: YINN CHAU
Commodities: CANE
CORN DBC JJC, NIB CORN, CUT (paper)
MOO, NRGU
SOYB WEAT UUP (Dollar) LIT
(Lithium) PALL
(Palladium)
Stocks
AA AAPL ADBE ALXN AMAT AMGN AMD AMZN ANET AXON AXP
BA BABA BAC BIDU BLDP BSX CAT CDNS CHKP CNX CPB CRM CVX CMG
DE DIS ENPH FB FSLR FTNT GILD GME GOOG GS HD IBM INTU JPM KO KR
LRCX MRK MRNA MOS MSFT NEM NFLX NKE NOC NUE NVDA PANW PG PYPL
QCOM QDEL REGN REV RE SCHW SNOW SO SQUARE TSLA TXN XOM V VRTX
WFC WMT XLE ZM ZOM
HOMEBUILDERS:
NAIL
BZH HOV MHO MTH PHM -
REGIONAL BANKS: EGBN FFIC GBCI HMST
Carl Icahn and
associates: IEP MS JEF
Leveraged Short ETFs:
FAZ - financials, TZA and SRTY- small caps, MZZ - mid caps, TECS -Techs,
SOXS -
semi-conductors LABD
- Biotechs
Bullish MAXCPs http://tigersoftware.com/upping/7-03-2023/Bullish.htm
Bearish MINCPs www.tigersoftware.com/downing/7-03-2023/Bearish.htm
|
|
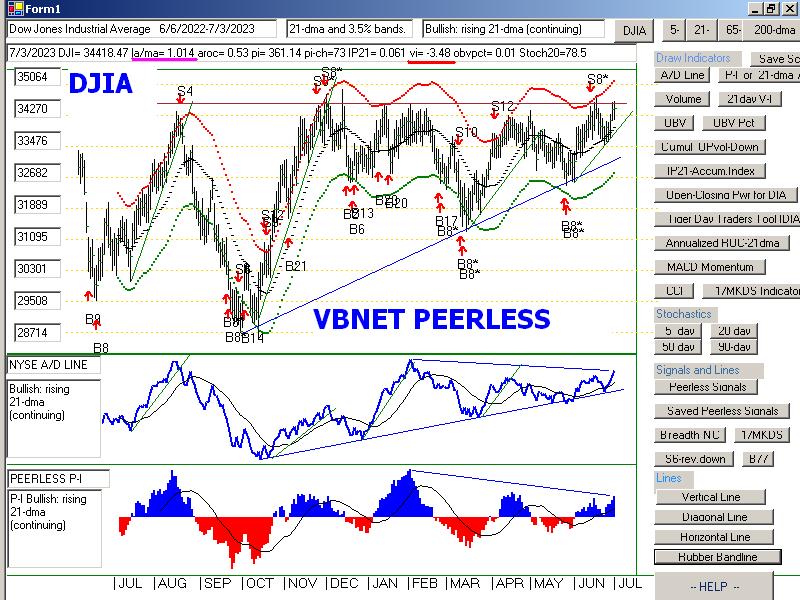 |
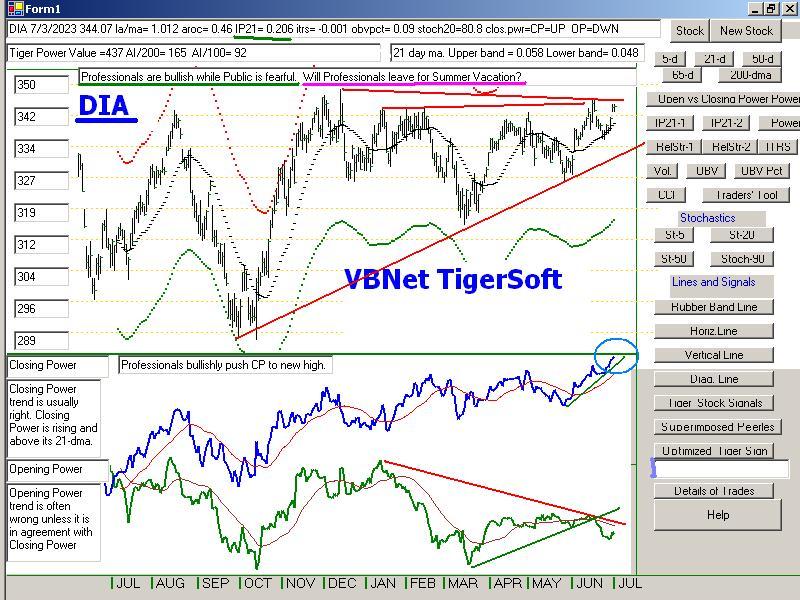 |
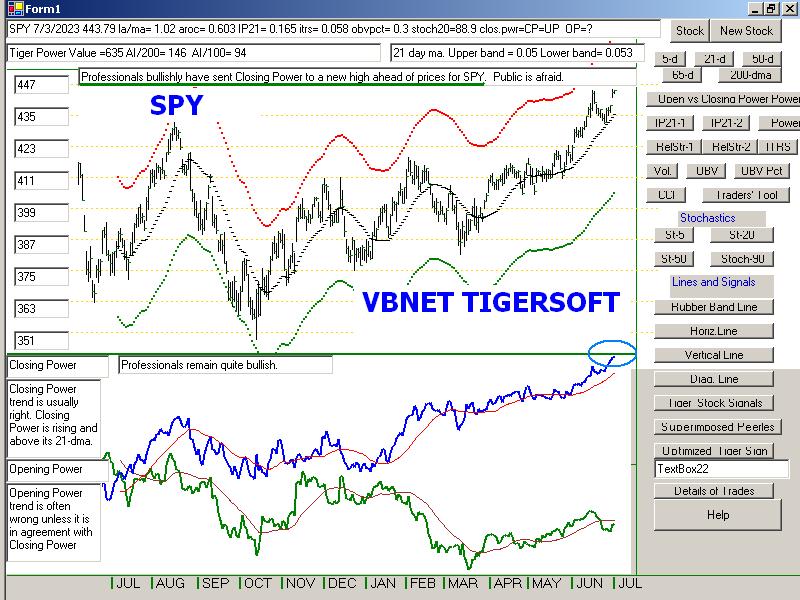 |
 |
 |
 |
 |
 |
 |
 |
 |
 |
 |
Table 1 - Daily Breadth and Volume Statistics
| NYSE |
Latest
Close |
Previous
Close |
Week
Ago |
| Issues
traded |
3,018 |
3,053 |
3,054 |
| Advances |
2,033 |
2,100 |
1,952 |
| Declines |
890 |
855 |
999 |
| Unchanged |
95 |
98 |
103 |
| New
highs |
93 |
225 |
58 |
| New
lows |
7 |
16 |
31 |
| Adv.
volume* |
340,351,448 |
761,951,528 |
552,346,824 |
| Decl.
volume* |
113,910,323 |
232,494,195 |
263,421,811 |
| Total
volume* |
460,443,231 |
1,008,736,411 |
823,093,685 |
| Closing
Arms (TRIN)† |
0.69 |
0.79 |
1.11 |
| Block
trades* |
3,498 |
4,474 |
3,713 |
| Adv.
volume |
1,538,490,013 |
2,923,781,381 |
2,153,061,264 |
| Decl.
volume |
466,961,319 |
935,856,978 |
1,220,993,542 |
| Total
volume |
2,034,289,064 |
3,923,455,074 |
3,415,030,059 |
| NASDAQ |
Latest
Close |
Previous
Close |
Week
Ago |
| Issues
traded |
4,372 |
4,538 |
4,591 |
| Advances |
2,520 |
2,583 |
2,041 |
| Declines |
1,673 |
1,752 |
2,358 |
| Unchanged |
179 |
203 |
192 |
| New
highs |
85 |
168 |
58 |
| New
lows |
60 |
76 |
170 |
| Closing
Arms (TRIN)† |
0.72 |
0.75 |
0.92 |
| Block
trades |
22,200 |
28,844 |
26,994 |
| Adv.
volume |
1,943,638,732 |
3,058,089,007 |
2,114,851,588 |
| Decl.
volume |
929,500,839 |
1,545,791,956 |
2,255,749,933 |
| Total
volume |
2,902,307,829 |
4,661,127,576 |
4,430,600,225 |
|
Table 2 QUICKSILVER on ETFS - 7/3/2023 ---
     Bullish = 6   COMPQX (+.306), QQQ,  MDY(+.286), RETL(+.342),  SOXL (+.692), TECL (+.672)
     Bearish = 1   YINN (-.259)
ETF       CLOSE     CHANGE    PIVOT-PT  5-dma AROC   CL-PWR  CANDLE  IP21    ITRS  POWER INDEX
==================================================================================================
DIA       344.07   .22       339.23        101.9%     Bullish  BLUE   .207    0        ======
---------------------------------------------------------------------------------------------
COMPQX    13816.77   28.85   13555.67      177.2%     Bullish  BLUE   .178    .128     .306
---------------------------------------------------------------------------------------------
SPY       443.79   .51       436.17        141.3%     Bullish  BLUE   .166    .059     .225
---------------------------------------------------------------------------------------------
QQQ       370.29   .87       363.83        173.3%     Bullish  BLUE   .125    .153     .278
---------------------------------------------------------------------------------------------
MDY       479.6   .69        469.82        181.1%     -------  BLUE   .253    .033     .286
---------------------------------------------------------------------------------------------
IWM       187.65   .38       183.36        187.1%     -------  BLUE   .172    .04      .212
---------------------------------------------------------------------------------------------
FAS       64.8   1.22        59.36         548.4%     -------  BLUE   .236   -.004     .232
---------------------------------------------------------------------------------------------
RETL      7.19   .17         6.8           528.6%     Bullish  BLUE   .317    .025     .342
---------------------------------------------------------------------------------------------
SOXL      25.49   .66        24.37         715.4%     -------  BLUE   .033    .659     .692
---------------------------------------------------------------------------------------------
TECL      53.63  -.39        51.27         513.4%     Bullish  RED    .153    .519     .672
---------------------------------------------------------------------------------------------
IBB       126.81  -.15       125.53       -10.3%      Bullish  BLUE   .1     -.057     .043
---------------------------------------------------------------------------------------------
GLD       178.47   .2        177.69       -1.1%       Bearish  RED   -.179   -.059    -.238
---------------------------------------------------------------------------------------------
DBO       14.08  -.04        13.68         39.4%      Bullish  ----   .035   -.062    -.027
---------------------------------------------------------------------------------------------
OIH       290.67   3.07      277.06        307.7%     -------  BLUE   .16    .01       .17
---------------------------------------------------------------------------------------------
CPER     23.34   .14         23.37        -8.6%       Bearish  ----  -.063   -.07     -.133
---------------------------------------------------------------------------------------------
TAN     71.42   0            69.2          216.5%     Bearish  ----  -.055   -.098    -.153
---------------------------------------------------------------------------------------------
UUP       28.41   .03        28.25         15.9%      Bearish  ----  -.077    .005    -.072
---------------------------------------------------------------------------------------------
CORN      22.4   .21         24.54        -673.6%     Bearish  RED   -.009   -.117    -.126
---------------------------------------------------------------------------------------------
WEAT      6.44   0           6.86         -571.2%     -------  ----  -.031   -.075    -.106
---------------------------------------------------------------------------------------------
YINN      36.24   1.98       35.85         365.9%     -------  RED   -.072   -.187    -.259
|
 Table 3     RANKING OF KEY DIRECTORIES BASED PCT.OF STOCKS ABOVE 65-DMA
             7/3/23
 Bullish = 36
 Bearish = 12
---------------------------------------------------------------------------------------
Directory     Current       day-1         day-2         day-3         day-4         day-5
----------------------------------------------------------------------------------------
TRANSP         .947          .947          .894          .894          .894          .894
HOMEBLDG       .944          .944          1             1             1             .833
JETS           .846          .846          .846          .846          .846          .692
AUTO           .83           .811          .773          .754          .754          .716
NIFTY          .818          .818          .795          .772          .772          .681
INFRA          .806          .741          .774          .677          .741          .612
-----------------------------------------------------------------------------------------------
SEMI           .787          .787          .776          .744          .776          .702
HOSPITAL       .769          .923          .846          .769          .692          .615
REIT           .762          .704          .696          .622          .639          .59
ELECTRON       .751          .721          .714          .684          .729          .661
NASD-100       .75           .73           .72           .73           .76           .65
FINANCE        .737          .637          .637          .487          .525          .462
HIGHPRIC       .735          .744          .709          .688          .701          .666
SOFTWARE       .732          .714          .714          .696          .678          .625
MILITARY       .73           .73           .615          .5            .538          .423
CHEM           .72           .674          .604          .488          .488          .418
BIGBANKS       .714          .571          .571          .285          .285          .285
GUNS           .714          .642          .642          .642          .642          .642
RUS-1000       .71           .693          .653          .613          .625          .552
INDEXES        .708          .713          .67           .654          .67           .616
EAT            .707          .707          .658          .658          .634          .536
COMPUTER       .7            .7            .65           .6            .55           .5
SP500          .694          .674          .627          .602          .61           .551
FIDSTKS        .686          .68           .627          .579          .579          .532
GAMING         .684          .631          .578          .526          .526          .473
DOWJONES       .666          .666          .6            .5            .533          .5
SP-100         .655          .644          .6            .533          .544          .488
RETAIL         .63           .586          .586          .586          .652          .586
ETFS           .618          .545          .436          .472          .472          .363
GREEN          .611          .611          .611          .5            .555          .5
INDMATER       .597          .527          .527          .444          .472          .43
OILGAS         .577          .515          .463          .422          .402          .35
COPPER         .571          .285          .428          .285          .571          .285
HACKERS        .562          .562          .562          .5            .5            .437
BONDFUND       .54           .425          .379          .678          .494          .344
DJI-13         .538          .538          .538          .538          .538          .461
=================================================================================================
BEVERAGE       .5            .5            .428          .428          .5            .571
COAL           .5            .5            .5            .333          .333          .5
=================================================================================================
INSURANC       .48           .52           .52           .4            .44           .44
REGBANKS       .476          .357          .404          .309          .333          .261
BIOTECH        .415          .41           .38           .402          .385          .39
LOWPRICE       .404          .372          .363          .346          .357          .36
MARIJUAN       .4            .3            .2            .2            .2            .2
FOOD           .367          .326          .285          .326          .367          .428
COMODITY       .333          .282          .23           .282          .333          .384
EDU            .333          .333          .333          .166          .166          .166
UTILITY        .333          .333          .282          .282          .307          .307
CHINA          .318          .318          .318          .318          .318          .318
SOLAR          .25           .187          .187          .125          .125          .125
GOLD           .111          .066          .066          .066          .088          .088
|
====================================================================================
Monday
-3:06 AM - 7/3/2023 - DJI
Futures -62 NASDAQ Futures +34 Data Used - 6/30/2023
| |
6/30/2023
|
|
| |
Market
Outlook:
The rally we are seeing
is extraordinary if the FED really does intend to raise
rates higher and to continue to sell off
the trillions of debt instruments that it has on
its books. Most likely, it will do
nothing of the sort. And word of this is spreading
among Wall Street Professionals even as
Fed Chairman pretends to be a "hawk",
His deceit and the bullish seasonality
are only partly the reason why Closing Powers
for all the key ETFs are making new highs
now. Consumers are buying and
traveling eagerly and with little
restraint. The ones with money are optimistic.
They are the ones that are important to
Wall Street. The higher interest rates
are no deterrent to them. See how
Visa is about to breakout. So is JP Morgan.
The real centers of strength remain the same.
See Tables 2 and 3. They are in
housing, semi-conductors, artificial
intelligence and the ETFs TECL, QQQ
and NAIL (homebuilders). NVDA
rocketted up nearly 15 while MSFT,
AAPL and TSLA rose more than four.
And now airlines and the travel
industry are taking off.
We trust our Power Rankings and
how well the Closing Powers and Relative
Strength Lines look for these leaders.
The DJI is less than a point away from
making a new closing high. The A/D
Line has been particularly strong recently.
I suspect a DJI new high will be
confirmed by our short-term breadth indicators.
Volume and the OBV Line probably continue
to lag. But OBV non-confirmations
no longer seem to matter.
Our bullishness with respect to the techs and housing
stocks just does not depend on the DJI
advancing past 34500 and completing a
potentially very bullish inverted head
and shoulders pattern. As they say, such
a breakout in the DJI will just be
"icing on the cake". With the NASDAQ up
nearly 30% this year, the market is
mocking the Fed chairman. The last time,
the NASDAQ rose this much in the first
six months of the year was back in
mid 1983, when rates were falling and a
significant top was six months away.
Happy July Fourth. I expect to get
more time now to work on a way to give Tiger
users the ability to flag for themselves
all unusual volume breakouts during the
day and much more using Visual Net Basic,
TC-2000 and Windows-10. It is
wonderful not to have to worry about
memory limits. And wouldn't it be
great to graph the Power Ranker's raw
score over the last five years. If you have
ideas along these lines and want me to
program them, now's the time to ask!
|
|
| |
6/30/2023
2022 PEERLESS DJI, Signals, Indicators Daily DJI Volume
10-DayUp/Down Vol Stoch-20 CCI RSI Pct of All Stocks above 65-dma
Inverted Traders Index
DJI-IPA DJI-OBV Short-Term Rates
NASDAQ S&P OEX NYSE DJ-15 DJ-20 DJI-30
Tiger Index of Big
Banks Bond
Funds Gold Stocks
Housing Stocks
Insurance-Stocks
Regional Banks
Russell-1000
Semi Conductors
Recent 2006 vers-Peerless signals http://tigersoftware.com/oldpeer/UPD90630.bmp
Note the old Buy "b" trading signals. They are not safe to use when
A/D Line
is below its 21-dma: See OLD06
OLD0607
OLD07 OLD0708 OLD08 OLD0809
ETFs: DIA QQQ SPY IWM MDY
TNA Short-Term Rates Ten Year Rates PST (Short Treasuries)
DOLLAR-UUP
ALLSTOCKs
COIN (Bit
Coin ETF)
USO-CrudeOil DBO
BLDP FAS GLD HD IBB JETS JNUG KOL NAIL NUGT
NRGU OIH PALL RSX RETL SDS AGQ SLV SOXL TAN TECL TLT TMF TNA
UGA USO China: YINN CHAU
Commodities: CANE
CORN DBC JJC, NIB CORN, CUT (paper)
MOO, NRGU
SOYB WEAT UUP (Dollar) LIT
(Lithium) PALL
(Palladium)
Stocks
AA AAPL ADBE ALXN AMAT AMGN AMD AMZN ANET AXON AXP
BA BABA BAC BIDU BLDP BSX CAT CDNS CHKP CNX CPB CRM CVX CMG
DE DIS ENPH FB FSLR FTNT GILD GME GOOG GS HD IBM INTU JPM KO KR
LRCX MRK MRNA MOS MSFT NEM NFLX NKE NOC NUE NVDA PANW PG PYPL
QCOM QDEL REGN REV RE SCHW SNOW SO SQUARE TSLA TXN XOM V VRTX
WFC WMT XLE ZM ZOM
HOMEBUILDERS:
NAIL
BZH HOV MHO MTH PHM -
REGIONAL BANKS: EGBN FFIC GBCI HMST
Carl Icahn and
associates: IEP MS JEF
Leveraged Short ETFs:
FAZ - financials, TZA and SRTY- small caps, MZZ - mid caps, TECS -Techs,
SOXS -
semi-conductors LABD
- Biotechs
Bullish MAXCPs http://tigersoftware.com/upping/6-30-2023/Bullish.htm
Bearish MINCPs www.tigersoftware.com/downing/6-30-2023/Bearish.htm
. |
|
 |
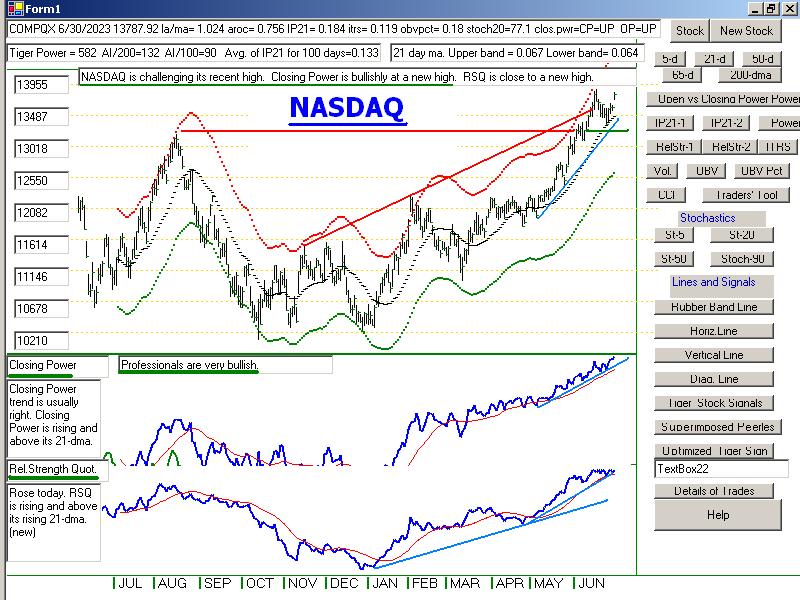 |
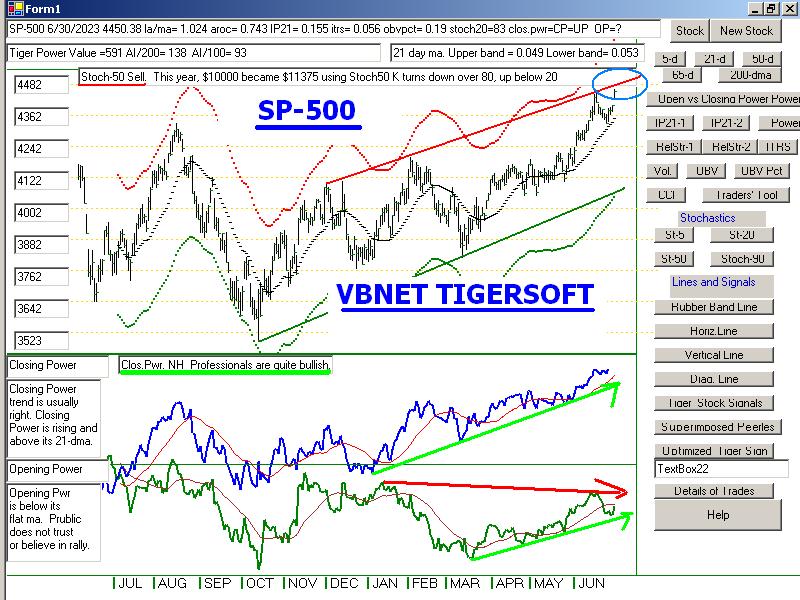 |
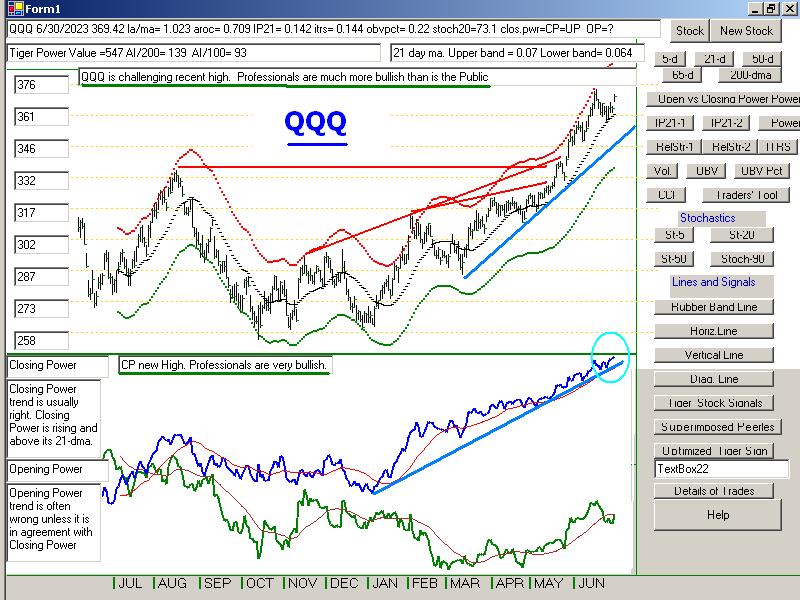 |
 |
 |
 |
 |
 |
 |
 |
Table 1
| NYSE |
Latest
Close |
Previous
Close |
Week
Ago |
| Issues
traded |
3,053 |
3,060 |
3,025 |
| Advances |
2,100 |
2,022 |
909 |
| Declines |
855 |
941 |
2,024 |
| Unchanged |
98 |
97 |
92 |
| New
highs |
225 |
149 |
52 |
| New
lows |
16 |
19 |
47 |
| Adv.
volume* |
761,951,528 |
613,735,475 |
520,036,029 |
| Decl.
volume* |
232,494,195 |
193,588,784 |
2,037,748,298 |
| Total
volume* |
1,008,736,411 |
816,323,392 |
2,603,729,816 |
| Closing
Arms (TRIN)† |
0.79 |
0.77 |
1.81 |
| Block
trades* |
4,474 |
4,082 |
4,603 |
| Adv.
volume |
2,923,781,381 |
2,687,490,706 |
1,181,948,190 |
| Decl.
volume |
935,856,978 |
964,864,326 |
4,770,103,926 |
| Total
volume |
3,923,455,074 |
3,696,669,401 |
6,053,626,923 |
| NASDAQ |
Latest
Close |
Previous
Close |
Week
Ago |
| Issues
traded |
4,538 |
4,594 |
4,557 |
| Advances |
2,583 |
2,602 |
1,447 |
| Declines |
1,752 |
1,777 |
2,932 |
| Unchanged |
203 |
215 |
178 |
| New
highs |
168 |
110 |
49 |
| New
lows |
76 |
120 |
153 |
| Closing
Arms (TRIN)† |
0.75 |
0.97 |
1.25 |
| Block
trades |
28,844 |
29,303 |
33,058 |
| Adv.
volume |
3,058,089,007 |
2,607,615,028 |
2,162,331,426 |
| Decl.
volume |
1,545,791,956 |
1,727,916,232 |
5,491,249,036 |
| Total
volume |
4,661,127,576 |
4,388,140,699 |
7,734,505,923 |
|
Table 2 QUICKSILVER on ETFS - 6/30/2023 ---
     Bullish = 6   COMPQX (+.315), QQQ,  MDY(+.309), RETL,  SOXL (+.657), TECL (+.672)
     Bearish = 0
ETF       CLOSE     CHANGE    PIVOT-PT  5-dma AROC   CL-PWR  CANDLE  IP21    ITRS  POWER INDEX
==================================================================================================
DIA       343.85   2.69      337.14        98.8%      Bullish  BLUE   .216    0        ====
---------------------------------------------------------------------------------------------
COMPQX    13787.92   196.59  13335.78      109.3%     -------  BLUE   .195    .12      .315
---------------------------------------------------------------------------------------------
SPY       443.28   5.17      431.44        115.7%     Bullish  BLUE   .182    .056     .238
---------------------------------------------------------------------------------------------
QQQ       369.42   5.61      357.68        94.9%      -------  BLUE   .142    .145     .287
---------------------------------------------------------------------------------------------
MDY       478.91   3.28      462.53        217%       -------  RED    .278    .031     .309
---------------------------------------------------------------------------------------------
IWM       187.27   .89       180.75        183%       -------  RED    .195    .036     .231
---------------------------------------------------------------------------------------------
FAS       63.58   1.55       58.17         426.5%     -------  BLUE   .24   -.029      .211
---------------------------------------------------------------------------------------------
RETL      7.02   .09         6.47          433.2%     Bullish  RED    .306   -.009     .297
---------------------------------------------------------------------------------------------
SOXL      24.83   1.02       22.09         634.3%     -------  BLUE   .044    .613     .657
---------------------------------------------------------------------------------------------
TECL      54.02   2.39       48.36         449.3%     Bullish  BLUE   .169    .503     .672
---------------------------------------------------------------------------------------------
IBB       126.96   1.01      127.07       -60.8%      Bullish  BLUE   .113   -.061     .052
---------------------------------------------------------------------------------------------
GLD       178.27   1.18      178.51        2%         Bearish  BLUE  -.123   -.053    -.176
---------------------------------------------------------------------------------------------
DBO       14.12   .1         13.97         75.5%      Bullish  ----   .063   -.077    -.014
---------------------------------------------------------------------------------------------
OIH       287.6   4.91       273.46        366.5%     -------  BLUE   .192   -.013     .179
---------------------------------------------------------------------------------------------
CPER     23.2   .45          23.38        -73.3%      -------  BLUE  -.058   -.082    -.14
---------------------------------------------------------------------------------------------
TAN     71.42   2.5          68.41         245.5%     -------  BLUE  -.013   -.096    -.109
---------------------------------------------------------------------------------------------
UUP       28.38  -.12        28.32         5.3%       Bearish  ----  -.016    .007    -.009
---------------------------------------------------------------------------------------------
CORN      22.19  -1.22       25.62        -671.8%     -------  RED   -.019   -.132    -.151
---------------------------------------------------------------------------------------------
WEAT      6.44  -.15         7.21         -572.6%     -------  RED   -.01   -.085     -.095
---------------------------------------------------------------------------------------------
YINN      34.26   .92        33.72         153.4%     -------  ----   .009   -.245    -.236
|
Table 3      RANKING OF KEY DIRECTORIES BASED PCT.OF STOCKS ABOVE 65-DMA
              6/30/23
Bullish = 35
Bearish = 13
---------------------------------------------------------------------------------------
Directory     Current       day-1         day-2         day-3         day-4         day-5
----------------------------------------------------------------------------------------
TRANSP         .947          .894          .894          .894          .894          .842
HOMEBLDG       .944          1             1             1             .888          .888
HOSPITAL       .923          .846          .769          .692          .615          .692
JETS           .846          .846          .846          .846          .692          .692
NIFTY          .818          .795          .772          .772          .681          .659
AUTO           .811          .792          .754          .754          .716          .679
SEMI           .787          .776          .744          .776          .691          .691
HIGHPRIC       .744          .709          .688          .701          .675          .675
INFRA          .741          .774          .677          .741          .612          .548
MILITARY       .73           .615          .5            .538          .423          .423
NASD-100       .73           .72           .73           .76           .65           .65
ELECTRON       .721          .714          .684          .729          .654          .646
SOFTWARE       .714          .732          .696          .678          .625          .625
INDEXES        .713          .67           .654          .67           .616          .61
EAT            .707          .658          .658          .634          .536          .609
REIT           .704          .688          .631          .647          .606          .377
COMPUTER       .7            .65           .6            .55           .5            .55
RUS-1000       .693          .653          .613          .625          .56           .516
FIDSTKS        .68           .627          .579          .579          .532          .526
CHEM           .674          .604          .488          .488          .418          .395
SP500          .674          .627          .602          .608          .558          .519
DOWJONES       .666          .6            .5            .533          .5            .533
               -----
SP-100         .644          .6            .533          .544          .488          .444
GUNS           .642          .642          .642          .642          .642          .642
FINANCE        .637          .637          .487          .512          .462          .462
GAMING         .631          .578          .473          .578          .473          .368
GREEN          .611          .611          .5            .555          .5            .444
RETAIL         .586          .586          .586          .652          .586          .565
BIGBANKS       .571          .571          .285          .285          .285          .285
HACKERS        .562          .562          .5            .5            .437          .437
ETFS           .545          .436          .472          .472          .418          .345
DJI-13         .538          .538          .538          .538          .461          .461
INDMATER       .527          .527          .444          .472          .43           .388
INSURANC       .52           .52           .4            .44           .44           .36
OILGAS         .515          .463          .422          .402          .35           .278
======================================================================================================
BEVERAGE       .5            .428          .428          .5            .571          .571
COAL           .5            .5            .333          .333          .5            .333
======================================================================================================
BONDFUND       .425          .367          .678          .505          .367          .287
BIOTECH        .407          .378          .405          .385          .398          .442
LOWPRICE       .372          .366          .348          .357          .363          .346
REGBANKS       .357          .404          .309          .333          .261          .214
EDU            .333          .333          .166          .166          .166          .333
UTILITY        .333          .282          .282          .307          .307          .23
FOOD           .326          .306          .306          .367          .428          .408
CHINA          .318          .318          .318          .318          .318          .295
MARIJUAN       .3            .2            .2            .2            .2            0
COPPER         .285          .428          .285          .571          .285          .285
COMODITY       .282          .256          .256          .333          .384          .358
SOLAR          .187          .187          .125          .125          .125          .187
GOLD           .066          .066          .066          .088          .088          .044
|
====================================================================================
Friday -6:05 AM
- 6/30/2023 - DJI Futures +165 NASDAQ
Futures +134 Data Used - 6/29/2023
| |
6/29/2023
|
|
| |
Market Outlook:
Seasonality is particularly bullish for the next two weeks. Since 1967,
in
the the third years of the Presidential cycle, the DJI has risen 85.7%
of
the time and gained on average 1.67%. Bullishly rising now are the
breadth figures shown in Table 1 and the A/D Lines for the NYSE
and
Russell-1000. Though, they might not confirm a new DJI high
next
week, we are seeing is a spreading out of the aggressive buying from
tech
stocks to medium and high priced quality stocks that are making
new
highs in the Bullish MAXCPs. These are stocks making Closing
Power
new highs that also show high AI/200 scores (above 147) and
high
current IP21 (above +..25). They now dominate our Bullish
MAXCPs. I take this to be very bullish development, just as home-builders
are
the clear market leaders now. 100% of this group are above their
65-dma. It's hard to see how this group could be so strong if interest
rates
were going to go up much more. Similarly, the strength in the
volatile semi-conductors is much more likely to be a sign of a new bull
market than the beginning of another big leg downward.
Yet,
another bullish note: See also how 57% of all stocks and indexes are
above
their 65-dma and the DJI-30 jumped from 50% to 60% in this
important statistic that measures likely overhead resistance.
It's
still true that the OBV Lines are lagging badly for the DJI. The advances
have
come in sudden buying surges, rather than steady advances. But note
that
the IP21 levels for the DIA (+.228 ), SPY ( +.166 ), QQQ (+.107) and
TECL
(+.104) are all safely positive, even though SOXL, MSFT and
NVDA
are now showing negative IP21 scores.
Making the market look especially bullish at this juncture are the wretched-
looking charts of the negative ETFs for the SP-500 and the DJI that
are
now among the most bearish looking charts in the "slim pickings"
we
show for Bearish MINCPs tonight.
Under
all these conditions, I would seek to close out all but a very
few
short positions. |
e |
| |
6/29/2023
2022 PEERLESS DJI, Signals, Indicators Daily DJI Volume
10-DayUp/Down Vol Stoch-20 CCI RSI Pct of All Stocks above 65-dma
Inverted Traders Index
DJI-IPA DJI-OBV Short-Term Rates
NASDAQ S&P OEX NYSE DJ-15 DJ-20 DJI-30
Tiger Index of Big
Banks Bond
Funds Gold Stocks
Housing Stocks
Insurance-Stocks
Regional Banks
Russell-1000
Semi Conductors
Recent 2006 vers-Peerless signals http://tigersoftware.com/oldpeer/UPD90629.bmp
ETFs: DIA QQQ SPY IWM MDY
TNA Short-Term Rates Ten Year Rates PST (Short Treasuries)
DOLLAR-UUP
ALLSTOCKs
COIN (Bit
Coin ETF)
USO-CrudeOil DBO
BLDP FAS GLD HD IBB JETS JNUG KOL NAIL NUGT
NRGU OIH PALL RSX RETL SDS AGQ SLV SOXL TAN TECL TLT TMF TNA
UGA USO China: YINN CHAU
Commodities: CANE
CORN DBC JJC, NIB CORN, CUT (paper)
MOO, NRGU
SOYB WEAT UUP (Dollar) LIT
(Lithium) PALL
(Palladium)
Stocks
AA AAPL ADBE ALXN AMAT AMGN AMD AMZN ANET AXON AXP
BA BABA BAC BIDU BLDP BSX CAT CDNS CHKP CNX CPB CRM CVX CMG
DE DIS ENPH FB FSLR FTNT GILD GME GOOG GS HD IBM INTU JPM KO KR
LRCX MRK MRNA MOS MSFT NEM NFLX NKE NOC NUE NVDA PANW PG PYPL
QCOM QDEL REGN REV RE SCHW SNOW SO SQUARE TSLA TXN XOM V VRTX
WFC WMT XLE ZM ZOM
HOMEBUILDERS:
NAIL
BZH HOV MHO MTH PHM -
REGIONAL BANKS: EGBN FFIC GBCI HMST
Carl Icahn and
associates: IEP MS JEF
Leveraged Short ETFs:
FAZ - financials, TZA and SRTY- small caps, MZZ - mid caps, TECS -Techs,
SOXS -
semi-conductors LABD
- Biotechs
Bullish MAXCPs http://tigersoftware.com/upping/6-29-2023/Bullish.htm
Bearish MINCPs www.tigersoftware.com/downing/6-29-2023/Bearish.htm |
|
 |
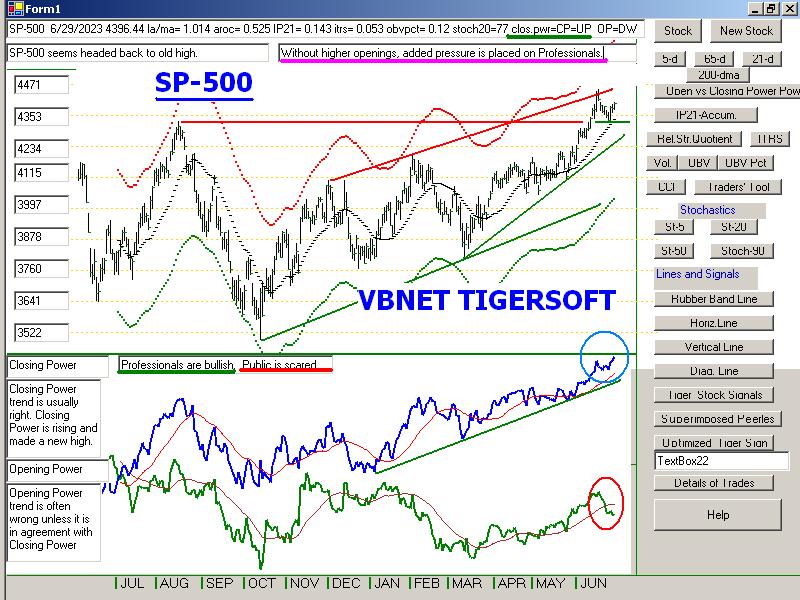 |
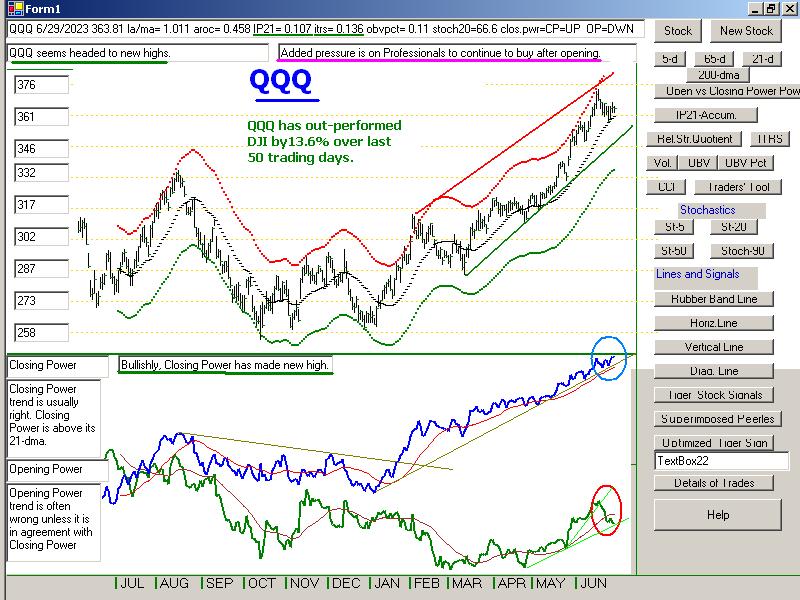 |
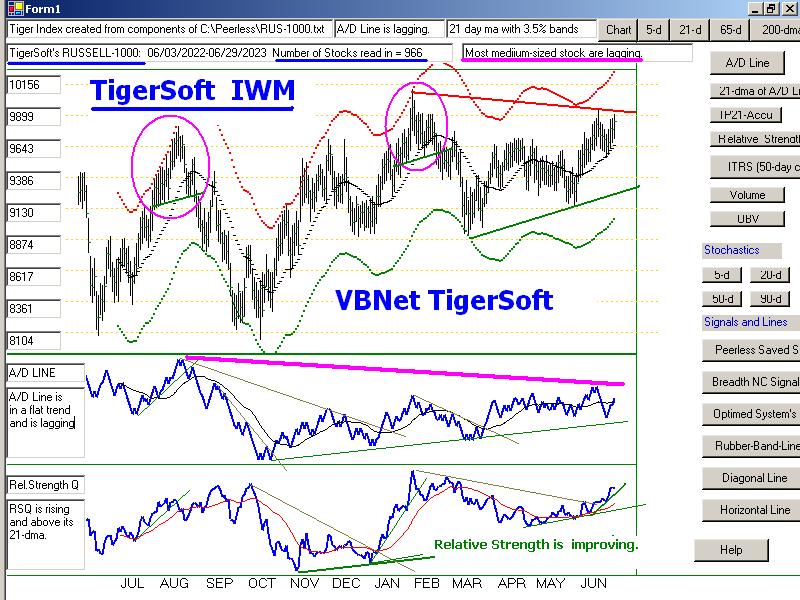 |
 |
 |
 |
 |
 |
 |
 |
|
 |
Table 1 - Daily Breadth and Volume Statistics
| NYSE |
Latest
Close |
Previous
Close |
Week
Ago |
| Issues
traded |
3,060 |
3,044 |
3,033 |
| Advances |
2,022 |
1,620 |
982 |
| Declines |
941 |
1,320 |
1,947 |
| Unchanged |
97 |
104 |
104 |
| New
highs |
149 |
115 |
50 |
| New
lows |
19 |
34 |
37 |
| Adv.
volume* |
613,735,475 |
409,366,414 |
232,165,181 |
| Decl.
volume* |
193,588,784 |
416,408,898 |
598,839,741 |
| Total
volume* |
816,323,392 |
830,972,290 |
837,015,741 |
| Closing
Arms (TRIN)† |
0.77 |
1.02 |
1.23 |
| Block
trades* |
4,082 |
3,938 |
4,232 |
| Adv.
volume |
2,687,490,706 |
2,027,728,927 |
1,013,978,952 |
| Decl.
volume |
964,864,326 |
1,687,042,872 |
2,472,137,825 |
| Total
volume |
3,696,669,401 |
3,739,335,689 |
3,511,002,551 |
| NASDAQ |
Latest
Close |
Previous
Close |
Week
Ago |
| Issues
traded |
4,594 |
4,558 |
4,567 |
| Advances |
2,602 |
2,293 |
1,669 |
| Declines |
1,777 |
2,071 |
2,698 |
| Unchanged |
215 |
194 |
200 |
| New
highs |
110 |
86 |
67 |
| New
lows |
120 |
126 |
125 |
| Closing
Arms (TRIN)† |
0.97 |
0.92 |
0.65 |
| Block
trades |
29,303 |
29,795 |
29,080 |
| Adv.
volume |
2,607,615,028 |
2,451,582,454 |
2,178,861,352 |
| Decl.
volume |
1,727,916,232 |
2,040,096,440 |
2,272,571,730 |
| Total
volume |
4,388,140,699 |
4,533,271,493 |
4,499,554,254 |
|
Table 2 QUICKSILVER on ETFS - 6/298/2023 ---
     Bullish = 4   COMPQX (+.275), MDY(+.287, SOXL (+.482), TECL (+.537)
     Bearish = 0
ETF       CLOSE     CHANGE    PIVOT-PT  5-dma AROC   CL-PWR  CANDLE  IP21    ITRS  POWER INDEX
==================================================================================================
DIA       341.16   2.53      337.16        26.9%     Bullish  BLUE   .228    0        =====
---------------------------------------------------------------------------------------------
COMPQX    13591.33  -.42     13492.52     -14.5%     -------  RED    .161    .114     .275
---------------------------------------------------------------------------------------------
SPY       438.11   1.72      433.21        18.4%     -------  BLUE   .167    .054     .221
---------------------------------------------------------------------------------------------
QQQ       363.81  -.73       362.54       -32.5%     -------  RED    .108    .137     .245
---------------------------------------------------------------------------------------------
MDY       475.63   5.71      458.63        124.3%    -------  BLUE   .251    .036     .287
---------------------------------------------------------------------------------------------
IWM       186.38   2.12      180.57        83.6%     -------  BLUE   .205    .043     .248
---------------------------------------------------------------------------------------------
FAS       62.03   2.92       58.51         232.6%    -------  BLUE   .256   -.036     .22
---------------------------------------------------------------------------------------------
RETL      6.93   .1          6.44          248.9%    Bullish  BLUE   .251   -.015     .236
---------------------------------------------------------------------------------------------
SOXL      23.81   .09        21.89         154.1%    -------  RED   -.023    .505     .482
---------------------------------------------------------------------------------------------
TECL      51.63   .31        49.49         35.8%     -------  BLUE   .104    .433     .537
---------------------------------------------------------------------------------------------
IBB       125.95  -.3        128.5        -153%      Bullish  ----   .105   -.055     .05
---------------------------------------------------------------------------------------------
GLD       177.09  -.19       178.2        -17.4%     Bearish  BLUE  -.19   -.053     -.243
---------------------------------------------------------------------------------------------
DBO       14.02   .08        13.91         46.8%     Bullish  ----   .02   -.091     -.071
---------------------------------------------------------------------------------------------
OIH       282.69   5.33      267.4         222.4%    -------  BLUE   .12   -.018      .102
---------------------------------------------------------------------------------------------
CPER     22.75  -.18         23.54        -266.6%    Bearish  ----  -.043   -.096    -.139
---------------------------------------------------------------------------------------------
TAN     68.92  -.71          68.04        -.7%       Bearish  RED   -.047   -.125    -.172
---------------------------------------------------------------------------------------------
UUP       28.5   .12         28.35         53%       -------  ----  -.035    .024    -.011
---------------------------------------------------------------------------------------------
CORN      23.41  -.33        25.49        -673.5%    -------  RED    .097   -.085     .012
---------------------------------------------------------------------------------------------
WEAT      6.59  -.01         7.23         -525.1%    -------  ----   .097   -.077     .02
---------------------------------------------------------------------------------------------
YINN      33.34  -1.65       33.21        -311.7%    -------  BLUE   .071   -.281    -.21
|
 Table 3      RANKING OF KEY DIRECTORIES BASED PCT.OF STOCKS ABOVE 65-DMA
              6/29/23
 Bullish = 34
 Bearish = 15
---------------------------------------------------------------------------------------
Directory     Current       day-1         day-2         day-3         day-4         day-5
----------------------------------------------------------------------------------------
HOMEBLDG       1             1             1             .888          .888          .888
TRANSP         .894          .894          .894          .894          .842          .842
HOSPITAL       .846          .769          .692          .615          .692          .692
JETS           .846          .846          .846          .692          .692          .769
=================================================================================================
NIFTY          .795          .772          .772          .681          .659          .75
AUTO           .792          .773          .754          .716          .679          .754
SEMI           .776          .744          .776          .691          .68           .744
INFRA          .774          .677          .741          .612          .548          .645
SOFTWARE       .732          .714          .678          .625          .625          .696
NASD-100       .72           .73           .76           .65           .65           .74
ELECTRON       .714          .684          .729          .654          .646          .691
HIGHPRIC       .709          .688          .701          .675          .679          .709
REIT           .688          .622          .655          .614          .385          .532
INDEXES        .67           .654          .67           .616          .61           .675
EAT            .658          .658          .634          .536          .609          .56
RUS-1000       .653          .613          .625          .56           .525          .581
COMPUTER       .65           .6            .55           .5            .55           .65
GUNS           .642          .642          .642          .642          .642          .642
FINANCE        .637          .487          .512          .45           .462          .487
FIDSTKS        .627          .579          .579          .532          .526          .568
SP500          .627          .602          .608          .556          .529          .578
MILITARY       .615          .5            .538          .423          .423          .5
GREEN          .611          .5            .555          .5            .444          .555
CHEM           .604          .488          .488          .418          .395          .395
DOWJONES       .6            .5            .533          .5            .533          .533
               =======
SP-100         .6            .533          .544          .488          .455          .522
RETAIL         .586          .586          .652          .586          .565          .586
GAMING         .578          .473          .526          .526          .368          .473
BIGBANKS       .571          .285          .285          .285          .285          .285
HACKERS        .562          .5            .5            .437          .437          .562
DJI-13         .538          .538          .538          .461          .461          .461
INDMATER       .527          .444          .472          .43           .388          .458
INSURANC       .52           .4            .44           .44           .36           .48
=================================================================================================
COAL           .5            .333          .333          .5            .333          .333
=================================================================================================
OILGAS         .463          .422          .402          .35           .278          .319
ETFS           .436          .472          .472          .418          .381          .49
BEVERAGE       .428          .428          .5            .571          .571          .714
COPPER         .428          .285          .571          .285          .285          .857
REGBANKS       .404          .309          .333          .261          .214          .333
BIOTECH        .375          .402          .388          .398          .447          .504
BONDFUND       .367          .666          .505          .379          .298          .137
LOWPRICE       .366          .351          .36           .363          .343          .384
EDU            .333          .166          .166          .166          .333          .166
CHINA          .318          .318          .318          .318          .295          .318
UTILITY        .282          .282          .307          .307          .23           .333
COMODITY       .256          .282          .307          .384          .358          .41
FOOD           .222          .25           .305          .388          .361          .388
MARIJUAN       .2            .2            .2            .2            0             .4
====================================================================================================
SOLAR          .187          .125          .125          .125          .187          .187
GOLD           .066          .066          .088          .088          .044          .133
|
===========================================================================
Thursday -5:56 AM -
6/29/2023 - DJI Futures +139 NASDAQ
Futures +52 Data Used - 6/28/2023
| |
6/28/2023
|
|
| |
Market Outlook:
Instead of insisting on the need for two more rate hikes,
Fed Chairman Powell
took
a significant step back from his recent hawkishness. He said only that
two
more rate hikes this year would be "on the table" at the next FOMC
meeting. This is much more than a nuanced change or words; it shows that
the
FOMC "doves" that want a longer pause to see how the CPI numbers
actually come out before making a decision about raising rates are making a
persuasive case. Powell is no longer insisting on more rate hikes. Given
the
falling price of Crude, commodities and Gold, this is a bullish development.
As a
result, we saw the Closing Powers turn up smartly today and even the
side-tracking DJI turned up from its 21-day ma. Moreover, a number of the
home-builders, our strongest group in Table 3, rose sharply. The market's
breadth has recently been improving. This should allow the DJI to re-challenge
its
highs and permit the techs that have been the market leaders to move still
higher. See below how our faith in the rising Closing Power Line matched
with
a rising Closing Power have been rewarded for the NASDAQ, QQQ
and
TECL (which has the higher "Power" score in Table 2.). Once again,
Professionals have shown that they have an inside track on what the FED
is
likely to do.
Stay
long the tech stocks and pick some of the bullish MAXCPs to play the
expected rally. It should spill over to the bullish period before July 4th.
The
only
shorts I would still hold are the still downtrending regional banks. |
|
| |
6/28/2023
2022 PEERLESS DJI, Signals, Indicators Daily DJI Volume
10-DayUp/Down Vol Stoch-20 CCI RSI Pct of All Stocks above 65-dma
Inverted Traders Index
DJI-IPA DJI-OBV Short-Term Rates
NASDAQ S&P OEX NYSE DJ-15 DJ-20 DJI-30
Tiger Index of Big
Banks Bond
Funds Gold Stocks
Housing Stocks
Insurance-Stocks
Regional Banks
Russell-1000
Semi Conductors
Recent 2006 vers-Peerless signals http://tigersoftware.com/oldpeer/UPD90628.bmp
ETFs: DIA QQQ SPY IWM MDY
TNA Short-Term Rates Ten Year Rates PST (Short Treasuries)
DOLLAR-UUP
ALLSTOCKs
COIN (Bit
Coin ETF)
USO-CrudeOil DBO
BLDP FAS GLD HD IBB JETS JNUG KOL NAIL NUGT
NRGU OIH PALL RSX RETL SDS AGQ SLV SOXL TAN TECL TLT TMF TNA
UGA USO China: YINN CHAU
Commodities: CANE
CORN DBC JJC, NIB CORN, CUT (paper)
MOO, NRGU
SOYB WEAT UUP (Dollar) LIT
(Lithium) PALL
(Palladium)
Stocks
AA AAPL ADBE ALXN AMAT AMGN AMD AMZN ANET AXON AXP
BA BABA BAC BIDU BLDP BSX CAT CDNS CHKP CNX CPB CRM CVX CMG
DE DIS ENPH FB FSLR FTNT GILD GME GOOG GS HD IBM INTU JPM KO KR
LRCX MRK MRNA MOS MSFT NEM NFLX NKE NOC NUE NVDA PANW PG PYPL
QCOM QDEL REGN REV RE SCHW SNOW SO SQUARE TSLA TXN XOM V VRTX
WFC WMT XLE ZM ZOM
HOMEBUILDERS:
NAIL
BZH HOV MHO MTH PHM -
REGIONAL BANKS: EGBN FFIC GBCI HMST
Carl Icahn and
associates: IEP MS JEF
Leveraged Short ETFs:
FAZ - financials, TZA and SRTY- small caps, MZZ - mid caps, TECS -Techs,
SOXS -
semi-conductors LABD
- Biotechs
Bullish MAXCPs http://tigersoftware.com/upping/6-28-2023/Bullish.htm
Bearish MINCPs www.tigersoftware.com/downing/6-28-2023/Bearish.htm |
|
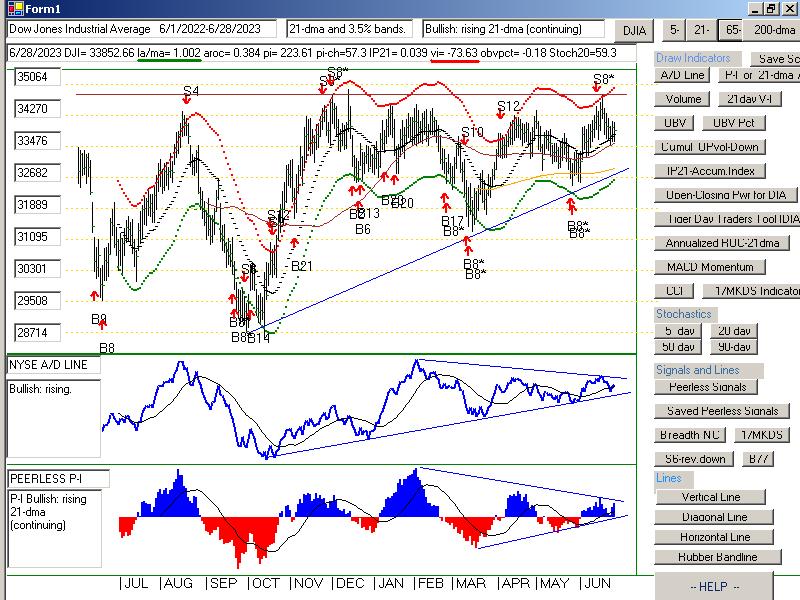 |
 |
 |
 |
 |
 |
 |
 |
 |
 |
Table 1 - Daily Breadth and Volume Statistics
| NYSE |
Latest
Close |
Previous
Close |
Week
Ago |
| Issues
traded |
3,044 |
3,040 |
3,072 |
| Advances |
1,620 |
2,136 |
1,508 |
| Declines |
1,320 |
807 |
1,418 |
| Unchanged |
104 |
97 |
146 |
| New
highs |
115 |
107 |
92 |
| New
lows |
34 |
32 |
29 |
| Adv.
volume* |
409,366,414 |
642,301,229 |
396,803,011 |
| Decl.
volume* |
416,408,898 |
157,928,728 |
514,809,217 |
| Total
volume* |
830,972,290 |
809,603,180 |
926,381,058 |
| Closing
Arms (TRIN)† |
1.02 |
0.66 |
1.54 |
| Block
trades* |
3,938 |
3,989 |
4,080 |
| Adv.
volume |
2,027,728,927 |
2,815,926,009 |
1,484,568,022 |
| Decl.
volume |
1,687,042,872 |
698,365,711 |
2,151,007,892 |
| Total
volume |
3,739,335,689 |
3,573,502,804 |
3,709,332,222 |
| NASDAQ |
Latest
Close |
Previous
Close |
Week
Ago |
| Issues
traded |
4,558 |
4,573 |
4,585 |
| Advances |
2,293 |
2,663 |
1,809 |
| Declines |
2,071 |
1,737 |
2,571 |
| Unchanged |
194 |
173 |
205 |
| New
highs |
86 |
87 |
92 |
| New
lows |
126 |
168 |
132 |
| Closing
Arms (TRIN)† |
0.92 |
0.73 |
0.98 |
| Block
trades |
29,795 |
34,454 |
36,368 |
| Adv.
volume |
2,451,582,454 |
3,364,156,938 |
2,143,954,664 |
| Decl.
volume |
2,040,096,440 |
1,610,577,360 |
2,977,728,526 |
| Total
volume |
4,533,271,493 |
5,053,666,168 |
5,194,643,837 |
|
|
|
|
|
Table 2 QUICKSILVER on ETFS - 6/28/2023 ---
     Bullish = 2   SOXL (+.431), TECL (+.46 8)
     Bearish = 0
ETF       CLOSE     CHANGE    PIVOT-PT  5-dma AROC   CL-PWR  CANDLE  IP21    ITRS  POWER INDEX
==================================================================================================
DIA       338.63  -.6        339.34       -11.8%     Bullish  RED    .207    0        ----
---------------------------------------------------------------------------------------------
COMPQX    13591.75   36.08   13630.61      33.2%     Bullish  BLUE   .125    .122     .247
---------------------------------------------------------------------------------------------
SPY       436.39   .22       436.51        16.7%     Bullish  BLUE   .076    .058     .134
---------------------------------------------------------------------------------------------
QQQ       364.54   .71       366.17        36.4%     Bullish  BLUE   .068    .147     .215
---------------------------------------------------------------------------------------------
MDY       469.92   .1        464.07        36.6%     Bullish  BLUE   .206    .03      .236
---------------------------------------------------------------------------------------------
IWM       184.26   .9        183.33       -12.1%     Bullish  BLUE   .171    .034     .205
---------------------------------------------------------------------------------------------
FAS       59.11  -.25        59.29        -136%      -------  RED    .2   -.065       .135
---------------------------------------------------------------------------------------------
RETL      6.83   .03         6.6           197.7%    Bullish  BLUE   .263   -.022     .241
--------------------------------------------------------------------------------------------
SOXL      23.72  -.65        23.1          205.7%    -------  BLUE  -.095    .526     .431
---------------------------------------------------------------------------------------------
TECL      51.32   .05        51.27         132.8%    Bullish  BLUE   .023    .445     .468
---------------------------------------------------------------------------------------------
IBB       126.25   .72       129.85       -139.3%    Bullish  BLUE   .087   -.051     .036
---------------------------------------------------------------------------------------------
GLD       177.28  -.41       177.71       -62%       Bearish  ----  -.198   -.041    -.239
---------------------------------------------------------------------------------------------
DBO       13.94   .26        13.89        -161.1%    Bullish  BLUE   .016   -.09     -.074
---------------------------------------------------------------------------------------------
OIH       277.36   .3        270.54        31.9%     -------  BLUE   .119   -.029     .09
---------------------------------------------------------------------------------------------
CPER     22.93  -.44         24           -219.9%    Bearish  RED   -.015   -.077    -.092
---------------------------------------------------------------------------------------------
TAN     69.63   .43          68.93        -.7%       Bullish  BLUE  -.03   -.108     -.138
---------------------------------------------------------------------------------------------
UUP       28.38   .13        28.2          49.6%     Bearish  ----  -.035    .024    -.011
---------------------------------------------------------------------------------------------
CORN      23.74  -.8         26.81        -667.1%    Bullish  RED    .132   -.059     .073
---------------------------------------------------------------------------------------------
WEAT      6.6  -.26          7.33         -487.1%    -------  RED    .106   -.061     .045
---------------------------------------------------------------------------------------------
YINN      34.99  -.86        35.5         -117.8%    -------  ----   .044   -.245    -.201
|
 TABLE 3   RANKING OF KEY DIRECTORIES BASED PCT.OF STOCKS ABOVE 65-DMA
              6/28/23
 Bullish = 24
 Bearish = 22
---------------------------------------------------------------------------------------
Directory     Current       day-1         day-2         day-3         day-4         day-5
----------------------------------------------------------------------------------------
HOMEBLDG       1             1             .888          .888          .888          .944
TRANSP         .894          .894          .894          .842          .842          .789
JETS           .846          .846          .692          .692          .769          .846
-------------------------------------------------------------------------------------------------
AUTO           .773          .773          .716          .679          .754          .754
NIFTY          .772          .772          .681          .659          .727          .75
HOSPITAL       .769          .692          .615          .692          .692          .692
SEMI           .744          .776          .691          .68           .734          .734
NASD-100       .73           .76           .65           .65           .74           .66
SOFTWARE       .714          .696          .625          .625          .696          .66
HIGHPRIC       .688          .701          .675          .679          .705          .705
ELECTRON       .684          .729          .654          .646          .684          .706
INFRA          .677          .741          .612          .548          .612          .645
BONDFUND       .666          .494          .379          .31           .149          .218
EAT            .658          .634          .536          .609          .56           .658
INDEXES        .654          .67           .616          .61           .664          .718
GUNS           .642          .642          .642          .642          .642          .642
REIT           .622          .647          .622          .393          .508          .639
RUS-1000       .613          .625          .56           .525          .582          .618
SP500          .602          .608          .556          .527          .576          .608
COMPUTER       .6            .55           .5            .55           .65           .65
RETAIL         .586          .652          .586          .565          .586          .608
FIDSTKS        .579          .579          .532          .526          .573          .603
DJI-13         .538          .538          .461          .461          .461          .538
SP-100         .533          .544          .488          .455          .533          .566
================================================================================================
DOWJONES       .5            .533          .5            .533          .533          .5
GREEN          .5            .555          .5            .444          .555          .555
HACKERS        .5            .5            .437          .437          .562          .5
MILITARY       .5            .538          .423          .423          .5            .692
================================================================================================
CHEM           .488          .488          .418          .395          .395          .488
FINANCE        .487          .512          .45           .45           .5            .675
GAMING         .473          .526          .473          .421          .473          .473
ETFS           .472          .472          .418          .381          .509          .527
INDMATER       .444          .472          .43           .388          .43           .5
BEVERAGE       .428          .5            .571          .571          .714          .571
OILGAS         .422          .402          .35           .278          .329          .453
BIOTECH        .4            .385          .4            .447          .507          .5
INSURANC       .4            .44           .44           .36           .48           .48
LOWPRICE       .348          .359          .362          .342          .38           .398
COAL           .333          .333          .5            .333          .333          .333
FOOD           .326          .367          .408          .428          .469          .53
CHINA          .318          .318          .318          .295          .318          .318
REGBANKS       .309          .333          .261          .214          .309          .452
BIGBANKS       .285          .285          .285          .285          .428          .714
COPPER         .285          .571          .285          .285          .857          .714
COMODITY       .282          .333          .358          .358          .435          .512
UTILITY        .282          .307          .307          .23           .358          .435
------------------------------------------------------------------------------------------------
MARIJUAN       .2            .2            .2            0             .4            .2
EDU            .166          .166          .166          .333          .166          .166
SOLAR          .125          .125          .125          .187          .187          .25
GOLD           .066          .088          .088          .044          .111          .111
|
=============================================================================
Wednesday -6:04 AM - 6/28/2023 - DJI Futures -31 NASDAQ Futures -71 Data Used - 6/27/2023
=========================================================================
| |
6/27/2023
|
|
| |
Market Outlook:
The Breadth NCs have brought Sell S8*s to the the DJI
chart. These are trading range
signals and recently dropped the DJI back to its 65-dma and its still rising 21-dma
support.
As
good as the rally looked today, it was from an oversold conditon. The DJI will now
need
to get back above its 34000 resistance.
Breadth was very positive for the second day. This shows that Fed Chairman Powell''s
hawkish words about two more rate hikes are not wholly believed. Moreover,
the
demand for housing and travel are very strong. This is not what one would see if a
recession lay just ahead. The market's rally also reminds us that the demand for
artificial intelligence in the form of smarter and smarter chips just cannot be denied
even
by
the FED, almighty. Tbe weakness in oil prices, on the other hand, is
consistent
with
a weakening economic outlook. And Gold and Silver's failure to rally can be
interpreted to mean that while there will be no panic financial ahead, but the higher
rates
will
tend to make holding precious metals less appealing. Avoid oil stocks and gold
a
hedge.
Professionals see these things and remain confident enough to keep buying the ETFs
representing indexes which overweight the best performing housing and tech stocks.
But
they are getting selective with their stock purchases. GOOG, for example, seems
to be
topping out. NVDA is in a minor downtrend. And some big name
biotechs, like
REGN,
were dumped today.
The
rush to buy housing stocks by Profesessionals is wholly out of character for the
scenario that the Public expects, namely a much weaker national economy and
rates
that
will approach the dangerous 6% danger-point later this year.
Performance is still king among Professionals.. Safety is less important. Hence the
Closing Powers are still rising for DIA, SPY, QQQ, MSFT, AAPL and TECL.
But this is a game of musical chairs. It puts extra pressure on the market to
continue
to show strength after weaker openings among the leaders. It remains to
be seen
if the market can stay so strong if the FED actually is going to raise rates to
5 1/2%-5 3/4% in a few months. The best way to trade this is to remain long the
stocks and ETFs that show rising Closing Powers and Relative Strengh Lines.
Where possible, new long positions should also show high current Accumulation,
IP21 over .30. Shorting some of the weakest regional banks should offer us
some
protection against more evidence of much higher interest rates and consumers. |
|
| |
6/27/2023
2022 PEERLESS DJI, Signals, Indicators Daily DJI Volume
10-DayUp/Down Vol Stoch-20 CCI RSI Pct of All Stocks above 65-dma
Inverted Traders Index
DJI-IPA DJI-OBV Short-Term Rates
NASDAQ S&P OEX NYSE DJ-15 DJ-20 DJI-30
Tiger Index of Big
Banks Bond
Funds Gold Stocks
Housing Stocks
Insurance-Stocks
Regional Banks
Russell-1000
Semi Conductors
Recent 2006 vers-Peerless signals http://tigersoftware.com/oldpeer/UPD90627.bmp
ETFs: DIA QQQ SPY IWM MDY
TNA Short-Term Rates Ten Year Rates PST (Short Treasuries)
DOLLAR-UUP
ALLSTOCKs
COIN (Bit
Coin ETF)
USO-CrudeOil DBO
BLDP FAS GLD HD IBB JETS JNUG KOL NAIL NUGT
NRGU OIH PALL RSX RETL SDS AGQ SLV SOXL TAN TECL TLT TMF TNA
UGA USO China: YINN CHAU
Commodities: CANE
CORN DBC JJC, NIB CORN, CUT (paper)
MOO, NRGU
SOYB WEAT UUP (Dollar) LIT
(Lithium) PALL
(Palladium)
Stocks
AA AAPL ADBE ALXN AMAT AMGN AMD AMZN ANET AXON AXP
BA BABA BAC BIDU BLDP BSX CAT CDNS CHKP CNX CPB CRM CVX CMG
DE DIS ENPH FB FSLR FTNT GILD GME GOOG GS HD IBM INTU JPM KO KR
LRCX MRK MRNA MOS MSFT NEM NFLX NKE NOC NUE NVDA PANW PG PYPL
QCOM QDEL REGN REV RE SCHW SNOW SO SQUARE TSLA TXN XOM V VRTX
WFC WMT XLE ZM ZOM
HOMEBUILDERS:
NAIL
BZH HOV MHO MTH PHM -
REGIONAL BANKS: EGBN FFIC GBCI HMST
Carl Icahn and
associates: IEP MS JEF
Leveraged Short ETFs:
FAZ - financials, TZA and SRTY- small caps, MZZ - mid caps, TECS -Techs,
SOXS -
semi-conductors LABD
- Biotechs
Bullish MAXCPs http://tigersoftware.com/upping/6-27-2023/Bullish.htm
Bearish MINCPs www.tigersoftware.com/downing/6-27-2023/Bearish.htm |
|
Peerless DJI Chart
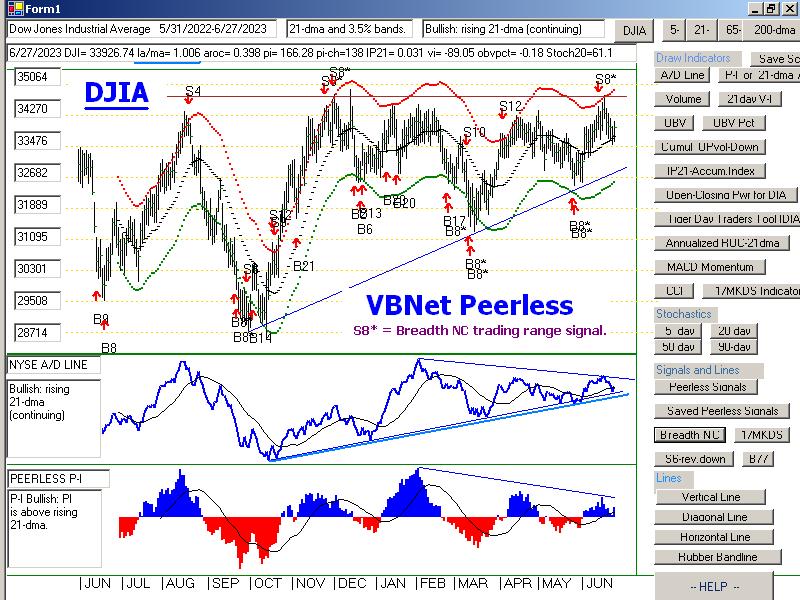 -----------------------------------------------------------------------------------------------------------------------
SP-500 Chart
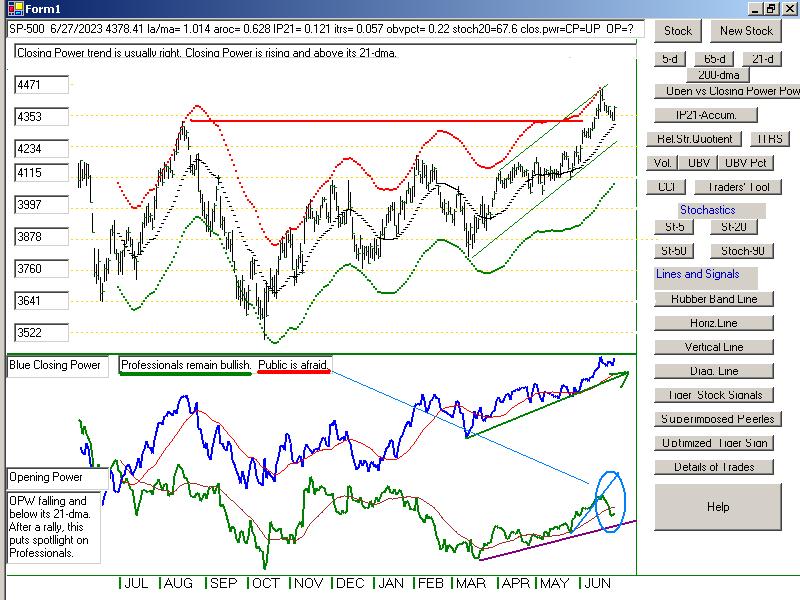
---------------------------------------------------------------------------------------------------------------------
QQQ Chart
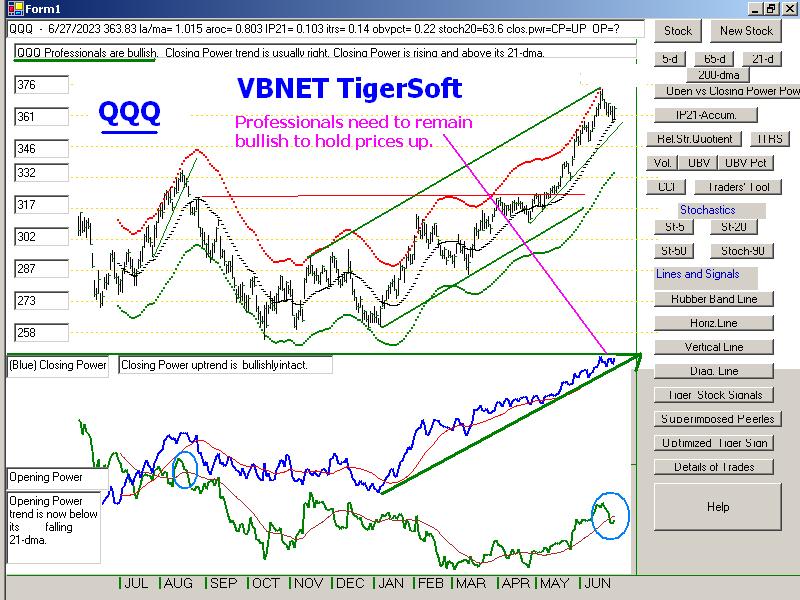
--------------------------------------------------------------------------------------------------------------------
 |
 |
 |
 |
 |
 |
 |
 |
 |
 |
 |
Table 1 - Daily Breadth and Volume Statistics
| NYSE |
Latest Close |
Previous
Close |
Week Ago |
| Issues
traded |
3,040 |
3,054 |
3,077 |
| Advances |
2,136 |
1,952 |
954 |
| Declines |
807 |
999 |
2,025 |
| Unchanged |
97 |
103 |
98 |
| New
highs |
107 |
58 |
69 |
| New
lows |
32 |
31 |
19 |
| Adv.
volume* |
642,301,229 |
552,346,824 |
218,214,127 |
| Decl.
volume* |
157,928,728 |
263,421,811 |
798,373,636 |
| Total
volume* |
809,603,180 |
823,093,685 |
1,024,247,588 |
| Closing
Arms (TRIN)† |
0.66 |
1.11 |
1.42 |
| Block
trades* |
3,989 |
3,713 |
4,355 |
| Adv.
volume |
2,815,926,009 |
2,153,061,264 |
999,867,299 |
| Decl.
volume |
698,365,711 |
1,220,993,542 |
3,016,165,492 |
| Total
volume |
3,573,502,804 |
3,415,030,059 |
4,055,797,080 |
| NASDAQ |
Latest Close |
Previous
Close |
Week Ago |
| Issues
traded |
4,573 |
4,591 |
4,627 |
| Advances |
2,663 |
2,041 |
1,700 |
| Declines |
1,737 |
2,358 |
2,770 |
| Unchanged |
173 |
192 |
157 |
| New
highs |
87 |
58 |
91 |
| New
lows |
168 |
170 |
100 |
| Closing
Arms (TRIN)† |
0.73 |
0.92 |
0.84 |
| Block
trades |
34,454 |
26,994 |
36,443 |
| Adv.
volume |
3,364,156,938 |
2,114,851,588 |
2,190,294,253 |
| Decl.
volume |
1,610,577,360 |
2,255,749,933 |
3,013,951,501 |
| Total
volume |
5,053,666,168 |
4,430,600,225 |
5,237,719,001 |
|
Table 2 QUICKSILVER on ETFS - 6/27/2023 ---
     Bullish = 4   COMPQX, RETL, SOXL (+.542), TECL (+.528)
     Bearish = 0
ETF       CLOSE     CHANGE    PIVOT-PT  5-dma AROC   CL-PWR  CANDLE  IP21    ITRS  POWER INDEX
==================================================================================================
DIA       339.23   2.09      339.43       -18.2%     -------  BLUE   .213    ----    ------
---------------------------------------------------------------------------------------------
COMPQX    13555.67   219.89  13502.2      -41.3%     Bullish  BLUE   .15    .117      .267
---------------------------------------------------------------------------------------------
SPY       436.17   4.73      434.94       -11.6%     -------  BLUE   .148    .056     .204
---------------------------------------------------------------------------------------------
QQQ       363.83   6.15      361.9        -42.3%     Bullish  BLUE   .104    .141     .245
---------------------------------------------------------------------------------------------
MDY       469.82   7.29      466.52        29.8%     Bullish  BLUE   .2    .033       .233
---------------------------------------------------------------------------------------------
IWM       183.36   2.61      184.7        -48.4%     Bullish  BLUE   .175    .038     .213
---------------------------------------------------------------------------------------------
FAS       59.36   1.19       60.72        -196.9%    -------  BLUE   .189   -.034     .155
---------------------------------------------------------------------------------------------
RETL      6.8   .33          6.57          168.4%    Bullish  BLUE   .269   -.018     .251
---------------------------------------------------------------------------------------------
SOXL      24.37   2.28       22.78        -61.1%     -------  BLUE  -.021    .563     .542
---------------------------------------------------------------------------------------------
TECL      51.27   2.91       49.99        -110.3%    Bullish  BLUE   .074    .454     .528
---------------------------------------------------------------------------------------------
IBB       125.53  -1.54      129.82       -187.8%    Bearish  RED    .064   -.053     .011
---------------------------------------------------------------------------------------------
GLD       177.69  -.82       179.49       -57.6%     Bearish  RED   -.19   -.048     -.238
---------------------------------------------------------------------------------------------
DBO       13.68  -.29        14.39        -167.1%    -------  RED   -.009   -.125    -.134
---------------------------------------------------------------------------------------------
OIH       277.06   3.6       275.62        91.2%     -------  BLUE   .088   -.039     .049
---------------------------------------------------------------------------------------------
CPER     23.37  -.01         23.97        -122%      -------  ----   .035   -.072    -.037
---------------------------------------------------------------------------------------------
TAN     69.2   .79           69.64        -94.1%     Bearish  BLUE  -.027   -.095    -.122
---------------------------------------------------------------------------------------------
UUP       28.25  -.07        28.1          3.5%      -------  ----  -.032    .019    -.013
---------------------------------------------------------------------------------------------
CORN      24.54  -1.08       27.2         -272.7%    Bullish  RED    .218   -.024     .194
---------------------------------------------------------------------------------------------
WEAT      6.86  -.35         7.3          -69.4%     -------  RED    .221   -.014     .207
---------------------------------------------------------------------------------------------
YINN      35.85   2.13       35.81        -114.4%    -------  BLUE   .043   -.171    -.128
|
Table 3      RANKING OF KEY DIRECTORIES BASED PCT.OF STOCKS ABOVE 65-DMA
             6/27/23
 Bullish = 29
 Bearish = 19
---------------------------------------------------------------------------------------
Directory     Current       day-1         day-2         day-3         day-4         day-5
----------------------------------------------------------------------------------------
HOMEBLDG       1             .888          .888          .888          .944          .944
TRANSP         .894          .894          .842          .842          .789          .842
JETS           .846          .692          .692          .769          .846          .846
===============================================================================================
SEMI           .776          .691          .68           .734          .723          .797
AUTO           .773          .735          .679          .754          .754          .773
NIFTY          .772          .681          .659          .727          .75           .818
NASD-100       .76           .65           .65           .74           .68           .75
INFRA          .741          .612          .548          .612          .645          .677
ELECTRON       .729          .654          .646          .684          .699          .751
HIGHPRIC       .701          .675          .679          .705          .709          .727
SOFTWARE       .696          .642          .625          .696          .66           .678
HOSPITAL       .692          .615          .692          .692          .692          .692
INDEXES        .67           .616          .61           .664          .718          .718
RETAIL         .652          .586          .565          .586          .608          .586
REIT           .647          .614          .401          .516          .631          .672
GUNS           .642          .642          .642          .642          .642          .642
EAT            .634          .536          .609          .56           .658          .682
RUS-1000       .625          .56           .525          .582          .62           .632
SP500          .608          .556          .527          .574          .615          .617
FIDSTKS        .579          .532          .526          .573          .609          .639
COPPER         .571          .285          .285          .857          .714          .714
GREEN          .555          .5            .444          .555          .555          .611
COMPUTER       .55           .5            .55           .65           .65           .7
SP-100         .544          .488          .455          .533          .566          .588
DJI-13         .538          .461          .461          .461          .538          .692
MILITARY       .538          .423          .423          .5            .692          .615
DOWJONES       .533          .5            .533          .533          .5            .6
GAMING         .526          .473          .368          .526          .526          .684
FINANCE        .512          .45           .45           .487          .662          .65
======================================================================================================
BEVERAGE       .5            .571          .571          .714          .571          .571
HACKERS        .5            .437          .437          .562          .5            .625
======================================================================================================
BONDFUND       .494          .367          .31           .16           .229          .172
CHEM           .488          .418          .395          .395          .465          .488
ETFS           .472          .418          .381          .509          .545          .563
INDMATER       .472          .43           .388          .43           .486          .458
INSURANC       .44           .44           .36           .48           .48           .44
OILGAS         .402          .35           .278          .329          .443          .402
BIOTECH        .383          .398          .45           .507          .507          .524
FOOD           .367          .428          .408          .469          .53           .51
LOWPRICE       .366          .372          .349          .383          .398          .398
COAL           .333          .5            .333          .333          .333          .333
COMODITY       .333          .384          .333          .435          .512          .487
REGBANKS       .333          .261          .214          .309          .452          .595
CHINA          .318          .318          .295          .318          .318          .34
UTILITY        .307          .307          .23           .358          .435          .384
BIGBANKS       .285          .285          .285          .428          .714          .857
=======================================================================================================
MARIJUAN       .2            .2            0             .4            .2            .2
EDU            .166          .166          .333          .166          .166          .166
SOLAR          .125          .125          .187          .187          .25           .312
GOLD           .088          .088          .044          .111          .111          .088
|
==================================================================================
===============================================================================
Tuesday -6:00 AM - 6/26/2023 -
DJI Futures -28 NASDAQ Futures +58
Data Used - 6/26/2023
| |
6/26/2023
|
|
| |
In coming
down from its recent high, the DJI has now fallen 7 of the last
8 days. It is Fed Chairman
Powell's hawkishness that has sent the bulls
to the exits He is
making believers of those who doubted his determination to
deliberately cause an economc
slow-down. He has dropped the words
"soft landing" from
his speeches. Does he intend to keep raising rates
until unemployment goes back
up to 5%, 6% or higher? That could be
very dangerous given how
dependent Wall Street has become on Powell's
usual supporting of the
market.
If the biggest tech stocks,
AAPL, MSFT, GOOG, NVDA and TSLA do not
turn back up today, it will
be very troubling. It is their leadership along with
AMZN
that has allowed the NASDAQ and SP-500 to run to new
highs. First, their
Opening Powers were recently broken. After a six-week rally,
this is clearly a warning.
Now we must watch for Closing Power and Relative
Strength violations.
When they take place, as in NVDA's case with prices
far above the 65-dma, it does
not take much for a quick retreat of 10%-15%
to occur. But that
still allows the stock plenty of room to regroup and rebound
nearer its rising 65-dma.
GOOG's short-term top pattern is more threatening.
Its RSQ is in a visible
downtrend.
QQQ, TECL and MSFT now show
Closing Powers and Relative Strength
Lines that are testing their
uptrends. This is where new buyers must come
in after the opening to keep
their uptrends alive. Otherwise, they will likely
have to fall back to their
rising 65-dma supports. Traders will have to wait
and see how these three fare
today. Hold AI stocks as long term investments.
It should be easier to ride
the current decline out if one holds short some
of the bearish MINCPs,
especially the weaker Regional Banks.
|
|
| |
6/26/2023
2022 PEERLESS DJI, Signals, Indicators Daily DJI Volume
10-DayUp/Down Vol Stoch-20 CCI RSI Pct of All Stocks above 65-dma
Inverted Traders Index
DJI-IPA DJI-OBV Short-Term Rates
NASDAQ S&P OEX NYSE DJ-15 DJ-20 DJI-30
Tiger Index of Big
Banks Bond
Funds Gold Stocks
Housing Stocks
Insurance-Stocks
Regional Banks
Russell-1000
Semi Conductors
Recent 2006 vers-Peerless signals
http://tigersoftware.com/oldpeer/UPD90626.bmp
ETFs: DIA QQQ SPY IWM MDY
TNA Short-Term Rates Ten Year Rates PST (Short Treasuries)
DOLLAR-UUP
ALLSTOCKs
COIN (Bit
Coin ETF)
USO-CrudeOil DBO
BLDP FAS GLD HD IBB JETS JNUG KOL NAIL NUGT
NRGU OIH PALL RSX RETL SDS AGQ SLV SOXL TAN TECL TLT TMF TNA
UGA USO China: YINN CHAU
Commodities: CANE
CORN DBC JJC, NIB CORN, CUT (paper)
MOO, NRGU
SOYB WEAT UUP (Dollar) LIT
(Lithium) PALL
(Palladium)
Stocks
AA AAPL ADBE ALXN AMAT AMGN AMD AMZN ANET AXON AXP
BA BABA BAC BIDU BLDP BSX CAT CDNS CHKP CNX CPB CRM CVX CMG
DE DIS ENPH FB FSLR FTNT GILD GME GOOG GS HD IBM INTU JPM KO KR
LRCX MRK MRNA MOS MSFT NEM NFLX NKE NOC NUE NVDA PANW PG PYPL
QCOM QDEL REGN REV RE SCHW SNOW SO SQUARE TSLA TXN XOM V VRTX
WFC WMT XLE ZM ZOM
HOMEBUILDERS: NAIL BZH HOV MHO MTH PHM -
REGIONAL BANKS: EGBN FFIC GBCI HMST
Carl Icahn and
associates: IEP MS JEF
Leveraged Short ETFs:
FAZ - financials, TZA and SRTY- small caps, MZZ - mid caps, TECS -Techs,
SOXS -
semi-conductors LABD
- Biotechs
Bullish MAXCPs http://tigersoftware.com/upping/6-26-2023/Bullish.htm
Bearish MINCPs
www.tigersoftware.com/downing/6-26-2023/Bearish.htm |
|
 |
DIA's Closing Power has broken
its uptrend and its Opening Power is falling.
 |
 |
 |
 |
MSFT''s Closing Power and RSQ are testing their uptrends.
 |
 |
 |
Table 1 - Daily Breadth and Volume Statistics
| NYSE |
Latest Close |
Previous
Close |
Week Ago |
| Issues
traded |
3,054 |
3,025 |
3,052 |
| Advances |
1,952 |
909 |
1,141 |
| Declines |
999 |
2,024 |
1,806 |
| Unchanged |
103 |
92 |
105 |
| New
highs |
58 |
52 |
145 |
| New
lows |
31 |
47 |
15 |
| Adv.
volume* |
552,346,824 |
520,036,029 |
1,323,353,893 |
| Decl.
volume* |
263,421,811 |
2,037,748,298 |
1,669,584,503 |
| Total
volume* |
823,093,685 |
2,603,729,816 |
3,053,607,728 |
| Closing
Arms (TRIN)† |
1.11 |
1.81 |
0.81 |
| Block
trades* |
3,713 |
4,603 |
6,186 |
| Adv.
volume |
2,153,061,264 |
1,181,948,190 |
2,949,856,705 |
| Decl.
volume |
1,220,993,542 |
4,770,103,926 |
3,761,271,758 |
| Total
volume |
3,415,030,059 |
6,053,626,923 |
6,848,603,118 |
| NASDAQ |
Latest Close |
Previous
Close |
Week Ago |
| Issues
traded |
4,591 |
4,557 |
4,593 |
| Advances |
2,041 |
1,447 |
1,786 |
| Declines |
2,358 |
2,932 |
2,646 |
| Unchanged |
192 |
178 |
161 |
| New
highs |
58 |
49 |
217 |
| New
lows |
170 |
153 |
79 |
| Closing
Arms (TRIN)† |
0.92 |
1.25 |
1.01 |
| Block
trades |
26,994 |
33,058 |
49,628 |
| Adv.
volume |
2,114,851,588 |
2,162,331,426 |
3,206,097,136 |
| Decl.
volume |
2,255,749,933 |
5,491,249,036 |
4,801,959,236 |
| Total
volume |
4,430,600,225 |
7,734,505,923 |
8,076,539,028 |
|
Table 2 QUICKSILVER on ETFS - 6/23/2023 ---
     Bullish = 4   SOXL (+.430, TECL (+.430), CORN (+.281), WEAT(+.361)
     Bearish = 2   GLD(-.253), YINN(-.272)
ETF       CLOSE     CHANGE    PIVOT-PT  5-dma AROC   CL-PWR  CANDLE  IP21    ITRS  POWER INDEX
==================================================================================================
DIA       337.14  -.02       340.46       -85.5%     -------  BLUE   .208    0        ----
---------------------------------------------------------------------------------------------
COMPQX    13335.78  -156.74  13667.29     -130.1%    -------  RED    .124    .106     .23
---------------------------------------------------------------------------------------------
SPY       431.44  -1.77      437.18       -91.9%     -------  RED    .126    .053     .179
---------------------------------------------------------------------------------------------
QQQ       357.68  -4.86      366.9        -140.4%     -------  RED    .095    .13     .225
---------------------------------------------------------------------------------------------
MDY       462.53   3.9       467.06       -86.1%     -------  BLUE   .192    .022     .214
---------------------------------------------------------------------------------------------
IWM       180.75   .18       185.13       -141.1%     -------  BLUE   .151    .024    .175
---------------------------------------------------------------------------------------------
FAS       58.17  -.34        61.71        -401.5%     -------  RED    .191   -.014    .177
---------------------------------------------------------------------------------------------
RETL      6.47   .03         6.58         -159.7%     -------  BLUE   .227   -.057    .17
---------------------------------------------------------------------------------------------
SOXL      22.09   .2         24.65        -669.3%     -------  RED    .011    .419    .43
---------------------------------------------------------------------------------------------
TECL      48.36  -1.13       52.38        -500.7%     -------  RED    .072    .358    .43
---------------------------------------------------------------------------------------------
IBB       127.07  -1.43      130.38       -162.7%     Bearish  RED    .096   -.039    .057
---------------------------------------------------------------------------------------------
GLD       178.51   .31       179.75       -87%        Bearish  RED   -.203   -.05    -.253
---------------------------------------------------------------------------------------------
DBO       13.97   .06        14.15        -95.6%      Bullish  BLUE   .031   -.092   -.061
---------------------------------------------------------------------------------------------
OIH       273.46   6.06      272.1        -52.3%      -------  BLUE   .075   -.043    .032
---------------------------------------------------------------------------------------------
CPER     23.38  -.16         23.95        -102.7%     -------  RED    .042   -.065    -.023
---------------------------------------------------------------------------------------------
TAN     68.41   .37          70.5         -312.9%     Bearish  BLUE  -.052   -.102    -.154
---------------------------------------------------------------------------------------------
UUP       28.32  -.03        28.23         30.1%      Bearish  ----   .003    .039     .042
---------------------------------------------------------------------------------------------
CORN      25.62   .13        25.97        -62.8%      Bullish  BLUE   .237    .044     .281
---------------------------------------------------------------------------------------------
WEAT      7.21  -.02         6.96          245.2%     -------  RED    .288    .073     .361
---------------------------------------------------------------------------------------------
YINN      33.72   .51        36.65        -1130.1%    -------  ----  -.034   -.238    -.272
|
 Table 3      RANKING OF KEY DIRECTORIES BASED PCT.OF STOCKS ABOVE 65-DMA
              6/26/23
 Bullish = 21
 Bearish = 25
---------------------------------------------------------------------------------------
Directory     Current       day-1         day-2         day-3         day-4         day-5
----------------------------------------------------------------------------------------
TRANSP         .894          .842          .842          .789          .842          .842
HOMEBLDG       .888          .888          .888          .944          .944          .944
----------------------------------------------------------------------------------------------
AUTO           .735          .698          .754          .754          .773          .811
JETS           .692          .692          .769          .846          .846          .846
SEMI           .691          .68           .734          .723          .765          .84
NIFTY          .681          .659          .727          .75           .818          .886
HIGHPRIC       .675          .679          .705          .709          .727          .753
ELECTRON       .654          .646          .684          .699          .729          .796
NASD-100       .65           .65           .74           .68           .75           .79
GUNS           .642          .642          .642          .642          .642          .642
SOFTWARE       .642          .642          .696          .66           .696          .678
INDEXES        .616          .61           .664          .718          .718          .74
HOSPITAL       .615          .692          .692          .692          .692          .769
REIT           .614          .393          .524          .639          .672          .745
INFRA          .612          .548          .612          .645          .677          .709
RETAIL         .586          .565          .586          .608          .586          .608
BEVERAGE       .571          .571          .714          .571          .571          .714
RUS-1000       .56           .525          .582          .62           .634          .689
SP500          .556          .527          .574          .613          .623          .678
EAT            .536          .609          .56           .658          .682          .731
FIDSTKS        .532          .526          .573          .609          .656          .692
================================================================================================
COAL           .5            .333          .333          .333          .333          .333
COMPUTER       .5            .55           .65           .65           .7            .7
DOWJONES       .5            .533          .533          .5            .6            .666
GREEN          .5            .444          .555          .555          .611          .722
SP-100         .488          .455          .533          .566          .6            .688
GAMING         .473          .368          .473          .578          .684          .526
DJI-13         .461          .461          .461          .538          .692          .692
FINANCE        .45           .45           .487          .65           .65           .775
INSURANC       .44           .36           .48           .48           .44           .48
HACKERS        .437          .437          .562          .5            .625          .687
INDMATER       .43           .388          .43           .486          .472          .569
FOOD           .428          .428          .448          .53           .51           .551
MILITARY       .423          .423          .5            .692          .615          .653
CHEM           .418          .395          .395          .465          .488          .674
ETFS           .418          .381          .509          .545          .6            .8
BIOTECH        .395          .447          .509          .507          .539          .532
COMODITY       .384          .358          .41           .512          .487          .538
LOWPRICE       .372          .352          .386          .401          .398          .424
BONDFUND       .367          .298          .16           .241          .183          .172
OILGAS         .35           .278          .329          .443          .422          .525
CHINA          .318          .295          .318          .318          .34           .5
UTILITY        .307          .23           .358          .435          .41           .487
BIGBANKS       .285          .285          .428          .714          .857          .857
COPPER         .285          .285          .857          .714          .714          .857
REGBANKS       .261          .214          .309          .452          .571          .69
------------------------------------------------------------------------------------------------
MARIJUAN       .2            0             .4            .2            .2            .3
EDU            .166          .333          .166          .166          .166          .166
SOLAR          .125          .187          .187          .25           .312          .5
GOLD           .088          .044          .111          .111          .088          .155
|
=================================================================================================
=================================================================================================
Monday -5:55 AM - 6/26/2023 -
DJI Futures -10 NASDAQ Futures +5
Data Used - 6/23/2023
| |
6/23/2023
|
|
| |
Powell's insistence on two more rate hikes this year, without the usual
caveat that he would be waiting upon the latest economic and inflation news,
has
turned the blue chips and NYSE dividend stocks down. They have
fallen back into their year-long trading range. That has validated our automatic
red
Sells on GS, FAS and Regional Banks. Rates above 5% usually take
a
toll on the economy. Above 6%, they become quite dangerous. That is
was
what turned the booming 1920s into the bust of the 1930s. Most likely,
Powell knows this and is using his words to turn the market back down for
now.
If it falls 20%, he figures he can reverse and turn it back up.
Putin
in Russia now looks personally vulnerable in a way he has never been.
Will
that lead to peace in the Ukraine, or will he "double-down"? Peace
would
great. And it would be bullish.
But
right now, the DJI is fighting to stay above its still rising 21-day ma,
but
with a much lower IP21 score, warning us that big money is not supporting
the
DJI now, with its highest price component, UNH on a new red Sell,
and
with its Opening Power and P-Indicators now weakening appreciably.
The
market's appearance of strength now depends on a handful of
tech
stocks and the retail-goliath, AMZN. Their relative strength and
Closing Powers are bullishly still rising. But as you can see in the second
SP-500 chart above, most SP-500 stocks are acting much weaker. And
now a
majority of all stocks and ETFs are back below their 65-dma.
With
Professionals apt to take more and more time off because Summer
has
officially arrived, a decline by the DJI to 33000 seems the most
likely scenario ahead. So, I've suggested shorting some MINCPs as hedges
while
we hold the tech leaders and some housing stocks.
For
hedgin purposes. the regional banks gain look the most vulnerable.
The
higher rates go, the more "under the water" their long term holdings are.
It is
by no means clear that the Congress and the President will work together
to
increase the FDIC insurance amount. So, we may even see another bank
run
if Powell really follows through and raises rates to 5 1/2%-5 3/4%.
I
refuse to think the FED is so ignorant of its own history so as to raise rates
to
6%. Let's hope so. |
|
| |
6/23/2023
2022 PEERLESS DJI, Signals, Indicators Daily DJI Volume
10-DayUp/Down Vol Stoch-20 CCI RSI Pct of All Stocks above 65-dma
Inverted Traders Index
DJI-IPA DJI-OBV Short-Term Rates
NASDAQ S&P OEX NYSE DJ-15 DJ-20 DJI-30
Tiger Index of Big
Banks Bond
Funds Gold Stocks
Housing Stocks
Insurance-Stocks
Regional Banks
Russell-1000
Semi Conductors
Recent 2006 vers-Peerless signals
http://tigersoftware.com/oldpeer/UPD90623.bmp
ETFs: DIA QQQ SPY IWM MDY
TNA Short-Term Rates Ten Year Rates PST (Short Treasuries)
DOLLAR-UUP
ALLSTOCKs
COIN (Bit
Coin ETF)
USO-CrudeOil DBO
BLDP FAS GLD HD IBB JETS JNUG KOL NAIL NUGT
NRGU OIH PALL RSX RETL SDS AGQ SLV SOXL TAN TECL TLT TMF TNA
UGA USO China: YINN CHAU
Commodities: CANE
CORN DBC JJC, NIB CORN, CUT (paper)
MOO, NRGU
SOYB WEAT UUP (Dollar) LIT
(Lithium) PALL
(Palladium)
Stocks
AA AAPL ADBE ALXN AMAT AMGN AMD AMZN ANET AXON AXP
BA BABA BAC BIDU BLDP BSX CAT CDNS CHKP CNX CPB CRM CVX CMG
DE DIS ENPH FB FSLR FTNT GILD GME GOOG GS HD IBM INTU JPM KO KR
LRCX MRK MRNA MOS MSFT NEM NFLX NKE NOC NUE NVDA PANW PG PYPL
QCOM QDEL REGN REV RE SCHW SNOW SO SQUARE TSLA TXN XOM V VRTX
WFC WMT XLE ZM ZOM
HOMEBUILDERS: NAIL BZH HOV MHO MTH PHM -
REGIONAL BANKS: EGBN FFIC GBCI HMST
Carl Icahn and
associates: IEP MS JEF
Leveraged Short ETFs:
FAZ - financials, TZA and SRTY- small caps, MZZ - mid caps, TECS -Techs,
SOXS -
semi-conductors LABD
- Biotechs
Bullish MAXCPs http://tigersoftware.com/upping/6-23-2023/Bullish.htm
Bearish MINCPs www.tigersoftware.com/downing/6-23-2023/Bearish.htm
|
|
 |
 |
 |
 |
 |
 |
 |
 |
 |
 |
 |
 |
 |
 |
 |
 |
Table 1
| NYSE |
Latest Close |
Previous
Close |
Week Ago |
| Issues
traded |
3,025 |
3,033 |
3,052 |
| Advances |
909 |
982 |
1,141 |
| Declines |
2,024 |
1,947 |
1,806 |
| Unchanged |
92 |
104 |
105 |
| New
highs |
52 |
50 |
145 |
| New
lows |
47 |
37 |
15 |
| Adv.
volume* |
520,036,029 |
232,165,181 |
1,323,353,893 |
| Decl.
volume* |
2,037,748,298 |
598,839,741 |
1,669,584,503 |
| Total
volume* |
2,603,729,816 |
837,015,741 |
3,053,607,728 |
| Closing
Arms (TRIN)† |
1.81 |
1.23 |
0.81 |
| Block
trades* |
4,603 |
4,232 |
6,186 |
| Adv.
volume |
1,181,948,190 |
1,013,978,952 |
2,949,856,705 |
| Decl.
volume |
4,770,103,926 |
2,472,137,825 |
3,761,271,758 |
| Total
volume |
6,053,626,923 |
3,511,002,551 |
6,848,603,118 |
| NASDAQ |
Latest Close |
Previous
Close |
Week Ago |
| Issues
traded |
4,557 |
4,567 |
4,593 |
| Advances |
1,447 |
1,669 |
1,786 |
| Declines |
2,932 |
2,698 |
2,646 |
| Unchanged |
178 |
200 |
161 |
| New
highs |
49 |
67 |
217 |
| New
lows |
153 |
125 |
79 |
| Closing
Arms (TRIN)† |
1.25 |
0.65 |
1.01 |
| Block
trades |
33,058 |
29,080 |
49,628 |
| Adv.
volume |
2,162,331,426 |
2,178,861,352 |
3,206,097,136 |
| Decl.
volume |
5,491,249,036 |
2,272,571,730 |
4,801,959,236 |
| Total
volume |
7,734,505,923 |
4,499,554,254 |
8,076,539,028 |
|
Table 2 QUICKSILVER on ETFS - 6/23/2023 ---
     Bullish = 6   COMPQX, QQQ, SOXL (+.494), TECL (+.554), CORN, WEAT)
     Bearish = 1   GLD, YINN
ETF       CLOSE     CHANGE    PIVOT-PT  5-dma AROC   CL-PWR  CANDLE  IP21    ITRS  POWER INDEX
==================================================================================================
DIA       337.16  -2.18      342.95       -111.5%     Bullish  ----   .177    0     .------
---------------------------------------------------------------------------------------------
COMPQX    13492.52  -138.09  13689.57     -106.3%     Bullish  BLUE   .18    .129      .309
---------------------------------------------------------------------------------------------
SPY       433.21  -3.3       439.46       -107.2%     Bullish  BLUE   .152    .06      .212
---------------------------------------------------------------------------------------------
QQQ       362.54  -3.63      367.93       -105.3%     Bullish  BLUE   .149    .156     .305
---------------------------------------------------------------------------------------------
MDY       458.63  -5.44      470.54       -166.5%     Bullish  RED    .172    .009     .181
---------------------------------------------------------------------------------------------
IWM       180.57  -2.76      185.94       -185.4%     Bullish  RED    .173    .025     .198
---------------------------------------------------------------------------------------------
FAS       58.51  -.78        63.04        -401.5%     -------  BLUE   .18    .004      .184
---------------------------------------------------------------------------------------------
RETL      6.44  -.16         6.68         -426.1%     Bullish  ----   .216   -.061     .155
---------------------------------------------------------------------------------------------
SOXL      21.89  -1.21       25.24        -833.9%     -------  RED    .068    .426     .494
---------------------------------------------------------------------------------------------
TECL      49.49  -1.78       53.5         -516.1%     Bullish  BLUE   .101    .453     .554
---------------------------------------------------------------------------------------------
IBB       128.5  -1.35       131.3        -126.7%     -------  RED    .093   -.017     .076
---------------------------------------------------------------------------------------------
GLD       178.2   .49        181.63       -103%       Bearish  RED   -.22   -.05      -.27
---------------------------------------------------------------------------------------------
DBO       13.91   .02        14.24        -56.5%      -------  BLUE   .029   -.112    -.083
---------------------------------------------------------------------------------------------
OIH       267.4  -3.14       276.31       -201.2%     -------  BLUE   .074   -.073     .001
---------------------------------------------------------------------------------------------
CPER     23.54  -.46         23.87        -89.8%      Bullish  BLUE  -.002   -.057    -.059
---------------------------------------------------------------------------------------------
TAN     68.04  -.89          72.79        -363.3%     Bearish  RED   -.02    -.09     -.11
---------------------------------------------------------------------------------------------
UUP       28.35   .15        28.15         44.4%      Bearish  ----   .041    .024     .065
---------------------------------------------------------------------------------------------
CORN      25.49  -1.32       25.95         82.1%      Bullish  RED    .244    .025     .269
---------------------------------------------------------------------------------------------
WEAT      7.23  -.1          6.86          413.1%     Bullish  ----   .333    .051     .384
---------------------------------------------------------------------------------------------
YINN      33.21  -2.29       42           -1241.3%    -------  RED   -.056   -.208    -.264
|
 Table 3     RANKING OF KEY DIRECTORIES BASED PCT.OF STOCKS ABOVE 65-DMA
             6/23/23
 Bullish = 22
 Bearish = 28
---------------------------------------------------------------------------------------
Directory     Current       day-1         day-2         day-3         day-4         day-5
----------------------------------------------------------------------------------------
HOMEBLDG       .888          .888          .944          .944          .944          .944
TRANSP         .842          .842          .789          .842          .842          .842
--------------------------------------------------------------------------------------------------
AUTO           .698          .773          .754          .773          .811          .811
HOSPITAL       .692          .692          .692          .692          .769          .769
JETS           .692          .769          .846          .846          .846          .846
SEMI           .68           .734          .723          .765          .829          .829
HIGHPRIC       .679          .705          .709          .727          .757          .757
NIFTY          .659          .727          .75           .818          .863          .84
NASD-100       .65           .74           .68           .75           .79           .81
ELECTRON       .646          .684          .699          .729          .781          .789
GUNS           .642          .642          .642          .642          .642          .714
SOFTWARE       .642          .714          .66           .696          .696          .678
INDEXES        .61           .664          .718          .718          .74           .74
EAT            .609          .56           .658          .682          .731          .731
INFRA          .575          .636          .666          .696          .727          .818
BEVERAGE       .571          .714          .571          .571          .714          .714
RETAIL         .565          .586          .608          .586          .608          .63
COMPUTER       .55           .65           .65           .7            .7            .75
DOWJONES       .533          .533          .5            .6            .666          .633
SP500          .527          .574          .613          .621          .678          .67
FIDSTKS        .526          .573          .609          .656          .692          .692
RUS-1000       .526          .583          .62           .634          .688          .686
==================================================================================================
DJI-13         .461          .461          .538          .692          .692          .692
SP-100         .455          .533          .566          .6            .677          .655
FINANCE        .45           .487          .65           .637          .775          .775
BIOTECH        .445          .507          .509          .539          .534          .532
GREEN          .444          .555          .555          .611          .722          .722
HACKERS        .437          .562          .5            .625          .687          .625
FOOD           .428          .469          .51           .51           .551          .51
MILITARY       .423          .5            .692          .615          .615          .576
CHEM           .395          .395          .465          .488          .674          .697
REIT           .393          .516          .647          .68           .737          .729
INDMATER       .388          .43           .486          .472          .569          .597
ETFS           .381          .509          .545          .6            .818          .781
GAMING         .368          .473          .526          .736          .578          .631
INSURANC       .36           .48           .48           .44           .48           .44
COMODITY       .358          .435          .487          .487          .538          .487
LOWPRICE       .352          .389          .404          .401          .424          .409
COAL           .333          .333          .333          .333          .333          .333
EDU            .333          .166          .166          .166          .166          .166
BONDFUND       .298          .149          .241          .195          .195          .252
CHINA          .295          .318          .318          .34           .5            .522
BIGBANKS       .285          .428          .714          .857          .857          .857
COPPER         .285          .857          .714          .714          .857          1
OILGAS         .278          .329          .443          .422          .525          .556
UTILITY        .23           .358          .435          .41           .487          .461
REGBANKS       .214          .309          .452          .571          .69           .69
SOLAR          .187          .187          .25           .312          .5            .562
GOLD           .044          .111          .111          .088          .155          .133
MARIJUAN       0             .4            .2            .2            .3            .3
|
===================================================================================
Friday - 6:15 AM - 6/23/2023 - Data
Used - 6/22/2023
| |
6/22/2023
|
|
| |
The DJI is unable to rally. Traders are aware of its repeated failures
to get past 34000+. They see more rate hikes ahead and know these will
hurt dividend stocks and blue chips. Many NY traders have decided
it's Summer and time to take some time off. But these factors do not seem
to have the same impact on the growth stock fanciers who favor the leading tech
stocks. Into this elite realm of MSFT, NVDA, QQQ and TECL are
now TSLA and AMZN, both of which can play on their past successes
as market leaders.
But the prospect of higher rates is hurting Regional Banks, retailers
other than AMZN and now big banks, as measured by their ETF, FAS.
Another week of DJI decline would seem to lie ahead. That will probably
frighten retail investors. Hence, more weaker openikngs lie ahead. Watch to
see if Professionals join in the selling of the blue chips. Normally, when
there is lots of resistance perceived to be overhead, as at 34300, the DJI
must plumb for support 1,000 points lower. But first, we will should watch
to see how easily it breaks below its rising 65-dma. The weak OBV we see
in the DJI chart argues against an upside breakout. It's best now to hold
the strongest techs and short some of regional banks and other bearish
MINCPs. |
|
| |
6/22/2023
2022 PEERLESS DJI, Signals, Indicators Daily DJI Volume
10-DayUp/Down Vol Stoch-20 CCI RSI Pct of All Stocks above 65-dma
Inverted Traders Index
DJI-IPA DJI-OBV Short-Term Rates
NASDAQ S&P OEX NYSE DJ-15 DJ-20 DJI-30
Tiger Index of Big
Banks Bond
Funds Gold Stocks
Housing Stocks
Insurance-Stocks
Regional Banks
Russell-1000
Semi Conductors
Recent 2006 vers-Peerless signals http://tigersoftware.com/oldpeer/UPD90622.bmp
ETFs: DIA QQQ SPY IWM MDY
TNA Short-Term Rates Ten Year Rates PST (Short Treasuries)
DOLLAR-UUP
ALLSTOCKs
COIN (Bit
Coin ETF)
USO-CrudeOil DBO
BLDP FAS GLD HD IBB JETS JNUG KOL NAIL NUGT
NRGU OIH PALL RSX RETL SDS AGQ SLV SOXL TAN TECL TLT TMF TNA
UGA USO China: YINN CHAU
Commodities: CANE
CORN DBC JJC, NIB CORN, CUT (paper)
MOO, NRGU
SOYB WEAT UUP (Dollar) LIT
(Lithium) PALL
(Palladium)
Stocks
AA AAPL ADBE ALXN AMAT AMGN AMD AMZN ANET AXON AXP
BA BABA BAC BIDU BLDP BSX CAT CDNS CHKP CNX CPB CRM CVX CMG
DE DIS ENPH FB FSLR FTNT GILD GME GOOG GS HD IBM INTU JPM KO KR
LRCX MRK MRNA MOS MSFT NEM NFLX NKE NOC NUE NVDA PANW PG PYPL
QCOM QDEL REGN REV RE SCHW SNOW SO SQUARE TSLA TXN XOM V VRTX
WFC WMT XLE ZM ZOM
HOMEBUILDERS: NAIL BZH HOV MHO MTH PHM -
REGIONAL BANKS: EGBN FFIC GBCI HMST
Carl Icahn and
associates: IEP MS JEF
Leveraged Short ETFs:
FAZ - financials, TZA and SRTY- small caps, MZZ - mid caps, TECS -Techs,
SOXS -
semi-conductors LABD
- Biotechs
Bullish MAXCPs http://tigersoftware.com/upping/6-22-2023/Bullish.htm
Bearish MINCPs www.tigersoftware.com/Downing/6-22-2023/BEARISH.htm |
|
 |
 |
 |
 |
 |
 |
 |
 |
 |
 |
 |
 |
Table 1
| NYSE |
Latest Close |
Previous
Close |
Week Ago |
| Issues
traded |
3,033 |
3,072 |
3,077 |
| Advances |
982 |
1,508 |
2,237 |
| Declines |
1,947 |
1,418 |
726 |
| Unchanged |
104 |
146 |
114 |
| New
highs |
50 |
92 |
104 |
| New
lows |
37 |
29 |
22 |
| Adv.
volume* |
232,165,181 |
396,803,011 |
853,567,848 |
| Decl.
volume* |
598,839,741 |
514,809,217 |
158,944,375 |
| Total
volume* |
837,015,741 |
926,381,058 |
1,022,948,971 |
| Closing
Arms (TRIN)† |
1.23 |
1.54 |
0.58 |
| Block
trades* |
4,232 |
4,080 |
4,189 |
| Adv.
volume |
1,013,978,952 |
1,484,568,022 |
3,475,164,197 |
| Decl.
volume |
2,472,137,825 |
2,151,007,892 |
651,979,038 |
| Total
volume |
3,511,002,551 |
3,709,332,222 |
4,176,691,369 |
| NASDAQ |
Latest Close |
Previous
Close |
Week Ago |
| Issues
traded |
4,567 |
4,585 |
4,610 |
| Advances |
1,669 |
1,809 |
2,919 |
| Declines |
2,698 |
2,571 |
1,495 |
| Unchanged |
200 |
205 |
196 |
| New
highs |
67 |
92 |
186 |
| New
lows |
125 |
132 |
84 |
| Closing
Arms (TRIN)† |
0.65 |
0.98 |
0.87 |
| Block
trades |
29,080 |
36,368 |
41,816 |
| Adv.
volume |
2,178,861,352 |
2,143,954,664 |
3,886,230,706 |
| Decl.
volume |
2,272,571,730 |
2,977,728,526 |
1,733,779,269 |
| Total
volume |
4,499,554,254 |
5,194,643,837 |
5,667,524,541 |
|
Table 2 QUICKSILVER on ETFS - 6/22/2023 ---
     Bullish = 6   COMPQX, QQQ, SOXL (+.467), TECL (+.557), CORN, WEAT)
     Bearish = 1   YINN
ETF       CLOSE     CHANGE    PIVOT-PT  5-dma AROC   CL-PWR  CANDLE  IP21    ITRS  POWER INDEX
==================================================================================================
DIA       339.34  -.09       344.77       -15.8%     Bullish  BLUE   .159    0     -------
---------------------------------------------------------------------------------------------
COMPQX    13630.61   128.41  13782.82      1.5%     Bullish  BLUE   .15    .126      .276
---------------------------------------------------------------------------------------------
SPY       436.51   1.57      442.6        -7.6%     Bullish  BLUE   .134    .058     .192
---------------------------------------------------------------------------------------------
QQQ       366.17   4.27      370.26        3.7%     Bullish  BLUE   .122    .152     .274
---------------------------------------------------------------------------------------------
MDY       464.07  -2.45      474.23       -59.1%     Bullish  RED    .172    .01     .182
---------------------------------------------------------------------------------------------
IWM       183.33  -1.37      187.44       -69.4%     Bullish  RED    .17    .028     .198
---------------------------------------------------------------------------------------------
FAS       59.29  -1.43       63.46        -153.2%     Bullish  RED    .131    .006   .137
---------------------------------------------------------------------------------------------
RETL      6.6   .03          7.01         -74.5%     Bullish  BLUE   .195   -.12     .075
---------------------------------------------------------------------------------------------
SOXL      23.1   .32         25.95        -706.5%     Bullish  BLUE   .049    .418   .467
---------------------------------------------------------------------------------------------
TECL      51.27   1.28       54.9         -150.8%     Bullish  BLUE   .082    .475   .557
---------------------------------------------------------------------------------------------
IBB       129.85   .03       131.81       -17.2%     Bullish  BLUE   .121   -.014    .107
---------------------------------------------------------------------------------------------
GLD       177.71  -1.78      181.91       -81.1%     Bearish  RED   -.163   -.053   -.216
---------------------------------------------------------------------------------------------
DBO       13.89  -.5         14.07         56.7%     -------  RED   -.027   -.102   -.129
---------------------------------------------------------------------------------------------
OIH       270.54  -5.08      278.45       -49.4%     -------  RED    .04   -.062    -.022
---------------------------------------------------------------------------------------------
CPER     24   .03            23.97         64.9%     -------  RED   -.091   -.035   -.126
---------------------------------------------------------------------------------------------
TAN     68.93  -.71          73.2         -188%     -------  RED   -.055   -.097    -.152
---------------------------------------------------------------------------------------------
UUP       28.2   .1          28.1         -10.7%     Bearish  ----   .046    .007    .053
---------------------------------------------------------------------------------------------
CORN      26.81  -.39        25.06         510.2%     Bullish  BLUE   .399    .069   .468
---------------------------------------------------------------------------------------------
WEAT      7.33   .03         6.65          718.1%     Bullish  BLUE   .343    .063   .406
---------------------------------------------------------------------------------------------
YINN      35.5  -.31         42.78        -596.4%     -------  BLUE  -.092   -.234   -.326
|
 Table 3      RANKING OF KEY DIRECTORIES BASED PCT.OF STOCKS ABOVE 65-DMA
              6/22/23
 Bullish = 29
 Bearish = 20
---------------------------------------------------------------------------------------
Directory     Current       day-1         day-2         day-3         day-4         day-5
----------------------------------------------------------------------------------------
HOMEBLDG       .888          .944          .944          .944          .944          .944
COPPER         .857          .714          .714          .857          .857          .714
TRANSP         .842          .789          .842          .842          .842          .842
AUTO           .773          .773          .773          .811          .811          .773
JETS           .769          .846          .846          .846          .846          .769
NASD-100       .74           .68           .75           .79           .81           .75
SEMI           .734          .723          .765          .829          .819          .829
NIFTY          .727          .75           .818          .863          .84           .84
BEVERAGE       .714          .571          .571          .714          .714          .642
SOFTWARE       .714          .678          .696          .696          .678          .678
HIGHPRIC       .705          .709          .727          .757          .761          .705
HOSPITAL       .692          .692          .692          .769          .769          .692
ELECTRON       .684          .699          .729          .781          .781          .789
INDEXES        .664          .718          .718          .74           .74           .67
COMPUTER       .65           .65           .7            .7            .75           .7
GUNS           .642          .642          .642          .642          .714          .714
INFRA          .636          .666          .696          .727          .787          .757
RETAIL         .586          .608          .586          .608          .608          .608
RUS-1000       .583          .62           .634          .688          .687          .643
FIDSTKS        .573          .609          .656          .692          .692          .65
SP500          .572          .616          .622          .683          .677          .609
HACKERS        .562          .5            .625          .687          .625          .625
GREEN          .555          .555          .611          .722          .722          .666
EAT            .547          .642          .666          .714          .714          .69
DOWJONES       .533          .5            .6            .666          .633          .533
SP-100         .533          .566          .6            .677          .655          .566
REIT           .516          .639          .688          .745          .721          .729
ETFS           .509          .545          .6            .818          .8            .672
BIOTECH        .504          .507          .542          .534          .532          .509
==============================================================================================
MILITARY       .5            .692          .615          .615          .576          .538
==============================================================================================
FINANCE        .487          .65           .637          .762          .775          .737
INSURANC       .48           .48           .44           .48           .44           .36
GAMING         .473          .526          .684          .631          .631          .631
FOOD           .469          .53           .489          .551          .489          .408
DJI-13         .461          .538          .692          .692          .692          .615
COMODITY       .435          .512          .461          .538          .461          .333
INDMATER       .43           .486          .472          .569          .611          .527
BIGBANKS       .428          .714          .857          .857          .857          .857
MARIJUAN       .4            .2            .2            .3            .3            .2
CHEM           .395          .465          .488          .674          .72           .581
LOWPRICE       .389          .406          .404          .426          .401          .381
UTILITY        .358          .435          .41           .487          .461          .358
COAL           .333          .333          .333          .333          .333          .166
OILGAS         .329          .443          .422          .525          .556          .432
CHINA          .318          .318          .34           .5            .522          .431
REGBANKS       .309          .452          .571          .69           .69           .595
SOLAR          .187          .25           .312          .5            .562          .375
EDU            .166          .166          .166          .166          .166          .166
BONDFUND       .149          .229          .195          .206          .264          .183
GOLD           .111          .111          .088          .155          .155          .111
|
===================================================================================
Thursday - 5:45 AM - 6/22/2023 DJI Futures - 86 NASDAQ Futures - 41 Data
Used - 6/21/2023
| |
6/21/2023
|
|
| |
"Somewhere a new trend is just beginnng". This was on a sign in a
sommodities' brokerage in Albuquerque I visited in 1981. I still
remember it. A corollary might have been added. "Somewhere, too,
an old trend is ending". We are seeing the start of uptrends in corn,
soybeans and wheat as a new aridity and heat-wave cause havoc to farmers
in Texas and Oklahoma, and very likely farther north very soon this
Summer. Buy them.
Crude Oil (UCO) has just seen its downtrends in Closing Power and
Relative Strength be broken. So Fed Chairman Powell may be correct
that Inflation is a long way from being conquered, not that the FED can
control food and fuel prices very well, short of causing a severe
Recession. ..
His hawkishness (two more rate hikes this year, he told Congress) is not
without mounting opposition within the FOMC. The less conservative
Boston Fed wants a longer pause, as does the Atlanta FED, which has
always represented a lot more farmers who seem always to be asked to
suffer moreespecially each time the FED raises rates. If the drought spreads,
farmers will need assistance, not higher rates. The truth is there is very
little evidence in history that the NY-Washington FED-axis ever listens
to hard-pressed farmers.
Remember the corollary, stock price up-trends often come to an end
when commodity prices rise. It looks like the uptrends in certain semi-
conudtor makers like AMD and AMAT, may be ending. A Fed-induced
recession would hit them much harder than artifcial ntelligence leaders,
NVDA or MSFT, whose Closing Powers and Relative Strength Lines
are still rising. But even GOOG now seems vulnerable. Watch Table 3.
to see if the number of stocks groups with a majority of the components
above the key 65-dma falls below 50%. So, far we are safely in
bullish territory.
And watch the Retailers and Regional Banks. They are exoected to
be the weakest groups again if Powell keeps his promise of more
rate hikes.
The 34200-34300 resistance represents the top of the price channel.
33000-33200 is where the parallel support line crosses along with the
200-day ma. DIA's Closing Power is now falling, though the A/D Line
seems to be holding up well.
There are now enough weak-looking bearish MINCPs to do some
hedging with. It is not clear that the flat 21-day ma in the DJI will be
able to hold up the market. Trading range dynamics call for a 1000
point decline in the DJI. So, hedging again seems approriate.
What can we make of the strength in NAIL, the ETF for home-
builders, other than that there is a huge shortage of affordable housing
which the home-builders can surely profit from. The builders realize,
what the FED does not, namely that high interest rates just make
the housing shortage worse and drives up rents mercilessly. |
|
| |
6/21/2023
2022 PEERLESS DJI, Signals, Indicators Daily DJI Volume
10-DayUp/Down Vol Stoch-20 CCI RSI Pct of All Stocks above 65-dma
Inverted Traders Index
DJI-IPA DJI-OBV Short-Term Rates
NASDAQ S&P OEX NYSE DJ-15 DJ-20 DJI-30
Tiger Index of Big
Banks Bond
Funds Gold Stocks
Housing Stocks
Insurance-Stocks
Regional Banks
Russell-1000
Semi Conductors
Recent 2006 vers-Peerless signals http://tigersoftware.com/oldpeer/UPD90621.bmp
ETFs: DIA QQQ SPY IWM MDY
TNA Short-Term Rates Ten Year Rates PST (Short Treasuries)
DOLLAR-UUP
ALLSTOCKs
COIN (Bit
Coin ETF)
USO-CrudeOil DBO
BLDP FAS GLD HD IBB JETS JNUG KOL NAIL NUGT
NRGU OIH PALL RSX RETL SDS AGQ SLV SOXL TAN TECL TLT TMF TNA
UGA USO China: YINN CHAU
Commodities: CANE
CORN DBC JJC, NIB CORN, CUT (paper)
MOO, NRGU
SOYB WEAT UUP (Dollar) LIT
(Lithium) PALL
(Palladium)
Stocks AA AAPL ADBE ALXN AMAT AMGN AMD AMZN ANET AXON AXP
BA BABA BAC BIDU BLDP BSX CAT CDNS CHKP CNX CPB CRM CVX CMG
DE DIS ENPH FB FSLR FTNT GILD GME GOOG GS HD IBM INTU JPM KO KR
LRCX MRK MRNA MOS MSFT NEM NFLX NKE NOC NUE NVDA PANW PG PYPL
QCOM QDEL REGN REV RE SCHW SNOW SO SQUARE TSLA TXN XOM V VRTX
WFC WMT XLE ZM ZOM
HOMEBUILDERS: NAIL BZH HOV MHO MTH PHM -
REGIONAL BANKS: EGBN FFIC GBCI HMST
Carl Icahn and
associates: IEP MS JEF
Leveraged Short ETFs:
FAZ - financials, TZA and SRTY- small caps, MZZ - mid caps, TECS -Techs,
SOXS -
semi-conductors LABD
- Biotechs
Bullish MAXCPs http://tigersoftware.com/upping/6-21-2023/Bullish.htm
Bearish MINCPs www.tigersoftware.com/Downing/6-21-2023/BEARISH.htm
|
|
 |
 |
 |
 |
 |
 |
 |
 |
 |
 |
 |
 |
 |
 |
 |
Table 1 - Daily Breadth and Volume Statistics
| NYSE |
Latest Close |
Previous
Close |
Week Ago |
| Issues
traded |
3,072 |
3,077 |
3,071 |
| Advances |
1,508 |
954 |
1,172 |
| Declines |
1,418 |
2,025 |
1,793 |
| Unchanged |
146 |
98 |
106 |
| New
highs |
92 |
69 |
118 |
| New
lows |
29 |
19 |
18 |
| Adv.
volume* |
396,803,011 |
218,214,127 |
398,573,196 |
| Decl.
volume* |
514,809,217 |
798,373,636 |
584,893,424 |
| Total
volume* |
926,381,058 |
1,024,247,588 |
998,455,849 |
| Closing
Arms (TRIN)† |
1.54 |
1.42 |
0.83 |
| Block
trades* |
4,080 |
4,355 |
4,142 |
| Adv.
volume |
1,484,568,022 |
999,867,299 |
1,842,259,307 |
| Decl.
volume |
2,151,007,892 |
3,016,165,492 |
2,342,593,521 |
| Total
volume |
3,709,332,222 |
4,055,797,080 |
4,252,115,092 |
| NASDAQ |
Latest Close |
Previous
Close |
Week Ago |
| Issues
traded |
4,585 |
4,627 |
4,639 |
| Advances |
1,809 |
1,700 |
1,697 |
| Declines |
2,571 |
2,770 |
2,744 |
| Unchanged |
205 |
157 |
198 |
| New
highs |
92 |
91 |
183 |
| New
lows |
132 |
100 |
89 |
| Closing
Arms (TRIN)† |
0.98 |
0.84 |
0.50 |
| Block
trades |
36,368 |
36,443 |
43,804 |
| Adv.
volume |
2,143,954,664 |
2,190,294,253 |
3,172,003,079 |
| Decl.
volume |
2,977,728,526 |
3,013,951,501 |
2,570,916,691 |
| Total
volume |
5,194,643,837 |
5,237,719,001 |
5,772,558,683 |
|
Table 2 QUICKSILVER on ETFS - 6/21/2023 ---
     Bullish = 4   SOXL (+.430), TECL (+.448), CORN (.541), WEAT (.372)
     Bearish = 1   YINN
ETF       CLOSE     CHANGE    PIVOT-PT  5-dma AROC   CL-PWR  CANDLE  IP21    ITRS  POWER INDEX
==================================================================================================
DIA       339.43  -1.03      340.42       -46.6%     Bullish  RED    .133    0       =====
---------------------------------------------------------------------------------------------
COMPQX    13502.2  -165.09   13626.48     -26%       Bullish  RED    .12    .107     .227
---------------------------------------------------------------------------------------------
SPY       434.94  -2.24      437.18       -19.6%     Bullish  RED    .097    .052    .149
---------------------------------------------------------------------------------------------
QQQ       361.9  -5          365.9        -18.5%     Bullish  RED    .09    .128     .218
---------------------------------------------------------------------------------------------
MDY       466.52  -.54       469.62       -62.8%     Bullish  BLUE   .178    .022    .2
---------------------------------------------------------------------------------------------
IWM       184.7  -.43        185.91       -86.6%     Bullish  BLUE   .19    .041     .231
---------------------------------------------------------------------------------------------
FAS       60.72  -.99        61.19        -92.4%     Bullish  BLUE   .183    .055    .238
---------------------------------------------------------------------------------------------
RETL      6.57  -.01         6.7          -287.4%    Bullish  BLUE   .188   -.084    .104
---------------------------------------------------------------------------------------------
SOXL      22.78  -1.87       26.64        -542.8%    Bullish  RED    .05    .38      .43
---------------------------------------------------------------------------------------------
TECL      49.99  -2.39       52.86        -125.5%    Bullish  RED    .054    .394    .448
---------------------------------------------------------------------------------------------
IBB       129.82  -.56       130.3        -58.4%     Bullish  ----   .116   -.014    .102
---------------------------------------------------------------------------------------------
GLD       179.49  -.26       180.64       -29%       Bearish  BLUE  -.128   -.041   -.169
---------------------------------------------------------------------------------------------
DBO       14.39   .24        13.73         218%      -------  BLUE   .006   -.059   -.053
---------------------------------------------------------------------------------------------
OIH       275.62   3.52      273.26        4.9%      Bullish  BLUE   .065   -.033    .032
---------------------------------------------------------------------------------------------
CPER     23.97   .02         23.69         86.1%     Bullish  BLUE  -.09   -.028    -.118
---------------------------------------------------------------------------------------------
TAN     69.64  -.86          71.62        -185.2%    Bullish  RED   -.046   -.084    -.13
---------------------------------------------------------------------------------------------
UUP       28.1  -.13         28.26        -53.1%     Bearish  RED    .034   -.003     .031
---------------------------------------------------------------------------------------------
CORN      27.2   1.23        24.19         604.4%    Bullish  BLUE   .467    .074     .541
---------------------------------------------------------------------------------------------
WEAT      7.3   .34          6.35          654.1%    Bullish  BLUE   .332    .04      .372
---------------------------------------------------------------------------------------------
YINN      35.81  -.84        40.21        -360.6%    -------  ----  -.133   -.224    -.357
|
Table 3      RANKING OF KEY DIRECTORIES BASED PCT.OF STOCKS ABOVE 65-DMA
             6/21/23
 Bullish = 34
 Bearish = 14
---------------------------------------------------------------------------------------
Directory     Current       day-1         day-2         day-3         day-4         day-5
----------------------------------------------------------------------------------------
HOMEBLDG       .944          .944          .944          .944          .944          .944
JETS           .846          .846          .846          .846          .769          .769
---------------------------------------------------------------------------------------------------
TRANSP         .789          .842          .842          .842          .842          .789
AUTO           .773          .792          .811          .811          .773          .754
NIFTY          .75           .818          .863          .84           .84           .818
SEMI           .723          .765          .829          .819          .819          .829
INDEXES        .718          .718          .74           .74           .681          .713
BIGBANKS       .714          .857          .857          .857          .857          .857
COPPER         .714          .714          .857          .857          .714          .571
HIGHPRIC       .709          .727          .757          .761          .709          .744
ELECTRON       .699          .729          .781          .781          .781          .812
HOSPITAL       .692          .692          .769          .769          .692          .769
MILITARY       .692          .615          .615          .576          .538          .615
NASD-100       .68           .75           .79           .81           .74           .74
SOFTWARE       .678          .714          .696          .678          .678          .678
INFRA          .666          .696          .727          .787          .727          .757
COMPUTER       .65           .7            .7            .75           .7            .8
FINANCE        .65           .637          .762          .762          .737          .775
EAT            .642          .666          .714          .714          .69           .714
GUNS           .642          .642          .642          .714          .714          .714
REIT           .639          .68           .754          .729          .721          .729
RUS-1000       .62           .634          .688          .687          .642          .674
SP500          .616          .622          .685          .673          .616          .638
FIDSTKS        .609          .656          .692          .692          .65           .68
RETAIL         .608          .586          .608          .608          .608          .695
BEVERAGE       .571          .571          .714          .714          .642          .642
SP-100         .566          .6            .677          .655          .566          .655
GREEN          .555          .611          .722          .722          .666          .666
ETFS           .545          .6            .818          .8            .709          .581
DJI-13         .538          .692          .692          .692          .615          .769
FOOD           .53           .51           .53           .489          .408          .428
GAMING         .526          .684          .578          .684          .631          .684
COMODITY       .512          .487          .512          .461          .333          .358
BIOTECH        .504          .539          .537          .532          .512          .579
==============================================================================================
DOWJONES       .5            .6            .666          .633          .533          .666
HACKERS        .5            .625          .687          .625          .625          .625
==============================================================================================
INDMATER       .486          .472          .569          .611          .527          .583
INSURANC       .48           .44           .48           .44           .36           .52
CHEM           .465          .488          .674          .72           .581          .674
REGBANKS       .452          .571          .69           .69           .595          .666
OILGAS         .443          .422          .525          .556          .432          .494
UTILITY        .435          .41           .487          .461          .384          .41
LOWPRICE       .406          .406          .429          .404          .381          .406
COAL           .333          .333          .333          .333          .166          .166
CHINA          .318          .34           .5            .522          .431          .318
SOLAR          .25           .312          .5            .562          .375          .437
BONDFUND       .229          .183          .206          .275          .195          .206
MARIJUAN       .2            .2            .3            .3            .2            .3
EDU            .166          .166          .166          .166          .166          .333
GOLD           .111          .088          .155          .155          .133          .111
|
===================================================================================
Wednesday - 5:51 AM - 6/21/2023 DJI Futures -73 NASDAQ Fulures -49 Data Used - 6/20/2023
| |
6/20/2023
|
|
| |
The FED may control the DJI, as well as most bonds and dividend
paying stocks on the NYSE along with likes of Goldman Sachs and
many home-builders, but it clearly has little control over the leading
tech stocks like NVDA and now TSLA along with many semi-conductors.
The artificial revolution will take place whatever the FED does or
does not do. This is why the NASDAQ, QQQ, TECL and even SPY
give way very grudgingly now that the DJI seems to be retreating back
to its rising 21-dma after the recent new DJI new highs were not
confirmed by the P-I and NY A/D Line.
The breadth non-confirmations are typical of what happens when the
NYSE is fearful of FED tightening. And Fed Chairman Powell is obliged
periodically by Wall Street to suppress Labor aggressiveness and by
bond-buyers now to vigorously fight inflation. So, expect Powell's
hawkish pronouncements this week to reflect thesem forces.
This will likely have the most negative impact on regional banks and
some beaten-down retailers. Higher interest rates will trouble the
regional banks because their real balance sheets will, as a result, drop
further under water. Powell will do this, as he periodically has for the
last 24 months, because he is confident that he can quickly reverse the
tone of his hawkishness and send the same markets right back up.
This he can do as long as the Jobs numbers remain strong and the rate
of Inflation, though high, keeps coming down. And this he can do so"
long as he is not challenged for actually causing inflation in rents. And
for so long as the Presidency and the House of Representatives do
not agree on a national economic policy and the FED can make the
case for its being the effective controllers of the national economy.
All this gives us a two-tier market. We have rising technology stocks
and also again weakening dividend-paying stocks. Nothing seems on
the horizon to this or revitalize the artificial intelligence revolution. And
nothing is present now to change the FED's "stop and go" approach
to the rest of the economy. Thus, I conclude that we should confidently
play long the tech stocks among the bullish MAXCPs and short some
of the weakest bearish MINCPs that look vulnerable when higher
interest rates seem to be settling in to stifle any resurgence of consumer
buying power at present. |
|
| |
6/20/2023
2022 PEERLESS DJI, Signals, Indicators Daily DJI Volume
10-DayUp/Down Vol Stoch-20 CCI RSI Pct of All Stocks above 65-dma
Inverted Traders Index
DJI-IPA DJI-OBV Short-Term Rates
NASDAQ S&P OEX NYSE DJ-15 DJ-20 DJI-30
Tiger Index of Big
Banks Bond
Funds Gold Stocks
Housing Stocks
Insurance-Stocks
Regional Banks
Russell-1000
Semi Conductors
Recent 2006 vers-Peerless signals
http://tigersoftware.com/oldpeer/UPD90620.bmp
ETFs: DIA QQQ SPY IWM MDY
TNA Short-Term Rates Ten Year Rates PST (Short Treasuries)
DOLLAR-UUP
ALLSTOCKs
COIN (Bit
Coin ETF)
USO-CrudeOil DBO
BLDP FAS GLD HD IBB JETS JNUG KOL NAIL NUGT
NRGU OIH PALL RSX RETL SDS AGQ SLV SOXL TAN TECL TLT TMF TNA
UGA USO China: YINN CHAU
Commodities: CANE
CORN DBC JJC, NIB CORN, CUT (paper)
MOO, NRGU
SOYB WEAT UUP (Dollar) LIT
(Lithium) PALL
(Palladium)
Stocks AA AAPL ADBE ALXN AMAT AMGN AMD AMZN ANET AXON AXP
BA BABA BAC BIDU BLDP BSX CAT CDNS CHKP CNX CPB CRM CVX CMG
DE DIS ENPH FB FSLR FTNT GILD GME GOOG GS HD IBM INTU JPM KO KR
LRCX MRK MRNA MOS MSFT NEM NFLX NKE NOC NUE NVDA PANW PG PYPL
QCOM QDEL REGN REV RE SCHW SNOW SO SQUARE TSLA TXN XOM V VRTX
WFC WMT XLE ZM ZOM
HOMEBUILDERS: NAIL BZH HOV MHO MTH PHM -
REGIONAL BANKS: EGBN FFIC GBCI HMST
Carl Icahn and
associates: IEP MS JEF
Leveraged Short ETFs:
FAZ - financials, TZA and SRTY- small caps, MZZ - mid caps, TECS -Techs,
SOXS -
semi-conductors LABD
- Biotechs
Bullish MAXCPs http://tigersoftware.com/upping/6-20-2023/Bullish.htm
Bearish MINCPs
www.tigersoftware.com/Downing/6-20-2023/BEARISH.htm |
|
 |
 |
 |
 |
 |
 |
 |
 |
|
 |
 |
 |
 |
| NYSE |
Latest Close |
Previous
Close |
Week Ago |
| Issues
traded |
3,077 |
3,052 |
3,083 |
| Advances |
954 |
1,141 |
2,079 |
| Declines |
2,025 |
1,806 |
893 |
| Unchanged |
98 |
105 |
111 |
| New
highs |
69 |
145 |
137 |
| New
lows |
19 |
15 |
8 |
| Adv.
volume* |
218,214,127 |
1,323,353,893 |
731,033,928 |
| Decl.
volume* |
798,373,636 |
1,669,584,503 |
176,817,594 |
| Total
volume* |
1,024,247,588 |
3,053,607,728 |
919,191,792 |
| Closing
Arms (TRIN)† |
1.42 |
0.81 |
0.52 |
| Block
trades* |
4,355 |
6,186 |
4,302 |
| Adv.
volume |
999,867,299 |
2,949,856,705 |
3,441,750,297 |
| Decl.
volume |
3,016,165,492 |
3,761,271,758 |
772,826,988 |
| Total
volume |
4,055,797,080 |
6,848,603,118 |
4,275,402,378 |
| NASDAQ |
Latest Close |
Previous
Close |
Week Ago |
| Issues
traded |
4,627 |
4,593 |
4,666 |
| Advances |
1,700 |
1,786 |
2,921 |
| Declines |
2,770 |
2,646 |
1,554 |
| Unchanged |
157 |
161 |
191 |
| New
highs |
91 |
217 |
223 |
| New
lows |
100 |
79 |
70 |
| Closing
Arms (TRIN)† |
0.84 |
1.01 |
0.58 |
| Block
trades |
36,443 |
49,628 |
40,237 |
| Adv.
volume |
2,190,294,253 |
3,206,097,136 |
4,170,029,987 |
| Decl.
volume |
3,013,951,501 |
4,801,959,236 |
1,297,305,246 |
| Total
volume |
5,237,719,001 |
8,076,539,028 |
5,522,107,823 |
|
Table 2 QUICKSILVER on ETFS - 6/20/2023 ---
     Bullish = 5   COMPQX, FAS, SOXL (+.651), TECL (+.546), CORN
     Bearish = 1   YINN
ETF       CLOSE     CHANGE    PIVOT-PT  5-dma AROC   CL-PWR  CANDLE  IP21    ITRS    POWER INDEX
==================================================================================================
DIA       340.46  -2.49      342.62       -10.4%     Bullish  RED    .125    0        .125
---------------------------------------------------------------------------------------------
COMPQX    13667.29  -22.28   13573.32      75.4%     Bullish  BLUE   .138    .114     .252
---------------------------------------------------------------------------------------------
SPY       437.18  -2.28      436.66        38.6%     Bullish  RED    .104    .052     .156
---------------------------------------------------------------------------------------------
QQQ       366.9  -1.03       363.26        87.7%     Bullish  BLUE   .107    .137     .244
---------------------------------------------------------------------------------------------
MDY       467.06  -3.48      472.43       -3.9%      Bullish  RED    .157    .029     .186
---------------------------------------------------------------------------------------------
IWM       185.13  -.81       187.93       -18%       Bullish  RED    .167    .048     .215
---------------------------------------------------------------------------------------------
FAS       61.71  -1.33       61.87         72.5%     Bullish  RED    .182    .074     .256
---------------------------------------------------------------------------------------------
RETL      6.58  -.1          6.96          14.7%     -------  ----   .127   -.039     .088
---------------------------------------------------------------------------------------------
SOXL      24.65  -.59        25.56         9.8%      Bullish  RED    .094    .557     .651
---------------------------------------------------------------------------------------------
TECL      52.38  -1.12       51.32         187.3%    Bullish  RED    .094    .452     .546
---------------------------------------------------------------------------------------------
IBB       130.38  -.92       131.35        19.5%     Bullish  RED    .122   -.022     .1
---------------------------------------------------------------------------------------------
GLD       179.75  -1.88      180.54       -58.7%     Bearish  RED   -.123   -.053    -.176
---------------------------------------------------------------------------------------------
DBO       14.15  -.09        13.78         281.8%    -------  ----  -.032   -.085    -.117
---------------------------------------------------------------------------------------------
OIH       272.1  -4.21       275.35        47.9%     Bullish  RED    .044   -.039     .005
---------------------------------------------------------------------------------------------
CPER     23.95   .08         23.56         173.4%    -------  ----  -.091   -.042    -.133
---------------------------------------------------------------------------------------------
TAN     70.5  -2.29          72.31        -71.9%     Bullish  RED   -.042   -.06     -.102
---------------------------------------------------------------------------------------------
UUP       28.23   .08        28.4         -46%       Bearish  ----   .055    .001     .056
---------------------------------------------------------------------------------------------
CORN      25.97   .02        24.17         388.9%    Bullish  ----   .346    .033     .379
---------------------------------------------------------------------------------------------
WEAT      6.96   .1          6.43          412.7%    Bullish  BLUE   .222   -.009     .213
---------------------------------------------------------------------------------------------
YINN      36.65  -5.35       38.7         -89.5%     Bearish  RED   -.113   -.222    -.335
|
 Table 3      RANKING OF KEY DIRECTORIES BASED PCT.OF STOCKS ABOVE 65-DMA
              6/20/23
 Bullish = 36
 Bearish = 14
---------------------------------------------------------------------------------------
Directory     Current       day-1         day-2         day-3         day-4         day-5
----------------------------------------------------------------------------------------
HOMEBLDG       .944          .944          .944          .944          .944          .944
               -----
BIGBANKS       .857          .857          .857          .857          .857          .857
JETS           .846          .846          .846          .769          .769          .769
TRANSP         .842          .842          .842          .842          .789          .789
NIFTY          .818          .863          .84           .84           .818          .75
--------------------------------------------------------------------------------------------------
AUTO           .792          .83           .811          .773          .754          .698
SEMI           .765          .829          .819          .819          .808          .808
               -----
NASD-100       .75           .79           .81           .74           .75           .71
ELECTRON       .729          .781          .781          .781          .796          .781
HIGHPRIC       .727          .757          .761          .709          .744          .714
INDEXES        .718          .74           .74           .681          .713          .675
COPPER         .714          .857          .857          .714          .571          .428
SOFTWARE       .714          .714          .678          .678          .678          .625
COMPUTER       .7            .7            .75           .7            .8            .75
INFRA          .696          .727          .787          .727          .757          .636
DJI-13         .692          .692          .692          .615          .769          .692
HOSPITAL       .692          .769          .769          .692          .769          .692
GAMING         .684          .578          .631          .684          .684          .684
REIT           .68           .745          .737          .729          .721          .737
EAT            .666          .714          .714          .69           .714          .761
FIDSTKS        .656          .692          .692          .65           .686          .633
GUNS           .642          .642          .714          .714          .714          .714
FINANCE        .637          .762          .762          .725          .775          .725
RUS-1000       .634          .688          .687          .642          .676          .625
HACKERS        .625          .687          .625          .625          .687          .5
SP500          .622          .685          .675          .611          .644          .597
MILITARY       .615          .615          .576          .538          .615          .576
GREEN          .611          .722          .722          .666          .666          .666
DOWJONES       .6            .666          .633          .533          .666          .566
               -----
ETFS           .6            .818          .8            .709          .6            .527
SP-100         .6            .677          .655          .566          .655          .6
RETAIL         .586          .608          .608          .608          .673          .63
BEVERAGE       .571          .714          .714          .642          .642          .642
REGBANKS       .571          .69           .69           .595          .666          .571
BIOTECH        .537          .534          .534          .512          .574          .542
FOOD           .51           .551          .469          .408          .428          .387
====================================================================================================
CHEM           .488          .674          .72           .581          .674          .581
COMODITY       .487          .538          .435          .333          .358          .333
INDMATER       .472          .569          .611          .527          .583          .458
INSURANC       .44           .48           .44           .36           .52           .4
OILGAS         .422          .525          .556          .432          .494          .432
UTILITY        .41           .487          .461          .384          .41           .41
LOWPRICE       .406          .432          .406          .383          .409          .409
CHINA          .34           .5            .522          .431          .318          .272
COAL           .333          .333          .333          .166          .166          .166
SOLAR          .312          .5            .562          .375          .437          .375
MARIJUAN       .2            .3            .3            .2            .3            .2
BONDFUND       .183          .195          .275          .206          .218          .275
EDU            .166          .166          .166          .166          .333          .166
GOLD           .088          .155          .155          .133          .111          .155
|
===============================================================================
Tuesday - 6:10 AM - 6/20/2023 DJI Futures -110 NASDAQ Fulures -23 Data Used - 6/16/2023
| |
6/16/2023
|
|
| |
The DJI has
reached its keenest resistance level, 34300, and is now pulling
back. This is a good
thing for the bulls because if it went any higher, we would
most likely get a Peerless
Sell S9v, thereby warning us that the Summer Rally
must first be punctuated by a
decline to the lower band. Since the key stocks
leading the rally, MSFT,
NVDA, AAPL and GOOD all had reversal days down,
as seen by their red
candle-sticks, a dhallow decline is now in the making. For
a deeper decline to be
predicted, we will need to have the Closing Power and
Relative strength up-trends
be broken. The "Big Four" remain the market leaders
and their red candle-sticks
by themselves warn of only a shallow decline.
The DJI's three highest
priced components look ready to sell off. The
most heavily weighted
component UNH is in a clear downtrend while GS
and HD show reliable
automatic red Sells. But again, the DJI is not the story.
This is a market that is
favoring tech stocks, especially AI stocks and
semi-conductors. When
we look back at how electric car technology and
TSLA seized investors'
immaginations not look ago, I think we can expect
still higher prices from
leaders NVDA and MSFT. The future of
semi-conductors and
artificial intelligence seems truly bullish to me. Even
if the DJI drops to its lower
band in a Summer storm, these two will still
find lots of buyers.
Stay long the NASDAQ, QQQ, TECL and the
strongest tech stocks.
With so many ETFs showing rising Closing Powers
in Table 2 and so many
sectors showing the majority of their components
well above their 65-dma in
Table 3, any decline is apt to be shallow. There
just not enough bearish
MINCPs to make the market look dangerous. |
|
| |
6/16/2023
2022 PEERLESS DJI, Signals, Indicators Daily DJI Volume
10-DayUp/Down Vol Stoch-20 CCI RSI Pct of All Stocks above 65-dma
Inverted Traders Index
DJI-IPA DJI-OBV Short-Term Rates
NASDAQ S&P OEX NYSE DJ-15 DJ-20 DJI-30
Tiger Index of Big
Banks Bond
Funds Gold Stocks
Housing Stocks
Insurance-Stocks
Regional Banks
Russell-1000
Semi Conductors
Recent 2006 vers-Peerless signals
http://tigersoftware.com/oldpeer/UPD90616.bmp
ETFs: DIA QQQ SPY IWM MDY
TNA Short-Term Rates Ten Year Rates PST (Short Treasuries)
DOLLAR-UUP
ALLSTOCKs
COIN (Bit
Coin ETF)
USO-CrudeOil DBO
BLDP FAS GLD HD IBB JETS JNUG KOL NAIL NUGT
NRGU OIH PALL RSX RETL SDS AGQ SLV SOXL TAN TECL TLT TMF TNA
UGA USO China: YINN CHAU
Commodities: CANE
CORN DBC JJC, NIB CORN, CUT (paper)
MOO, NRGU
SOYB WEAT UUP (Dollar) LIT
(Lithium) PALL
(Palladium)
Stocks AA AAPL ADBE ALXN AMAT AMGN AMD AMZN ANET AXON AXP
BA BABA BAC BIDU BLDP BSX CAT CDNS CHKP CNX CPB CRM CVX CMG
DE DIS ENPH FB FSLR FTNT GILD GME GOOG GS HD IBM INTU JPM KO KR
LRCX MRK MRNA MOS MSFT NEM NFLX NKE NOC NUE NVDA PANW PG PYPL
QCOM QDEL REGN REV RE SCHW SNOW SO SQUARE TSLA TXN XOM V VRTX
WFC WMT XLE ZM ZOM
HOMEBUILDERS: NAIL BZH HOV MHO MTH PHM -
REGIONAL BANKS: EGBN FFIC GBCI HMST
Carl Icahn and
associates: IEP MS JEF
Leveraged Short ETFs:
FAZ - financials, TZA and SRTY- small caps, MZZ - mid caps, TECS -Techs,
SOXS -
semi-conductors LABD
- Biotechs
Bullish MAXCPs http://tigersoftware.com/upping/6-16-2023/Bullish.htm
Bearish MINCPs www.tigersoftware.com/Downing/6-16-2023/BEARISH.htm
|
|
 |
 |
 |
 |
 |
 |
 |
 |
 |
 |
 |
 |
 |
| NYSE |
Latest Close |
Previous
Close |
Week Ago |
| Issues
traded |
3,052 |
3,077 |
3,044 |
| Advances |
1,141 |
2,237 |
1,116 |
| Declines |
1,806 |
726 |
1,815 |
| Unchanged |
105 |
114 |
113 |
| New
highs |
145 |
104 |
70 |
| New
lows |
15 |
22 |
17 |
| Adv.
volume* |
1,323,353,893 |
853,567,848 |
348,808,366 |
| Decl.
volume* |
1,669,584,503 |
158,944,375 |
466,896,207 |
| Total
volume* |
3,053,607,728 |
1,022,948,971 |
826,011,344 |
| Closing
Arms (TRIN)† |
0.81 |
0.58 |
0.79 |
| Block
trades* |
6,186 |
4,189 |
4,009 |
| Adv.
volume |
2,949,856,705 |
3,475,164,197 |
1,630,320,737 |
| Decl.
volume |
3,761,271,758 |
651,979,038 |
2,105,397,141 |
| Total
volume |
6,848,603,118 |
4,176,691,369 |
3,786,513,709 |
| NASDAQ |
Latest Close |
Previous
Close |
Week Ago |
| Issues
traded |
4,593 |
4,610 |
4,583 |
| Advances |
1,786 |
2,919 |
1,558 |
| Declines |
2,646 |
1,495 |
2,842 |
| Unchanged |
161 |
196 |
183 |
| New
highs |
217 |
186 |
117 |
| New
lows |
79 |
84 |
73 |
| Closing
Arms (TRIN)† |
1.01 |
0.87 |
0.61 |
| Block
trades |
49,628 |
41,816 |
24,790 |
| Adv.
volume |
3,206,097,136 |
3,886,230,706 |
2,066,621,290 |
| Decl.
volume |
4,801,959,236 |
1,733,779,269 |
2,313,325,053 |
| Total
volume |
8,076,539,028 |
5,667,524,541 |
4,412,710,624 |
|
Table 2 QUICKSILVER on ETFS - 6/16/2023 ---
     Bullish = 6   COMPQX, SPY,  FAS, QQQ, SOXL (+.708), TECL (+.644)
     Bearish = 0
ETF       CLOSE     CHANGE    PIVOT-PT  5-dma AROC   CL-PWR  CANDLE  IP21    ITRS    POWER INDEX
==================================================================================================
DIA       342.95  -1.82      341.17        53.9%     Bullish  RED    .158    0     .   ---
---------------------------------------------------------------------------------------------
COMPQX    13689.57  -93.25   13461.92      158.9%    Bullish  RED    .155    .117     .272
---------------------------------------------------------------------------------------------
SPY       439.46  -3.14      433.8         109.6%    Bullish  RED    .135    .054     .189
---------------------------------------------------------------------------------------------
QQQ       367.93  -2.33      360.49        185%      Bullish  RED    .139    .14      .279
---------------------------------------------------------------------------------------------
MDY       470.54  -3.69      467.43        60.6%     Bullish  RED    .182    .028     .21
---------------------------------------------------------------------------------------------
IWM       185.94  -1.5       185.8         24.4%     Bullish  RED    .173    .047     .22
---------------------------------------------------------------------------------------------
FAS       63.04  -.42        60.81         170.3%    Bullish  RED    .199    .099     .298
---------------------------------------------------------------------------------------------
RETL      6.68  -.33         6.56          283.3%    -------  RED    .146   -.039     .107
---------------------------------------------------------------------------------------------
SOXL      25.24  -.71        24.6          567.3%    Bullish  RED    .147    .561     .708
---------------------------------------------------------------------------------------------
TECL      53.5  -1.4         50.41         598.6%    Bullish  RED    .145    .499     .644
---------------------------------------------------------------------------------------------
IBB       131.3  -.51        129.87        94.3%     Bullish  RED    .149   -.01      .139
---------------------------------------------------------------------------------------------
GLD       181.63  -.28       181.88       -11.3%     Bearish  RED   -.129   -.057    -.186
---------------------------------------------------------------------------------------------
DBO       14.24   .17        13.37         119.8%    -------  BLUE  -.076   -.087    -.163
---------------------------------------------------------------------------------------------
OIH       276.31  -2.14      269.47       -1.6%      Bullish  RED    .057   -.047     .01
---------------------------------------------------------------------------------------------
CPER     23.87  -.1          23.13         125.4%    -------  RED   -.096   -.046    -.142
---------------------------------------------------------------------------------------------
TAN     72.79  -.41          71.54         167.1%    Bullish  RED   -.004   -.036    -.04
---------------------------------------------------------------------------------------------
UUP       28.15   .05        28.49        -58.2%     Bearish  ----   .097   -.009     .088
---------------------------------------------------------------------------------------------
CORN      25.95   .89        24.05         533.8%    Bullish  BLUE   .335    .017     .352
---------------------------------------------------------------------------------------------
WEAT      6.86   .21         6.42          372.3%    Bullish  BLUE   .172   -.039     .133
---------------------------------------------------------------------------------------------
YINN      42  -.78           37.37         552.8%    -------  RED   -.073   -.079    -.152
|
 Table 3     RANKING OF KEY DIRECTORIES BASED PCT.OF STOCKS ABOVE 65-DMA
              6/16/23
 Bullish = 40
 Bearish = 8
---------------------------------------------------------------------------------------
Directory     Current       day-1         day-2         day-3         day-4         day-5
----------------------------------------------------------------------------------------
HOMEBLDG       .944          .944          .944          .944          .944          .944
               ------
NIFTY          .863          .84           .84           .818          .75           .681
BIGBANKS       .857          .857          .857          .857          .857          .857
COPPER         .857          .857          .714          .571          .428          .428
JETS           .846          .846          .769          .769          .769          .769
TRANSP         .842          .842          .842          .789          .789          .789
AUTO           .83           .83           .773          .754          .698          .66
SEMI           .829          .819          .819          .808          .797          .744
               -----
ETFS           .818          .8            .709          .6            .545          .527
----------------------------------------------------------------------------------------------------
NASD-100       .79           .81           .74           .75           .71           .67
ELECTRON       .781          .781          .781          .796          .774          .721
HOSPITAL       .769          .769          .692          .769          .769          .769
FINANCE        .762          .762          .725          .762          .737          .725
HIGHPRIC       .757          .761          .709          .744          .722          .688
REIT           .745          .729          .737          .729          .729          .713
INDEXES        .74           .74           .681          .713          .681          .697
INFRA          .727          .787          .727          .757          .636          .575
GREEN          .722          .722          .666          .666          .666          .611
BEVERAGE       .714          .714          .642          .642          .642          .642
EAT            .714          .714          .69           .714          .761          .642
SOFTWARE       .714          .696          .678          .678          .625          .66
COMPUTER       .7            .75           .7            .8            .75           .75
DJI-13         .692          .692          .615          .769          .692          .769
FIDSTKS        .692          .692          .65           .686          .633          .621
REGBANKS       .69           .69           .595          .666          .547          .619
RUS-1000       .688          .687          .642          .676          .625          .611
HACKERS        .687          .625          .625          .687          .5            .562
SP500          .685          .675          .613          .64           .599          .591
SP-100         .677          .655          .566          .655          .6            .555
CHEM           .674          .72           .581          .674          .581          .558
DOWJONES       .666          .633          .533          .666          .566          .6
               -----
GUNS           .642          .714          .714          .714          .714          .714
MILITARY       .615          .576          .538          .615          .576          .653
RETAIL         .608          .608          .608          .673          .63           .565
GAMING         .578          .631          .631          .736          .684          .631
INDMATER       .569          .611          .527          .583          .458          .458
FOOD           .551          .489          .387          .428          .408          .408
COMODITY       .538          .461          .307          .358          .358          .358
BIOTECH        .532          .532          .514          .574          .544          .507
OILGAS         .525          .556          .432          .494          .422          .494
===============================================================================================
CHINA          .5            .522          .431          .318          .25           .25
SOLAR          .5            .562          .375          .437          .375          .25
===============================================================================================
UTILITY        .487          .461          .384          .41           .435          .512
INSURANC       .48           .44           .36           .52           .36           .56
LOWPRICE       .432          .409          .386          .412          .404          .392
COAL           .333          .333          .166          .166          .166          .333
MARIJUAN       .3            .3            .2            .3            .2            .2
BONDFUND       .195          .264          .206          .229          .287          .241
EDU            .166          .166          .166          .333          .166          .333
GOLD           .155          .155          .133          .111          .155          .177
|
===================================================================================
Friday - 6:03 AM - 6/16/2023 DJI Futures +43 NASDAQ Fulures +58 Data Used - 6/15/2023
| |
6/15/2023
|
|
| |
More and more the DJI looks like it wanted
to complete a very bullish in inverted
head and shoulders pattern. Thursday's advance
certainly makes that a likely
scenario. When the DJI does something very
unexpected, we need to take note.
Thursday's rally not only shrugged of Powell's threat of
two more rate hikes, it also
did not heed the breadth divergences of the new high.
What's up? A rally is typical of trading before a a
three day weekend. Monday
commemorates the Emancipation millions of American slaves.
But can the DJI rally
make a breakout to a new yearly high. Only three of
the thirty Dow Jones Industrial's
stocks are making new highs, AAPL, MSFT and WMT?
Moreover, its most heavily
weighted component, UNH, is in an ugly downtrend.
A breakout by the DJI would certainly boost public
bullishness for the market as a
whole. But we we are not trading it, at this point.
Instead, we are short some of the
bearish MINCPs, which could not even rally Thursday and we
are long a numer of
the most powerful tech stocks and ETFs. MSFT, AAPL
and NVDA have been bullish-
looking for weeks. Their rising Closing Power and
Relative Strength have been our
technical markers to buy and hold them.
Semi-conductors and Housing stocks are
the leading sectors. So, they should just be held,
too.
Look at the bearish MINCPs. See how the shorts on the
DJI, the SP-500 and
the QQQ have all the hallmarks of weakness we look for in
stocks to sell short:
very heavy red distribution and falling Closing Power and
Relative Strength
Lines. There is one difference among them. The
shorts on the ETFs for QQQ and
SPY are making new lows.
Let me point out the chart of SNOW, which is shown below.
The 5-day Stochastic
has until recently traded it amazingly well. For the
last year, its red optimized system's
signals have gained about 1000%. In theory $10,000
would have become $100,000
even allowing for commissions and slippage. But now
it is on a Sell and the stock
is soaring. This action demonstrates how an optimized
system starts to fail when
the stock changes its trading pattern. In this case,
the tight trading range is breaking
down. It's behavior also shows that it is often
better to trade such a stock mainly
in a way that is consistent with its internal strength
readings, which here have become
quite bullish.
Have a great Day of Emancipation. I'll be busy
working on the VBNet Software
so that we can screen all stocks in one pass, not
just 500 or 1000. That should
be done in a week or two. I look forward to be
able to share the results here.
, |
|
| |
6/15/2023
2022 PEERLESS DJI, Signals, Indicators Daily DJI Volume
10-DayUp/Down Vol Stoch-20 CCI RSI Pct of All Stocks above 65-dma
Inverted Traders Index
DJI-IPA DJI-OBV Short-Term Rates
NASDAQ S&P OEX NYSE DJ-15 DJ-20 DJI-30
Tiger Index of Big
Banks Bond
Funds Gold Stocks
Housing Stocks
Insurance-Stocks
Regional Banks
Russell-1000
Semi Conductors
Recent 2006 vers-Peerless signals http://tigersoftware.com/oldpeer/UPD90615.bmp
ETFs: DIA QQQ SPY IWM MDY
TNA Short-Term Rates Ten Year Rates PST (Short Treasuries)
DOLLAR-UUP
ALLSTOCKs
COIN (Bit
Coin ETF)
USO-CrudeOil DBO
BLDP FAS GLD HD IBB JETS JNUG KOL NAIL NUGT
NRGU OIH PALL RSX RETL SDS AGQ SLV SOXL TAN TECL TLT TMF TNA
UGA USO China: YINN CHAU
Commodities: CANE
CORN DBC JJC, NIB CORN, CUT (paper)
MOO, NRGU
SOYB WEAT UUP (Dollar) LIT
(Lithium) PALL
(Palladium)
Stocks AA AAPL ADBE ALXN AMAT AMGN AMD AMZN ANET AXON AXP
BA BABA BAC BIDU BLDP BSX CAT CDNS CHKP CNX CPB CRM CVX CMG
DE DIS ENPH FB FSLR FTNT GILD GME GOOG GS HD IBM INTU JPM KO KR
LRCX MRK MRNA MOS MSFT NEM NFLX NKE NOC NUE NVDA PANW PG PYPL
QCOM QDEL REGN REV RE SCHW SNOW SO SQUARE TSLA TXN XOM V VRTX
WFC WMT XLE ZM ZOM
HOMEBUILDERS: NAIL BZH HOV MHO MTH PHM -
REGIONAL BANKS: EGBN FFIC GBCI HMST
Carl Icahn and
associates: IEP MS JEF
Leveraged Short ETFs:
FAZ - financials, TZA and SRTY- small caps, MZZ - mid caps, TECS -Techs,
SOXS -
semi-conductors LABD
- Biotechs
Bullish MAXCPs http://tigersoftware.com/upping/6-15-2023/Bullish.htm
Bearish MINCPs www.tigersoftware.com/Downing/6-15-2023/BEARISH.htm
|
|
 |
 |
 |
 |
 |
 |
 |
 |
 |
 |
 |
 |
 |
 |
 |
|
 |
Table 1 - Daily Breadth and Volume Statistics
| NYSE |
Latest Close |
Previous
Close |
Week Ago |
| Issues
traded |
3,077 |
3,071 |
3,069 |
| Advances |
2,237 |
1,172 |
1,427 |
| Declines |
726 |
1,793 |
1,515 |
| Unchanged |
114 |
106 |
127 |
| New
highs |
104 |
118 |
83 |
| New
lows |
22 |
18 |
18 |
| Adv.
volume* |
853,567,848 |
398,573,196 |
394,066,986 |
| Decl.
volume* |
158,944,375 |
584,893,424 |
423,178,340 |
| Total
volume* |
1,022,948,971 |
998,455,849 |
829,817,650 |
| Closing
Arms (TRIN)† |
0.58 |
0.83 |
0.87 |
| Block
trades* |
4,189 |
4,142 |
3,920 |
| Adv.
volume |
3,475,164,197 |
1,842,259,307 |
1,945,318,320 |
| Decl.
volume |
651,979,038 |
2,342,593,521 |
1,806,735,146 |
| Total
volume |
4,176,691,369 |
4,252,115,092 |
3,826,745,232 |
| NASDAQ |
Latest Close |
Previous
Close |
Week Ago |
| Issues
traded |
4,610 |
4,639 |
4,613 |
| Advances |
2,919 |
1,697 |
2,228 |
| Declines |
1,495 |
2,744 |
2,177 |
| Unchanged |
196 |
198 |
208 |
| New
highs |
186 |
183 |
86 |
| New
lows |
84 |
89 |
62 |
| Closing
Arms (TRIN)† |
0.87 |
0.50 |
0.65 |
| Block
trades |
41,816 |
43,804 |
26,536 |
| Adv.
volume |
3,886,230,706 |
3,172,003,079 |
2,594,731,515 |
| Decl.
volume |
1,733,779,269 |
2,570,916,691 |
1,644,149,076 |
| Total
volume |
5,667,524,541 |
5,772,558,683 |
4,280,169,676 |
|
Table 3       RANKING OF KEY DIRECTORIES BASED PCT.OF STOCKS ABOVE 65-DMA
               6/15/23
Bullish = 40
Bearish = 10
---------------------------------------------------------------------------------------
Directory     Current       day-1         day-2         day-3         day-4         day-5
----------------------------------------------------------------------------------------
HOMEBLDG       .944          .944          .944          .944          .944          .944
               =====
BIGBANKS       .857          .857          .857          .857          .857          .857
COPPER         .857          .714          .571          .428          .428          .428
JETS           .846          .769          .769          .769          .769          .769
TRANSP         .842          .842          .789          .789          .789          .736
NIFTY          .84           .84           .818          .75           .681          .659
AUTO           .83           .792          .754          .698          .66           .698
SEMI           .819          .819          .808          .797          .734          .776
               =====
NASD-100       .81           .74           .75           .71           .67           .67
               =====
ETFS           .8            .709          .6            .545          .545          .563
INFRA          .787          .727          .757          .636          .575          .636
ELECTRON       .781          .781          .796          .774          .714          .729
HOSPITAL       .769          .692          .769          .769          .769          .769
FINANCE        .762          .725          .762          .725          .712          .775
HIGHPRIC       .761          .709          .744          .722          .688          .718
COMPUTER       .75           .7            .8            .75           .75           .75
INDEXES        .74           .681          .713          .681          .691          .697
REIT           .729          .729          .737          .737          .704          .745
GREEN          .722          .666          .666          .666          .611          .611
CHEM           .72           .581          .674          .581          .558          .651
BEVERAGE       .714          .642          .642          .642          .642          .642
EAT            .714          .69           .714          .761          .642          .738
GUNS           .714          .714          .714          .714          .714          .714
SOFTWARE       .696          .696          .678          .625          .66           .678
DJI-13         .692          .615          .769          .692          .769          .692
FIDSTKS        .692          .65           .686          .633          .627          .585
REGBANKS       .69           .595          .666          .547          .595          .69
RUS-1000       .687          .642          .676          .625          .611          .627
SP500          .675          .613          .642          .595          .597          .589
SP-100         .655          .566          .655          .6            .555          .544
DOWJONES       .633          .533          .666          .566          .6            .566
               ----
GAMING         .631          .631          .684          .736          .631          .578
HACKERS        .625          .625          .687          .5            .562          .5
INDMATER       .611          .527          .583          .458          .458          .513
RETAIL         .608          .608          .673          .63           .565          .586
MILITARY       .576          .538          .615          .576          .653          .653
SOLAR          .562          .375          .437          .375          .25           .312
OILGAS         .556          .432          .494          .422          .494          .546
BIOTECH        .528          .511          .576          .543          .511          .546
CHINA          .522          .431          .318          .25           .25           .295
=================================================================================================
FOOD           .489          .408          .408          .408          .428          .428
COMODITY       .461          .333          .333          .358          .384          .384
UTILITY        .461          .384          .41           .435          .538          .564
INSURANC       .44           .36           .52           .36           .56           .56
LOWPRICE       .409          .389          .415          .406          .383          .406
COAL           .333          .166          .166          .166          .333          .166
MARIJUAN       .3            .2            .3            .2            .2            .2
BONDFUND       .264          .195          .229          .298          .252          .229
EDU            .166          .166          .333          .166          .333          .333
GOLD           .155          .133          .111          .155          .2            .2
|
Table 2
QUICKSILVER on ETFS - 6/15/2023 --- Bullish = 8 COMPQX, SPY, IWM, MDY, FAS, QQQ, SOXL (+.726), TECL (+.698)
Bearish = 0
ETF       CLOSE     CHANGE    PIVOT-PT  5-dma AROC   CL-PWR  CANDLE  IP21    ITRS    POWER INDEX
==================================================================================================
DIA       344.77   4.35      339.27        87.5%     Bullish  BLUE   .259    0         ---
---------------------------------------------------------------------------------------------
COMPQX    13782.82   156.34  13259.14      202.6%    Bullish  BLUE   .254    .104     .358  +++
---------------------------------------------------------------------------------------------
SPY       442.6   5.42       429.9         155.4%    Bullish  BLUE   .225    .051     .276  +++
---------------------------------------------------------------------------------------------
QQQ       370.26   4.36      354.5         238%      Bullish  BLUE   .228    .128     .356  +++
---------------------------------------------------------------------------------------------
MDY       474.23   4.61      464.85        69.1%     Bullish  BLUE   .256    .02      .276  +++
---------------------------------------------------------------------------------------------
IWM       187.44   1.53      185.03        24.2%     Bullish  BLUE   .25    .037      .287  +++
---------------------------------------------------------------------------------------------
FAS       63.46   2.27       60.94         208.5%    Bullish  BLUE   .264    .096     .36   +++
---------------------------------------------------------------------------------------------
RETL      7.01   .31         6.3           294.2%    Bullish  BLUE   .197   -.066     .131
---------------------------------------------------------------------------------------------
SOXL      25.95  -.69        22.4          755.3%    Bullish  BLUE   .213    .513     .726  +++
---------------------------------------------------------------------------------------------
TECL      54.9   2.04        47.35         825.5%    Bullish  BLUE   .222    .476     .698  +++
---------------------------------------------------------------------------------------------
IBB       131.81   1.51      128.84        107%      Bullish  BLUE   .25   -.01       .24
---------------------------------------------------------------------------------------------
GLD       181.91   1.27      182.04       -17.1%     Bearish  BLUE  -.062   -.065    -.127
---------------------------------------------------------------------------------------------
DBO       14.07   .34        13.91         25.4%     -------  BLUE  -.069   -.106    -.175
---------------------------------------------------------------------------------------------
OIH       278.45   5.19      276.4         4.7%      Bullish  BLUE   .105   -.052     .053
---------------------------------------------------------------------------------------------
CPER     23.97   .28         23.28         143.2%    Bullish  BLUE  -.028   -.046    -.074
---------------------------------------------------------------------------------------------
TAN     73.2   1.58          70.39         166.8%    Bullish  BLUE   .05   -.067     -.017
---------------------------------------------------------------------------------------------
UUP       28.1  -.16         28.48        -51%       Bearish  RED    .075   -.016     .059
---------------------------------------------------------------------------------------------
CORN      25.06   .87        23.37         320.6%    Bullish  BLUE   .229   -.028     .201
---------------------------------------------------------------------------------------------
WEAT      6.65   .3          6.38          227%      -------  BLUE   .145   -.089     .056
---------------------------------------------------------------------------------------------
YINN      42.78   2.57       37.65         672.1%     -------  BLUE  -.021   -.106    -.127
|
===============================================================================
Thursday - 6:09 AM - 6/15/2023 DJI Futures - 38 NASDAQ Fulures -71 Data Used - 6/14/2023
| |
6/14/2023
|
|
| |
It was Powell in a "hawk's" costume that spoke today as the FED announced
a temporary pause
in their rate hikes. He might have said about future rate hikes,
"We must
weight and see the numbers and then decide." Instead he proudly backed
two more rate
hikes. He cherry picked the CPI numbers. Instead of remarking on
the
month-to-month change, which was miniscule except for rents, he focused on
the 6-month rate
of change in the CPI. In disregarding the clearly downward trend
of the CPI
numbers to 4% on a yearly basis, he is also disregarding how his higher
rates will cause
both more homelessness and fewer homes to be built. Rents
will go up faster
because of the FED! What made him do this? Perhaps, it was the
DJI being at the
top of its trading range. Now he can turn dovish when the DJI drops
to the lower
band. Certainly, this will help the Professionals who rig the DJI's
swings to
Powell's mood change and to their heightened trading advantage. In the
mean time, the
DJI will again go nowehere fast and more and more traders will
probably partake
in the best game in town, buying the semi and AI leaders.
Technically, we
see non-confirmations of the 40-day DJI closing high from
the Peerless
P-Indicator, Accumulation Index and Volume Indicator. We should
accord these Sell
S8* status, meaning the these are significant trading range breadth
non-
confirmations at the 2.4% upper band. A new Peerless (XP version) showing
these will be
released on Sunday.
The DJI's decline
looks rigged. Just one stock in the DJI 30 caused the DJI
to fall almost
200 points. This was our old friend UNH, the same very high
priced DJI that
helped prop up the DJI in the decline and send it back
upwards.
I doubt if a DJI
manipulated decline will fool the Professionals who are
trading the BIG
FOUR tech stocks, MSFT, NVDA, APPL and GOOG.
In any case,
their Closing Powers and Relative Strength Quotient (RSQ)
lines are rising
very nicely. NVDA jumped almost 20 points today.
The DJI decline
if it unfolds on schedule in here will next see breaks in the
uptrends of the
NYSE A/D Line and Peerless PI. That seems most likely.
Accordingly,
traders should hedge with some short sales among the weakest
Oils, Regional
Banks as well as AA and DISH.
|
|
| |
6/14/2023
2022 PEERLESS DJI, Signals, Indicators Daily DJI Volume
10-DayUp/Down Vol Stoch-20 CCI RSI Pct of All Stocks above 65-dma
Inverted Traders Index
DJI-IPA DJI-OBV Short-Term Rates
NASDAQ S&P OEX NYSE DJ-15 DJ-20 DJI-30
Tiger Index of Big
Banks Bond
Funds Gold Stocks
Housing Stocks
Insurance-Stocks
Regional Banks
Russell-1000
Semi Conductors
Recent 2006 vers-Peerless signals http://tigersoftware.com/oldpeer/UPD90614.bmp
ETFs: DIA QQQ SPY IWM MDY
TNA Short-Term Rates Ten Year Rates PST (Short Treasuries)
DOLLAR-UUP
ALLSTOCKs
COIN (Bit
Coin ETF)
USO-CrudeOil DBO
BLDP FAS GLD HD IBB JETS JNUG KOL NAIL NUGT
NRGU OIH PALL RSX RETL SDS AGQ SLV SOXL TAN TECL TLT TMF TNA
UGA USO China: YINN CHAU
Commodities: CANE
CORN DBC JJC, NIB CORN, CUT (paper)
MOO, NRGU
SOYB WEAT UUP (Dollar) LIT
(Lithium) PALL
(Palladium)
Stocks AA AAPL ADBE ALXN AMAT AMGN AMD AMZN ANET AXON AXP
BA BABA BAC BIDU BLDP BSX CAT CDNS CHKP CNX CPB CRM CVX CMG
DE DIS ENPH FB FSLR FTNT GILD GME GOOG GS HD IBM INTU JPM KO KR
LRCX MRK MRNA MOS MSFT NEM NFLX NKE NOC NUE NVDA PANW PG PYPL
QCOM QDEL REGN REV RE SCHW SNOW SO SQUARE TSLA TXN XOM V VRTX
WFC WMT XLE ZM ZOM
HOMEBUILDERS: NAIL BZH HOV MHO MTH PHM -
REGIONAL BANKS: EGBN FFIC GBCI HMST
Carl Icahn and
associates: IEP MS JEF
Leveraged Short ETFs:
FAZ - financials, TZA and SRTY- small caps, MZZ - mid caps, TECS -Techs,
SOXS -
semi-conductors LABD
- Biotechs
Bullish MAXCPs http://tigersoftware.com/upping/6-14-2023/Bullish.htm
Bearish MINCPs www.tigersoftware.com/Downing/6-14-2023/BEARISH.htm
|
|
 |
 |
 |
 |
 |
 |
 |
 |
 |
 |
 |
 |
|
Table 1 - Daily Breadth and Volume Statistics
| NYSE |
Latest Close |
Previous
Close |
Week Ago |
| Issues
traded |
3,071 |
3,083 |
3,075 |
| Advances |
1,172 |
2,079 |
1,927 |
| Declines |
1,793 |
893 |
1,039 |
| Unchanged |
106 |
111 |
109 |
| New
highs |
118 |
137 |
155 |
| New
lows |
18 |
8 |
10 |
| Adv.
volume* |
398,573,196 |
731,033,928 |
713,211,404 |
| Decl.
volume* |
584,893,424 |
176,817,594 |
293,404,337 |
| Total
volume* |
998,455,849 |
919,191,792 |
1,015,082,060 |
| Closing
Arms (TRIN)† |
0.83 |
0.52 |
0.95 |
| Block
trades* |
4,142 |
4,302 |
4,703 |
| Adv.
volume |
1,842,259,307 |
3,441,750,297 |
2,966,537,700 |
| Decl.
volume |
2,342,593,521 |
772,826,988 |
1,520,442,564 |
| Total
volume |
4,252,115,092 |
4,275,402,378 |
4,537,808,923 |
| NASDAQ |
Latest Close |
Previous
Close |
Week Ago |
| Issues
traded |
4,639 |
4,666 |
4,606 |
| Advances |
1,697 |
2,921 |
2,479 |
| Declines |
2,744 |
1,554 |
1,954 |
| Unchanged |
198 |
191 |
173 |
| New
highs |
183 |
223 |
152 |
| New
lows |
89 |
70 |
58 |
| Closing
Arms (TRIN)† |
0.50 |
0.58 |
1.12 |
| Block
trades |
43,804 |
40,237 |
30,560 |
| Adv.
volume |
3,172,003,079 |
4,170,029,987 |
2,762,767,550 |
| Decl.
volume |
2,570,916,691 |
1,297,305,246 |
2,446,454,874 |
| Total
volume |
5,772,558,683 |
5,522,107,823 |
5,270,606,756 |
|
Table 2 QUICKSILVER on ETFS - 6/14/2023 ---
     Bullish = 4   COMPQX, QQQ, SOXL (+.673), TECL (+.594)
     Bearish = 0   YINN
ETF       CLOSE     CHANGE    PIVOT-PT  5-dma AROC   CL-PWR  CANDLE  IP21    ITRS    POWER INDEX
==================================================================================================
DIA       340.42  -2.2       338.81        47.8%     Bullish  RED    .188    ----      -----
---------------------------------------------------------------------------------------------
COMPQX    13626.48   53.16   13238.52      195.7%     Bullish  BLUE   .197    .104     .301 +++
---------------------------------------------------------------------------------------------
SPY       437.18   .52       429.13        123.3%     Bullish  BLUE   .157    .05      .207
------------------------------------------------------------------------------------- --------
QQQ       365.9   2.64       353.15        239.9%     Bullish  BLUE   .19    .129      .319 +++
---------------------------------------------------------------------------------------------
MDY       469.62  -2.81      467.76       -1.8%       Bullish  RED    .177    .012     .189
---------------------------------------------------------------------------------------------
IWM       185.91  -2.02      186.54       -35.7%      Bullish  RED    .178    .028     .206
---------------------------------------------------------------------------------------------
FAS       61.19  -.68        60.91         9%         Bullish  RED    .201    .041     .242
---------------------------------------------------------------------------------------------
RETL      6.7  -.26          6.62          243.8%     -------  RED    .143   -.125     .018
---------------------------------------------------------------------------------------------
SOXL      26.64   1.08       22.28         1073.1%    Bullish  BLUE   .191    .482     .673 +++
---------------------------------------------------------------------------------------------
TECL      52.86   1.54       46.69         788.3%     Bullish  BLUE   .178    .416     .594 +++
---------------------------------------------------------------------------------------------
IBB       130.3  -1.05       129.03        56.7%      Bullish  RED    .161   -.009     .152
---------------------------------------------------------------------------------------------
GLD       180.64   .1        182.53        13.5%      Bearish  RED   -.145   -.035      -.18
---------------------------------------------------------------------------------------------
DBO       13.73  -.05        14           -194.7%     -------  RED   -.119   -.11      -.229
------------------------------------------------------------------------------------ --------
OIH       273.26  -2.09      278.19       -107.9%     Bullish  RED    .06   -.082      -.022
---------------------------------------------------------------------------------------------
CPER     23.69   .13         23.3          120.3%     -------  ----  -.111   -.057     -.168
---------------------------------------------------------------------------------------------
TAN     71.62  -.69          70.82         42.1%      -------  RED   -.05   -.076      -.126
---------------------------------------------------------------------------------------------
UUP       28.26  -.14        28.39        -63.2%      Bearish  ----   .143    .005     .148
---------------------------------------------------------------------------------------------
CORN      24.19   .02        23.53         194.3%     Bullish  BLUE   .124   -.056     .068
---------------------------------------------------------------------------------------------
WEAT      6.35  -.08         6.36          86.4%      Bearish  ----   .065   -.123     -.058
---------------------------------------------------------------------------------------------
YINN      40.21   1.51       37.63         491%       Bullish  BLUE  -.066   -.155     -.221
|
Table 3      RANKING OF KEY DIRECTORIES BASED PCT.OF STOCKS ABOVE 65-DMA
             6/14/23
Bullish = 37
Bearish = 13
---------------------------------------------------------------------------------------
Directory     Current       day-1         day-2         day-3         day-4         day-5
----------------------------------------------------------------------------------------
HOMEBLDG       .944          .944          .944          .944          .944          .944
               ===
BIGBANKS       .857          .857          .857          .857          .857          .857
TRANSP         .842          .789          .789          .789          .736          .894
NIFTY          .84           .818          .75           .681          .659          .613
SEMI           .819          .808          .797          .734          .765          .744
               ====
AUTO           .792          .773          .698          .66           .698          .66
ELECTRON       .781          .796          .774          .714          .721          .699
JETS           .769          .769          .769          .769          .769          .769
NASD-100       .74           .75           .71           .67           .66           .62
REIT           .729          .729          .745          .713          .737          .77
INFRA          .727          .757          .636          .575          .636          .575
FINANCE        .725          .762          .725          .7            .762          .775
COPPER         .714          .571          .428          .428          .428          .142
GUNS           .714          .714          .714          .714          .714          .714
ETFS           .709          .6            .545          .545          .563          .454
HIGHPRIC       .709          .744          .722          .688          .722          .692
COMPUTER       .7            .8            .75           .75           .75           .75
SOFTWARE       .696          .696          .625          .66           .66           .66
HOSPITAL       .692          .769          .769          .769          .769          .846
EAT            .69           .714          .761          .642          .738          .714
INDEXES        .681          .713          .681          .691          .697          .654
GREEN          .666          .666          .666          .611          .611          .666
FIDSTKS        .65           .686          .633          .627          .585          .568
BEVERAGE       .642          .642          .642          .642          .642          .642
RUS-1000       .642          .676          .625          .611          .625          .637
GAMING         .631          .684          .684          .684          .578          .631
HACKERS        .625          .687          .5            .562          .5            .562
DJI-13         .615          .769          .692          .769          .692          .538
SP500          .613          .642          .597          .593          .591          .583
RETAIL         .608          .673          .63           .565          .586          .543
REGBANKS       .595          .666          .547          .595          .666          .69
CHEM           .581          .674          .581          .558          .651          .744
SP-100         .566          .655          .6            .555          .544          .511
MILITARY       .538          .615          .576          .653          .653          .615
DOWJONES       .533          .666          .566          .6            .566          .533
INDMATER       .527          .583          .458          .458          .513          .513
BIOTECH        .509          .574          .547          .512          .547          .542
=================================================================================================
OILGAS         .432          .494          .422          .494          .536          .515
CHINA          .431          .318          .25           .25           .295          .272
FOOD           .408          .428          .387          .428          .428          .346
LOWPRICE       .389          .418          .409          .386          .401          .389
UTILITY        .384          .41           .435          .538          .564          .487
SOLAR          .375          .437          .375          .25           .312          .375
INSURANC       .36           .52           .36           .56           .56           .6
COMODITY       .333          .358          .333          .384          .384          .282
MARIJUAN       .2            .3            .2            .2            .2            .2
BONDFUND       .195          .218          .298          .264          .275          .137
COAL           .166          .166          .166          .333          .166          .333
EDU            .166          .333          .166          .333          .333          .333
GOLD           .133          .111          .155          .2            .222          .133
|
===============================================================================
Wednesday - 6:05 AM - 6/14/2023 DJI Futures -78 NASDAQ Fulures
+10 Data Used - 6/13/2023
| |
6/13/2023
|
|
| |
The FED
will decide today whether to keep rates at 5%-5 1.4% or move them
up to 5 1.2%. If
they raise rates, then I would think that the DJI will pull back
again from 34000, but
probably not very far or for very long. The DJI has reached
a point 2.4% over the
21-day ma with the V-Indicator just barely positive and
with the A/D Line, P-I,
IP21 and V-I all below what it was on its previous 35-day
high. Presently,
we have no Peerless Sell, but the non-confirmations and
overhead resistance do
invite a pullback, even without the FED having a say
in the matter.
But the DJI is not so
important anymore. Tech stocks are already taking off like
it is a new bull
market and the FED has already started to ease off the brakes to
the economy. Tech
leadersip like this is exactly what we would expect to see
if a new bull market
had just started or was about to begin.
So, perhaps, the FED
will pause this month, the CPI will drop to a 3% annual rate
next month or so and
there will not be another rate hike. Then next month the
DJI could complete its
inverted head shoulders pattern and atack 35,000.
Look ahead. With
the Jobs numbers so good, the economy will also stay strong,
but without dangerous
inflation, except in rents. And even here, there are limits
to high how rents can
go. Renters have to be able to afford to pay them.
The Housing stocks are
going up strongly now because of the lack of affordable
housing shortage.
The demand for housing remains very high and now long-term
mortgage rates may
start declining. Such is only part of the bulls' case now..
Crude oil's downtrend
will not quickly turn up. See the trend in UCO below. This
is the most important
part of the inflation equation.
While the stage is set
for the FED to ease up. It probably won't drop rates
anytime soon. The hawks
on the FOMC do not want to give up their battle with
inflation. They
want much higher unemployment. Labor must be periodcially
tamed in this way,
they think but do not say. So, don't look for rate reductions.
There is no need now to
pump up the market.
As long as the Closing
Power and Relative Strength lines for QQQ, TECL
and SOXL are still
rising, hold tightly them and our bullish MAXCPs. In this
environment, the tech
stocks, especially semi-conductors, are a natural
focus for
performance-mined investors. Nearly everything but food and clothes
now uses
semi-conductors. And I suspect soon they will sell shoes that will
tell you how far you
have walked each day. |
|
| |
6/13/2023
2022 PEERLESS DJI, Signals, Indicators Daily DJI Volume
10-DayUp/Down Vol Stoch-20 CCI RSI Pct of All Stocks above 65-dma
Inverted Traders Index
DJI-IPA DJI-OBV Short-Term Rates
NASDAQ S&P OEX NYSE DJ-15 DJ-20 DJI-30
Tiger Index of Big
Banks Bond
Funds Gold Stocks
Housing Stocks
Insurance-Stocks
Regional Banks
Russell-1000
Semi Conductors
Recent 2006 vers-Peerless signals http://tigersoftware.com/oldpeer/UPD90613.bmp
ETFs: DIA QQQ SPY IWM MDY
TNA Short-Term Rates Ten Year Rates PST (Short Treasuries)
DOLLAR-UUP
ALLSTOCKs
COIN (Bit
Coin ETF)
USO-CrudeOil DBO
BLDP FAS GLD HD IBB JETS JNUG KOL NAIL NUGT
NRGU OIH PALL RSX RETL SDS AGQ SLV SOXL TAN TECL TLT TMF TNA
UGA USO China: YINN CHAU
Commodities: CANE
CORN DBC JJC, NIB CORN, CUT (paper)
MOO, NRGU
SOYB WEAT UUP (Dollar) LIT
(Lithium) PALL
(Palladium)
Stocks AA AAPL ADBE ALXN AMAT AMGN AMD AMZN ANET AXON AXP
BA BABA BAC BIDU BLDP BSX CAT CDNS CHKP CNX CPB CRM CVX CMG
DE DIS ENPH FB FSLR FTNT GILD GME GOOG GS HD IBM INTU JPM KO KR
LRCX MRK MRNA MOS MSFT NEM NFLX NKE NOC NUE NVDA PANW PG PYPL
QCOM QDEL REGN REV RE SCHW SNOW SO SQUARE TSLA TXN XOM V VRTX
WFC WMT XLE ZM ZOM
HOMEBUILDERS:
NAIL BZH HOV MHO MTH PHM -
REGIONAL BANKS: EGBN
FFIC GBCI HMST
Carl Icahn and associates: IEP
MS JEF
Leveraged Short ETFs:
FAZ - financials, TZA and SRTY- small caps, MZZ - mid caps, TECS -Techs,
SOXS -
semi-conductors LABD
- Biotechs
Bullish MAXCPs
http://tigersoftware.com/upping/6-13-2023/Bullish.htm
Bearish MINCPs www.tigersoftware.com/Downing/6-13-2023/BEARISH.htm
|
|
 |
 |
 |
 |
 |
 |
 |
 |
 |
 |
 |
Table 1 - Daily Breadth and Volume Statistics
| NYSE |
Latest Close |
Previous
Close |
Week Ago |
| Issues
traded |
3,083 |
3,082 |
3,079 |
| Advances |
2,079 |
1,530 |
2,348 |
| Declines |
893 |
1,437 |
632 |
| Unchanged |
111 |
115 |
99 |
| New
highs |
137 |
98 |
110 |
| New
lows |
8 |
12 |
18 |
| Adv.
volume* |
731,033,928 |
501,641,482 |
678,613,428 |
| Decl.
volume* |
176,817,594 |
359,892,123 |
162,651,743 |
| Total
volume* |
919,191,792 |
871,125,521 |
850,457,799 |
| Closing
Arms (TRIN)† |
0.52 |
0.69 |
0.92 |
| Block
trades* |
4,302 |
4,118 |
4,240 |
| Adv.
volume |
3,441,750,297 |
2,375,034,424 |
3,162,811,456 |
| Decl.
volume |
772,826,988 |
1,529,505,165 |
787,454,683 |
| Total
volume |
4,275,402,378 |
3,945,673,041 |
3,996,564,066 |
| NASDAQ |
Latest Close |
Previous
Close |
Week Ago |
| Issues
traded |
4,666 |
4,659 |
4,602 |
| Advances |
2,921 |
2,622 |
3,172 |
| Declines |
1,554 |
1,834 |
1,256 |
| Unchanged |
191 |
203 |
174 |
| New
highs |
223 |
160 |
131 |
| New
lows |
70 |
83 |
83 |
| Closing
Arms (TRIN)† |
0.58 |
0.56 |
0.93 |
| Block
trades |
40,237 |
27,012 |
30,189 |
| Adv.
volume |
4,170,029,987 |
3,348,756,152 |
3,477,092,202 |
| Decl.
volume |
1,297,305,246 |
1,320,662,055 |
1,284,739,135 |
| Total
volume |
5,522,107,823 |
4,722,682,813 |
4,810,914,072 |
|
Table 2 QUICKSILVER on ETFS - 6/13/2023 ---
     Bullish = 4   COMPQX, FAS, SOXL (+.548), TECL (+.491)
     Bearish = 1   YINN
ETF       CLOSE     CHANGE    PIVOT-PT  5-dma AROC   CL-PWR  CANDLE  IP21    ITRS    POWER INDEX
==================================================================================================
DIA       342.62   1.45      337.17        95.3%      Bullish  BLUE   .204    0        .204
---------------------------------------------------------------------------------------------
COMPQX    13573.32   111.4   13104.9       111.9%     Bullish  BLUE   .192    .081     .273  +++
---------------------------------------------------------------------------------------------
SPY       436.66   2.86      426.55        100.5%     Bullish  BLUE   .166    .037     .203
---------------------------------------------------------------------------------------------
QQQ       363.26   2.77      348.82        118.8%     Bullish  RED    .165    .102     .267  +++
---------------------------------------------------------------------------------------------
MDY       472.43   5         469.79        102.7%     Bullish  BLUE   .212    .001     .213
---------------------------------------------------------------------------------------------
IWM       187.93   2.13      187.24        97.4%      Bullish  BLUE   .215    .023     .238
---------------------------------------------------------------------------------------------
FAS       61.87   1.06       61.08         117.5%     Bullish  BLUE   .259    .043     .302  +++
---------------------------------------------------------------------------------------------
RETL      6.96   .4          6.38          737.1%     -------  BLUE   .179   -.087     .092
---------------------------------------------------------------------------------------------
SOXL      25.56   .96        21.64         850%       Bullish  RED    .181    .367     .548  +++
---------------------------------------------------------------------------------------------
TECL      51.32   .91        45.26         413.3%     Bullish  RED    .141    .35      .491  +++
---------------------------------------------------------------------------------------------
IBB       131.35   1.48      128.83        87.9%      Bullish  BLUE   .212   -.013     .199
---------------------------------------------------------------------------------------------
GLD       180.54  -1.34      180.15       -49.5%      Bearish  RED   -.147   -.045    -.192
---------------------------------------------------------------------------------------------
DBO       13.78   .41        14.27        -104.1%     -------  ----  -.085   -.084    -.169
---------------------------------------------------------------------------------------------
OIH       275.35   5.88      279.21        78%        Bullish  BLUE   .065   -.036     .029
---------------------------------------------------------------------------------------------
CPER     23.56   .43         23.13         84%        -------  ----  -.105   -.085    -.19
---------------------------------------------------------------------------------------------
TAN     72.31   .77          71.02         75.3%      -------  BLUE  -.031   -.099    -.13
---------------------------------------------------------------------------------------------
UUP       28.4  -.09         28.62        -36.8%      Bearish  ----   .241   -.011     .23
---------------------------------------------------------------------------------------------
CORN      24.17   .12        23.27         93.3%      -------  RED    .131   -.072     .059
---------------------------------------------------------------------------------------------
WEAT      6.43   .01         6.24          47.2%      Bearish  ----   .119   -.119     0
---------------------------------------------------------------------------------------------
YINN      38.7   1.33        36.52         129.7%     -------  ----  -.037   -.215    -.252  ---
|
 Table 3    RANKING OF KEY DIRECTORIES BASED PCT.OF STOCKS ABOVE 65-DMA
              6/13/23
 Bullish = 38
 Bearish = 12
---------------------------------------------------------------------------------------
Directory     Current       day-1         day-2         day-3         day-4         day-5
----------------------------------------------------------------------------------------
HOMEBLDG       .944          .944          .944          .944          .944          .944
BIGBANKS       .857          .857          .857          .857          .857          .571
NIFTY          .818          .75           .681          .659          .59           .681
SEMI           .808          .797          .734          .765          .734          .723
COMPUTER       .8            .75           .75           .75           .75           .75
ELECTRON       .796          .774          .714          .721          .691          .661
TRANSP         .789          .789          .789          .736          .894          .684
AUTO           .773          .716          .66           .698          .66           .641
DJI-13         .769          .692          .769          .692          .538          .538
HOSPITAL       .769          .769          .769          .769          .846          .692
JETS           .769          .769          .769          .769          .769          .769
FINANCE        .762          .725          .7            .75           .75           .687
INFRA          .757          .636          .575          .636          .575          .515
NASD-100       .75           .71           .67           .66           .63           .68
HIGHPRIC       .744          .722          .688          .722          .688          .692
REIT           .729          .737          .721          .745          .754          .631
EAT            .714          .761          .642          .738          .714          .714
GUNS           .714          .714          .714          .714          .714          .714
INDEXES        .713          .681          .691          .697          .654          .621
SOFTWARE       .696          .642          .66           .66           .642          .714
HACKERS        .687          .5            .562          .5            .5            .562
FIDSTKS        .686          .633          .627          .585          .579          .532
GAMING         .684          .684          .631          .631          .631          .631
RUS-1000       .676          .625          .611          .625          .635          .577
CHEM           .674          .581          .558          .651          .744          .558
RETAIL         .673          .63           .565          .586          .543          .5
DOWJONES       .666          .566          .6            .566          .533          .533
               ++++++
GREEN          .666          .666          .611          .611          .666          .666
REGBANKS       .666          .547          .595          .666          .666          .476
SP-100         .655          .6            .555          .544          .522          .455
BEVERAGE       .642          .642          .642          .642          .642          .642
SP500          .642          .597          .595          .587          .589          .525
MILITARY       .615          .576          .653          .653          .615          .461
ETFS           .6            .545          .545          .563          .472          .581
INDMATER       .583          .458          .458          .513          .541          .472
BIOTECH        .572          .544          .514          .547          .544          .557
COPPER         .571          .428          .428          .428          .142          .142
INSURANC       .52           .36           .56           .56           .6            .52
==============================================================================================
OILGAS         .494          .422          .494          .536          .505          .371
SOLAR          .437          .375          .25           .312          .375          .375
FOOD           .428          .408          .408          .428          .346          .367
LOWPRICE       .418          .412          .389          .404          .386          .383
UTILITY        .41           .435          .538          .564          .512          .282
COMODITY       .358          .358          .358          .384          .282          .307
EDU            .333          .166          .333          .333          .333          .166
CHINA          .318          .25           .25           .295          .227          .272
MARIJUAN       .3            .2            .2            .2            .2            .2
BONDFUND       .218          .287          .264          .287          .16           .149
COAL           .166          .166          .333          .166          .333          .166
GOLD           .111          .155          .2            .222          .177          .222
|
====================================================================================
Tuesday - 6:05 AM - 6/13/2023 DJI Futures +59 NASDAQ Fulures +102 Data Used - 612/2023
| |
6/12/2023
|
|
| |
The DJI has almost reached
34250 where there should be keen resistance. The DJI
closed 2.1% over its 21-day ma with the V-I
negative and the A/D Line both lagging.
Breadth was just barely positive. A Sell
S9-v is a possibility if the V-Indicator stays
negative but that may have more bearing on the
blue chips.
.This is mostly a rally led by and in tech stocks and
semi-conductors. As long the
Closing Power and Relative Strength lines for
the NASDAQ, QQQ, TECL and
SOXL keep rising, they should just be held and
allowed to run, along with the
Big Four (MSFT, NVDA, GOOG and AAPL) and all
our Bullish MAXCPs.
Remember our advocacy for buying the first out
of the gate in a new bull market.
The concentrated buying in these stocks is
occurring because the artificial
intelligence revolution could be
spectular. Keep in mind what I said about
how the tech stocks of the day in early 1967
ran wildly up when the
Fed reversed its tight money policy at a time
of inflation. Now the new Inflation
numbers are getting more and more under
control. Today's month-to-month rate of
inflation is miniscule and the yearly CPI
change is down to 4.0%. The FED will
probably delay any more rate hikes. But
even if it does not, the tech stocks are
getting a big influx of more speculative and
growth-minded investing. See how
utilities, beverages and bonds are lagging.
That should continue.
The rate of inflation is going to continue to
drop most likely. Look at the falling
Crude Oil trend. Play the bullish MAXCPs
and TECL long. The short side
offers few opportunities.
Visual Net Progress Report
I intend to add the B8* to Peerless. It
occurs because the DJI makes a 35
day low which is widely unconfirmed by the A/D
Line or P/I. More details
will be added when I can show its past trading
results. I could not quickly
test this change, Visual Basic ran out of free
memory space. That will not be
a problem with Visual Net. I'm working on
the automatic signals now. Visual
Net does not allow the use of line numbers, so
much of the complex code
has to be re-written without them. This takes
time because of the new testing
required. But the end result will be a
ranking of the best way to trade any
of the nearly 3000 stocks over $4 that are
reasonably active. I expect to be able
to allow you to use TC-2000 directly for that.
|
|
| |
6/12/2023
2022 PEERLESS DJI, Signals, Indicators Daily DJI Volume
10-DayUp/Down Vol Stoch-20 CCI RSI Pct of All Stocks above 65-dma
Inverted Traders Index
DJI-IPA DJI-OBV Short-Term Rates
NASDAQ S&P OEX NYSE DJ-15 DJ-20 DJI-30
Tiger Index of Big
Banks Bond
Funds Gold Stocks
Housing Stocks
Insurance-Stocks
Regional Banks
Russell-1000
Semi Conductors
Recent 2006 vers-Peerless signals http://tigersoftware.com/oldpeer/UPD90612.bmp
ETFs: DIA QQQ SPY IWM MDY
TNA Short-Term Rates Ten Year Rates PST (Short Treasuries)
DOLLAR-UUP
ALLSTOCKs
COIN (Bit
Coin ETF)
USO-CrudeOil DBO
BLDP FAS GLD HD IBB JETS JNUG KOL NAIL NUGT
NRGU OIH PALL RSX RETL SDS AGQ SLV SOXL TAN TECL TLT TMF TNA
UGA USO China: YINN CHAU
Commodities: CANE
CORN DBC JJC, NIB CORN, CUT (paper)
MOO, NRGU
SOYB WEAT UUP (Dollar) LIT
(Lithium) PALL
(Palladium)
Stocks AA AAPL ADBE ALXN AMAT AMGN AMD AMZN ANET AXON AXP
BA BABA BAC BIDU BLDP BSX CAT CDNS CHKP CNX CPB CRM CVX CMG
DE DIS ENPH FB FSLR FTNT GILD GME GOOG GS HD IBM INTU JPM KO KR
LRCX MRK MRNA MOS MSFT NEM NFLX NKE NOC NUE NVDA PANW PG PYPL
QCOM QDEL REGN REV RE SCHW SNOW SO SQUARE TSLA TXN XOM V VRTX
WFC WMT XLE ZM ZOM
HOMEBUILDERS:
NAIL BZH HOV MHO MTH PHM -
REGIONAL BANKS: EGBN
FFIC GBCI HMST
Carl Icahn and associates: IEP
MS JEF
Leveraged Short ETFs:
FAZ - financials, TZA and SRTY- small caps, MZZ - mid caps, TECS -Techs,
SOXS -
semi-conductors LABD
- Biotechs
Bullish MAXCPs http://tigersoftware.com/upping/6-12-2023/Bullish.htm
Bearish MINCPs www.tigersoftware.com/Downing/6-12-2023/BEARISH.htm
|
|
 |
 |
 |
 |
 |
 |
 |
 |
 |
Table 2 QUICKSILVER on ETFS - 6/12/2023 ---
     Bullish = 4   FAS, SOXL, TECL (+.512),  UUP
     Bearish = 2   GLD   YINN
ETF       CLOSE     CHANGE    PIVOT-PT  5-dma AROC   CL-PWR  CANDLE  IP21    ITRS    POWER INDEX
==================================================================================================
DIA       341.17   1.9       336.17        74.7%     Bullish  BLUE   .214    0        ------
---------------------------------------------------------------------------------------------
COMPQX    13461.92   202.78  13276.42      87.9%     Bullish  BLUE   .154    .082     .236
---------------------------------------------------------------------------------------------
SPY       433.8   3.9        428.03        78.2%     Bullish  BLUE   .145    .036     .181
---------------------------------------------------------------------------------------------
QQQ       360.49   5.99      354.84        79.1%     Bullish  BLUE   .137    .103     .24
---------------------------------------------------------------------------------------------
MDY       467.43   2.58      462.85        151.3%    Bullish  BLUE   .197   -.001     .196
---------------------------------------------------------------------------------------------
IWM       185.8   .77        184.31        168.5%    Bullish  BLUE   .204    .022     .226
---------------------------------------------------------------------------------------------
FAS       60.81  -.13        60.44         218%      Bullish  RED    .235    .05      .285 +++
---------------------------------------------------------------------------------------------
RETL      6.56   .26         6.02          843.1%    -------  BLUE   .141   -.081     .06
---------------------------------------------------------------------------------------------
SOXL      24.6   2.2         21.73         832.4%    Bullish  BLUE   .175    .332     .507 +++
---------------------------------------------------------------------------------------------
TECL      50.41   3.06       47.4          315%      Bullish  BLUE   .137    .375     .512 +++
---------------------------------------------------------------------------------------------
IBB       129.87   1.03      129.08        15.5%     Bullish  BLUE   .183   -.018     .165
---------------------------------------------------------------------------------------------
GLD       181.88  -.16       182.34       -7.1%      Bearish  BLUE  -.153   -.051    -.204
---------------------------------------------------------------------------------------------
DBO       13.37  -.54        14.07        -262.9%    Bearish  RED   -.097   -.108    -.205
---------------------------------------------------------------------------------------------
OIH       269.47  -6.93      271.06        31.3%     Bullish  RED    .092   -.056     .036
---------------------------------------------------------------------------------------------
CPER     23.13  -.15         23.17        -4.3%      -------  ----  -.093   -.118    -.211
---------------------------------------------------------------------------------------------
TAN     71.54   1.15         71.24        -19%       Bullish  BLUE  -.061   -.094    -.155
---------------------------------------------------------------------------------------------
UUP       28.49   .01        28.61        -5.3%      -------  ----   .303   -.013     .29 +++
---------------------------------------------------------------------------------------------
CORN      24.05   .68        23.73         85.1%     -------  BLUE   .184   -.083     .101
---------------------------------------------------------------------------------------------
WEAT      6.42   .04         6.37          63.1%     -------  ----   .153   -.128     .025
---------------------------------------------------------------------------------------------
YINN      37.37  -.28        37.73         258.1%    -------  RED   -.045   -.282    -.327 ---
|
| NYSE |
Latest Close |
Previous
Close |
Week Ago |
| Issues
traded |
3,082 |
3,044 |
3,074 |
| Advances |
1,530 |
1,116 |
1,041 |
| Declines |
1,437 |
1,815 |
1,913 |
| Unchanged |
115 |
113 |
120 |
| New
highs |
98 |
70 |
50 |
| New
lows |
12 |
17 |
26 |
| Adv.
volume* |
501,641,482 |
348,808,366 |
319,517,438 |
| Decl.
volume* |
359,892,123 |
466,896,207 |
515,531,918 |
| Total
volume* |
871,125,521 |
826,011,344 |
840,263,405 |
| Closing
Arms (TRIN)† |
0.69 |
0.79 |
0.72 |
| Block
trades* |
4,118 |
4,009 |
4,043 |
| Adv.
volume |
2,375,034,424 |
1,630,320,737 |
1,634,377,081 |
| Decl.
volume |
1,529,505,165 |
2,105,397,141 |
2,151,818,641 |
| Total
volume |
3,945,673,041 |
3,786,513,709 |
3,813,295,269 |
| NASDAQ |
Latest Close |
Previous
Close |
Week Ago |
| Issues
traded |
4,659 |
4,583 |
4,620 |
| Advances |
2,622 |
1,558 |
1,768 |
| Declines |
1,834 |
2,842 |
2,656 |
| Unchanged |
203 |
183 |
196 |
| New
highs |
160 |
117 |
124 |
| New
lows |
83 |
73 |
71 |
| Closing
Arms (TRIN)† |
0.56 |
0.61 |
0.71 |
| Block
trades |
27,012 |
24,790 |
24,247 |
| Adv.
volume |
3,348,756,152 |
2,066,621,290 |
2,074,556,575 |
| Decl.
volume |
1,320,662,055 |
2,313,325,053 |
2,205,548,666 |
| Total
volume |
4,722,682,813 |
4,412,710,624 |
4,344,285,639 |
|
| |
Table 3       RANKING OF KEY DIRECTORIES BASED PCT.OF STOCKS ABOVE 65-DMA
              6/12/23
Bullish = 34
Bearish = 15
---------------------------------------------------------------------------------------
Directory     Current       day-1         day-2         day-3         day-4         day-5
----------------------------------------------------------------------------------------
HOMEBLDG       .944          .944          .944          .944          .944          .888
               =====
BIGBANKS       .857          .857          .857          .857          .571          .285
SEMI           .797          .734          .765          .734          .712          .68
               =====
TRANSP         .789          .789          .736          .894          .684          .526
ELECTRON       .774          .714          .721          .691          .654          .609
HOSPITAL       .769          .769          .769          .846          .692          .615
JETS           .769          .769          .769          .769          .769          .615
EAT            .761          .642          .738          .714          .714          .642
COMPUTER       .75           .75           .75           .75           .75           .65
NIFTY          .75           .681          .659          .59           .681          .613
REIT           .737          .713          .754          .762          .598          .459
FINANCE        .725          .7            .75           .737          .675          .525
HIGHPRIC       .722          .688          .722          .688          .688          .675
AUTO           .716          .679          .698          .66           .622          .547
GUNS           .714          .714          .714          .714          .714          .5
NASD-100       .71           .67           .66           .63           .68           .64
DJI-13         .692          .769          .692          .538          .538          .538
GAMING         .684          .631          .578          .684          .631          .526
INDEXES        .681          .691          .697          .654          .621          .572
GREEN          .666          .611          .611          .666          .666          .611
BEVERAGE       .642          .642          .642          .642          .642          .714
SOFTWARE       .642          .678          .66           .642          .714          .66
INFRA          .636          .575          .636          .575          .484          .454
FIDSTKS        .633          .627          .585          .579          .532          .485
RETAIL         .63           .565          .586          .543          .5            .413
RUS-1000       .625          .611          .625          .635          .574          .487
SP-100         .6            .555          .544          .522          .455          .4
SP500          .597          .595          .589          .585          .527          .466
CHEM           .581          .558          .651          .744          .534          .441
MILITARY       .576          .653          .653          .615          .461          .384
DOWJONES       .566          .6            .566          .533          .533          .533
               =====
REGBANKS       .547          .595          .666          .666          .452          .238
ETFS           .545          .545          .563          .472          .6            .49
BIOTECH        .542          .512          .549          .544          .552          .49
=============================================================================================
HACKERS        .5            .562          .5            .5            .562          .5
=============================================================================================
INDMATER       .458          .458          .513          .541          .458          .333
UTILITY        .435          .538          .564          .512          .282          .256
COPPER         .428          .428          .428          .142          .142          0
OILGAS         .422          .494          .536          .505          .36           .247
LOWPRICE       .412          .392          .406          .389          .383          .361
FOOD           .408          .428          .408          .346          .367          .346
SOLAR          .375          .25           .312          .375          .375          .312
INSURANC       .36           .56           .56           .6            .52           .36
COMODITY       .358          .384          .358          .282          .307          .282
BONDFUND       .287          .252          .287          .172          .172          .16
CHINA          .25           .25           .295          .227          .25           .181
MARIJUAN       .2            .2            .2            .2            .2            .1
COAL           .166          .333          .166          .333          .166          .166
EDU            .166          .333          .333          .333          .166          .166
GOLD           .155          .2            .222          .177          .222          .222
|
====================================================================================
Monday - 6:00 AM -6/12/2023 DJI Futures +37 NASDAQ
Fulures +64 Data Used - 6/9/2023
| |
6/9/2023
|
|
| |
The DJI moved up closer to its zone of resistance between 34000 and 34400
and the SP-500 is
now challenging its 12-month high. The broader market
is starting to
lag. There were 700 more down than up on the NYSE. Some traders
are showing
concerns that the FED will only temporarily halt its rate hikes
because the labor
market needs to be tamed and inflation is still far above the
FED's stated goal
of 2%. But the key indexes we follow here still show rising
Closing Lines and
Relative Strength Lines. And the DJI reveals a pattern
of having its
Stochastic-20 reach 90 before turning back down and the index itself
then falling
back.
Investor money
naturally gravitates to the high capitalization leaders. They
can raise their
prices more easily and generate such ample cash flow that they
are much less
disciplinable by higher rates. And with the "Big Three" taking off
because of the AI
revolution, it is likely it will take much bigger divergences
between the
leading indexes and most stocks than we have seen so far to
bring about a
decline. Such is the beauty of weighting the averages by
the market
capitalization of each component.
By now
professionals are used to having the FED protect them and many are
fearful of
missing out if there is an inverted head/shoulders DJIA breakout on
news of a Fed
pause. As former FED Chairman said recently, with the President
and Congress at
loggerheads and unable to agree on fiscal policy, it is up to
the FED to make
such monetary policies as the economy's safety and growth
requires.
Bernanke dienies this, but In effect, Wall Street rules through the FED.
The artificial
intelligence revolution has begin. There is no sign yet that its
leaders, MSFT,
NVDA and GOOGL, are weakening after big advances
that otherwise
might cause a 20% profit-taking pullback. More and more
talk is focused
on all the things that a new generation of computer programming
may accomplish in
field after field. Thrree stocks are the leaders of
this
"singular" and "transformative" new era. TECL just gave a new
RED
buy. This
would seem a good time to buy more of it.
There are few
Bearish MINCPs and quite a few Bullish MAXCPs are
running wild.
The trend is still up. The FED is not likely to disappoint.
The falling
trends of Food Prices, Commodites and Crude Oil should
encourage a Fed
pause this Wednesday. With Job growth high, consumer
demand will only
be tempered by much, much higher rates. That means there
should be a
profits' surge as we go into Summer.
|
|
| |
6/9/2023
2022 PEERLESS DJI, Signals, Indicators Daily DJI Volume
10-DayUp/Down Vol Stoch-20 CCI RSI Pct of All Stocks above 65-dma
Inverted Traders Index
DJI-IPA DJI-OBV Short-Term Rates
NASDAQ S&P OEX NYSE DJ-15 DJ-20 DJI-30
Tiger Index of Big
Banks Bond
Funds Gold Stocks
Housing Stocks
Insurance-Stocks
Regional Banks
Russell-1000
Semi Conductors
Recent 2006 vers-Peerless signals http://tigersoftware.com/oldpeer/UPD90609.bmp
ETFs: DIA QQQ SPY IWM MDY
TNA Short-Term Rates Ten Year Rates PST (Short Treasuries)
DOLLAR-UUP
ALLSTOCKs
COIN (Bit
Coin ETF)
USO-CrudeOil DBO
BLDP FAS GLD HD IBB JETS JNUG KOL NAIL NUGT
NRGU OIH PALL RSX RETL SDS AGQ SLV SOXL TAN TECL TLT TMF TNA
UGA USO China: YINN CHAU
Commodities: CANE
CORN DBC JJC, NIB CORN, CUT (paper)
MOO, NRGU
SOYB WEAT UUP (Dollar) LIT
(Lithium) PALL
(Palladium)
Stocks AA AAPL ADBE ALXN AMAT AMGN AMD AMZN ANET AXON AXP
BA BABA BAC BIDU BLDP BSX CAT CDNS CHKP CNX CPB CRM CVX CMG
DE DIS ENPH FB FSLR FTNT GILD GME GOOG GS HD IBM INTU JPM KO KR
LRCX MRK MRNA MOS MSFT NEM NFLX NKE NOC NUE NVDA PANW PG PYPL
QCOM QDEL REGN REV RE SCHW SNOW SO SQUARE TSLA TXN XOM V VRTX
WFC WMT XLE ZM ZOM
HOMEBUILDERS:
NAIL BZH HOV MHO MTH PHM -
REGIONAL BANKS: EGBN
FFIC GBCI HMST
Carl Icahn and associates: IEP
MS JEF
Leveraged Short ETFs:
FAZ - financials, TZA and SRTY- small caps, MZZ - mid caps, TECS -Techs,
SOXS -
semi-conductors LABD
- Biotechs
Bullish MAXCPs http://tigersoftware.com/upping/6-09-2023/Bullish.htm
Bearish MINCPs
www.tigersoftware.com/Downing/6-09-2023/BEARISH.htm |
|


|
 |
 |
 |
 |
 |
 |
 |
 |
 |
 |
Table 1 - Daily Breadth and Volume Statistics
| NYSE |
Latest Close |
Previous
Close |
Week Ago |
| Issues
traded |
3,044 |
3,069 |
3,065 |
| Advances |
1,116 |
1,427 |
2,547 |
| Declines |
1,815 |
1,515 |
452 |
| Unchanged |
113 |
127 |
66 |
| New
highs |
70 |
83 |
88 |
| New
lows |
17 |
18 |
15 |
| Adv.
volume* |
348,808,366 |
394,066,986 |
843,342,405 |
| Decl.
volume* |
466,896,207 |
423,178,340 |
130,113,055 |
| Total
volume* |
826,011,344 |
829,817,650 |
979,528,689 |
| Closing
Arms (TRIN)† |
0.79 |
0.87 |
1.20 |
| Block
trades* |
4,009 |
3,920 |
4,566 |
| Adv.
volume |
1,630,320,737 |
1,945,318,320 |
3,649,722,918 |
| Decl.
volume |
2,105,397,141 |
1,806,735,146 |
776,045,088 |
| Total
volume |
3,786,513,709 |
3,826,745,232 |
4,454,202,860 |
| NASDAQ |
Latest Close |
Previous
Close |
Week Ago |
| Issues
traded |
4,583 |
4,613 |
4,608 |
| Advances |
1,558 |
2,228 |
3,241 |
| Declines |
2,842 |
2,177 |
1,186 |
| Unchanged |
183 |
208 |
181 |
| New
highs |
117 |
86 |
129 |
| New
lows |
73 |
62 |
54 |
| Closing
Arms (TRIN)† |
0.61 |
0.65 |
0.82 |
| Block
trades |
24,790 |
26,536 |
21,679 |
| Adv.
volume |
2,066,621,290 |
2,594,731,515 |
3,363,379,973 |
| Decl.
volume |
2,313,325,053 |
1,644,149,076 |
1,008,515,235 |
| Total
volume |
4,412,710,624 |
4,280,169,676 |
4,426,760,607 |
|
Table 2 QUICKSILVER on ETFS - 6/9/2023 ---
     Bullish = 4   FAS, SOXL, TECL (+.443),  UUP
     Bearish = 1   GLD
ETF       CLOSE     CHANGE    PIVOT-PT  5-dma AROC   CL-PWR  CANDLE  IP21    ITRS    POWER INDEX
==================================================================================================
DIA       339.27   .46       336.13        17.8%     Bullish  BLUE   .208    ===      =====
---------------------------------------------------------------------------------------------
COMPQX    13259.14   20.62   13229.43      6.9%      Bullish  RED    .138    .074     .212
---------------------------------------------------------------------------------------------
SPY       429.9   .77        427.1         23.1%     Bullish  ----   .133    .034     .167
---------------------------------------------------------------------------------------------
QQQ       354.5   1.35       354.9        -2.1%      Bullish  RED    .123    .096     .219
---------------------------------------------------------------------------------------------
MDY       464.85  -2.91      453.4         70.7%     Bullish  RED    .18    -.002     .178
---------------------------------------------------------------------------------------------
IWM       185.03  -1.51      179.58        81.8%     Bullish  RED    .199    .018     .217
---------------------------------------------------------------------------------------------
FAS       60.94   .03        58.18         153.5%    Bullish  BLUE   .25     .046     .296  +
---------------------------------------------------------------------------------------------
RETL      6.3  -.32          5.52          445.5%    Bearish  RED    .108   -.096     .012
---------------------------------------------------------------------------------------------
SOXL      22.4   .12         20.97         87.4%     Bullish  RED    .144    .274     .418  +
---------------------------------------------------------------------------------------------
TECL      47.35   .66        47.46        -104.2%    Bullish  BLUE   .108    .335     .443  +
---------------------------------------------------------------------------------------------
IBB       128.84  -.19       129.47       -5.4%      Bullish  RED    .169   -.029     .14
---------------------------------------------------------------------------------------------
GLD       182.04  -.49       182.14        27.3%     Bearish  RED   -.22    -.04     -.26   -
---------------------------------------------------------------------------------------------
DBO       13.91  -.09        14.11        -77.9%     Bearish  RED   -.067   -.055    -.122
---------------------------------------------------------------------------------------------
OIH       276.4  -1.79       267.75        72.2%     Bullish  RED    .121   -.041     .08
---------------------------------------------------------------------------------------------
CPER     23.28  -.02         23.15         64.8%     -------  ----  -.133   -.103    -.236
---------------------------------------------------------------------------------------------
TAN     70.39  -.43          71.81        -117.7%    -------  RED   -.112   -.089    -.201
---------------------------------------------------------------------------------------------
UUP       28.48   .09        28.52        -15.8%     -------  ----   .332   -.017     .315  +
---------------------------------------------------------------------------------------------
CORN      23.37  -.16        23.65        -97.4%     Bullish  ----   .131   -.113     .018
---------------------------------------------------------------------------------------------
WEAT      6.38   .02         6.34          47.4%     -------  ----   .122   -.146    -.024
---------------------------------------------------------------------------------------------
YINN      37.65   .02        35.46         274.6%    Bullish  RED    0      -.237    -.237
|
Table 3      RANKING OF KEY DIRECTORIES BASED PCT.OF STOCKS ABOVE 65-DMA
             6/9/23
  Bullish = 37
  Bearish = 13
Note the new industry group EAT(S) for restaurants.
---------------------------------------------------------------------------------------
Directory     Current       day-1         day-2         day-3         day-4         day-5
----------------------------------------------------------------------------------------
HOMEBLDG       .944          .944          .944          .944          .888          .888
               -----
BIGBANKS       .857          .857          .857          .571          .285          .285
               -----
TRANSP         .789          .736          .894          .684          .526          .631
DJI-13         .769          .692          .538          .538          .538          .538
HOSPITAL       .769          .769          .846          .692          .615          .538
JETS           .769          .769          .769          .769          .615          .769
COMPUTER       .75           .75           .75           .75           .65           .75
SEMI           .734          .765          .734          .712          .659          .734
ELECTRON       .714          .721          .691          .654          .593          .699
GUNS           .714          .714          .714          .714          .5            .642
REIT           .713          .745          .77           .606          .434          .483
FINANCE        .7            .75           .737          .662          .512          .562
INDEXES        .691          .697          .654          .621          .567          .61
HIGHPRIC       .688          .722          .688          .688          .675          .688
NIFTY          .681          .659          .59           .681          .613          .727
AUTO           .679          .716          .66           .622          .547          .584
SOFTWARE       .678          .678          .642          .714          .66           .678
NASD-100       .67           .66           .63           .68           .64           .66
MILITARY       .653          .653          .615          .461          .384          .5
EATS           .65           .75           .725          .725          .65           .625
BEVERAGE       .642          .642          .642          .642          .714          .714
GAMING         .631          .578          .631          .684          .473          .473
FIDSTKS        .627          .585          .579          .532          .485          .514
GREEN          .611          .611          .666          .666          .611          .666
RUS-1000       .611          .625          .635          .574          .482          .513
DOWJONES       .6            .566          .533          .533          .533          .566
               ----
REGBANKS       .595          .666          .666          .452          .238          .261
SP500          .595          .589          .587          .523          .466          .486
INFRA          .575          .636          .575          .484          .393          .393
RETAIL         .565          .586          .543          .5            .413          .456
HACKERS        .562          .5            .5            .562          .5            .562
INSURANC       .56           .56           .6            .52           .36           .4
CHEM           .558          .651          .744          .534          .418          .465
SP-100         .555          .544          .522          .455          .411          .433
ETFS           .545          .563          .472          .6            .509          .581
UTILITY        .538          .564          .512          .282          .256          .307
BIOTECH        .509          .547          .547          .552          .492          .504
===============================================================================================
OILGAS         .494          .536          .505          .36           .237          .268
INDMATER       .458          .513          .541          .458          .319          .388
COPPER         .428          .428          .142          .142          0             0
FOOD           .428          .428          .326          .367          .346          .285
LOWPRICE       .392          .409          .392          .386          .361          .361
COMODITY       .384          .384          .256          .307          .282          .23
COAL           .333          .166          .333          .166          .166          .166
EDU            .333          .333          .333          .166          .166          .166
BONDFUND       .252          .275          .172          .183          .172          .137
CHINA          .25           .295          .227          .25           .181          .227
SOLAR          .25           .312          .375          .375          .312          .375
GOLD           .2            .222          .177          .222          .222          .222
MARIJUAN       .2            .2            .2            .2            .1            .1
|
=====================================================================================
Friday - 6:11 AM -6/9/2023 DJI Futures -5 NASDAQ Fulures +19 Data Used - 6/8/2023
| |
DJIA 33833.61
168.59 +0.50%
S&P 500 4293.93 26.41
+0.62%
Nasdaq 13238.52 133.63 +1.02% |
|
| |
The DJI is
challenging its 34000 resistance while we wait for confirmation
from the FED that it is, in
fact, going to pause in its rate hikes. Another drop in
the CPI would be bullish,
too. The weak OBV Lines shown by the indexes
have not prevented the rally
by these indexes to their yearly highs. More
important has been the
gathering strength in the overall market. The A/D Line's
uptrend is now key and it is
clearly rising. The profit-taking in the tech stocks
is viewed as temporary.
But what would be of bearish concern would be the
DJI reaching 34300 or so with
the V-Indicator negative. That would bring
a Peerless S9-V. A
negativeV-I non-confirmation with the DJI closing above the
2.4% band would show us that
many Professionals are leaving for their Summer
vacations and their
aggressive buying will not be present to boost the market.
But for now, there are almost
no Bearish MINCPs and the rally should continue.
Notice the recent very
flat resistance exactly at 34000 in the DJI below. As we
like to say, this beckons for
a breakout. 34300 is now our DJI target. |
|
| |
6/8/2023
2022 PEERLESS DJI, Signals, Indicators Daily DJI Volume
10-DayUp/Down Vol Stoch-20 CCI RSI Pct of All Stocks above 65-dma
Inverted Traders Index
DJI-IPA DJI-OBV Short-Term Rates
NASDAQ S&P OEX NYSE DJ-15 DJ-20 DJI-30
Tiger Index of Big
Banks Bond
Funds Gold Stocks
Housing Stocks
Insurance-Stocks
Regional Banks
Russell-1000
Semi Conductors
Recent 2006 vers-Peerless signals http://tigersoftware.com/oldpeer/UPD90607.bmp
ETFs: DIA QQQ SPY IWM MDY
TNA Short-Term Rates Ten Year Rates PST (Short Treasuries)
DOLLAR-UUP
ALLSTOCKs
COIN (Bit
Coin ETF)
USO-CrudeOil DBO
BLDP FAS GLD HD IBB JETS JNUG KOL NAIL NUGT
NRGU OIH PALL RSX RETL SDS AGQ SLV SOXL TAN TECL TLT TMF TNA
UGA USO China: YINN CHAU
Commodities: CANE
CORN DBC JJC, NIB CORN, CUT (paper)
MOO, NRGU
SOYB WEAT UUP (Dollar) LIT
(Lithium) PALL
(Palladium)
Stocks AA AAPL ADBE ALXN AMAT AMGN AMD AMZN ANET AXON AXP
BA BABA BAC BIDU BLDP BSX CAT CDNS CHKP CNX CPB CRM CVX CMG
DE DIS ENPH FB FSLR FTNT GILD GME GOOG GS HD IBM INTU JPM KO KR
LRCX MRK MRNA MOS MSFT NEM NFLX NKE NOC NUE NVDA PANW PG PYPL
QCOM QDEL REGN REV RE SCHW SNOW SO SQUARE TSLA TXN XOM V VRTX
WFC WMT XLE ZM ZOM
HOMEBUILDERS:
NAIL BZH HOV MHO MTH PHM -
REGIONAL BANKS: EGBN
FFIC GBCI HMST
Carl Icahn and associates: IEP
MS JEF
Leveraged Short ETFs:
FAZ - financials, TZA and SRTY- small caps, MZZ - mid caps, TECS -Techs,
SOXS -
semi-conductors LABD
- Biotechs
Bullish MAXCPs http://tigersoftware.com/upping/6-08-2023/Bullish.htm
Bearish MINCPs
www.tigersoftware.com/Downing/6-08-2023/BEARISH.htm |
|

 
|
 |
 |
 |
 |

===================================================================================

|
Table 1
| NYSE |
Latest Close |
Previous
Close |
Week Ago |
| Issues
traded |
3,069 |
3,075 |
3,079 |
| Advances |
1,427 |
1,927 |
2,139 |
| Declines |
1,515 |
1,039 |
836 |
| Unchanged |
127 |
109 |
104 |
| New
highs |
83 |
155 |
27 |
| New
lows |
18 |
10 |
76 |
| Adv.
volume* |
394,066,986 |
713,211,404 |
730,910,005 |
| Decl.
volume* |
423,178,340 |
293,404,337 |
247,019,057 |
| Total
volume* |
829,817,650 |
1,015,082,060 |
991,296,051 |
| Closing
Arms (TRIN)† |
0.87 |
0.95 |
0.86 |
| Block
trades* |
3,920 |
4,703 |
4,609 |
| Adv.
volume |
1,945,318,320 |
2,966,537,700 |
3,245,437,069 |
| Decl.
volume |
1,806,735,146 |
1,520,442,564 |
1,086,468,928 |
| Total
volume |
3,826,745,232 |
4,537,808,923 |
4,391,866,580 |
| NASDAQ |
Latest Close |
Previous
Close |
Week Ago |
| Issues
traded |
4,613 |
4,606 |
4,613 |
| Advances |
2,228 |
2,479 |
2,929 |
| Declines |
2,177 |
1,954 |
1,473 |
| Unchanged |
208 |
173 |
211 |
| New
highs |
86 |
152 |
80 |
| New
lows |
62 |
58 |
123 |
| Closing
Arms (TRIN)† |
0.65 |
1.12 |
0.89 |
| Block
trades |
26,536 |
30,560 |
23,768 |
| Adv.
volume |
2,594,731,515 |
2,762,767,550 |
3,142,921,768 |
| Decl.
volume |
1,644,149,076 |
2,446,454,874 |
1,399,897,837 |
|
Table 2 QUICKSILVER on ETFS - 6/8/2023 ---
     Bullish = 6   COMPQX(.280),  QQQ(+.327), SOXL (+.555), TECL (.555), FAS ,UP (347)
     Bearish = 0
ETF       CLOSE     CHANGE    PIVOT-PT  5-dma AROC   CL-PWR  CANDLE  IP21    ITRS    POWER INDEX
==================================================================================================
DIA       338.81   1.64      338.07        117.2%     Bullish  BLUE   .214    ----     .214
---------------------------------------------------------------------------------------------
COMPQX    13238.52   133.62  13240.77      52.1%      Bullish  BLUE   .196    .084     .28  +++
---------------------------------------------------------------------------------------------
SPY       429.13   2.58      427.92        85.7%      Bullish  BLUE   .173    .038     .211
---------------------------------------------------------------------------------------------
QQQ       353.15   4.33      354.65        16.1%      Bullish  BLUE   .172    .104     .276  +++
---------------------------------------------------------------------------------------------
MDY       467.76  -2.03      458.31        259.9%     Bullish  RED    .211    .008     .219
---------------------------------------------------------------------------------------------
IWM       186.54  -.7        182.02        299.6%     Bullish  RED    .22    .029      .249
---------------------------------------------------------------------------------------------
FAS       60.91  -.17        59.1          452.6%     Bullish  BLUE   .23    .084      .314  +++
---------------------------------------------------------------------------------------------
RETL      6.62   .24         5.76          1293%      Bullish  BLUE   .151   -.043     .108
---------------------------------------------------------------------------------------------
SOXL      22.28   .64        22.02         27.6%      Bullish  BLUE   .166    .379     .545  +++
---------------------------------------------------------------------------------------------
TECL      46.69   1.43       48.33        -83.7%      Bullish  BLUE   .164    .391     .555  +++
---------------------------------------------------------------------------------------------
IBB       129.03   .2        128.98        87.9%      Bullish  BLUE   .148   -.023     .125
---------------------------------------------------------------------------------------------
GLD       182.53   2.38      181.05       -33.8%      Bearish  BLUE  -.199   -.051    -.25
---------------------------------------------------------------------------------------------
DBO       14  -.27           14.13         63.9%      -------  RED   -.029   -.062    -.091
---------------------------------------------------------------------------------------------
OIH       278.19  -1.02      272.45        352.1%     Bullish  RED    .123   -.035     .088
---------------------------------------------------------------------------------------------
CPER     23.3   .17          22.98         99.8%      -------  BLUE  -.103   -.109    -.212
---------------------------------------------------------------------------------------------
TAN     70.82  -.2           72.07        -46.1%      Bullish  RED   -.058   -.07     -.128
---------------------------------------------------------------------------------------------
UUP       28.39  -.23        28.57         21%        -------  RED    .322   -.027     .295  +++
---------------------------------------------------------------------------------------------
CORN      23.53   .26        23.83         8.5%       -------  BLUE   .143   -.116     .027
---------------------------------------------------------------------------------------------
WEAT      6.36   .12         6.32          111.1%     -------  BLUE   .102   -.153    -.051
---------------------------------------------------------------------------------------------
YINN      37.63   1.11       35.64         682.1%     Bullish  BLUE   .029   -.244    -.215
|
 Table 3     RANKING OF KEY DIRECTORIES BASED PCT.OF STOCKS ABOVE 65-DMA
             6/8/23
 Bullish = 37
 Bearish = 11
---------------------------------------------------------------------------------------
Directory     Current       day-1         day-2         day-3         day-4         day-5
----------------------------------------------------------------------------------------
HOMEBLDG       .944          .944          .944          .888          .888          .722
BIGBANKS       .857          .857          .571          .285          .285          .285
HOSPITAL       .769          .846          .692          .615          .615          .461
JETS           .769          .769          .769          .615          .769          .615
SEMI           .765          .734          .712          .659          .712          .691
COMPUTER       .75           .75           .75           .65           .75           .55
FINANCE        .75           .737          .662          .5            .55           .35
REIT           .745          .762          .614          .442          .475          .327
TRANSP         .736          .894          .684          .526          .631          .526
HIGHPRIC       .722          .688          .688          .675          .679          .545
ELECTRON       .721          .691          .654          .593          .684          .624
AUTO           .716          .679          .622          .547          .566          .32
GUNS           .714          .714          .714          .5            .642          .357
INDEXES        .697          .654          .621          .567          .605          .4
DJI-13         .692          .538          .538          .538          .538          .384
SOFTWARE       .678          .66           .714          .66           .678          .607
REGBANKS       .666          .666          .452          .238          .261          .166
NASD-100       .66           .63           .68           .64           .65           .57
NIFTY          .659          .59           .681          .613          .704          .681
MILITARY       .653          .615          .461          .384          .5            .346
CHEM           .651          .744          .534          .418          .465          .162
BEVERAGE       .642          .642          .642          .714          .714          .5
INFRA          .636          .575          .484          .393          .393          .303
RUS-1000       .625          .635          .574          .482          .51           .371
GREEN          .611          .666          .666          .611          .666          .5
SP500          .589          .587          .525          .462          .488          .342
RETAIL         .586          .543          .5            .413          .456          .282
FIDSTKS        .585          .579          .532          .485          .514          .39
GAMING         .578          .631          .631          .526          .473          .315
DOWJONES       .566          .533          .533          .533          .566          .433
UTILITY        .564          .512          .282          .256          .307          .23
ETFS           .563          .472          .6            .509          .6            .4
INSURANC       .56           .6            .52           .36           .4            .32
BIOTECH        .544          .544          .554          .492          .507          .445
SP-100         .544          .522          .455          .411          .433          .344
OILGAS         .536          .505          .36           .237          .268          .185
INDMATER       .513          .541          .458          .319          .388          .152
===============================================================================================
HACKERS        .5            .5            .562          .5            .562          .562
===============================================================================================
COPPER         .428          .142          .142          0             0             0
FOOD           .428          .346          .346          .346          .285          .408
LOWPRICE       .409          .395          .389          .363          .352          .323
COMODITY       .384          .282          .282          .282          .23           .384
EDU            .333          .333          .166          .166          .166          .166
SOLAR          .312          .375          .375          .312          .375          .312
CHINA          .295          .227          .25           .181          .181          .181
BONDFUND       .275          .16           .183          .183          .149          .137
GOLD           .222          .177          .222          .222          .222          .377
MARIJUAN       .2            .2            .2            .1            .1            .1
COAL .166 .333 .166 .166 .166 0
|
===================================================================================
Thursday - 6:03 AM -6/8/2023 DJI
Futures -5 NASDAQ Fulures +19 Data Used - 6/7/2023
| |
6/7/2023
|
|
| |
The hope that the Fed
will pause in its rate hikes and a "soft landing" will be
achieved as the rate Inflation
keeps falling have brought the DJI to a point where
its hypothetical highs have almost
tagged 34000. More of a recovery now will need
dovish leaks from within the FOMC
as the market waits to see what the FED will,
in fact, do next week. With
volume low, even poor, judging by OBV for the
various indexes, we can only expect
a labored rally now from the DJI.
But the internal strength downtrend-lines
we track for the DJI have been broken.
In particular, breadth (advances-declines
and New Highs/New Lows) indicators
are improving and positive. This
has unleashed rallies from the most beaten down
groups. See below how IWM and RETL
jumped up again today. And why shouldn't
they? If rates stop rising, soon
they may even start falling.
In early 1967, when Inflation pressures
were still indeniable, the FED stopped
after a year of tightening. The
result was runaway prices in electronics, computer
and semi-conductors. They were the
growth stocks then, just as they are now.
The smaller stocks, like those in IWM
now, held back. They made their big
advance in 1968. The DJI throughout
this period of time only made modest
gains and could not make new highs above
much above its early 1966 peak.
I think the behavior of sectors then is
likely to play out again now. So, ride out
the current "subsidence" in the
AI, TECL and QQQ stocks. The lack of bearish
MINCPs tells us to avoid the short side.
Expect the tech stocks that are dipping
to find ample support at their 21-day ma.
|
|
| |
6/7/2023
2022 PEERLESS DJI, Signals, Indicators Daily DJI Volume
10-DayUp/Down Vol Stoch-20 CCI RSI Pct of All Stocks above 65-dma
Inverted Traders Index
DJI-IPA DJI-OBV Short-Term Rates
NASDAQ S&P OEX NYSE DJ-15 DJ-20 DJI-30
Tiger Index of Big
Banks Bond
Funds Gold Stocks
Housing Stocks
Insurance-Stocks
Regional Banks
Russell-1000
Semi Conductors
Recent 2006 vers-Peerless signals http://tigersoftware.com/oldpeer/UPD90607.bmp
ETFs: DIA QQQ SPY IWM MDY
TNA Short-Term Rates Ten Year Rates PST (Short Treasuries)
DOLLAR-UUP
ALLSTOCKs
COIN (Bit
Coin ETF)
USO-CrudeOil DBO
BLDP FAS GLD HD IBB JETS JNUG KOL NAIL NUGT
NRGU OIH PALL RSX RETL SDS AGQ SLV SOXL TAN TECL TLT TMF TNA
UGA USO China: YINN CHAU
Commodities: CANE
CORN DBC JJC, NIB CORN, CUT (paper)
MOO, NRGU
SOYB WEAT UUP (Dollar) LIT
(Lithium) PALL
(Palladium)
Stocks AA AAPL ADBE ALXN AMAT AMGN AMD AMZN ANET AXON AXP
BA BABA BAC BIDU BLDP BSX CAT CDNS CHKP CNX CPB CRM CVX CMG
DE DIS ENPH FB FSLR FTNT GILD GME GOOG GS HD IBM INTU JPM KO KR
LRCX MRK MRNA MOS MSFT NEM NFLX NKE NOC NUE NVDA PANW PG PYPL
QCOM QDEL REGN REV RE SCHW SNOW SO SQUARE TSLA TXN XOM V VRTX
WFC WMT XLE ZM ZOM
HOMEBUILDERS:
NAIL BZH HOV MHO MTH PHM -
REGIONAL BANKS: EGBN
FFIC GBCI HMST
Carl Icahn and associates: IEP
MS JEF
Leveraged Short ETFs:
FAZ - financials, TZA and SRTY- small caps, MZZ - mid caps, TECS -Techs,
SOXS -
semi-conductors LABD
- Biotechs
Bullish MAXCPs http://tigersoftware.com/upping/6-07-2023/Bullish.htm
Bearish MINCPs www.tigersoftware.com/Downing/6-07-2023/BEARISH.htm
|
|
 |
 |
 |
 |
 |
 |
 |
 |
 |
 |
| NYSE |
Latest Close |
Previous
Close |
Week Ago |
| Issues
traded |
3,075 |
3,079 |
3,074 |
| Advances |
1,927 |
2,348 |
1,295 |
| Declines |
1,039 |
632 |
1,687 |
| Unchanged |
109 |
99 |
92 |
| New
highs |
155 |
110 |
20 |
| New
lows |
10 |
18 |
117 |
| Adv.
volume* |
713,211,404 |
678,613,428 |
833,396,909 |
| Decl.
volume* |
293,404,337 |
162,651,743 |
1,296,896,635 |
| Total
volume* |
1,015,082,060 |
850,457,799 |
2,163,638,841 |
| Closing
Arms (TRIN)† |
0.95 |
0.92 |
1.36 |
| Block
trades* |
4,703 |
4,240 |
5,188 |
| Adv.
volume |
2,966,537,700 |
3,162,811,456 |
2,094,542,737 |
| Decl.
volume |
1,520,442,564 |
787,454,683 |
3,712,777,380 |
| Total
volume |
4,537,808,923 |
3,996,564,066 |
5,980,675,696 |
| NASDAQ |
Latest Close |
Previous
Close |
Week Ago |
| Issues
traded |
4,606 |
4,602 |
4,609 |
| Advances |
2,479 |
3,172 |
1,872 |
| Declines |
1,954 |
1,256 |
2,569 |
| Unchanged |
173 |
174 |
168 |
| New
highs |
152 |
131 |
51 |
| New
lows |
58 |
83 |
202 |
| Closing
Arms (TRIN)† |
1.12 |
0.93 |
0.83 |
| Block
trades |
30,560 |
30,189 |
28,124 |
| Adv.
volume |
2,762,767,550 |
3,477,092,202 |
2,740,164,476 |
| Decl.
volume |
2,446,454,874 |
1,284,739,135 |
3,112,185,558 |
| Total
volume |
5,270,606,756 |
4,810,914,072 |
5,905,762,188 |
|
Table 2 QUICKSILVER on ETFS - 6/5/2023 ---
     Bullish = 6   COMPQX(.291),  QQQ(+.306), SOXL (+.480), TECL (.557), FAS (271), UUP (347)
     Bearish = 0
ETF       CLOSE     CHANGE    PIVOT-PT  5-dma AROC   CL-PWR  CANDLE  IP21    ITRS    POWER INDEX
==================================================================================================
DIA       336.17   .04       329.52        84.8%      -------  BLUE   .163    0        ---
---------------------------------------------------------------------------------------------
COMPQX    13276.42   46.99   12935.29      98.8%      Bullish  BLUE   .211    .08      .291   +++
---------------------------------------------------------------------------------------------
SPY       428.03   .93       417.85        92.8%      Bullish  BLUE   .185    .039     .224
---------------------------------------------------------------------------------------------
QQQ       354.84  -.06       347.99        69.1%      Bullish  BLUE   .208    .098     .306   +++
---------------------------------------------------------------------------------------------
MDY       462.85   9.45      440.15        185.9%     Bullish  BLUE   .163    .013     .176
---------------------------------------------------------------------------------------------
IWM       184.31   4.73      173.77        248.4%     Bullish  BLUE   .165    .03      .195
---------------------------------------------------------------------------------------------
FAS       60.44   2.26       53.8          419.7%     Bullish  BLUE   .148    .123     .271   +++
---------------------------------------------------------------------------------------------
RETL      6.02   .5          5.1           406.1%     Bearish  BLUE   .086   -.099    -.013
---------------------------------------------------------------------------------------------
SOXL      21.73   .76        21.15        -261.1%     Bullish  BLUE   .212    .268     .48   +++
---------------------------------------------------------------------------------------------
TECL      47.4  -.06         46.13         8.4%       Bullish  BLUE   .195    .362     .557  +++
---------------------------------------------------------------------------------------------
IBB       129.08  -.39       126.28        114.1%     -------  RED    .136   -.017     .119
---------------------------------------------------------------------------------------------
GLD       182.34   .2        182.32        8.2%       Bearish  ----  -.147   -.05     -.197
---------------------------------------------------------------------------------------------
DBO       14.07  -.04        13.37         112%       -------  BLUE  -.015   -.003    -.018
---------------------------------------------------------------------------------------------
OIH       271.06   3.31      246.78        288.6%     Bullish  BLUE   .08    .01       .09
---------------------------------------------------------------------------------------------
CPER     23.17   .02         22.62         133.6%     -------  ----  -.048   -.11    -.158
---------------------------------------------------------------------------------------------
TAN     71.24  -.57          69.98         30.2%      -------  BLUE  -.023   -.067    -.09
---------------------------------------------------------------------------------------------
UUP       28.61   .09        28.61         8.8%       -------  ----   .369   -.022     .347  +++
---------------------------------------------------------------------------------------------
CORN      23.73   .08        23.1          113%       Bullish  ----   .144   -.089     .055
---------------------------------------------------------------------------------------------
WEAT      6.37   .03         6.06          266.3%     -------  RED    .118   -.137    -.019
---------------------------------------------------------------------------------------------
YINN      37.73   2.27       30.47         1055.4%    Bullish  BLUE   .078   -.199    -.121
                     QUICKSILVER on ETFS - 06/07/23
ETF       CLOSE   CHANGE    PIVOT-PT    5-dma AROC   CL-PWR   CANDLE   IP21   ITRS   POWER INDEX
---------------------------------------------------------------------------------------------
DIA       337.17   1         330.94        114.5%     Bullish  BLUE   .184    0     .184
---------------------------------------------------------------------------------------------
COMPQX    13104.9  -171.52   13100.98      64.5%     Bullish  RED    .122    .074     .196
---------------------------------------------------------------------------------------------
SPY       426.55  -1.48      421.82        102.5%     Bullish  RED    .126    .036     .162
---------------------------------------------------------------------------------------------
QQQ       348.82  -6.02      352.01        11.8%     Bullish  RED    .123    .09     .213
---------------------------------------------------------------------------------------------
MDY       469.79   6.94      443.97        328.1%     Bullish  BLUE   .217    .021     .238
---------------------------------------------------------------------------------------------
IWM       187.24   2.93      175.65        376.1%     Bullish  BLUE   .218    .038     .256
---------------------------------------------------------------------------------------------
FAS       61.08   .64        55.58         633.9%     Bullish  BLUE   .214    .091     .305
---------------------------------------------------------------------------------------------
RETL      6.38   .36         5.13          1162.4%     -------  BLUE   .113   -.047     .066
---------------------------------------------------------------------------------------------
SOXL      21.64  -.09        22.16         113.4%     Bullish  RED    .148    .315     .463
---------------------------------------------------------------------------------------------
TECL      45.26  -2.14       47.48        -91.8%     Bullish  RED    .122    .334     .456
---------------------------------------------------------------------------------------------
IBB       128.83  -.25       126.77        99.5%     Bullish  RED    .156   -.017     .139
---------------------------------------------------------------------------------------------
GLD       180.15  -2.19      183.76       -59.5%     Bearish  RED   -.177   -.05    -.227
---------------------------------------------------------------------------------------------
DBO       14.27   .2         13.82         323.7%     -------  BLUE   .004   -.03    -.026
---------------------------------------------------------------------------------------------
OIH       279.21   8.15      259.18        615.5%     Bullish  BLUE   .132    0     .132
---------------------------------------------------------------------------------------------
CPER     23.13  -.04         22.84         111.1%     -------  RED   -.062   -.114    -.176
---------------------------------------------------------------------------------------------
TAN     71.02  -.22          71.48         72.9%     Bullish  RED   -.042   -.066    -.108
---------------------------------------------------------------------------------------------
UUP       28.62   .01        28.27         1.8%     -------  BLUE   .366   -.015     .351
---------------------------------------------------------------------------------------------
CORN      23.27  -.46        23.49         36.1%     -------  RED    .123   -.118     .005
---------------------------------------------------------------------------------------------
WEAT      6.24  -.13         6.22          143.7%     -------  RED    .078   -.161    -.083
---------------------------------------------------------------------------------------------
YINN      36.52  -1.21       32.77         879%     Bullish  RED    .04   -.166    -.126
|
 Table 3    RANKING OF KEY DIRECTORIES BASED PCT.OF STOCKS ABOVE 65-DMA
             6/7/23
Bullish = 36
Bearish = 12
---------------------------------------------------------------------------------------
Directory     Current       day-1         day-2         day-3         day-4         day-5
----------------------------------------------------------------------------------------
HOMEBLDG       .944          .944          .888          .888          .777          .666
TRANSP         .894          .684          .526          .631          .526          .368
BIGBANKS       .857          .571          .285          .285          .285          .285
HOSPITAL       .846          .692          .615          .615          .461          .384
JETS           .769          .769          .615          .769          .615          .538
REIT           .762          .606          .45           .483          .311          .311
COMPUTER       .75           .75           .65           .75           .55           .55
CHEM           .744          .534          .418          .465          .186          .186
FINANCE        .737          .662          .5            .537          .362          .25
SEMI           .734          .712          .659          .712          .68           .648
GUNS           .714          .714          .5            .642          .357          .357
ELECTRON       .691          .654          .593          .684          .616          .586
HIGHPRIC       .688          .688          .675          .679          .549          .48
AUTO           .679          .641          .547          .566          .32           .301
GREEN          .666          .666          .611          .666          .5            .333
REGBANKS       .666          .452          .238          .261          .166          .119
SOFTWARE       .66           .732          .66           .678          .607          .625
INDEXES        .654          .621          .567          .605          .4            .308
BEVERAGE       .642          .642          .714          .714          .5            .5
RUS-1000       .635          .574          .482          .51           .375          .338
GAMING         .631          .631          .473          .526          .315          .315
NASD-100       .63           .68           .64           .65           .57           .54
MILITARY       .615          .461          .384          .5            .346          .23
INSURANC       .6            .52           .36           .4            .32           .28
NIFTY          .59           .681          .613          .704          .681          .59
SP500          .587          .525          .464          .484          .353          .299
FIDSTKS        .579          .532          .485          .514          .402          .343
INFRA          .575          .484          .393          .393          .303          .303
RETAIL         .543          .5            .413          .456          .304          .282
BIOTECH        .542          .552          .495          .507          .447          .43
INDMATER       .541          .458          .319          .388          .18           .125
DJI-13         .538          .538          .538          .538          .384          .384
DOWJONES       .533          .533          .533          .566          .466          .366
SP-100         .522          .455          .411          .433          .355          .277
UTILITY        .512          .282          .256          .307          .256          .256
OILGAS         .505          .36           .237          .268          .185          .144
================================================================================================
HACKERS        .5            .562          .5            .562          .562          .562
================================================================================================
ETFS           .472          .6            .509          .6            .418          .309
LOWPRICE       .395          .392          .366          .355          .32           .295
SOLAR          .375          .375          .312          .375          .312          .25
FOOD           .346          .367          .326          .285          .408          .244
COAL           .333          .166          .166          .166          .166          0
EDU            .333          .166          .166          .166          .166          .166
COMODITY       .282          .307          .256          .23           .384          .205
CHINA          .227          .25           .181          .181          .181          .113
MARIJUAN       .2            .2            .1            .1            .1            .1
GOLD           .177          .222          .222          .222          .377          .177
BONDFUND       .16           .172          .183          .16           .149          .103
COPPER         .142          .142          0             0             0             0
|
===================================================================================
Wednesday - 6:00
AM -6/7/2023 DJI Futures +5
NASDAQ Fulures +10 Data
Used - 6/6/2023
| |
6/6/2023
|
|
| |
The NYSE A/D
Line broke its downtrend decisively today. This recorded
and resulted in the
Russell-2000's 2.5% one day jump. 56% of all 5000 stocks
and ETFs we track are above
their 65-dma. Even 50% of the beaten-down Retail
stocks are above their
65-dma. See Table 3.
Very few bearish MINCPs
appear tonight. The prospects of the FED pausing in
their rate hike program when
the FOMC meets next week coupled with last
Friday's surprisingly
positive Jobs' number are the combned cause for this advance.
A broad advance will take the
focus from the "Big Four" (MSFT, NVDA, GOOG
and AAPL) and may cause them
some subsidence. TECL, as the ETF with the highest
ITRS (Relative Strength)
score among the major ETFs, may pause before
rising more. But
traders should continue to hold it. See below how its internals
are not likely to be soon
reversed.
Home-Builders responded to
the same bullish stimuli. They are now the natural
leaders if the FED does
decide to stop raising rates and there is no recession.
Cover short sales whose steep
Closing Power and Relative Strength Lines are broken.
A DJI slow rally to 34000
would seem to lie ahead. Let's see if the weak LABD
(Nasdaq biotechs) can join
the recovery. Its Accumulation Index is improving.
FAS (representing big banks)
should go back to its broken support, shown
below. As the breadth
figures show for today, this is apt to be a broad advance.
But, for some reason, volume
is still suspiciously low. That means it is unlikely
the DJI will be leading the
charge and will be able to muscle past its overhead
resistance. Normally,
semi-conductors make good plays in this situation, as
well as our bullish MAXCPs. |
|
| |
6/6/2023
2022 PEERLESS DJI, Signals, Indicators Daily DJI Volume
10-DayUp/Down Vol Stoch-20 CCI RSI Pct of All Stocks above 65-dma
Inverted Traders Index
DJI-IPA DJI-OBV Short-Term Rates
NASDAQ S&P OEX NYSE DJ-15 DJ-20 DJI-30
Tiger Index of Big
Banks Bond
Funds Gold Stocks
Housing Stocks
Insurance-Stocks
Regional Banks
Russell-1000
Semi Conductors
Recent 2006 vers-Peerless signals http://tigersoftware.com/oldpeer/UPD90606.bmp
ETFs: DIA QQQ SPY IWM MDY
TNA Short-Term Rates Ten Year Rates PST (Short Treasuries)
DOLLAR-UUP
ALLSTOCKs
COIN (Bit
Coin ETF)
USO-CrudeOil DBO
BLDP FAS GLD HD IBB JETS JNUG KOL NAIL NUGT
NRGU OIH PALL RSX RETL SDS AGQ SLV SOXL TAN TECL TLT TMF TNA
UGA USO China: YINN CHAU
Commodities: CANE
CORN DBC JJC, NIB CORN, CUT (paper)
MOO, NRGU
SOYB WEAT UUP (Dollar) LIT
(Lithium) PALL
(Palladium)
Stocks AA AAPL ADBE ALXN AMAT AMGN AMD AMZN ANET AXON AXP
BA BABA BAC BIDU BLDP BSX CAT CDNS CHKP CNX CPB CRM CVX CMG
DE DIS ENPH FB FSLR FTNT GILD GME GOOG GS HD IBM INTU JPM KO KR
LRCX MRK MRNA MOS MSFT NEM NFLX NKE NOC NUE NVDA PANW PG PYPL
QCOM QDEL REGN REV RE SCHW SNOW SO SQUARE TSLA TXN XOM V VRTX
WFC WMT XLE ZM ZOM
HOMEBUILDERS:
NAIL BZH HOV MHO MTH PHM -
REGIONAL BANKS: EGBN
FFIC GBCI HMST
Carl Icahn and associates: IEP
MS JEF
Leveraged Short ETFs:
FAZ - financials, TZA and SRTY- small caps, MZZ - mid caps, TECS -Techs,
SOXS -
semi-conductors LABD
- Biotechs
Bullish MAXCPs http://tigersoftware.com/upping/6-06-2023/Bullish.htm
Bearish MINCPs www.tigersoftware.com/Downing/6-06-2023/BEARISH.htm
|
|
A/D Line trend-break is bullish. This line is widely watched.


 |
 |
 |
 |
 |
 |
 |
 |
 |
 |
 |
Table 1 - Daily Breadth and Volume Statistics
| NYSE |
Latest Close |
Previous
Close |
Week Ago |
| Issues
traded |
3,079 |
3,074 |
3,094 |
| Advances |
2,348 |
1,041 |
1,408 |
| Declines |
632 |
1,913 |
1,574 |
| Unchanged |
99 |
120 |
112 |
| New
highs |
110 |
50 |
51 |
| New
lows |
18 |
26 |
78 |
| Adv.
volume* |
678,613,428 |
319,517,438 |
376,997,172 |
| Decl.
volume* |
162,651,743 |
515,531,918 |
529,554,481 |
| Total
volume* |
850,457,799 |
840,263,405 |
915,012,314 |
| Closing
Arms (TRIN)† |
0.92 |
0.72 |
1.11 |
| Block
trades* |
4,240 |
4,043 |
4,405 |
| Adv.
volume |
3,162,811,456 |
1,634,377,081 |
1,865,274,680 |
| Decl.
volume |
787,454,683 |
2,151,818,641 |
2,315,013,569 |
| Total
volume |
3,996,564,066 |
3,813,295,269 |
4,228,511,226 |
| NASDAQ |
Latest Close |
Previous
Close |
Week Ago |
| Issues
traded |
4,602 |
4,620 |
4,625 |
| Advances |
3,172 |
1,768 |
2,023 |
| Declines |
1,256 |
2,656 |
2,422 |
| Unchanged |
174 |
196 |
180 |
| New
highs |
131 |
124 |
128 |
| New
lows |
83 |
71 |
146 |
| Closing
Arms (TRIN)† |
0.93 |
0.71 |
0.53 |
| Block
trades |
30,189 |
24,247 |
29,530 |
| Adv.
volume |
3,477,092,202 |
2,074,556,575 |
2,946,043,776 |
| Decl.
volume |
1,284,739,135 |
2,205,548,666 |
1,859,312,327 |
| Total
volume |
4,810,914,072 |
4,344,285,639 |
4,843,478,184 |
|
Table 2 QUICKSILVER on ETFS - 6/5/2023 ---
     Bullish = 6   COMPQX(.291),  QQQ(+.306), SOXL (+.480), TECL (.557), FAS (271), UUP (347)
     Bearish = 0
ETF       CLOSE     CHANGE    PIVOT-PT  5-dma AROC   CL-PWR  CANDLE  IP21    ITRS    POWER INDEX
==================================================================================================
DIA       336.17   .04       329.52        84.8%      -------  BLUE   .163    0        ---
---------------------------------------------------------------------------------------------
COMPQX    13276.42   46.99   12935.29      98.8%      Bullish  BLUE   .211    .08      .291   +++
---------------------------------------------------------------------------------------------
SPY       428.03   .93       417.85        92.8%      Bullish  BLUE   .185    .039     .224
---------------------------------------------------------------------------------------------
QQQ       354.84  -.06       347.99        69.1%      Bullish  BLUE   .208    .098     .306   +++
---------------------------------------------------------------------------------------------
MDY       462.85   9.45      440.15        185.9%     Bullish  BLUE   .163    .013     .176
---------------------------------------------------------------------------------------------
IWM       184.31   4.73      173.77        248.4%     Bullish  BLUE   .165    .03      .195
---------------------------------------------------------------------------------------------
FAS       60.44   2.26       53.8          419.7%     Bullish  BLUE   .148    .123     .271   +++
---------------------------------------------------------------------------------------------
RETL      6.02   .5          5.1           406.1%     Bearish  BLUE   .086   -.099    -.013
---------------------------------------------------------------------------------------------
SOXL      21.73   .76        21.15        -261.1%     Bullish  BLUE   .212    .268     .48   +++
---------------------------------------------------------------------------------------------
TECL      47.4  -.06         46.13         8.4%       Bullish  BLUE   .195    .362     .557  +++
---------------------------------------------------------------------------------------------
IBB       129.08  -.39       126.28        114.1%     -------  RED    .136   -.017     .119
---------------------------------------------------------------------------------------------
GLD       182.34   .2        182.32        8.2%       Bearish  ----  -.147   -.05     -.197
---------------------------------------------------------------------------------------------
DBO       14.07  -.04        13.37         112%       -------  BLUE  -.015   -.003    -.018
---------------------------------------------------------------------------------------------
OIH       271.06   3.31      246.78        288.6%     Bullish  BLUE   .08    .01       .09
---------------------------------------------------------------------------------------------
CPER     23.17   .02         22.62         133.6%     -------  ----  -.048   -.11    -.158
---------------------------------------------------------------------------------------------
TAN     71.24  -.57          69.98         30.2%      -------  BLUE  -.023   -.067    -.09
---------------------------------------------------------------------------------------------
UUP       28.61   .09        28.61         8.8%       -------  ----   .369   -.022     .347  +++
---------------------------------------------------------------------------------------------
CORN      23.73   .08        23.1          113%       Bullish  ----   .144   -.089     .055
---------------------------------------------------------------------------------------------
WEAT      6.37   .03         6.06          266.3%     -------  RED    .118   -.137    -.019
---------------------------------------------------------------------------------------------
YINN      37.73   2.27       30.47         1055.4%    Bullish  BLUE   .078   -.199    -.121
|
Table 3       RANKING OF KEY DIRECTORIES BASED PCT.OF STOCKS ABOVE 65-DMA
              6/6/23
 Bullish = 30
 Bearish = 19
---------------------------------------------------------------------------------------
Directory     Current       day-1         day-2         day-3         day-4         day-5
----------------------------------------------------------------------------------------
HOMEBLDG       .944          .888          .888          .777          .666          .833
JETS           .769          .615          .769          .615          .538          .538
COMPUTER       .75           .65           .75           .55           .55           .55
SOFTWARE       .732          .678          .678          .607          .625          .607
GUNS           .714          .5            .642          .357          .357          .571
SEMI           .712          .659          .712          .68           .627          .691
HOSPITAL       .692          .615          .615          .461          .384          .384
HIGHPRIC       .688          .675          .679          .549          .48           .541
TRANSP         .684          .526          .631          .526          .368          .578
NIFTY          .681          .613          .704          .681          .59           .522
NASD-100       .68           .64           .65           .57           .54           .53
GREEN          .666          .611          .666          .5            .333          .333
FINANCE        .662          .5            .537          .35           .225          .325
ELECTRON       .654          .593          .684          .616          .571          .609
BEVERAGE       .642          .714          .714          .5            .5            .5
AUTO           .641          .566          .566          .32           .301          .415
GAMING         .631          .473          .473          .368          .315          .368
INDEXES        .621          .567          .605          .4            .308          .372
REIT           .606          .442          .491          .319          .303          .295
ETFS           .6            .509          .6            .418          .327          .4
RUS-1000       .574          .482          .51           .375          .338          .37
BIGBANKS       .571          .285          .285          .285          .142          .428
HACKERS        .562          .5            .562          .562          .562          .562
BIOTECH        .549          .492          .509          .447          .43           .415
DJI-13         .538          .538          .538          .384          .384          .384
CHEM           .534          .418          .465          .186          .186          .186
DOWJONES       .533          .533          .566          .466          .366          .366
FIDSTKS        .532          .485          .514          .402          .337          .396
SP500          .525          .464          .486          .349          .301          .34
INSURANC       .52           .36           .4            .32           .28           .36
==================================================================================================
RETAIL         .5            .413          .456          .304          .282          .304
==================================================================================================
INFRA          .484          .393          .393          .303          .303          .303
MILITARY       .461          .384          .5            .346          .23           .269
INDMATER       .458          .319          .388          .18           .125          .138
SP-100         .455          .411          .433          .355          .266          .333
REGBANKS       .452          .238          .261          .166          .119          .166
LOWPRICE       .392          .369          .358          .323          .295          .292
SOLAR          .375          .312          .375          .312          .25           .25
FOOD           .367          .346          .265          .408          .244          .224
OILGAS         .36           .237          .268          .185          .144          .154
COMODITY       .307          .282          .205          .384          .205          .205
UTILITY        .282          .256          .307          .256          .256          .256
CHINA          .25           .181          .181          .181          .113          .136
GOLD           .222          .222          .222          .377          .2            .133
MARIJUAN       .2            .1            .1            .1            .1            .1
BONDFUND       .172          .172          .16           .16           .114          .068
COAL           .166          .166          .166          .166          0             0
EDU            .166          .166          .166          .166          .166          .166
COPPER         .142          0             0             0             0             0
|
===================================================================================
| |
6/5/2023
|
|
| |
The NIFTY FOUR are
holding up the market. How long can they
remain the leaders? What can
unseat them? They are fully astride powerful,
even epic, forces.
Friday's 800-point advance invited
easy profit-taking. There are still more
potentially bullish events to lift
it back up. Next Tuesday and Wednesday the
June CPI comes out and the FED's
FIMC holds its next meeting. The down-
trend in oil prices suggests
another big CPI drop and the FED has said it
will give real consideration to a
pause in rate hikes.
But we should be concerned about
another market decline. There was no
DJI bounce at the close.
Retail stocks were again in retreat and RETL could
not get back above its resistance.
Semi-conductors pulled back and housing
stocks held where they were, more
or less. So, the housing stocks
could still become leaders again.
Their group has the highest percentage of
of stocks above the 65-dma.
Watch the A/D Line downtrend.
Again there were more new highs than lows,
as on Friday, and there were more
MAXCPs than MINCPs. Even so, without
a break in the downtrending NYSE
A/D Line, the bulls are mainly relying on
four major stocks to keep the
NASDAQ, QQQ and TECL rising. They are
MSFT, GOOG , AAPL and NVDA.
As long as their Closing Powers and
Relative Strength lines are rising,
we have, it may be argued, a NIFTY FOUR
market and the DJI's likely moves
will be minimal.
Watch RETL to see if the most
beaten-down stocks can follow the REGIONAL
BANKs and begin a recovery because
of the Job Growth, Inflation-Subsidence
and a FED pause for the summer in
raising rates. Meanwhile, there are again
enough Bearish MINCPs to go short
with while being long the most bullish MAXCPs
and the NIFTY FOUR. |
|
| |
6/5/2023
2022 PEERLESS DJI, Signals, Indicators Daily DJI Volume
10-DayUp/Down Vol Stoch-20 CCI RSI Pct of All Stocks above 65-dma
Inverted Traders Index
DJI-IPA DJI-OBV Short-Term Rates
NASDAQ S&P OEX NYSE DJ-15 DJ-20 DJI-30
Tiger Index of Big
Banks Bond
Funds Gold Stocks
Housing Stocks
Insurance-Stocks
Regional Banks
Russell-1000
Semi Conductors
Recent 2006 vers-Peerless signals http://tigersoftware.com/oldpeer/UPD90605.bmp
ETFs: DIA QQQ SPY IWM MDY
TNA Short-Term Rates Ten Year Rates PST (Short Treasuries)
DOLLAR-UUP
ALLSTOCKs
COIN (Bit
Coin ETF)
USO-CrudeOil DBO
BLDP FAS GLD HD IBB JETS JNUG KOL NAIL NUGT
NRGU OIH PALL RSX RETL SDS AGQ SLV SOXL TAN TECL TLT TMF TNA
UGA USO China: YINN CHAU
Commodities: CANE
CORN DBC JJC, NIB CORN, CUT (paper)
MOO, NRGU
SOYB WEAT UUP (Dollar) LIT
(Lithium) PALL
(Palladium)
Stocks AA AAPL ADBE ALXN AMAT AMGN AMD AMZN ANET AXON AXP
BA BABA BAC BIDU BLDP BSX CAT CDNS CHKP CNX CPB CRM CVX CMG
DE DIS ENPH FB FSLR FTNT GILD GME GOOG GS HD IBM INTU JPM KO KR
LRCX MRK MRNA MOS MSFT NEM NFLX NKE NOC NUE NVDA PANW PG PYPL
QCOM QDEL REGN REV RE SCHW SNOW SO SQUARE TSLA TXN XOM V VRTX
WFC WMT XLE ZM ZOM
HOMEBUILDERS:
NAIL BZH HOV MHO MTH PHM -
REGIONAL BANKS: EGBN
FFIC GBCI HMST
Carl Icahn and associates: IEP
MS JEF
Leveraged Short ETFs:
FAZ - financials, TZA and SRTY- small caps, MZZ - mid caps, TECS -Techs,
SOXS -
semi-conductors LABD
- Biotechs
Bullish MAXCPs http://tigersoftware.com/upping/6-05-2023/Bullish.htm
Bearish MINCPs www.tigersoftware.com/Downing/6-05-2023/BEARISH.htm
|
|
 |
 |
 |
 |
 |
 |

 |
 |
 |
 |
 |
 |
 |
Table 1 - Daily Breadth and Volume Statistics
| NYSE |
Latest Close |
Previous
Close |
Week Ago |
| Issues
traded |
3,074 |
3,065 |
3,082 |
| Advances |
1,041 |
2,547 |
2,056 |
| Declines |
1,913 |
452 |
917 |
| Unchanged |
120 |
66 |
109 |
| New
highs |
50 |
88 |
47 |
| New
lows |
26 |
15 |
75 |
| Adv.
volume* |
319,517,438 |
843,342,405 |
568,597,774 |
| Decl.
volume* |
515,531,918 |
130,113,055 |
240,141,792 |
| Total
volume* |
840,263,405 |
979,528,689 |
815,839,309 |
| Closing
Arms (TRIN)† |
0.72 |
1.20 |
0.85 |
| Block
trades* |
4,043 |
4,566 |
3,878 |
| Adv.
volume |
1,634,377,081 |
3,649,722,918 |
2,648,096,852 |
| Decl.
volume |
2,151,818,641 |
776,045,088 |
1,009,810,721 |
| Total
volume |
3,813,295,269 |
4,454,202,860 |
3,715,466,718 |
| NASDAQ |
Latest Close |
Previous
Close |
Week Ago |
| Issues
traded |
4,620 |
4,608 |
4,627 |
| Advances |
1,768 |
3,241 |
2,840 |
| Declines |
2,656 |
1,186 |
1,563 |
| Unchanged |
196 |
181 |
224 |
| New
highs |
124 |
129 |
123 |
| New
lows |
71 |
54 |
142 |
| Closing
Arms (TRIN)† |
0.71 |
0.82 |
0.72 |
| Block
trades |
24,247 |
21,679 |
22,094 |
| Adv.
volume |
2,074,556,575 |
3,363,379,973 |
3,144,625,265 |
| Decl.
volume |
2,205,548,666 |
1,008,515,235 |
1,243,593,450 |
| Total
volume |
4,344,285,639 |
4,426,760,607 |
4,434,075,788 |
|
Table 2 QUICKSILVER on ETFS - 6/5/2023 ---
     Bullish = 5   COMPQX(.293),  QQQ(+.329), SOXL (+.370), TECL (.573), UUP
     Bearish = 0
ETF       CLOSE     CHANGE    PIVOT-PT  5-dma AROC   CL-PWR  CANDLE  IP21    ITRS    POWER INDEX
==================================================================================================
DIA       336.13  -1.94      330.52        79.7%     Bullish  RED    .17     ----     ----
---------------------------------------------------------------------------------------------
COMPQX    13229.43  -11.34   13017.43      97.2%     Bullish  RED    .218    .075     .293
---------------------------------------------------------------------------------------------
SPY       427.1  -.82        420.18        84%       Bullish  RED    .19     .039     .229
---------------------------------------------------------------------------------------------
QQQ       354.9   .25        349.98        92.7%     Bullish  BLUE   .23     .098     .328
---------------------------------------------------------------------------------------------
MDY       453.4  -4.91       446.18        74%       -------  RED    .127   -.005     .122
---------------------------------------------------------------------------------------------
IWM       179.58  -2.44      175.5         97.1%     Bullish  RED    .119    .007     .126
---------------------------------------------------------------------------------------------
FAS       58.18  -.92        55.7          226%      Bearish  RED    .147    .072     .219
---------------------------------------------------------------------------------------------
RETL      5.52  -.24         5.58         -46.1%     Bearish  RED    .044   -.171    -.127
---------------------------------------------------------------------------------------------
SOXL      20.97  -1.05       22.87        -429.9%    Bullish  RED    .219    .151     .37
---------------------------------------------------------------------------------------------
TECL      47.46  -.87        47.32         92.2%     Bullish  RED    .205    .368     .573
---------------------------------------------------------------------------------------------
IBB       129.47   .49       126.17        93.7%     Bullish  BLUE   .176   -.006     .17
---------------------------------------------------------------------------------------------
GLD       182.14   1.09      182.04        33.5%     Bearish  BLUE  -.085   -.067    -.152
---------------------------------------------------------------------------------------------
DBO       14.11  -.02        13.76        -57.7%     Bearish  RED   -.017   -.004    -.021
---------------------------------------------------------------------------------------------
OIH       267.75  -4.7       256.03        153.6%    -------  RED    .01    -.012    -.002
---------------------------------------------------------------------------------------------
CPER     23.15   .17         22.56         118.8%    -------  BLUE  -.048   -.12     -.168
---------------------------------------------------------------------------------------------
TAN     71.81  -.26          70.81         73.2%     Bullish  ----   .012   -.072    -.06
---------------------------------------------------------------------------------------------
UUP       28.52  -.05        28.56        -12.3%     Bullish  RED    .332   -.024     .308
---------------------------------------------------------------------------------------------
CORN      23.65  -.18        23.2          6.4%      Bullish  RED    .162   -.078     .084
---------------------------------------------------------------------------------------------
WEAT      6.34   .02         6.04          64.7%     -------  ----   .166   -.104     .062
---------------------------------------------------------------------------------------------
YINN      35.46  -.18        30.76         277.1%    -------  BLUE   .056   -.261    -.205
|
 RANKING OF KEY DIRECTORIES BASED PCT.OF STOCKS ABOVE 65-DMA
6/5/23
---------------------------------------------------------------------------------------
Directory     Current       day-1         day-2         day-3         day-4         day-5
----------------------------------------------------------------------------------------
HOMEBLDG       .888          .888          .777          .666          .833          .777
BEVERAGE       .714          .714          .5            .5            .5            .5
SOFTWARE       .678          .696          .607          .625          .607          .607
HIGHPRIC       .675          .679          .549          .48           .536          .545
SEMI           .659          .712          .68           .627          .68           .67
COMPUTER       .65           .75           .55           .55           .55           .55
NASD-100       .64           .65           .57           .54           .53           .58
JETS           .615          .769          .615          .538          .461          .461
NIFTY          .613          .704          .681          .59           .522          .545
GREEN          .611          .666          .5            .333          .333          .388
ELECTRON       .593          .684          .616          .571          .601          .593
HOSPITAL       .571          .571          .428          .357          .357          .357
INDEXES        .567          .605          .4            .308          .372          .383
AUTO           .566          .584          .32           .301          .415          .452
DJI-13         .538          .538          .384          .384          .384          .384
DOWJONES       .533          .566          .466          .366          .366          .333
TRANSP         .526          .631          .526          .368          .578          .526
ETFS           .509          .6            .418          .327          .418          .436
FINANCE        .5            .537          .35           .212          .325          .325
GUNS           .5            .642          .357          .357          .571          .571
HACKERS        .5            .562          .562          .562          .562          .562
BIOTECH        .49           .507          .45           .43           .412          .417
FIDSTKS        .485          .514          .402          .337          .402          .408
RUS-1000       .482          .51           .375          .338          .37           .373
GAMING         .473          .473          .315          .368          .368          .421
SP500          .464          .486          .351          .297          .347          .355
REIT           .442          .483          .327          .311          .278          .237
CHEM           .418          .465          .186          .186          .186          .232
RETAIL         .413          .456          .304          .282          .304          .304
SP-100         .411          .433          .355          .266          .333          .355
INFRA          .393          .393          .303          .303          .303          .303
MILITARY       .384          .5            .346          .23           .269          .269
LOWPRICE       .369          .361          .326          .297          .289          .303
INSURANC       .36           .4            .32           .28           .36           .32
FOOD           .346          .285          .387          .244          .224          .265
INDMATER       .319          .388          .18           .125          .152          .18
SOLAR          .312          .375          .312          .25           .25           .312
BIGBANKS       .285          .285          .285          .142          .428          .428
COMODITY       .282          .23           .358          .205          .205          .23
UTILITY        .256          .307          .256          .256          .256          .23
REGBANKS       .238          .261          .166          .119          .166          .166
OILGAS         .237          .268          .185          .144          .154          .164
GOLD           .222          .222          .377          .2            .133          .155
CHINA          .181          .181          .181          .113          .136          .204
BONDFUND       .172          .149          .16           .126          .08           .034
COAL           .166          .166          .166          0             0             0
EDU            .166          .166          .166          .166          .166          .166
MARIJUAN       .1            .1            .1            .1            .1            0
COPPER         0             0             0             0             0             0
|
==================================================================================
Monday - 6:11 AM
-6/52/2023 DJI
Futures -18 NASDAQ Fulures -9 Data Used - 6/2/2023
| |
6/2/2023
|
|
| |
Having successfully
tested its rising support and 200-day ma near 33000, the DJI
now should need to test its
resistance at 34000. The very fine Jobs' report gave hope
to the bulls that there would be no
recession. The DJI now may be forming an inverted
head and shoulders pattern with a
neckline at at about 34400. Classic technical analysis
warns us that such a move will
require rising volume. As you can see from the index charts,
like the NYSE, volume has been
quite low. Its OBV Line, by itself, is very bearish. So,
a DJI breakout above 34400 seems
unlikely. But first it must probe 34000.
The very positive Jobs number on a
Friday when trading volume is often low led to a
rush by shorts to cover their
positions in beaten-down stocks, especially in the retail
sector. This should
prompt Tiger users to have done some short-covering. Where the
Closing Power and Relative Strength
trendlines were broken, we have advocated that
shorts should be covered.
In addition, when the broken support, as in Macy's shown
below, fails to hold the
stock down and a rally goes above the expected resistance
there, it is best to cover.
This is a "false breakdown".
Presently, there are very few
bearish MINCPs and the number of new lows on the
NYSE dropped sharply,
so no new shorts are advised. Instead look at the many bullish
MAXCPs for ideas. TECL
has the highest power ranking in Table 2. And Home-
Builders are the top group in
Table 3. After a pause to digest Friday's big rise
and traders take note of the
FED's lack of verbal reaction to the Jobs' Report.
I would expect them to resume
their leadership. |
|
| |
6/2/2023
2022 PEERLESS DJI, Signals, Indicators Daily DJI Volume
10-DayUp/Down Vol Stoch-20 CCI RSI Pct of All Stocks above 65-dma
Inverted Traders Index
DJI-IPA DJI-OBV Short-Term Rates
NASDAQ S&P OEX NYSE DJ-15 DJ-20 DJI-30
Tiger Index of Big
Banks Bond
Funds Gold Stocks
Housing Stocks
Insurance-Stocks
Regional Banks
Russell-1000
Semi Conductors
Recent 2006 vers-Peerless signals http://tigersoftware.com/oldpeer/UPD90602.bmp
ETFs: DIA QQQ SPY IWM MDY
TNA Short-Term Rates Ten Year Rates PST (Short Treasuries)
DOLLAR-UUP
ALLSTOCKs
COIN (Bit
Coin ETF)
USO-CrudeOil DBO
BLDP FAS GLD HD IBB JETS JNUG KOL NAIL NUGT
NRGU OIH PALL RSX RETL SDS AGQ SLV SOXL TAN TECL TLT TMF TNA
UGA USO China: YINN CHAU
Commodities: CANE
CORN DBC JJC, NIB CORN, CUT (paper)
MOO, NRGU
SOYB WEAT UUP (Dollar) LIT
(Lithium) PALL
(Palladium)
Stocks AA AAPL ADBE ALXN AMAT AMGN AMD AMZN ANET AXON AXP
BA BABA BAC BIDU BLDP BSX CAT CDNS CHKP CNX CPB CRM CVX CMG
DE DIS ENPH FB FSLR FTNT GILD GME GOOG GS HD IBM INTU JPM KO KR
LRCX MRK MRNA MOS MSFT NEM NFLX NKE NOC NUE NVDA PANW PG PYPL
QCOM QDEL REGN REV RE SCHW SNOW SO SQUARE TSLA TXN XOM V VRTX
WFC WMT XLE ZM ZOM
HOMEBUILDERS:
NAIL BZH HOV MHO MTH PHM -
REGIONAL BANKS: EGBN
FFIC GBCI HMST
Carl Icahn and associates: IEP
MS JEF
Leveraged Short ETFs:
FAZ - financials, TZA and SRTY- small caps, MZZ - mid caps, TECS -Techs,
SOXS -
semi-conductors LABD
- Biotechs
Bullish MAXCPs http://tigersoftware.com/upping/6-02-2023/Bullish.htm
Bearish MINCPs www.tigersoftware.com/Downing/6-02-2023/BEARISH.htm
|
|
 |
 |
 |
 |
 |
 |
 |
 |
 |
 |
 |
 |
 |
Table 1 - Daily Breadth and Volume Statistics
| NYSE |
Latest Close |
Previous
Close |
Week Ago |
| Issues
traded |
3,065 |
3,079 |
3,082 |
| Advances |
2,547 |
2,139 |
2,056 |
| Declines |
452 |
836 |
917 |
| Unchanged |
66 |
104 |
109 |
| New
highs |
88 |
27 |
47 |
| New
lows |
15 |
76 |
75 |
| Adv.
volume* |
843,342,405 |
730,910,005 |
568,597,774 |
| Decl.
volume* |
130,113,055 |
247,019,057 |
240,141,792 |
| Total
volume* |
979,528,689 |
991,296,051 |
815,839,309 |
| Closing
Arms (TRIN)† |
1.20 |
0.86 |
0.85 |
| Block
trades* |
4,566 |
4,609 |
3,878 |
| Adv.
volume |
3,649,722,918 |
3,245,437,069 |
2,648,096,852 |
| Decl.
volume |
776,045,088 |
1,086,468,928 |
1,009,810,721 |
| Total
volume |
4,454,202,860 |
4,391,866,580 |
3,715,466,718 |
| NASDAQ |
Latest Close |
Previous
Close |
Week Ago |
| Issues
traded |
4,608 |
4,613 |
4,627 |
| Advances |
3,241 |
2,929 |
2,840 |
| Declines |
1,186 |
1,473 |
1,563 |
| Unchanged |
181 |
211 |
224 |
| New
highs |
129 |
80 |
123 |
| New
lows |
54 |
123 |
142 |
| Closing
Arms (TRIN)† |
0.82 |
0.89 |
0.72 |
| Block
trades |
21,679 |
23,768 |
22,094 |
| Adv.
volume |
3,363,379,973 |
3,142,921,768 |
3,144,625,265 |
| Decl.
volume |
1,008,515,235 |
1,399,897,837 |
1,243,593,450 |
| Total
volume |
4,426,760,607 |
4,610,319,533 |
4,434,075,788 |
|
Table 2 QUICKSILVER on ETFS - 6/2/2023 ---
     Bullish = 5   COMPQX(.308),  QQQ(+.3368), SOXL (+.525), TECL (.684), UUP
     Bearish = 0
ETF       CLOSE     CHANGE    PIVOT-PT  5-dma AROC   CL-PWR  CANDLE  IP21    ITRS    POWER INDEX
==================================================================================================
DIA       338.07   7.13      330.84        156.4%     -------  BLUE   .22    ====      ====
---------------------------------------------------------------------------------------------
COMPQX    13240.77   139.79  12975.69      209.6%     Bullish  BLUE   .229    .079     .308
---------------------------------------------------------------------------------------------
SPY       427.92   6.1       420.02        158.4%     -------  BLUE   .196    .035     .231
---------------------------------------------------------------------------------------------
QQQ       354.65   2.64      348.4         214.7%     Bullish  BLUE   .233    .103     .336
---------------------------------------------------------------------------------------------
MDY       458.31   14.34     446.78        180.8%     Bearish  BLUE   .113   -.007     .106
---------------------------------------------------------------------------------------------
IWM       182.02   6.37      176.15        224.2%     -------  BLUE   .142    .005     .147
---------------------------------------------------------------------------------------------
FAS       59.1   3.52        55.65         416.9%     Bearish  BLUE   .146    .056     .202
---------------------------------------------------------------------------------------------
RETL      5.76   .63         5.57          298.3%     Bearish  BLUE   .059   -.174    -.115
---------------------------------------------------------------------------------------------
SOXL      22.02  -.14        22.88         663.1%     Bullish  RED    .225    .3       .525
---------------------------------------------------------------------------------------------
TECL      48.33   .85        46.59         579.2%     Bullish  ----   .227    .457     .684
---------------------------------------------------------------------------------------------
IBB       128.98   2.21      127.09        84.5%      Bullish  BLUE   .184   -.01      .174
---------------------------------------------------------------------------------------------
GLD       181.05  -2.71      180.92        23.4%      Bearish  RED   -.082   -.069    -.151
---------------------------------------------------------------------------------------------
DBO       14.13   .31        14.27         10.8%      Bearish  ----   .032   -.019     .013
---------------------------------------------------------------------------------------------
OIH       272.45   13.27     259.8         220.8%     Bullish  BLUE   .059   -.031     .028
---------------------------------------------------------------------------------------------
CPER     22.98   .14         22.61         181.8%     -------  RED   -.048   -.124    -.172
---------------------------------------------------------------------------------------------
TAN     72.07   .59          70.77         102.5%     -------  RED   -.029   -.062    -.091
---------------------------------------------------------------------------------------------
UUP       28.57   .3         28.59        -5.3%       Bullish  BLUE   .376   -.029     .347
---------------------------------------------------------------------------------------------
CORN      23.83   .34        23.62         204.2%     Bullish  BLUE   .205   -.082     .123
---------------------------------------------------------------------------------------------
WEAT      6.32   .1          6.26          154.7%     Bullish  BLUE   .186   -.12      .066
---------------------------------------------------------------------------------------------
YINN      35.64   2.87       33.65         550.8%     -------  BLUE   .051   -.191    -.14
|
Table 3       RANKING OF KEY DIRECTORIES BASED PCT.OF STOCKS ABOVE 65-DMA
              6/2/23
 Bullish = 24
 Bearish = 24
---------------------------------------------------------------------------------------
Directory     Current       day-1         day-2         day-3         day-4         day-5
----------------------------------------------------------------------------------------
HOMEBLDG       .888          .777          .666          .833          .777          .722
JETS           .769          .615          .538          .461          .461          .461
COMPUTER       .75           .55           .55           .55           .55           .5
BEVERAGE       .714          .5            .5            .5            .5            .642
SEMI           .712          .68           .627          .68           .659          .585
NIFTY          .704          .681          .59           .522          .545          .431
SOFTWARE       .696          .625          .625          .607          .607          .517
ELECTRON       .684          .616          .571          .601          .586          .511
HIGHPRIC       .679          .549          .48           .536          .545          .463
NASD-100       .65           .57           .54           .53           .58           .47
GREEN          .647          .47           .294          .352          .411          .411
GUNS           .642          .357          .357          .571          .571          .5
TRANSP         .631          .526          .368          .578          .526          .578
INDEXES        .605          .4            .308          .372          .383          .34
ETFS           .6            .418          .327          .418          .472          .327
AUTO           .584          .339          .301          .415          .452          .32
HOSPITAL       .571          .428          .357          .357          .357          .285
DOWJONES       .566          .466          .366          .366          .333          .233
HACKERS        .562          .562          .562          .562          .562          .562
DJI-13         .538          .384          .384          .384          .384          .153
FINANCE        .537          .35           .212          .312          .325          .275
FIDSTKS        .514          .402          .337          .402          .408          .355
RUS-1000       .51           .375          .338          .37           .371          .324
BIOTECH        .504          .447          .432          .412          .415          .412
===============================================================================================
MILITARY       .5            .346          .23           .269          .269          .23
===============================================================================================
SP500          .486          .351          .299          .342          .361          .301
REIT           .483          .319          .319          .286          .229          .172
GAMING         .473          .315          .315          .421          .421          .368
CHEM           .465          .186          .186          .186          .209          .209
RETAIL         .456          .304          .282          .304          .304          .26
SP-100         .433          .355          .266          .333          .355          .277
INSURANC       .4            .32           .28           .36           .32           .32
INFRA          .393          .303          .303          .303          .303          .303
INDMATER       .388          .18           .125          .152          .152          .166
SOLAR          .375          .312          .25           .25           .312          .312
LOWPRICE       .361          .329          .3            .292          .303          .297
UTILITY        .307          .256          .256          .256          .256          .205
BIGBANKS       .285          .285          .142          .428          .428          .285
FOOD           .285          .408          .224          .224          .265          .244
OILGAS         .268          .185          .144          .154          .164          .185
REGBANKS       .261          .166          .119          .166          .166          .142
COMODITY       .23           .384          .179          .205          .23           .23
GOLD           .222          .377          .2            .133          .155          .155
CHINA          .181          .181          .113          .136          .204          .113
COAL           .166          .166          0             0             0             .166
EDU            .166          .166          .166          .166          .166          .166
BONDFUND       .149          .149          .126          .091          .045          .022
MARIJUAN       .1            .1            .1            .1            0             0
COPPER         0             0             0             0             0             0
|
====================================================================================
Friday - 6:05 AM
-6/2/2023 DJI Futures +150
NASDAQ Fulures +100 Data
Used - 6/1/2023
| |
6/1/2023
|
|
| |
Another very positive jobs number, +339,000, came out today. With the FED
talking about a pause in their program of rate hikes, this has to be bullish. As
you can see from our DJI indicators, a turning upwards in them is beginning. The
Closing Power downtrend on DIA has been slightly broken. So, the DJI ought to
rally past its resistance, its falling 21-day ma, and a rally back to 34000 where the
real resistance is for the blue chips probably lies ahead.
But for six months the DJI has fluctuated, of course, but essentially gone nowhere.
Our approach here has to been to advocate hedging by being long the most bullish
MAXCPs and sell short the weakest MINCPs. That has worked well using the
Closing Power and Relative Strength trendlines to tell us when wide divergence in
these stocks is shifting to another group. Contrast again today the uptrends of the
big AI stocks and best performing chip stocks with collapsing Retail stocks that
make up many of the bearish MINCPs.
It's not hard to see why this is occurring. Retail stocks stocks are
stagnating.
Amazon makes shopping much easier. And the AI stocks are in the early stages
of what will transform our society. I take that to be the real story now. Use
our
tools to take full advantage of this epic opportunity. |
|
| |
6/1/2023
2022 PEERLESS DJI, Signals, Indicators Daily DJI Volume
10-DayUp/Down Vol Stoch-20 CCI RSI Pct of All Stocks above 65-dma
Inverted Traders Index
DJI-IPA DJI-OBV Short-Term Rates
NASDAQ S&P OEX NYSE DJ-15 DJ-20 DJI-30
Tiger Index of Big
Banks Bond
Funds Gold Stocks
Housing Stocks
Insurance-Stocks
Regional Banks
Russell-1000
Semi Conductors
Recent 2006 vers-Peerless signals http://tigersoftware.com/oldpeer/UPD90601.bmp
ETFs: DIA QQQ SPY IWM MDY
TNA Short-Term Rates Ten Year Rates PST (Short Treasuries)
DOLLAR-UUP
ALLSTOCKs
COIN (Bit
Coin ETF)
USO-CrudeOil DBO
BLDP FAS GLD HD IBB JETS JNUG KOL NAIL NUGT
NRGU OIH PALL RSX RETL SDS AGQ SLV SOXL TAN TECL TLT TMF TNA
UGA USO China: YINN CHAU
Commodities: CANE
CORN DBC JJC, NIB CORN, CUT (paper)
MOO, NRGU
SOYB WEAT UUP (Dollar) LIT
(Lithium) PALL
(Palladium)
Stocks AA AAPL ADBE ALXN AMAT AMGN AMD AMZN ANET AXON AXP
BA BABA BAC BIDU BLDP BSX CAT CDNS CHKP CNX CPB CRM CVX CMG
DE DIS ENPH FB FSLR FTNT GILD GME GOOG GS HD IBM INTU JPM KO KR
LRCX MRK MRNA MOS MSFT NEM NFLX NKE NOC NUE NVDA PANW PG PYPL
QCOM QDEL REGN REV RE SCHW SNOW SO SQUARE TSLA TXN XOM V VRTX
WFC WMT XLE ZM ZOM
HOMEBUILDERS:
NAIL BZH HOV MHO MTH PHM -
REGIONAL BANKS: EGBN
FFIC GBCI HMST
Carl Icahn and associates: IEP
MS JEF
Leveraged Short ETFs:
FAZ - financials, TZA and SRTY- small caps, MZZ - mid caps, TECS -Techs,
SOXS -
semi-conductors LABD
- Biotechs
Bullish MAXCPs http://tigersoftware.com/upping/6-01-2023/Bullish.htm
Bearish MINCPs www.tigersoftware.com/Downing/6-01-2023/BEARISH.htm
|
|

 |
 |
 |
 |
 |
 |
 |
 |
 |
 |
 |
 |
 |
 |
 |
 |
Table 1 - Daily Breadth and Volume Statistics
| NYSE |
Latest Close |
Previous
Close |
Week Ago |
| Issues
traded |
3,079 |
3,074 |
3,079 |
| Advances |
2,139 |
1,295 |
1,032 |
| Declines |
836 |
1,687 |
1,936 |
| Unchanged |
104 |
92 |
111 |
| New
highs |
27 |
20 |
33 |
| New
lows |
76 |
117 |
144 |
| Adv.
volume* |
730,910,005 |
833,396,909 |
276,612,236 |
| Decl.
volume* |
247,019,057 |
1,296,896,635 |
627,435,047 |
| Total
volume* |
991,296,051 |
2,163,638,841 |
910,682,649 |
| Closing
Arms (TRIN)† |
0.86 |
1.36 |
1.11 |
| Block
trades* |
4,609 |
5,188 |
4,056 |
| Adv.
volume |
3,245,437,069 |
2,094,542,737 |
1,330,609,180 |
| Decl.
volume |
1,086,468,928 |
3,712,777,380 |
2,780,775,524 |
| Total
volume |
4,391,866,580 |
5,980,675,696 |
4,147,769,236 |
| NASDAQ |
Latest Close |
Previous
Close |
Week Ago |
| Issues
traded |
4,613 |
4,609 |
4,638 |
| Advances |
2,929 |
1,872 |
1,450 |
| Declines |
1,473 |
2,569 |
2,998 |
| Unchanged |
211 |
168 |
190 |
| New
highs |
80 |
51 |
72 |
| New
lows |
123 |
202 |
191 |
| Closing
Arms (TRIN)† |
0.89 |
0.83 |
0.59 |
| Block
trades |
23,768 |
28,124 |
23,448 |
| Adv.
volume |
3,142,921,768 |
2,740,164,476 |
2,059,786,840 |
| Decl.
volume |
1,399,897,837 |
3,112,185,558 |
2,516,743,931 |
| Total
volume |
4,610,319,533 |
5,905,762,188 |
4,651,647,122 |
|
Table 2 QUICKSILVER on ETFS - 6/1/2023 ---
Bullish = 3 QQQ (+.28), SOXL (+.505), TECL (.561)
Bearish = 1 RETL (-.375)
ETF CLOSE CHANGE PIVOT-PT 5-dma AROC CL-PWR CANDLE IP21 ITRS POWER INDEX
==================================================================================================
DIA 330.94 1.42 327.75 44.5% Bearish BLUE .095 ---- -----
---------------------------------------------------------------------------------------------
COMPQX 13100.98 165.69 12698.09 240.5% ------- BLUE .129 .088 .217
---------------------------------------------------------------------------------------------
SPY 421.82 3.97 414.65 128.7% ------- BLUE .113 .041 .154
---------------------------------------------------------------------------------------------
QQQ 352.01 4.02 339.72 296.3% Bullish BLUE .162 .118 .28
---------------------------------------------------------------------------------------------
MDY 443.97 3.82 442.26 17.6% Bearish BLUE -.022 -.026 -.048
---------------------------------------------------------------------------------------------
IWM 175.65 1.88 174.17 3.1% Bearish BLUE .011 -.022 -.011
---------------------------------------------------------------------------------------------
FAS 55.58 1.78 54.51 93.9% Bearish BLUE .052 -.044 .008
---------------------------------------------------------------------------------------------
RETL 5.13 .03 5.44 -609.3% Bearish BLUE -.11 -.266 -.376
---------------------------------------------------------------------------------------------
SOXL 22.16 1.01 19.15 1501.3% Bullish BLUE .192 .313 .505
---------------------------------------------------------------------------------------------
TECL 47.48 1.35 42.99 1006.4% Bullish BLUE .135 .426 .561
---------------------------------------------------------------------------------------------
IBB 126.77 .49 126.84 -98.7% Bearish BLUE .093 -.01 .083
---------------------------------------------------------------------------------------------
GLD 183.76 1.44 180.2 49.9% ------- BLUE .025 .002 .027
---------------------------------------------------------------------------------------------
DBO 13.82 .45 14.1 -218.1% Bearish BLUE -.047 .001 -.046
---------------------------------------------------------------------------------------------
OIH 259.18 12.4 261.12 -169.2% ------- BLUE -.06 -.075 -.135
---------------------------------------------------------------------------------------------
CPER 22.84 .22 22.16 201.1% Bullish BLUE -.051 -.083 -.134
---------------------------------------------------------------------------------------------
TAN 71.48 1.5 70.62 46.7% ------- BLUE -.018 -.051 -.069
---------------------------------------------------------------------------------------------
UUP 28.27 -.34 28.6 -35% Bullish RED .271 -.008 .263
---------------------------------------------------------------------------------------------
CORN 23.49 .39 22.88 99.3% Bullish BLUE .216 -.058 .158
---------------------------------------------------------------------------------------------
WEAT 6.22 .16 6.13 73.5% Bullish ---- .23 -.114 .116
---------------------------------------------------------------------------------------------
YINN 32.77 2.3 32.12 -237.1% ------- BLUE .076 -.216 -.14
---------------------------------------------------------------------------------------------
CORN 23.49 .39 22.88 99.3% Bullish BLUE .216 -.058 .158
---------------------------------------------------------------------------------------------
WEAT 6.22 .16 6.13 73.5% Bullish ---- .23 -.114 .116
---------------------------------------------------------------------------------------------
YINN 32.77 2.3 32.12 -237.1% ------- BLUE .076 -.216 -.14
|
Table 3 RANKING OF KEY DIRECTORIES BASED PCT.OF STOCKS ABOVE 65-DMA
6/1/23
Bullish = 11
Bearish = 36
---------------------------------------------------------------------------------------
Directory Current day-1 day-2 day-3 day-4 day-5
----------------------------------------------------------------------------------------
HOMEBLDG .777 .666 .833 .777 .722 .722
NIFTY .681 .59 .522 .545 .431 .431
SEMI .68 .627 .68 .659 .574 .5
SOFTWARE .625 .642 .607 .607 .535 .571
ELECTRON .616 .571 .601 .586 .503 .458
JETS .615 .538 .461 .461 .461 .461
NASD-100 .57 .54 .53 .58 .47 .48
HACKERS .562 .562 .562 .562 .562 .437
COMPUTER .55 .55 .55 .55 .5 .5
HIGHPRIC .549 .48 .536 .545 .463 .489
TRANSP .526 .368 .578 .526 .578 .578
================================================================================================
BEVERAGE .5 .5 .5 .5 .642 .714
GREEN .5 .333 .333 .388 .388 .444
================================================================================================
DOWJONES .466 .366 .366 .333 .233 .233
=====
BIOTECH .445 .43 .415 .415 .41 .477
HOSPITAL .428 .357 .357 .357 .285 .571
ETFS .418 .327 .418 .472 .363 .381
FOOD .408 .244 .204 .265 .244 .346
FIDSTKS .402 .337 .402 .408 .349 .349
INDEXES .4 .308 .372 .383 .335 .383
COMODITY .384 .205 .179 .23 .23 .307
DJI-13 .384 .384 .384 .384 .153 .153
GOLD .377 .2 .133 .155 .177 .288
RUS-1000 .375 .338 .37 .371 .321 .336
GUNS .357 .357 .571 .571 .5 .571
SP-100 .355 .266 .333 .355 .277 .322
SP500 .351 .299 .344 .357 .299 .314
FINANCE .35 .212 .312 .312 .262 .262
MILITARY .346 .23 .269 .269 .23 .269
AUTO .339 .32 .415 .452 .32 .32
LOWPRICE .329 .303 .295 .306 .3 .332
INSURANC .32 .28 .36 .32 .32 .32
REIT .319 .311 .295 .237 .163 .188
GAMING .315 .315 .368 .473 .368 .368
SOLAR .312 .25 .25 .312 .312 .312
RETAIL .304 .282 .304 .304 .26 .304
INFRA .303 .303 .303 .303 .303 .303
BIGBANKS .285 .142 .428 .428 .285 .285
UTILITY .256 .256 .256 .256 .205 .282
CHEM .186 .186 .186 .209 .209 .255
OILGAS .185 .144 .154 .164 .185 .309
CHINA .181 .113 .136 .204 .113 .113
INDMATER .18 .125 .152 .152 .166 .208
COAL .166 0 0 0 .166 .166
EDU .166 .166 .166 .166 .166 .166
REGBANKS .166 .119 .166 .166 .142 .166
BONDFUND .149 .114 .091 .057 .034 .022
MARIJUAN .1 .1 .1 0 0 .2
COPPER 0 0 0 0 0 0
|
===================================================================================
===================================================================================
Thursday - 5:56 AM
-6/1/2023 DJI
Futures -108 NASDAQ Fulures -14 Data Used - 5/31/2023
| |
6/31/2023
|
|
| |
The news of a
budget agreement and the prospects of a rate pause "should"
be lifting the DJI now, but it is
not. From a macro-economic point of view,
the curbing of new government
spending will now having a disinflationay impact
on many areas of the economy, which
are heavily dependent on the government.
Meanwhile, interest rates remain
high, too high to encourage private spending.
Retailers are breaking down.
See RETL and some of the weakest stocks in
the group below and among the
bearish MINCPs. Our hedging strategy has
suggesting shorting these.
Meanwhile, oil and gas stocks
are comng down to their yearly lows and OIH and
SLB show potential bearish
head and shoulders patterncy to be unfolding. At the
pump, gas prices keep
falling. This reflects an economic slow-down in the making.
Now even homebuilding stocks
are in retreat from their recent highs. Presumably,
they are finally being hurt
by high interest rates coupled with the possibility of
reduced subsidies to
home-buyers as the Federal Government starts looking for
ways to reduce its spending.
The continued decline of the
key Peerless technical indicators warns us that the
DJI's 200-day ma may be
broken below soon. Additional blue chip selling will
surely follow that event.
With only 1/3 of all stocks
and just 37% of the DJI-30 stocks still above their
65-dma, there appears to be
lots of resistance overhead if a rally should start
again. It would be best
now for us as traders to take advantage of the fact that
there are more than four
times as many new lows as new highs on the NYSE
and the NASDAQ.
We are long the strongest of
the AI stocks and some semi-conductors, but only
provided they do not
show broken Closing Power and Relative Strength
uptrend-liness.
We are mindful of how the DJI made a very significant top in the year
2000, several months
before the NASDAQ did. |
|
| |
5/30/2023
2022 PEERLESS DJI, Signals, Indicators Daily DJI Volume
10-DayUp/Down Vol Stoch-20 CCI RSI Pct of All Stocks above 65-dma
Inverted Traders Index
DJI-IPA DJI-OBV Short-Term Rates
NASDAQ S&P OEX NYSE DJ-15 DJ-20 DJI-30
Tiger Index of Big
Banks Bond
Funds Gold Stocks
Housing Stocks
Insurance-Stocks
Regional Banks
Russell-1000
Semi Conductors
Recent 2006 vers-Peerless signals http://tigersoftware.com/oldpeer/UPD90531.bmp
ETFs: DIA QQQ SPY IWM MDY
TNA Short-Term Rates Ten Year Rates PST (Short Treasuries)
DOLLAR-UUP
ALLSTOCKs
COIN (Bit
Coin ETF)
USO-CrudeOil DBO
BLDP FAS GLD HD IBB JETS JNUG KOL NAIL NUGT
NRGU OIH PALL RSX RETL SDS AGQ SLV SOXL TAN TECL TLT TMF TNA
UGA USO China: YINN CHAU
Commodities: CANE
CORN DBC JJC, NIB CORN, CUT (paper)
MOO, NRGU
SOYB WEAT UUP (Dollar) LIT
(Lithium) PALL
(Palladium)
Stocks AA AAPL ADBE ALXN AMAT AMGN AMD AMZN ANET AXON AXP
BA BABA BAC BIDU BLDP BSX CAT CDNS CHKP CNX CPB CRM CVX CMG
DE DIS ENPH FB FSLR FTNT GILD GME GOOG GS HD IBM INTU JPM KO KR
LRCX MRK MRNA MOS MSFT NEM NFLX NKE NOC NUE NVDA PANW PG PYPL
QCOM QDEL REGN REV RE SCHW SNOW SO SQUARE TSLA TXN XOM V VRTX
WFC WMT XLE ZM ZOM
HOMEBUILDERS:
NAIL BZH HOV MHO MTH PHM -
REGIONAL BANKS: EGBN
FFIC GBCI HMST
Carl Icahn and associates: IEP
MS JEF
Leveraged Short ETFs:
FAZ - financials, TZA and SRTY- small caps, MZZ - mid caps, TECS -Techs,
SOXS -
semi-conductors LABD
- Biotechs
Bullish MAXCPs www.tigersoftware.com/UPPING/5-31-2023/Bullish.htm
Bearish MINCPs www.tigersoftware.com/Downing/5-31-2023/BEARISH.htm
|
|
 |
 |
 |
 |
 |
 |
 |
 |
 |
 |
 |
 |
 |
 |
|
Table 1 - Daily Breadth and Volume Statistics
| NYSE |
Latest Close |
Previous
Close |
Week Ago |
| Issues
traded |
3,074 |
3,094 |
3,067 |
| Advances |
1,295 |
1,408 |
689 |
| Declines |
1,687 |
1,574 |
2,260 |
| Unchanged |
92 |
112 |
118 |
| New
highs |
20 |
51 |
17 |
| New
lows |
117 |
78 |
85 |
| Adv.
volume* |
833,396,909 |
376,997,172 |
178,143,208 |
| Decl.
volume* |
1,296,896,635 |
529,554,481 |
632,330,372 |
| Total
volume* |
2,163,638,841 |
915,012,314 |
817,403,675 |
| Closing
Arms (TRIN)† |
1.36 |
1.11 |
1.01 |
| Block
trades* |
5,188 |
4,405 |
3,905 |
| Adv.
volume |
2,094,542,737 |
1,865,274,680 |
857,089,047 |
| Decl.
volume |
3,712,777,380 |
2,315,013,569 |
2,842,967,065 |
| Total
volume |
5,980,675,696 |
4,228,511,226 |
3,739,167,215 |
| NASDAQ |
Latest Close |
Previous
Close |
Week Ago |
| Issues
traded |
4,609 |
4,625 |
4,636 |
| Advances |
1,872 |
2,023 |
1,334 |
| Declines |
2,569 |
2,422 |
3,117 |
| Unchanged |
168 |
180 |
185 |
| New
highs |
51 |
128 |
42 |
| New
lows |
202 |
146 |
120 |
| Closing
Arms (TRIN)† |
0.83 |
0.53 |
0.92 |
| Block
trades |
28,124 |
29,530 |
20,696 |
| Adv.
volume |
2,740,164,476 |
2,946,043,776 |
1,282,788,790 |
| Decl.
volume |
3,112,185,558 |
1,859,312,327 |
2,759,159,935 |
| Total
volume |
5,905,762,188 |
4,843,478,184 |
4,088,276,977 |
|
Table 2 QUICKSILVER on ETFS - 5/30/2023 ---
Bullish = 2 SOXL (+.420), TECL (.4923)
Bearish = 3 RETL (-.344, YINN (-.345), OIH (-.268)
ETF CLOSE CHANGE PIVOT-PT 5-dma AROC CL-PWR CANDLE IP21 ITRS POWER INDEX
==================================================================================================
DIA 329.52 -1 328.01 -16.5% Bearish BLUE .062 ---- -----
---------------------------------------------------------------------------------------------
COMPQX 12935.29 -82.14 12484.16 147.1% ------- RED .078 .085 .163
---------------------------------------------------------------------------------------------
SPY 417.85 -2.33 411.09 45.2% Bearish RED .07 .039 .109
---------------------------------------------------------------------------------------------
QQQ 347.99 -1.99 331.65 214.8% ------- RED .12 .115 .235
---------------------------------------------------------------------------------------------
MDY 440.15 -6.03 442.41 -72.9% Bearish RED -.068 -.023 -.091
---------------------------------------------------------------------------------------------
IWM 173.77 -1.73 175.54 -103.8% Bearish RED -.031 -.021 -.052
---------------------------------------------------------------------------------------------
FAS 53.8 -1.9 54.55 -266.1% Bearish RED -.01 -.013 -.023
---------------------------------------------------------------------------------------------
RETL 5.1 -.48 5.8 -646.7% Bearish RED -.094 -.24 -.334
---------------------------------------------------------------------------------------------
SOXL 21.15 -1.72 16.03 1080.7% ------- RED .169 .251 .42
---------------------------------------------------------------------------------------------
TECL 46.13 -1.19 38.56 777.1% ------- RED .084 .408 .492
---------------------------------------------------------------------------------------------
IBB 126.28 .11 129.28 -188.5% Bearish BLUE .02 -.019 .001
---------------------------------------------------------------------------------------------
GLD 182.32 .28 181.95 -30.5% ------- RED .085 -.031 .054
---------------------------------------------------------------------------------------------
DBO 13.37 -.39 14.43 -310.7% Bearish RED -.118 -.019 -.137
---------------------------------------------------------------------------------------------
OIH 246.78 -9.25 267.92 -360% Bearish RED -.175 -.093 -.268
---------------------------------------------------------------------------------------------
CPER 22.62 .06 21.94 49.3% ------- BLUE -.061 -.087 -.148
---------------------------------------------------------------------------------------------
TAN 69.98 -.83 70.82 -81.9% Bearish RED -.115 -.03 -.145
---------------------------------------------------------------------------------------------
UUP 28.61 .05 28.47 42.1% Bullish ---- .06 -.002 .058
---------------------------------------------------------------------------------------------
CORN 23.1 -.1 23.03 21.6% Bullish BLUE .233 -.089 .144
---------------------------------------------------------------------------------------------
WEAT 6.06 .02 6.13 -186.4% Bullish BLUE .173 -.162 .011
---------------------------------------------------------------------------------------------
YINN 30.47 -.29 34.3 -905.2% ------- BLUE .008 -.25 -.242
|
TABLE 1 RANKING OF KEY DIRECTORIES BASED PCT.OF STOCKS ABOVE 65-DMA
5/31/23
Bullish = 9
Bearish = 39
---------------------------------------------------------------------------------------
Directory Current day-1 day-2 day-3 day-4 day-5
----------------------------------------------------------------------------------------
HOMEBLDG .666 .833 .777 .722 .777 .833
big drop
SOFTWARE .642 .625 .607 .535 .571 .553
SEMI .627 .68 .659 .574 .489 .585
NIFTY .59 .522 .545 .431 .431 .545
ELECTRON .571 .601 .586 .503 .451 .511
HACKERS .562 .562 .562 .562 .437 .312
COMPUTER .55 .55 .55 .5 .5 .6
NASD-100 .54 .53 .58 .47 .49 .57
JETS .538 .461 .461 .461 .461 .461
=================================================================================================
BEVERAGE .5 .5 .5 .642 .714 .785
=================================================================================================
HIGHPRIC .48 .536 .545 .463 .484 .536
BIOTECH .427 .412 .417 .41 .475 .527
DJI-13 .384 .384 .384 .153 .153 .384
TRANSP .368 .578 .526 .578 .578 .578
DOWJONES .366 .366 .333 .233 .233 .433
-----
GUNS .357 .571 .571 .5 .571 .642
HOSPITAL .357 .357 .357 .285 .571 .642
RUS-1000 .338 .37 .371 .321 .334 .396
FIDSTKS .337 .402 .408 .349 .349 .431
GREEN .333 .333 .388 .388 .388 .5
ETFS .327 .418 .472 .363 .4 .49
AUTO .32 .433 .452 .32 .32 .433
GAMING .315 .368 .421 .421 .368 .315
REIT .311 .286 .245 .172 .18 .295
INDEXES .308 .372 .383 .335 .383 .427
INFRA .303 .303 .303 .303 .303 .303
LOWPRICE .303 .297 .309 .303 .329 .332
SP500 .299 .344 .359 .295 .318 .388
RETAIL .282 .304 .304 .26 .304 .326
INSURANC .28 .36 .32 .32 .32 .36
SP-100 .266 .333 .355 .277 .322 .388
UTILITY .256 .256 .256 .205 .282 .307
SOLAR .25 .25 .312 .312 .312 .312
FOOD .244 .224 .244 .244 .367 .367
MILITARY .23 .269 .269 .23 .269 .346
FINANCE .212 .312 .312 .25 .262 .312
COMODITY .205 .205 .205 .23 .333 .307
GOLD .2 .133 .155 .177 .333 .377
CHEM .186 .186 .209 .209 .232 .372
EDU .166 .166 .166 .166 .166 .166
OILGAS .144 .154 .164 .185 .298 .309
BIGBANKS .142 .428 .428 .285 .285 .285
INDMATER .125 .152 .152 .166 .208 .277
REGBANKS .119 .166 .166 .142 .142 .166
BONDFUND .114 .08 .057 .045 .034 .068
CHINA .113 .136 .204 .113 .113 .136
MARIJUAN .1 .1 0 0 .2 .2
COAL 0 0 0 .166 .166 .166
COPPER 0 0 0 0 0 0
|
====================================================================================
Wednesday - 5:45 AM -5/31/2023 DJI Futures -162 NASDAQ
Fulures -7 Data Used - 5/30/2023
| |
5/30/202
|
|
| |
Profit-taking today
brought reversals to the high-flying AI and semi-conductor stocks.
Traders using classic rules of technical
analysis will likely continue to take profits.
But the leaders we have been posting
charts of here still show rising Closing Powers
and Relative Strength Lines, so my
counsel is to hold long them for now. Their
leaders MSFT and NVDA will be watched
closely.
Significantly, the DJI is
much weaker. Only 37% of its components are above their
65-dma. This shows ample overhead
resistance is still a factor. Accordingly,
the DJI could not get back above its
21-day and 65-dma today. Almost
all the DJI's internal strength
indicators are falling. So the DJI must again test
its 200-day ma and its rising
price-trendline. Without a major Peerless Buy from
our current version of Peerless, the Sell
S12 still operates and tells us a deeper
decline for much of the market still lies
ahead before late June's typical bullishness
kicks in. To hedge against more of
a decline and the faillure of the Biden-McCarthy
budget compromise being passed by
Congress. Also feeding the bears will be
the FED continuing to "talk
tough" about more rate hikes. So, go short some of
the numerous bearish MINCPs shown
tonight. |
|
| |
5/30/2023
2022 PEERLESS DJI, Signals, Indicators Daily DJI Volume
10-DayUp/Down Vol Stoch-20 CCI RSI Pct of All Stocks above 65-dma
Inverted Traders Index
DJI-IPA DJI-OBV Short-Term Rates
NASDAQ S&P OEX NYSE DJ-15 DJ-20 DJI-30
Tiger Index of Big
Banks Bond
Funds Gold Stocks
Housing Stocks
Insurance-Stocks
Regional Banks
Russell-1000
Semi Conductors
Recent 2006 vers-Peerless signals http://tigersoftware.com/oldpeer/UPD90530.bmp
ETFs: DIA QQQ SPY IWM MDY
TNA Short-Term Rates Ten Year Rates PST (Short Treasuries)
DOLLAR-UUP
ALLSTOCKs
COIN (Bit
Coin ETF)
USO-CrudeOil DBO
BLDP FAS GLD HD IBB JETS JNUG KOL NAIL NUGT
NRGU OIH PALL RSX RETL SDS AGQ SLV SOXL TAN TECL TLT TMF TNA
UGA USO China: YINN CHAU
Commodities: CANE
CORN DBC JJC, NIB CORN, CUT (paper)
MOO, NRGU
SOYB WEAT UUP (Dollar) LIT
(Lithium) PALL
(Palladium)
Stocks AA AAPL ADBE ALXN AMAT AMGN AMD AMZN ANET AXON AXP
BA BABA BAC BIDU BLDP BSX CAT CDNS CHKP CNX CPB CRM CVX CMG
DE DIS ENPH FB FSLR FTNT GILD GME GOOG GS HD IBM INTU JPM KO KR
LRCX MRK MRNA MOS MSFT NEM NFLX NKE NOC NUE NVDA PANW PG PYPL
QCOM QDEL REGN REV RE SCHW SNOW SO SQUARE TSLA TXN XOM V VRTX
WFC WMT XLE ZM ZOM
HOMEBUILDERS:
NAIL BZH HOV MHO MTH PHM -
REGIONAL BANKS: EGBN
FFIC GBCI HMST
Carl Icahn and associates: IEP
MS JEF
Leveraged Short ETFs:
FAZ - financials, TZA and SRTY- small caps, MZZ - mid caps, TECS -Techs,
SOXS -
semi-conductors LABD
- Biotechs
Bullish MAXCPs www.tigersoftware.com/UPPING/5-30-2023/Bullish.htm
Bearish MINCPs www.tigersoftware.com/Downing/5-30-2023/BEARISH.htm
|
|

 |
 |
 |
 |
 |
 |
 |
 |
Table 1 - Daily Breadth and Volume Statistics
| NYSE |
Latest Close |
Previous
Close |
Week Ago |
| Issues
traded |
3,094 |
3,082 |
3,077 |
| Advances |
1,408 |
2,056 |
1,153 |
| Declines |
1,574 |
917 |
1,806 |
| Unchanged |
112 |
109 |
118 |
| New
highs |
51 |
47 |
26 |
| New
lows |
78 |
75 |
31 |
| Adv.
volume* |
376,997,172 |
568,597,774 |
373,164,328 |
| Decl.
volume* |
529,554,481 |
240,141,792 |
508,032,649 |
| Total
volume* |
915,012,314 |
815,839,309 |
892,460,390 |
| Closing
Arms (TRIN)† |
1.11 |
0.85 |
0.80 |
| Block
trades* |
4,405 |
3,878 |
4,136 |
| Adv.
volume |
1,865,274,680 |
2,648,096,852 |
1,817,380,859 |
| Decl.
volume |
2,315,013,569 |
1,009,810,721 |
2,268,485,054 |
| Total
volume |
4,228,511,226 |
3,715,466,718 |
4,155,328,872 |
| NASDAQ |
Latest Close |
Previous
Close |
Week Ago |
| Issues
traded |
4,625 |
4,627 |
4,636 |
| Advances |
2,023 |
2,840 |
1,977 |
| Declines |
2,422 |
1,563 |
2,468 |
| Unchanged |
180 |
224 |
191 |
| New
highs |
128 |
123 |
91 |
| New
lows |
146 |
142 |
77 |
| Closing
Arms (TRIN)† |
0.53 |
0.72 |
1.23 |
| Block
trades |
29,530 |
22,094 |
20,404 |
| Adv.
volume |
2,946,043,776 |
3,144,625,265 |
1,685,752,741 |
| Decl.
volume |
1,859,312,327 |
1,243,593,450 |
2,598,827,477 |
| Total
volume |
4,843,478,184 |
4,434,075,788 |
4,347,444,919 |
|
Table 2 QUICKSILVER on ETFS - 5/26/2023 ---
Bullish = 2 SOXL (+.617), TECL (.563)
Bearish = 1 YINN (-.345)
ETF CLOSE CHANGE PIVOT-PT 5-dma AROC CL-PWR CANDLE IP21 ITRS POWER INDEX
==================================================================================================
DIA 330.52 -.32 330.61 -36.1% Bearish RED .006 ----- -----
---------------------------------------------------------------------------------------------
COMPQX 13017.43 41.74 12560.25 116.9% ------- RED .084 .082 .166
---------------------------------------------------------------------------------------------
SPY 420.18 .16 414.09 16.7% Bearish RED .037 .04 .077
---------------------------------------------------------------------------------------------
QQQ 349.98 1.58 333.36 182.5% ------- RED .134 .108 .242
---------------------------------------------------------------------------------------------
MDY 446.18 -.6 446.64 -56.9% Bearish RED -.079 -.008 -.087
---------------------------------------------------------------------------------------------
IWM 175.5 -.65 177.42 -78.3% Bearish RED -.044 -.013 -.057
---------------------------------------------------------------------------------------------
FAS 55.7 .05 56.75 -288.9% Bearish RED -.048 .043 -.005
---------------------------------------------------------------------------------------------
RETL 5.58 .01 5.83 -297.6% Bearish ---- -.069 -.175 -.244
---------------------------------------------------------------------------------------------
SOXL 22.87 -.01 16.92 1443.1% Bullish RED .237 .38 .617
---------------------------------------------------------------------------------------------
TECL 47.32 .73 39.45 726.6% Bullish RED .123 .44 .563
---------------------------------------------------------------------------------------------
IBB 126.17 -.92 131.11 -192.9% Bearish RED .039 -.024 .015
---------------------------------------------------------------------------------------------
GLD 182.04 1.12 183.43 -32.2% ------- BLUE .075 -.047 .028
---------------------------------------------------------------------------------------------
DBO 13.76 -.51 14.25 -102% Bearish RED -.051 .013 -.038
---------------------------------------------------------------------------------------------
OIH 256.03 -3.77 265.65 -167.5% Bearish BLUE -.105 -.044 -.149
---------------------------------------------------------------------------------------------
CPER 22.56 -.05 22.4 -20.1% Bullish ---- -.161 -.088 -.249
---------------------------------------------------------------------------------------------
TAN 70.81 .04 71.14 -37.4% Bearish RED -.169 -.018 -.187
---------------------------------------------------------------------------------------------
UUP 28.56 -.03 28.37 47.4% Bullish ---- .135 -.025 .11
---------------------------------------------------------------------------------------------
CORN 23.2 -.42 23 123.7% ------- RED .209 -.101 .108
---------------------------------------------------------------------------------------------
WEAT 6.04 -.22 6.29 -72.7% ------- RED .064 -.193 -.129
---------------------------------------------------------------------------------------------
YINN 30.76 -2.89 36.53 -1316.1% Bearish RED -.084 -.261 -.345
|
Table 3 RANKING OF KEY DIRECTORIES BASED PCT.OF STOCKS ABOVE 65-DMA
5/30/23
Bulliah = 11
Bearish = 37
---------------------------------------------------------------------------------------
Directory Current day-1 day-2 day-3 day-4 day-5
----------------------------------------------------------------------------------------
HOMEBLDG .833 .777 .722 .777 .833 .833
SEMI .68 .659 .574 .489 .574 .606
SOFTWARE .625 .625 .535 .571 .553 .607
ELECTRON .601 .586 .503 .451 .503 .526
TRANSP .578 .526 .578 .578 .578 .578
GUNS .571 .571 .5 .571 .642 .714
HACKERS .562 .562 .562 .437 .312 .437
COMPUTER .55 .55 .5 .5 .6 .55
HIGHPRIC .536 .545 .463 .484 .523 .653
NASD-100 .53 .58 .47 .49 .57 .65
NIFTY .522 .545 .431 .431 .568 .659
===================================================================================================
BEVERAGE .5 .5 .642 .714 .785 .785
====================================================================================================
JETS .461 .461 .461 .461 .461 .615
AUTO .433 .471 .32 .32 .433 .49
BIGBANKS .428 .428 .285 .285 .285 .285
ETFS .418 .472 .363 .4 .509 .654
BIOTECH .41 .415 .412 .475 .522 .534
FIDSTKS .402 .408 .349 .349 .426 .52
DJI-13 .384 .384 .153 .153 .384 .384
INDEXES .372 .383 .335 .383 .432 .529
RUS-1000 .37 .371 .321 .334 .394 .455
GAMING .368 .421 .368 .421 .315 .421
DOWJONES .366 .333 .233 .233 .433 .466
=====
INSURANC .36 .32 .32 .32 .36 .44
HOSPITAL .357 .357 .285 .571 .642 .642
SP500 .344 .359 .297 .314 .39 .451
GREEN .333 .388 .388 .388 .555 .555
SP-100 .333 .355 .277 .322 .388 .433
FINANCE .312 .312 .25 .25 .3 .337
RETAIL .304 .304 .26 .304 .326 .326
INFRA .303 .303 .303 .303 .303 .303
LOWPRICE .297 .312 .306 .332 .329 .315
REIT .286 .237 .18 .188 .27 .262
MILITARY .269 .269 .23 .269 .346 .461
UTILITY .256 .256 .205 .282 .307 .358
SOLAR .25 .312 .312 .312 .375 .437
FOOD .224 .265 .224 .367 .367 .448
COMODITY .205 .23 .205 .333 .307 .41
CHEM .186 .209 .209 .232 .372 .372
EDU .166 .166 .166 .166 .166 .166
REGBANKS .166 .166 .142 .142 .166 .142
OILGAS .154 .164 .185 .298 .288 .298
INDMATER .152 .152 .166 .208 .277 .277
CHINA .136 .204 .113 .113 .136 .113
GOLD .133 .155 .177 .333 .4 .466
MARIJUAN .1 0 0 .2 .2 .3
BONDFUND .08 .045 .045 .045 .08 .091
COAL 0 0 .166 .166 .166 .166
COPPER 0 0 0 0 0 0
|
====================================================================================
|
Tuesday - 6:04 AM -5-30/2023
DJI Futures + 6 NASDAQ Fulures + 193 Data Used - 5/26 |
| |
5/26/2023
|
|
| |
The DJI is
still below its 21-day ma and only shows short-term breadth NC buys.
It key indicators are nearly
all falling. But the DJI is not the story here, though
bulls are clearly
hoping Congress will pass the Biden-McCarthy budget accord
and the DJI will then take
off on high volume and complete a bullish inverted
head/shoulders pattern, which
might allow it to play catch up with the rocketing
semi-conductors and AI
stocks, that are real story here.
See how the bullish MAXCPs
are nearly all semi-conductor and AI stocks. And
all these show what may
become breakaway gaps on high volume. Their group
strength is extraordinary.
Until we see contrary evidence, we should hold them tight.
Bull market stocks make
selling very easy. Hold tight. This is the dawning of
the age of artificial
intelligence.
There are not many bearish
MINCPs. And those we are short, we should cover
when their Closing Powers and
Relative Strength Lines break their downtrends.
It is still possible that
Congress will not pass the Biden-McCarthy budget, such
are the political divisions
in America. If that happens I would expect the stocks
that are on the verge of
breaking key support (or have just done so in a minor way)
to sell off badly. The
semi-conductors, SOXL, TECL and QQQ show such
high relative strength
(ITRS), it is not clear that they will fall back much even if
the DJI should reverse back
down. |
|
| |
5/26/2023
2022 PEERLESS DJI, Signals, Indicators Daily DJI Volume
10-DayUp/Down Vol Stoch-20 CCI RSI Pct of All Stocks above 65-dma
Inverted Traders Index
DJI-IPA DJI-OBV Short-Term Rates
NASDAQ S&P OEX NYSE DJ-15 DJ-20 DJI-30
Tiger Index of Big
Banks Bond
Funds Gold Stocks
Housing Stocks
Insurance-Stocks
Regional Banks
Russell-1000
Semi Conductors
Recent 2006 vers-Peerless signals http://tigersoftware.com/oldpeer/UPD90526.bmp
ETFs: DIA QQQ SPY IWM MDY
TNA Short-Term Rates Ten Year Rates PST (Short Treasuries)
DOLLAR-UUP
ALLSTOCKs
COIN (Bit
Coin ETF)
USO-CrudeOil DBO
BLDP FAS GLD HD IBB JETS JNUG KOL NAIL NUGT
NRGU OIH PALL RSX RETL SDS AGQ SLV SOXL TAN TECL TLT TMF TNA
UGA USO China: YINN CHAU
Commodities: CANE
CORN DBC JJC, NIB CORN, CUT (paper)
MOO, NRGU
SOYB WEAT UUP (Dollar) LIT
(Lithium) PALL
(Palladium)
Stocks AA AAPL ADBE ALXN AMAT AMGN AMD AMZN ANET AXON AXP
BA BABA BAC BIDU BLDP BSX CAT CDNS CHKP CNX CPB CRM CVX CMG
DE DIS ENPH FB FSLR FTNT GILD GME GOOG GS HD IBM INTU JPM KO KR
LRCX MRK MRNA MOS MSFT NEM NFLX NKE NOC NUE NVDA PANW PG PYPL
QCOM QDEL REGN REV RE SCHW SNOW SO SQUARE TSLA TXN XOM V VRTX
WFC WMT XLE ZM ZOM
HOMEBUILDERS:
NAIL BZH HOV MHO MTH PHM -
REGIONAL BANKS: EGBN
FFIC GBCI HMST
Carl Icahn and associates: IEP
MS JEF
Leveraged Short ETFs:
FAZ - financials, TZA and SRTY- small caps, MZZ - mid caps, TECS -Techs,
SOXS -
semi-conductors LABD
- Biotechs
Bullish MAXCPs www.tigersoftware.com/UPPING/5-26-2023/Bullish.htm
Bearish MINCPs www.tigersoftware.com/Downing/5-26-2023/BEARISH.htm |
|


|
 |
 |
 |
 |
 |
 |
 |
 |
 |
 |
 |
 |
 |
| NYSE |
Latest Close |
Previous
Close |
Week Ago |
| Issues
traded |
3,082 |
3,079 |
3,059 |
| Advances |
2,056 |
1,032 |
1,169 |
| Declines |
917 |
1,936 |
1,776 |
| Unchanged |
109 |
111 |
114 |
| New
highs |
47 |
33 |
75 |
| New
lows |
75 |
144 |
45 |
| Adv.
volume* |
568,597,774 |
276,612,236 |
364,004,690 |
| Decl.
volume* |
240,141,792 |
627,435,047 |
576,404,078 |
| Total
volume* |
815,839,309 |
910,682,649 |
951,484,926 |
| Closing
Arms (TRIN)† |
0.85 |
1.11 |
1.06 |
| Block
trades* |
3,878 |
4,056 |
4,652 |
| Adv.
volume |
2,648,096,852 |
1,330,609,180 |
1,527,583,303 |
| Decl.
volume |
1,009,810,721 |
2,780,775,524 |
2,463,706,674 |
| Total
volume |
3,715,466,718 |
4,147,769,236 |
4,041,907,938 |
| NASDAQ |
Latest Close |
Previous
Close |
Week Ago |
| Issues
traded |
4,627 |
4,638 |
4,586 |
| Advances |
2,840 |
1,450 |
1,976 |
| Declines |
1,563 |
2,998 |
2,364 |
| Unchanged |
224 |
190 |
246 |
| New
highs |
123 |
72 |
108 |
| New
lows |
142 |
191 |
99 |
| Closing
Arms (TRIN)† |
0.72 |
0.59 |
1.15 |
| Block
trades |
22,094 |
23,448 |
19,652 |
| Adv.
volume |
3,144,625,265 |
2,059,786,840 |
1,626,430,713 |
| Decl.
volume |
1,243,593,450 |
2,516,743,931 |
2,235,182,066 |
| Total
volume |
4,434,075,788 |
4,651,647,122 |
3,935,782,307 |
|
Table 2 QUICKSILVER on ETFS - 5/26/2023 ---
Bullish = 3 QQQ(+.33), SOXL (+.708), TECL (.672)
Bearish = 1 RETL (-.309)
ETF CLOSE CHANGE PIVOT-PT 5-dma AROC CL-PWR CANDLE IP21 ITRS POWER INDEX
==================================================================================================
DIA 330.84 3.09 332.9 -50.7% Bearish BLUE .045 ---------------
---------------------------------------------------------------------------------------------
COMPQX 12975.69 277.6 12720.78 125.9% ------- BLUE .16 .084 .244
---------------------------------------------------------------------------------------------
SPY 420.02 5.37 418.79 16.8% ------- BLUE .099 .037 .136
---------------------------------------------------------------------------------------------
QQQ 348.4 8.68 337.64 177.1% Bullish BLUE .221 .112 .333
---------------------------------------------------------------------------------------------
MDY 446.78 4.52 451.25 -22.6% Bearish BLUE -.027 -.018 -.045
---------------------------------------------------------------------------------------------
IWM 176.15 1.98 178.26 1.1% Bearish BLUE .001 -.023 -.022
---------------------------------------------------------------------------------------------
FAS 55.65 1.14 58.94 -259.4% Bearish BLUE -.013 -.051 -.064
---------------------------------------------------------------------------------------------
RETL 5.57 .13 5.92 -259.9% Bearish BLUE -.09 -.219 -.309
---------------------------------------------------------------------------------------------
SOXL 22.88 3.73 17.53 1577.2% Bullish BLUE .338 .37 .708
---------------------------------------------------------------------------------------------
TECL 46.59 3.6 41.25 682.5% Bullish BLUE .247 .425 .672
---------------------------------------------------------------------------------------------
IBB 127.09 .25 131.15 -115.3% ------- BLUE .09 -.021 .069
---------------------------------------------------------------------------------------------
GLD 180.92 .72 183.21 -74.5% ------- RED .064 -.01 .054
---------------------------------------------------------------------------------------------
DBO 14.27 .17 14.05 74.1% Bearish ---- -.015 .045 .03
---------------------------------------------------------------------------------------------
OIH 259.8 -1.32 264.87 -4% Bearish RED -.11 -.045 -.155
---------------------------------------------------------------------------------------------
CPER 22.61 .45 22.65 -71.4% Bearish BLUE -.174 -.065 -.239
---------------------------------------------------------------------------------------------
TAN 70.77 .15 71.34 46.6% ------- BLUE -.094 -.044 -.138
---------------------------------------------------------------------------------------------
UUP 28.59 -.01 28.29 56.3% Bullish ---- .11 -.015 .095
---------------------------------------------------------------------------------------------
CORN 23.62 .74 22.63 296.5% ------- BLUE .272 -.067 .205
------------------------------------------------------------------------------------- --------
WEAT 6.26 .13 6.13 97.3% Bullish ---- .132 -.139 -.007
---------------------------------------------------------------------------------------------
YINN 33.65 1.53 40.06 -635.8% ------- BLUE -.025 -.18 -.205
|
Table 3 RANKING OF KEY DIRECTORIES BASED PCT.OF STOCKS ABOVE 65-DMA
5/26/23
Bullish = 11
Bearish = 37
---------------------------------------------------------------------------------------
Directory Current day-1 day-2 day-3 day-4 day-5
----------------------------------------------------------------------------------------
HOMEBLDG .777 .722 .777 .833 .833 .833
SEMI .659 .574 .489 .574 .574 .553
SOFTWARE .625 .553 .571 .553 .607 .553
ELECTRON .586 .503 .451 .503 .511 .503
NASD-100 .58 .47 .49 .57 .64 .61
GUNS .571 .5 .571 .642 .714 .714
HACKERS .562 .562 .437 .312 .437 .375
COMPUTER .55 .5 .5 .6 .55 .6
HIGHPRIC .545 .463 .484 .523 .645 .601
NIFTY .545 .431 .431 .568 .659 .636
TRANSP .526 .578 .578 .578 .578 .578
==============================================================================================
BEVERAGE .5 .642 .714 .785 .785 .857
==============================================================================================
ETFS .472 .363 .4 .509 .672 .654
AUTO .471 .339 .32 .433 .49 .358
JETS .461 .461 .461 .461 .538 .615
BIGBANKS .428 .285 .285 .285 .285 .142
GAMING .421 .368 .368 .368 .421 .473
BIOTECH .412 .41 .477 .522 .524 .48
FIDSTKS .408 .349 .349 .426 .508 .52
GREEN .388 .388 .388 .555 .555 .444
DJI-13 .384 .153 .153 .384 .384 .538
INDEXES .383 .335 .383 .432 .529 .481
RUS-1000 .371 .321 .334 .394 .446 .43
SP500 .359 .297 .316 .386 .447 .451
HOSPITAL .357 .285 .571 .642 .642 .642
SP-100 .355 .277 .322 .388 .422 .466
DOWJONES .333 .233 .233 .433 .466 .566
INSURANC .32 .32 .32 .36 .44 .52
FINANCE .312 .25 .25 .287 .325 .3
LOWPRICE .312 .309 .335 .332 .315 .303
SOLAR .312 .312 .312 .375 .437 .25
RETAIL .304 .26 .304 .326 .326 .347
INFRA .303 .303 .303 .303 .303 .303
MILITARY .269 .23 .269 .346 .423 .384
FOOD .265 .244 .346 .367 .448 .489
UTILITY .256 .205 .282 .307 .358 .333
REIT .237 .172 .196 .278 .254 .229
COMODITY .23 .23 .307 .307 .41 .461
CHEM .209 .209 .232 .372 .372 .348
CHINA .204 .113 .113 .136 .113 .159
EDU .166 .166 .166 .166 .166 .166
REGBANKS .166 .142 .142 .166 .142 .071
OILGAS .164 .185 .298 .288 .278 .216
GOLD .155 .177 .333 .4 .466 .555
INDMATER .152 .166 .208 .277 .277 .236
BONDFUND .045 .034 .045 .091 .103 .08
COAL 0 .166 .166 .166 .166 .166
COPPER 0 0 0 0 0 0
MARIJUAN 0 0 .2 .2 .3 .1
|
====================================================================================
====================================================================================
Friday - 5/26/2023 - 6:10 AM Futures
DJI +40 NASDAQ +65 Data used 5/25/2023
| |
5/25/2023
|
|
| |
The DJI is trying to gather support at its 6-month uptrend-line and
its 200-day ma. The old 2006 version of Peerless has generated a
Buy B8. The Help routine for the old version of Peerless says that
these minor P-I non-confirmation signals work out well about 75%
of the time and are quite capable of bringing a rally to the upper band,
provided the overhead supply of stock from a higher broken support
does not interfere with a rally attempt. Unfortunately for the bulls
who want to trade DIA, we can see there is, in fact, overhead
resistance now at 33000. So, the old B8 signal seems dubious.
Much will depend upon the Biden-McCarthy budget discussions. Bonds
and utilities, which are most sensitive to these developments, are still in
in short-term declines. And RETL, the ETF representing retails stocks,
today broke below well-tested support. Consumers are not confident
and big retailers like Macy's, which broke down, too, have real problems
luring them into the big mall stores.
I have already suggested hedging AI and tech stock longs with shorts
in the weakest retailers. Our MINCPs show many such stocks now.
Meanwhile, the bullish MAXCPs are packed with semi-conductors
that jumped upward today in response to NVDA's much higher
earnings projections. See the fine-looking flat top breakout in SOXL.
See how its volume rose to confirm the breakout. Its upward-trending
Closing Power and Relative Strength Lines should now guide us as to how
long to ride this rally. The very high ITRS, Relative Strength, readings
for TECL, show us that techs generally and artificial intelligence/
semi-conductors, in particular, are where we should be long.
The market as a whole is nowhere near this strong. Only 32%
of all stocks are above their 65-dma. This shows lots of overhead
resistance. The same is true for the DJI.
Not making the headlines is the collapse of the Carl Icahn empire.
See IEP below. This will have far-reaching consequences for the
the stocks he may be forced to sell and for Morgan Stanley which
has bankrolled IEP. |
|
| |
5/25/2023
2022 PEERLESS DJI, Signals, Indicators Daily DJI Volume
10-DayUp/Down Vol Stoch-20 CCI RSI Pct of All Stocks above 65-dma
Inverted Traders Index
DJI-IPA DJI-OBV Short-Term Rates
NASDAQ S&P OEX NYSE DJ-15 DJ-20 DJI-30
Tiger Index of Big
Banks Bond
Funds Gold Stocks
Housing Stocks
Insurance-Stocks
Regional Banks
Russell-1000
Semi Conductors
Recent 2006 vers-Peerless signals http://tigersoftware.com/oldpeer/UPD90525.bmp
ETFs: DIA QQQ SPY IWM MDY
TNA Short-Term Rates Ten Year Rates PST (Short Treasuries)
DOLLAR-UUP
ALLSTOCKs
COIN (Bit
Coin ETF)
USO-CrudeOil DBO
BLDP FAS GLD HD IBB JETS JNUG KOL NAIL NUGT
NRGU OIH PALL RSX RETL SDS AGQ SLV SOXL TAN TECL TLT TMF TNA
UGA USO China: YINN CHAU
Commodities: CANE
CORN DBC JJC, NIB CORN, CUT (paper)
MOO, NRGU
SOYB WEAT UUP (Dollar) LIT
(Lithium) PALL
(Palladium)
Stocks AA AAPL ADBE ALXN AMAT AMGN AMD AMZN ANET AXON AXP
BA BABA BAC BIDU BLDP BSX CAT CDNS CHKP CNX CPB CRM CVX CMG
DE DIS ENPH FB FSLR FTNT GILD GME GOOG GS HD IBM INTU JPM KO KR
LRCX MRK MRNA MOS MSFT NEM NFLX NKE NOC NUE NVDA PANW PG PYPL
QCOM QDEL REGN REV RE SCHW SNOW SO SQUARE TSLA TXN XOM V VRTX
WFC WMT XLE ZM ZOM
HOMEBUILDERS:
NAIL BZH HOV MHO MTH PHM -
REGIONAL BANKS: EGBN
FFIC GBCI HMST
Carl Icahn and associates: IEP
MS JEF
Leveraged Short ETFs:
FAZ - financials, TZA and SRTY- small caps, MZZ - mid caps, TECS -Techs,
SOXS -
semi-conductors LABD
- Biotechs
Bullish MAXCPs www.tigersoftware.com/UPPING/5-25-2023/Bullish.htm
Bearish MINCPs www.tigersoftware.com/Downing/5-25-2023/BEARISH.htm
|
|

 |
 |
 |
 |
 |
 |
 |
 |
 |
 |
Table 1 - Daily Breadth
and Volume Statistics
| NYSE |
Latest Close |
Previous
Close |
Week Ago |
| Issues
traded |
3,079 |
3,067 |
3,068 |
| Advances |
1,032 |
689 |
1,738 |
| Declines |
1,936 |
2,260 |
1,203 |
| Unchanged |
111 |
118 |
127 |
| New
highs |
33 |
17 |
82 |
| New
lows |
144 |
85 |
45 |
| Adv.
volume* |
276,612,236 |
178,143,208 |
498,013,376 |
| Decl.
volume* |
627,435,047 |
632,330,372 |
355,453,366 |
| Total
volume* |
910,682,649 |
817,403,675 |
860,472,520 |
| Closing
Arms (TRIN)† |
1.11 |
1.01 |
1.07 |
| Block
trades* |
4,056 |
3,905 |
3,978 |
| Adv.
volume |
1,330,609,180 |
857,089,047 |
2,260,393,747 |
| Decl.
volume |
2,780,775,524 |
2,842,967,065 |
1,681,914,593 |
| Total
volume |
4,147,769,236 |
3,739,167,215 |
3,980,506,829 |
| NASDAQ |
Latest Close |
Previous
Close |
Week Ago |
| Issues
traded |
4,638 |
4,636 |
4,612 |
| Advances |
1,450 |
1,334 |
2,343 |
| Declines |
2,998 |
3,117 |
2,060 |
| Unchanged |
190 |
185 |
209 |
| New
highs |
72 |
42 |
115 |
| New
lows |
191 |
120 |
103 |
| Closing
Arms (TRIN)† |
0.59 |
0.92 |
0.76 |
| Block
trades |
23,448 |
20,696 |
23,449 |
| Adv.
volume |
2,059,786,840 |
1,282,788,790 |
2,672,573,327 |
| Decl.
volume |
2,516,743,931 |
2,759,159,935 |
1,782,984,298 |
| Total
volume |
4,651,647,122 |
4,088,276,977 |
4,532,890,835 |
|
Table 2 QUICKSILVER on ETFS - 5/25/2023 ---
Bullish = 3 QQQ(+.33), SOXL (+.616), TECL (.665)
Bearish = 1 RETL (-.320)
ETF CLOSE CHANGE PIVOT-PT 5-dma AROC CL-PWR CANDLE IP21 ITRS POWER INDEX
==================================================================================================
DIA 327.75 -.26 334.19 -125% Bearish RED .053 ---------------
---------------------------------------------------------------------------------------------
COMPQX 12698.09 213.93 12657.9 3.7% ------- RED .17 .085 .255
---------------------------------------------------------------------------------------------
SPY 414.65 3.56 418.62 -55% ------- RED .109 .039 .148
---------------------------------------------------------------------------------------------
QQQ 339.72 8.07 336.51 36.5% Bullish BLUE .222 .111 .333
---------------------------------------------------------------------------------------------
MDY 442.26 -.15 448.8 -118.5% Bearish RED -.03 -.017 -.047
---------------------------------------------------------------------------------------------
IWM 174.17 -1.37 176.11 -85.4% Bearish RED .009 -.022 -.013
---------------------------------------------------------------------------------------------
FAS 54.51 -.04 58.59 -416.5% Bearish BLUE 0 -.018 -.018
---------------------------------------------------------------------------------------------
RETL 5.44 -.36 5.87 -934% Bearish RED -.101 -.219 -.32
---------------------------------------------------------------------------------------------
SOXL 19.15 3.12 17.39 432.5% Bullish BLUE .338 .278 .616
---------------------------------------------------------------------------------------------
TECL 42.99 4.43 41.04 227.1% Bullish BLUE .241 .424 .665
---------------------------------------------------------------------------------------------
IBB 126.84 -2.44 130.08 -81.8% ------- RED .111 -.02 .091
---------------------------------------------------------------------------------------------
GLD 180.2 -1.75 183.64 -44.9% ------- RED .086 -.015 .071
---------------------------------------------------------------------------------------------
DBO 14.1 -.33 14.06 -3.5% Bearish RED -.02 .033 .013
---------------------------------------------------------------------------------------------
OIH 261.12 -6.8 260.01 35.3% Bearish RED -.082 -.032 -.114
---------------------------------------------------------------------------------------------
CPER 22.16 .22 22.93 -133.1% Bearish BLUE -.155 -.091 -.246
---------------------------------------------------------------------------------------------
TAN 70.62 -.2 70.11 -10.6% ------- RED -.086 -.061 -.147
---------------------------------------------------------------------------------------------
UUP 28.6 .13 28.27 44.1% Bullish BLUE .088 -.018 .07
---------------------------------------------------------------------------------------------
CORN 22.88 -.15 22.27 143.6% ------- RED .062 -.095 -.033
---------------------------------------------------------------------------------------------
WEAT 6.13 0 6.14 -32.4% Bullish ---- .126 -.162 -.036
---------------------------------------------------------------------------------------------
YINN 32.12 -2.18 38.26 -915.4% ------- RED -.037 -.191 -.228
|
Table 3 RANKING OF KEY DIRECTORIES BASED PCT.OF STOCKS ABOVE 65-DMA
5/25/23
Bullish = 7
Bearish = 40
Only 23% of DJI-30 are above their 30-week ma.
---------------------------------------------------------------------------------------
Directory Current day-1 day-2 day-3 day-4 day-5
----------------------------------------------------------------------------------------
HOMEBLDG .722 .777 .833 .833 .833 .888
BEVERAGE .642 .714 .785 .785 .857 .857
TRANSP .578 .578 .578 .578 .578 .631
SEMI .574 .489 .574 .574 .542 .585
HACKERS .562 .437 .312 .437 .375 .5
SOFTWARE .553 .589 .553 .607 .553 .553
ELECTRON .503 .451 .503 .511 .496 .511
================================================================================================
COMPUTER .5 .5 .6 .55 .6 .55
GUNS .5 .571 .642 .714 .714 .714
================================================================================================
NASD-100 .47 .49 .57 .64 .61 .61
HIGHPRIC .463 .484 .523 .645 .593 .606
JETS .461 .461 .461 .538 .615 .615
NIFTY .431 .431 .568 .659 .636 .613
BIOTECH .407 .475 .524 .524 .48 .455
GREEN .388 .388 .555 .555 .444 .5
GAMING .368 .368 .315 .473 .473 .473
ETFS .363 .4 .509 .672 .672 .618
FIDSTKS .349 .349 .426 .508 .502 .502
AUTO .339 .339 .433 .49 .339 .415
INDEXES .335 .383 .432 .529 .47 .508
RUS-1000 .321 .334 .394 .446 .423 .441
INSURANC .32 .32 .36 .44 .52 .56
SOLAR .312 .312 .375 .437 .25 .312
LOWPRICE .309 .338 .335 .318 .303 .306
INFRA .303 .303 .303 .303 .303 .333
SP500 .297 .316 .388 .443 .451 .443
BIGBANKS .285 .285 .285 .285 .142 .142
HOSPITAL .285 .571 .642 .642 .642 .642
SP-100 .277 .322 .388 .422 .466 .433
RETAIL .26 .304 .326 .326 .347 .434
FINANCE .25 .25 .287 .312 .3 .3
FOOD .244 .367 .346 .448 .489 .408
DOWJONES .233 .233 .433 .466 .566 .5
=====
COMODITY .23 .333 .282 .41 .461 .384
MILITARY .23 .269 .346 .423 .384 .461
CHEM .209 .232 .372 .372 .348 .348
UTILITY .205 .282 .307 .358 .358 .358
OILGAS .185 .298 .288 .278 .206 .185
GOLD .177 .333 .4 .466 .555 .466
REIT .172 .188 .286 .262 .221 .245
COAL .166 .166 .166 .166 .166 .166
EDU .166 .166 .166 .166 .166 .166
INDMATER .166 .208 .277 .277 .236 .263
DJI-13 .153 .153 .384 .384 .538 .461
REGBANKS .142 .142 .166 .142 .071 .119
CHINA .113 .113 .136 .113 .159 .159
BONDFUND .034 .034 .091 .114 .091 .114
COPPER 0 0 0 0 0 0
MARIJUAN 0 .2 .2 .3 .1 .2
|
====================================================================================
Thursday - 5/25/2023 - 6:03 AM Futures DJI -60 NASDAQ +257 Data used 5/24/2023
| |
5/24/2023
|
|
| |
The
weak DJI has dropped down to its still rising 200-day ma. Its falling internals
and the Peerless S12
are vindicated. But the DJIA is not the story. The really
big story today is that
bullish artificial intelligence stocks, especially NVDA,
MSFT and GOOG will
likely make great leaps upward today as NVDA's earnings,
just reported, were 50%
higher than even the bulls expected. As a result, NVDA is
now 25% higher.
Since NVDA is a very big component of the SP-500 and QQQ,
the tech sector should
be up very sharply. One would think that this will help the
market as a whole.
But the budget impasse
remains a bearish force in many sectors. Bonds and utilities
tumbled today.
And the prospects of higher interest rates as a result of a credit default
by the Federal
Government and non-payments to those due payments in June
are weighing heavily on
the Retail secor and now Reits, too. The RETL ETFs remains
on the verge of a
serious price breakdown. Many of its components are already
making new lows.
Watch M (Macy's) in this regard, too.
And then there's Carl
Icahn, who with the help of Jeffers and Morgan Stanley
has for years been
luring in new dividend seekers into to his overpriced but now
collapsing IEP
stock. The problem now is as his stock drops, its threatens huge
margin calls on Icahn
from Morgan Stanley and is also likely to dry up the source
of fresh funds from new
investors to pay the huge IEP dividends, that are presently
$2.00 per share each
quarter. It's hard not to see this as a "Ponzi scheme", which is
being exposed now in a
weak general market, just as always seems to happen.
Icahn has made a lot of
enemies over the years. This ugly story is not going to go
away any time soon.
And it exposes a most unflattering aspect of Wall Street's
inner workings. |
|
| |
5/24/2023
2022 PEERLESS DJI, Signals, Indicators Daily DJI Volume
10-DayUp/Down Vol Stoch-20 CCI RSI Pct of All Stocks above 65-dma
Inverted Traders Index
DJI-IPA DJI-OBV Short-Term Rates
NASDAQ S&P OEX NYSE DJ-15 DJ-20 DJI-30
Tiger Index of Big
Banks Bond
Funds Gold Stocks
Housing Stocks
Insurance-Stocks
Regional Banks
Russell-1000
Semi Conductors
Recent 2006 vers-Peerless signals http://tigersoftware.com/oldpeer/UPD90524.bmp
ETFs: DIA QQQ SPY IWM MDY
TNA Short-Term Rates Ten Year Rates PST (Short Treasuries)
DOLLAR-UUP
ALLSTOCKs
COIN (Bit
Coin ETF)
USO-CrudeOil DBO
BLDP FAS GLD HD IBB JETS JNUG KOL NAIL NUGT
NRGU OIH PALL RSX RETL SDS AGQ SLV SOXL TAN TECL TLT TMF TNA
UGA USO China: YINN CHAU
Commodities: CANE
CORN DBC JJC, NIB CORN, CUT (paper)
MOO, NRGU
SOYB WEAT UUP (Dollar) LIT
(Lithium) PALL
(Palladium)
Stocks AA AAPL ADBE ALXN AMAT AMGN AMD AMZN ANET AXON AXP
BA BABA BAC BIDU BLDP BSX CAT CDNS CHKP CNX CPB CRM CVX CMG
DE DIS ENPH FB FSLR FTNT GILD GME GOOG GS HD IBM INTU JPM KO KR
LRCX MRK MRNA MOS MSFT NEM NFLX NKE NOC NUE NVDA PANW PG PYPL
QCOM QDEL REGN REV RE SCHW SNOW SO SQUARE TSLA TXN XOM V VRTX
WFC WMT XLE ZM ZOM
HOMEBUILDERS:
NAIL BZH HOV MHO MTH PHM -
REGIONAL BANKS: EGBN
FFIC GBCI HMST
Carl Icahn and associates: IEP
MS JEF
Leveraged Short ETFs:
FAZ - financials, TZA and SRTY- small caps, MZZ - mid caps, TECS -Techs,
SOXS -
semi-conductors LABD
- Biotechs
Bullish MAXCPs www.tigersoftware.com/UPPING/5-24-2023/Bullish.htm
Bearish MINCPs www.tigersoftware.com/Downing/5-24-2023/BEARISH.htm
|
|

 |
 |
 |
 |
 |
 |
 |
 |
 |
 |
 |
 |
 |
 |
 |
Table 1 - Daily Breadth and Volume Statistics
| NYSE |
Latest Close |
Previous
Close |
Week Ago |
| Issues
traded |
3,067 |
3,077 |
3,084 |
| Advances |
689 |
1,153 |
2,311 |
| Declines |
2,260 |
1,806 |
675 |
| Unchanged |
118 |
118 |
98 |
| New
highs |
17 |
26 |
56 |
| New
lows |
85 |
31 |
80 |
| Adv.
volume* |
178,143,208 |
373,164,328 |
732,635,114 |
| Decl.
volume* |
632,330,372 |
508,032,649 |
162,863,913 |
| Total
volume* |
817,403,675 |
892,460,390 |
905,944,715 |
| Closing
Arms (TRIN)† |
1.01 |
0.80 |
0.81 |
| Block
trades* |
3,905 |
4,136 |
4,092 |
| Adv.
volume |
857,089,047 |
1,817,380,859 |
3,215,519,800 |
| Decl.
volume |
2,842,967,065 |
2,268,485,054 |
757,689,323 |
| Total
volume |
3,739,167,215 |
4,155,328,872 |
4,039,085,979 |
| NASDAQ |
Latest Close |
Previous
Close |
Week Ago |
| Issues
traded |
4,636 |
4,636 |
4,622 |
| Advances |
1,334 |
1,977 |
3,152 |
| Declines |
3,117 |
2,468 |
1,289 |
| Unchanged |
185 |
191 |
181 |
| New
highs |
42 |
91 |
84 |
| New
lows |
120 |
77 |
144 |
| Closing
Arms (TRIN)† |
0.92 |
1.23 |
0.55 |
| Block
trades |
20,696 |
20,404 |
26,248 |
| Adv.
volume |
1,282,788,790 |
1,685,752,741 |
3,661,205,754 |
| Decl.
volume |
2,759,159,935 |
2,598,827,477 |
816,057,582 |
| Total
volume |
4,088,276,977 |
4,347,444,919 |
4,501,820,354 |
|
Table 2
QUICKSILVER on ETFS - 5/24/2023 --- Bullish = 3 QQQ(+.26), SOXL (+.298), TECL (.445)
Bearish = 2 RETL (-.261), CPER(-.308)
ETF CLOSE CHANGE PIVOT-PT 5-dma AROC CL-PWR CANDLE IP21 ITRS POWER INDEX
==================================================================================================
DIA 328.01 -2.6 336.06 -98.9% Bearish RED -.005 ---------------
---------------------------------------------------------------------------------------------
COMPQX 12484.16 -76.09 12688.84 -6.5% ------- BLUE .112 .074 .186
---------------------------------------------------------------------------------------------
SPY 411.09 -3 419.23 -49.6% ------- RED .065 .031 .096
---------------------------------------------------------------------------------------------
QQQ 331.65 -1.71 337.27 7.9% ------- BLUE .163 .097 .26
---------------------------------------------------------------------------------------------
MDY 442.41 -4.23 452.89 -76.5% Bearish RED -.087 -.031 -.118
---------------------------------------------------------------------------------------------
IWM 175.54 -1.88 177.19 -16.4% Bearish RED -.025 -.024 -.049
---------------------------------------------------------------------------------------------
FAS 54.55 -2.2 59.31 -306% Bearish RED -.043 -.092 -.135
---------------------------------------------------------------------------------------------
RETL 5.8 -.03 6.56 -578.4% Bearish RED -.093 -.168 -.261
---------------------------------------------------------------------------------------------
SOXL 16.03 -.89 17.67 -32.1% Bullish BLUE .263 .035 .298
---------------------------------------------------------------------------------------------
TECL 38.56 -.89 41.16 -27.3% ------- BLUE .161 .284 .445
---------------------------------------------------------------------------------------------
IBB 129.28 -1.83 128.97 -1.9% ------- RED .126 0 .126
---------------------------------------------------------------------------------------------
GLD 181.95 -1.48 181.84 -62.2% ------- RED .09 .011 .101
---------------------------------------------------------------------------------------------
DBO 14.43 .18 14.11 74.3% Bearish ---- -.083 .019 -.064
---------------------------------------------------------------------------------------------
OIH 267.92 2.27 259.26 233.8% Bearish BLUE -.129 -.073 -.202
---------------------------------------------------------------------------------------------
CPER 21.94 -.46 22.76 -246% Bearish RED -.186 -.122 -.308
---------------------------------------------------------------------------------------------
TAN 70.82 -.32 70.77 -59.2% ------- ---- -.162 -.082 -.244
---------------------------------------------------------------------------------------------
UUP 28.47 .1 28.35 58.3% Bullish BLUE .094 -.005 .089
---------------------------------------------------------------------------------------------
CORN 23.03 .03 22.23 184.7% ------- ---- .049 -.082 -.033
---------------------------------------------------------------------------------------------
WEAT 6.13 -.16 6.17 -128.9% ------- RED .093 -.15 -.057
---------------------------------------------------------------------------------------------
YINN 34.3 -2.23 39.01 -811.2% ------- RED -.028 -.163 -.191
|
Table 3 RANKING OF KEY DIRECTORIES BASED PCT.OF STOCKS ABOVE 65-DMA
5/24/23
Bullish = 6
Bearish = 42
---------------------------------------------------------------------------------------
Directory Current day-1 day-2 day-3 day-4 day-5
----------------------------------------------------------------------------------------
HOMEBLDG .777 .833 .833 .833 .888 .833
BEVERAGE .714 .785 .785 .857 .857 .857
SOFTWARE .589 .571 .607 .553 .553 .5
TRANSP .578 .578 .578 .578 .631 .578
GUNS .571 .642 .714 .714 .714 .714
HOSPITAL .571 .642 .642 .642 .642 .642
=============================================================================================
COMPUTER .5 .6 .55 .6 .55 .45
=============================================================================================
NASD-100 .49 .57 .64 .61 .61 .55
SEMI .489 .574 .574 .542 .563 .5
HIGHPRIC .484 .523 .645 .593 .61 .567
BIOTECH .472 .522 .527 .48 .45 .497
JETS .461 .461 .538 .615 .615 .615
ELECTRON .451 .503 .511 .496 .496 .458
HACKERS .437 .312 .437 .375 .5 .437
NIFTY .431 .568 .659 .636 .613 .5
ETFS .4 .509 .672 .672 .636 .654
GREEN .388 .555 .555 .444 .5 .666
INDEXES .383 .432 .529 .47 .502 .475
GAMING .368 .315 .421 .526 .473 .473
FOOD .367 .367 .428 .489 .408 .51
FIDSTKS .349 .426 .508 .502 .502 .449
AUTO .339 .452 .49 .339 .396 .358
LOWPRICE .338 .338 .32 .306 .303 .306
RUS-1000 .334 .394 .446 .423 .44 .404
COMODITY .333 .307 .384 .461 .384 .487
GOLD .333 .4 .466 .555 .488 .622
SP-100 .322 .388 .422 .466 .433 .411
INSURANC .32 .36 .44 .52 .56 .48
SP500 .316 .388 .445 .447 .447 .404
SOLAR .312 .375 .437 .25 .312 .312
RETAIL .304 .326 .326 .347 .434 .391
INFRA .303 .303 .303 .303 .333 .333
OILGAS .298 .288 .278 .206 .185 .185
BIGBANKS .285 .285 .285 .142 .142 .142
UTILITY .282 .307 .358 .358 .358 .41
MILITARY .269 .346 .423 .384 .461 .423
FINANCE .25 .287 .312 .287 .3 .287
DOWJONES .233 .433 .466 .566 .5 .466
=====
CHEM .232 .372 .372 .348 .348 .279
INDMATER .208 .277 .277 .236 .25 .222
MARIJUAN .2 .2 .3 .1 .2 .2
REIT .188 .278 .27 .229 .213 .229
COAL .166 .166 .166 .166 .166 0
EDU .166 .166 .166 .166 .166 .166
DJI-13 .153 .384 .384 .538 .461 .461
REGBANKS .142 .166 .142 .071 .119 .119
CHINA .113 .136 .113 .159 .159 .181
BONDFUND .034 .08 .114 .103 .126 .183
COPPER 0 0 0 0 0 0
|
====================================================================================
Wednesday - 5/24/2023 - 6:04 AM Futures DJI -127 NASDAQ -57 Data used 5/23/2023
|
5/23/2023
|
|
|
Now we will see if the 30 blue chips in the DJI can lead the market down like it did
earlier
lead them up. All the DJI's internal strength indicators are falling and we do
still see
an unreversed Peerless Sell. A decline now would be in keeping with the
2011
experience when the Budget talks were stalling as the deadline for Federal
unfunded
payments came due. That brought a 16% DJI decline from the highs then.
A decline
now would also be Wall Street's way of showing the politicians in Washington
DC how
risky a US Government default would be.
Such
"theater" has worked before, as when in 1962, it got JFK to drop taxes sharply
on
corporations and the wealthy to end the the big sell-off of that year. Will it work
now.
Biden and
his comrades may use the XIVth Amendment. That would force the Supreme
Court to
intervene. Would they really stop social security payments, etc? This would
cause a
huge political storm.
33000
is the psychological support that is imperil right now. Below that, there is support
at
the DJI's 200-day ma, a little lower. And the A/D Line will not confirm such a
breakdown.
So,
depending on breadth later this week, we may see a Peerless Buy signal. Much will
depend on whether additional key supports are broken elsewhere in the market, notably
RETL
and Macy's, AMGEN in the DJI, Northrop (NOC) and QCOM, for example.
See
how the leading sectors anticipate a DJI breakdown. Homebuilders fell further.
They,
no doubt, sensed a bigger DJI slide. Short sales in retail stocks will
initiated
if
RETL's key support gives way..
A
breakdown will put much more pressure on the tech leadership. Note the high
ITRS
(relative strength) scores still of the NASDAQ (COMPQX), QQQ and TECL.
Even
MSFT, GOOG and NVDA, the AI leaders should fall back to their 21-day
moving averages. More than that cannot be predicted. Their Closing Powers
and
Relative Strength Lines are still rising.
Watch
how the Icahn drama unfolds. Wall Street depends on investor confidence.
If IEP (Icahn Enterprises) continues to fall, that will mean margin calls on its central
owner, Cark Icahn. If these margin calls cannot be met, look for a breakdown in
Morgan Stanley, one of Wall Street's biggest banks. The press has largely avoided
comparing Icahn with Bernie Madoff-with-all-their money. But a by failure such a
stalwart in Wall Street may lie ahead.
|
|
|
5/23/2023
2022 PEERLESS DJI, Signals, Indicators Daily DJI Volume
10-DayUp/Down Vol Stoch-20 CCI RSI Pct of All Stocks above 65-dma
Inverted Traders Index
DJI-IPA DJI-OBV Short-Term Rates
NASDAQ S&P OEX NYSE DJ-15 DJ-20 DJI-30
Tiger Index of Big
Banks Bond
Funds Gold Stocks
Housing Stocks
Insurance-Stocks
Regional Banks
Russell-1000
Semi Conductors
Recent 2006 vers-Peerless signals http://tigersoftware.com/oldpeer/UPD90523.bmp
ETFs: DIA QQQ SPY IWM MDY
TNA Short-Term Rates Ten Year Rates PST (Short Treasuries)
DOLLAR-UUP
ALLSTOCKs
COIN (Bit
Coin ETF)
USO-CrudeOil DBO
BLDP FAS GLD HD IBB JETS JNUG KOL NAIL NUGT
NRGU OIH PALL RSX RETL SDS AGQ SLV SOXL TAN TECL TLT TMF TNA
UGA USO China: YINN CHAU
Commodities: CANE
CORN DBC JJC, NIB CORN, CUT (paper)
MOO, NRGU
SOYB WEAT UUP (Dollar) LIT
(Lithium) PALL
(Palladium)
Stocks AA AAPL ADBE ALXN AMAT AMGN AMD AMZN ANET AXON AXP
BA BABA BAC BIDU BLDP BSX CAT CDNS CHKP CNX CPB CRM CVX CMG
DE DIS ENPH FB FSLR FTNT GILD GME GOOG GS HD IBM INTU JPM KO KR
LRCX MRK MRNA MOS MSFT NEM NFLX NKE NOC NUE NVDA PANW PG PYPL
QCOM QDEL REGN REV RE SCHW SNOW SO SQUARE TSLA TXN XOM V VRTX
WFC WMT XLE ZM ZOM
HOMEBUILDERS:
NAIL BZH HOV MHO MTH PHM -
REGIONAL BANKS: EGBN
FFIC GBCI HMST
Carl Icahn and associates: IEP
MS JEF
Leveraged Short ETFs:
FAZ - financials, TZA and SRTY- small caps, MZZ - mid caps, TECS -Techs,
SOXS -
semi-conductors LABD
- Biotechs
Bullish MAXCPs www.tigersoftware.com/UPPING/5-23-2023/Bullish.htm
Bearish MINCPs www.tigersoftware.com/Downing/5-23-2023/BEARISH.htm
|
|

 |
 |
 |
 |
 |
Table 1 - Daily Breadth and Volume Statistics
| NYSE |
Latest Close |
Previous
Close |
Week Ago |
| Issues
traded |
3,077 |
3,095 |
3,085 |
| Advances |
1,153 |
1,790 |
610 |
| Declines |
1,806 |
1,192 |
2,387 |
| Unchanged |
118 |
113 |
88 |
| New
highs |
26 |
49 |
36 |
| New
lows |
31 |
35 |
107 |
| Adv.
volume* |
373,164,328 |
507,889,383 |
119,767,156 |
| Decl.
volume* |
508,032,649 |
278,573,612 |
678,542,442 |
| Total
volume* |
892,460,390 |
796,578,521 |
806,142,461 |
| Closing
Arms (TRIN)† |
0.80 |
0.78 |
1.21 |
| Block
trades* |
4,136 |
3,860 |
4,142 |
| Adv.
volume |
1,817,380,859 |
2,404,661,470 |
631,159,289 |
| Decl.
volume |
2,268,485,054 |
1,247,465,866 |
2,997,562,604 |
| Total
volume |
4,155,328,872 |
3,728,529,387 |
3,654,207,076 |
| NASDAQ |
Latest Close |
Previous
Close |
Week Ago |
| Issues
traded |
4,636 |
4,611 |
4,633 |
| Advances |
1,977 |
2,805 |
1,359 |
| Declines |
2,468 |
1,623 |
3,099 |
| Unchanged |
191 |
183 |
175 |
| New
highs |
91 |
112 |
69 |
| New
lows |
77 |
97 |
199 |
| Closing
Arms (TRIN)† |
1.23 |
0.71 |
0.71 |
| Block
trades |
20,404 |
20,643 |
21,540 |
| Adv.
volume |
1,685,752,741 |
3,004,630,251 |
1,517,483,846 |
| Decl.
volume |
2,598,827,477 |
1,231,493,121 |
2,465,149,126 |
| Total
volume |
4,347,444,919 |
4,278,924,432 |
4,067,510,682 |
|
Table 2 QUICKSILVER on ETFS - 5/23/2023 ---
Bullish = 2 SOXL (+.340), TECL (.491)
Bearish = 4 RETL (-.313), OIH(-.266), TAN (-.287), CPER(-.267)
ETF CLOSE CHANGE PIVOT-PT 5-dma AROC CL-PWR CANDLE IP21 ITRS POWER INDEX
===============================================================================================
DIA 330.61 -2.29 334.61 3.9% Bearish RED -.016 ---------------
---------------------------------------------------------------------------------------------
COMPQX 12560.25 -160.53 12500.57 86.3% ------- RED .054 .086 .14
---------------------------------------------------------------------------------------------
SPY 414.09 -4.7 415.23 46.1% Bearish RED .014 .038 .052
---------------------------------------------------------------------------------------------
QQQ 333.36 -4.28 331.12 92.8% ------- RED .097 .11 .207
---------------------------------------------------------------------------------------------
MDY 446.64 -4.61 449.29 58.2% Bearish RED -.107 -.021 -.128
---------------------------------------------------------------------------------------------
IWM 177.42 -.84 176.12 146% Bearish RED -.062 -.013 -.075
---------------------------------------------------------------------------------------------
FAS 56.75 -2.19 58.12 170.8% Bearish RED -.06 -.016 -.076
---------------------------------------------------------------------------------------------
RETL 5.83 -.09 6.51 -145.8% Bearish ---- -.135 -.178 -.313
---------------------------------------------------------------------------------------------
SOXL 16.92 -.61 16.14 558% Bullish RED .17 .17 .34
---------------------------------------------------------------------------------------------
TECL 39.45 -1.8 38.78 268.1% Bullish RED .104 .387 .491
---------------------------------------------------------------------------------------------
IBB 131.11 -.04 129.33 79.8% ------- BLUE .102 .009 .111
---------------------------------------------------------------------------------------------
GLD 183.43 .22 184.23 -39.2% ------- BLUE .143 -.006 .137
---------------------------------------------------------------------------------------------
DBO 14.25 .2 14.22 174.5% Bearish ---- -.135 -.045 -.18
---------------------------------------------------------------------------------------------
OIH 265.65 .78 255.71 321.6% Bearish RED -.173 -.093 -.266
---------------------------------------------------------------------------------------------
CPER 22.4 -.25 23.06 -21.9% ------- RED -.137 -.13 -.267
---------------------------------------------------------------------------------------------
TAN 71.14 -.2 71.66 10.6% ------- RED -.197 -.09 -.287
---------------------------------------------------------------------------------------------
UUP 28.37 .08 28.14 49.6% Bullish ---- .076 -.027 .049
---------------------------------------------------------------------------------------------
CORN 23 .37 22.2 87.1% ------- BLUE .06 -.095 -.035
---------------------------------------------------------------------------------------------
WEAT 6.29 .16 6.29 -160.2% Bearish BLUE .125 -.132 -.007
--------------------------------------------------------------------------------------------
YINN 36.53 -3.53 40.61 -682.7% ------- RED -.033 -.108 -.141
|
Table 3 RANKING OF KEY DIRECTORIES BASED PCT.OF STOCKS ABOVE 65-DMA
5/23/23
BULLISH = 15
Bearish = 34
---------------------------------------------------------------------------------------
Directory Current day-1 day-2 day-3 day-4 day-5
----------------------------------------------------------------------------------------
HOMEBLDG .833 .833 .833 .888 .833 .722
BEVERAGE .785 .785 .857 .857 .857 .785
GUNS .642 .714 .714 .714 .714 .571
HOSPITAL .642 .642 .642 .642 .642 .642
COMPUTER .6 .55 .6 .55 .45 .45
TRANSP .578 .578 .578 .631 .578 .368
SEMI .574 .574 .542 .563 .489 .372
SOFTWARE .571 .625 .553 .553 .5 .446
NASD-100 .57 .64 .61 .61 .55 .5
NIFTY .568 .659 .636 .613 .5 .409
GREEN .555 .555 .444 .5 .666 .5
HIGHPRIC .523 .645 .593 .61 .562 .497
BIOTECH .519 .524 .482 .45 .487 .437
ETFS .509 .672 .672 .636 .672 .581
ELECTRON .503 .511 .496 .496 .451 .383
===============================================================================================
JETS .461 .538 .615 .615 .615 .23
AUTO .452 .509 .339 .396 .358 .207
DOWJONES .433 .466 .566 .5 .466 .366
=====
INDEXES .432 .529 .47 .502 .47 .378
FIDSTKS .426 .508 .502 .502 .449 .378
GOLD .4 .466 .555 .488 .622 .622
RUS-1000 .394 .446 .423 .44 .4 .354
SP-100 .388 .422 .466 .433 .411 .344
SP500 .388 .445 .449 .443 .406 .351
DJI-13 .384 .384 .538 .461 .461 .384
SOLAR .375 .437 .25 .312 .312 .187
CHEM .372 .372 .348 .348 .279 .232
FOOD .367 .448 .469 .408 .489 .469
INSURANC .36 .44 .52 .56 .44 .4
MILITARY .346 .423 .384 .461 .423 .269
LOWPRICE .338 .323 .309 .306 .303 .277
RETAIL .326 .326 .347 .434 .391 .282
GAMING .315 .421 .473 .526 .473 .473
HACKERS .312 .437 .375 .5 .437 .312
COMODITY .307 .41 .435 .384 .461 .461
UTILITY .307 .358 .358 .358 .41 .487
INFRA .303 .303 .303 .333 .333 .333
OILGAS .288 .278 .206 .185 .185 .134
FINANCE .287 .312 .287 .287 .287 .212
BIGBANKS .285 .285 .142 .142 .142 0
REIT .278 .262 .237 .221 .213 .172
INDMATER .277 .277 .236 .25 .208 .194
MARIJUAN .2 .3 .1 .2 .2 .1
COAL .166 .166 .166 .166 0 0
EDU .166 .166 .166 .166 .166 .166
REGBANKS .166 .142 .071 .119 .119 .071
CHINA .136 .113 .159 .159 .181 .181
BONDFUND .08 .103 .103 .137 .195 .229
COPPER 0 0 0 0 0 0
|
===================================================================================
Tuesday - 5/23/2023 - 6:04 AM Futures DJI -80 NASDAQ -20 Data used 5/22/2023
| |
|
|
| |
The market may seem dull and uninteresting. But beneath the calm exterior
that the Dow Jones average offers us, a lot is going on that will have far-reaching
consequences. First, we should not assume that the DJI will continue to
hold up. Besides the still active Peerless Sell, we have to note that all the
major Peerless internal strength indicators show in our DJI and DIA charts
are falling. If the DJI were to break its green uptrendline and its 200-day ma,
a retest of year's lows would technically be expected. And this is what probably
lies ahead if the budget talks remain stalemated and/or Biden resorts to the
14th Amendment to keep Federal checks flowing.
Second, the AI revolution is just starting. Those that take the long view
in MSFT, GOOG and NVDA clearly are not willing to sell right now.
They are holding those shares quite tightly. It is this which explains
the high relative strength of QQQ and TECL, and even SPY.
Third, beaten down regional banks are mounting a potential recovery,
as the FED and Powell avoid talking about another rate hike. But
bond investors are clearly getting scared again both about higher rates
and the dangers of a default to American credit.
Fourth, Carl Icahn, an icon of Wall Street aggressiveness and hedging,
stands accused of running a giant ponzi scheme wherein Piper Jeffries
lured in big dividend-seekers into IEP despite its approaching a certain day of
reckoning because of how over-valued it was in terns of its net assets.
IEP is collaping. See below. Now Morgan Stanley must give Icahn
huge margin calls. Will Icahn have the money to pay the margin calls?
If not, one Wall Street's truly big banks will be torpedoed. This drama
will only hurt share prices.
Fifthly, we see signs from the housing stocks and from Lilly that they
need to pullback, possibly as far as their 65-dma, which is quite a ways
below. Taking some profits in these stocks seems prudent now.
And lastly, we must watch RETL and Macy's, in particular, to see if
they can continue to hold up at their key support levels. If they do not,
the general market will likely be in trouble. |
|
| |
5/22/2023
2022 PEERLESS DJI, Signals, Indicators Daily DJI Volume
10-DayUp/Down Vol Stoch-20 CCI RSI Pct of All Stocks above 65-dma
Inverted Traders Index
DJI-IPA DJI-OBV Short-Term Rates
NASDAQ S&P OEX NYSE DJ-15 DJ-20 DJI-30
Tiger Index of Big
Banks Bond
Funds Gold Stocks
Housing Stocks
Insurance-Stocks
Regional Banks
Russell-1000
Semi Conductors
Recent 2006 vers-Peerless signals http://tigersoftware.com/oldpeer/UPD90522.bmp
ETFs: DIA QQQ SPY IWM MDY
TNA Short-Term Rates Ten Year Rates PST (Short Treasuries)
DOLLAR-UUP
ALLSTOCKs
COIN (Bit
Coin ETF)
USO-CrudeOil DBO
BLDP FAS GLD HD IBB JETS JNUG KOL NAIL NUGT
NRGU OIH PALL RSX RETL SDS AGQ SLV SOXL TAN TECL TLT TMF TNA
UGA USO China: YINN CHAU
Commodities: CANE
CORN DBC JJC, NIB CORN, CUT (paper)
MOO, NRGU
SOYB WEAT UUP (Dollar) LIT
(Lithium) PALL
(Palladium)
Stocks AA AAPL ADBE ALXN AMAT AMGN AMD AMZN ANET AXON AXP
BA BABA BAC BIDU BLDP BSX CAT CDNS CHKP CNX CPB CRM CVX CMG
DE DIS ENPH FB FSLR FTNT GILD GME GOOG GS HD IBM INTU JPM KO KR
LRCX MRK MRNA MOS MSFT NEM NFLX NKE NOC NUE NVDA PANW PG PYPL
QCOM QDEL REGN REV RE SCHW SNOW SO SQUARE TSLA TXN XOM V VRTX
WFC WMT XLE ZM ZOM
HOMEBUILDERS:
NAIL BZH MHO MTH PHM -
REGIONAL BANKS: EGBN
FFIC GBCI HMST
Leveraged Short ETFs:
FAZ - financials, TZA and SRTY- small caps, MZZ - mid caps, TECS -Techs,
SOXS -
semi-conductors LABD
- Biotechs
Bullish MAXCPs www.tigersoftware.com/UPPING/5-22-2023/Bullish.htm
Bearish MINCPs www.tigersoftware.com/Downing/5-22-2023/BEARISH.htm
|
|

 |
 |
 |
 |
 |
 |
 |
 |
 |
 |
 |
 |
|
 |
 |
 |
Table 1 - Daily Breadth and Volume Statistics
| NYSE |
Latest Close |
Previous
Close |
Week Ago |
| Issues
traded |
3,095 |
3,059 |
3,077 |
| Advances |
1,790 |
1,169 |
1,982 |
| Declines |
1,192 |
1,776 |
973 |
| Unchanged |
113 |
114 |
122 |
| New
highs |
49 |
75 |
43 |
| New
lows |
35 |
45 |
58 |
| Adv.
volume* |
507,889,383 |
364,004,690 |
583,267,667 |
| Decl.
volume* |
278,573,612 |
576,404,078 |
212,801,473 |
| Total
volume* |
796,578,521 |
951,484,926 |
800,895,103 |
| Closing
Arms (TRIN)† |
0.78 |
1.06 |
0.71 |
| Block
trades* |
3,860 |
4,652 |
4,074 |
| Adv.
volume |
2,404,661,470 |
1,527,583,303 |
2,623,788,636 |
| Decl.
volume |
1,247,465,866 |
2,463,706,674 |
909,851,800 |
| Total
volume |
3,728,529,387 |
4,041,907,938 |
3,562,172,206 |
| NASDAQ |
Latest Close |
Previous
Close |
Week Ago |
| Issues
traded |
4,611 |
4,586 |
4,644 |
| Advances |
2,805 |
1,976 |
2,887 |
| Declines |
1,623 |
2,364 |
1,564 |
| Unchanged |
183 |
246 |
193 |
| New
highs |
112 |
108 |
77 |
| New
lows |
97 |
99 |
160 |
| Closing
Arms (TRIN)† |
0.71 |
1.15 |
0.77 |
| Block
trades |
20,643 |
19,652 |
20,951 |
| Adv.
volume |
3,004,630,251 |
1,626,430,713 |
2,774,815,595 |
| Decl.
volume |
1,231,493,121 |
2,235,182,066 |
1,162,111,079 |
| Total
volume |
4,278,924,432 |
3,935,782,307 |
3,979,299,123 |
|
Table 2 QUICKSILVER on ETFS - 5/22/2023 ---
Bullish = 3 QQQ (.268), SOXL (+.388), TECL (.611)
Bearish = 3 RETL (-.289), OIH(-.278), TAN (-.264)
ETF CLOSE CHANGE PIVOT-PT 5-dma AROC CL-PWR CANDLE IP21 ITRS POWER INDEX
===============================================================================================
DIA 332.9 -1.29 330.35 -13% Bearish RED .04 ---------------
---------------------------------------------------------------------------------------------
COMPQX 12720.78 62.88 12343.05 142.1% ------- BLUE .098 .101 .199
---------------------------------------------------------------------------------------------
SPY 418.79 .17 410.25 69.6% ------- BLUE .079 .044 .123
---------------------------------------------------------------------------------------------
QQQ 337.64 1.13 327.16 163.5% Bullish BLUE .139 .129 .268
---------------------------------------------------------------------------------------------
MDY 451.25 2.45 441.42 36.9% Bearish BLUE -.059 -.034 -.093
---------------------------------------------------------------------------------------------
IWM 178.26 2.15 172.28 97.8% Bearish BLUE -.013 -.029 -.042
---------------------------------------------------------------------------------------------
FAS 58.94 .35 54.77 222% Bearish RED -.036 -.105 -.141
---------------------------------------------------------------------------------------------
RETL 5.92 .05 6.01 -461% Bearish ---- -.058 -.231 -.289
---------------------------------------------------------------------------------------------
SOXL 17.53 .14 15.05 743.6% Bullish BLUE .182 .206 .388
---------------------------------------------------------------------------------------------
TECL 41.25 .21 37.31 520.5% Bullish BLUE .142 .469 .611
---------------------------------------------------------------------------------------------
IBB 131.15 1.07 129.04 -22.7% ------- BLUE .134 .034 .168
---------------------------------------------------------------------------------------------
GLD 183.21 -.43 184.87 -108.5% ------- ---- .157 .013 .17
---------------------------------------------------------------------------------------------
DBO 14.05 -.01 13.76 64.3% Bearish ---- -.115 -.087 -.202
---------------------------------------------------------------------------------------------
OIH 264.87 4.86 249.07 174.8% Bearish BLUE -.137 -.141 -.278
---------------------------------------------------------------------------------------------
CPER 22.65 -.28 22.5 -76.6% ------- ---- -.121 -.113 -.234
---------------------------------------------------------------------------------------------
TAN 71.34 1.23 70.99 -94.7% ------- BLUE -.148 -.091 -.239
---------------------------------------------------------------------------------------------
UUP 28.29 .02 28.09 47.9% Bullish ---- .052 -.043 .009
---------------------------------------------------------------------------------------------
CORN 22.63 .36 22.61 -97.9% Bullish BLUE .036 -.121 -.085
---------------------------------------------------------------------------------------------
WEAT 6.13 -.01 6.49 -401.8% Bearish ---- .042 -.157 -.115
---------------------------------------------------------------------------------------------
YINN 40.06 1.8 41.99 -384.1% ------- BLUE .034 -.007 .027
|
Table 3 RANKING OF KEY DIRECTORIES BASED PCT.OF STOCKS ABOVE 65-DMA
5/22/23
Bullish = 19
Bearish = 30
---------------------------------------------------------------------------------------
Directory Current day-1 day-2 day-3 day-4 day-5
----------------------------------------------------------------------------------------
HOMEBLDG .833 .833 .888 .833 .666 .777
BEVERAGE .785 .857 .857 .857 .785 .785
GUNS .714 .714 .714 .714 .571 .571
ETFS .672 .672 .636 .672 .581 .672
NIFTY .659 .636 .613 .5 .409 .454
HIGHPRIC .645 .593 .61 .562 .497 .554
HOSPITAL .642 .642 .642 .642 .642 .642
NASD-100 .64 .61 .61 .55 .5 .58
SOFTWARE .625 .571 .553 .5 .446 .464
TRANSP .578 .578 .631 .578 .368 .421
SEMI .574 .542 .563 .489 .361 .382
GREEN .555 .444 .5 .666 .5 .5
COMPUTER .55 .6 .55 .45 .4 .4
JETS .538 .615 .615 .615 .23 .23
INDEXES .529 .47 .502 .47 .378 .486
BIOTECH .524 .48 .452 .487 .435 .48
ELECTRON .511 .496 .496 .451 .368 .375
AUTO .509 .358 .396 .358 .207 .301
FIDSTKS .508 .502 .502 .449 .372 .426
=================================================================================================
DOWJONES .466 .566 .5 .466 .366 .466
=====
GOLD .466 .555 .488 .622 .622 .688
FOOD .448 .489 .387 .489 .469 .489
RUS-1000 .446 .423 .44 .4 .352 .417
SP500 .445 .449 .445 .402 .351 .418
INSURANC .44 .52 .56 .44 .4 .44
HACKERS .437 .375 .5 .437 .312 .375
SOLAR .437 .25 .312 .312 .187 .25
MILITARY .423 .384 .461 .423 .269 .307
SP-100 .422 .466 .433 .411 .344 .4
GAMING .421 .473 .473 .526 .473 .473
COMODITY .41 .461 .358 .461 .461 .461
DJI-13 .384 .538 .461 .461 .384 .461
CHEM .372 .348 .348 .279 .232 .279
UTILITY .358 .358 .358 .41 .487 .641
RETAIL .326 .347 .434 .391 .282 .326
LOWPRICE .323 .312 .309 .306 .275 .286
FINANCE .312 .287 .287 .275 .212 .225
INFRA .303 .303 .333 .333 .333 .393
MARIJUAN .3 .1 .2 .2 .1 .2
BIGBANKS .285 .142 .142 .142 0 0
OILGAS .278 .206 .185 .185 .134 .175
INDMATER .277 .236 .25 .208 .194 .222
REIT .262 .229 .229 .221 .155 .262
COAL .166 .166 .166 0 0 .333
EDU .166 .166 .166 .166 .166 .166
REGBANKS .142 .071 .119 .119 .071 .047
CHINA .113 .159 .159 .181 .181 .181
BONDFUND .103 .091 .137 .206 .252 .252
COPPER 0 0 0 0 0 0
|
===================================================================================
Monday - 5/22/2023 - 6:11 AM Futures DJI +20 NASDAQ -5 Data
used 5/19/2023
| |
5/19/2023
|
|
| |
The Budget
talks between Biden and McCarthy are at center stage. But
meanwhile the divide in the
market between AI stocks, like NVDA, MSFT
and GOOG and the stocks and
bonds dependent on interest rates continues
to widen.
Bonds and bank stocks were
particularly weak on Friday as bears talked
about the calamity of a
failure of the budget talks. Mild profit-taking in the
leading groups, including
home-builders, did not change the bullish fact that
their Closing Powers and
Relative strength lines are still rising.
The 2011 experience shows us
that the DJI will be under pressure until
there is agreement.
That matches the weakening internals the Peerless DJI
chart below shows.
One clue about how the talks
are going will be retail stocks. RETL is testing
its 12 month low, as is
Macy's shown below. The bearish stocks we can
hedge with are still led by
failling regional stocks. But now bonds are again
in the bearish MINCPs list.
Apparently, the FED is expected to again
raise rates, even though the
falling commodity and oil prices would seem
to show that they may have
already won their battle with inflation. As usual,
they will probably over-shoot
their target.
"The Mouse that Roared."
This weekend I found myself
sitting down at my computer ready to work
on the Windows-10 software,
but the screen was frozen and when I re-booted,
the computer was unresponsive
and extraordinarily slow. Lots of problems.
For the next five hours, I
tried to take off the key directories and
save them onto backup
external flash drives. Mostly I resorted to old
DOS commands.
When I was done, I turned on
the back up computer but hooked up the same
mouse to it.
Immediately, the same problems I was having with the main
computer started occurring on
the backup. My first thought was to consider
MSFT had put some sort of
time-set bomb in XPs. Then I realized that the
other common denominator was
the mouse.
With a prayer, I rehooked up
the main computer and used an old mouse
I had in storage.
Suddenly, everything worked fine again. A bad mouse
had caused 5 hours of
frustration. I had never experienced this before.
So, I pass along this little
story in hopes it may help some of my readers. |
|
| |
5/19/2023
2022 PEERLESS DJI, Signals, Indicators Daily DJI Volume
10-DayUp/Down Vol Stoch-20 CCI RSI Pct of All Stocks above 65-dma
Inverted Traders Index
DJI-IPA DJI-OBV Short-Term Rates
NASDAQ S&P OEX NYSE DJ-15 DJ-20 DJI-30
Tiger Index of Big
Banks Bond
Funds Gold Stocks
Housing Stocks
Insurance-Stocks
Regional Banks
Russell-1000
Semi Conductors
Recent 2006 vers-Peerless signals http://tigersoftware.com/oldpeer/UPD90519.bmp
ETFs: DIA QQQ SPY IWM MDY
TNA Short-Term Rates Ten Year Rates PST (Short Treasuries)
DOLLAR-UUP
ALLSTOCKs
COIN (Bit
Coin ETF)
USO-CrudeOil DBO
BLDP FAS GLD HD IBB JETS JNUG KOL NAIL NUGT
NRGU OIH PALL RSX RETL SDS AGQ SLV SOXL TAN TECL TLT TMF TNA
UGA USO China: YINN CHAU
Commodities: CANE
CORN DBC JJC, NIB CORN, CUT (paper)
MOO, NRGU
SOYB WEAT UUP (Dollar) LIT
(Lithium) PALL
(Palladium)
Stocks AA AAPL ADBE ALXN AMAT AMGN AMD AMZN ANET AXON AXP
BA BABA BAC BIDU BLDP BSX CAT CDNS CHKP CNX CPB CRM CVX CMG
DE DIS ENPH FB FSLR FTNT GILD GME GOOG GS HD IBM INTU JPM KO KR
LRCX MRK MRNA MOS MSFT NEM NFLX NKE NOC NUE NVDA PANW PG PYPL
QCOM QDEL REGN REV RE SCHW SNOW SO SQUARE TSLA TXN XOM V VRTX
WFC WMT XLE ZM ZOM
HOMEBUILDERS:
NAIL BZH MHO MTH PHM -
REGIONAL BANKS: EGBN
FFIC GBCI HMST
Leveraged Short ETFs:
FAZ - financials, TZA and SRTY- small caps, MZZ - mid caps, TECS -Techs,
SOXS -
semi-conductors LABD
- Biotechs
Bullish MAXCPs www.tigersoftware.com/UPPING/5-19-2023/Bullish.htm
Bearish MINCPs www.tigersoftware.com/Downing/5-19-2023/BEARISH.htm
|
|

 |
 |
 |
 |
 |
 |
 |
 |
 |
 |
 |
 |
 |
Table 1 - Daily Breadth Volume and Breadth
Statistics
| NYSE |
Latest Close |
Previous
Close |
Week Ago |
| Issues
traded |
3,059 |
3,068 |
3,064 |
| Advances |
1,169 |
1,738 |
1,312 |
| Declines |
1,776 |
1,203 |
1,638 |
| Unchanged |
114 |
127 |
114 |
| New
highs |
75 |
82 |
50 |
| New
lows |
45 |
45 |
118 |
| Adv.
volume* |
364,004,690 |
498,013,376 |
289,687,908 |
| Decl.
volume* |
576,404,078 |
355,453,366 |
468,257,268 |
| Total
volume* |
951,484,926 |
860,472,520 |
775,467,040 |
| Closing
Arms (TRIN)† |
1.06 |
1.07 |
1.34 |
| Block
trades* |
4,652 |
3,978 |
3,813 |
| Adv.
volume |
1,527,583,303 |
2,260,393,747 |
1,291,560,618 |
| Decl.
volume |
2,463,706,674 |
1,681,914,593 |
2,161,681,367 |
| Total
volume |
4,041,907,938 |
3,980,506,829 |
3,533,743,847 |
| NASDAQ |
Latest Close |
Previous
Close |
Week Ago |
| Issues
traded |
4,586 |
4,612 |
4,578 |
| Advances |
1,976 |
2,343 |
1,753 |
| Declines |
2,364 |
2,060 |
2,615 |
| Unchanged |
246 |
209 |
210 |
| New
highs |
108 |
115 |
71 |
| New
lows |
99 |
103 |
250 |
| Closing
Arms (TRIN)† |
1.15 |
0.76 |
1.13 |
| Block
trades |
19,652 |
23,449 |
24,317 |
| Adv.
volume |
1,626,430,713 |
2,672,573,327 |
1,526,197,107 |
| Decl.
volume |
2,235,182,066 |
1,782,984,298 |
2,567,120,591 |
| Total
volume |
3,935,782,307 |
4,532,890,835 |
4,170,003,073 |
|
Table 2 --- QUICKSILVER on ETFS - 5/18/2023 ---
Bullish = 3 QQQ (.275), SOXL (+.306), TECL (.527)
Bearish = 1 RETL (-.352), OIH(-.360), TAN (-.264)
A majority of Closing Powers are bearish.
Only the Dollar is rising.
ETF CLOSE CHANGE PIVOT-PT 5-dma AROC CL-PWR CANDLE IP21 ITRS POWER INDEX
===============================================================================================
DIA 334.19 -1.87 333.77 14.8% Bearish RED .076 ---- -----
---------------------------------------------------------------------------------------------
COMPQX 12657.9 -30.94 12365.21 150% ------- RED .111 .082 .193
---------------------------------------------------------------------------------------------
SPY 418.62 -.61 413.01 84.9% ------- RED .109 .035 .144
---------------------------------------------------------------------------------------------
QQQ 336.51 -.76 326.79 174.2% ------- RED .16 .115 .275
---------------------------------------------------------------------------------------------
MDY 448.8 -4.09 447.94 49.3% Bearish RED -.053 -.061 -.114
---------------------------------------------------------------------------------------------
IWM 176.11 -1.08 174.83 97.1% Bearish RED -.009 -.064 -.073
---------------------------------------------------------------------------------------------
FAS 58.59 -.72 56.39 312% Bearish RED -.026 -.157 -.183
---------------------------------------------------------------------------------------------
RETL 5.87 -.69 6.5 -360.4% Bearish RED -.065 -.287 -.352
---------------------------------------------------------------------------------------------
SOXL 17.39 -.28 15.11 1080.3% Bullish RED .174 .132 .306
---------------------------------------------------------------------------------------------
TECL 41.04 -.12 37.18 620% ------- RED .148 .389 .537
---------------------------------------------------------------------------------------------
IBB 130.08 1.11 131.74 -3.9% ------- BLUE .165 .015 .18
---------------------------------------------------------------------------------------------
GLD 183.64 1.8 187.21 -85.7% ------- BLUE .152 .045 .197
---------------------------------------------------------------------------------------------
DBO 14.06 -.05 13.87 150.9% Bearish RED -.101 -.067 -.168
---------------------------------------------------------------------------------------------
OIH 260.01 .75 255.92 137.7% Bearish RED -.187 -.173 -.36
---------------------------------------------------------------------------------------------
CPER 22.93 .17 23 6.6% Bearish ---- -.067 -.098 -.165
---------------------------------------------------------------------------------------------
TAN 70.11 -.66 72.69 -127.8% Bearish RED -.14 -.124 -.264
---------------------------------------------------------------------------------------------
UUP 28.27 -.08 28.02 30.2% Bullish ---- .023 -.044 -.021
---------------------------------------------------------------------------------------------
CORN 22.27 .04 23.07 -104.1% ------- RED -.015 -.12 -.135
---------------------------------------------------------------------------------------------
WEAT 6.14 -.03 6.64 -195.4% Bearish RED .025 -.13 -.105
---------------------------------------------------------------------------------------------
YINN 38.26 -.75 43.18 -2.5% ------- ---- .09 -.047 .043
|
Table 3 RANKING OF KEY DIRECTORIES BASED PCT.OF STOCKS ABOVE 65-DMA
5/19/23
Bullish = 18
Bearish = 31
---------------------------------------------------------------------------------------
Directory Current day-1 day-2 day-3 day-4 day-5
----------------------------------------------------------------------------------------
BEVERAGE .857 .857 .857 .785 .785 .785
HOMEBLDG .833 .888 .833 .666 .777 .833
GUNS .714 .714 .714 .571 .571 .571
ETFS .672 .636 .672 .581 .69 .581
HOSPITAL .642 .642 .642 .642 .642 .642
NIFTY .636 .613 .5 .409 .454 .386
JETS .615 .615 .615 .23 .23 .23
NASD-100 .61 .61 .55 .5 .57 .52
COMPUTER .6 .55 .45 .4 .4 .25
HIGHPRIC .593 .61 .562 .497 .545 .523
TRANSP .578 .631 .578 .368 .421 .315
SOFTWARE .571 .571 .5 .446 .464 .428
DOWJONES .566 .5 .466 .366 .4 .4
GOLD .555 .488 .622 .622 .666 .666
SEMI .542 .563 .489 .361 .372 .276
DJI-13 .538 .461 .461 .384 .384 .461
INSURANC .52 .56 .44 .4 .44 .48
FIDSTKS .502 .502 .449 .372 .408 .39
=======================================================================================================
ELECTRON .496 .496 .451 .368 .368 .3
FOOD .489 .408 .469 .469 .489 .428
BIOTECH .48 .45 .49 .435 .48 .442
GAMING .473 .473 .473 .526 .473 .473
INDEXES .47 .502 .47 .378 .486 .4
SP-100 .466 .433 .411 .344 .377 .355
COMODITY .461 .384 .435 .461 .461 .435
SP500 .449 .445 .404 .347 .412 .41
GREEN .444 .5 .666 .5 .5 .5
RUS-1000 .423 .44 .4 .352 .411 .399
MILITARY .384 .461 .423 .269 .269 .23
HACKERS .375 .5 .437 .312 .375 .312
AUTO .358 .415 .358 .207 .283 .207
UTILITY .358 .358 .41 .487 .641 .794
CHEM .348 .348 .279 .232 .279 .279
RETAIL .347 .434 .391 .282 .326 .347
LOWPRICE .312 .312 .309 .277 .28 .263
INFRA .303 .333 .333 .333 .363 .363
FINANCE .287 .287 .275 .2 .225 .175
SOLAR .25 .312 .312 .187 .25 .25
INDMATER .236 .25 .208 .194 .222 .208
REIT .229 .221 .229 .163 .229 .286
OILGAS .206 .185 .185 .134 .164 .123
COAL .166 .166 0 0 .333 .166
EDU .166 .166 .166 .166 .166 .166
CHINA .159 .159 .181 .181 .181 .159
BIGBANKS .142 .142 .142 0 0 0
MARIJUAN .1 .2 .2 .1 .2 .2
BONDFUND .091 .126 .206 .264 .264 .241
REGBANKS .071 .119 .119 .071 .047 .071
COPPER 0 0 0 0 0 0
|
====================================================================================
Friday - 5/19/2023 - 6:00 AM Futures DJI +66 NASDAQ -2 Data
used 5/18/2023
| |
One of my heroes when I
lived in Santa Fe long ago has taken his earthly
leave from all of us recently.
Larry Mahon was the finest rodeo wild
bull rider ever. And always a
smiling gentleman, too. When asked what
was the secret of riding a wild bull, he
thought a moments and replied,
"Gettin off the bull is easy.
It's the getting onto the bull that's the hard part".
So, too, in the stock market, getting
aboard the most bullish stocks that
are the first out of the gate is for most
the hard part. And once they
do take a position, it's difficult to
hold onto it. Today, we saw wild ttakeoffs
in the artificial intelligence and
semi-conductor stocks. Sure enough,
making my point, a young writer on Yahoo
immediately proclaimed
stocks like NVDA, MSFT, GOOD and LRCX to
be part of a giant
bubble, thereby inducing some likely very
premature profit-taking.
In 1966 the Fed raised interest rates
because of the inflation that the
war in Vietnam was bringing. But
early in 1967, they relented and
reversed course. This set off a
huge rally in electronics and computer
stocks. With few pullbacks, the
stocks of that era like Control Data
rose day after day. WQXR Radio, in
NYC, kept reporting its hourly advances
from the low 30s to 150 in nine months.
That's what got my attention.
My guess is these stocks could go much
higher if we all get past
the things that seem so bearish now.
Clearly the bulls in these MAXCP stocks
understand that we are on the
threshold of a new era of
artificial intelligence that will change drastically
human lives forevermore and they
want to be in "on the ground floor".
Moreover, the bulls are looking ahead to
when interest rates start falling.
That this day may not be so far off, have
a look at most of the
commodity stocks like soybeans and wheat,
or the ETFs DBc and MOO.
Notice, too, the bearish head and
shoulders in OIH and SLB. Oil
and gas prices are headed down, not up.
For us getting aboard a super explosive
stock is actually not that hard.
Our Tiger screener, the Power Ranker we
use to find the most bullish
MAXCPs and bearish MINCPs, has
highlighted the AI stocks for weeks.
They show major Buy signals, flat topped
breakouts confirmed by rising
Closing Power and Relative Strength.
Most have big bulges of insider buying.
And as for selling, traders can stay
aboard as long as their Closing Powers and
Relative Strength lines are in
uptrends. And when these are broken, watch for them
to find support at their rising 65-dma,
where they can be bought again. |
|
| |
5/18/2023
2022 PEERLESS DJI, Signals, Indicators Daily DJI Volume
10-DayUp/Down Vol Stoch-20 CCI RSI Pct of All Stocks above 65-dma
Inverted Traders Index
DJI-IPA DJI-OBV Short-Term Rates
NASDAQ S&P OEX NYSE DJ-15 DJ-20 DJI-30
Tiger Index of Big
Banks Bond
Funds Gold Stocks
Housing Stocks
Insurance-Stocks
Regional Banks
Russell-1000
Semi Conductors
Recent 2006 vers-Peerless signals http://tigersoftware.com/oldpeer/UPD90518.bmp
ETFs: DIA QQQ SPY IWM MDY
TNA Short-Term Rates Ten Year Rates PST (Short Treasuries)
DOLLAR-UUP
ALLSTOCKs
COIN (Bit
Coin ETF)
USO-CrudeOil DBO
BLDP FAS GLD HD IBB JETS JNUG KOL NAIL NUGT
NRGU OIH PALL RSX RETL SDS AGQ SLV SOXL TAN TECL TLT TMF TNA
UGA USO China: YINN CHAU
Commodities: CANE
CORN DBC JJC, NIB CORN, CUT (paper)
MOO, NRGU
SOYB WEAT UUP (Dollar) LIT
(Lithium) PALL
(Palladium)
Stocks AA AAPL ADBE ALXN AMAT AMGN AMD AMZN ANET AXON AXP
BA BABA BAC BIDU BLDP BSX CAT CDNS CHKP CNX CPB CRM CVX CMG
DE DIS ENPH FB FSLR FTNT GILD GME GOOG GS HD IBM INTU JPM KO KR
LRCX MRK MRNA MOS MSFT NEM NFLX NKE NOC NUE NVDA PANW PG PYPL
QCOM QDEL REGN REV RE SCHW SNOW SO SQUARE TSLA TXN XOM V VRTX
WFC WMT XLE ZM ZOM
HOMEBUILDERS:
NAIL BZH MHO MTH PHM -
REGIONAL BANKS: EGBN
FFIC GBCI HMST
Leveraged Short ETFs:
FAZ - financials, TZA and SRTY- small caps, MZZ - mid caps, TECS -Techs,
SOXS -
semi-conductors LABD
- Biotechs
Bullish MAXCPs www.tigersoftware.com/UPPING/5-18-2023/Bullish.htm
Bearish MINCPs www.tigersoftware.com/Downing/5-18-2023/BEARISH.htm
|
|
Table 1 - Daily Breadth and Volume Statistics
| NYSE |
Latest Close |
Previous
Close |
Week Ago |
| Issues
traded |
3,068 |
3,084 |
3,075 |
| Advances |
1,738 |
2,311 |
927 |
| Declines |
1,203 |
675 |
2,045 |
| Unchanged |
127 |
98 |
103 |
| New
highs |
82 |
56 |
35 |
| New
lows |
45 |
80 |
86 |
| Adv.
volume* |
498,013,376 |
732,635,114 |
243,165,793 |
| Decl.
volume* |
355,453,366 |
162,863,913 |
585,939,340 |
| Total
volume* |
860,472,520 |
905,944,715 |
837,897,447 |
| Closing
Arms (TRIN)† |
1.07 |
0.81 |
1.03 |
| Block
trades* |
3,978 |
4,092 |
4,010 |
| Adv.
volume |
2,260,393,747 |
3,215,519,800 |
1,131,912,469 |
| Decl.
volume |
1,681,914,593 |
757,689,323 |
2,571,459,040 |
| Total
volume |
3,980,506,829 |
4,039,085,979 |
3,752,902,209 |
| NASDAQ |
Latest Close |
Previous
Close |
Week Ago |
| Issues
traded |
4,612 |
4,622 |
4,635 |
| Advances |
2,343 |
3,152 |
1,663 |
| Declines |
2,060 |
1,289 |
2,769 |
| Unchanged |
209 |
181 |
203 |
| New
highs |
115 |
84 |
81 |
| New
lows |
103 |
144 |
218 |
| Closing
Arms (TRIN)† |
0.76 |
0.55 |
0.66 |
| Block
trades |
23,449 |
26,248 |
23,135 |
| Adv.
volume |
2,672,573,327 |
3,661,205,754 |
2,110,896,556 |
| Decl.
volume |
1,782,984,298 |
816,057,582 |
2,316,629,710 |
| Total
volume |
4,532,890,835 |
4,501,820,354 |
4,489,491,713 |
|
Table 2 QUICKSILVER on ETFS - 5/18/2023 ---
Bullish = 2 QQQ (.259), TECL (.463)
Bearish = 1 OIH(-.370)
A majority of Closing Powers are bearish.
ETF CLOSE CHANGE PIVOT-PT 5-dma AROC CL-PWR CANDLE IP21 ITRS POWER INDEX
===============================================================================================
DIA 336.06 1.45 333.2 41% Bearish BLUE .106 ---------------
---------------------------------------------------------------------------------------------
COMPQX 12688.84 188.27 12284.74 145.7% ------- BLUE .109 .073 .182
---------------------------------------------------------------------------------------------
SPY 419.23 4 411.59 86.1% ------- BLUE .123 .028 .151
---------------------------------------------------------------------------------------------
QQQ 337.27 6.15 325.03 169.1% ------- BLUE .15 .109 .259
---------------------------------------------------------------------------------------------
MDY 452.89 3.6 444.39 95% Bearish BLUE -.03 -.064 -.094
---------------------------------------------------------------------------------------------
IWM 177.19 1.07 172.72 118.5% Bearish BLUE .015 -.073 -.058
---------------------------------------------------------------------------------------------
FAS 59.31 1.19 55.05 317.8% Bearish BLUE .003 -.243 -.24
---------------------------------------------------------------------------------------------
RETL 6.56 .05 6.33 78.6% Bearish BLUE .052 -.235 -.183
---------------------------------------------------------------------------------------------
SOXL 17.67 1.53 14.02 1209.8% Bullish BLUE .157 .095 .252
---------------------------------------------------------------------------------------------
TECL 41.16 2.38 36.31 631.6% Bullish BLUE .121 .342 .463
---------------------------------------------------------------------------------------------
IBB 128.97 -.36 130.18 -56.1% ------- RED .141 -.003 .138
---------------------------------------------------------------------------------------------
GLD 181.84 -2.39 186.81 -142.2% ------- RED .118 .056 .174
---------------------------------------------------------------------------------------------
DBO 14.11 -.11 13.64 72% ------- ---- -.123 -.064 -.187
---------------------------------------------------------------------------------------------
OIH 259.26 3.55 253 136.1% Bearish BLUE -.165 -.205 -.37
---------------------------------------------------------------------------------------------
CPER 22.76 -.3 22.9 2.2% Bearish ---- -.076 -.096 -.172
---------------------------------------------------------------------------------------------
TAN 70.77 -.89 71.94 67.2% Bearish RED -.106 -.12 -.226
---------------------------------------------------------------------------------------------
UUP 28.35 .21 28.1 76.6% Bullish BLUE .061 -.032 .029
---------------------------------------------------------------------------------------------
CORN 22.23 .03 22.74 -160.7% Bullish BLUE .062 -.125 -.063
---------------------------------------------------------------------------------------------
WEAT 6.17 -.12 6.39 -132.2% Bearish ---- .032 -.137 -.105
---------------------------------------------------------------------------------------------
YINN 39.01 -1.6 38.28 -296.8% ------ RED .066 -.131 -.065
|
Table 3 RANKING OF KEY DIRECTORIES BASED PCT.OF STOCKS ABOVE 65-DMA
5/18/23
Bullish = 16
Bearish = 30
---------------------------------------------------------------------------------------
Directory Current day-1 day-2 day-3 day-4 day-5
----------------------------------------------------------------------------------------
HOMEBLDG .888 .833 .666 .777 .833 .833
-----
BEVERAGE .857 .857 .785 .785 .785 .857
GUNS .714 .714 .571 .571 .571 .571
HOSPITAL .642 .642 .642 .642 .642 .642
ETFS .636 .672 .581 .69 .6 .618
TRANSP .631 .578 .368 .421 .315 .315
JETS .615 .615 .23 .23 .23 .23
NIFTY .613 .5 .409 .454 .386 .363
HIGHPRIC .61 .562 .497 .545 .523 .523
NASD-100 .61 .55 .5 .57 .52 .53
SOFTWARE .571 .517 .446 .464 .428 .428
SEMI .563 .489 .361 .372 .265 .244
INSURANC .56 .44 .4 .44 .48 .56
COMPUTER .55 .45 .4 .4 .25 .35
FIDSTKS .502 .449 .372 .408 .39 .426
INDEXES .502 .47 .378 .486 .4 .41
---------------------------------------------------------------------------------------------------
DOWJONES .5 .466 .366 .4 .4 .433
GREEN .5 .666 .5 .5 .5 .388
HACKERS .5 .437 .312 .375 .312 .312
---------------------------------------------------------------------------------------------------
ELECTRON .496 .451 .368 .368 .293 .285
GOLD .488 .622 .622 .666 .666 .666
GAMING .473 .473 .473 .526 .473 .473
DJI-13 .461 .461 .384 .384 .461 .461
MILITARY .461 .423 .269 .269 .23 .23
BIOTECH .45 .487 .437 .48 .437 .47
SP500 .445 .404 .349 .408 .412 .412
RUS-1000 .44 .4 .352 .411 .4 .397
RETAIL .434 .391 .282 .326 .347 .369
SP-100 .433 .411 .344 .377 .355 .388
AUTO .415 .377 .207 .283 .207 .226
FOOD .408 .489 .448 .489 .428 .428
COMODITY .384 .461 .435 .461 .435 .435
UTILITY .358 .41 .487 .641 .794 .717
CHEM .348 .279 .232 .279 .279 .279
INFRA .333 .333 .333 .363 .363 .393
LOWPRICE .312 .312 .28 .283 .263 .275
SOLAR .312 .312 .187 .25 .25 .125
FINANCE .287 .275 .2 .212 .175 .212
INDMATER .25 .208 .194 .222 .208 .236
REIT .221 .221 .172 .237 .245 .262
MARIJUAN .2 .2 .1 .2 .2 .1
OILGAS .185 .185 .134 .164 .123 .113
COAL .166 0 0 .333 .166 .166
EDU .166 .166 .166 .166 .166 .166
CHINA .159 .181 .181 .181 .159 .136
BIGBANKS .142 .142 0 0 0 .142
BONDFUND .126 .195 .264 .275 .252 .31
REGBANKS .119 .119 .071 .047 .071 .071
COPPER 0 0 0 0 0 0
|
====================================================================================
Thursday - 5/18/2023 - 5:45 AM Futures DJI -31 NASDAQ +8 Data used 5/17/2023
| |
Data used 5/17/2023
|
|
| |
Driving up the
markets more than 1% on Wednesday were rumors
that President Biden might resort
to issing a $1 trillion platinum coin
for desposit in the US Treasury or
would employ the 14th Amendment
to honor essential Federal debts
next month. In this way he could refuse
accept a budget deficit limit from
Congress. Right or wrong, likely
or not, the rumors powered a
400 point DJI advance. The shorts
have been making lots of money in
the weakest stocks. Today, they
took profits, a little clumsily.
Now we will need to see how DC's
"game of chicken"
will really play out. I am not so optimistic that
an accord will be reached until we
get closer to the June deadline.
See how rallies in the beaten down
regional banks occurred en masse.
Big Banks and Retailers rose nicely
from well-tested support. See how
NOC ralllied and even SCHW.
But most impressive from our hedging
viewpoint were the nice advances
among the strongest stocks in
artifical intelligence,
semi-conductors and home-building. As a result, there
are many more MAXCPs than MINCPs
tonight, even thousgh once again
the number of new lows was greater
by a wide margin than the number
of new lows.
Now the DJI must fight its way back
above its 21-day ma. That is not
made easy without a Peerless Buy
and with so many Peerless internal
strength indicators falling for the
DJI. For months, the DJI has been
going nwhere. Instead of
trading it or SPY or even the NASDAQ or
QQQ long, I have been suggesting
hedging by buying the most bullish
MAXCPs and shorting the weakest
MINCPs. This has been succssful
in most cases. It is the
reason I publish daily the NAXCPs and MINCPs.
But eventually, these will break
their Closing Power and Relative Strength
uptrends and downtrends,
respectively. If their moves have left them
amply over-extended, we should then
take profits, at least that has been
my experience with the short sales
even in a bear market. With the
longs, we can give them more
"slack" and if we really want to let
them run after they have had big
bulges of Accumulation, hold them
until they break their 65-dma with
a negative IP21. |
|
The DJI is still below its 21-day ma
and nearly all its Peerless internal strength indicators
are still failling.

 |
The steep ClosPwr downtrend-line was broken but its 21-day
ma is falling.
a
 |
NASDAQ and QQQ recovery highs were confirmed by their Closing Power.
 |
 |
| Leaders were AI stocks , semi-conductors and Home-Bulding Stocks. |
 |
 |
 |
The prospects of
lower fuel prices should propel airlines stocks upwards.
 |
Still below their falling Closing Powers are
some the very weakest MINCPs.
 |
 |
 |
Table 1 - Daily Breadth and Volume
Statistics
- Still 94 more new lows today than new highs.
| NYSE |
Latest Close |
Previous
Close |
Week Ago |
| Issues
traded |
3,084 |
3,085 |
3,086 |
| Advances |
2,311 |
610 |
1,707 |
| Declines |
675 |
2,387 |
1,264 |
| Unchanged |
98 |
88 |
115 |
| New
highs |
56 |
36 |
60 |
| New
lows |
80 |
107 |
69 |
| Adv.
volume* |
732,635,114 |
119,767,156 |
429,891,264 |
| Decl.
volume* |
162,863,913 |
678,542,442 |
464,742,774 |
| Total
volume* |
905,944,715 |
806,142,461 |
903,467,621 |
| Closing
Arms (TRIN)† |
0.81 |
1.21 |
1.41 |
| Block
trades* |
4,092 |
4,142 |
4,361 |
| Adv.
volume |
3,215,519,800 |
631,159,289 |
1,957,659,830 |
| Decl.
volume |
757,689,323 |
2,997,562,604 |
2,047,757,683 |
| Total
volume |
4,039,085,979 |
3,654,207,076 |
4,057,169,925 |
| NASDAQ |
Latest Close |
Previous
Close |
Week Ago |
| Issues
traded |
4,622 |
4,633 |
4,613 |
| Advances |
3,152 |
1,359 |
2,541 |
| Declines |
1,289 |
3,099 |
1,849 |
| Unchanged |
181 |
175 |
223 |
| New
highs |
84 |
69 |
106 |
| New
lows |
144 |
199 |
171 |
| Closing
Arms (TRIN)† |
0.55 |
0.71 |
1.06 |
| Block
trades |
26,248 |
21,540 |
28,043 |
| Adv.
volume |
3,661,205,754 |
1,517,483,846 |
2,737,144,052 |
| Decl.
volume |
816,057,582 |
2,465,149,126 |
2,109,145,859 |
| Total
volume |
4,501,820,354 |
4,067,510,682 |
4,948,263,516 |
|
Table 2 QUICKSILVER on ETFS - 5/17/2023 ---
Bullish = 1 TECL (.388)
Bearish = 4 FAS (-.28), OIH(-.386)
A majority of Closing Powers are bearish.
ETF CLOSE CHANGE PIVOT-PT 5-dma AROC CL-PWR CANDLE IP21 ITRS POWER INDEX
===============================================================================================
DIA 334.61 4.26 333.33 -13.2% Bearish BLUE .066 0 ------
---------------------------------------------------------------------------------------------
COMPQX 12500.57 157.52 12328.51 78.8% ------- BLUE .093 .067 .16
---------------------------------------------------------------------------------------------
SPY 415.23 4.98 412.13 28.9% ------- BLUE .089 .025 .114
---------------------------------------------------------------------------------------------
QQQ 331.12 3.96 326.2 91.7% ------- BLUE .11 .1 .21
---------------------------------------------------------------------------------------------
MDY 449.29 7.87 444.43 21.6% Bearish BLUE -.06 -.065 -.125
---------------------------------------------------------------------------------------------
IWM 176.12 3.84 173.07 49.3% Bearish BLUE -.004 -.073 -.077
---------------------------------------------------------------------------------------------
FAS 58.12 3.35 55.75 180.7% Bearish BLUE -.017 -.263 -.28
---------------------------------------------------------------------------------------------
RETL 6.51 .5 6.46 7.9% Bearish BLUE .039 -.234 -.195
---------------------------------------------------------------------------------------------
SOXL 16.14 1.09 14.07 630.5% Bullish BLUE .121 .084 .205
---------------------------------------------------------------------------------------------
TECL 38.78 1.47 36.46 244.2% ------- BLUE .088 .3 .388
---------------------------------------------------------------------------------------------
IBB 129.33 .29 130.43 -65.1% ------- BLUE .127 -.001 .126
---------------------------------------------------------------------------------------------
GLD 184.23 -.64 187.13 -120.9% ------- RED .142 .075 .217
---------------------------------------------------------------------------------------------
DBO 14.22 .46 13.91 25.2% ------- BLUE -.142 -.062 -.204
---------------------------------------------------------------------------------------------
OIH 255.71 6.64 252.37 -81.1% Bearish BLUE -.162 -.224 -.386
---------------------------------------------------------------------------------------------
CPER 23.06 .56 22.75 -124.2% Bearish ---- -.095 -.066 -.161
---------------------------------------------------------------------------------------------
TAN 71.66 .67 69.81 124.5% Bearish BLUE -.087 -.108 -.195
---------------------------------------------------------------------------------------------
UUP 28.14 .05 27.92 71.5% Bullish ---- .058 -.034 .024
---------------------------------------------------------------------------------------------
CORN 22.2 -.41 22.96 -220.4% ------- RED .01 -.134 -.124
---------------------------------------------------------------------------------------------
WEAT 6.29 -.2 6.34 -108.4% Bearish RED -.006 -.128 -.134
---------------------------------------------------------------------------------------------
YINN 40.61 -1.38 41.45 52.4% ------- BLUE .117 -.115 .002
|
Table 3 RANKING OF KEY DIRECTORIES BASED PCT.OF STOCKS ABOVE 65-DMA
5/17/23
---------------------------------------------------------------------------------------
Directory Current day-1 day-2 day-3 day-4 day-5
----------------------------------------------------------------------------------------
BEVERAGE .857 .785 .785 .785 .857 .857
HOMEBLDG .833 .666 .777 .833 .833 .833
GUNS .714 .571 .571 .571 .5 .5
ETFS .672 .581 .69 .6 .636 .709
GREEN .666 .5 .5 .5 .388 .388
HOSPITAL .642 .642 .642 .642 .642 .642
GOLD .622 .622 .666 .666 .666 .777
JETS .615 .23 .23 .23 .23 .23
TRANSP .578 .368 .421 .315 .315 .368
HIGHPRIC .562 .497 .545 .523 .515 .541
NASD-100 .55 .5 .57 .52 .53 .57
SOFTWARE .517 .464 .464 .428 .428 .428
===============================================================================================
NIFTY .5 .409 .454 .386 .363 .386
FOOD .489 .469 .469 .428 .428 .448
SEMI .489 .361 .372 .265 .234 .255
BIOTECH .487 .435 .482 .437 .467 .49
GAMING .473 .473 .473 .526 .473 .526
INDEXES .47 .378 .486 .4 .405 .437
DOWJONES .466 .366 .4 .4 .433 .566
------
COMODITY .461 .461 .435 .435 .435 .435
DJI-13 .461 .384 .384 .461 .461 .461
ELECTRON .451 .368 .368 .293 .285 .293
COMPUTER .45 .4 .4 .25 .35 .4
FIDSTKS .449 .372 .408 .39 .414 .443
INSURANC .44 .4 .44 .48 .56 .52
HACKERS .437 .312 .375 .312 .312 .25
MILITARY .423 .269 .269 .23 .192 .269
SP-100 .411 .344 .377 .355 .377 .422
UTILITY .41 .487 .641 .794 .743 .82
SP500 .404 .349 .41 .408 .408 .425
RUS-1000 .4 .352 .411 .4 .392 .407
RETAIL .391 .282 .326 .347 .347 .369
AUTO .377 .226 .283 .207 .207 .245
INFRA .333 .333 .363 .363 .393 .393
LOWPRICE .312 .283 .286 .266 .272 .292
SOLAR .312 .187 .25 .25 .125 .062
CHEM .279 .232 .279 .279 .279 .279
FINANCE .275 .2 .212 .162 .212 .212
REIT .221 .163 .245 .254 .229 .286
INDMATER .208 .194 .222 .208 .236 .263
MARIJUAN .2 .1 .2 .2 .1 .3
BONDFUND .195 .252 .275 .264 .321 .31
OILGAS .185 .134 .164 .123 .113 .144
CHINA .181 .181 .181 .159 .136 .181
EDU .166 .166 .166 .166 .166 .166
BIGBANKS .142 0 0 0 .142 .142
REGBANKS .119 .071 .047 .071 .071 .047
COAL 0 0 .333 .166 .166 .166
COPPER 0 0 0 0 0 0
|
====================================================================================
====================================================================================

----------------------------------------------------------------------------------------------------------------------------
Wednesday -
5/16/2023 - 6:08 AM Futures
DJI +155 NASDAQ +33 Data used 5/16/2023
| |
5/16/2023
|
|
| |
The futures
should bring a rally back to the broken resistance of the
DJI's 65-dma. With the DJI's
Closing Power and all its key Peerless
indicators falling, I would
expect the rally to fail.
Biden said he would not
negotiate with the over-zealous budget hawks in
the House. Now he is
doing exactly that. His hand is weak. He is blamed
for not preparing for this
inevitable fight, for not creating a Trillion Dollar Coin,
for not fighting harder
publicly... And if he holds firm, it is he who will be blamed
by the Public for the
cessation of vital social security checks and payments to
Federal employees,
contractors and for the damage done to US. Credit. So,
I've been saying, he will
make big concessions to the Republicans in the House.
And these make Wall Street
quite happy. But, first, we have to endure the
crazy suspense and drama of
two juveniles playing a game of chicken with
the national economy as the
stakes. The two sides are now much farther apart
than in 2011's similar
political budget struggle. So, the contest may continue
for two more weeks, at least.
Not all Wall Street participants are similarly affected. Now the big banks are
tetsing their lows.
Utilities and bonds were especially weak today. The prospects
of a deflationary fiscal
future has brought retails stocks to their 12-month lows.
And Oil stocks envisage more
consumer belt-tighening.
But the times are bullish for
stocks like NVDA, MSFT and GOOG that are
the leaders in the burgeoning
new field of artificial intelligence. And the future
looks sweet for LLY and the
beneficiaries of its amazing weight-loss anti-diabetes
drug. Hedging by
shorting our most bearish MINCPs and being long the strongest
home-builders and other
MAXCPs keeps working out. When hedging is doing
out this well, I think it
would be a mistake to apply a new strategy. Look for
more blue-chip and bond
weakness. But note the pockets of strength. They
will be the leaders when the
political drama eases off. |
|
| |
5/16/2023
2022 PEERLESS DJI, Signals, Indicators Daily DJI Volume
10-DayUp/Down Vol Stoch-20 CCI RSI Pct of All Stocks above 65-dma
Inverted Traders Index
DJI-IPA DJI-OBV Short-Term Rates
NASDAQ S&P OEX NYSE DJ-15 DJ-20 DJI-30
Tiger Index of Big
Banks Bond
Funds Gold Stocks
Housing Stocks
Insurance-Stocks
Regional Banks
Russell-1000
Semi Conductors
Recent 2006 vers-Peerless signals http://tigersoftware.com/oldpeer/UPD90516.bmp
ETFs: DIA QQQ SPY IWM MDY
TNA Short-Term Rates Ten Year Rates PST (Short Treasuries)
DOLLAR-UUP
ALLSTOCKs
COIN (Bit
Coin ETF)
USO-CrudeOil DBO
BLDP FAS GLD HD IBB JETS JNUG KOL NAIL NUGT
NRGU OIH PALL RSX RETL SDS AGQ SLV SOXL TAN TECL TLT TMF TNA
UGA USO China: YINN CHAU
Commodities: CANE
CORN DBC JJC, NIB CORN, CUT (paper)
MOO, NRGU
SOYB WEAT UUP (Dollar) LIT
(Lithium) PALL
(Palladium)
Stocks AA AAPL ADBE ALXN AMAT AMGN AMD AMZN ANET AXON AXP
BA BABA BAC BIDU BLDP BSX CAT CDNS CHKP CNX CPB CRM CVX CMG
DE DIS ENPH FB FSLR FTNT GILD GME GOOG GS HD IBM INTU JPM KO KR
LRCX MRK MRNA MOS MSFT NEM NFLX NKE NOC NUE NVDA PANW PG PYPL
QCOM QDEL REGN REV RE SCHW SNOW SO SQUARE TSLA TXN XOM V VRTX
WFC WMT XLE ZM ZOM
NEW-HOMEBUILDERS:
NAIL BZH MHO MTH PHM
NEW-REGIONAL
BANKS: EGBN FFIC GBCI HMST
Leveraged Short ETFs:
FAZ - financials, TZA and SRTY- small caps, MZZ - mid caps, TECS -Techs,
SOXS -
semi-conductors LABD
- Biotechs
Bullish MAXCPs www.tigersoftware.com/UPPING/5-16-2023/Bullish.htm
Bearish MINCPs
www.tigersoftware.com/Downing/5-16-2023/BEARISH.htm |
|
DJI broke below its 65-dma All its internal strength indicators are falling.
Even our Accumulation Index turned negative.
 |
DIA's Closing Power is falling. So are its 5-day, 21-day and 65-dma.
 |
NASDAQ has made a recovery new high, but cannot advance by itself, it seems.
 |
 |
 |
Bullish Stocks: LLY, NVDA,
 |
 |
Snack food is in style.
 |
"Gotta have a home."
 |
But false breakouts must be watched for, as with FSLR
 |
Will RETL breakdown? Chart looks bearish.
 |
Regional Banks are still struggling and under mounting
public scrutiny.
 |
 |
Will Big Banks catch the contagion that its lay low the
regional banks?
 |
Heavy Distribution, big money dumping and Professional selling:
These find us the most bearish stocks to sell short.. |
 |
 |
 |
able 1 - Daily Breadth and Volume Statistics
| NYSE |
Latest Close |
Previous
Close |
Week Ago |
| Issues
traded |
3,085 |
3,077 |
3,080 |
| Advances |
610 |
1,982 |
1,202 |
| Declines |
2,387 |
973 |
1,753 |
| Unchanged |
88 |
122 |
125 |
| New
highs |
36 |
43 |
49 |
| New
lows |
107 |
58 |
76 |
| Adv.
volume* |
119,767,156 |
583,267,667 |
358,676,050 |
| Decl.
volume* |
678,542,442 |
212,801,473 |
494,527,371 |
| Total
volume* |
806,142,461 |
800,895,103 |
875,127,332 |
| Closing
Arms (TRIN)† |
1.21 |
0.71 |
0.83 |
| Block
trades* |
4,142 |
4,074 |
4,250 |
| Adv.
volume |
631,159,289 |
2,623,788,636 |
1,665,884,957 |
| Decl.
volume |
2,997,562,604 |
909,851,800 |
2,021,707,952 |
| Total
volume |
3,654,207,076 |
3,562,172,206 |
3,810,146,102 |
| NASDAQ |
Latest Close |
Previous
Close |
Week Ago |
| Issues
traded |
4,633 |
4,644 |
4,633 |
| Advances |
1,359 |
2,887 |
1,877 |
| Declines |
3,099 |
1,564 |
2,531 |
| Unchanged |
175 |
193 |
225 |
| New
highs |
69 |
77 |
87 |
| New
lows |
199 |
160 |
188 |
| Closing
Arms (TRIN)† |
0.71 |
0.77 |
0.99 |
| Block
trades |
21,540 |
20,951 |
21,720 |
| Adv.
volume |
1,517,483,846 |
2,774,815,595 |
1,746,192,160 |
| Decl.
volume |
2,465,149,126 |
1,162,111,079 |
2,322,031,872 |
| Total
volume |
4,067,510,682 |
3,979,299,123 |
4,126,782,968 |
|
Table 2 QUICKSILVER on ETFS - 5/16/2023 ---
Bullish = 1 TECL (.276)
Bearish = 4 FAS (-.329), RETL (-.288), DBO(-.273), OIH(-.424)
Closing Powers are mostly bearish.
ETF CLOSE CHANGE PIVOT-PT 5-dma AROC CL-PWR CANDLE IP21 ITRS POWER INDEX
===============================================================================================
DIA 330.35 -3.42 335.49 -81.1% Bearish RED .052 0 .052
---------------------------------------------------------------------------------------------
COMPQX 12343.05 -22.16 12306.44 66.5% ------- BLUE .039 .07 .109
---------------------------------------------------------------------------------------------
SPY 410.25 -2.76 412.85 -8.3% Bearish RED .047 .027 .074
---------------------------------------------------------------------------------------------
QQQ 327.16 .37 325.14 84.9% ------- BLUE .06 .103 .163
---------------------------------------------------------------------------------------------
MDY 441.42 -6.52 447.37 -57.7% Bearish RED -.12 -.063 -.183
---------------------------------------------------------------------------------------------
IWM 172.28 -2.55 174.41 -36% Bearish RED -.066 -.074 -.14
---------------------------------------------------------------------------------------------
FAS 54.77 -1.62 56.11 -208.6% Bearish RED -.009 -.33 -.339
---------------------------------------------------------------------------------------------
RETL 6.01 -.49 6.5 -387% Bearish RED -.026 -.262 -.288
---------------------------------------------------------------------------------------------
SOXL 15.05 -.06 14.31 388.4% ------- BLUE .074 .005 .079
---------------------------------------------------------------------------------------------
TECL 37.31 .13 36.98 219% ------- BLUE .044 .232 .276
---------------------------------------------------------------------------------------------
IBB 129.04 -2.7 131.03 -59.6% ------- RED .074 .011 .085
---------------------------------------------------------------------------------------------
GLD 184.87 -2.34 188.75 -110.5% ------- RED .13 .09 .22
---------------------------------------------------------------------------------------------
DBO 13.76 -.11 14.15 -175.5% Bearish RED -.179 -.094 -.273
---------------------------------------------------------------------------------------------
OIH 249.07 -6.85 259.83 -273.7% Bearish RED -.193 -.231 -.424
---------------------------------------------------------------------------------------------
CPER 22.5 -.5 23.63 -328.9% Bearish RED -.075 -.082 -.157
---------------------------------------------------------------------------------------------
TAN 70.99 -1.7 69.89 123% Bearish RED -.105 -.097 -.202
---------------------------------------------------------------------------------------------
UUP 28.09 .07 27.74 53.7% Bullish ---- .041 .007 .048
---------------------------------------------------------------------------------------------
CORN 22.61 -.46 23.21 -119.4% ------- RED .069 -.092 -.023
---------------------------------------------------------------------------------------------
WEAT 6.49 -.15 6.43 15.5% Bearish RED .053 -.065 -.012
---------------------------------------------------------------------------------------------
YINN 41.99 -1.19 40.18 123.7% ------- BLUE .064 -.107 -.043
|
Table 3 RANKING OF KEY DIRECTORIES BASED PCT.OF STOCKS ABOVE 65-DMA
5/16/23
Bullish = 6
Bearish = 41
---------------------------------------------------------------------------------------
Directory Current day-1 day-2 day-3 day-4 day-5
----------------------------------------------------------------------------------------
BEVERAGE .785 .785 .785 .857 .857 .928
HOMEBLDG .666 .777 .833 .833 .833 .833
HOSPITAL .642 .642 .642 .642 .642 .642
GOLD .622 .666 .666 .666 .777 .8
ETFS .581 .69 .6 .636 .727 .709
GUNS .571 .571 .571 .5 .5 .5
=================================================================================================
GREEN .5 .5 .5 .388 .388 .444
NASD-100 .5 .57 .52 .53 .57 .54
=================================================================================================
HIGHPRIC .497 .545 .523 .515 .536 .506
UTILITY .487 .641 .794 .743 .82 .769
GAMING .473 .473 .473 .526 .526 .578
FOOD .469 .489 .408 .428 .448 .428
SOFTWARE .464 .482 .428 .428 .41 .41
COMODITY .461 .461 .41 .435 .435 .435
BIOTECH .435 .48 .44 .467 .482 .462
NIFTY .409 .454 .386 .363 .386 .386
COMPUTER .4 .4 .25 .35 .4 .25
INSURANC .4 .44 .48 .56 .52 .6
DJI-13 .384 .384 .461 .461 .461 .461
INDEXES .378 .486 .4 .405 .432 .448
FIDSTKS .372 .408 .39 .414 .443 .443
ELECTRON .368 .368 .293 .285 .285 .248
TRANSP .368 .421 .315 .315 .315 .421
DOWJONES .366 .4 .4 .433 .566 .566
-----
SEMI .361 .372 .265 .234 .244 .202
RUS-1000 .352 .411 .4 .392 .403 .409
SP500 .349 .41 .41 .404 .429 .435
-----
SP-100 .344 .377 .355 .377 .422 .433
INFRA .333 .363 .363 .393 .393 .393
HACKERS .312 .375 .312 .312 .25 .25
LOWPRICE .283 .289 .269 .275 .286 .297
RETAIL .282 .326 .347 .347 .369 .369
MILITARY .269 .269 .23 .192 .269 .269
BONDFUND .252 .264 .264 .333 .321 .218
CHEM .232 .279 .279 .279 .279 .255
JETS .23 .23 .23 .23 .23 .307
AUTO .226 .301 .207 .207 .245 .264
FINANCE .2 .212 .162 .2 .212 .212
INDMATER .194 .222 .208 .236 .25 .25
SOLAR .187 .25 .25 .125 .062 .125
CHINA .181 .181 .159 .136 .181 .159
EDU .166 .166 .166 .166 .166 0
REIT .163 .237 .262 .237 .27 .254
OILGAS .134 .164 .123 .113 .134 .154
MARIJUAN .1 .2 .2 .1 .3 .2
REGBANKS .071 .047 .071 .071 .047 .047
BIGBANKS 0 0 0 .142 .142 .142
-----
COAL 0 .333 .166 .166 .166 .166
COPPER 0 0 0 0 0 .142
|
==================================================================================
Tuesday - 5/15/2023 - 5:30 AM Futures DJI -80 NASDAQ -5 Data used 5/15/2023
| |
5/15/2023
|
|
| |
Outwardly the market
looks like it is asleep. The low volume reflects the fear
that there will be a budget default
crisis early next month. Treasury Secretary
Janet Yellen is living up to her name.
Each day she is "yelling" about all the bad
things that will happen if no agreement
is reached very soon between the President
and House Speaker McCarthy. But
each day, Professionals buy the weak opening
that ensues from the fear she creates.
They just don't think that in the end there
will be no compromise. The
Professionals are looking ahead not only to a settlement
that keeps government running and
maintains the credit-worthiness of the Dollar.
but also one that prevents higher taxes
on the very well-off.
Today was typical. The DJI was down
200 points an hour into trading, but it
fought its way back into positive
territoty and there were 1000 more up than down
on the NYSE. Moreover, even the
regional banks nearly all were up. So, were most
retailers. And leading
semi-conductors did very well. (See the Bullish MAXCPs.)
Oil stocks were weak. See Table 3.
Their weakness is a sign that inflation may
be on the way out. Wouldn't that be
something. Professionals are usually right.
They are looking ahead to a time when the
FED eases off its tightening of monetary
policy. Semi-conductors, which are
normally quite volatile, would not have had
such a good day today if there wasn't a
growing sense that better times lie ahead.
We can't turn bullish yet. Peerless
remains on a Sell. Seasonality suggests caution,
as do the greater number of new lows than
new highs and the still falling Closing
Power for DIA. The DJI's key
indicators have also not broken their downtrends.
But the low volume on RETL is a warning
against shorting the stocks in this group
if they have not already broken down
badly. Moreover, SCHW (Schwab) looks
very cheap. With its Accumulation
Index positive and rising, it would seem to
be very inviting as a Buy. So does
Northrop (NOC) which is holding just
above key support. Let's watch and
see how the semi-conductors fare this week.
Volume is probably too low to buy SOXL,
but traders would not be buyers here
if they were not optimists that the
budget crisis and high interest rates should be
looked past. If this assessment is
correct, home-building stocks will stay strong.
And even the very weak regional banks may
now start to slowly recover. |
|
| |
5/15/2023
2022 PEERLESS DJI, Signals, Indicators Daily DJI Volume
10-DayUp/Down Vol Stoch-20 CCI RSI Pct of All Stocks above 65-dma
Inverted Traders Index
DJI-IPA DJI-OBV Short-Term Rates
NASDAQ S&P OEX NYSE DJ-15 DJ-20 DJI-30
Tiger Index of Big
Banks Bond
Funds Gold Stocks
Housing Stocks
Insurance-Stocks
Regional Banks
Russell-1000
Semi Conductors
Recent 2006 vers-Peerless signals http://tigersoftware.com/oldpeer/UPD90515.bmp
ETFs: DIA QQQ SPY IWM MDY
TNA Short-Term Rates Ten Year Rates PST (Short Treasuries)
DOLLAR-UUP
ALLSTOCKs
COIN (Bit
Coin ETF)
USO-CrudeOil DBO
BLDP FAS GLD HD IBB JETS JNUG KOL NAIL NUGT
NRGU OIH PALL RSX RETL SDS AGQ SLV SOXL TAN TECL TLT TMF TNA
UGA USO China: YINN CHAU
Commodities: CANE
CORN DBC JJC, NIB CORN, CUT (paper)
MOO, NRGU
SOYB WEAT UUP (Dollar) LIT
(Lithium) PALL
(Palladium)
Stocks AA AAPL ADBE ALXN AMAT AMGN AMD AMZN ANET AXON AXP
BA BABA BAC BIDU BLDP BSX CAT CDNS CHKP CNX CPB CRM CVX CMG
DE DIS ENPH FB FSLR FTNT GILD GME GOOG GS HD IBM INTU JPM KO KR
LRCX MRK MRNA MOS MSFT NEM NFLX NKE NOC NUE NVDA PANW PG PYPL
QCOM QDEL REGN REV RE SCHW SNOW SO SQUARE TSLA TXN XOM V VRTX
WFC WMT XLE ZM ZOM
NEW-HOMEBUILDERS:
NAIL BZH MHO MTH PHM
NEW-REGIONAL
BANKS: EGBN FFIC GBCI HMST
Leveraged Short ETFs:
FAZ - financials, TZA and SRTY- small caps, MZZ - mid caps, TECS -Techs,
SOXS -
semi-conductors LABD
- Biotechs
Bullish MAXCPs www.tigersoftware.com/UPPING/5-15-2023/Bullish.htm
Bearish MINCPs
www.tigersoftware.com/Downing/5-15-2023/BEARISH.htm |
|
The DJI refuses to crack below the support of its
65-dma. Its internal strength
indicators are still falling. But see how the A/D Line has not
made a new low.
 |
 |
 |
 |
 |
 |
 |
 |
 |
 |
 |
 |
 |
Table 1 - Daily Breadth and Volume Statistics.
| Issues
traded |
3,077 |
3,064 |
3,084 |
| Advances |
1,982 |
1,312 |
1,405 |
| Declines |
973 |
1,638 |
1,574 |
| Unchanged |
122 |
114 |
105 |
| New
highs |
43 |
50 |
59 |
| New
lows |
58 |
118 |
44 |
| Adv.
volume* |
583,267,667 |
289,687,908 |
437,167,040 |
| Decl.
volume* |
212,801,473 |
468,257,268 |
356,068,601 |
| Total
volume* |
800,895,103 |
775,467,040 |
810,107,971 |
| Closing
Arms (TRIN)† |
0.71 |
1.34 |
0.65 |
| Block
trades* |
4,074 |
3,813 |
4,138 |
| Adv.
volume |
2,623,788,636 |
1,291,560,618 |
2,055,203,497 |
| Decl.
volume |
909,851,800 |
2,161,681,367 |
1,496,378,279 |
| Total
volume |
3,562,172,206 |
3,533,743,847 |
3,641,645,071 |
| NASDAQ |
Latest Close |
Previous
Close |
Week Ago |
| Issues
traded |
4,644 |
4,578 |
4,613 |
| Advances |
2,887 |
1,753 |
2,128 |
| Declines |
1,564 |
2,615 |
2,273 |
| Unchanged |
193 |
210 |
212 |
| New
highs |
77 |
71 |
81 |
| New
lows |
160 |
250 |
113 |
| Closing
Arms (TRIN)† |
0.77 |
1.13 |
0.46 |
| Block
trades |
20,951 |
24,317 |
24,392 |
| Adv.
volume |
2,774,815,595 |
1,526,197,107 |
2,782,368,736 |
| Decl.
volume |
1,162,111,079 |
2,567,120,591 |
1,369,984,118 |
| Total
volume |
3,979,299,123 |
4,170,003,073 |
4,216,362,702 |
|
Table 2 QUICKSILVER on ETFS - 5/15/2023 ---
Bullish = 2 TECL (.309), GLD (+.276)
Bearish = 1 OIH(-.387)
Closing Powers are mostly bearish.
ETF CLOSE CHANGE PIVOT-PT 5-dma AROC CL-PWR CANDLE IP21 ITRS POWER INDEX
===============================================================================================
DIA 333.77 .57 335.77 -36.6% Bearish BLUE .126 ----- ------
---------------------------------------------------------------------------------------------
COMPQX 12365.21 80.47 12179.55 44.1% ------- BLUE .108 .059 .167
---------------------------------------------------------------------------------------------
SPY 413.01 1.42 410.93 3.3% Bearish BLUE .125 .023 .148
---------------------------------------------------------------------------------------------
QQQ 326.79 1.76 321.64 47.8% ------- BLUE .099 .092 .191
---------------------------------------------------------------------------------------------
MDY 447.94 3.55 446.57 -1.7% Bearish BLUE -.046 -.072 -.118
---------------------------------------------------------------------------------------------
IWM 174.83 2.11 173.53 22.5% Bearish BLUE .009 -.086 -.077
---------------------------------------------------------------------------------------------
FAS 56.39 1.34 57.11 -124.2% Bearish BLUE .079 -.32 -.241
---------------------------------------------------------------------------------------------
RETL 6.5 .17 6.51 -38.6% Bearish BLUE .043 -.263 -.22
---------------------------------------------------------------------------------------------
SOXL 15.11 1.09 13.94 162% ------- BLUE .142 -.035 .107
---------------------------------------------------------------------------------------------
TECL 37.18 .87 35.71 85.2% ------- BLUE .074 .235 .309
---------------------------------------------------------------------------------------------
IBB 131.74 1.56 130.6 34.1% ------- BLUE .148 .011 .159
---------------------------------------------------------------------------------------------
GLD 187.21 .4 189.02 -12.8% Bullish RED .189 .087 .276
---------------------------------------------------------------------------------------------
DBO 13.87 .23 14.25 -82.1% Bearish BLUE -.156 -.089 -.245
---------------------------------------------------------------------------------------------
OIH 255.92 2.92 263.13 -119.7% Bearish BLUE -.163 -.224 -.387
---------------------------------------------------------------------------------------------
CPER 23 .1 24.03 -232.1% Bearish ---- -.045 -.073 -.118
---------------------------------------------------------------------------------------------
TAN 72.69 .75 69.25 195.2% Bearish ---- -.025 -.069 -.094
---------------------------------------------------------------------------------------------
UUP 28.02 -.08 27.79 57.5% Bullish ---- .015 -.009 .006
---------------------------------------------------------------------------------------------
CORN 23.07 .33 23.16 -112.4% Bullish BLUE .11 -.089 .021
---------------------------------------------------------------------------------------------
WEAT 6.64 .25 6.47 62.1% Bearish BLUE .107 -.075 .032
---------------------------------------------------------------------------------------------
YINN 43.18 4.9 40.98 -3.7% ------- BLUE .072 -.126 -.054
|
Table 3 RANKING OF KEY DIRECTORIES BASED PCT.OF STOCKS ABOVE 65-DMA
5/15/23
Bullish = 9
Bearish = 40
---------------------------------------------------------------------------------------
Directory Current day-1 day-2 day-3 day-4 day-5
----------------------------------------------------------------------------------------
BEVERAGE .785 .785 .857 .857 .928 .928
HOMEBLDG .777 .833 .833 .833 .833 .833
ETFS .69 .6 .636 .727 .709 .745
GOLD .666 .666 .666 .777 .8 .8
HOSPITAL .642 .642 .642 .642 .642 .642
UTILITY .641 .794 .743 .82 .769 .794
GUNS .571 .571 .5 .5 .428 .428
NASD-100 .57 .52 .53 .57 .54 .6
HIGHPRIC .545 .523 .515 .536 .506 .562
============================================================================================
GREEN .5 .5 .388 .388 .444 .5
FOOD .489 .428 .408 .448 .428 .469
INDEXES .486 .4 .405 .432 .448 .454
SOFTWARE .482 .446 .428 .41 .41 .392
BIOTECH .48 .437 .47 .482 .462 .457
GAMING .473 .473 .473 .578 .578 .631
COMODITY .461 .435 .41 .435 .435 .435
NIFTY .454 .386 .363 .386 .386 .409
INSURANC .44 .48 .56 .52 .6 .56
TRANSP .421 .315 .315 .315 .421 .473
RUS-1000 .411 .4 .392 .403 .406 .431
SP500 .41 .41 .406 .425 .437 .459
FIDSTKS .408 .39 .414 .443 .449 .473
COMPUTER .4 .25 .35 .4 .25 .25
DOWJONES .4 .4 .433 .566 .566 .566
=====
DJI-13 .384 .461 .461 .461 .461 .461
SP-100 .377 .355 .377 .422 .433 .433
HACKERS .375 .312 .312 .25 .25 .312
SEMI .372 .265 .234 .244 .191 .244
ELECTRON .368 .293 .285 .285 .248 .263
INFRA .363 .363 .393 .393 .393 .393
COAL .333 .166 .166 .166 .166 .166
RETAIL .326 .347 .347 .369 .347 .369
AUTO .301 .226 .207 .245 .264 .283
LOWPRICE .289 .272 .277 .289 .289 .269
CHEM .279 .279 .279 .279 .255 .279
MILITARY .269 .23 .192 .269 .269 .23
BONDFUND .264 .252 .333 .333 .218 .264
SOLAR .25 .25 .125 .062 .062 .125
REIT .237 .254 .245 .278 .237 .27
JETS .23 .23 .23 .23 .307 .23
INDMATER .222 .208 .236 .25 .25 .277
FINANCE .212 .162 .2 .2 .2 .212
MARIJUAN .2 .2 .1 .3 .2 .2
CHINA .181 .159 .136 .181 .159 .136
EDU .166 .166 .166 .166 0 .166
OILGAS .164 .123 .113 .134 .154 .154
=====
REGBANKS .047 .071 .071 .047 .047 .047
BIGBANKS 0 0 .142 .142 .142 .142
COPPER 0 0 0 0 .142 .142
|
====================================================================================
Monday - 5/15/2023 - 5:55 AM Futures
DJI+55 NASDAQ +27 Data used 5/12/2023
| |
5/12/2023
|
|
| |
The DJI's
early sell-off again found support at its 65-dma as Friday-trading
Professionals bid up the blue
chips and leading tech stocks up after mid-day.
The DJI is still way below
its well-tested resistance at 34000. More running
in place, bobbing and weaving
indecisively, seems likely for it. The key DJI
indicators are still falling
and only 40% of the DJI-30 stocks are above their
65-dma. There are many more
new lows than new highs.
The growing disparity between
the rising MAXCPs made up of special situations,
home-building and beverage
stocks and the falling MINCPs, especially regional
banks, remains the central
tendency of the market. Hedge funds are playing these
disparate trends to the hilt.
There is little evidence that they are ready to find
a new strategy. And it
keep working, day to day.
But three groups deserve
special attention now. Oil stocks and OIH look weak.
See the head/shoulders
pattern in OIH. Their weakness will be bullish for
the market in so far as it
predicts a subsidence of inflation and that allows
the FED to stop its rate
increases soon.
RETL is testing its lows, but
not breaking down. Will some retailers report better
than expected earnings this
week and give RETL a boost or will the political stalemate
over paying for the Federal
budget deficit take center stage. Watch to see
how the big banks do this
week. A failure to reach a budget agreement would
hit the big banks hard, I
believe.
In that case, the credit
worthiness of US debt will take a hit and cause a
late-in-the-week plunge.
See how the decline in 2011
was delayed until the last moment. It is not clear
how either political side can
back down and stay consistent with their core beliefs.
But the Democrats are the
most pragmatic. And since the Democrats have the
Presidency, any cessation of
social security payments and delayed payments to
doctors and contractors, etc.
will bring more public blame on them. So with the
Presidential Election coming
next year, I would expect Biden to blink first.
Stay hedged. The DJI
will likely bob up and down as the budget talks come
down to their
end-of-the-month deadline. |
|
| |
5/12/2023
2022 PEERLESS DJI, Signals, Indicators Daily DJI Volume
10-DayUp/Down Vol Stoch-20 CCI RSI Pct of All Stocks above 65-dma
Inverted Traders Index
DJI-IPA DJI-OBV Short-Term Rates
NASDAQ S&P OEX NYSE DJ-15 DJ-20 DJI-30
Tiger Index of Big
Banks Bond
Funds Gold Stocks
Housing Stocks
Insurance-Stocks
Regional Banks
Russell-1000
Semi Conductors
Recent 2006 vers-Peerless signals http://tigersoftware.com/oldpeer/UPD90512.bmp
ETFs: DIA QQQ SPY IWM MDY
TNA Short-Term Rates Ten Year Rates PST (Short Treasuries)
DOLLAR-UUP
ALLSTOCKs
COIN (Bit
Coin ETF)
USO-CrudeOil DBO
BLDP FAS GLD HD IBB JETS JNUG KOL NAIL NUGT
NRGU OIH PALL RSX RETL SDS AGQ SLV SOXL TAN TECL TLT TMF TNA
UGA USO China: YINN CHAU
Commodities: CANE
CORN DBC JJC, NIB CORN, CUT (paper)
MOO, NRGU
SOYB WEAT UUP (Dollar) LIT
(Lithium) PALL
(Palladium)
Stocks AA AAPL ADBE ALXN AMAT AMGN AMD AMZN ANET AXON AXP
BA BABA BAC BIDU BLDP BSX CAT CDNS CHKP CNX CPB CRM CVX CMG
DE DIS ENPH FB FSLR FTNT GILD GME GOOG GS HD IBM INTU JPM KO KR
LRCX MRK MRNA MOS MSFT NEM NFLX NKE NOC NUE NVDA PANW PG PYPL
QCOM QDEL REGN REV RE SCHW SNOW SO SQUARE TSLA TXN XOM V VRTX
WFC WMT XLE ZM ZOM
NEW-HOMEBUILDERS:
NAIL BZH MHO MTH PHM
NEW-REGIONAL
BANKS: EGBN FFIC GBCI HMST
Leveraged Short ETFs:
FAZ - financials, TZA and SRTY- small caps, MZZ - mid caps, TECS -Techs,
SOXS -
semi-conductors LABD
- Biotechs
Bullish MAXCPs www.tigersoftware.com/UPPING/5-12-2023/Bullish.htm
Bearish MINCPs www.tigersoftware.com/Downing/5-12-2023/BEARISH.htm |
|
 |
 |
 |
 |
 |
 |
 |
 |
 |
 |
 |
 |
 |
 |
Table 1 - Daily Breadth and Volume Statistics
| NYSE |
Latest Close |
Previous
Close |
Week Ago |
| Issues
traded |
3,064 |
3,075 |
3,073 |
| Advances |
1,312 |
927 |
2,549 |
| Declines |
1,638 |
2,045 |
438 |
| Unchanged |
114 |
103 |
86 |
| New
highs |
50 |
35 |
48 |
| New
lows |
118 |
86 |
49 |
| Adv.
volume* |
289,687,908 |
243,165,793 |
827,963,324 |
| Decl.
volume* |
468,257,268 |
585,939,340 |
91,824,338 |
| Total
volume* |
775,467,040 |
837,897,447 |
925,735,935 |
| Closing
Arms (TRIN)† |
1.34 |
1.03 |
0.70 |
| Block
trades* |
3,813 |
4,010 |
4,727 |
| Adv.
volume |
1,291,560,618 |
1,131,912,469 |
3,710,307,802 |
| Decl.
volume |
2,161,681,367 |
2,571,459,040 |
449,425,330 |
| Total
volume |
3,533,743,847 |
3,752,902,209 |
4,186,270,049 |
| NASDAQ |
Latest Close |
Previous
Close |
Week Ago |
| Issues
traded |
4,578 |
4,635 |
4,583 |
| Advances |
1,753 |
1,663 |
3,221 |
| Declines |
2,615 |
2,769 |
1,180 |
| Unchanged |
210 |
203 |
182 |
| New
highs |
71 |
81 |
99 |
| New
lows |
250 |
218 |
135 |
| Closing
Arms (TRIN)† |
1.13 |
0.66 |
0.64 |
| Block
trades |
24,317 |
23,135 |
25,790 |
| Adv.
volume |
1,526,197,107 |
2,110,896,556 |
3,680,590,012 |
| Decl.
volume |
2,567,120,591 |
2,316,629,710 |
866,199,736 |
| Total
volume |
4,170,003,073 |
4,489,491,713 |
4,574,791,473 |
https://www.wsj.com/market-data/stocks/marketsdiary
|
Table 2 QUICKSILVER on ETFS - 5/12/2023 ---
Bullish = 2 TECL (.314), GLD (+.264)
Bearish = 5 FAS (.28), RETL(-.279), DBO(-.266), OIH(-.392), YINN(.262)
Closing Powers are mostly bearish.
ETF CLOSE CHANGE PIVOT-PT 5-dma AROC CL-PWR CANDLE IP21 ITRS POWER INDEX
===============================================================================================
DIA 333.2 -.13 336.22 -52.6% Bearish RED .095 ------ ------
---------------------------------------------------------------------------------------------
COMPQX 12284.74 -43.77 12256.92 20.1% ------- RED .078 .063 .141
---------------------------------------------------------------------------------------------
SPY 411.59 -.54 412.74 -12.6% Bearish RED .097 .026 .123
---------------------------------------------------------------------------------------------
QQQ 325.03 -1.17 323.69 33% ------- RED .084 .099 .183
---------------------------------------------------------------------------------------------
MDY 444.39 -.04 448.09 -57.1% Bearish RED -.078 -.08 -.158
---------------------------------------------------------------------------------------------
IWM 172.72 -.35 174.05 -49.7% Bearish RED -.027 -.094 -.121
---------------------------------------------------------------------------------------------
FAS 55.05 -.7 57.79 -204.1% Bearish RED .036 -.316 -.28
---------------------------------------------------------------------------------------------
RETL 6.33 -.13 6.55 -84.7% Bearish RED -.014 -.265 -.279
---------------------------------------------------------------------------------------------
SOXL 14.02 -.05 14.65 -157.5% Bearish RED .092 -.074 .018
---------------------------------------------------------------------------------------------
TECL 36.31 -.15 36.56 -42.5% ------- RED .042 .272 .314
---------------------------------------------------------------------------------------------
IBB 130.18 -.25 130.85 -66.4% Bearish RED .106 .006 .112
---------------------------------------------------------------------------------------------
GLD 186.81 -.32 187.69 -17.3% ------- RED .178 .086 .264
---------------------------------------------------------------------------------------------
DBO 13.64 -.27 14.1 -67.6% Bearish RED -.17 -.096 -.266
---------------------------------------------------------------------------------------------
OIH 253 .63 262.1 -165.1% Bearish RED -.16 -.232 -.392
---------------------------------------------------------------------------------------------
CPER 22.9 .15 24.09 -213.2% Bearish BLUE -.073 -.085 -.158
---------------------------------------------------------------------------------------------
TAN 71.94 2.13 69.95 123.9% Bearish BLUE -.022 -.065 -.087
---------------------------------------------------------------------------------------------
UUP 28.1 .18 27.7 79.2% Bullish BLUE .059 -.02 .039
---------------------------------------------------------------------------------------------
CORN 22.74 -.22 23.59 -222.8% Bullish RED .115 -.104 .011
---------------------------------------------------------------------------------------------
WEAT 6.39 .05 6.56 -169.7% ------- ---- .107 -.121 -.014
---------------------------------------------------------------------------------------------
YINN 38.28 -3.17 43.21 -467.6% Bearish RED -.025 -.236 -.261
|
Table 3 RANKING OF KEY DIRECTORIES BASED PCT.OF STOCKS ABOVE 65-DMA
5/12/23
Bullish = 9 (#1 - Homebuilding)
Bearish = 40 (Lowest are OILGAS, REGBANKS, BIGBANKS and COPPER)
DJI is only 40%.
---------------------------------------------------------------------------------------
Directory Current day-1 day-2 day-3 day-4 day-5
----------------------------------------------------------------------------------------
HOMEBLDG .833 .833 .833 .833 .833 .833
UTILITY .794 .743 .82 .769 .794 .769
BEVERAGE .785 .857 .857 .928 .928 .928
GOLD .666 .666 .777 .8 .8 .777
HOSPITAL .642 .642 .642 .642 .642 .642
ETFS .6 .636 .727 .709 .745 .709
GUNS .571 .5 .5 .428 .428 .428
HIGHPRIC .523 .515 .536 .506 .562 .536
NASD-100 .52 .53 .57 .54 .6 .55
================================================================================================
GREEN .5 .388 .388 .444 .444 .444
INSURANC .48 .56 .52 .6 .52 .48
GAMING .473 .473 .526 .631 .631 .578
DJI-13 .461 .461 .461 .461 .461 .461
SOFTWARE .446 .446 .41 .41 .392 .357
BIOTECH .437 .467 .485 .462 .452 .457
COMODITY .435 .435 .41 .435 .435 .435
FOOD .428 .428 .428 .428 .469 .469
SP500 .41 .406 .427 .433 .459 .449
DOWJONES .4 .433 .566 .566 .566 .566
INDEXES .4 .405 .432 .448 .459 .443
RUS-1000 .4 .392 .403 .406 .428 .42
FIDSTKS .39 .414 .443 .449 .467 .449
NIFTY .386 .363 .386 .386 .409 .386
INFRA .363 .393 .393 .393 .393 .393
SP-100 .355 .377 .422 .433 .433 .433
RETAIL .347 .347 .369 .347 .369 .391
TRANSP .315 .315 .315 .421 .421 .473
HACKERS .312 .312 .25 .25 .312 .25
ELECTRON .293 .285 .285 .248 .255 .263
CHEM .279 .279 .279 .255 .279 .302
LOWPRICE .272 .28 .292 .292 .269 .263
SEMI .265 .234 .244 .191 .244 .244
REIT .254 .237 .286 .245 .254 .245
BONDFUND .252 .321 .333 .229 .275 .402
COMPUTER .25 .35 .4 .25 .25 .25
SOLAR .25 .125 .062 .062 .125 .062
JETS .23 .23 .23 .307 .23 .23
MILITARY .23 .192 .269 .269 .23 .23
AUTO .226 .226 .245 .264 .283 .226
INDMATER .208 .236 .25 .25 .277 .263
MARIJUAN .2 .1 .3 .2 .2 .2
COAL .166 .166 .166 .166 .166 .166
EDU .166 .166 .166 0 .166 0
FINANCE .162 .2 .2 .187 .2 .187
CHINA .159 .136 .181 .159 .136 .159
OILGAS .123 .113 .134 .154 .154 .175
REGBANKS .073 .073 .048 .048 .048 .048
BIGBANKS 0 .142 .142 .142 .142 .142
COPPER 0 0 0 .142 .142 .142
|
===================================================================================
Friday - 5/12/2023 - 5:40 AM Futures
DJI+125 NASDAQ +35 Data used 5/11/2023
| |
5/11/2023
|
|
| |
The DJI
fell 400 in early trading and then recovered about half what it lost in a
steady rally engineered
by steady Professional buying in the second half of the day's
trading. The
buyers were, we may guess, covering some shorts and buying in
preparation for another
rally attempt on a Friday. The central tendency that we
have capitalized on,
namely that the weakest MINCPs would fall and many of the strongest
MAXCPs would rise,
again played out Thursday. See how weak the regional banks
were and some of the
retail stocks, like CVS, were. Home-building stocks again
rose.
Also moving up were the
brightest names in the big tech sector, GOOG, and AMZN.
APPL and MSFT are also
hovering near their highs. That has allowed the NASDAQ and
QQQ to push up to
another marginal recovery high on their six-month candlestick
charts. In buying
them today, despite the looming loggerheads and stalemate in
the Federal budget
talks, Professionals are apparently counting on a compromise
between Biden and
McCarthy being reached. They also are looking ahead to a
Fed announcement that
there will be a pause in interest rate hikes. They may be
right about their
second expectation. Surely, the FED does not want to cause
more bank failures.
And inflation is probably ebbing. Look at the toppish pattern
in the oil service
sector (Table 2).
The rally that will be
attempted today comes as the DJI bounces up from the
support of its 65-dma.
But can it carry very far. Only 36% of all stocks and
ETFs are above their
65-dma. The cumulative Up Volume minus Down Volume
and all our other key
Peerless indicators on the DJI are falling. We are still waiting
for a Peerless buy
signal and the DJI has a strong tendency to fall over the next
two months at this time
of year in the third year of the 4-year Presidential cycle.
Hedging is still
advised. Without more volume and better breadth, the DJI is
not likely to achieve a
breakout. There remains too much overhead resistance
for most stocks. |
|
| |
5/11/2023
2022 PEERLESS DJI, Signals, Indicators Daily DJI Volume
10-DayUp/Down Vol Stoch-20 CCI RSI Pct of All Stocks above 65-dma
Inverted Traders Index
DJI-IPA DJI-OBV Short-Term Rates
NASDAQ S&P OEX NYSE DJ-15 DJ-20 DJI-30
Tiger Index of Big
Banks Bond
Funds Gold Stocks
Housing Stocks
Insurance-Stocks
Regional Banks
Russell-1000
Semi Conductors
Recent 2006 vers-Peerless signals http://tigersoftware.com/oldpeer/UPD90511.bmp
ETFs: DIA QQQ SPY IWM MDY
TNA Short-Term Rates Ten Year Rates PST (Short Treasuries)
DOLLAR-UUP
ALLSTOCKs
COIN (Bit
Coin ETF)
USO-CrudeOil DBO
BLDP FAS GLD HD IBB JETS JNUG KOL NAIL NUGT
NRGU OIH PALL RSX RETL SDS AGQ SLV SOXL TAN TECL TLT TMF TNA
UGA USO China: YINN CHAU
Commodities: CANE
CORN DBC JJC, NIB CORN, CUT (paper)
MOO, NRGU
SOYB WEAT UUP (Dollar) LIT
(Lithium) PALL
(Palladium)
Stocks AA AAPL ADBE ALXN AMAT AMGN AMD AMZN ANET AXON AXP
BA BABA BAC BIDU BLDP BSX CAT CDNS CHKP CNX CPB CRM CVX CMG
DE DIS ENPH FB FSLR FTNT GILD GME GOOG GS HD IBM INTU JPM KO KR
LRCX MRK MRNA MOS MSFT NEM NFLX NKE NOC NUE NVDA PANW PG PYPL
QCOM QDEL REGN REV RE SCHW SNOW SO SQUARE TSLA TXN XOM V VRTX
WFC WMT XLE ZM ZOM
NEW-HOMEBUILDERS:
NAIL BZH MHO MTH PHM
NEW-REGIONAL
BANKS: EGBN FFIC GBCI HMST
Leveraged Short ETFs:
FAZ - financials, TZA and SRTY- small caps, MZZ - mid caps, TECS -Techs,
SOXS -
semi-conductors LABD
- Biotechs
Bullish MAXCPs www.tigersoftware.com/UPPING/5-11-2023/Bullish.htm
Bearish MINCPs www.tigersoftware.com/Downing/5-11-2023/BEARISH.htm |
|

 |
 |
 |
 |
 |
 |
 |
 |
 |
|
 |
 |
 |
 |
 |
 |
 |
 |
 |
Daily Breadth and Volume Statistics
| NYSE |
Latest Close |
Previous
Close |
Week Ago |
| Issues
traded |
3,075 |
3,086 |
3,065 |
| Advances |
927 |
1,707 |
868 |
| Declines |
2,045 |
1,264 |
2,108 |
| Unchanged |
103 |
115 |
89 |
| New
highs |
35 |
60 |
38 |
| New
lows |
86 |
69 |
258 |
| Adv.
volume* |
243,165,793 |
429,891,264 |
340,816,220 |
| Decl.
volume* |
585,939,340 |
464,742,774 |
724,704,245 |
| Total
volume* |
837,897,447 |
903,467,621 |
1,070,277,352 |
| Closing
Arms (TRIN)† |
1.03 |
1.41 |
0.84 |
| Block
trades* |
4,010 |
4,361 |
4,793 |
| Adv.
volume |
1,131,912,469 |
1,957,659,830 |
1,617,485,780 |
| Decl.
volume |
2,571,459,040 |
2,047,757,683 |
3,280,174,423 |
| Total
volume |
3,752,902,209 |
4,057,169,925 |
4,920,099,287 |
| NASDAQ |
Latest Close |
Previous
Close |
Week Ago |
| Issues
traded |
4,635 |
4,613 |
4,601 |
| Advances |
1,663 |
2,541 |
1,745 |
| Declines |
2,769 |
1,849 |
2,662 |
| Unchanged |
203 |
223 |
194 |
| New
highs |
81 |
106 |
60 |
| New
lows |
218 |
171 |
476 |
| Closing
Arms (TRIN)† |
0.66 |
1.06 |
0.82 |
| Block
trades |
23,135 |
28,043 |
26,304 |
| Adv.
volume |
2,110,896,556 |
2,737,144,052 |
2,092,882,400 |
| Decl.
volume |
2,316,629,710 |
2,109,145,859 |
2,608,712,003 |
| Total
volume |
4,489,491,713 |
4,948,263,516 |
4,745,781,430 |
|
Table 2 QUICKSILVER on ETFS - 5/11/2023 ---
Bullish = 2 GLD (.274), TECL (+.383)
Bearish = 1 OIH (-.386)
ETF CLOSE CHANGE PIVOT-PT 5-dma AROC CL-PWR CANDLE IP21 ITRS POWER INDEX
===============================================================================================
DIA 333.33 -2.16 336.73 29.8% Bearish RED .132 ----- -----
---------------------------------------------------------------------------------------------
COMPQX 12328.51 22.07 12235.41 148.5% ------- BLUE .119 .064 .183
---------------------------------------------------------------------------------------------
SPY 412.13 -.72 412.63 85.2% ------- BLUE .138 .025 .163
---------------------------------------------------------------------------------------------
QQQ 326.2 1.06 322.89 155.8% ------- BLUE .124 .101 .225
---------------------------------------------------------------------------------------------
MDY 444.43 -2.94 449.5 50.2% Bearish RED -.057 -.085 -.142
---------------------------------------------------------------------------------------------
IWM 173.07 -1.34 174.45 77% Bearish RED .004 -.101 -.097
---------------------------------------------------------------------------------------------
FAS 55.75 -.36 57.37 194.2% Bearish BLUE .09 -.328 -.238
---------------------------------------------------------------------------------------------
RETL 6.46 -.04 6.44 391.1% Bearish ---- -.001 -.238 -.239
---------------------------------------------------------------------------------------------
SOXL 14.07 -.24 14.47 165.6% ------- RED .105 -.061 .044
---------------------------------------------------------------------------------------------
TECL 36.46 -.52 36.62 326.4% ------- RED .069 .314 .383
---------------------------------------------------------------------------------------------
IBB 130.43 -.6 131.92 5% ------- RED .146 -.001 .145
---------------------------------------------------------------------------------------------
GLD 187.13 -1.62 187.46 -87.7% ------- RED .197 .077 .274
---------------------------------------------------------------------------------------------
DBO 13.91 -.24 13.83 193.7% Bearish ---- -.16 -.085 -.245
---------------------------------------------------------------------------------------------
OIH 252.37 -7.46 261.58 -42.5% Bearish RED -.157 -.229 -.386
---------------------------------------------------------------------------------------------
CPER 22.75 -.88 23.91 -188.6% Bearish RED -.049 -.123 -.172
---------------------------------------------------------------------------------------------
TAN 69.81 -.08 70.21 110.8% Bearish BLUE .044 -.107 -.063
---------------------------------------------------------------------------------------------
UUP 27.92 .18 27.66 39.7% Bullish ---- .036 -.032 .004
---------------------------------------------------------------------------------------------
CORN 22.96 -.25 23.78 -108.8% Bullish RED .123 -.108 .015
---------------------------------------------------------------------------------------------
WEAT 6.34 -.09 6.61 -99.9% ------- RED .101 -.139 -.038
---------------------------------------------------------------------------------------------
YINN 41.45 1.27 42.17 112.3% Bearish BLUE .03 -.138 -.108
|
Table 3 RANKING OF KEY DIRECTORIES BASED PCT.OF STOCKS ABOVE 65-DMA
5/12/23
Bullish = 9
Bearish = 40
---------------------------------------------------------------------------------------
Directory Current day-1 day-2 day-3 day-4 day-5
----------------------------------------------------------------------------------------
BEVERAGE .857 .857 .928 .928 .857 .857
HOMEBLDG .833 .833 .833 .833 .833 .777
-----
UTILITY .743 .82 .769 .794 .769 .743
GOLD .666 .777 .8 .8 .777 .777
HOSPITAL .642 .642 .642 .642 .642 .642
ETFS .636 .727 .709 .745 .727 .527
INSURANC .56 .52 .6 .52 .52 .4
NASD-100 .53 .57 .54 .6 .55 .41
=====
HIGHPRIC .515 .536 .506 .562 .528 .406
================================================================================================
GUNS .5 .5 .428 .428 .428 .357
=================================================================================================
GAMING .473 .526 .578 .684 .578 .421
BIOTECH .467 .482 .465 .452 .452 .398
DJI-13 .461 .461 .461 .461 .461 .461
SOFTWARE .446 .428 .41 .392 .339 .267
COMODITY .435 .435 .41 .435 .435 .41
DOWJONES .433 .566 .566 .566 .566 .5
=====
FOOD .428 .448 .408 .469 .469 .408
FIDSTKS .414 .443 .449 .467 .449 .366
SP500 .406 .427 .435 .455 .449 .357
=====
INDEXES .405 .432 .448 .459 .432 .378
INFRA .393 .393 .393 .393 .393 .363
RUS-1000 .392 .403 .406 .428 .418 .328
GREEN .388 .388 .444 .444 .444 .5
SP-100 .377 .422 .433 .433 .433 .355
NIFTY .363 .386 .386 .409 .386 .295
COMPUTER .35 .4 .25 .25 .25 .25
RETAIL .347 .369 .347 .369 .369 .239
BONDFUND .321 .321 .229 .287 .379 .218
TRANSP .315 .315 .421 .421 .473 .315
HACKERS .312 .25 .25 .312 .25 .125
ELECTRON .285 .285 .248 .255 .255 .218
LOWPRICE .28 .295 .295 .272 .255 .243
CHEM .279 .279 .255 .279 .302 .232
REIT .237 .278 .254 .262 .229 .188
INDMATER .236 .25 .25 .277 .263 .222
SEMI .234 .244 .191 .244 .234 .18
JETS .23 .23 .307 .23 .23 .153
AUTO .226 .264 .264 .283 .226 .113
FINANCE .2 .2 .187 .187 .187 .175
MILITARY .192 .269 .269 .23 .23 .23
COAL .166 .166 .166 .166 .166 .166
EDU .166 .166 0 .166 0 0
BIGBANKS .142 .142 .142 .142 .142 0
CHINA .136 .181 .159 .136 .159 .25
SOLAR .125 .062 .062 .125 .062 .062
OILGAS .113 .134 .154 .154 .175 .113
MARIJUAN .1 .3 .2 .2 .2 0
REGBANKS .073 .048 .048 .048 .048 .048
-----
COPPER 0 0 .142 .142 .142 0
|
====================================================================================
Thursday - 5/11/2023 - 4:30 AM Futures DJI -83 NASDAQ +7 Data
used 5/10/2023
| |
5/10/2023
|
|
| |
The DJI internals are falling and negative. As yesterday showed, even
its opening
strength cannot be trusted. May is not usually a good time to
buy the DJI.
It rises only 33% of the time over the next two months in
years before a
Presidential Election since 1967 after May 10th. Bulls
may hope that the
NASDAQ will outperform the DJI, but more often
a DJI decline
causes the NASDAQ to retreat, too.
The DJI remains
trapped between its rising support line and its flat resistance
about 800 points
above today's close. Its Closing Power is below its falling
21-dma.
Professionals are now net sellers as they grow cautious from the
unresolved
political conflict over whether the Congress should authorize
payments of the
Federal deficit, including payments to contractors, senions
and physicians.
In 2011, no agreement was reached until the DJI swooned
17% as US debt
began to be downgraded by credit agencies. The Publc
and overseas
buyers assume that an agreement will be reached. I would not
bet on that.
Tonight former President Trump decared that Congress should
allow the Federal
Government to go in default. This will make it harder for
a compromise to
be reached.
But the bulls
dismiss this as poltical theatrics and now happily believe that
a pause in the
FED's raising of interes rates is at hand. Tell that to the
regional bankers
that fell some more today. Or the retail stocks, whose index
RETL threatens
now to break down to new lows. Or to Peerless followers
who understand
that March and April Sell S12s sometimes take a month
to turn the DJI
down. Less than 40% of all 6000 stocks and ETFs we
track are safely
back above their 65-dma.
The main aspect
of the market remains unchanged. With the DJI's volatility
tightly bound by
its rising support and flat resistance, it pays for traders to
look elsewhere
for vehicles suitable for trading. While the QQQ and NASDAQ
did make nominal
recovery highs today and do showing rising uptrends of Closing
Power, so that
one could pick them to go long, that may not make much
money. It
picks a fight with the still active Sell S12 and ignores the weakness
in the broad
market and most of all in NASDAQ stocks, where there were many
more new lows
than new highs today.
So, once again, I
have to urge hedging. And once again, it was profitable
in most of its
longs and in its shorts today.
See the Bullish
MAXCPs for longs, especially MSFT, NVDA, home-builders,
LLY and the
"sweets-stocks". For shorts, note the continuing declines
in the regional
banks and how it is now threatening even FAS with a serious
breakdown.
The weakest retailers keep falling. Look at CVS. M (Macy's)
has now broken
down, too A new price low by RETL will probably start another
leg down for that
ETF and its relailer components.
While it is true
the number of new highs may increase briefly, I am much more
concerned that
SCHWab will breakdown along with AA (Alcoa), Bank of
America (BAC),
Northrop (NOC), and MMM in the DJI-30. |
|
| |
5/10/2023
2022 PEERLESS DJI, Signals, Indicators Daily DJI Volume
10-DayUp/Down Vol Stoch-20 CCI RSI Pct of All Stocks above 65-dma
Inverted Traders Index
DJI-IPA DJI-OBV Short-Term Rates
NASDAQ S&P OEX NYSE DJ-15 DJ-20 DJI-30
Tiger Index of Big
Banks Bond
Funds Gold Stocks
Housing Stocks
Insurance-Stocks
Regional Banks
Russell-1000
Semi Conductors
Recent 2006 vers-Peerless signals http://tigersoftware.com/oldpeer/UPD90510.bmp
ETFs: DIA QQQ SPY IWM MDY
TNA Short-Term Rates Ten Year Rates PST (Short Treasuries)
DOLLAR-UUP
ALLSTOCKs
COIN (Bit
Coin ETF)
USO-CrudeOil DBO
BLDP FAS GLD HD IBB JETS JNUG KOL NAIL NUGT
NRGU OIH PALL RSX RETL SDS AGQ SLV SOXL TAN TECL TLT TMF TNA
UGA USO China: YINN CHAU
Commodities: CANE
CORN DBC JJC, NIB CORN, CUT (paper)
MOO, NRGU
SOYB WEAT UUP (Dollar) LIT
(Lithium) PALL
(Palladium)
Stocks AA AAPL ADBE ALXN AMAT AMGN AMD AMZN ANET AXON AXP
BA BABA BAC BIDU BLDP BSX CAT CDNS CHKP CNX CPB CRM CVX CMG
DE DIS ENPH FB FSLR FTNT GILD GME GOOG GS HD IBM INTU JPM KO KR
LRCX MRK MRNA MOS MSFT NEM NFLX NKE NOC NUE NVDA PANW PG PYPL
QCOM QDEL REGN REV RE SCHW SNOW SO SQUARE TSLA TXN XOM V VRTX
WFC WMT XLE ZM ZOM
NEW-HOMEBUILDERS:
NAIL BZH MHO MTH PHM
NEW-REGIONAL
BANKS: EGBN FFIC GBCI HMST
Leveraged Short ETFs:
FAZ - financials, TZA and SRTY- small caps, MZZ - mid caps, TECS -Techs,
SOXS -
semi-conductors LABD
- Biotechs
Bullish MAXCPs www.tigersoftware.com/UPPING/5-10-2023/Bullish.htm
Bearish MINCPs www.tigersoftware.com/Downing/5-10-2023/BEARISH.htm
|
|

 |
 |
 |
 |
 |
 |
 |
 |
 |
STOCKS TO WATCH
 |
 |
 |
|
BEARISH STOCKS |
 |
 |
 |
 |
 |
Table 1 - Daily Volume and Breadth Statistics
| NYSE |
Latest Close |
Previous
Close |
Week Ago |
| Issues
traded |
3,086 |
3,080 |
3,095 |
| Advances |
1,707 |
1,202 |
1,130 |
| Declines |
1,264 |
1,753 |
1,841 |
| Unchanged |
115 |
125 |
124 |
| New
highs |
60 |
49 |
79 |
| New
lows |
69 |
76 |
104 |
| Adv.
volume* |
429,891,264 |
358,676,050 |
341,208,371 |
| Decl.
volume* |
464,742,774 |
494,527,371 |
644,144,230 |
| Total
volume* |
903,467,621 |
875,127,332 |
996,296,923 |
| Closing
Arms (TRIN)† |
1.41 |
0.83 |
1.13 |
| Block
trades* |
4,361 |
4,250 |
4,349 |
| Adv.
volume |
1,957,659,830 |
1,665,884,957 |
1,476,745,146 |
| Decl.
volume |
2,047,757,683 |
2,021,707,952 |
2,714,996,683 |
| Total
volume |
4,057,169,925 |
3,810,146,102 |
4,246,517,459 |
| NASDAQ |
Latest Close |
Previous
Close |
Week Ago |
| Issues
traded |
4,613 |
4,633 |
4,566 |
| Advances |
2,541 |
1,877 |
2,180 |
| Declines |
1,849 |
2,531 |
2,186 |
| Unchanged |
223 |
225 |
200 |
| New
highs |
106 |
87 |
78 |
| New
lows |
171 |
188 |
281 |
| Closing
Arms (TRIN)† |
1.06 |
0.99 |
1.47 |
| Block
trades |
28,043 |
21,720 |
51,675 |
| Adv.
volume |
2,737,144,052 |
1,746,192,160 |
2,314,718,728 |
| Decl.
volume |
2,109,145,859 |
2,322,031,872 |
3,407,381,300 |
|
Table 2 QUICKSILVER on ETFS - 5/10/2023 ---
Bullish = 2 GLD (.332), TECL (+.305)
Bearish = 3 FAS (-.311) RETL (-.371), OIH (-.331)
ETF CLOSE CHANGE PIVOT-PT 5-dma AROC CL-PWR CANDLE IP21 ITRS POWER INDEX
===============================================================================================
DIA 335.49 -.28 331.33 20.6% Bearish RED .073 0 ---
---------------------------------------------------------------------------------------------
COMPQX 12306.44 126.89 11966.4 115.8% ------- BLUE .052 .047 .099
---------------------------------------------------------------------------------------------
SPY 412.85 1.92 405.13 58.9% ------- RED .065 .015 .08
---------------------------------------------------------------------------------------------
QQQ 325.14 3.5 316.17 122.5% ------- BLUE .051 .08 .131
---------------------------------------------------------------------------------------------
MDY 447.37 .8 439.95 -5.2% Bearish RED -.098 -.085 -.183
---------------------------------------------------------------------------------------------
IWM 174.41 .88 170.4 60.1% Bearish RED -.04 -.1 -.14
---------------------------------------------------------------------------------------------
FAS 56.11 -1 53.56 38.2% Bearish RED .028 -.339 -.311
---------------------------------------------------------------------------------------------
RETL 6.5 -.01 5.96 205% Bearish RED -.09 -.281 -.371
---------------------------------------------------------------------------------------------
SOXL 14.31 .37 13.6 166.7% Bearish RED .048 -.051 -.003
---------------------------------------------------------------------------------------------
TECL 36.98 1.27 34.11 333.6% ------- BLUE .011 .294 .305
---------------------------------------------------------------------------------------------
IBB 131.03 .43 130.3 13.4% ------- RED .102 .003 .105
---------------------------------------------------------------------------------------------
GLD 188.75 -.27 190.44 -9.5% Bullish RED .248 .084 .332
---------------------------------------------------------------------------------------------
DBO 14.15 -.1 13.37 305% Bearish RED -.141 -.064 -.205
---------------------------------------------------------------------------------------------
OIH 259.83 -3.3 254.58 121.6% Bearish RED -.139 -.192 -.331
---------------------------------------------------------------------------------------------
CPER 23.63 -.4 23.65 10.5% ------- ---- .01 -.076 -.066
---------------------------------------------------------------------------------------------
TAN 69.89 .64 68.27 85.2% Bearish BLUE .003 -.087 -.084
---------------------------------------------------------------------------------------------
UUP 27.74 -.05 27.7 12.6% Bullish ---- -.01 -.051 -.061
---------------------------------------------------------------------------------------------
CORN 23.21 .05 23.47 -59.6% Bullish BLUE .119 -.101 .018
---------------------------------------------------------------------------------------------
WEAT 6.43 -.04 6.47 -7.7% ------- ---- .093 -.128 -.035
---------------------------------------------------------------------------------------------
YINN 40.18 -.8 40.52 310.5% Bearish BLUE -.074 -.067 -.141
|
Table 3 RANKING OF KEY DIRECTORIES BASED PCT.OF STOCKS ABOVE 65-DMA
5/10/23
Bullish = 11
Bearish = 37
---------------------------------------------------------------------------------------
Directory Current day-1 day-2 day-3 day-4 day-5
----------------------------------------------------------------------------------------
BEVERAGE .857 .928 .928 .857 .857 .857
HOMEBLDG .833 .833 .833 .833 .777 .833
UTILITY .82 .769 .794 .769 .743 .666
GOLD .777 .8 .8 .777 .777 .755
ETFS .727 .709 .745 .727 .545 .49
HOSPITAL .642 .642 .642 .642 .642 .714
NASD-100 .57 .54 .6 .55 .41 .42
DOWJONES .566 .566 .566 .566 .5 .533
HIGHPRIC .536 .506 .562 .528 .406 .471
GAMING .526 .578 .631 .631 .421 .631
INSURANC .52 .6 .52 .52 .4 .48
============================================================================================
GUNS .5 .428 .428 .428 .357 .357
============================================================================================
BIOTECH .482 .462 .455 .452 .398 .412
DJI-13 .461 .461 .461 .461 .461 .461
FOOD .448 .428 .448 .469 .408 .408
FIDSTKS .443 .449 .467 .449 .366 .384
COMODITY .435 .435 .41 .435 .41 .41
INDEXES .432 .448 .459 .432 .378 .378
SOFTWARE .428 .428 .392 .339 .285 .339
SP500 .427 .435 .457 .445 .361 .386
SP-100 .422 .433 .433 .433 .355 .388
RUS-1000 .403 .406 .428 .418 .328 .36
COMPUTER .4 .25 .25 .25 .25 .25
INFRA .393 .393 .393 .393 .363 .363
GREEN .388 .444 .444 .444 .5 .388
NIFTY .386 .386 .409 .386 .295 .318
RETAIL .382 .361 .382 .382 .234 .255
BONDFUND .321 .218 .287 .39 .229 .241
TRANSP .315 .421 .421 .473 .315 .421
MARIJUAN .3 .2 .2 .2 0 .1
LOWPRICE .295 .297 .275 .257 .243 .246
ELECTRON .285 .248 .255 .255 .21 .187
CHEM .279 .255 .279 .302 .232 .255
REIT .278 .245 .27 .237 .163 .147
MILITARY .269 .269 .23 .23 .23 .423
AUTO .264 .283 .283 .226 .113 .15
HACKERS .25 .25 .312 .25 .125 .125
INDMATER .25 .25 .277 .263 .222 .263
SEMI .244 .191 .244 .234 .17 .159
JETS .23 .307 .23 .23 .307 .384
FINANCE .2 .187 .187 .175 .175 .175
CHINA .181 .159 .136 .159 .295 .272
COAL .166 .166 .166 .166 .166 .166
EDU .166 0 .166 0 0 .166
BIGBANKS .142 .142 .142 .142 0 0
OILGAS .134 .154 .154 .175 .113 .123
SOLAR .062 .062 .125 .062 .062 .062
REGBANKS .048 .048 .048 .048 .048 .048
COPPER 0 .142 .142 .142 0 .142
|
====================================================================================
Wednesday - 5/10/2023 - 6:15 AM Futures DJI
+100 NASDAQ +50 Data used 5/9/2023
| |
5/9/2023
|
|
| |
The
technical picture of the general market is unchanged, even if we now factor
in "only" a
4.9% yearly rise in the just reported CPI. Bulls will note the rising
Closing Powers for the
NASDAQ, DIA, QQQ and SPY. Professionals expected
a modest subsidence in
the rate of inflation. Enough of the most heavily weighted
stocks that make up the
SP-500 and NASDAQ are rising and near their highs
to hold the market up,
too. And the flat tops in these major indexes and ETFs
do most often become
platforms for breakout advances.
But the basic technical
fact is less than 40% of all stocks are above their 65-dma.
Most are struggling not
to breakout but to just hold up. And now all stocks must
wait for the Republican
House Speaker and the Democrat President to agree on
some kind of a
compromise about the Budget and how to pay for Federal debts
about to come due in
June. Will a trillion dollar coin have to be minted? Will
the XIV ammendment's
reference to the debt of the US not being questioned
be claimed by the
Administration? Willl right wing budget hawks settle for
anything less than
surrender by Democrats who have too long made a specialty
of spending other
people's money?
For months the
DJI has wobbled and fluctuated between 32000 and 34500.
Too little
movement to make money except for those who write covered calls
or who play a
different game, namely betting on the strongest sectors and shorting
the weakest.
That startegy has meant shorting regional banks or very weak
retailers and buy
some leading home-builders. beverage or sugar stocks and
gold stocks.
I've seen nothing so far that would justify changing our approach.
|
|
| |
5/9/2023
2022 PEERLESS DJI, Signals, Indicators Daily DJI Volume
10-DayUp/Down Vol Stoch-20 CCI RSI Pct of All Stocks above 65-dma
Inverted Traders Index
DJI-IPA DJI-OBV Short-Term Rates
NASDAQ S&P OEX NYSE DJ-15 DJ-20 DJI-30
Tiger Index of Big
Banks Bond
Funds Gold Stocks
Housing Stocks
Insurance-Stocks
Regional Banks
Russell-1000
Semi Conductors
Recent 2006 vers-Peerless signals http://tigersoftware.com/oldpeer/UPD90509.bmp
ETFs: DIA QQQ SPY IWM MDY
TNA Short-Term Rates Ten Year Rates PST (Short Treasuries)
DOLLAR-UUP
ALLSTOCKs
COIN (Bit
Coin ETF)
USO-CrudeOil DBO
BLDP FAS GLD HD IBB JETS JNUG KOL NAIL NUGT
NRGU OIH PALL RSX RETL SDS AGQ SLV SOXL TAN TECL TLT TMF TNA
UGA USO China: YINN CHAU
Commodities: CANE
CORN DBC JJC, NIB CORN, CUT (paper)
MOO, NRGU
SOYB WEAT UUP (Dollar) LIT
(Lithium) PALL
(Palladium)
Stocks AA AAPL ADBE ALXN AMAT AMGN AMD AMZN ANET AXON AXP
BA BABA BAC BIDU BLDP BSX CAT CDNS CHKP CNX CPB CRM CVX CMG
DE DIS ENPH FB FSLR FTNT GILD GME GOOG GS HD IBM INTU JPM KO KR
LRCX MRK MRNA MOS MSFT NEM NFLX NKE NOC NUE NVDA PANW PG PYPL
QCOM QDEL REGN REV RE SCHW SNOW SO SQUARE TSLA TXN XOM V VRTX
WFC WMT XLE ZM ZOM
NEW-HOMEBUILDERS:
NAIL BZH MHO MTH PHM
NEW-REGIONAL
BANKS: EGBN FFIC GBCI HMST
Leveraged Short ETFs:
FAZ - financials, TZA and SRTY- small caps, MZZ - mid caps, TECS -Techs,
SOXS -
semi-conductors LABD
- Biotechs
Bullish MAXCPs www.tigersoftware.com/UPPING/5-09-2023/Bullish.htm
Bearish MINCPs www.tigersoftware.com/Downing/5-09-2023/BEARISH.htm
|
|


|
 |
 |
 |
 |
 |
 |
 |
Daily Breadth and Volume Statistics
| NYSE |
Latest Close |
Previous
Close |
Week Ago |
| Issues
traded |
3,080 |
3,084 |
3,094 |
| Advances |
1,202 |
1,405 |
603 |
| Declines |
1,753 |
1,574 |
2,398 |
| Unchanged |
125 |
105 |
93 |
| New
highs |
49 |
59 |
41 |
| New
lows |
76 |
44 |
152 |
| Adv.
volume* |
358,676,050 |
437,167,040 |
146,443,936 |
| Decl.
volume* |
494,527,371 |
356,068,601 |
817,926,099 |
| Total
volume* |
875,127,332 |
810,107,971 |
969,771,077 |
| Closing
Arms (TRIN)† |
0.83 |
0.65 |
1.26 |
| Block
trades* |
4,250 |
4,138 |
4,515 |
| Adv.
volume |
1,665,884,957 |
2,055,203,497 |
739,997,448 |
| Decl.
volume |
2,021,707,952 |
1,496,378,279 |
3,717,545,876 |
| Total
volume |
3,810,146,102 |
3,641,645,071 |
4,486,130,982 |
| NASDAQ |
Latest Close |
Previous
Close |
Week Ago |
| Issues
traded |
4,633 |
4,613 |
4,624 |
| Advances |
1,877 |
2,128 |
1,281 |
| Declines |
2,531 |
2,273 |
3,127 |
| Unchanged |
225 |
212 |
216 |
| New
highs |
87 |
81 |
62 |
| New
lows |
188 |
113 |
442 |
| Closing
Arms (TRIN)† |
0.99 |
0.46 |
0.76 |
| Block
trades |
21,720 |
24,392 |
44,570 |
| Adv.
volume |
1,746,192,160 |
2,782,368,736 |
1,893,177,912 |
| Decl.
volume |
2,322,031,872 |
1,369,984,118 |
3,515,735,998 |
| Total
volume |
4,126,782,968 |
4,216,362,702 |
5,501,414,589 |
|
Table 2 QUICKSILVER on ETFS - 5/9/2023 ---
Bullish = 1 GLD (.363)
Bearish = 3 FAS (-26) RETL (-.333), OIH (-.298)
ETF CLOSE CHANGE PIVOT-PT 5-dma AROC CL-PWR CANDLE IP21 ITRS POWER INDEX
===============================================================================================
DIA 335.77 -.45 334.11 -16.4% Bearish BLUE .066 0 ----
---------------------------------------------------------------------------------------------
COMPQX 12179.55 -77.37 12025.33 40.9% ------- RED .002 .042 .044
---------------------------------------------------------------------------------------------
SPY 410.93 -1.81 408.02 1.1% ------- RED .032 .013 .045
---------------------------------------------------------------------------------------------
QQQ 321.64 -2.05 317.29 35.3% ------- RED -.006 .074 .068
---------------------------------------------------------------------------------------------
MDY 446.57 -1.52 447.83 -15.4% Bearish BLUE -.094 -.082 -.176
---------------------------------------------------------------------------------------------
IWM 173.53 -.52 172.33 53% Bearish BLUE -.038 -.098 -.136
---------------------------------------------------------------------------------------------
FAS 57.11 -.68 55.68 -55.8% ------- BLUE .053 -.318 -.265
---------------------------------------------------------------------------------------------
RETL 6.51 -.04 6.24 126.8% Bearish ---- -.057 -.276 -.333
---------------------------------------------------------------------------------------------
SOXL 13.94 -.71 13.84 -144.5% Bearish RED .015 -.059 -.044
---------------------------------------------------------------------------------------------
TECL 35.71 -.85 34.61 25.4% ------- RED -.046 .248 .202
---------------------------------------------------------------------------------------------
IBB 130.6 -.25 130.68 30.2% ------- BLUE .087 .009 .096
---------------------------------------------------------------------------------------------
GLD 189.02 1.33 189.11 39.8% Bullish BLUE .265 .098 .363
---------------------------------------------------------------------------------------------
DBO 14.25 .15 13.31 153.4% ------- BLUE -.122 -.042 -.164
---------------------------------------------------------------------------------------------
OIH 263.13 1.03 253.53 123.8% Bearish BLUE -.114 -.184 -.298
---------------------------------------------------------------------------------------------
CPER 24.03 -.06 23.58 67.3% Bullish BLUE .012 -.037 -.025
---------------------------------------------------------------------------------------------
TAN 69.25 -.7 68.71 31.8% Bearish RED .015 -.087 -.072
---------------------------------------------------------------------------------------------
UUP 27.79 .09 27.67 -5.4% Bullish ---- -.023 -.04 -.063
---------------------------------------------------------------------------------------------
CORN 23.16 -.43 23.49 21.3% Bullish ---- .091 -.111 -.02
---------------------------------------------------------------------------------------------
WEAT 6.47 -.09 6.44 248.2% Bearish ---- .066 -.118 -.052
---------------------------------------------------------------------------------------------
YINN 40.98 -2.23 37.64 373.4% Bearish BLUE -.102 -.075 -.177
|
Table 3 RANKING OF KEY DIRECTORIES BASED PCT.OF STOCKS ABOVE 65-DMA
5/9/23
Bullish = 11
Bearish = 38
---------------------------------------------------------------------------------------
Directory Current day-1 day-2 day-3 day-4 day-5
----------------------------------------------------------------------------------------
BEVERAGE .928 .928 .857 .857 .857 .857
HOMEBLDG .833 .833 .833 .777 .833 .833
GOLD .8 .8 .777 .777 .755 .777
UTILITY .769 .794 .769 .743 .641 .743
ETFS .709 .745 .727 .545 .509 .49
HOSPITAL .642 .642 .642 .642 .714 .714
INSURANC .6 .52 .52 .4 .48 .48
GAMING .578 .631 .578 .473 .631 .578
DOWJONES .566 .566 .566 .5 .533 .533
NASD-100 .54 .6 .55 .41 .42 .47
HIGHPRIC .506 .562 .528 .406 .467 .48
================================================================================================
BIOTECH .462 .452 .455 .398 .407 .355
DJI-13 .461 .461 .461 .461 .461 .461
FIDSTKS .449 .467 .449 .366 .378 .414
INDEXES .448 .459 .432 .378 .378 .389
GREEN .444 .444 .444 .5 .333 .388
COMODITY .435 .435 .41 .41 .41 .41
SP500 .435 .457 .447 .357 .386 .396
SP-100 .433 .433 .433 .355 .388 .4
FOOD .428 .469 .448 .408 .408 .408
GUNS .428 .428 .428 .357 .357 .357
SOFTWARE .428 .41 .339 .285 .339 .357
TRANSP .421 .421 .473 .315 .421 .368
RUS-1000 .406 .428 .418 .328 .356 .362
INFRA .393 .393 .393 .363 .333 .333
NIFTY .386 .409 .386 .295 .318 .363
RETAIL .361 .382 .382 .234 .255 .34
JETS .307 .23 .23 .307 .384 .307
LOWPRICE .297 .277 .26 .246 .246 .243
AUTO .283 .301 .226 .113 .132 .226
MILITARY .269 .23 .23 .23 .423 .346
CHEM .255 .279 .302 .232 .232 .232
COMPUTER .25 .25 .25 .25 .25 .3
HACKERS .25 .312 .25 .125 .125 .125
INDMATER .25 .277 .263 .222 .263 .277
ELECTRON .248 .255 .255 .21 .187 .21
REIT .245 .262 .245 .172 .122 .106
BONDFUND .218 .275 .39 .241 .229 .218
MARIJUAN .2 .2 .2 0 .1 .1
SEMI .191 .244 .234 .17 .159 .191
FINANCE .187 .187 .175 .162 .162 .187
COAL .166 .166 .166 .166 .166 .166
CHINA .159 .136 .159 .295 .272 .25
OILGAS .154 .154 .175 .113 .123 .134
BIGBANKS .142 .142 .142 0 0 .142
COPPER .142 .142 .142 0 .142 .142
SOLAR .062 .125 .062 .062 .062 .062
REGBANKS .048 .048 .048 .048 .048 .048
EDU 0 .166 0 0 .166 .166
|
====================================================================================
Tuesday - 5/9/2023 - 6:06 AM Futures DJI -90 NASDAQ -75 Data
used 5/8/2023
| |
5/8/2023
|
|
| |
The DJI-30 looks droopy. Most
of its internal strength indicators are falling
and negative. Even its Closing Power is just
barely rated as positive and rising
upon inspection of DIA's chart below. This past
year's best two indicators for
the DJI have been the trend of the 21-dma of advances
minus declines (or the
PI, as we call it) and the 50-day stochastic.
Both have broken their uptrends.
Note also how the DJI has not been able to get past
its 21-dma. The lowest
Power Ranked stock in the DJI-30 is now its most
heavily weighted component,
UNH. All this and the still active, if delayed,
S12 suggest that a DJI decline from
its flat overhead resistance appears to be in the
making. A retesting of 33,000
would not come as a surprise, especially if Biden and
McCarthy have a public
"falling out" arguing about the limit on
the Federal Deficit.
But what if the CPI number comes out below 5% from a
year ago. Would not
that encourage the bulls? Judging from the
again falling regional banks, the CPI's
rise from last year, as released on Wednesday,
Inflation may not subside enough
to cause the FED to pause in their pushing for higher
interest rates.
I have said I thought that the FED will pause for
fear of causing more bankruptcies
among the regional banks. But I may be wrong.
The FED created a near-decpression
in 1920-1921 which led to a host of banks failing and
even the bombing of Wall Street.
The FED did not lower rates until 18 months after
they began raising rates. Of course,
they delayed way too long from 1930 to 1933.
But they did relent in early 1967
after raising rates in early 1967. They waited
too long in 2008. But they suddenly
switched from tight to lose money in 2018. So,
realistically, we can only wait and see.
Oh, and also watch the Professionals and our Closing
Power. See how Table 2 below
rates the Professionals predominately bearish now.
Meanwhile our falling Accumulation
Index trends are warnng that big money is unwilling
to do the necessary buying on
strength to bring about breakouts in most stocks or
key ETFs. That is also why
down-day volume recently has been above up-day
volume.
All this is why I've suggested hedging, being long
the strongest stocks and short the
weakest. The Bullish MAXCPs emphasize the
"Sugar" stocks and home-builders
as well as NVDA and AAPL. The Bearish MINCPS
offer some retailers as
well as lots of regional bank stocks. Watch
RETL to see if it breaks down to a
new low. Higher interest rates will definitely
reduce credit card buying. The way
MA (Master Card) has risen to its old highs suggests
it may the way to making more
money is to raise the interest rates on credit card
still higher since the Jobs Report
shows no recession is in sight. |
|
| |
5/8/2023
2022 PEERLESS DJI, Signals, Indicators Daily DJI Volume
10-DayUp/Down Vol Stoch-20 CCI RSI Pct of All Stocks above 65-dma
Inverted Traders Index
DJI-IPA DJI-OBV Short-Term Rates
NASDAQ S&P OEX NYSE DJ-15 DJ-20 DJI-30
Tiger Index of Big
Banks Bond
Funds Gold Stocks
Housing Stocks
Insurance-Stocks
Regional Banks
Russell-1000
Semi Conductors
Recent 2006 vers-Peerless signals http://tigersoftware.com/oldpeer/UPD90506.bmp
ETFs: DIA QQQ SPY IWM MDY
TNA Short-Term Rates Ten Year Rates PST (Short Treasuries)
DOLLAR-UUP
ALLSTOCKs
COIN (Bit
Coin ETF)
USO-CrudeOil DBO
BLDP FAS GLD HD IBB JETS JNUG KOL NAIL NUGT
NRGU OIH PALL RSX RETL SDS AGQ SLV SOXL TAN TECL TLT TMF TNA
UGA USO China: YINN CHAU
Commodities: CANE
CORN DBC JJC, NIB CORN, CUT (paper)
MOO, NRGU
SOYB WEAT UUP (Dollar) LIT
(Lithium) PALL
(Palladium)
Stocks AA AAPL ADBE ALXN AMAT AMGN AMD AMZN ANET AXON AXP
BA BABA BAC BIDU BLDP BSX CAT CDNS CHKP CNX CPB CRM CVX CMG
DE DIS ENPH FB FSLR FTNT GILD GME GOOG GS HD IBM INTU JPM KO KR
LRCX MRK MRNA MOS MSFT NEM NFLX NKE NOC NUE NVDA PANW PG PYPL
QCOM QDEL REGN REV RE SCHW SNOW SO SQUARE TSLA TXN XOM V VRTX
WFC WMT XLE ZM ZOM
NEW-HOMEBUILDERS:
NAIL BZH MHO MTH PHM
NEW-REGIONAL
BANKS: EGBN FFIC GBCI HMST
Leveraged Short ETFs:
FAZ - financials, TZA and SRTY- small caps, MZZ - mid caps, TECS -Techs,
SOXS -
semi-conductors LABD
- Biotechs
Bullish MAXCPs www.tigersoftware.com/UPPING/5-08-2023/Bullish.htm
Bearish MINCPs www.tigersoftware.com/Downing/5-08-2023/BEARISH.htm
|
|
DJI looks bearish with so many declining internal strength indicators
and Sell from Stochastic-50


|
With DIA,
Closing Power's 21-dma is falling while trend is still up.
 |
At flat resistance - CP
is just above its ma. Note heavier down volume at bottom.
 |
 |
 |
STRONG STOCK FOLLOW:
 |
|
|
WEAK STOCKS FOLLOW |
 |
 |
 |
STRONG STOCKS FOLLOW
 |
 |
 |
|
 |
Daily Breadth Statistics
| NYSE |
Latest Close |
Previous
Close |
Week Ago |
| Issues
traded |
3,084 |
3,073 |
3,096 |
| Advances |
1,405 |
2,549 |
1,212 |
| Declines |
1,574 |
438 |
1,776 |
| Unchanged |
105 |
86 |
108 |
| New
highs |
59 |
48 |
83 |
| New
lows |
44 |
49 |
35 |
| Adv.
volume* |
437,167,040 |
827,963,324 |
352,122,253 |
| Decl.
volume* |
356,068,601 |
91,824,338 |
433,673,549 |
| Total
volume* |
810,107,971 |
925,735,935 |
792,214,141 |
| Closing
Arms (TRIN)† |
0.65 |
0.70 |
0.83 |
| Block
trades* |
4,138 |
4,727 |
3,934 |
| Adv.
volume |
2,055,203,497 |
3,710,307,802 |
1,483,166,104 |
| Decl.
volume |
1,496,378,279 |
449,425,330 |
1,808,304,138 |
| Total
volume |
3,641,645,071 |
4,186,270,049 |
3,321,376,860 |
| NASDAQ |
Latest Close |
Previous
Close |
Week Ago |
| Issues
traded |
4,613 |
4,583 |
4,596 |
| Advances |
2,128 |
3,221 |
2,048 |
| Declines |
2,273 |
1,180 |
2,388 |
| Unchanged |
212 |
182 |
160 |
| New
highs |
81 |
99 |
103 |
| New
lows |
113 |
135 |
198 |
| Closing
Arms (TRIN)† |
0.46 |
0.64 |
0.94 |
| Block
trades |
24,392 |
25,790 |
46,644 |
| Adv.
volume |
2,782,368,736 |
3,680,590,012 |
2,459,008,432 |
| Decl.
volume |
1,369,984,118 |
866,199,736 |
2,684,726,905 |
| Total
volume |
4,216,362,702 |
4,574,791,473 |
5,168,438,845 |
|
Table 2 QUICKSILVER on ETFS - 5/6/2023 ---
Bullish = 2 GLD (.37), TECL (.322)
Bearish = 3 RETL (-.311), OIH (-.306) and DBOil (-.258)
Closing Power - All but UUP, Gold and Corn are falling and bearish.
ETF CLOSE CHANGE PIVOT-PT 5-dma AROC CL-PWR CANDLE IP21 ITRS POWER INDEX
===============================================================================================
DIA 336.22 -.51 336.87 -61.6% Bearish RED .118 0 -----
---------------------------------------------------------------------------------------------
COMPQX 12256.92 21.51 12080.51 18.3% ------- BLUE .073 .051 .124
---------------------------------------------------------------------------------------------
SPY 412.74 .11 410.84 -33.7% ------- RED .09 .017 .107
---------------------------------------------------------------------------------------------
QQQ 323.69 .8 319.38 23.5% ------- BLUE .051 .084 .135
---------------------------------------------------------------------------------------------
MDY 448.09 -1.41 447.95 -70.9% Bearish RED -.057 -.081 -.138
---------------------------------------------------------------------------------------------
IWM 174.05 -.4 171.7 -36.2% Bearish RED -.014 -.096 -.11
---------------------------------------------------------------------------------------------
FAS 57.79 .42 57.74 -370.1% ------- RED .089 -.313 -.224
---------------------------------------------------------------------------------------------
RETL 6.55 .11 6.35 79.5% Bearish ---- -.037 -.274 -.311
---------------------------------------------------------------------------------------------
SOXL 14.65 .18 14.35 -3.5% Bearish BLUE .053 -.001 .052
---------------------------------------------------------------------------------------------
TECL 36.56 -.06 35.53 0% ------- BLUE .018 .294 .312
---------------------------------------------------------------------------------------------
IBB 130.85 -1.07 129.81 -26.4% ------- RED .088 .01 .098
---------------------------------------------------------------------------------------------
GLD 187.69 .23 187.52 99.1% Bullish RED .266 .09 .356
---------------------------------------------------------------------------------------------
DBO 14.1 .27 13.83 -159.7% Bearish RED -.189 -.069 -.258
---------------------------------------------------------------------------------------------
OIH 262.1 .52 256.75 -215.2% Bearish RED -.127 -.179 -.306
---------------------------------------------------------------------------------------------
CPER 24.09 .18 23.71 -6.3% ------- ---- -.022 -.023 -.045
---------------------------------------------------------------------------------------------
TAN 69.95 -.26 68.81 -85% Bearish RED .028 -.061 -.033
---------------------------------------------------------------------------------------------
UUP 27.7 .04 27.82 -34.2% Bullish BLUE -.058 -.052 -.11
---------------------------------------------------------------------------------------------
CORN 23.59 -.19 23.06 76.9% Bullish RED .109 -.105 .004
---------------------------------------------------------------------------------------------
WEAT 6.56 -.05 6.15 274.5% ------- RED .06 -.121 -.061
---------------------------------------------------------------------------------------------
YINN 43.21 1.04 37.97 356.1% Bearish RED -.086 .012 -.074
|
Table 3 RANKING OF KEY DIRECTORIES BASED PCT.OF STOCKS ABOVE 65-DMA
5/8/23
Bullish = 11 - Top 3 are Beverages, Homebldg and Gold)
Bearish = 38 - Regional Banks remains lowest.
---------------------------------------------------------------------------------------
Directory Current day-1 day-2 day-3 day-4 day-5
----------------------------------------------------------------------------------------
BEVERAGE .928 .857 .857 .857 .857 .928
HOMEBLDG .833 .833 .777 .833 .833 .833
GOLD .8 .777 .777 .755 .777 .733
UTILITY .789 .789 .763 .657 .763 .842
ETFS .745 .727 .545 .509 .49 .545
HOSPITAL .642 .642 .642 .714 .714 .785
GAMING .631 .578 .421 .684 .578 .631
NASD-100 .6 .55 .41 .42 .47 .56
DOWJONES .566 .566 .5 .533 .533 .6
HIGHPRIC .562 .528 .406 .467 .48 .549
INSURANC .52 .52 .4 .48 .48 .48
=======================================================================================================
FOOD .469 .469 .387 .408 .408 .408
FIDSTKS .467 .449 .366 .378 .408 .485
DJI-13 .461 .461 .461 .461 .461 .538
INDEXES .459 .432 .378 .378 .389 .448
SP500 .457 .447 .359 .381 .398 .476
BIOTECH .452 .452 .4 .407 .353 .395
GREEN .444 .444 .5 .333 .388 .555
COMODITY .435 .435 .384 .41 .41 .384
SP-100 .433 .433 .355 .388 .4 .444
GUNS .428 .428 .357 .357 .357 .357
RUS-1000 .428 .418 .328 .356 .362 .437
TRANSP .421 .473 .315 .421 .368 .421
SOFTWARE .41 .357 .285 .339 .357 .41
NIFTY .409 .386 .295 .318 .363 .431
INFRA .393 .393 .363 .333 .333 .363
RETAIL .382 .382 .234 .255 .34 .361
HACKERS .312 .25 .125 .125 .125 .25
AUTO .301 .245 .113 .132 .226 .245
REIT .292 .269 .215 .169 .138 .176
CHEM .279 .302 .232 .232 .232 .279
INDMATER .277 .263 .222 .263 .277 .291
LOWPRICE .277 .263 .249 .249 .243 .249
BONDFUND .275 .379 .241 .241 .229 .114
ELECTRON .255 .255 .21 .187 .203 .233
COMPUTER .25 .25 .25 .25 .3 .4
SEMI .244 .234 .17 .159 .18 .202
JETS .23 .23 .307 .384 .23 .307
MILITARY .23 .23 .23 .423 .346 .461
MARIJUAN .2 .2 0 .1 .1 .1
FINANCE .187 .175 .162 .15 .187 .25
COAL .166 .166 .166 .166 .166 .166
EDU .166 0 0 .166 .166 .333
OILGAS .154 .175 .113 .123 .134 .278
BIGBANKS .142 .142 0 0 .142 .142
COPPER .142 .142 0 .142 .142 .142
CHINA .136 .159 .295 .272 .227 .272
SOLAR .125 .062 .062 .062 .062 .187
REGBANKS .048 .048 .048 .048 .048 .024
|
===================================================================================
Monday - 5/8/2023 - 6:08 AM Futures DJI
+101 NASDAQ -25 Data used
5/5/2023
| |
5/5/2023
|
|
| |
Hedging is recommended.
Though the DJI and the big indices are close to
making breakouts, we have no new Peerless
Buy. In addion, only 36% of
all stocks are above their 65-dma and new
lows outnumbered new highs.
The charts for the DJI, DIA, NASDAQ, SPY
and QQQ show the market must
now eat up flat overhead resistance.
The Jobs' Report of last week argues that
the result of the Fed's hikes will be a
soft landing for the general economy. At
the same time, the regional bank
bankruptcies and their panic will make it difficult for
the FED to continue to raise rates unless
they are willing to risk causing a financial
panic, something their their original
charter instructed them to prevent. But this week
the CPI (Inflation) numbers will be
released. If the CPI rise from a year ago is
still above 5%, I think we can assume
Powell and friends will opt to raise rates
by another 1/4%. That will
certainly hurt the weakest the regional banks.
But what else?
The market is minimizing the risk of a
Budget Default in June if the Congressional
Republicans and the White House cannot
reach an accord to lift the Debt Ceiling.
In the past, an agreement has always been
reached. But in 2011, it took a 17%
sell-off in the DJI to bring that about.
Professionals, judging by our Closing Powers,
do not think this will happen.
I went through all the SP-500
charts tonight looking for head/shoulders patterns. If
there was going to be a big sell
off, one would expect numerous head and shoulders
tops. I found only two,
Morgan Stanley (MS) and Schlumberger (SLB). See below.
Watch these. If a decline is
expected, their necklines should be challenged soon.
What I did find looking at the
SP-500 charts were numberous bullishly uptrending
stocks. Probably twice
as many of these as bearish SP-500 stocks making new lows.
This comes as a surprise because
there are still more SP-500 stocks below their
65-dma than above it. See
Table 3. The biggest tech stocks, AAPL, MSFT and NVDA
are at or very near their yearly
highs. So are drug stocks LLY, MRK, BIIB and VRTX.
The sugar and beverage stocks, HSY,
MNST and PEP, are very strong. Sugar consumption
may soon not have the big health
risks thanks to LLY's anti-diabetes drug. That
also means higher milkshake sales
at MCD. See their charts below. Surprisingly also
bullish are the home builders.
Such is the need for more affordable housing that cities
like Los Angeles are offering home
builders big incentives. See the charts of PHM, LEN
and PHM on our Hotline.
I recognize that buying such stocks
may seem risky. But their Closing Power and
Relative Strength lines are still
rising. They show positive Accumulation. And we
can hedge them with shorts on the
still very weakest stocks, like CVS, DISH, MMM
and M. Until their Closing
Power and Relative Strength downtrends are broken
to the upside, hedging this way
seems reasonable.
Watch to see if RETL holds up above
its recent lows. Watch to see if SCHW can
turn back up. Its
Accumulation Index is positive and uptrending. |
|
| |
5/5/2023
2022 PEERLESS DJI, Signals, Indicators Daily DJI Volume
10-DayUp/Down Vol Stoch-20 CCI RSI Pct of All Stocks above 65-dma
Inverted Traders Index
DJI-IPA DJI-OBV Short-Term Rates
NASDAQ S&P OEX NYSE DJ-15 DJ-20 DJI-30
Tiger Index of Big
Banks Bond
Funds Gold Stocks
Housing Stocks
Insurance-Stocks
Regional Banks
Russell-1000
Semi Conductors
Recent 2006 vers-Peerless signals http://tigersoftware.com/oldpeer/UPD90505.bmp
ETFs: DIA QQQ SPY IWM MDY
TNA Short-Term Rates Ten Year Rates PST (Short Treasuries)
DOLLAR-UUP
ALLSTOCKs
COIN (Bit
Coin ETF)
USO-CrudeOil DBO
BLDP FAS GLD HD IBB JETS JNUG KOL NAIL NUGT
NRGU OIH PALL RSX RETL SDS AGQ SLV SOXL TAN TECL TLT TMF TNA
UGA USO China: YINN CHAU
Commodities: CANE
CORN DBC JJC, NIB CORN, CUT (paper)
MOO, NRGU
SOYB WEAT UUP (Dollar) LIT
(Lithium) PALL
(Palladium)
Stocks AA AAPL ADBE ALXN AMAT AMGN AMD AMZN ANET AXON AXP
BA BABA BAC BIDU BLDP BSX CAT CDNS CHKP CNX CPB CRM CVX CMG
DE DIS ENPH FB FSLR FTNT GILD GME GOOG GS HD IBM INTU JPM KO KR
LRCX MRK MRNA MOS MSFT NEM NFLX NKE NOC NUE NVDA PANW PG PYPL
QCOM QDEL REGN REV RE SCHW SNOW SO SQUARE TSLA TXN XOM V VRTX
WFC WMT XLE ZM ZOM
NEW-HOMEBUILDERS:
NAIL BZH MHO MTH PHM
NEW-REGIONAL
BANKS: EGBN FFIC GBCI HMST
Leveraged Short ETFs:
FAZ - financials, TZA and SRTY- small caps, MZZ - mid caps, TECS -Techs,
SOXS -
semi-conductors LABD
- Biotechs
Bullish MAXCPs www.tigersoftware.com/UPPING/5-05-2023/Bullish.htm
Bearish MINCPs www.tigersoftware.com/Downing/5-05-2023/BEARISH.htm
|
|
 |
 |
 |
 |
 |
 |
 --------------------------------------------------------------------------------------------------------------------
 |
 |
 |
 |
 |
 |
 |
 |
 |
 |
 ---------------------------------------------------------------------------------------------------------------------
============================================================================= |
Table 1: Daily Breadth and Volume Statistics
| NYSE |
Latest Close |
Previous
Close |
Week Ago |
| Issues
traded |
3,073 |
3,065 |
3,111 |
| Advances |
2,549 |
868 |
2,206 |
| Declines |
438 |
2,108 |
798 |
| Unchanged |
86 |
89 |
107 |
| New
highs |
48 |
38 |
72 |
| New
lows |
49 |
258 |
37 |
| Adv.
volume* |
827,963,324 |
340,816,220 |
783,703,090 |
| Decl.
volume* |
91,824,338 |
724,704,245 |
260,528,345 |
| Total
volume* |
925,735,935 |
1,070,277,352 |
1,052,329,580 |
| Closing
Arms (TRIN)† |
0.70 |
0.84 |
1.03 |
| Block
trades* |
4,727 |
4,793 |
4,606 |
| Adv.
volume |
3,710,307,802 |
1,617,485,780 |
2,940,946,388 |
| Decl.
volume |
449,425,330 |
3,280,174,423 |
1,096,860,769 |
| Total
volume |
4,186,270,049 |
4,920,099,287 |
4,087,800,666 |
| NASDAQ |
Latest Close |
Previous
Close |
Week Ago |
| Issues
traded |
4,583 |
4,601 |
4,640 |
| Advances |
3,221 |
1,745 |
2,891 |
| Declines |
1,180 |
2,662 |
1,533 |
| Unchanged |
182 |
194 |
216 |
| New
highs |
99 |
60 |
70 |
| New
lows |
135 |
476 |
153 |
| Closing
Arms (TRIN)† |
0.64 |
0.82 |
0.71 |
| Block
trades |
25,790 |
26,304 |
45,145 |
| Adv.
volume |
3,680,590,012 |
2,092,882,400 |
3,844,474,537 |
| Decl.
volume |
866,199,736 |
2,608,712,003 |
1,452,848,103 |
| Total
volume |
4,574,791,473 |
4,745,781,430 |
5,331,381,382 |
|
Table 2 QUICKSILVER on ETFS - 5/5/2023 ---
Bullish = 1 GLD (.37), TECL (.266)
Bearish = 1 RETL (-.364), OIH (-.292)
ETF CLOSE CHANGE PIVOT-PT 5-dma AROC CL-PWR CANDLE IP21 ITRS POWER INDEX
===============================================================================================
DIA 336.73 5.4 340.36 -63.8% ------- BLUE .141 0 .141
---------------------------------------------------------------------------------------------
COMPQX 12235.41 269.01 12212.6 3.6% ------- BLUE .072 .04 .112
---------------------------------------------------------------------------------------------
SPY 412.63 7.5 415.51 -40.1% ------- BLUE .106 .015 .121
---------------------------------------------------------------------------------------------
QQQ 322.89 6.72 322.19 5.2% ------- BLUE .061 .073 .134
---------------------------------------------------------------------------------------------
MDY 449.5 9.55 454.44 -58.5% ------- BLUE -.032 -.074 -.106
---------------------------------------------------------------------------------------------
IWM 174.45 4.05 175.3 -21.7% ------- BLUE .011 -.094 -.083
---------------------------------------------------------------------------------------------
FAS 57.37 3.81 62.03 -442.5% ------- BLUE .137 -.309 -.172
---------------------------------------------------------------------------------------------
RETL 6.44 .48 6.45 -110.8% Bearish BLUE -.045 -.319 -.364
---------------------------------------------------------------------------------------------
SOXL 14.47 .87 14.66 84.9% Bearish BLUE .038 -.056 -.018
---------------------------------------------------------------------------------------------
TECL 36.62 2.51 36.56 18.3% ------- BLUE .031 .235 .266
---------------------------------------------------------------------------------------------
IBB 131.92 1.62 131.54 54% ------- BLUE .125 .007 .132
---------------------------------------------------------------------------------------------
GLD 187.46 -2.98 183.97 71.1% Bullish BLUE .28 .09 .37
---------------------------------------------------------------------------------------------
DBO 13.83 .46 14.54 -329.5% ------- BLUE -.175 -.072 -.247
---------------------------------------------------------------------------------------------
OIH 261.58 7 273.29 -239.1% Bearish RED -.128 -.154 -.282
---------------------------------------------------------------------------------------------
CPER 23.91 .26 24.12 12.6% Bearish ---- -.006 -.045 -.051
---------------------------------------------------------------------------------------------
TAN 70.21 1.94 71.13 -127.5% ------- BLUE .053 -.075 -.022
---------------------------------------------------------------------------------------------
UUP 27.66 -.04 27.89 -16.2% Bullish RED -.082 -.037 -.119
---------------------------------------------------------------------------------------------
CORN 23.78 .31 23.23 85.7% Bullish BLUE .114 -.104 .01
---------------------------------------------------------------------------------------------
WEAT 6.61 .14 6.21 181.7% ------- BLUE .072 -.142 -.07
---------------------------------------------------------------------------------------------
YINN 42.17 1.65 40.38 174.9% Bearish BLUE -.056 -.099 -.155
|
Table 3 RANKING OF KEY DIRECTORIES BASED PCT.OF STOCKS ABOVE 65-DMA
5/5/23
Bullish = 11
Bearish = 38
---------------------------------------------------------------------------------------
Directory Current day-1 day-2 day-3 day-4 day-5
----------------------------------------------------------------------------------------
BEVERAGE .857 .857 .857 .857 .928 .928
-----
HOMEBLDG .833 .777 .833 .833 .833 .888
-----
UTILITY .789 .763 .657 .763 .815 .789
GOLD .777 .777 .755 .777 .733 .755
ETFS .727 .545 .509 .49 .563 .563
HOSPITAL .642 .642 .714 .714 .785 .785
GAMING .578 .421 .631 .631 .631 .578
DOWJONES .566 .5 .533 .533 .6 .7
=====
NASD-100 .55 .41 .42 .47 .55 .6
HIGHPRIC .528 .406 .467 .48 .545 .575
INSURANC .52 .4 .48 .48 .48 .44
=============================================================================================
TRANSP .473 .315 .421 .368 .421 .368
FOOD .469 .408 .387 .408 .408 .448
DJI-13 .461 .461 .461 .461 .538 .692
BIOTECH .452 .398 .41 .353 .393 .36
FIDSTKS .449 .366 .378 .408 .479 .497
SP500 .447 .359 .383 .394 .472 .48
=====
GREEN .444 .5 .333 .388 .555 .444
COMODITY .435 .41 .384 .41 .384 .435
SP-100 .433 .355 .388 .4 .444 .477
INDEXES .432 .378 .378 .389 .432 .464
GUNS .428 .357 .357 .357 .357 .357
RUS-1000 .418 .328 .356 .362 .434 .431
INFRA .393 .363 .333 .333 .363 .363
NIFTY .386 .295 .318 .363 .431 .431
RETAIL .382 .234 .255 .34 .361 .404
BONDFUND .379 .229 .241 .241 .126 .356
SOFTWARE .357 .303 .339 .357 .41 .41
CHEM .302 .232 .232 .232 .279 .302
REIT .269 .207 .176 .146 .161 .192
INDMATER .263 .222 .263 .277 .291 .277
LOWPRICE .263 .252 .252 .246 .246 .237
ELECTRON .255 .21 .187 .203 .218 .218
COMPUTER .25 .25 .25 .3 .4 .35
HACKERS .25 .125 .125 .125 .25 .25
AUTO .245 .132 .132 .226 .245 .169
SEMI .234 .17 .159 .18 .18 .191
JETS .23 .307 .384 .23 .307 .23
MILITARY .23 .23 .423 .346 .461 .346
MARIJUAN .2 0 .1 .1 .1 .1
FINANCE .175 .162 .15 .175 .25 .262
OILGAS .175 .113 .123 .134 .278 .319
COAL .166 .166 .166 .166 .166 .166
CHINA .159 .295 .272 .227 .272 .204
BIGBANKS .142 0 0 .142 .142 .285
COPPER .142 0 .142 .142 .142 .142
SOLAR .062 .062 .062 .062 .187 .125
REGBANKS .048 .048 .048 .048 .024 .048
EDU 0 0 .166 .166 .333 .166
|
====================================================================================
Thursday - 5/5/2023 - 6:12 AM Futures
DJI +146 NASDAQ +52 Data used 5/4/2023
| |
5/4/2023
|
|
| |
The
Jobs Report came out. There was no slowdown in the economy in April as
253,000 new jobs were
created. This puts the FED on the spot. Their rapid raising
of rates from near zero
to 5% has primarily hurt the regional stocks. Ironically, they
were invented
supposedly to prevent financial panics. The main thing their rate increases
have done so far is to
force depositors into the welcome arms of the big banks and
away from smaller
banks. This is exactly what Jefferson, Jackson and all populists
thought would be what a
cental bank would do.
Be that as it may, the
FED will now be under pressure of inflation hawks and bond
salesmen to continue to
raise interest rates since the very positive Jobs' report would
seem to indicate that
inflation cannot be tamed, much less be brought back to 2%,
with a rise of rates to
only 5%. If it does raise rates to 5 1/2%, 6% or higher, it
will do severe damage
to regional banks. On this basis, a case can be made that
we should just stay
short the regional banks we started hedging with a month ago
when they were much
higher. However, the Regional Banks' Tiger chart, shown
below, now shows a new
optimized red Buy. In addition, the short side on these
stocks is getting very
over-crowded, thus making a rally more and more likely.
So,
I think, just as a public service, we should close out our shorts on regional bank
stocks.
We've made a lot of
money very quickly. The only way the regional banks can keep
on declining will be if
there are public runs on these banks. The Jobs number will
give some measure of
reassurance to folks who may be getting scared by all the
bearish hype about the
regional banks.
In any case, that
leaves us short some of the weakest retail stocks, especially
those that do most of
their selling in malls. See those below. Now we must
wait and see if RETL
will break its major support. At the same time we are long
the strongest of the
home-builders. Their strength is a testimony to the immense
unmet housing needs of
the middle and lower classes in America and to the
belief that the Fed
will pause before resuming its rate hike path. As Powell has
admitted, it takes 6
months and longer to see the effects of rate hikes. This
would seem to be a
basis for the FED pausung now.
The DJI is testing its
key 65-dma now. Fridays in bear markets do bring
frequent rallies.
But 5% rates hurt the many dividend stocks on the NYSE.
That average has
dropped below its 65-dma. Its price pattern could evolve
into a bearish
head and shoulders pattern if it should fall down steadily from
here. So,
watch the NYSE as well as the other indexes and charts below.
The performance
of oil drilling and service stocks as shown by OIH below
is important.
Note the classic head and shoulders pattern there. Weakness
in OIH is a
warning that oil prices will be coming down.
|
|
| |
5/4/2023
2022 PEERLESS DJI, Signals, Indicators Daily DJI Volume
10-DayUp/Down Vol Stoch-20 CCI RSI Pct of All Stocks above 65-dma
Inverted Traders Index
DJI-IPA DJI-OBV Short-Term Rates
NASDAQ S&P OEX NYSE DJ-15 DJ-20 DJI-30
Tiger Index of Big
Banks Bond
Funds Gold Stocks
Housing Stocks
Insurance-Stocks
Regional Banks
Russell-1000
Semi Conductors
Recent 2006 vers-Peerless signals http://tigersoftware.com/oldpeer/UPD90504.bmp
ETFs: DIA QQQ SPY IWM MDY
TNA Short-Term Rates Ten Year Rates PST (Short Treasuries)
DOLLAR-UUP
ALLSTOCKs
COIN (Bit
Coin ETF)
USO-CrudeOil DBO
BLDP FAS GLD HD IBB JETS JNUG KOL NAIL NUGT
NRGU OIH PALL RSX RETL SDS AGQ SLV SOXL TAN TECL TLT TMF TNA
UGA USO China: YINN CHAU
Commodities: CANE
CORN DBC JJC, NIB CORN, CUT (paper)
MOO, NRGU
SOYB WEAT UUP (Dollar) LIT
(Lithium) PALL
(Palladium)
Stocks AA AAPL ADBE ALXN AMAT AMGN AMD AMZN ANET AXON AXP
BA BABA BAC BIDU BLDP BSX CAT CDNS CHKP CNX CPB CRM CVX CMG
DE DIS ENPH FB FSLR FTNT GILD GME GOOG GS HD IBM INTU JPM KO KR
LRCX MRK MRNA MOS MSFT NEM NFLX NKE NOC NUE NVDA PANW PG PYPL
QCOM QDEL REGN REV RE SCHW SNOW SO SQUARE TSLA TXN XOM V VRTX
WFC WMT XLE ZM ZOM
NEW-HOMEBUILDERS:
NAIL BZH MHO MTH PHM
NEW-REGIONAL
BANKS: EGBN FFIC GBCI HMST
Leveraged Short ETFs:
FAZ - financials, TZA and SRTY- small caps, MZZ - mid caps, TECS -Techs,
SOXS -
semi-conductors LABD
- Biotechs
Bullish MAXCPs www.tigersoftware.com/UPPING/5-04-2023/Bullish.htm
Bearish MINCPs www.tigersoftware.com/Downing/5-04-2023/BEARISH.htm
|
|
 |
 |
 |
 |
 |
 |
 |
 |
 |
 |
 |
 |
Table 1 - Daily Breadth and Volume Statistics
| NYSE |
Latest Close |
Previous
Close |
Week Ago |
| Issues
traded |
3,065 |
3,095 |
3,079 |
| Advances |
868 |
1,130 |
2,342 |
| Declines |
2,108 |
1,841 |
636 |
| Unchanged |
89 |
124 |
101 |
| New
highs |
38 |
79 |
37 |
| New
lows |
258 |
104 |
55 |
| Adv.
volume* |
340,816,220 |
341,208,371 |
688,574,019 |
| Decl.
volume* |
724,704,245 |
644,144,230 |
120,309,036 |
| Total
volume* |
1,070,277,352 |
996,296,923 |
813,709,146 |
| Closing
Arms (TRIN)† |
0.84 |
1.13 |
0.68 |
| Block
trades* |
4,793 |
4,349 |
3,769 |
| Adv.
volume |
1,617,485,780 |
1,476,745,146 |
3,149,524,743 |
| Decl.
volume |
3,280,174,423 |
2,714,996,683 |
577,371,848 |
| Total
volume |
4,920,099,287 |
4,246,517,459 |
3,750,554,125 |
| NASDAQ |
Latest Close |
Previous
Close |
Week Ago |
| Issues
traded |
4,601 |
4,566 |
4,609 |
| Advances |
1,745 |
2,180 |
2,864 |
| Declines |
2,662 |
2,186 |
1,533 |
| Unchanged |
194 |
200 |
212 |
| New
highs |
60 |
78 |
53 |
| New
lows |
476 |
281 |
219 |
| Closing
Arms (TRIN)† |
0.82 |
1.47 |
0.99 |
| Block
trades |
26,304 |
51,675 |
42,688 |
| Adv.
volume |
2,092,882,400 |
2,314,718,728 |
3,401,536,144 |
| Decl.
volume |
2,608,712,003 |
3,407,381,300 |
1,806,409,696 |
| Total
volume |
4,745,781,430 |
5,782,161,901 |
5,253,710,477 |
|
Table 2 QUICKSILVER on ETFS - 5/4/2023 ---
Bullish = 1 GLD (.346)
Bearish = 1 RETL (-.469)
ETF CLOSE CHANGE PIVOT-PT 5-dma AROC CL-PWR CANDLE IP21 ITRS POWER INDEX
===============================================================================================
DIA 331.33 -2.78 341.03 -101.6% Bearish RED .12 ---- ----
---------------------------------------------------------------------------------------------
COMPQX 11966.4 -58.93 12226.58 -72.4% ------- RED .03 .037 .067
---------------------------------------------------------------------------------------------
SPY 405.13 -2.89 415.93 -88.2% ------- RED .084 .014 .098
---------------------------------------------------------------------------------------------
QQQ 316.17 -1.12 322.56 -65.2% ------- RED .009 .072 .081
---------------------------------------------------------------------------------------------
MDY 439.95 -7.88 454.75 -116.4% Bearish RED -.052 -.077 -.129
---------------------------------------------------------------------------------------------
IWM 170.4 -1.93 175.2 -94.4% Bearish RED -.012 -.096 -.108
---------------------------------------------------------------------------------------------
FAS 53.56 -2.12 62.53 -569.8% ------- RED .129 -.339 -.21
---------------------------------------------------------------------------------------------
RETL 5.96 -.28 6.58 -473.7% Bearish RED -.1 -.369 -.469
---------------------------------------------------------------------------------------------
SOXL 13.6 -.24 14.23 21.2% Bearish BLUE .016 -.019 -.003
---------------------------------------------------------------------------------------------
TECL 34.11 -.5 36.49 -175% ------- RED -.006 .218 .212
---------------------------------------------------------------------------------------------
IBB 130.3 -.38 130.51 42.2% ------- BLUE .117 .005 .122
---------------------------------------------------------------------------------------------
GLD 190.44 1.33 184.8 152.9% Bullish BLUE .226 .12 .346
---------------------------------------------------------------------------------------------
DBO 13.37 .06 14.75 -356.6% ------- ---- -.174 -.073 -.247
---------------------------------------------------------------------------------------------
OIH 254.58 1.05 274.13 -254.6% Bearish BLUE -.086 -.147 -.233
---------------------------------------------------------------------------------------------
CPER 23.65 .07 23.85 -37.8% ------- BLUE .023 -.068 -.045
---------------------------------------------------------------------------------------------
TAN 68.27 -.44 71.99 -316.9% Bearish RED .01 -.081 -.071
---------------------------------------------------------------------------------------------
UUP 27.7 .03 27.75 -1.8% Bullish ---- -.028 -.023 -.051
---------------------------------------------------------------------------------------------
CORN 23.47 -.02 23.38 4.3% Bullish BLUE .087 -.118 -.031
---------------------------------------------------------------------------------------------
WEAT 6.47 .03 6.38 87.2% Bearish BLUE .03 -.148 -.118
---------------------------------------------------------------------------------------------
YINN 40.52 2.88 40.79 22.8% Bearish BLUE -.096 -.136 -.232
|
RANKING OF KEY DIRECTORIES BASED PCT.OF STOCKS ABOVE 65-DMA
5/4/23
---------------------------------------------------------------------------------------
Directory Current day-1 day-2 day-3 day-4 day-5
----------------------------------------------------------------------------------------
BEVERAGE .857 .857 .857 .928 .928 .928
GOLD .777 .755 .777 .733 .733 .755
HOMEBLDG .777 .833 .833 .833 .888 .777
UTILITY .763 .657 .763 .815 .789 .815
HOSPITAL .642 .714 .714 .785 .785 .785
ETFS .545 .509 .49 .563 .581 .49
DOWJONES .5 .533 .533 .6 .666 .566
GREEN .5 .333 .388 .555 .444 .444
DJI-13 .461 .461 .461 .538 .692 .538
GAMING .421 .631 .578 .684 .578 .526
COMODITY .41 .41 .384 .384 .435 .41
NASD-100 .41 .42 .47 .55 .58 .55
FOOD .408 .408 .387 .408 .448 .428
HIGHPRIC .406 .467 .48 .545 .571 .532
INSURANC .4 .48 .48 .48 .44 .4
BIOTECH .398 .407 .355 .393 .358 .348
INDEXES .378 .378 .389 .432 .459 .405
FIDSTKS .366 .378 .408 .479 .497 .467
INFRA .363 .333 .333 .363 .363 .333
SP500 .359 .383 .396 .468 .478 .427
GUNS .357 .357 .357 .357 .357 .285
SP-100 .355 .388 .4 .444 .477 .444
RUS-1000 .328 .356 .362 .434 .425 .38
TRANSP .315 .421 .368 .421 .368 .315
JETS .307 .384 .23 .307 .153 .153
SOFTWARE .303 .357 .357 .41 .41 .428
CHINA .295 .272 .227 .272 .181 .181
NIFTY .295 .318 .363 .431 .454 .409
LOWPRICE .252 .255 .249 .249 .234 .223
COMPUTER .25 .25 .3 .4 .35 .3
RETAIL .234 .255 .34 .361 .404 .361
CHEM .232 .232 .232 .279 .279 .186
MILITARY .23 .423 .346 .461 .384 .346
BONDFUND .229 .229 .241 .137 .356 .241
INDMATER .222 .263 .277 .291 .263 .263
ELECTRON .21 .187 .203 .218 .21 .195
REIT .207 .169 .153 .169 .176 .153
SEMI .17 .159 .18 .18 .18 .17
COAL .166 .166 .166 .166 .166 .166
FINANCE .162 .15 .175 .237 .262 .237
AUTO .132 .15 .226 .245 .169 .169
HACKERS .125 .125 .125 .25 .25 .375
OILGAS .113 .123 .134 .278 .319 .268
SOLAR .062 .062 .062 .187 .125 .187
REGBANKS .048 .048 .048 .024 .048 .048
BIGBANKS 0 0 .142 .142 .285 .142
COPPER 0 .142 .142 .142 .142 .142
EDU 0 .166 .166 .333 .166 .333
MARIJUAN 0 .1 .1 .1 .1 .1
|
==========================================================================
Thursday - 5/4/2023 - 6:15 AM Futures
DJI -62 NASDAQ -10 Data used 5/3/2023
| |
5/3/2023
|
|
| |
The
first reaction of traders in the DJI, SPY and QQQ today was relief that the
FED finally has lifted
rates by only 1/4% to 5%. Then, they realized that Powell
would not promise a
"pause", as was hoped. So, the DJI fell off more than 300
in the last hour.
This brought renewed selling in regional banks. Two of them had
to have trading their
stopped.
The decline today took RETL (Retail stocks) down
to its support. Oil took a
tumble down.
Drilling stocks OIH have
formed an unmistakeable H/S pattern.
But the biggest event
of the day may have been the collapse of billion dollar
trader, Carl Ichan's,
stock. IEP is shown below. Is this the curent era's Ponzii
scheme that will rock
this market's foundations? But MSFT does not quiver
and the home-building
stocks are holding at their highs. The number of
"trap-door"
stocks is bearishly on the rise. And only 31% of all stocks are still
above their 65-dma.
Hedgers have ample choices among our bearish MINC Ps
to short.
The blue-chip DJI seems
finally to be wakening up to the possibility that
the Federal budget
talks may go right down to the point of default, just like
they did in 2011, with
the result that even the DJI fells off 18%. The flat overhead
resistance and Sell S12
recently are similar to what happened in 2011. The
A/D Line is now in a
downtrend. So is the P-Indicator and our Accumulation
Index. The DJI
seems headed immediately down to test the support at 33200
and its rising 65-dma.
The regional bank short
sales are working out well. Go short a few of the lowest
Power ranked in the
Retail group: CVS, LE, PLCE and GME.
Some MAXCPs remain very
strong. Hold the leading home-builders long.
|
|
| |
5/4/2023
2022 PEERLESS DJI, Signals, Indicators Daily DJI Volume
10-DayUp/Down Vol Stoch-20 CCI RSI Pct of All Stocks above 65-dma
Inverted Traders Index
DJI-IPA DJI-OBV Short-Term Rates
NASDAQ S&P OEX NYSE DJ-15 DJ-20 DJI-30
Tiger Index of Big
Banks Bond
Funds Gold Stocks
Housing Stocks
Insurance-Stocks
Regional Banks
Russell-1000
Semi Conductors
Recent 2006 vers-Peerless signals http://tigersoftware.com/oldpeer/UPD90504.bmp
ETFs: DIA QQQ SPY IWM MDY
TNA Short-Term Rates Ten Year Rates PST (Short Treasuries)
DOLLAR-UUP
ALLSTOCKs
COIN (Bit
Coin ETF)
USO-CrudeOil DBO
BLDP FAS GLD HD IBB JETS JNUG KOL NAIL NUGT
NRGU OIH PALL RSX RETL SDS AGQ SLV SOXL TAN TECL TLT TMF TNA
UGA USO China: YINN CHAU
Commodities: CANE
CORN DBC JJC, NIB CORN, CUT (paper)
MOO, NRGU
SOYB WEAT UUP (Dollar) LIT
(Lithium) PALL
(Palladium)
Stocks AA AAPL ADBE ALXN AMAT AMGN AMD AMZN ANET AXON AXP
BA BABA BAC BIDU BLDP BSX CAT CDNS CHKP CNX CPB CRM CVX CMG
DE DIS ENPH FB FSLR FTNT GILD GME GOOG GS HD IBM INTU JPM KO KR
LRCX MRK MRNA MOS MSFT NEM NFLX NKE NOC NUE NVDA PANW PG PYPL
QCOM QDEL REGN REV RE SCHW SNOW SO SQUARE TSLA TXN XOM V VRTX
WFC WMT XLE ZM ZOM
NEW-HOMEBUILDERS:
NAIL BZH MHO MTH PHM
NEW-REGIONAL
BANKS: EGBN FFIC GBCI HMST
Leveraged Short ETFs:
FAZ - financials, TZA and SRTY- small caps, MZZ - mid caps, TECS -Techs,
SOXS -
semi-conductors LABD
- Biotechs
Bullish MAXCPs www.tigersoftware.com/UPPING/5-03-2023/Bullish.htm
Bearish MINCPs www.tigersoftware.com/Downing/5-03-2023/BEARISH.htm
|
|
 |
 |
 |
 |
 |
 |
 |
 |
 |
 |
 |
 |
|
Table 1 - Daily Breadth and Volume Statistics
| NYSE |
Latest Close |
Previous
Close |
Week Ago |
| Issues
traded |
3,095 |
3,094 |
3,111 |
| Advances |
1,130 |
603 |
1,011 |
| Declines |
1,841 |
2,398 |
1,969 |
| Unchanged |
124 |
93 |
131 |
| New
highs |
79 |
41 |
31 |
| New
lows |
104 |
152 |
101 |
| Adv.
volume* |
341,208,371 |
146,443,936 |
192,386,569 |
| Decl.
volume* |
644,144,230 |
817,926,099 |
633,875,579 |
| Total
volume* |
996,296,923 |
969,771,077 |
846,351,901 |
| Closing
Arms (TRIN)† |
1.13 |
1.26 |
1.50 |
| Block
trades* |
4,349 |
4,515 |
4,051 |
| Adv.
volume |
1,476,745,146 |
739,997,448 |
954,865,712 |
| Decl.
volume |
2,714,996,683 |
3,717,545,876 |
2,787,901,251 |
| Total
volume |
4,246,517,459 |
4,486,130,982 |
3,837,034,178 |
| NASDAQ |
Latest Close |
Previous
Close |
Week Ago |
| Issues
traded |
4,566 |
4,624 |
4,680 |
| Advances |
2,180 |
1,281 |
1,785 |
| Declines |
2,186 |
3,127 |
2,662 |
| Unchanged |
200 |
216 |
233 |
| New
highs |
78 |
62 |
51 |
| New
lows |
281 |
442 |
408 |
| Closing
Arms (TRIN)† |
1.47 |
0.76 |
1.00 |
| Block
trades |
51,675 |
44,570 |
44,196 |
| Adv.
volume |
2,314,718,728 |
1,893,177,912 |
2,107,020,210 |
| Decl.
volume |
3,407,381,300 |
3,515,735,998 |
3,134,407,163 |
| Total
volume |
5,782,161,901 |
5,501,414,589 |
5,281,973,744 |
|
Table 2 QUICKSILVER on ETFS - 5/3/2023 ---
Bullish = 1 GLD (.367)
Bearish = 4 RETL (-.438), OIH (-.333), DBO(-.298), YINN (-.286)
ETF CLOSE CHANGE PIVOT-PT 5-dma AROC CL-PWR CANDLE IP21 ITRS POWER INDEX
===============================================================================================
DIA 334.11 -2.76 338.2 17.2% Bearish RED .115
---------------------------------------------------------------------------------------------
COMPQX 12025.33 -55.18 12142.24 70.6% Bearish RED .032 .038 .07
---------------------------------------------------------------------------------------------
SPY 408.02 -2.82 412.41 44.4% ------- RED .083 .014 .097
---------------------------------------------------------------------------------------------
QQQ 317.29 -2.09 320.35 84.9% Bearish RED .01 .07 .08
---------------------------------------------------------------------------------------------
MDY 447.83 -.12 450.45 48.9% Bearish RED -.054 -.065 -.119
---------------------------------------------------------------------------------------------
IWM 172.33 .63 173.68 27.1% Bearish BLUE -.057 -.089 -.146
---------------------------------------------------------------------------------------------
FAS 55.68 -2.06 60.36 -161.5% ------- RED .103 -.324 -.221
---------------------------------------------------------------------------------------------
RETL 6.24 -.11 6.57 -77.4% Bearish RED -.103 -.335 -.438
---------------------------------------------------------------------------------------------
SOXL 13.84 -.51 13.54 167.5% Bearish RED -.011 -.021 -.032
---------------------------------------------------------------------------------------------
TECL 34.61 -.92 35.36 184.8% Bearish RED -.017 .223 .206
---------------------------------------------------------------------------------------------
IBB 130.68 .87 129.2 74.6% ------- BLUE .085 -.001 .084
---------------------------------------------------------------------------------------------
GLD 189.11 1.59 184.75 118% Bullish BLUE .267 .1 .367
---------------------------------------------------------------------------------------------
DBO 13.31 -.52 14.38 -348.1% ------- RED -.195 -.103 -.298
---------------------------------------------------------------------------------------------
OIH 253.53 -3.22 268.08 -284.7% Bearish BLUE -.151 -.182 -.333
---------------------------------------------------------------------------------------------
CPER 23.58 -.13 23.83 -6.3% Bearish ---- .011 -.086 -.075
---------------------------------------------------------------------------------------------
TAN 68.71 -.1 72.75 -192.3% Bearish ---- .043 -.081 -.038
---------------------------------------------------------------------------------------------
UUP 27.67 -.15 27.71 -5.4% Bullish ---- -.061 -.027 -.088
---------------------------------------------------------------------------------------------
CORN 23.49 .43 23.45 -128% Bullish BLUE .034 -.132 -.098
---------------------------------------------------------------------------------------------
WEAT 6.44 .29 6.36 -23.8% Bearish BLUE -.021 -.169 -.19
---------------------------------------------------------------------------------------------
YINN 37.64 -.33 40.34 -121.2% Bearish RED -.063 -.223 -.286
|
Table 3 RANKING OF KEY DIRECTORIES BASED PCT.OF STOCKS ABOVE 65-DMA
5/3/23
Bullish = 8
Bearish = 41
---------------------------------------------------------------------------------------
Directory Current day-1 day-2 day-3 day-4 day-5
----------------------------------------------------------------------------------------
BEVERAGE .857 .857 .928 .928 .928 .928
HOMEBLDG .833 .833 .833 .888 .777 .611
GOLD .755 .777 .733 .733 .755 .733
HOSPITAL .714 .714 .785 .785 .785 .785
UTILITY .657 .763 .815 .789 .842 .657
GAMING .631 .578 .631 .631 .526 .421
DOWJONES .533 .533 .6 .666 .566 .4
ETFS .509 .49 .563 .581 .509 .418
==============================================================================================
INSURANC .48 .48 .48 .44 .4 .32
HIGHPRIC .467 .48 .545 .571 .532 .437
DJI-13 .461 .461 .538 .692 .538 .307
MILITARY .423 .346 .461 .384 .346 .269
TRANSP .421 .368 .421 .368 .315 .105
NASD-100 .42 .47 .55 .58 .55 .43
COMODITY .41 .41 .358 .435 .41 .435
FOOD .408 .408 .387 .448 .428 .469
BIOTECH .407 .353 .395 .358 .34 .353
SP-100 .388 .4 .444 .477 .444 .355
JETS .384 .23 .307 .153 .153 .153
SP500 .383 .396 .47 .474 .429 .308
FIDSTKS .378 .408 .479 .497 .467 .343
INDEXES .378 .389 .432 .459 .4 .329
GUNS .357 .357 .357 .357 .285 .285
SOFTWARE .357 .375 .41 .41 .41 .339
RUS-1000 .356 .362 .434 .425 .381 .285
GREEN .333 .388 .555 .444 .444 .444
INFRA .333 .333 .363 .363 .333 .303
NIFTY .318 .363 .431 .454 .409 .34
CHINA .272 .227 .272 .181 .181 .113
INDMATER .263 .277 .291 .263 .263 .222
LOWPRICE .255 .252 .252 .237 .217 .209
RETAIL .255 .34 .361 .404 .361 .276
COMPUTER .25 .3 .4 .35 .3 .2
CHEM .232 .232 .279 .279 .186 .139
BONDFUND .229 .229 .137 .367 .252 .275
ELECTRON .187 .203 .218 .21 .187 .18
REIT .169 .146 .176 .184 .146 .107
COAL .166 .166 .166 .166 .166 .166
EDU .166 .166 .333 .166 .166 .333
SEMI .159 .18 .18 .18 .159 .17
AUTO .15 .245 .245 .169 .169 .169
FINANCE .15 .175 .237 .25 .237 .162
COPPER .142 .142 .142 .142 .142 .142
HACKERS .125 .125 .25 .25 .312 .312
OILGAS .123 .134 .278 .319 .257 .216
MARIJUAN .1 .1 .1 .1 .1 .1
SOLAR .062 .062 .187 .125 .187 .125
REGBANKS .048 .048 .024 .048 .048 .048
BIGBANKS 0 .142 .142 .285 .142 0
|
====================================================================================
Wednesday - 5/3/2023 - 6:15 AM Futures
DJI +15 NASDAQ +22 Data used 5/2/2023
| |
5/2/2023
|
|
| |
In unison,
the DJI, SP-500 and NASDAQ were marked down by 1% today
after traders saw the flat
resistance over-head was too much for the market.
The A/D Line failed to
confirm the most recent DJI high. As a result of the
decline this technical
failure helped signal, today there were three times more
decliners than advancers on
the NYSE.
Hedging is necessary for
successful trading as there were almost 600 new lows
on the NYSE and NASDAQ.
Today short-term interest
rates rose above 5%. That hit the regional banks
especially hard, as it
dropped the real market value of their long-term bond
and mortgage assets down
still further. It is a good thing that depositors
do not all want their money
back from these banks all at once. They
could not be accomodated.
And the FDIC would run out of money making
good their claims in the
event of a wave of new bankruptcies, as took
place in the Depression.
But that is the worry now - that more and more
depositors are taking out
their money with the result that getting a loan from
these banks is becoming
harder and harder.
Is this what the FED really
wants? Talk now is that the FED will be raising
rates by another quarter
percent before they pause. Critics ask why they
don't pause now and just wait
to see what the inflation numbers are. But
belatedly now they are fixed
upon curbing inflation and all its dire consequences.
At least, so it seems.
Meanwhile, the count-down to
a Government default on its debts, including
social security payments, is
taking place because of the gulf in spending
and budget cutting priorities
of the White House and the Republican majority
in the House. Back in
2011, chart shown below, the market also chose to ignore
the coming budgetary crisis
until two weeks before time was going to run
out. Then it swiftly
fell almost 20%. Peerless, like now, had given a
Sell S12 and the DJI could
not rise above its flat resistance.
There are new elements in the
picture now. The Republicans are a lot more
motivated to carry on theiir
fight and the Biden Administraton has a
contitutional tool it may
choose to use to continue essential payments,
,
namely the interpretation
they may give to the 14th Amendment, where it says
the Debt of United States
must not be "questioned". See NY Times
https://www.nytimes.com/2023/05/02/us/politics/debt-limit-us-constitution.html?campaign_id=2&emc=edit_th_20230503&instance_id=91641&nl=todaysheadlines®i_id=58223894&segment_id=131969&user_id=ebc2a133c7a3b83a9a92049aae5a2e03
We are short a number of the
weakest regional banks. At least, that is what
I have been urging here for
several weeks. Their gains should offset losses
among MAXCPs, where there
have been losses. That is the whole purpose of
hedging when the DJI and
other leading major market ETFs move back and forth
without real conviction, but
do conceal the weakness of the broad market where
there are many more new lows
than new highs (Table 1) and only 30% of all
stocks and ETFs are still
above their 65-dma. |
|
| |
5/3/2023
2022 PEERLESS DJI, Signals, Indicators Daily DJI Volume
10-DayUp/Down Vol Stoch-20 CCI RSI Pct of All Stocks above 65-dma
Inverted Traders Index
DJI-IPA DJI-OBV Short-Term Rates
NASDAQ S&P OEX NYSE DJ-15 DJ-20 DJI-30
Tiger Index of Big
Banks Bond
Funds Gold Stocks
Housing Stocks
Insurance-Stocks
Regional Banks
Russell-1000
Semi Conductors
Recent 2006 vers-Peerless signals http://tigersoftware.com/oldpeer/UPD90501.bmp
ETFs: DIA QQQ SPY IWM MDY
TNA Short-Term Rates Ten Year Rates PST (Short Treasuries)
DOLLAR-UUP
ALLSTOCKs
COIN (Bit
Coin ETF)
USO-CrudeOil DBO
BLDP FAS GLD HD IBB JETS JNUG KOL NAIL NUGT
NRGU OIH PALL RSX RETL SDS AGQ SLV SOXL TAN TECL TLT TMF TNA
UGA USO China: YINN CHAU
Commodities: CANE
CORN DBC JJC, NIB CORN, CUT (paper)
MOO, NRGU
SOYB WEAT UUP (Dollar) LIT
(Lithium) PALL
(Palladium)
Stocks AA AAPL ADBE ALXN AMAT AMGN AMD AMZN ANET AXON AXP
BA BABA BAC BIDU BLDP BSX CAT CDNS CHKP CNX CPB CRM CVX CMG
DE DIS ENPH FB FSLR FTNT GILD GME GOOG GS HD IBM INTU JPM KO KR
LRCX MRK MRNA MOS MSFT NEM NFLX NKE NOC NUE NVDA PANW PG PYPL
QCOM QDEL REGN REV RE SNOW SO SQUARE TSLA TXN XOM V VRTX WFC
WMT XLE ZM ZOM
NEW-HOMEBUILDERS:
NAIL BZH MHO MTH PHM
NEW-REGIONAL
BANKS: EGBN FFIC GBCI HMST
Leveraged Short ETFs:
FAZ - financials, TZA and SRTY- small caps, MZZ - mid caps, TECS -Techs,
SOXS -
semi-conductors LABD
- Biotechs
Bullish MAXCPs www.tigersoftware.com/UPPING/5-02-2023/Bullish.htm
Bearish MINCPs www.tigersoftware.com/Downing/5-02-2023/BEARISH.htm
|
|
In August 2011, it appeared that US would default
on its debt.
Note Sell S12 as well as S9-Vs. There was a flat top
also like now and the decline came very quickly, not slowly.
 |
Current DJI, Peerless Signals and Indicators

 |
 |
 |
 |
 |
Weakest Regional Banks - dropping steeply
 |
 |
 |
 |
Bullish Sweet Stock - YUM
 |
Table 1 -
Daily Breadth and
Volume Statistics
| NYSE |
Latest Close |
Previous
Close |
Week Ago |
| Issues
traded |
3,094 |
3,096 |
3,116 |
| Advances |
603 |
1,212 |
496 |
| Declines |
2,398 |
1,776 |
2,538 |
| Unchanged |
93 |
108 |
82 |
| New
highs |
41 |
83 |
43 |
| New
lows |
152 |
35 |
103 |
| Adv.
volume* |
146,443,936 |
352,122,253 |
107,267,253 |
| Decl.
volume* |
817,926,099 |
433,673,549 |
740,474,802 |
| Total
volume* |
969,771,077 |
792,214,141 |
856,251,914 |
| Closing
Arms (TRIN)† |
1.26 |
0.83 |
1.33 |
| Block
trades* |
4,515 |
3,934 |
4,563 |
| Adv.
volume |
739,997,448 |
1,483,166,104 |
501,909,925 |
| Decl.
volume |
3,717,545,876 |
1,808,304,138 |
3,426,599,684 |
| Total
volume |
4,486,130,982 |
3,321,376,860 |
3,978,647,357 |
| NASDAQ |
Latest Close |
Previous
Close |
Week Ago |
| Issues
traded |
4,624 |
4,596 |
4,643 |
| Advances |
1,281 |
2,048 |
998 |
| Declines |
3,127 |
2,388 |
3,455 |
| Unchanged |
216 |
160 |
190 |
| New
highs |
62 |
103 |
39 |
| New
lows |
442 |
198 |
385 |
| Closing
Arms (TRIN)† |
0.76 |
0.94 |
0.70 |
| Block
trades |
44,570 |
46,644 |
36,059 |
| Adv.
volume |
1,893,177,912 |
2,459,008,432 |
1,395,496,511 |
| Decl.
volume |
3,515,735,998 |
2,684,726,905 |
3,394,708,287 |
| Total
volume |
5,501,414,589 |
5,168,438,845 |
4,806,021,164 |
|
Table 2 QUICKSILVER on ETFS - 5/2/2023 ---
Bullish = 2 TECL (.286), GLD (.338)
Bearish = 4 RETL (-.447), OIH (-.308), WHEAT (-.308), YINN (-.284)
ETF CLOSE CHANGE PIVOT-PT 5-dma AROC CL-PWR CANDLE IP21 ITRS POWER INDEX
===============================================================================================
DIA 336.87 -3.49 332.95 22.8% ------- RED .222 0
---------------------------------------------------------------------------------------------
COMPQX 12080.51 -132.09 11854.35 116.8% ------- RED .128 .029 .157
---------------------------------------------------------------------------------------------
SPY 410.84 -4.67 404.36 57.9% ------- RED .167 .013 .18
---------------------------------------------------------------------------------------------
QQQ 319.38 -2.81 311.87 147.9% ------- RED .098 .065 .163
---------------------------------------------------------------------------------------------
MDY 447.95 -6.49 443.43 5.9% Bearish RED .031 -.075 -.044
---------------------------------------------------------------------------------------------
IWM 171.7 -3.6 171.39 -39.1% Bearish RED .017 -.107 -.09
---------------------------------------------------------------------------------------------
FAS 57.74 -4.29 57.62 -134.2% ------- RED .162 -.328 -.166
---------------------------------------------------------------------------------------------
RETL 6.35 -.1 6.34 15.5% Bearish RED -.036 -.411 -.447
---------------------------------------------------------------------------------------------
SOXL 14.35 -.31 13.37 416.7% Bearish RED .051 -.07 -.019
---------------------------------------------------------------------------------------------
TECL 35.53 -1.03 33.3 527.1% ------- RED .107 .179 .286
---------------------------------------------------------------------------------------------
IBB 129.81 -1.73 128.74 -26.5% ------- RED .168 -.022 .146
---------------------------------------------------------------------------------------------
GLD 187.52 3.55 184.74 47.9% ------- BLUE .239 .099 .338
---------------------------------------------------------------------------------------------
DBO 13.83 -.71 14.31 -312.8% Bearish RED -.131 -.056 -.187
---------------------------------------------------------------------------------------------
OIH 256.75 -16.54 268.8 -325.8% Bearish RED -.134 -.174 -.308
---------------------------------------------------------------------------------------------
CPER 23.71 -.41 23.61 10.5% Bearish ---- -.001 -.05 -.051
---------------------------------------------------------------------------------------------
TAN 68.81 -2.32 71.45 -469.1% Bearish RED .03 -.087 -.057
---------------------------------------------------------------------------------------------
UUP 27.82 -.07 27.7 5.4% Bullish RED -.095 -.005 -.1
---------------------------------------------------------------------------------------------
CORN 23.06 -.17 24.09 -242.9% Bullish ---- -.052 -.13 -.182
---------------------------------------------------------------------------------------------
WEAT 6.15 -.06 6.47 -328.2% Bearish ---- -.101 -.205 -.306
---------------------------------------------------------------------------------------------
YINN 37.97 -2.41 38.6 134.5% Bearish RED -.052 -.232 -.284
|
Table 3 RANKING OF KEY DIRECTORIES BASED PCT.OF STOCKS ABOVE 65-DMA
5/2/23
Bullish = 7
Bearish = 42
---------------------------------------------------------------------------------------
Directory Current day-1 day-2 day-3 day-4 day-5
----------------------------------------------------------------------------------------
BEVERAGE .857 .928 .928 .928 .928 .928
HOMEBLDG .833 .833 .888 .777 .611 .722
UTILITY .763 .815 .789 .842 .657 .842
GOLD .76 .717 .717 .739 .717 .717
HOSPITAL .714 .785 .785 .785 .785 .785
GAMING .578 .631 .578 .578 .421 .526
DOWJONES .533 .6 .666 .566 .4 .5
================================================================================================
ETFS .49 .563 .581 .509 .436 .381
HIGHPRIC .48 .545 .571 .532 .441 .493
INSURANC .48 .48 .44 .4 .32 .36
NASD-100 .47 .55 .58 .55 .44 .5
DJI-13 .461 .538 .692 .538 .307 .538
COMODITY .41 .384 .41 .41 .435 .41
FIDSTKS .408 .479 .497 .467 .349 .437
FOOD .408 .408 .428 .428 .469 .428
SP-100 .4 .444 .477 .444 .355 .422
SP500 .396 .47 .476 .425 .316 .383
INDEXES .389 .432 .459 .4 .329 .362
GREEN .388 .555 .444 .444 .444 .444
SOFTWARE .375 .428 .41 .41 .339 .357
TRANSP .368 .421 .368 .315 .105 .21
NIFTY .363 .431 .454 .409 .34 .34
RUS-1000 .362 .434 .425 .381 .29 .339
GUNS .357 .357 .357 .285 .285 .285
BIOTECH .353 .393 .36 .34 .355 .378
MILITARY .346 .461 .384 .346 .269 .384
RETAIL .34 .361 .404 .361 .276 .297
INFRA .333 .363 .363 .333 .303 .363
COMPUTER .3 .4 .35 .3 .25 .25
INDMATER .277 .291 .263 .263 .222 .208
LOWPRICE .252 .255 .24 .22 .209 .229
AUTO .245 .264 .169 .169 .169 .132
CHEM .232 .279 .279 .186 .139 .186
JETS .23 .307 .153 .153 .153 .153
BONDFUND .229 .126 .367 .264 .264 .206
CHINA .227 .272 .181 .181 .113 .113
ELECTRON .203 .218 .21 .187 .172 .18
SEMI .18 .18 .18 .159 .159 .148
FINANCE .175 .237 .25 .225 .175 .2
COAL .166 .166 .166 .166 .166 .166
EDU .166 .333 .166 .166 .333 .333
REIT .146 .169 .192 .153 .1 .123
BIGBANKS .142 .142 .285 .142 0 .142
COPPER .142 .142 .142 .142 .142 .142
OILGAS .134 .278 .319 .257 .226 .247
HACKERS .125 .25 .25 .312 .312 .312
MARIJUAN .1 .1 .1 .1 .1 .1
SOLAR .062 .187 .125 .187 .125 .312
REGBANKS .048 .024 .048 .048 .048 .048
|
====================================================================================
Tuesday - 5/2/2023 - 6:15 AM Futures
DJI -79 NASDAQ -11 Data used 5/1/2023
| |
5/1/2023
|
|
| |
The DJI lost nearly
200 points after mid-day. There were 550 more NYSE decliners
than advancers. The
well-tested flat resistance levels for the DJI, NASDAQ,
SPY and QQQ held once again.
Another decline appears likely and this is
what the Futures show.
Though the Closing Power 21-day moving averages of
these indexes and ETFs are rising,
the weak close today warns us of another retreat.
This time the DJI may drop farther
down to its 21-dma and rising 65-dma. The
market seems now to be wakening up
to the very real risk of a political deadlock
and default on the Federal
Budget. If the West Virginia Senator switches parties,
the Senate may go along with House
Republican demands for some big cuts in the
Federal spending. A White
House veto of a new Budget would prolong the deadlock
and likely hit the stock market
quite hard. Will Biden who wants to be President for
another four years, risk a bear
market? Unlike in 2011 when this sort of crisis last
occurred, the Accumulation Index
remains positive.
I have recommended hedging, by
being short the weakest of the regional
banks. They continue to fall
at a very fast rate. See the new links I have added
just below and the bearish MINCPs.
NVDA did breakout from its Darvas
box pattern. Articifial
intelligence applications of all types require NVDA chips.
Sugar stocks HSY and YUM rose, as
was expected, given Lilly's new
weightloss, anti-Diabaetes drug.
But housing stocks disappointed us as they
fell back from Friday's big gains.
Interest rates did go up, but profit-taking
was more likely the cause of their
pullback.
We want to be on the look out for
stocks that give 5-day Stochastic Buys
and Sells where that is the best
system for the last year and the yearly gain is
more than 300%. SNOW
(on a new sell and below its 65-dma) is such a stock
along with ETF NRGU (which is on a buy). The
MAXCPs show a number
of biotechs. They usually
pop up when traders look to strength in non-cyclical
stocks. Ideally, they show
high Accumulation on a fresh breakout
to new highs. Buy B12s most
often their breakouts. See those in the Bull MAXCPs. |
|
| |
5/1/2023
2022 PEERLESS DJI, Signals, Indicators Daily DJI Volume
10-DayUp/Down Vol Stoch-20 CCI RSI Pct of All Stocks above 65-dma
Inverted Traders Index
DJI-IPA DJI-OBV Short-Term Rates
NASDAQ S&P OEX NYSE DJ-15 DJ-20 DJI-30
Tiger Index of Big
Banks Bond
Funds Gold Stocks
Housing Stocks
Insurance-Stocks
Regional Banks
Russell-1000
Semi Conductors
Recent 2006 vers-Peerless signals http://tigersoftware.com/oldpeer/UPD90501.bmp
ETFs: DIA QQQ SPY IWM MDY
TNA Short-Term Rates Ten Year Rates PST (Short Treasuries)
DOLLAR-UUP
ALLSTOCKs
COIN (Bit
Coin ETF)
USO-CrudeOil DBO
BLDP FAS GLD HD IBB JETS JNUG KOL NAIL NUGT
NRGU OIH PALL RSX RETL SDS AGQ SLV SOXL TAN TECL TLT TMF TNA
UGA USO China: YINN CHAU
Commodities: CANE
CORN DBC JJC, NIB CORN, CUT (paper)
MOO, NRGU
SOYB WEAT UUP (Dollar) LIT
(Lithium) PALL
(Palladium)
Stocks AA AAPL ADBE ALXN AMAT AMGN AMD AMZN ANET AXON AXP
BA BABA BAC BIDU BLDP BSX CAT CDNS CHKP CNX CPB CRM CVX CMG
DE DIS ENPH FB FSLR FTNT GILD GME GOOG GS HD IBM INTU JPM KO KR
LRCX MRK MRNA MOS MSFT NEM NFLX NKE NOC NUE NVDA PANW PG PYPL
QCOM QDEL REGN REV RE SNOW SO SQUARE TSLA TXN XOM V VRTX WFC
WMT XLE ZM ZOM
NEW-HOMEBUILDERS:
NAIL BZH MHO MTH PHM
NEW-REGIONAL
BANKS: EGBN FFIC GBCI HMST
Leveraged Short ETFs:
FAZ - financials, TZA and SRTY- small caps, MZZ - mid caps, TECS -Techs,
SOXS -
semi-conductors LABD
- Biotechs
Bullish MAXCPs www.tigersoftware.com/UPPING/5-01-2023/Bullish.htm
Bearish MINCPs www.tigersoftware.com/Downing/5-01-2023/BEARISH.htm
|
|
 |
 |
 |
 |
 |
 |
 |
 |
 |
 |
Table 1 - Daily Breadth
and Volume Statistics.
| NYSE |
Latest Close |
Previous
Close |
Week Ago |
| Issues
traded |
3,096 |
3,111 |
3,076 |
| Advances |
1,212 |
2,206 |
1,635 |
| Declines |
1,776 |
798 |
1,331 |
| Unchanged |
108 |
107 |
110 |
| New
highs |
83 |
72 |
53 |
| New
lows |
35 |
37 |
40 |
| Adv.
volume* |
352,122,253 |
783,703,090 |
407,289,239 |
| Decl.
volume* |
433,673,549 |
260,528,345 |
326,098,805 |
| Total
volume* |
792,214,141 |
1,052,329,580 |
746,084,794 |
| Closing
Arms (TRIN)† |
0.83 |
1.03 |
1.02 |
| Block
trades* |
3,934 |
4,606 |
3,818 |
| Adv.
volume |
1,483,166,104 |
2,940,946,388 |
1,766,512,542 |
| Decl.
volume |
1,808,304,138 |
1,096,860,769 |
1,466,683,026 |
| Total
volume |
3,321,376,860 |
4,087,800,666 |
3,290,940,151 |
| NASDAQ |
Latest Close |
Previous
Close |
Week Ago |
| Issues
traded |
4,596 |
4,640 |
4,630 |
| Advances |
2,048 |
2,891 |
1,817 |
| Declines |
2,388 |
1,533 |
2,614 |
| Unchanged |
160 |
216 |
199 |
| New
highs |
103 |
70 |
79 |
| New
lows |
198 |
153 |
211 |
| Closing
Arms (TRIN)† |
0.94 |
0.71 |
1.65 |
| Block
trades |
46,644 |
45,145 |
44,680 |
| Adv.
volume |
2,459,008,432 |
3,844,474,537 |
1,424,122,248 |
| Decl.
volume |
2,684,726,905 |
1,452,848,103 |
3,383,118,058 |
| Total
volume |
5,168,438,845 |
5,331,381,382 |
4,854,054,961 |
|
Table 2 QUICKSILVER on ETFS - 5/1/2023 ---
Bullish = 1 TECL (.337)
Bearish = 3 RETL (-.415), WHEAT (-.284), YINN (-.310)
ETF CLOSE CHANGE PIVOT-PT 5-dma AROC CL-PWR CANDLE IP21 ITRS POWER INDEX
===============================================================================================
DIA 340.36 -.67 335.33 23.9% Bullish RED .273 0 .------
---------------------------------------------------------------------------------------------
COMPQX 12212.6 -13.98 11799.16 73% ------- BLUE .194 .021 .215
---------------------------------------------------------------------------------------------
SPY 415.51 -.42 406.08 35.1% ------- BLUE .235 .009 .244
---------------------------------------------------------------------------------------------
QQQ 322.19 -.37 309.99 98.7% ------- BLUE .162 .053 .215
---------------------------------------------------------------------------------------------
MDY 454.44 -.31 447.42 -19.3% ------- BLUE .101 -.076 .025
---------------------------------------------------------------------------------------------
IWM 175.3 .1 173.06 -61.4% Bearish BLUE .082 -.099 -.017
---------------------------------------------------------------------------------------------
FAS 62.03 -.5 59.36 -52.9% ------- RED .265 -.292 -.027
---------------------------------------------------------------------------------------------
RETL 6.45 -.13 6.33 -433.9% Bearish RED -.007 -.408 -.415
---------------------------------------------------------------------------------------------
SOXL 14.66 .43 13.2 10.9% Bearish BLUE .101 -.108 -.007
---------------------------------------------------------------------------------------------
TECL 36.56 .07 31.87 365.3% ------- BLUE .182 .155 .337
---------------------------------------------------------------------------------------------
IBB 131.54 1.03 130.5 -57.9% ------- BLUE .239 -.013 .226
---------------------------------------------------------------------------------------------
GLD 183.97 -.83 185.75 -22.7% Bearish RED .154 .069 .223
---------------------------------------------------------------------------------------------
DBO 14.54 -.21 14.74 -201.2% Bearish ---- -.037 -.039 -.076
---------------------------------------------------------------------------------------------
OIH 273.29 -.84 274.46 -234.9% Bearish BLUE -.051 -.174 -.225
---------------------------------------------------------------------------------------------
CPER 24.12 .27 23.66 -48.2% Bearish BLUE -.004 -.044 -.048
---------------------------------------------------------------------------------------------
TAN 71.13 -.86 75.62 -443.2% ------- RED .109 -.076 .033
---------------------------------------------------------------------------------------------
UUP 27.89 .14 27.79 41.5% Bullish BLUE .081 -.017 .064
---------------------------------------------------------------------------------------------
CORN 23.23 -.15 24.21 -224% Bullish BLUE -.014 -.132 -.146
---------------------------------------------------------------------------------------------
WEAT 6.21 -.17 6.57 -308.7% Bearish RED -.072 -.212 -.284
---------------------------------------------------------------------------------------------
YINN 40.38 -.41 36.91 15.2% Bearish RED -.063 -.247 -.31
|
Table 3 RANKING OF KEY DIRECTORIES BASED PCT.OF STOCKS ABOVE 65-DMA
5/1/23
Bullish = 12
Bearish = 37
---------------------------------------------------------------------------------------
Directory Current day-1 day-2 day-3 day-4 day-5
----------------------------------------------------------------------------------------
BEVERAGE .928 .928 .928 .928 .928 .857
HOMEBLDG .833 .888 .777 .611 .722 .777
UTILITY .815 .789 .842 .657 .815 .842
HOSPITAL .785 .785 .785 .785 .785 .785
GOLD .717 .717 .739 .717 .717 .739
GAMING .631 .578 .526 .473 .526 .526
DOWJONES .6 .666 .566 .4 .5 .7
ETFS .563 .581 .509 .436 .4 .509
GREEN .555 .444 .444 .444 .444 .666
NASD-100 .55 .58 .55 .44 .5 .63
HIGHPRIC .545 .571 .532 .441 .493 .632
DJI-13 .538 .692 .538 .307 .538 .769
====================================================================================================
INSURANC .48 .44 .4 .32 .36 .4
FIDSTKS .479 .497 .467 .349 .431 .514
SP500 .47 .476 .427 .312 .383 .476
MILITARY .461 .384 .346 .269 .384 .5
SP-100 .444 .477 .444 .355 .422 .544
RUS-1000 .434 .425 .381 .29 .337 .431
INDEXES .432 .459 .4 .329 .362 .491
NIFTY .431 .454 .409 .34 .34 .5
SOFTWARE .428 .428 .41 .339 .357 .446
TRANSP .421 .368 .315 .105 .21 .368
FOOD .408 .448 .408 .469 .428 .571
COMPUTER .4 .35 .3 .25 .25 .35
BIOTECH .393 .358 .343 .355 .368 .425
COMODITY .384 .435 .384 .435 .41 .538
INFRA .363 .363 .333 .303 .363 .393
RETAIL .361 .404 .361 .276 .297 .425
GUNS .357 .357 .285 .285 .285 .357
EDU .333 .166 .166 .333 .333 .333
JETS .307 .153 .153 .153 .153 .153
INDMATER .291 .263 .263 .222 .208 .291
CHEM .279 .279 .186 .139 .186 .279
OILGAS .278 .319 .257 .226 .247 .36
CHINA .272 .181 .181 .113 .09 .136
AUTO .264 .188 .169 .169 .15 .207
LOWPRICE .255 .243 .223 .212 .226 .289
HACKERS .25 .25 .312 .312 .312 .437
FINANCE .237 .25 .225 .162 .2 .262
ELECTRON .218 .21 .187 .172 .172 .293
SOLAR .187 .125 .187 .125 .312 .5
SEMI .18 .18 .159 .159 .138 .308
REIT .169 .184 .161 .107 .115 .153
COAL .166 .166 .166 .166 .166 .166
BIGBANKS .142 .285 .142 0 .142 .428
COPPER .142 .142 .142 .142 .142 .142
BONDFUND .126 .356 .264 .275 .206 .218
MARIJUAN .1 .1 .1 .1 .1 .1
REGBANKS .024 .048 .048 .048 .024 .048
|
====================================================================================
Monday -
5/1/2023 - 1:00 AM Futures DJI +
6 NASDAQ +8 Data used 4/28/2023
| |
4/28/2023
|
|
| |
Hotline:
Hedging with
Housing and AI longs and shorts on the very weakest
regional banks is
advisable. Watch to see if the big four (the DJI, the SPY,
the NASDAQ and
QQQ) can all breakout, even as the rest of the market
seeks just to
stabalize.
A long time ago,
in 1913, the Federal Reserve Bank was sold as a
concept to the
American public by Woodrow Wilson as a reform to
prevent bankers
from causing financial panics like the one in 1907.
Behnd the scenes
the Federal Reserve system was actually secretly
designed by a
coterie of elite bankers of the day to give themselves complete
control interest
rates and money supply in the U.S. (And, I would add, so that
the elite bankers
and their their friends could make a lot of extra money in the
stock market
because of their inside knowledge of interest rate changes,
etc.).
https://www.federalreservehistory.org/essays/jekyll-island-conference
https://www.youtube.com/watch?v=4RCJGr2XQh8
From the bankers
point of view it has been a big success. Other folks
offer different
reviews. While the FED succeeded in stopping the
Crash of 2008 and
the financial panic of 2020, monetarists say it prolonged
the Great
Depression because it chose to protect the Dollar and keep
the U.S. on the
Gold Standard rather than deliberately increase money supply
to re-inflate the
general economy. In 1999 and 2022, it made the opposite
mistake, it
delayed too long raising rates and selling bonds and mortgages from
its own inventory
to curb the inflation born by the runaway stock prices its
low interest
rates caused. It is in a word, fallible. But that has not lessened
its near
omnipotence.
Now it has raised
rates so fast, that there have bank failures. Silicon
Valley was
vaporized. First Republic (FRC) is now in liquidation. And
other regional
banks like FFIC, GBCI, FIBK, HMST, NRIM and
BRKC (shown among
the MINCPs) may follow FRC into a financial
black hole.
The threat of
more bankruptices obviously has the FED's attention now.
Their medicine
for curing inflation is actually now causing bank failures, just as
happened in the
Depression or in 1920-1921. Many of the FOMC hawks
just don't seem
to care about the financial pain that a FED-created recession or
Depression can
cause millions of Americans.
Powell may be
different. Professional traders are now guessing, or have been
informed by
leakers within the FED, that short-term rates will soon pause and
stop going up.
The prospects of a rate pause, of course, are music to
the ears of
home-builders. Thus, in our bullish MAXCPs today we see
a new leadership
group of housing stocks coming to the fore. Look at
BZH, MHO, MTH,
PHM and their ETF, NAIL in our Bullish MAXCPs.
I think that the
bulls are right about Powell. So, we need to be long
home builders, as
well as artificial intelligence stocks, especially
NVDA and MSFT) as
well as the sugar, candy, beverage and donut
stocks.
Will these trends continue? Their stocks; their Closing Power,
Accumulation and
Relative Strength indicators all say "YES". Hedging
long positions in
them by shorting the weakest regional banks
should work out
well, even if the DJI again pulls back from 34000
and even with the
Summer trading doldrums not far away.
My own opinion is
that hedging seems a better way to go than guessing
whether the blue
chip DJI can stay over 34000 or not and whether without
higher volume and
much better breadth the DJI can now advance to 35000.
That is far from
certain, even if there is a clearer breakout by the DJI above
34000. The
DJI-30 is just carrying too much weight. The NYSE is lagging
and only 36% of
all our stocks and ETFs are above their 65-dma.
A DJI breakout
should also see breakouts by the NASDAQ, SPY and
QQQ. April
was a bullish month, Mays and Junes can be problematic. |
|
| |
4/28/2023
2022 PEERLESS DJI, Signals, Indicators Daily DJI Volume
10-DayUp/Down Vol Stoch-20 CCI RSI Pct of All Stocks above 65-dma
Inverted Traders Index
DJI-IPA DJI-OBV Short-Term Rates
NASDAQ S&P OEX NYSE DJ-15 DJ-20 DJI-30
Tiger Index of Big
Banks Bond
Funds Gold Stocks
Housing Stocks
Insurance-Stocks
Regional Banks
Russell-1000
Semi Conductors
Recent 2006 vers-Peerless signals http://tigersoftware.com/oldpeer/UPD90428.bmp
ETFs: DIA QQQ SPY IWM MDY
TNA Short-Term Rates Ten Year Rates PST (Short Treasuries)
DOLLAR-UUP
ALLSTOCKs
COIN (Bit
Coin ETF)
USO-CrudeOil DBO
BLDP FAS GLD HD IBB JETS JNUG KOL NAIL NUGT
NRGU OIH PALL RSX RETL SDS AGQ SLV SOXL TAN TECL TLT TMF TNA
UGA USO China: YINN CHAU
Commodities: CANE
CORN DBC JJC, NIB CORN, CUT (paper)
MOO, NRGU
SOYB WEAT UUP (Dollar) LIT
(Lithium) PALL
(Palladium)
Stocks AA AAPL ADBE ALXN AMAT AMGN AMD AMZN ANET AXON AXP
BA BABA BAC BIDU BLDP BSX CAT CDNS CHKP CNX CPB CRM CVX CMG
DE DIS ENPH FB FSLR FTNT GILD GME GOOG GS HD IBM INTU JPM KO KR
LRCX MRK MRNA MOS MSFT NEM NFLX NKE NOC NUE NVDA PANW PG PYPL
QCOM QDEL REGN REV RE SNOW SO SQUARE TSLA TXN XOM V VRTX WFC
WMT XLE ZM ZOM
Leveraged Short ETFs:
FAZ - financials, TZA and SRTY- small caps, MZZ - mid caps, TECS -Techs,
SOXS -
semi-conductors LABD
- Biotechs
Bullish MAXCPs www.tigersoftware.com/UPPING/4-28-2023/Bullish.htm
Bearish MINCPs www.tigersoftware.com/Downing/4-28-2023/BEARISH.htm
|
|
 |
 |
Watch to see if NASDAQ can breakout.
 |
 |
 |
 |
 |
 |
 |
 |
 |
 |
 |
Table 1 - Daily Breadth and Volume Statistics
| NYSE |
Latest Close |
Previous
Close |
Week Ago |
| Issues
traded |
3,111 |
3,079 |
3,100 |
| Advances |
2,206 |
2,342 |
1,350 |
| Declines |
798 |
636 |
1,612 |
| Unchanged |
107 |
101 |
138 |
| New
highs |
72 |
37 |
54 |
| New
lows |
37 |
55 |
39 |
| Adv.
volume* |
783,703,090 |
688,574,019 |
373,415,743 |
| Decl.
volume* |
260,528,345 |
120,309,036 |
513,470,310 |
| Total
volume* |
1,052,329,580 |
813,709,146 |
897,262,294 |
| Closing
Arms (TRIN)† |
1.03 |
0.68 |
1.19 |
| Block
trades* |
4,606 |
3,769 |
4,409 |
| Adv.
volume |
2,940,946,388 |
3,149,524,743 |
1,469,836,172 |
| Decl.
volume |
1,096,860,769 |
577,371,848 |
2,086,619,265 |
| Total
volume |
4,087,800,666 |
3,750,554,125 |
3,611,754,437 |
| NASDAQ |
Latest Close |
Previous
Close |
Week Ago |
| Issues
traded |
4,640 |
4,609 |
4,618 |
| Advances |
2,891 |
2,864 |
2,092 |
| Declines |
1,533 |
1,533 |
2,303 |
| Unchanged |
216 |
212 |
223 |
| New
highs |
70 |
53 |
68 |
| New
lows |
153 |
219 |
201 |
| Closing
Arms (TRIN)† |
0.71 |
0.99 |
0.71 |
| Block
trades |
45,145 |
42,688 |
44,059 |
| Adv.
volume |
3,844,474,537 |
3,401,536,144 |
2,713,174,155 |
| Decl.
volume |
1,452,848,103 |
1,806,409,696 |
2,112,117,071 |
| Total
volume |
5,331,381,382 |
5,253,710,477 |
4,868,059,227 |
|
Table 2 QUICKSILVER on ETFS - 4/28/2023 ---
Bullish = 3 SPY(.293), TECL (.323), GLD (.305)
Bearish = 2 RETL (-.428), OIH(-.262),
ETF CLOSE CHANGE PIVOT-PT 5-dma AROC CL-PWR CANDLE IP21 ITRS POWER INDEX
===============================================================================================
DIA 341.03 2.83 338.75 43.4% Bullish BLUE .333
---------------------------------------------------------------------------------------------
COMPQX 12226.58 84.34 12037.2 64.3% ------- BLUE .222 .015 .237
---------------------------------------------------------------------------------------------
SPY 415.93 3.52 412.63 45.5% ------- BLUE .286 .007 .293
---------------------------------------------------------------------------------------------
QQQ 322.56 2.21 315.95 94.5% ------- BLUE .198 .045 .243
---------------------------------------------------------------------------------------------
MDY 454.75 4.3 456.18 -15.5% ------- BLUE .12 -.071 .049
---------------------------------------------------------------------------------------------
IWM 175.2 1.52 177.44 -67.6% Bearish BLUE .087 -.097 -.01
---------------------------------------------------------------------------------------------
FAS 62.53 2.17 62.67 -46.2% ------- BLUE .253 -.299 -.046
---------------------------------------------------------------------------------------------
RETL 6.58 .01 7.02 -241.3% ------- BLUE -.014 -.414 -.428
---------------------------------------------------------------------------------------------
SOXL 14.23 .69 14.63 -226.3% Bearish BLUE .084 -.187 -.103
---------------------------------------------------------------------------------------------
TECL 36.49 1.13 34.06 292.7% ------- BLUE .221 .102 .323
---------------------------------------------------------------------------------------------
IBB 130.51 1.31 133.05 -112.6% ------- BLUE .206 -.023 .183
---------------------------------------------------------------------------------------------
GLD 184.8 .05 184.81 14.9% ------- ---- .222 .083 .305
---------------------------------------------------------------------------------------------
DBO 14.75 .37 15.13 -61.2% Bearish BLUE -.043 -.024 -.067
---------------------------------------------------------------------------------------------
OIH 274.13 6.05 286.18 -67.1% Bearish BLUE -.104 -.158 -.262
---------------------------------------------------------------------------------------------
CPER 23.85 .02 24.35 -121% Bearish RED .035 -.025 .01
---------------------------------------------------------------------------------------------
TAN 71.99 -.76 77.68 -381.8% ------- BLUE .095 -.087 .008
---------------------------------------------------------------------------------------------
UUP 27.75 .04 27.66 0% Bullish ---- .022 -.01 .012
---------------------------------------------------------------------------------------------
CORN 23.38 -.07 24.3 -213.8% ------- BLUE -.045 -.117 -.162
---------------------------------------------------------------------------------------------
WEAT 6.38 .02 6.61 -274.8% Bearish BLUE -.061 -.182 -.243
---------------------------------------------------------------------------------------------
YINN 40.79 .45 40.26 -97.4% Bearish BLUE -.006 -.226 -.232
|
Table 3 RANKING OF KEY DIRECTORIES BASED PCT.OF STOCKS ABOVE 65-DMA
4/28/23
---------------------------------------------------------------------------------------
Directory Current day-1 day-2 day-3 day-4 day-5
----------------------------------------------------------------------------------------
BEVERAGE .928 .928 .928 .928 .857 .857
HOMEBLDG .888 .777 .611 .722 .777 .722
=====
UTILITY .789 .842 .657 .815 .842 .894
HOSPITAL .785 .785 .785 .785 .785 .785
GOLD .717 .739 .717 .717 .717 .76
DJI-13 .692 .538 .307 .538 .769 .538
DOWJONES .666 .566 .4 .5 .7 .533
=====
ETFS .581 .509 .436 .4 .509 .472
NASD-100 .58 .55 .44 .5 .63 .63
GAMING .578 .526 .421 .578 .526 .526
HIGHPRIC .571 .532 .441 .493 .619 .601
==================================================================================================
FIDSTKS .497 .467 .349 .431 .508 .479
SP-100 .477 .444 .355 .422 .533 .488
SP500 .476 .427 .314 .379 .474 .453
INDEXES .459 .4 .329 .362 .47 .448
NIFTY .454 .409 .34 .34 .5 .568
FOOD .448 .428 .448 .428 .571 .489
GREEN .444 .444 .444 .444 .666 .611
INSURANC .44 .4 .32 .36 .4 .44
COMODITY .435 .41 .41 .41 .538 .461
SOFTWARE .428 .428 .339 .357 .446 .464
RUS-1000 .425 .381 .29 .337 .431 .427
RETAIL .404 .361 .276 .297 .425 .34
MILITARY .384 .346 .269 .384 .5 .461
TRANSP .368 .315 .105 .21 .368 .368
INFRA .363 .333 .303 .363 .393 .393
BIOTECH .358 .34 .358 .368 .42 .45
GUNS .357 .285 .285 .285 .357 .357
BONDFUND .356 .252 .275 .218 .218 .172
COMPUTER .35 .3 .25 .25 .35 .35
OILGAS .319 .257 .226 .247 .36 .288
BIGBANKS .285 .142 0 .142 .428 .285
CHEM .279 .186 .139 .186 .279 .255
INDMATER .263 .263 .222 .208 .291 .277
FINANCE .25 .225 .162 .187 .262 .237
HACKERS .25 .312 .312 .312 .437 .437
LOWPRICE .243 .226 .214 .229 .283 .266
ELECTRON .21 .187 .172 .172 .285 .3
AUTO .188 .188 .169 .15 .207 .207
REIT .184 .153 .115 .123 .138 .169
CHINA .181 .181 .113 .09 .136 .159
SEMI .18 .159 .159 .138 .297 .329
COAL .166 .166 .166 .166 .166 .166
EDU .166 .166 .333 .333 .333 .333
JETS .153 .153 .153 .153 .153 .153
COPPER .142 .142 .142 .142 .142 .142
SOLAR .125 .187 .125 .312 .5 .5
MARIJUAN .1 .1 .1 .1 .1 .1
REGBANKS .048 .048 .048 .024 .048 .048
=====
|
=====================================================================================
Friday - 4/28/2023 - 8:50 AM DJI +
180 NASDAQ +40 Data used 4/27/2023
|
Sorry about the delay. All should be back to normal next week.
The DJI's Closing Power alone
among the big ETFs is rising convincingly.
See Table 2 below and the
charts below. Its Accumulation Index is very
high. I should have
factored this in when calling for a decline to the lower
band by it earlier this week.
Now we must wait an see if the sellers at
DJI-34000 are still there.
Big MSFT profits sent the DJI
soaring. The NASDAQ and other ETFs joined
in the rally. But the
weakest of the Regional Banks, which are shown below
and which we remain short,
could not advance even though other regional banks did.
This shows the advantage of
shorting the weakest BEARISH MINCPS as a hedge
against long positions.
The DJI is now charging back
up to its 34000 resistance. Until we see a new Peerless
Buy or there is a high volume
breakout by the DJI above its 34000 resistance, my
suggestion is to avoid the
DJI and use our hedging strategy emplying MAXCPs
and MINCPs.
Elsewhere, the market's bulls
clearly prefers well known companies that dominate
their industries and can
raise their prices without much fear of a contraction of
demand.
Lilly's new drug to
fight diabetes also can reduce a person's weight by an amazing
15%. Gluttonly,
pure and simple, caused traders to indulge in buying YUM (donuts),
MCD (milkshakes) and
HSY (chocolate). See bullish MAXCPs.
Lilly's
tirzepatide achieved up to 15.7% weight loss in adults
Sugar is King, not Cotton

The Hotline today has been
cut short. It will resume its normal content
Sunday. But use the new
address that will be sent you Saturday. |
|
|
Bullish
MAXCPs www.tigersoftware.com/UPPING/4-27-2023/Bullish.htm
Bearish MINCPs www.tigersoftware.com/Downing/4-27-2023/BEARISH.htm
|
|
CHARTS AND TABLES
 |
 |
 |
 |
 |
 |
 |
|
 |
 |
 |
 |
 |
 |
| No table 1 today. |
Table 2 QUICKSILVER on ETFS - 4/27/2023 ---
Bullish = 1 GLD (.304)
Bearish = 1 RETL, WEAT
ETF CLOSE CHANGE PIVOT-PT 5-dma AROC CL-PWR CANDLE IP21 ITRS POWER INDEX
===============================================================================================
DIA 338.2 5.25 338.11 3.7% Bullish BLUE .316 0 .316
---------------------------------------------------------------------------------------------
COMPQX 12142.24 287.89 12072.46 34.6% ------- BLUE .204 .024 .228
---------------------------------------------------------------------------------------------
SPY 412.41 8.05 412.2 6.5% ------- BLUE .273 .008 .281
---------------------------------------------------------------------------------------------
QQQ 320.35 8.48 316.61 64.8% ------- BLUE .177 .053 .23
---------------------------------------------------------------------------------------------
MDY 450.45 7.02 456.15 -65.7% Bearish BLUE .124 -.067 .057
---------------------------------------------------------------------------------------------
IWM 173.68 2.29 177.56 -104.1% Bearish BLUE .098 -.089 .009
---------------------------------------------------------------------------------------------
FAS 60.36 2.74 63.09 -288.6% ------- BLUE .287 -.314 -.027
---------------------------------------------------------------------------------------------
RETL 6.57 .23 6.9 -238.9% Bearish BLUE .004 -.366 -.362
---------------------------------------------------------------------------------------------
SOXL 13.54 .17 14.86 -582.4% Bearish BLUE .062 -.21 -.148
---------------------------------------------------------------------------------------------
TECL 35.36 2.06 34.51 68.2% ------- BLUE .202 .092 .294
---------------------------------------------------------------------------------------------
IBB 129.2 .46 133.46 -104.2% ------- BLUE .202 -.026 .176
---------------------------------------------------------------------------------------------
GLD 184.75 .01 184.25 -36.2% ------- BLUE .21 .079 .289
---------------------------------------------------------------------------------------------
DBO 14.38 .07 14.93 -118.5% Bearish ---- -.117 -.045 -.162
---------------------------------------------------------------------------------------------
OIH 268.08 -.72 277.82 -265.1% Bearish BLUE -.121 -.181 -.302
---------------------------------------------------------------------------------------------
CPER 23.83 .22 24.43 -161.6% Bearish BLUE .022 -.034 -.012
---------------------------------------------------------------------------------------------
TAN 72.75 1.3 77.72 -321% ------- BLUE .087 -.041 .046
---------------------------------------------------------------------------------------------
UUP 27.71 .01 27.75 -12.6% Bullish RED .049 .003 .052
---------------------------------------------------------------------------------------------
CORN 23.45 -.64 24.41 -291.3% ------- RED -.121 -.113 -.234
---------------------------------------------------------------------------------------------
WEAT 6.36 -.11 6.74 -353.7% Bearish ---- -.157 -.193 -.35
---------------------------------------------------------------------------------------------
YINN 40.34 1.74 41.56 -405.6% Bearish BLUE .001 -.248 -.247
|
Table 3 RANKING OF KEY DIRECTORIES BASED PCT.OF STOCKS ABOVE 65-DMA
4/27/23
---------------------------------------------------------------------------------------
Directory Current day-1 day-2 day-3 day-4 day-5
----------------------------------------------------------------------------------------
BEVERAGE .928 .928 .928 .857 .857 .928
UTILITY .842 .657 .815 .842 .868 .842
HOSPITAL .785 .785 .785 .785 .785 .714
HOMEBLDG .777 .611 .722 .777 .722 .722
GOLD .739 .717 .717 .717 .76 .782
DOWJONES .566 .4 .5 .7 .533 .633
NASD-100 .55 .44 .5 .63 .63 .65
DJI-13 .538 .307 .538 .769 .538 .615
HIGHPRIC .532 .441 .493 .619 .597 .606
GAMING .526 .421 .526 .578 .526 .526
ETFS .509 .436 .4 .509 .49 .545
FIDSTKS .467 .349 .431 .508 .485 .491
GREEN .444 .444 .444 .666 .611 .5
SP-100 .444 .355 .422 .533 .488 .511
FOOD .428 .469 .408 .571 .489 .469
SOFTWARE .428 .357 .357 .446 .464 .464
SP500 .427 .314 .381 .47 .457 .457
COMODITY .41 .435 .384 .538 .461 .461
NIFTY .409 .34 .34 .5 .568 .522
INDEXES .4 .329 .362 .47 .448 .47
INSURANC .4 .32 .36 .4 .44 .44
RUS-1000 .381 .29 .337 .431 .428 .426
RETAIL .361 .276 .297 .425 .361 .361
MILITARY .346 .269 .384 .5 .461 .5
BIOTECH .34 .355 .37 .42 .447 .422
INFRA .333 .303 .363 .393 .393 .393
TRANSP .315 .105 .21 .368 .368 .368
HACKERS .312 .312 .312 .437 .437 .437
COMPUTER .3 .25 .25 .35 .35 .35
GUNS .285 .285 .285 .357 .357 .357
INDMATER .263 .222 .208 .291 .277 .319
OILGAS .257 .226 .247 .36 .298 .268
BONDFUND .252 .264 .218 .229 .172 .206
LOWPRICE .226 .217 .232 .286 .269 .275
FINANCE .225 .162 .187 .25 .237 .262
AUTO .188 .188 .15 .207 .207 .207
ELECTRON .187 .172 .172 .285 .293 .308
SOLAR .187 .125 .312 .5 .5 .437
CHEM .186 .139 .186 .279 .255 .279
CHINA .181 .113 .09 .136 .159 .181
COAL .166 .166 .166 .166 .166 .333
EDU .166 .333 .333 .333 .333 .5
SEMI .159 .159 .138 .297 .319 .308
JETS .153 .153 .153 .153 .153 .153
REIT .153 .107 .13 .146 .161 .169
BIGBANKS .142 0 .142 .428 .285 .285
COPPER .142 .142 .142 .142 .142 .285
MARIJUAN .1 .1 .1 .1 .1 .1
REGBANKS .048 .048 .024 .048 .048 .048
|
===================================================================================
Thursday - 4/26/2023 - 6:12 AM Futures: DJI +168
NASDAQ +138 Data used 4/26/2023
| |
4/26/2023
|
|
| |
Even if there is a rally
short-term, our clinched Sell S12 tells us to look for lower
prices until the DJI reaches its 3.5%
lower band. This means that most stocks
and ETFs will be following the DJI,
though there may be rallies from supports like the
65-dma. Our falling Closing Power
on DIA and DJ-30 tells us to not trust
these rallies. All this most of us
can see from the history of Sell S12 signals even if
they first bring some small paper losses
if you trade the DJI..
What emerges now from our current
situation is just how profitable it can be
picking the biggest losers after the Sell
S12 occurs. Regional banks clearly
have been the weakest group since the
Sell S12. Whether or not, this is a
bear market, the weakest bearish MINCPs
will act like it is when Peerless
gives a Sell S12 and there are so many
stocks from one group populating
each night the bearish MINCPs shown here.
They cave in when the general
market starts declining.
The very weakest Bearish MINCPs are shown
below: FRC, FFIC and EGBN.
The heads of these companies all made
major mistakes and did not plan ahead
properly when the FED started raising
interest rates. Whether they made these
mistakes out of ineptitude, ignorance or
short-term greed, this is the conduct
that bear markets always expose. It
is one of the things we can count on. So,
don't overlook this easy way our software
and the Hotline offer to make good
money at these times. Nothng I can
say from the market's actions today is
anywhere near as important as this.
|
|
| |
Charts - 4/26/2023
2022 PEERLESS DJI, Signals, Indicators Daily DJI Volume
10-DayUp/Down Vol Stoch-20 CCI RSI Pct of All Stocks above 65-dma
Inverted Traders Index
DJI-IPA DJI-OBV Short-Term Rates
NASDAQ S&P OEX NYSE DJ-15 DJ-20 DJI-30
Tiger Index of Big
Banks Bond
Funds Gold Stocks
Housing Stocks
Insurance-Stocks
Regional Banks
Russell-1000
Semi Conductors
Recent 2006 vers-Peerless signals http://tigersoftware.com/oldpeer/UPD90426.bmp
ETFs: DIA QQQ SPY IWM MDY
TNA Short-Term Rates Ten Year Rates PST (Short Treasuries)
DOLLAR-UUP
ALLSTOCKs
COIN (Bit
Coin ETF)
USO-CrudeOil DBO
BLDP FAS GLD HD IBB JETS JNUG KOL NAIL NUGT
NRGU OIH PALL RSX RETL SDS AGQ SLV SOXL TAN TECL TLT TMF TNA
UGA USO China: YINN CHAU
Commodities: CANE
CORN DBC JJC, NIB CORN, CUT (paper)
MOO, NRGU
SOYB WEAT UUP (Dollar) LIT
(Lithium) PALL
(Palladium)
Stocks AA AAPL ADBE ALXN AMAT AMGN AMD AMZN ANET AXON AXP
BA BABA BAC BIDU BLDP BSX CAT CDNS CHKP CNX CPB CRM CVX CMG
DE DIS ENPH FB FSLR FTNT GILD GME GOOG GS HD IBM INTU JPM KO KR
LRCX MRK MRNA MOS MSFT NEM NFLX NKE NOC NUE NVDA PANW PG PYPL
QCOM QDEL REGN REV RE SNOW SO SQUARE TSLA TXN XOM V VRTX WFC
WMT XLE ZM ZOM
Leveraged Short ETFs:
FAZ - financials, TZA and SRTY- small caps, MZZ - mid caps, TECS -Techs,
SOXS -
semi-conductors LABD
- Biotechs
Bullish MAXCPs www.tigersoftware.com/UPPING/4-26-2023/Bullish.htm
Bearish MINCPs www.tigersoftware.com/Downing/4-26-2023/BEARISH.htm
|
|
 |
 |
 |
+ |
 |
 |
|
 |
 |
 |
 |
 |
 |
 |
 |
Table 1 - Daily Breadth and Volume Statistics
| NYSE |
Latest Close |
Previous
Close |
Week Ago |
| Issues
traded |
3,111 |
3,116 |
3,106 |
| Advances |
1,011 |
496 |
1,399 |
| Declines |
1,969 |
2,538 |
1,580 |
| Unchanged |
131 |
82 |
127 |
| New
highs |
31 |
43 |
54 |
| New
lows |
101 |
103 |
33 |
| Adv.
volume* |
192,386,569 |
107,267,253 |
344,088,301 |
| Decl.
volume* |
633,875,579 |
740,474,802 |
403,157,728 |
| Total
volume* |
846,351,901 |
856,251,914 |
758,794,263 |
| Closing
Arms (TRIN)† |
1.50 |
1.33 |
1.18 |
| Block
trades* |
4,051 |
4,563 |
3,854 |
| Adv.
volume |
954,865,712 |
501,909,925 |
1,508,466,478 |
| Decl.
volume |
2,787,901,251 |
3,426,599,684 |
2,002,940,998 |
| Total
volume |
3,837,034,178 |
3,978,647,357 |
3,572,564,312 |
| NASDAQ |
Latest Close |
Previous
Close |
Week Ago |
| Issues
traded |
4,680 |
4,643 |
4,655 |
| Advances |
1,785 |
998 |
2,104 |
| Declines |
2,662 |
3,455 |
2,324 |
| Unchanged |
233 |
190 |
227 |
| New
highs |
51 |
39 |
65 |
| New
lows |
408 |
385 |
140 |
| Closing
Arms (TRIN)† |
1.00 |
0.70 |
0.78 |
| Block
trades |
44,196 |
36,059 |
46,208 |
| Adv.
volume |
2,107,020,210 |
1,395,496,511 |
2,638,917,573 |
| Decl.
volume |
3,134,407,163 |
3,394,708,287 |
2,261,667,423 |
| Total
volume |
5,281,973,744 |
4,806,021,164 |
4,972,705,439 |
|
Table 2 QUICKSILVER on ETFS - 4/26/2023 ---
Bullish = 1 GLD (.304)
Bearish = 1 RETL, WEAT
ETF CLOSE CHANGE PIVOT-PT 5-dma AROC CL-PWR CANDLE IP21 ITRS POWER INDEX
===============================================================================================
DIA 332.95 -2.38 337.95 -89.4% ------- RED .26 0 ----
high
---------------------------------------------------------------------------------------------
COMPQX 11854.35 55.19 12059.56 -125.9% ------- RED .179 .025 .204
---------------------------------------------------------------------------------------------
SPY 404.36 -1.72 411.88 -118.9% ------- RED .239 .008 .247
---------------------------------------------------------------------------------------------
QQQ 311.87 1.88 316.28 -108.4% ------- RED .148 .052 .2
---------------------------------------------------------------------------------------------
MDY 443.43 -3.99 456.39 -159.4% Bearish RED .09 -.062 .028
---------------------------------------------------------------------------------------------
IWM 171.39 -1.67 177.33 -194.1% Bearish RED .036 -.082 -.046
---------------------------------------------------------------------------------------------
FAS 57.62 -1.74 63.9 -550.2% ------- RED .272 -.335 -.063
---------------------------------------------------------------------------------------------
RETL 6.34 .01 6.89 -468.9% Bearish ---- -.04 -.37 -.41
---------------------------------------------------------------------------------------------
SOXL 13.37 .17 15.2 -645.9% Bearish RED .034 -.158 -.124
---------------------------------------------------------------------------------------------
TECL 33.3 1.43 34.9 -337.8% ------- RED .171 .058 .229
---------------------------------------------------------------------------------------------
IBB 128.74 -1.76 131.94 -169.1% ------- RED .164 -.013 .151
---------------------------------------------------------------------------------------------
GLD 184.74 -1.01 186.09 -16.7% ------- RED .205 .099 .304
---------------------------------------------------------------------------------------------
DBO 14.31 -.43 14.73 -251.4% Bearish RED -.105 -.029 -.134
---------------------------------------------------------------------------------------------
OIH 268.8 -5.66 282.82 -326.8% Bearish RED -.085 -.161 -.246
---------------------------------------------------------------------------------------------
CPER 23.61 -.05 24.61 -262.4% Bearish RED -.014 -.017 -.031
---------------------------------------------------------------------------------------------
TAN 71.45 -4.17 77.63 -409.5% ------- RED .075 -.045 .03
---------------------------------------------------------------------------------------------
UUP 27.7 -.09 27.78 -14.4% Bullish BLUE .038 .021 .059
---------------------------------------------------------------------------------------------
CORN 24.09 -.12 24.87 -217.6% ------- ---- -.001 -.072 -.073
---------------------------------------------------------------------------------------------
WEAT 6.47 -.1 6.83 -341.4% Bearish RED -.2 -.162 -.362
---------------------------------------------------------------------------------------------
YINN 38.6 1.69 43.6 -720.2% Bearish RED .067 -.281 -.214
|
Table 3 RANKING OF KEY DIRECTORIES BASED PCT.OF STOCKS ABOVE 65-DMA
4/26/23
Bullish = 5
Bearish = 44
---------------------------------------------------------------------------------------
Directory Current day-1 day-2 day-3 day-4 day-5
----------------------------------------------------------------------------------------
BEVERAGE .928 .928 .857 .857 .928 .928
HOSPITAL .785 .785 .785 .785 .714 .714
GOLD .717 .717 .717 .76 .76 .804
UTILITY .657 .815 .842 .868 .842 .815
HOMEBLDG .611 .722 .777 .722 .722 .777
==============================================================================================
FOOD .469 .428 .551 .489 .469 .632
GREEN .444 .444 .666 .611 .5 .555
HIGHPRIC .441 .493 .619 .597 .606 .658
NASD-100 .44 .5 .63 .63 .65 .65
ETFS .436 .4 .509 .49 .563 .527
COMODITY .435 .41 .512 .461 .461 .615
GAMING .421 .526 .526 .578 .526 .684
DOWJONES .4 .5 .7 .533 .633 .666
SOFTWARE .357 .375 .446 .464 .464 .5
BIOTECH .355 .368 .422 .447 .422 .435
SP-100 .355 .422 .533 .488 .5 .611
FIDSTKS .349 .431 .508 .485 .491 .532
NIFTY .34 .34 .5 .568 .522 .59
EDU .333 .333 .333 .333 .5 .5
INDEXES .329 .362 .47 .448 .47 .529
INSURANC .32 .36 .4 .44 .44 .48
SP500 .314 .381 .472 .453 .459 .501
HACKERS .312 .312 .437 .437 .437 .437
DJI-13 .307 .538 .769 .538 .615 .692
INFRA .303 .363 .393 .393 .393 .393
RUS-1000 .29 .337 .431 .428 .425 .464
GUNS .285 .285 .357 .357 .357 .357
RETAIL .276 .297 .425 .361 .382 .382
MILITARY .269 .384 .5 .461 .5 .576
BONDFUND .264 .206 .229 .183 .218 .16
COMPUTER .25 .25 .35 .35 .35 .45
OILGAS .226 .247 .36 .298 .268 .35
INDMATER .222 .208 .291 .277 .319 .375
LOWPRICE .217 .234 .289 .272 .272 .272
AUTO .188 .169 .207 .207 .226 .245
ELECTRON .172 .172 .285 .293 .3 .338
COAL .166 .166 .166 .166 .333 .5
FINANCE .162 .187 .25 .225 .262 .25
SEMI .159 .138 .297 .319 .297 .34
JETS .153 .153 .153 .153 .153 .307
COPPER .142 .142 .142 .142 .142 .428
CHEM .139 .186 .279 .255 .279 .372
SOLAR .125 .312 .5 .5 .437 .375
CHINA .113 .09 .136 .159 .181 .181
REIT .107 .123 .153 .169 .161 .2
TRANSP .105 .21 .368 .368 .368 .315
MARIJUAN .1 .1 .1 .1 .1 .1
REGBANKS .048 .024 .048 .048 .048 .048
BIGBANKS 0 .142 .428 .285 .285 .285
|
===================================================================================
Wednesday - 4/26/2023 - 6:16 AM
Futures: DJI +100 NASDAQ +100
Data used 4/25/2023
| |
4/25/2023
|
|
| |
We are seeing a recovery in the DJI and NASDAQ after yesterday's broad
decline.
Bargain-hunting shows that there are still lots of bulls who believe
the FED
will support the market and not raise rates because of how fragile
regional
banks look now. Professionals may concur. Or they may sell into
rally and
cause our Closing Powers to drop. This would be quite bearish,
The DJI's
Peerless Sell S12 has been "clinched" by DIA's Closing Power uptrend
being violated.
When we treat the DJI as a stock or ETF (see second chart down
from top
tonight), we see the same thing, though I did not draw it in. "Clinching"
a Peerless Sell
is important because we want to avoid, as much as possible,
paper losses.
But with a little dilligence we can use our full quiver of technical
indicators and
notice when the uptrends of the various indicators of the DJI, DJ-30
and DIA have had
their uptrends broken. And in this case, we could see how
unrelenting was
the resistance at 34000. So we might properly guess that
the
"quants" and Professionals were running out of funds trying to prop the DJI
up. They do
this because it is profitable trading like this near the resistance
and because they
want to conceal the weakness elsewhere in the market.
Now they appear
to be no longer propping up the DJI. If the bulls are lucky,
professional
money will now be shifted to other investment vehicles, like
gold, oils,
utilities, bonds and commodities while waiting for the DJI to again
pulll back.
Watch the other charts shown below representing alternatives
to the DJI.
Bears, now are encouraged that the regional banks may now be
starting another
leg down. There are more than a dozen of these banks on our
Bearish MINCP
stock list todays. Their weakness has stood out clearly.
I hope many of
you have used them to hedge long positions.
The Fed now,
because of the sharp sell-off in regional banks, will be under
intense pressure
from its clientele to hold back on more rate increasing. These
banks are
already under water to the tune of trillions because they unwisely
bought bonds when
interest rates were very low. Now if rates go higher,
not only will
their older bonds and mortgages drop even more if marked
to what they
realistically could sell them for, but their own customers' defaulting
on loans and
mortages will also rise as the economy weakens due to
the effects of
the rising rates. That the Fed will turn away from hawkish accents,
at least, is the
expectation of the growth stock and tech stock afficionadas who
will be buying on
the sell-offs in their favorite groups.
Watch any longs
you have now for signs these stocks or ETFs are going
to drop
with the DJI. Most often a Peerless sell signal takes semis,
techs and
biotechs, too. That is what I tried to show last night. The
smaller
regional banks are in trouble. I would short more of them.
Expect the
DJI to drop to its lower band. Remember in May traders
"go
away". Without their support of the DJI, it may go back even to
30000.
Watch the breadth (which was terrible today) and our
Accumulation Index. It is still high for the big major market ETFs,
but can
drop swiftly below its 21-day ma if this is to be a big sell-off.
|
|
| |
Charts - 4/25/2023
2022 PEERLESS DJI, Signals, Indicators Daily DJI Volume
10-DayUp/Down Vol Stoch-20 CCI RSI Pct of All Stocks above 65-dma
Inverted Traders Index
DJI-IPA DJI-OBV Short-Term Rates
NASDAQ S&P OEX NYSE DJ-15 DJ-20 DJI-30
Tiger Index of Big
Banks Bond
Funds Gold Stocks
Housing Stocks
Insurance-Stocks
Regional Banks
Russell-1000
Semi Conductors
Recent 2006 vers-Peerless signals http://tigersoftware.com/oldpeer/UPD90425.bmp
ETFs: DIA QQQ SPY IWM MDY
TNA Short-Term Rates Ten Year Rates PST (Short Treasuries)
DOLLAR-UUP
ALLSTOCKs
COIN (Bit
Coin ETF)
USO-CrudeOil DBO
BLDP FAS GLD HD IBB JETS JNUG KOL NAIL NUGT
NRGU OIH PALL RSX RETL SDS AGQ SLV SOXL TAN TECL TLT TMF TNA
UGA USO China: YINN CHAU
Commodities: CANE
CORN DBC JJC, NIB CORN, CUT (paper)
MOO, NRGU
SOYB WEAT UUP (Dollar) LIT
(Lithium) PALL
(Palladium)
Stocks AA AAPL ADBE ALXN AMAT AMGN AMD AMZN ANET AXON AXP
BA BABA BAC BIDU BLDP BSX CAT CDNS CHKP CNX CPB CRM CVX CMG
DE DIS ENPH FB FSLR FTNT GILD GME GOOG GS HD IBM INTU JPM KO KR
LRCX MRK MRNA MOS MSFT NEM NFLX NKE NOC NUE NVDA PANW PG PYPL
QCOM QDEL REGN REV RE SNOW SO SQUARE TSLA TXN XOM V VRTX WFC
WMT XLE ZM ZOM
Leveraged Short ETFs:
FAZ - financials, TZA and SRTY- small caps, MZZ - mid caps, TECS -Techs,
SOXS -
semi-conductors LABD
- Biotechs
Bullish MAXCPs www.tigersoftware.com/UPPING/4-25-2023/Bullish.htm
Bearish MINCPs www.tigersoftware.com/Downing/4-25-2023/BEARISH.htm
|
|
Peerless DJI and Signals
 |
 |
DIA testing its rising 21-dma.
But its long Closing Power uptrend has been violated.
 |
NASDAQ testing its rising 65-dma.
 |
Uptrend of QQQ's Closing Power has not been violated.
 |
SPY's Closing
Power uptrend has not yet been violated.
 |
Weak SOXL...
 |
TECL
is testing its rising 65-dma. CP uptrend has been violated.
 |
FAS is weak, below falling 65-dma. CP uptrend has been violated.
 |
 |
 |
 |
 |
 |
| NYSE |
Latest Close |
Previous
Close |
Week Ago |
| Issues
traded |
3,116 |
3,076 |
3,125 |
| Advances |
496 |
1,635 |
1,374 |
| Declines |
2,538 |
1,331 |
1,617 |
| Unchanged |
82 |
110 |
134 |
| New
highs |
43 |
53 |
66 |
| New
lows |
103 |
40 |
34 |
| Adv.
volume* |
107,267,253 |
407,289,239 |
394,465,317 |
| Decl.
volume* |
740,474,802 |
326,098,805 |
368,183,062 |
| Total
volume* |
856,251,914 |
746,084,794 |
770,127,537 |
| Closing
Arms (TRIN)† |
1.33 |
1.02 |
0.78 |
| Block
trades* |
4,563 |
3,818 |
3,616 |
| Adv.
volume |
501,909,925 |
1,766,512,542 |
1,821,262,089 |
| Decl.
volume |
3,426,599,684 |
1,466,683,026 |
1,674,032,383 |
| Total
volume |
3,978,647,357 |
3,290,940,151 |
3,536,646,758 |
| NASDAQ |
Latest Close |
Previous
Close |
Week Ago |
| Issues
traded |
4,643 |
4,630 |
4,660 |
| Advances |
998 |
1,817 |
1,954 |
| Declines |
3,455 |
2,614 |
2,512 |
| Unchanged |
190 |
199 |
194 |
| New
highs |
39 |
79 |
74 |
| New
lows |
385 |
211 |
152 |
| Closing
Arms (TRIN)† |
0.70 |
1.65 |
0.81 |
| Block
trades |
36,059 |
44,680 |
36,897 |
| Adv.
volume |
1,395,496,511 |
1,424,122,248 |
2,344,312,231 |
| Decl.
volume |
3,394,708,287 |
3,383,118,058 |
2,455,143,937 |
| Total
volume |
4,806,021,164 |
4,854,054,961 |
4,851,816,227 |
|
Table 2 QUICKSILVER on ETFS - 4/25/2023 ---
Bullish = 4 SPY,(.264), GLD (.343)
Bearish = 1 WEAT
ETF CLOSE CHANGE PIVOT-PT 5-dma AROC CL-PWR CANDLE IP21 ITRS POWER INDEX
==============================================================================================
DIA 335.33 -3.42 338.99 -66% ------- RED .297 0 . ----
---------------------------------------------------------------------------------------------
COMPQX 11799.16 -238.04 12157.23 -146.4% ------- RED .186 .017 .203
---------------------------------------------------------------------------------------------
SPY 406.08 -6.55 414.14 -98.4% ------- RED .259 .005 .264
---------------------------------------------------------------------------------------------
QQQ 309.99 -5.96 318.71 -139.8% ------- RED .156 .044 .2
---------------------------------------------------------------------------------------------
MDY 447.42 -8.76 457.93 -106.3% Bearish RED .137 -.06 .077
---------------------------------------------------------------------------------------------
IWM 173.06 -4.38 178.25 -139.5% Bearish RED .083 -.081 .002
---------------------------------------------------------------------------------------------
FAS 59.36 -3.31 64.52 -369.2% ------- RED .278 -.312 -.034
---------------------------------------------------------------------------------------------
RETL 6.33 -.69 6.98 -488.5% Bearish RED -.014 -.349 -.363
---------------------------------------------------------------------------------------------
SOXL 13.2 -1.43 15.26 -851.7% Bearish RED .023 -.155 -.132
---------------------------------------------------------------------------------------------
TECL 31.87 -2.19 35.61 -580% ------- RED .19 .046 .236
------------------------------------------------------------------------------------ ---------
IBB 130.5 -2.55 133.22 -81.3% ------- RED .16 -.004 .156
---------------------------------------------------------------------------------------------
GLD 185.75 .94 185.36 -13.5% Bullish BLUE .261 .082 .343
---------------------------------------------------------------------------------------------
DBO 14.74 -.39 15.06 -206.1% ------- RED -.007 -.023 -.03
---------------------------------------------------------------------------------------------
OIH 274.46 -11.72 287.21 -216.6% Bearish RED .015 -.156 -.141
---------------------------------------------------------------------------------------------
CPER 23.66 -.69 24.89 -281.8% Bearish ---- .041 -.021 .02
---------------------------------------------------------------------------------------------
TAN 75.62 -2.06 77.78 -178.6% ------- RED .145 .007 .152
---------------------------------------------------------------------------------------------
UUP 27.79 .13 27.78 12.6% ------- BLUE -.057 .003 -.054
---------------------------------------------------------------------------------------------
CORN 24.21 -.09 25.16 -255.6% Bullish RED .085 -.082 .003
---------------------------------------------------------------------------------------------
WEAT 6.57 -.04 6.93 -394.5% Bearish ---- -.143 -.169 -.312
---------------------------------------------------------------------------------------------
YINN 36.91 -3.35 44.56 -1062.2% Bearish RED .122 -.296 -.174
|
Table 3 RANKING OF KEY DIRECTORIES BASED PCT.OF STOCKS ABOVE 65-DMA
4/25/23
Bullish = 7
Bearish = 41
Notebig drop in DOW JONES value here tonight.
---------------------------------------------------------------------------------------
Directory Current day-1 day-2 day-3 day-4 day-5
----------------------------------------------------------------------------------------
BEVERAGE .928 .857 .857 .928 .928 .928
UTILITY .815 .842 .868 .842 .789 .763
HOSPITAL .785 .785 .785 .714 .714 .714
HOMEBLDG .722 .777 .722 .722 .777 .722
GOLD .717 .717 .76 .76 .804 .847
DJI-13 .538 .769 .538 .615 .692 .615
GAMING .526 .526 .526 .578 .684 .631
==============================================================================================
DOWJONES .5 .7 .533 .633 .666 .7
==============================================================================================
NASD-100 .5 .63 .63 .65 .65 .66
HIGHPRIC .493 .619 .597 .606 .649 .666
GREEN .444 .666 .611 .5 .555 .555
FIDSTKS .431 .508 .485 .491 .532 .532
FOOD .428 .571 .469 .469 .632 .653
SP-100 .422 .533 .488 .5 .611 .588
COMODITY .41 .538 .435 .461 .615 .641
ETFS .4 .509 .49 .563 .563 .636
MILITARY .384 .5 .461 .5 .576 .576
SP500 .381 .472 .455 .455 .501 .505
SOFTWARE .375 .464 .464 .464 .5 .517
BIOTECH .371 .422 .451 .427 .437 .422
INFRA .363 .393 .393 .393 .393 .393
INDEXES .362 .47 .448 .47 .524 .54
INSURANC .36 .4 .44 .44 .48 .4
NIFTY .34 .5 .568 .522 .59 .636
RUS-1000 .337 .431 .428 .425 .461 .459
EDU .333 .333 .333 .5 .5 .666
HACKERS .312 .437 .437 .437 .437 .562
SOLAR .312 .5 .5 .437 .375 .375
RETAIL .297 .425 .361 .382 .382 .446
GUNS .285 .357 .357 .357 .357 .357
COMPUTER .25 .35 .35 .35 .45 .6
OILGAS .247 .36 .298 .268 .35 .34
LOWPRICE .234 .292 .275 .275 .272 .283
TRANSP .21 .368 .368 .368 .315 .263
INDMATER .208 .291 .277 .319 .361 .375
BONDFUND .206 .218 .183 .229 .149 .264
FINANCE .187 .25 .225 .25 .25 .275
CHEM .186 .279 .255 .279 .348 .325
ELECTRON .172 .285 .293 .3 .33 .368
AUTO .169 .226 .207 .226 .245 .301
COAL .166 .166 .166 .333 .5 .5
JETS .153 .153 .153 .153 .307 .307
BIGBANKS .142 .428 .285 .285 .285 .285
COPPER .142 .142 .142 .142 .428 .428
SEMI .138 .297 .319 .297 .329 .372
REIT .123 .146 .176 .169 .192 .161
MARIJUAN .1 .1 .1 .1 .1 .2
CHINA .09 .136 .159 .181 .181 .204
REGBANKS .024 .048 .048 .048 .048 .048
|
=====================================================================================
Tuesday -
4/25/2023 - 6:15 AM Futures: DJI -102 NASDAQ -53
Data used 4/24/2023
| |
4/24/2023
|
|
| |
Another early dip is shaping up. But seasonality is quite bullish for the
next
ten days. And traders may be pleased with AMZN earnings today.
Covid
has brought a lot of new buyers to Amazon.
The
DJI was down on Monday more than 100 points. Then began a mid-day
rally
as Professionals, as though in unison, drove prices up quite steadily. This
action is what has been driving the DJI and the various major market indexes
up
ever since the current rally began. We are waiting for Professionals not
behaving this way to call for a decline to the lower band by the DJI, SPY,
QQQ
and NASDAQ. We may need to see the exactly opposite behavior,
namely a sharp reversal down after a strong opening. But we wll also turn
bearish if the steep Closing Power uptrends are broken by additional significant
selling after a poor opening, such as today appears to be offering.
In trusting our Closing Power, at first, we simply reasoned that
Professionals
usually know best. Compared to the Public which tends to be more influenced
by
the headlines, we do not need to be cynics to undertand that Professionals
do
know much better what the FED really intends to do, rather than what
Powell and associates simply say. They also know more because they are
smart
enough to watch what those with insider information are doing.
Tiger and Peerless Signals
When
we superimpose the Peerless DJI-based signals on indexes of groups
of
stocks or ETFs, we find that their Buys and Sells taken at the next day's
opening brings widely different gains from group to group or ETF to ETF.
For
years, we have seen Peerless work best in terms of gains long and short
where
there is volatility. See below how well Peerless has worked this year
with
biotechs, semi-conductors and electronics stocks. And also with
housing stocks. When a signal occurs with one of these groups, it is advisable
to
look for their representatives in the Bearish MINCPs and Bullish MAXCPs.
Traders should also consider trading soon after a reversing optimized Buy
or
Sell when that system for a group or an ETF shows both very high pct. gains
on an
ETF or Tiger Stock group. See below. I put the most trust in these
when
they are based on 5-day and 50-day Stochastics. With luck the best
picks
this way show lots of other technical signs, such as being near support
or
resistance and a Closing Power reversal.
|
|
| |
Charts - 4/24/2023
2022 PEERLESS DJI, Signals, Indicators Daily DJI Volume
10-DayUp/Down Vol Stoch-20 CCI RSI Pct of All Stocks above 65-dma
Inverted Traders Index
DJI-IPA DJI-OBV Short-Term Rates
NASDAQ S&P OEX NYSE DJ-15 DJ-20 DJI-30
Tiger Index of Big
Banks Bond
Funds Gold Stocks
Housing Stocks
Insurance-Stocks
Regional Banks
Russell-1000
Semi Conductors
Recent 2006 vers-Peerless signals http://tigersoftware.com/oldpeer/UPD90424.bmp
ETFs: DIA QQQ SPY IWM MDY
TNA Short-Term Rates Ten Year Rates PST (Short Treasuries)
DOLLAR-UUP
ALLSTOCKs
COIN (Bit
Coin ETF)
USO-CrudeOil DBO
BLDP FAS GLD HD IBB JETS JNUG KOL NAIL NUGT
NRGU OIH PALL RSX RETL SDS AGQ SLV SOXL TAN TECL TLT TMF TNA
UGA USO China: YINN CHAU
Commodities: CANE
CORN DBC JJC, NIB CORN, CUT (paper)
MOO, NRGU
SOYB WEAT UUP (Dollar) LIT
(Lithium) PALL
(Palladium)
Stocks AA AAPL ADBE ALXN AMAT AMGN AMD AMZN ANET AXON AXP
BA BABA BAC BIDU BLDP BSX CAT CDNS CHKP CNX CPB CRM CVX CMG
DE DIS ENPH FB FSLR FTNT GILD GME GOOG GS HD IBM INTU JPM KO KR
LRCX MRK MRNA MOS MSFT NEM NFLX NKE NOC NUE NVDA PANW PG PYPL
QCOM QDEL REGN REV RE SNOW SO SQUARE TSLA TXN XOM V VRTX WFC
WMT XLE ZM ZOM
Leveraged Short ETFs:
FAZ - financials, TZA and SRTY- small caps, MZZ - mid caps, TECS -Techs,
SOXS -
semi-conductors LABD
- Biotechs
Bullish MAXCPs www.tigersoftware.com/UPPING/4-24-2023/Bullish.htm
Bearish MINCPs www.tigersoftware.com/Downing/4-24-2023/BEARISH.htm
|
|
There remains lots of
overhead resistance. Each rally to 34000 brings out new
sellers in DJI. The break in the
A/D Line shows NYSE breadth is deteriorating.
But the P-I is still rising. Its
trend-breaks have been a superb way to trade
DJI or DIA.
 |
The Peerless Buys and Sells have
produced only adequate gains DIA. The Peerless
signals have done much better on the more volatile
tech ETFs and sectors. See further
below. Trading Peerless Buys and Sells at
opening the day after the signal works
very well with Biotechs and Semi-conductors.
See these charts further below.
 |
 |
 |
 |
 |
 |
 |
 |
Best
Sectors to trade Peerless for last year.


|
Optimized trading Buys and Sells have worked particularly for Bonds and
Utilities.

 |
Finding the weakest in a very weak group is the basis of hedging with
Bearish MINCPs.
The best short sales appear night after night, just as do the most bullish MAXCPs.
|
TABLE 1 - DAILY BREADTH and VOLUME STATISTICS
| Issues
traded |
3,076 |
3,100 |
3,131 |
| Advances |
1,635 |
1,350 |
1,835 |
| Declines |
1,331 |
1,612 |
1,160 |
| Unchanged |
110 |
138 |
136 |
| New
highs |
53 |
54 |
56 |
| New
lows |
40 |
39 |
39 |
| Adv.
volume* |
407,289,239 |
373,415,743 |
533,200,795 |
| Decl.
volume* |
326,098,805 |
513,470,310 |
260,157,348 |
| Total
volume* |
746,084,794 |
897,262,294 |
804,775,585 |
| Closing
Arms (TRIN)† |
1.02 |
1.19 |
0.87 |
| Block
trades* |
3,818 |
4,409 |
3,829 |
| Adv.
volume |
1,766,512,542 |
1,469,836,172 |
2,287,545,461 |
| Decl.
volume |
1,466,683,026 |
2,086,619,265 |
1,261,047,134 |
| Total
volume |
3,290,940,151 |
3,611,754,437 |
3,611,184,829 |
| NASDAQ |
Latest Close |
Previous
Close |
Week Ago |
| Issues
traded |
4,630 |
4,618 |
4,669 |
| Advances |
1,817 |
2,092 |
2,751 |
| Declines |
2,614 |
2,303 |
1,712 |
| Unchanged |
199 |
223 |
206 |
| New
highs |
79 |
68 |
80 |
| New
lows |
211 |
201 |
170 |
| Closing
Arms (TRIN)† |
1.65 |
0.71 |
0.68 |
| Block
trades |
44,680 |
44,059 |
36,507 |
| Adv.
volume |
1,424,122,248 |
2,713,174,155 |
3,360,028,993 |
| Decl.
volume |
3,383,118,058 |
2,112,117,071 |
1,416,615,050 |
| Total
volume |
4,854,054,961 |
4,868,059,227 |
4,823,182,434 |
|
Table 2 QUICKSILVER on ETFS - 4/24/2023 ---
Bullish = 4 COMPQX (.2978), SPY,(.397),QQQ (.297), TECL (.385)
Bearish = 1 WEAT
ETF CLOSE CHANGE PIVOT-PT 5-dma AROC CL-PWR CANDLE IP21 ITRS POWER INDEX
==============================================================================================
DIA 338.75 .64 339.8 -17.3% Bullish BLUE .404 0 ----
(High)
---------------------------------------------------------------------------------------------
COMPQX 12037.2 -35.26 12153.41 -49.7% ------- RED .281 .016 .297
---------------------------------------------------------------------------------------------
SPY 412.63 .43 414.21 -15.8% ------- BLUE .388 .009 .397
---------------------------------------------------------------------------------------------
QQQ 315.95 -.66 318.86 -45.5% ------- RED .255 .042 .297
---------------------------------------------------------------------------------------------
MDY 456.18 .03 457.13 -18% ------- BLUE .228 -.055 .173
---------------------------------------------------------------------------------------------
IWM 177.44 -.12 178.02 -37.6% ------- BLUE .2 -.071 .129
---------------------------------------------------------------------------------------------
FAS 62.67 -.42 64.06 -64.3% ------- RED .379 -.281 .098
---------------------------------------------------------------------------------------------
RETL 7.02 .12 7.01 7.2% ------- BLUE .101 -.317 -.216
---------------------------------------------------------------------------------------------
SOXL 14.63 -.23 15.78 -309.7% Bearish RED .074 -.123 -.049
---------------------------------------------------------------------------------------------
TECL 34.06 -.45 35.93 -219.5% ------- RED .301 .084 .385
---------------------------------------------------------------------------------------------
IBB 133.05 -.41 132.66 -19.6% Bullish RED .25 0 .25
---------------------------------------------------------------------------------------------
GLD 184.81 .56 186.25 -19.4% Bullish BLUE .187 .063 .25
---------------------------------------------------------------------------------------------
DBO 15.13 .2 15.36 -86.1% Bullish BLUE .075 .013 .088
---------------------------------------------------------------------------------------------
OIH 286.18 8.36 286.77 -8.8% Bullish BLUE .1 -.104 -.004
---------------------------------------------------------------------------------------------
CPER 24.35 -.08 25.05 -119% Bearish RED .079 -.021 .058
---------------------------------------------------------------------------------------------
TAN 77.68 -.04 78.4 -43.6% ------- RED .198 .012 .21
---------------------------------------------------------------------------------------------
UUP 27.66 -.09 27.72 -28.8% ------- ---- -.084 -.013 -.097
---------------------------------------------------------------------------------------------
CORN 24.3 -.11 25.48 -205.6% Bullish BLUE .134 -.082 .052
---------------------------------------------------------------------------------------------
WEAT 6.61 -.13 7.11 -324.5% Bearish RED -.134 -.148 -.282
---------------------------------------------------------------------------------------------
YINN 40.26 -1.3 46.09 -708.3% Bearish RED .213 -.315 -.102
|
Table 3 RANKING OF KEY DIRECTORIES BASED PCT.OF STOCKS ABOVE 65-DMA
4/24/23
Bullish = 16
Bearish = 30
---------------------------------------------------------------------------------------
Directory Current day-1 day-2 day-3 day-4 day-5
----------------------------------------------------------------------------------------
BEVERAGE .857 .857 .928 .928 .928 .928
UTILITY .842 .868 .842 .789 .763 .842
HOSPITAL .785 .785 .714 .714 .714 .714
HOMEBLDG .777 .722 .722 .777 .777 .722
DJI-13 .769 .538 .615 .692 .615 .538
GOLD .717 .76 .76 .804 .847 .847
DOWJONES .7 .533 .633 .666 .666 .7
=====
GREEN .666 .611 .5 .555 .555 .5
NASD-100 .63 .63 .65 .65 .67 .68
HIGHPRIC .619 .597 .606 .649 .662 .658
FOOD .571 .489 .448 .632 .653 .653
COMODITY .538 .461 .435 .615 .641 .641
SP-100 .533 .488 .5 .611 .588 .611
GAMING .526 .526 .526 .736 .631 .631
ETFS .509 .49 .563 .563 .654 .654
FIDSTKS .508 .485 .491 .532 .538 .568
===============================================================================================
MILITARY .5 .461 .5 .576 .538 .5
NIFTY .5 .568 .522 .59 .659 .636
SOLAR .5 .5 .437 .375 .375 .375
-----------------------------------------------------------------------------------------------
sP500 .472 .455 .457 .496 .509 .509
INDEXES .47 .448 .47 .524 .535 .589
SOFTWARE .464 .482 .464 .5 .517 .553
HACKERS .437 .437 .437 .437 .562 .562
RUS-1000 .431 .428 .425 .461 .462 .459
BIGBANKS .428 .285 .285 .285 .285 .285
RETAIL .425 .361 .382 .382 .446 .425
BIOTECH .421 .447 .426 .438 .416 .416
INSURANC .4 .44 .44 .48 .4 .36
INFRA .393 .393 .393 .393 .393 .393
TRANSP .368 .368 .368 .315 .263 .263
OILGAS .36 .298 .268 .35 .34 .371
GUNS .357 .357 .357 .357 .357 .357
COMPUTER .35 .35 .35 .45 .6 .6
EDU .333 .333 .5 .5 .666 .666
SEMI .297 .319 .297 .329 .382 .372
LOWPRICE .292 .277 .277 .275 .28 .275
INDMATER .291 .277 .319 .361 .375 .388
ELECTRON .285 .293 .3 .33 .375 .375
CHEM .279 .255 .279 .348 .325 .325
FINANCE .25 .225 .25 .237 .275 .262
AUTO .226 .226 .226 .245 .32 .283
BONDFUND .218 .172 .229 .16 .275 .356
COAL .166 .166 .333 .5 .5 .5
JETS .153 .153 .153 .307 .307 .23
REIT .146 .169 .176 .2 .161 .161
COPPER .142 .142 .142 .428 .428 .428
CHINA .136 .159 .181 .181 .204 .159
MARIJUAN .1 .1 .1 .1 .2 .2
REGBANKS .048 .048 .048 .048 .048 .073
|
====================================================================================
Monday - 4/24/2023
- 6:15 AM Futures: DJI -25 NASDAQ
+3 Data used 4/21/2023
| |
4/21/2023
|
|
| |
The Closing
Powers for DIA, SPY, QQQ and the NASDAQ are still rising.
Table 2 below shows that
their Power scores are above +.25. So, these key
major market ETFs should be
resistant to a big sell off. But the DJI chart shows
stubborn well tested
resistamce overhead and a broken A/D Line uptrend. If
the DIA's Closing Power
uptrend is broken, we will have to consider the Peerless
S12 to be clinched.
Today's news that BBBY is
going bankrupt is not much of a surprise. Big money
has been a heavy seller for
much of the last two years. See the heavy red Distribution
in the BBBY charts below.
Our Accumulation Index is as important as our Closing
Power. See the highest
AI stocks now below and the lowest AI/200 scores among
the regional banks that
threaten now to start another leg down.
So many of you have sought a
Windows-10 version of Peerless, that I have
started converting our
software to Visual Net 2022. I will keep you apprised
of how much I have got done. |
|
| |
Charts - 4/21/2023
2022 PEERLESS DJI, Signals, Indicators Daily DJI Volume
10-DayUp/Down Vol Stoch-20 CCI RSI Pct of All Stocks above 65-dma
Inverted Traders Index
DJI-IPA DJI-OBV Short-Term Rates
NASDAQ S&P OEX NYSE DJ-15 DJ-20 DJI-30
Tiger Index of Big
Banks Bond
Funds Gold Stocks
Housing Stocks
Insurance-Stocks
Regional Banks
Russell-1000
Semi Conductors
Recent 2006 vers-Peerless signals http://tigersoftware.com/oldpeer/UPD90421.bmp
ETFs: DIA QQQ SPY IWM MDY
TNA Short-Term Rates Ten Year Rates PST (Short Treasuries)
DOLLAR-UUP
ALLSTOCKs
COIN (Bit
Coin ETF)
USO-CrudeOil DBO
BLDP FAS GLD HD IBB JETS JNUG KOL NAIL NUGT
NRGU OIH PALL RSX RETL SDS AGQ SLV SOXL TAN TECL TLT TMF TNA
UGA USO China: YINN CHAU
Commodities: CANE
CORN DBC JJC, NIB CORN, CUT (paper)
MOO, NRGU
SOYB WEAT UUP (Dollar) LIT
(Lithium) PALL
(Palladium)
Stocks AA AAPL ADBE ALXN AMAT AMGN AMD AMZN ANET AXON AXP
BA BABA BAC BIDU BLDP BSX CAT CDNS CHKP CNX CPB CRM CVX CMG
DE DIS ENPH FB FSLR FTNT GILD GME GOOG GS HD IBM INTU JPM KO KR
LRCX MRK MRNA MOS MSFT NEM NFLX NKE NOC NUE NVDA PANW PG PYPL
QCOM QDEL REGN REV RE SNOW SO SQUARE TSLA TXN XOM V VRTX WFC
WMT XLE ZM ZOM
Leveraged Short ETFs:
FAZ - financials, TZA and SRTY- small caps, MZZ - mid caps, TECS -Techs,
SOXS -
semi-conductors LABD
- Biotechs
Bullish MAXCPs www.tigersoftware.com/UPPING/4-21-2023/Bullish.htm
Bearish MINCPs www.tigersoftware.com/Downing/4-21-2023/BEARISH.htm
|
|
 |
 |
 |
 |
 |
 |
 |
 |
 |
 |
 |
 |
 |
 |
 |
 |
| NYSE |
Latest Close |
Previous
Close |
Week Ago |
| Issues
traded |
3,100 |
3,082 |
3,095 |
| Advances |
1,350 |
1,102 |
1,018 |
| Declines |
1,612 |
1,857 |
1,945 |
| Unchanged |
138 |
123 |
132 |
| New
highs |
54 |
70 |
46 |
| New
lows |
39 |
34 |
40 |
| Adv.
volume* |
373,415,743 |
210,906,057 |
296,675,798 |
| Decl.
volume* |
513,470,310 |
610,622,706 |
478,456,520 |
| Total
volume* |
897,262,294 |
832,743,285 |
790,944,936 |
| Closing
Arms (TRIN)† |
1.19 |
1.68 |
0.79 |
| Block
trades* |
4,409 |
4,290 |
3,796 |
| Adv.
volume |
1,469,836,172 |
970,994,980 |
1,393,795,556 |
| Decl.
volume |
2,086,619,265 |
2,745,853,045 |
2,093,433,591 |
| Total
volume |
3,611,754,437 |
3,772,083,661 |
3,575,696,266 |
| NASDAQ |
Latest Close |
Previous
Close |
Week Ago |
| Issues
traded |
4,618 |
4,632 |
4,621 |
| Advances |
2,092 |
1,580 |
1,434 |
| Declines |
2,303 |
2,832 |
2,954 |
| Unchanged |
223 |
220 |
233 |
| New
highs |
68 |
58 |
71 |
| New
lows |
201 |
150 |
222 |
| Closing
Arms (TRIN)† |
0.71 |
1.53 |
0.84 |
| Block
trades |
44,059 |
32,297 |
34,284 |
| Adv.
volume |
2,713,174,155 |
1,212,329,640 |
1,688,306,366 |
| Decl.
volume |
2,112,117,071 |
3,321,299,005 |
2,919,482,262 |
| Total
volume |
4,868,059,227 |
4,590,533,040 |
4,655,748,770 |
|
Table 2 QUICKSILVER on ETFS - 4/21/2023 ---
Bullish = 5 COMPQX (.28), SPY,(.328),QQQ (.272),, GLD (.25),TECL (.358)
Bearish = 2 RETL (-.39 ), WEAT
ETF CLOSE CHANGE PIVOT-PT 5-dma AROC CL-PWR CANDLE IP21 ITRS POWER INDEX
==============================================================================================
DIA 338.11 .16 339.92 -10.8% Bullish RED .335 0 -----
---------------------------------------------------------------------------------------------
COMPQX 12072.46 12.9 12157.72 -21% ------- BLUE .263 .017 .28
---------------------------------------------------------------------------------------------
SPY 412.2 .32 413.94 -3.1% ------- ---- .32 .008 .328
---------------------------------------------------------------------------------------------
QQQ 316.61 .33 318.84 -30.8% ------- BLUE .228 .044 .272
---------------------------------------------------------------------------------------------
MDY 456.15 -.24 457.83 19.4% ------- RED .181 -.058 .123
---------------------------------------------------------------------------------------------
IWM 177.56 .23 178.78 29.5% Bearish RED .154 -.075 .079
---------------------------------------------------------------------------------------------
FAS 63.09 -.81 63.49 133.1% ------- RED .32 -.294 .026
---------------------------------------------------------------------------------------------
RETL 6.9 .01 7.01 -14.4% Bearish ---- .054 -.353 -.299
---------------------------------------------------------------------------------------------
SOXL 14.86 -.34 15.58 -232.6% Bearish RED .086 -.095 -.009
---------------------------------------------------------------------------------------------
TECL 34.51 -.39 35.61 -101.5% ------- ---- .268 .09 .358
---------------------------------------------------------------------------------------------
IBB 133.46 1.52 133.57 38.8% Bullish BLUE .231 .005 .236
---------------------------------------------------------------------------------------------
GLD 184.25 -1.84 185.53 -56.7% Bullish RED .19 .06 .25
---------------------------------------------------------------------------------------------
DBO 14.93 .2 15.39 -223.2% ------- ---- -.001 -.002 -.003
---------------------------------------------------------------------------------------------
OIH 277.82 -5 286.68 -179.2% Bearish RED .036 -.152 -.116
---------------------------------------------------------------------------------------------
CPER 24.43 -.18 24.94 -142.4% Bearish RED .08 -.002 .078
---------------------------------------------------------------------------------------------
TAN 77.72 .09 78.36 89.4% ------- ---- .129 0 .129
---------------------------------------------------------------------------------------------
UUP 27.75 -.03 27.82 12.6% Bullish ---- -.015 -.003 -.018
---------------------------------------------------------------------------------------------
CORN 24.41 -.46 25.33 -138.9% Bullish RED .071 -.079 -.008
---------------------------------------------------------------------------------------------
WEAT 6.74 -.09 7.06 -150.5% Bearish RED -.121 -.131 -.252
---------------------------------------------------------------------------------------------
YINN 41.56 -2.04 46.56 -178.6% Bearish RED .189 -.243 -.054
|
Table 3 RANKING OF KEY DIRECTORIES BASED PCT.OF STOCKS ABOVE 65-DMA
4/21/23
Bullish = 12
Bearish = 36
---------------------------------------------------------------------------------------
Directory Current day-1 day-2 day-3 day-4 day-5
----------------------------------------------------------------------------------------
UTILITY .868 .842 .789 .763 .815 .736
BEVERAGE .857 .928 .928 .928 .928 .928
HOSPITAL .785 .714 .714 .714 .714 .714
GOLD .76 .76 .804 .847 .847 .891
HOMEBLDG .722 .722 .777 .777 .722 .611
NASD-100 .63 .65 .65 .67 .68 .64
------
GREEN .611 .5 .555 .555 .5 .444
HIGHPRIC .597 .606 .649 .662 .653 .61
NIFTY .568 .522 .59 .659 .636 .659
DJI-13 .538 .615 .692 .615 .538 .538
DOWJONES .533 .633 .666 .666 .7 .6
-----
GAMING .526 .526 .684 .684 .631 .684
===========================================================================================
SOLAR .5 .437 .375 .375 .375 .125
===========================================================================================
ETFS .49 .563 .563 .654 .672 .636
FOOD .489 .469 .612 .653 .653 .632
SP-100 .488 .5 .611 .588 .6 .555
FIDSTKS .485 .491 .532 .538 .562 .502
SOFTWARE .482 .482 .5 .517 .553 .553
COMODITY .461 .461 .589 .641 .641 .615
MILITARY .461 .5 .576 .538 .5 .423
SP500 .455 .457 .498 .505 .507 .453
-----
BIOTECH .449 .425 .439 .42 .417 .381
INDEXES .448 .47 .524 .535 .589 .556
INSURANC .44 .44 .48 .4 .4 .2
HACKERS .437 .437 .437 .562 .562 .562
RUS-1000 .428 .425 .461 .462 .459 .418
INFRA .393 .393 .393 .393 .393 .333
TRANSP .368 .368 .315 .263 .263 .263
RETAIL .361 .382 .382 .446 .425 .34
GUNS .357 .357 .357 .357 .357 .357
COMPUTER .35 .35 .45 .6 .6 .6
EDU .333 .5 .5 .666 .666 .666
SEMI .319 .297 .329 .382 .361 .393
OILGAS .298 .268 .35 .34 .371 .402
ELECTRON .293 .3 .33 .375 .36 .39
BIGBANKS .285 .285 .285 .285 .285 .285
INDMATER .277 .319 .361 .375 .375 .361
LOWPRICE .277 .28 .277 .283 .275 .266
CHEM .255 .279 .348 .325 .325 .302
AUTO .226 .245 .245 .32 .283 .264
FINANCE .225 .25 .237 .262 .275 .25
BONDFUND .172 .218 .16 .287 .367 .494
REIT .169 .169 .207 .169 .153 .123
COAL .166 .333 .5 .5 .5 .5
CHINA .159 .181 .181 .204 .159 .159
JETS .153 .153 .307 .307 .23 .23
COPPER .142 .142 .428 .428 .428 .428
MARIJUAN .1 .1 .1 .2 .2 .1
REGBANKS .048 .048 .048 .048 .073 .048
|
===================================================================================
Friday - 4/21/2023
- 6:00 AM Futures: DJI -21 NASDAQ -33
Data used 4/20/2023
| |
4/20/2023
|
|
| |
The Closing Powers for DIA, SPY, NASDAQ, TECL and QQQ are
still rising. But the DJI's well-tested resistance just above 34000 has
brought in new selling each time it has been challenged this year. So,
there appears to be little upside head-room for the major market
ETFs. Today the NYSE A/D Line broke its uptrend. That usually
brings in a new round of selling. And sure enough, see in Table 3 below
how many more groups of stocks now have a majority of their components
below their 65-dma.
Tesla got badly jolted today when Elon Musk's rocket blew up
prematurely. The euphemism used on CNN quite seriously was that
an "unscheduled disassembly" took place. This event has hurt tech
stocks only temporarily.
Hedging seems advisable. The weakest regional banks also fell back.
But BSX is the best stock that I can find now and it should be held long.
Its AI/200 is 190, way above every other stock that I am aware of.
Fridays have had a habit ot rallying this year. Until the Closing Power
uptrends are violated, we cannot "clinch" the Sell S12. So more
backing and filling by the averages seems likely.
|
|
| |
Charts - 4/20/2023
2022 PEERLESS DJI, Signals, Indicators Daily DJI Volume
10-DayUp/Down Vol Stoch-20 CCI RSI Pct of All Stocks above 65-dma
Inverted Traders Index
DJI-IPA DJI-OBV Short-Term Rates
NASDAQ S&P OEX NYSE DJ-15 DJ-20 DJI-30
Tiger Index of Big
Banks Bond
Funds Gold Stocks
Housing Stocks
Insurance-Stocks
Regional Banks
Russell-1000
Semi Conductors
Recent 2006 vers-Peerless signals http://tigersoftware.com/oldpeer/UPD90420.bmp
ETFs: DIA QQQ SPY IWM MDY
TNA Short-Term Rates Ten Year Rates PST (Short Treasuries)
DOLLAR-UUP
ALLSTOCKs
COIN (Bit
Coin ETF)
USO-CrudeOil DBO
BLDP FAS GLD HD IBB JETS JNUG KOL NAIL NUGT
NRGU OIH PALL RSX RETL SDS AGQ SLV SOXL TAN TECL TLT TMF TNA
UGA USO China: YINN CHAU
Commodities: CANE
CORN DBC JJC, NIB CORN, CUT (paper)
MOO, NRGU
SOYB WEAT UUP (Dollar) LIT
(Lithium) PALL
(Palladium)
Stocks AA AAPL ADBE ALXN AMAT AMGN AMD AMZN ANET AXON AXP
BA BABA BAC BIDU BLDP BSX CAT CDNS CHKP CNX CPB CRM CVX CMG
DE DIS ENPH FB FSLR FTNT GILD GME GOOG GS HD IBM INTU JPM KO KR
LRCX MRK MRNA MOS MSFT NEM NFLX NKE NOC NUE NVDA PANW PG PYPL
QCOM QDEL REGN REV RE SNOW SO SQUARE TSLA TXN XOM V VRTX WFC
WMT XLE ZM ZOM
Leveraged Short ETFs:
FAZ - financials, TZA and SRTY- small caps, MZZ - mid caps, TECS -Techs,
SOXS -
semi-conductors LABD
- Biotechs
Bullish MAXCPs www.tigersoftware.com/UPPING/4-20-2023/Bullish.htm
Bearish MINCPs www.tigersoftware.com/Downing/4-20-2023/BEARISH.htm
|
|

 |
 |
 |
 |
 |
 |
 |
 |
 |
 |
 |
 |
 |
 |
 |
Table 1 - Daily Breadth
and Volume Statistics
| NYSE |
Latest Close |
Previous
Close |
Week Ago |
| Issues
traded |
3,082 |
3,106 |
3,107 |
| Advances |
1,102 |
1,399 |
2,130 |
| Declines |
1,857 |
1,580 |
859 |
| Unchanged |
123 |
127 |
118 |
| New
highs |
70 |
54 |
54 |
| New
lows |
34 |
33 |
31 |
| Adv.
volume* |
210,906,057 |
344,088,301 |
600,440,164 |
| Decl.
volume* |
610,622,706 |
403,157,728 |
208,516,100 |
| Total
volume* |
832,743,285 |
758,794,263 |
814,400,596 |
| Closing
Arms (TRIN)† |
1.68 |
1.18 |
0.95 |
| Block
trades* |
4,290 |
3,854 |
3,927 |
| Adv.
volume |
970,994,980 |
1,508,466,478 |
2,584,954,228 |
| Decl.
volume |
2,745,853,045 |
2,002,940,998 |
987,310,647 |
| Total
volume |
3,772,083,661 |
3,572,564,312 |
3,596,593,326 |
| NASDAQ |
Latest Close |
Previous
Close |
Week Ago |
| Issues
traded |
4,632 |
4,655 |
4,652 |
| Advances |
1,580 |
2,104 |
3,178 |
| Declines |
2,832 |
2,324 |
1,253 |
| Unchanged |
220 |
227 |
221 |
| New
highs |
58 |
65 |
86 |
| New
lows |
150 |
140 |
157 |
| Closing
Arms (TRIN)† |
1.53 |
0.78 |
0.95 |
| Block
trades |
32,297 |
46,208 |
35,708 |
| Adv.
volume |
1,212,329,640 |
2,638,917,573 |
3,559,121,426 |
| Decl.
volume |
3,321,299,005 |
2,261,667,423 |
1,337,052,213 |
| Total
volume |
4,590,533,040 |
4,972,705,439 |
4,942,992,222 |
|
Table 2 QUICKSILVER on ETFS - 4/20/2023 ---
Bullish = 1 GLD (.325)
Bearish = 1 RETL (-.39 )
ETF CLOSE CHANGE PIVOT-PT 5-dma AROC CL-PWR CANDLE IP21 ITRS POWER INDEX
==============================================================================================
DIA 337.95 -1.04 338.84 -35.6% Bullish BLUE .24 0 ----
---------------------------------------------------------------------------------------------
COMPQX 12059.56 -97.67 12123.47 -43.9% ------- BLUE .183 .006 .189
---------------------------------------------------------------------------------------------
SPY 411.88 -2.26 412.46 -19.2% Bullish BLUE .216 .002 .218
---------------------------------------------------------------------------------------------
QQQ 316.28 -2.43 318.57 -45.3% ------- BLUE .132 .031 .163
---------------------------------------------------------------------------------------------
MDY 456.39 -1.54 454.38 -5.6% Bearish BLUE .072 -.062 .01
---------------------------------------------------------------------------------------------
IWM 177.33 -.92 176.51 -23.6% Bearish BLUE .034 -.083 -.049
---------------------------------------------------------------------------------------------
FAS 63.9 -.62 61.4 347.4% ------- BLUE .217 -.291 -.074
---------------------------------------------------------------------------------------------
RETL 6.89 -.09 6.92 -28.7% Bearish BLUE -.017 -.375 -.392
---------------------------------------------------------------------------------------------
SOXL 15.2 -.06 15.58 -150.9% Bearish BLUE .013 -.125 -.112
---------------------------------------------------------------------------------------------
TECL 34.9 -.71 35.23 -136% ------- BLUE .146 .069 .215
---------------------------------------------------------------------------------------------
IBB 131.94 -1.28 132.43 -61.6% Bullish RED .127 -.022 .105
---------------------------------------------------------------------------------------------
GLD 186.09 .73 186.36 -97.2% Bullish ---- .245 .08 .325
---------------------------------------------------------------------------------------------
DBO 14.73 -.33 15.61 -263.1% Bullish RED -.037 .003 -.034
---------------------------------------------------------------------------------------------
OIH 282.82 -4.39 288.08 -102.6% ------- RED -.014 -.116 -.13
---------------------------------------------------------------------------------------------
CPER 24.61 -.28 25.14 -127.7% Bearish RED .032 .005 .037
---------------------------------------------------------------------------------------------
TAN 77.63 -.15 76.33 41.3% ------- BLUE .062 -.006 .056
---------------------------------------------------------------------------------------------
UUP 27.78 0 27.68 46.9% ------- ---- -.026 .006 -.02
---------------------------------------------------------------------------------------------
CORN 24.87 -.29 25.11 19.9% Bullish ---- .103 -.051 .052
---------------------------------------------------------------------------------------------
WEAT 6.83 -.1 6.95 35.9% Bearish ---- -.102 -.099 -.201
---------------------------------------------------------------------------------------------
YINN 43.6 -.96 43.16 -133.2% Bearish RED .121 -.231 -.11
|
Table 3 KEY DIRECTORIES BASED PCT.OF STOCKS ABOVE 65-DMA
4/20/23
Bullish = 12
Bearish = 33
---------------------------------------------------------------------------------------
Directory Current day-1 day-2 day-3 day-4 day-5
----------------------------------------------------------------------------------------
BEVERAGE .928 .928 .928 .928 .857 .928
UTILITY .842 .789 .763 .815 .736 .921
GOLD .76 .804 .847 .847 .891 .913
HOMEBLDG .722 .777 .777 .722 .611 .666
HOSPITAL .714 .714 .714 .714 .714 .714
NASD-100 .65 .65 .67 .68 .64 .64
DOWJONES .633 .666 .666 .7 .6 .666
DJI-13 .615 .692 .615 .538 .538 .615
HIGHPRIC .606 .649 .662 .653 .614 .658
ETFS .563 .563 .654 .672 .654 .69
GAMING .526 .684 .631 .684 .684 .736
NIFTY .522 .59 .659 .636 .659 .704
-----------------------------------------------------------------------------------------------
EDU .5 .5 .666 .666 .666 .666
GREEN .5 .555 .555 .5 .388 .555
MILITARY .5 .576 .538 .5 .423 .538
SP-100 .5 .611 .588 .6 .544 .566
-----------------------------------------------------------------------------------------------
FIDSTKS .491 .532 .538 .562 .497 .532
SOFTWARE .482 .517 .517 .553 .553 .553
INDEXES .47 .524 .535 .589 .556 .6
FOOD .469 .632 .632 .653 .632 .612
COMODITY .461 .615 .615 .641 .615 .615
SP500 .457 .498 .507 .503 .453 .484
INSURANC .44 .48 .4 .4 .2 .36
HACKERS .437 .437 .562 .562 .562 .562
SOLAR .437 .375 .375 .375 .125 .25
BIOTECH .425 .437 .42 .42 .384 .415
RUS-1000 .425 .461 .462 .459 .418 .449
INFRA .393 .393 .393 .393 .333 .333
RETAIL .382 .382 .446 .425 .34 .382
TRANSP .368 .315 .263 .263 .315 .263
GUNS .357 .357 .357 .357 .357 .428
COMPUTER .35 .45 .6 .6 .65 .7
COAL .333 .5 .5 .5 .5 .5
INDMATER .319 .361 .375 .375 .361 .444
ELECTRON .3 .33 .375 .36 .375 .383
SEMI .297 .329 .382 .361 .382 .393
BIGBANKS .285 .285 .285 .285 .285 0
LOWPRICE .28 .28 .286 .277 .266 .252
CHEM .279 .348 .325 .325 .302 .372
OILGAS .268 .35 .34 .371 .402 .463
FINANCE .25 .237 .262 .262 .25 .212
AUTO .245 .264 .32 .283 .264 .245
BONDFUND .218 .149 .287 .379 .494 .62
CHINA .181 .181 .204 .159 .159 .181
REIT .169 .2 .176 .161 .115 .161
JETS .153 .307 .307 .23 .23 .23
COPPER .142 .428 .428 .428 .428 .428
MARIJUAN .1 .1 .2 .2 .2 .2
REGBANKS .048 .048 .048 .073 .048 .024
|
====================================================================================
Thursday - 4/20/2023 - 6:08
AM Futures:
DJI -183 NASDAQ -120 Data
used 4/19/2023
| |
4/19/2023
|
|
| |
The
resistance at 34000 is proving too much for the rally. A decline to the
lower band is likely.
A patttern of early DJI
weakness followed by a steady recovery in the second
half of each day's trading
has kept the DJI very close to its now well-tested
resistance just above 34000.
But how many failed rally attempts will still allow
Professionals to prop up the
DJI. The 5% short-term interest rates are now likely
to cause a break in the NYSE
A/D Line uptrend. And with that will
come additional selling.
The rising Closing Powers shown in the charts below
are looking more and more
over-extended and vulnerable.
Now traders must face
squarely and head-on the entirely likely prospects of
dangerous
"brinksamenship" from a political failure to agree on an increase in the
Federal Budget's deficit.
In 2011, such brinksmanship over the budget deficit
brought abouyt a 17% DJI
decline from its highs. Only then did the Republicans
and Democrats agree to
compromise. But now the political parties are farther
apart and now the shrill
demands of extremeists in Congress make miscalculation
and a bigger sell-off even
more likely. So far, this scenario has not been front
and center. The Bank
failures and the role rising interest rates have played that
role.
I would continue to hedge
with some short sales among the Bearish MINCPs
and the weakest regional
banks, as shown below. With long positions, among the
bullish MAXCPs, I would plan
to take some quick profits if today brings a follow-
through decline even lower
after today's weak opening. It will not take much of
a red candle-stick in DIA to
cause its Closing Power to break its uptrend. This
is what we have been waiting
for to 'clinch' our Sell S12. Note in the DJI chart below
that the key short-term 5-day
ma will pivot down unless the DJI can somehow close
today above 34000. |
|
| |
Charts - 4/19/2023
2022 PEERLESS DJI, Signals, Indicators Daily DJI Volume
10-DayUp/Down Vol Stoch-20 CCI RSI Pct of All Stocks above 65-dma
Inverted Traders Index
DJI-IPA DJI-OBV Short-Term Rates
NASDAQ S&P OEX NYSE DJ-15 DJ-20 DJI-30
Tiger Index of Big
Banks Bond
Funds Gold Stocks
Housing Stocks
Insurance-Stocks
Regional Banks
Russell-1000
Semi Conductors
Recent 2006 vers-Peerless signals http://tigersoftware.com/oldpeer/UPD90419.bmp
ETFs: DIA QQQ SPY IWM MDY
TNA Short-Term Rates Ten Year Rates PST (Short Treasuries)
DOLLAR-UUP
ALLSTOCKs
COIN (Bit
Coin ETF)
USO-CrudeOil DBO
BLDP FAS GLD HD IBB JETS JNUG KOL NAIL NUGT
NRGU OIH PALL RSX RETL SDS AGQ SLV SOXL TAN TECL TLT TMF TNA
UGA USO China: YINN CHAU
Commodities: CANE
CORN DBC JJC, NIB CORN, CUT (paper)
MOO, NRGU
SOYB WEAT UUP (Dollar) LIT
(Lithium) PALL
(Palladium)
Stocks AA AAPL ADBE ALXN AMAT AMGN AMD AMZN ANET AXON AXP
BA BABA BAC BIDU BLDP BSX CAT CDNS CHKP CNX CPB CRM CVX CMG
DE DIS ENPH FB FSLR FTNT GILD GME GOOG GS HD IBM INTU JPM KO KR
LRCX MRK MRNA MOS MSFT NEM NFLX NKE NOC NUE NVDA PANW PG PYPL
QCOM QDEL REGN REV RE SNOW SO SQUARE TSLA TXN XOM V VRTX WFC
WMT XLE ZM ZOM
Leveraged Short
ETFs:
FAZ - financials, TZA and SRTY- small caps, MZZ - mid caps, TECS -Techs,
SOXS -
semi-conductors LABD
- Biotechs
Bullish MAXCPs www.tigersoftware.com/UPPING/4-19-2023/Bullish.htm
Bearish MINCPs www.tigersoftware.com/Downing/4-19-2023/BEARISH.htm
|
|
The
resistance at 34000 has now held back 5 different rallies this year.
 |
Note red Sell from
optimized trading systems for DIA and how the Closing
Power's uptrend, though still intact and
rising, is looking like it could soon be broken.
 |
NASDAQ cannot seem to overcome
resistance just above 12200. Its
Closing Power's uptrend is still intect. But
its Relative Strength and OBV
uptrends have been broken.
 |
QQQ cannot seem to overcome
resistance just above 320. Its
Closing Power's uptrend is still intect. But
its Relative Strength and OBV
uptrends have been broken.
 |
SPY is very close to
having its price uptrend-line broken. Its Closing
Power is still rising.
 |
The
failure to resolve the budget dispute between President and House
would stop payments to
health insurance companies from Federal Govt.
As DJI's highest priced
stocks, UNH could be a particularly heavy drag on
DJI.
 |
Regional
banks bounced up off their lows today, but their falling triangle
pattern is still bearishly
alive and dangerous. The weakest regional banks
shown below should be shorted
again.
 |
 |
 |
 |
FRC is the regional bank most talked about as possibly failing.
It
did give a red Buy signal today, but it could suddenly collapse.
Stay
short for now as a hedge.
 |
Table 1 - Daily Breadth and Volume Statistics
| NYSE |
Latest Close |
Previous
Close |
Week Ago |
| Issues
traded |
3,106 |
3,125 |
3,134 |
| Advances |
1,399 |
1,374 |
1,380 |
| Declines |
1,580 |
1,617 |
1,617 |
| Unchanged |
127 |
134 |
137 |
| New
highs |
54 |
66 |
57 |
| New
lows |
33 |
34 |
28 |
| Adv.
volume* |
344,088,301 |
394,465,317 |
286,137,411 |
| Decl.
volume* |
403,157,728 |
368,183,062 |
510,653,671 |
| Total
volume* |
758,794,263 |
770,127,537 |
802,365,338 |
| Closing
Arms (TRIN)† |
1.18 |
0.78 |
1.44 |
| Block
trades* |
3,854 |
3,616 |
4,019 |
| Adv.
volume |
1,508,466,478 |
1,821,262,089 |
1,338,696,329 |
| Decl.
volume |
2,002,940,998 |
1,674,032,383 |
2,266,072,503 |
| Total
volume |
3,572,564,312 |
3,536,646,758 |
3,633,120,885 |
| NASDAQ |
Latest Close |
Previous
Close |
Week Ago |
| Issues
traded |
4,655 |
4,660 |
4,760 |
| Advances |
2,104 |
1,954 |
1,666 |
| Declines |
2,324 |
2,512 |
2,818 |
| Unchanged |
227 |
194 |
276 |
| New
highs |
65 |
74 |
80 |
| New
lows |
140 |
152 |
192 |
| Closing
Arms (TRIN)† |
0.78 |
0.81 |
1.19 |
| Block
trades |
46,208 |
36,897 |
35,400 |
| Adv.
volume |
2,638,917,573 |
2,344,312,231 |
1,609,661,012 |
| Decl.
volume |
2,261,667,423 |
2,455,143,937 |
3,250,559,887 |
| Total
volume |
4,972,705,439 |
4,851,816,227 |
4,909,770,894 |
|
Table 2 QUICKSILVER on ETFS - 4/19/2023 ---
Bullish = 4 COMPQX, SPY , TECL (+.352), GLD
Bearish = 1 RETL (-.43)
ETF CLOSE CHANGE PIVOT-PT 5-dma AROC CL-PWR CANDLE IP21 ITRS POWER INDEX
==============================================================================================
DIA 338.99 -.81 340.37 35.1% Bullish RED .276 0 ====
---------------------------------------------------------------------------------------------
COMPQX 12157.23 3.82 12166.27 94.1% Bullish BLUE .238 .021 .259
---------------------------------------------------------------------------------------------
SPY 414.14 -.07 413.47 73.8% Bullish BLUE .259 .009 .268
---------------------------------------------------------------------------------------------
QQQ 318.71 -.15 319.17 89.2% Bullish BLUE .191 .048 .239
---------------------------------------------------------------------------------------------
MDY 457.93 .8 456.9 46.8% Bearish BLUE .073 -.064 .009
---------------------------------------------------------------------------------------------
IWM 178.25 .23 178.17 67.9% Bearish BLUE .018 -.083 -.065
---------------------------------------------------------------------------------------------
FAS 64.52 .46 59.55 517.7% ------- BLUE .241 -.27 -.029
---------------------------------------------------------------------------------------------
RETL 6.98 -.03 6.93 93.6% Bearish BLUE -.042 -.388 -.43
---------------------------------------------------------------------------------------------
SOXL 15.26 -.52 15.67 -22.5% Bearish BLUE .017 -.054 -.037
---------------------------------------------------------------------------------------------
TECL 35.61 -.32 35.87 223.6% Bullish BLUE .193 .159 .352
---------------------------------------------------------------------------------------------
IBB 133.22 .56 133.58 100.3% Bullish BLUE .137 -.019 .118
---------------------------------------------------------------------------------------------
GLD 185.36 -.89 189.72 -48.9% Bullish BLUE .216 .065 .281
---------------------------------------------------------------------------------------------
DBO 15.06 -.3 15.54 -183.8% Bullish RED .106 .041 .147
---------------------------------------------------------------------------------------------
OIH 287.21 .44 288.72 -11.1% ------- BLUE -.033 -.094 -.127
---------------------------------------------------------------------------------------------
CPER 24.89 -.16 25.25 -4% Bearish RED .138 .013 .151
---------------------------------------------------------------------------------------------
TAN 77.78 -.62 76.99 204% ------- BLUE .094 -.019 .075
---------------------------------------------------------------------------------------------
UUP 27.78 .06 27.52 23.5% ------- ---- -.051 -.008 -.059
---------------------------------------------------------------------------------------------
CORN 25.16 -.32 24.77 67.7% Bullish RED .028 -.058 -.03
---------------------------------------------------------------------------------------------
WEAT 6.93 -.18 6.78 43.1% Bearish RED -.139 -.094 -.233
---------------------------------------------------------------------------------------------
YINN 44.56 -1.53 44.8 302.3% Bearish BLUE .163 -.207 -.044
|
TABLE 3 RANKING OF KEY DIRECTORIES BASED PCT.OF STOCKS ABOVE 65-DMA
4/19/23
Bullish = 20
Bearish = 27
---------------------------------------------------------------------------------------
Directory Current day-1 day-2 day-3 day-4 day-5
----------------------------------------------------------------------------------------
BEVERAGE .928 .928 .928 .857 .928 .857
GOLD .804 .847 .847 .891 .913 .869
UTILITY .789 .763 .815 .736 .921 .921
HOMEBLDG .777 .777 .722 .611 .666 .666
HOSPITAL .714 .714 .714 .714 .785 .714
DJI-13 .692 .615 .538 .538 .615 .615
GAMING .684 .631 .631 .736 .736 .578
DOWJONES .666 .666 .7 .6 .666 .633
NASD-100 .65 .67 .68 .64 .64 .59
HIGHPRIC .649 .662 .653 .614 .662 .571
FOOD .632 .653 .632 .632 .612 .591
COMODITY .615 .641 .615 .615 .615 .589
SP-100 .611 .588 .6 .544 .566 .444
NIFTY .59 .659 .636 .659 .704 .613
MILITARY .576 .538 .5 .423 .538 .5
ETFS .563 .654 .672 .654 .709 .618
GREEN .555 .555 .5 .388 .555 .444
FIDSTKS .532 .538 .562 .497 .538 .449
INDEXES .524 .535 .589 .556 .605 .529
SOFTWARE .517 .535 .553 .553 .553 .517
==============================================================================================
COAL .5 .5 .5 .5 .5 .5
EDU .5 .666 .666 .666 .666 .666
==============================================================================================
SP500 .498 .507 .505 .449 .49 .435
INSURANC .48 .4 .4 .2 .36 .44
RUS-1000 .461 .462 .459 .418 .456 .403
COMPUTER .45 .6 .6 .65 .7 .65
BIOTECH .437 .417 .42 .386 .413 .34
HACKERS .437 .562 .562 .562 .562 .562
COPPER .428 .428 .428 .428 .428 .285
INFRA .393 .393 .393 .333 .333 .333
RETAIL .382 .446 .425 .34 .382 .276
SOLAR .375 .375 .375 .125 .25 .125
INDMATER .361 .375 .375 .361 .444 .361
GUNS .357 .357 .357 .357 .428 .428
OILGAS .35 .34 .371 .402 .484 .432
CHEM .348 .325 .325 .302 .372 .325
ELECTRON .33 .375 .36 .375 .375 .375
SEMI .329 .382 .361 .382 .382 .372
TRANSP .315 .263 .263 .315 .315 .315
JETS .307 .307 .23 .23 .23 .23
BIGBANKS .285 .285 .285 .285 0 0
LOWPRICE .28 .289 .28 .269 .249 .24
AUTO .264 .339 .283 .264 .245 .245
FINANCE .237 .262 .262 .237 .212 .187
REIT .2 .169 .169 .123 .161 .161
CHINA .181 .204 .159 .159 .159 .113
BONDFUND .149 .275 .379 .505 .632 .632
MARIJUAN .1 .2 .2 .2 .2 .2
REGBANKS .048 .048 .073 .048 .024 .024
|
===================================================================================
Wednesday - 4/19/2023 - 6:08
AM Futures:
DJI -100 NASDAQ -110 Data
used 4/18/2023
| |
4/18/2023
|
|
| |
Short-term interest
rates rose above 5% today. Initially, the DJI fell more than
100 in response, but at the close
it was down only 11. Professionals waited
two hours into trading to steadily
resume their buying. As a result, the Closing
Power uptrends for DIA, NASDAQ,
SPY, QQQ and TECL are still unbroken
on the current rally. But it
is significant that the selling came in as the DJI reached
its well-tested resistance-line
just a little above 34000. There were no breakouts
in these indexes. This
morning more early weakness is developing. But we will
need
to see the rising Closing Powers
break their uptrends to be in a position to call a
decline to the lower band.
See below also, how well the price-uptrends for these
ETFs determine if prices will go
higher or lower. And note how well the P-Indicator
trendline breaks have called the
advances and declines for the DJI this past year.
That uptrend is still intact, but
since we will be dropping off very positive days 21
and 20 days ago, it will probably
be broken. Note, also that it will take more than
a 300-point DJI decline to turn
down our DJI 5-day ma. So, though we have a
Sell S12 as our last Peerless
signal, we should stay hedged, rather than turn bearish.
The Bullish MAXCPs seem to keep
rising and the Bearish MINCPs keep falling.
Financials along with UNH, as the
highest priced DJI stock, usually lead and
track the DJI. JPM has been a
beneficiary of the recent wave of depositor-fear
about banks. It has been able
to open a lot of new accounts as a result of the
panic elsewhere in banking.
See how JPM is now holding up the DJI by rallying
on better than expected earnings.
Goldman Sachs, other the other hand, was
turned back down from its overhead
resistance. If it falls and UNH keeps
retreating, I would expect the DJI
to turn down. Such is their extra importance
as the two most heavily weighted
DJI stocks. In that connection, watch high-
priced MSFT. Note its red
candle-stick today as it was turned back from its
overhead resistance.
We have been recommending shorting
the weakest bearish MINCPs, especially
those that are regional bankers.
The jump in short-term interest rates have spooked
many of them again. But the
regional banks' ETFs are still holding at their lows.
Watch KRE and DPST (3-times
leveraged) long ETFs here. A good number
of the regional banks shares fell
to new lows today. I think that we can bet that
those are the ones in most trouble.
If the FED keeps raising rates, they will suffer
the most, first because their
long-term investments will go down in value even more
and, second because defaults in
home and car loans are bound to rise. |
|
| |
Charts - 4/18/2023
2022 PEERLESS DJI, Signals, Indicators Daily DJI Volume
10-DayUp/Down Vol Stoch-20 CCI RSI Pct of All Stocks above 65-dma
Inverted Traders Index
DJI-IPA DJI-OBV Short-Term Rates
NASDAQ S&P OEX NYSE DJ-15 DJ-20 DJI-30
Tiger Index of Big
Banks Bond
Funds Gold Stocks
Housing Stocks
Insurance-Stocks
Regional Banks
Russell-1000
Semi Conductors
Recent 2006 vers-Peerless signals http://tigersoftware.com/oldpeer/UPD90418.bmp
ETFs: DIA QQQ SPY IWM MDY
TNA Short-Term Rates Ten Year Rates PST (Short Treasuries)
DOLLAR-UUP
ALLSTOCKs
COIN (Bit
Coin ETF)
USO-CrudeOil DBO
BLDP FAS GLD HD IBB JETS JNUG KOL NAIL NUGT
NRGU OIH PALL RSX RETL SDS AGQ SLV SOXL TAN TECL TLT TMF TNA
UGA USO China: YINN CHAU
Commodities: CANE
CORN DBC JJC, NIB CORN, CUT (paper)
MOO, NRGU
SOYB WEAT UUP (Dollar) LIT
(Lithium) PALL
(Palladium)
Stocks AA AAPL ADBE ALXN AMAT AMGN AMD AMZN ANET AXON AXP
BA BABA BAC BIDU BLDP BSX CAT CDNS CHKP CNX CPB CRM CVX CMG
DE DIS ENPH FB FSLR FTNT GILD GME GOOG GS HD IBM INTU JPM KO KR
LRCX MRK MRNA MOS MSFT NEM NFLX NKE NOC NUE NVDA PANW PG PYPL
QCOM QDEL REGN REV RE SNOW SO SQUARE TSLA TXN XOM V VRTX WFC
WMT XLE ZM ZOM
Leveraged Short
ETFs:
FAZ - financials, TZA and SRTY- small caps, MZZ - mid caps, TECS -Techs,
SOXS -
semi-conductors LABD
- Biotechs
Bullish MAXCPs www.tigersoftware.com/UPPING/4-18-2023/Bullish.htm
Bearish MINCPs
www.tigersoftware.com/Downing/4-18-2023/BEARISH.htm |
|
 |
 |
 |
 |
 |
 |
 |
 |
Short-Term Rates now up to 5%.
 |
 |
 |
 |
Table 1 - Daily Breadth and Volume Statistics
| NYSE |
Latest Close |
Previous
Close |
Week Ago |
| Issues
traded |
3,125 |
3,131 |
3,127 |
| Advances |
1,374 |
1,835 |
2,218 |
| Declines |
1,617 |
1,160 |
787 |
| Unchanged |
134 |
136 |
122 |
| New
highs |
66 |
56 |
48 |
| New
lows |
34 |
39 |
20 |
| Adv.
volume* |
394,465,317 |
533,200,795 |
622,358,855 |
| Decl.
volume* |
368,183,062 |
260,157,348 |
172,006,053 |
| Total
volume* |
770,127,537 |
804,775,585 |
809,976,325 |
| Closing
Arms (TRIN)† |
0.78 |
0.87 |
0.81 |
| Block
trades* |
3,616 |
3,829 |
4,062 |
| Adv.
volume |
1,821,262,089 |
2,287,545,461 |
2,786,982,646 |
| Decl.
volume |
1,674,032,383 |
1,261,047,134 |
801,257,313 |
| Total
volume |
3,536,646,758 |
3,611,184,829 |
3,665,835,999 |
| NASDAQ |
Latest Close |
Previous
Close |
Week Ago |
| Issues
traded |
4,660 |
4,669 |
4,734 |
| Advances |
1,954 |
2,751 |
2,653 |
| Declines |
2,512 |
1,712 |
1,781 |
| Unchanged |
194 |
206 |
300 |
| New
highs |
74 |
80 |
71 |
| New
lows |
152 |
170 |
120 |
| Closing
Arms (TRIN)† |
0.81 |
0.68 |
0.80 |
| Block
trades |
36,897 |
36,507 |
35,754 |
| Adv.
volume |
2,344,312,231 |
3,360,028,993 |
3,009,483,222 |
| Decl.
volume |
2,455,143,937 |
1,416,615,050 |
1,611,058,957 |
| Total
volume |
4,851,816,227 |
4,823,182,434 |
4,676,966,194 |
|
Table 2 QUICKSILVER on ETFS - 4/18/2023 ---
Bullish = 8 COMPQX, SPY, QQQ, TECL (+.338), GLD, DBO, GLD, DBO
Bearish = 1 RETL (-.514)
ETF CLOSE CHANGE PIVOT-PT 5-dma AROC CL-PWR CANDLE IP21 ITRS POWER INDEX
==================================================================================================
DIA 339.8 -.12 336.61 42.8% Bullish RED .317 ----- -----
---------------------------------------------------------------------------------------------
COMPQX 12153.41 -4.31 11929.34 50.3% ------- RED .249 .01 .259
---------------------------------------------------------------------------------------------
SPY 414.21 .27 408.05 54.6% Bullish RED .286 .002 .288
---------------------------------------------------------------------------------------------
QQQ 318.86 .02 313.04 47.8% Bullish RED .218 .039 .257
---------------------------------------------------------------------------------------------
MDY 457.13 -.7 453.66 9.4% Bearish RED .054 -.077 -.023
---------------------------------------------------------------------------------------------
IWM 178.02 -.76 175.84 24.8% Bearish RED -.022 -.099 -.121
---------------------------------------------------------------------------------------------
FAS 64.06 .57 58.17 461.6% ------- BLUE .2 -.28 -.08
---------------------------------------------------------------------------------------------
RETL 7.01 0 6.85 -305.8% Bearish RED -.09 -.424 -.514
---------------------------------------------------------------------------------------------
SOXL 15.78 .2 15.33 -137.2% Bearish RED .03 -.07 -.04
---------------------------------------------------------------------------------------------
TECL 35.93 .32 34.03 189.6% Bullish RED .212 .126 .338
---------------------------------------------------------------------------------------------
IBB 132.66 -.91 130.56 73.8% ------- RED .163 -.031 .132
---------------------------------------------------------------------------------------------
GLD 186.25 .72 187.19 -.8% Bullish BLUE .199 .071 .27
---------------------------------------------------------------------------------------------
DBO 15.36 -.03 15.63 3.2% Bullish RED .21 .079 .289
---------------------------------------------------------------------------------------------
OIH 286.77 .09 287.85 10.1% ------- BLUE -.028 -.094 -.122
---------------------------------------------------------------------------------------------
CPER 25.05 .11 24.91 74% ------- ---- .155 .018 .173
---------------------------------------------------------------------------------------------
TAN 78.4 .04 74.64 175.4% ------- RED .095 -.019 .076
---------------------------------------------------------------------------------------------
UUP 27.72 -.1 27.65 -14.4% ------- ---- -.118 -.005 -.123
---------------------------------------------------------------------------------------------
CORN 25.48 .15 24.82 114.1% Bullish BLUE .098 -.044 .054
---------------------------------------------------------------------------------------------
WEAT 7.11 .05 6.87 188.4% Bearish ---- -.125 -.078 -.203
---------------------------------------------------------------------------------------------
YINN 46.09 -.47 41.87 20.2% Bearish RED .147 -.219 -.072
|
Table 3 RANKING OF KEY DIRECTORIES BASED PCT.OF STOCKS ABOVE 65-DMA
4/18/23
Bullish = 24
Bearish = 24
---------------------------------------------------------------------------------------
Directory Current day-1 day-2 day-3 day-4 day-5
----------------------------------------------------------------------------------------
BEVERAGE .928 .928 .857 .928 .857 .785
GOLD .847 .847 .891 .913 .869 .891
HOMEBLDG .777 .722 .611 .666 .666 .666
UTILITY .763 .815 .736 .921 .894 .894
HOSPITAL .714 .714 .714 .785 .785 .714
NASD-100 .67 .68 .64 .64 .6 .67
DOWJONES .666 .7 .6 .666 .633 .633
======
EDU .666 .666 .666 .666 .666 .666
HIGHPRIC .662 .653 .614 .662 .58 .61
NIFTY .659 .636 .659 .704 .636 .704
ETFS .654 .672 .654 .709 .636 .581
FOOD .653 .653 .612 .612 .591 .612
COMODITY .641 .641 .589 .615 .589 .564
GAMING .631 .631 .684 .789 .578 .684
DJI-13 .615 .538 .538 .615 .615 .615
COMPUTER .6 .6 .65 .7 .65 .65
SP-100 .588 .6 .544 .566 .444 .522
HACKERS .562 .562 .562 .562 .562 .562
GREEN .555 .5 .388 .555 .444 .388
FIDSTKS .538 .562 .497 .538 .455 .508
MILITARY .538 .5 .423 .538 .5 .5
INDEXES .535 .589 .556 .605 .529 .572
SOFTWARE .535 .571 .553 .553 .517 .553
SP500 .507 .505 .451 .486 .445 .472
==============================================================================================
COAL .5 .5 .5 .5 .5 .333
==============================================================================================
RUS-1000 .462 .459 .418 .456 .41 .438
RETAIL .446 .425 .34 .382 .297 .446
COPPER .428 .428 .428 .428 .285 .142
BIOTECH .417 .417 .386 .415 .34 .364
INSURANC .4 .4 .2 .36 .44 .36
INFRA .393 .393 .333 .333 .333 .303
SEMI .382 .361 .382 .382 .361 .446
ELECTRON .375 .36 .375 .375 .368 .436
INDMATER .375 .375 .361 .444 .361 .361
SOLAR .375 .375 .125 .25 .125 .187
GUNS .357 .357 .357 .428 .428 .5
OILGAS .34 .371 .402 .484 .432 .422
AUTO .339 .301 .264 .245 .264 .264
CHEM .325 .325 .302 .372 .325 .279
JETS .307 .23 .23 .23 .23 .23
LOWPRICE .289 .283 .272 .252 .243 .229
BIGBANKS .285 .285 .285 0 0 0
BONDFUND .275 .367 .505 .643 .643 .563
TRANSP .263 .263 .315 .315 .315 .315
FINANCE .262 .262 .237 .2 .187 .187
CHINA .204 .159 .159 .159 .113 .159
MARIJUAN .2 .2 .2 .2 .2 .2
REIT .169 .161 .13 .169 .161 .184
REGBANKS .048 .073 .048 .024 .024 .048
|
====================================================================================
Tuesday -
4/18/2023 - 6:10 AM Futures: DJI + 43 NASDAQ +92 Data used
4/17/2023
| |
4/17/2023
|
|
| |
The DJI rose nearly 200 points in the last two hours. It heard Republican
House Speaker McCarthy's conditions for raising the Federal debt limit.
He would seek a Federal spending-freeze at last year’s levels, stricter work
requirements for social programs and a variety of regulatory rollbacks. The
market liked what it heard. But will the Senate Democrats or President Biden
be willing to make such a deal? Is there anything new in this? The market
must think there is and that a political deal can be reached before a Summer
default and a market sell-off.
The DJI, the NASDAQ, SPY, QQQ and TECL have each risen back to
their flat resistance levels. See their charts below. Their Closing Powers
continue to rise. From this, we conclude that Professionals remain optimistic.
They should be our guide now. Even the weak regional banks rallied up off
their lows. I warned readers two week ago that Peerless Sell S12s at this time
of the year yield a 2% to 4% loss about half the time before there is a market
decline back to the lower band.
So, hedging with Bullish MAXCPs and Bearish MINCPs has been advised
here, always watching for Closing Power trend-breaks which would justify
closing out our positions. One exception to that is when we trade
the red automatic Buys and Sells using the 5-day Stochastic because of how
successful it has been for the last year. Yesterday, I recommended shorting
TRUP and CRNX. TRUP fell today 5.53 to a new low, about 15% in one
day. Close that short out. The other short, CRNX rose by a point. Let's give
it a chance to fall back.
A breakout by the DJI and NASDAQ will likely cause a rush to cover shorts.
Watch how GS does today, now that it has risen to its earlier point of breakdown.
We advise covering our short sales if their Closing Powers break their downtrends.
We will report on the Regional Banks tomorrow in this regard.
|
|
| |
Charts - 4/17/2023
2022 PEERLESS DJI, Signals, Indicators Daily DJI Volume
10-DayUp/Down Vol Stoch-20 CCI RSI Pct of All Stocks above 65-dma
Inverted Traders Index
DJI-IPA DJI-OBV Short-Term Rates
NASDAQ S&P OEX NYSE DJ-15 DJ-20 DJI-30
Tiger Index of Big
Banks Bond
Funds Gold Stocks
Housing Stocks
Insurance-Stocks
Regional Banks
Russell-1000
Semi Conductors
Recent 2006 vers-Peerless signals http://tigersoftware.com/oldpeer/UPD90417.bmp
ETFs: DIA QQQ SPY IWM MDY
TNA Short-Term Rates Ten Year Rates PST (Short Treasuries)
DOLLAR-UUP
ALLSTOCKs
COIN (Bit
Coin ETF)
USO-CrudeOil DBO
BLDP FAS GLD HD IBB JETS JNUG KOL NAIL NUGT
NRGU OIH PALL RSX RETL SDS AGQ SLV SOXL TAN TECL TLT TMF TNA
UGA USO China: YINN CHAU
Commodities: CANE
CORN DBC JJC, NIB CORN, CUT (paper)
MOO, NRGU
SOYB WEAT UUP (Dollar) LIT
(Lithium) PALL
(Palladium)
Stocks AA AAPL ADBE ALXN AMAT AMGN AMD AMZN ANET AXON AXP
BA BABA BAC BIDU BLDP BSX CAT CDNS CHKP CNX CPB CRM CVX CMG
DE DIS ENPH FB FSLR FTNT GILD GME GOOG GS HD IBM INTU JPM KO KR
LRCX MRK MRNA MOS MSFT NEM NFLX NKE NOC NUE NVDA PANW PG PYPL
QCOM QDEL REGN REV RE SNOW SO SQUARE TSLA TXN XOM V VRTX WFC
WMT XLE ZM ZOM
Leveraged Short
ETFs:
FAZ - financials, TZA and SRTY- small caps, MZZ - mid caps, TECS -Techs,
SOXS -
semi-conductors LABD
- Biotechs
Bullish MAXCPs www.tigersoftware.com/UPPING/4-17-2023/Bullish.htm
Bearish MINCPs
www.tigersoftware.com/Downing/4-17-2023/BEARISH.htm |
|
 |
 |
 |
 |
 |
 |
 |
 |
 |
 |
 |
 |
 |
Table 1 - Daily Breadth and Volume Statistics
| NYSE |
Latest Close |
Previous
Close |
Week Ago |
| Issues
traded |
3,131 |
3,095 |
3,112 |
| Advances |
1,835 |
1,018 |
1,934 |
| Declines |
1,160 |
1,945 |
1,050 |
| Unchanged |
136 |
132 |
128 |
| New
highs |
56 |
46 |
34 |
| New
lows |
39 |
40 |
39 |
| Adv.
volume* |
533,200,795 |
296,675,798 |
565,773,443 |
| Decl.
volume* |
260,157,348 |
478,456,520 |
233,264,873 |
| Total
volume* |
804,775,585 |
790,944,936 |
816,590,143 |
| Closing
Arms (TRIN)† |
0.87 |
0.79 |
0.80 |
| Block
trades* |
3,829 |
3,796 |
3,773 |
| Adv.
volume |
2,287,545,461 |
1,393,795,556 |
2,322,338,997 |
| Decl.
volume |
1,261,047,134 |
2,093,433,591 |
1,014,061,268 |
| Total
volume |
3,611,184,829 |
3,575,696,266 |
3,423,659,343 |
| NASDAQ |
Latest Close |
Previous
Close |
Week Ago |
| Issues
traded |
4,669 |
4,621 |
4,642 |
| Advances |
2,751 |
1,434 |
2,560 |
| Declines |
1,712 |
2,954 |
1,845 |
| Unchanged |
206 |
233 |
237 |
| New
highs |
80 |
71 |
54 |
| New
lows |
170 |
222 |
167 |
| Closing
Arms (TRIN)† |
0.68 |
0.84 |
0.80 |
| Block
trades |
36,507 |
34,284 |
30,358 |
| Adv.
volume |
3,360,028,993 |
1,688,306,366 |
2,708,235,042 |
| Decl.
volume |
1,416,615,050 |
2,919,482,262 |
1,556,463,451 |
| Total
volume |
4,823,182,434 |
4,655,748,770 |
4,334,079,669 |
|
Table 2 QUICKSILVER on ETFS - 4/17/2023 ---
Bullish = 2 TECL(+.282), GLD(+.274)
Bearish = 1 RETL (-.543)
ETF CLOSE CHANGE PIVOT-PT 5-dma AROC CL-PWR CANDLE IP21 ITRS POWER INDEX
==================================================================================================
DIA 339.92 1.08 336.9 58.6% Bullish BLUE .258 --- --------
---------------------------------------------------------------------------------------------
COMPQX 12157.72 34.25 12031.88 30.4% Bullish BLUE .244 -.002 .242
---------------------------------------------------------------------------------------------
SPY 413.94 1.48 409.72 52.7% Bullish BLUE .236 -.005 .231
---------------------------------------------------------------------------------------------
QQQ 318.84 .27 315.83 15.3% Bullish BLUE .201 .024 .225
---------------------------------------------------------------------------------------------
MDY 457.83 3.45 456.27 63.1% Bearish BLUE .014 -.078 -.064
---------------------------------------------------------------------------------------------
IWM 178.78 2.27 177.14 85.7% Bearish BLUE -.093 -.097 -.19
---------------------------------------------------------------------------------------------
FAS 63.49 2.09 58.5 552.4% Bearish BLUE .098 -.285 -.187
---------------------------------------------------------------------------------------------
RETL 7.01 .09 7.44 -56.8% Bearish ---- -.103 -.44 -.543
---------------------------------------------------------------------------------------------
SOXL 15.58 0 16.21 -255.7% Bearish BLUE .015 -.129 -.114
---------------------------------------------------------------------------------------------
TECL 35.61 .38 34.6 2.9% Bullish BLUE .19 .092 .282
---------------------------------------------------------------------------------------------
IBB 133.57 1.14 130.71 122% Bullish BLUE .13 -.025 .105
---------------------------------------------------------------------------------------------
GLD 185.53 -.83 186.28 11.2% Bullish RED .23 .044 .274
---------------------------------------------------------------------------------------------
DBO 15.39 -.22 15.35 87.4% Bullish RED .18 .053 .233
---------------------------------------------------------------------------------------------
OIH 286.68 -1.4 286.19 81% ------- RED -.058 -.085 -.143
---------------------------------------------------------------------------------------------
CPER 24.94 -.2 24.68 110.6% ------- RED .136 .006 .142
---------------------------------------------------------------------------------------------
TAN 78.36 2.03 75.72 209.2% Bullish BLUE .034 -.039 -.005
---------------------------------------------------------------------------------------------
UUP 27.82 .14 27.8 -14.4% ------- ---- -.1 .016 -.084
---------------------------------------------------------------------------------------------
CORN 25.33 .22 24.91 50.1% Bullish BLUE .043 -.042 .001
---------------------------------------------------------------------------------------------
WEAT 7.06 .11 6.85 79.9% Bearish BLUE -.155 -.083 -.238
---------------------------------------------------------------------------------------------
YINN 46.56 3.4 45.91 115.2% Bearish BLUE .149 -.267 -.118
|
Table 3 RANKING OF KEY DIRECTORIES BASED PCT.OF STOCKS ABOVE 65-DMA
4/17/23
Bullish = 22
Bearish = 24
---------------------------------------------------------------------------------------
Directory Current day-1 day-2 day-3 day-4 day-5
----------------------------------------------------------------------------------------
BEVERAGE .928 .857 .928 .857 .857 .785
GOLD .847 .891 .913 .869 .891 .847
UTILITY .815 .736 .921 .894 .894 .842
HOMEBLDG .722 .611 .666 .666 .666 .5
HOSPITAL .714 .714 .785 .785 .714 .714
DOWJONES .7 .6 .666 .633 .633 .566
=====
NASD-100 .68 .64 .64 .6 .67 .65
=====
ETFS .672 .654 .709 .636 .6 .454
EDU .666 .666 .666 .666 .666 .5
FOOD .653 .632 .591 .591 .591 .551
HIGHPRIC .653 .614 .662 .58 .619 .567
COMODITY .641 .615 .589 .589 .564 .512
NIFTY .636 .659 .704 .636 .704 .727
GAMING .631 .684 .736 .631 .736 .684
COMPUTER .6 .65 .7 .65 .65 .65
SP-100 .6 .544 .566 .444 .522 .477
INDEXES .589 .556 .605 .529 .572 .513
SOFTWARE .571 .571 .553 .517 .553 .535
FIDSTKS .562 .497 .538 .455 .508 .467
HACKERS .562 .562 .562 .562 .562 .562
DJI-13 .538 .538 .615 .615 .615 .615
SP500 .505 .451 .488 .441 .478 .435
===============================================================================================
COAL .5 .5 .5 .5 .333 .166
GREEN .5 .388 .555 .444 .388 .388
MILITARY .5 .423 .538 .5 .5 .5
===============================================================================================
RUS-1000 .459 .418 .456 .41 .442 .397
COPPER .428 .428 .428 .285 .142 .142
RETAIL .425 .34 .382 .297 .446 .404
BIOTECH .415 .382 .415 .345 .362 .327
INSURANC .4 .2 .36 .44 .36 .28
INFRA .393 .333 .333 .333 .303 .272
INDMATER .375 .361 .444 .361 .361 .319
SOLAR .375 .125 .25 .125 .187 .187
OILGAS .371 .402 .484 .432 .432 .329
BONDFUND .367 .494 .643 .655 .563 .402
SEMI .361 .382 .382 .361 .436 .457
ELECTRON .36 .375 .375 .368 .421 .443
GUNS .357 .357 .428 .428 .5 .428
CHEM .325 .302 .372 .325 .279 .255
AUTO .301 .283 .245 .264 .264 .188
BIGBANKS .285 .285 0 0 0 0
(Big improvement)
LOWPRICE .283 .275 .255 .246 .226 .22
TRANSP .263 .315 .315 .315 .315 .21
FINANCE .262 .237 .2 .175 .187 .112
JETS .23 .23 .23 .23 .23 .23
MARIJUAN .2 .2 .2 .2 .2 .2
REIT .161 .123 .176 .169 .176 .161
CHINA .159 .159 .159 .113 .159 .181
REGBANKS .073 .048 .024 .024 .048 .024
|
===================================================================================
Monday
- 4/17/2023 - 6:10 AM Futures: DJI + 26 NASDAQ -11
Data used 4/14/2023
| |
4/14/2023
|
|
| |
We still have no
Buy signal to tell us the DJI will be able to breakout. Most
likely, it will need to pull back.
Friday's 143 point drop on the DJI
took place after the key blue chip index reached
its well-tested resistance Thursday
at 34000. The decline would have been worse if
JP Morgan had not jumped 9+ points
on unexpectedly good earnings. As it was,
NYSE decliners almost doubled
advancers and the DJI-30's biggest leader, UNH,
fell 14. UNH now also sports
a red automatic (optimized) Sell. See the UNH chart
below and note how when it breaks
its uptrend, DIA invariably has fallen this past
year. JPM's jump up occurred
despite (or perhaps because) regional banks are
again starting to breakdown..
See the weakest among our bearish MINCPs. I
have been recommending these for
short sales. See also the chart of the very heavily
traded SP-500 Regional Banks' ETF,
KRE, below. It is on the very of a breakdown
that could start another leg down.
The DJI-30 is doing its best to
maintain the appearance that all is well in the market.
See how its price, P-I, IP21 and
Closing Power uptrendlines are still intact. The Closing
Powers for SPY, QQQ and TECL are
also still rising. So, we cannot yet predict the
current rally is over. But
more and more, the rally is dependent on the blue chips in
DJI. The OBV and Relative
Strength Lines for QQQ, TECL and SOXL are no longer
rising.
In this environement, the risk is
high that there will be another regional bank crisis.
Shorting more bearish MINCPs is one
approach we can take now. Another is
to search for new red (optimized)
Stochastic Sells that have worked out especially
well this past year. CRNX and
TRUP, below, are two such stocks.
A Personal Story
A link to my "Peerless:
1950-2020" study has been posted above. We will occasionally
make reference to it in the
Hotline. It seeks to explain the market's moves not just
technically and with Peerless
signals, but by showing the events that were occurring
at the same time and how they
shaped the rises and falls of the market. Of course,
the FED's monetary policies and the
government's fiscal policies were very important.
Cutting taxes and maintaining low
interest rates are the most bullish set of policies possible.
In June 1962, I was witness to
JFK's hugely important announcement that he wou;d be
sharply cutting taxes and expanding
military spending. Even the Cuban Missile Crisis
that October could not cause a new
DJI low. As I think back, I think it was this
experience that got me most
interested in the stock market and all the forces that
shape its biggest moves. At
the time, it seemed like it was directly from a page in
my Samuelson Econ 101 text.
1960 to 1969-1970
http://tigersoftware.com/z/HISTORY/1960s/deca-60s.htm
|
|
| |
Charts - 4/14/2023
2022 PEERLESS DJI, Signals, Indicators Daily DJI Volume
10-DayUp/Down Vol Stoch-20 CCI RSI Pct of All Stocks above 65-dma
Inverted Traders Index
DJI-IPA DJI-OBV Short-Term Rates
NASDAQ S&P OEX NYSE DJ-15 DJ-20 DJI-30
Tiger Index of Big
Banks Bond
Funds Gold Stocks
Housing Stocks
Insurance-Stocks
Regional Bnnls
Russell-1000
Semi Conductors
Recent 2006 vers-Peerless signals http://tigersoftware.com/oldpeer/UPD90414.bmp
ETFs: DIA QQQ SPY IWM MDY
TNA Short-Term Rates Ten Year Rates PST (Short Treasuries)
DOLLAR-UUP
ALLSTOCKs
COIN (Bit
Coin ETF)
USO-CrudeOil DBO
BLDP FAS GLD HD IBB JETS JNUG KOL NAIL NUGT
NRGU OIH PALL RSX RETL SDS AGQ SLV SOXL TAN TECL TLT TMF TNA
UGA USO China: YINN CHAU
Commodities: CANE
CORN DBC JJC, NIB CORN, CUT (paper)
MOO, NRGU
SOYB WEAT UUP (Dollar) LIT
(Lithium) PALL
(Palladium)
Stocks AA AAPL ADBE ALXN AMAT AMGN AMD AMZN ANET AXON AXP
BA BABA BAC BIDU BLDP BSX CAT CDNS CHKP CNX CPB CRM CVX CMG
DE DIS ENPH FB FSLR FTNT GILD GME GOOG GS HD IBM INTU JPM KO KR
LRCX MRK MRNA MOS MSFT NEM NFLX NKE NOC NUE NVDA PANW PG PYPL
QCOM QDEL REGN REV RE SNOW SO SQUARE TSLA TXN XOM V VRTX WFC
WMT XLE ZM ZOM
Leveraged Short
ETFs:
FAZ - financials, TZA and SRTY- small caps, MZZ - mid caps, TECS -Techs,
SOXS -
semi-conductors LABD
- Biotechs
Bullish MAXCPs www.tigersoftware.com/UPPING/4-14-2023/Bullish.htm
Bearish MINCPs
www.tigersoftware.com/Downing/4-14-2023/BEARISH.htm |
|
 |
 |
 |
 |
 |
 |
 |
 |
 |
 |
 |
Table 1 - Daily Breadth and Volume Statistics
| NYSE |
Latest Close |
Previous
Close |
Week Ago |
| Issues
traded |
3,095 |
3,107 |
3,121 |
| Advances |
1,018 |
2,130 |
1,625 |
| Declines |
1,945 |
859 |
1,350 |
| Unchanged |
132 |
118 |
146 |
| New
highs |
46 |
54 |
34 |
| New
lows |
40 |
31 |
39 |
| Adv.
volume* |
296,675,798 |
600,440,164 |
423,357,457 |
| Decl.
volume* |
478,456,520 |
208,516,100 |
317,050,830 |
| Total
volume* |
790,944,936 |
814,400,596 |
752,879,462 |
| Closing
Arms (TRIN)† |
0.79 |
0.95 |
0.80 |
| Block
trades* |
3,796 |
3,927 |
3,883 |
| Adv.
volume |
1,393,795,556 |
2,584,954,228 |
2,054,964,434 |
| Decl.
volume |
2,093,433,591 |
987,310,647 |
1,367,371,960 |
| Total
volume |
3,575,696,266 |
3,596,593,326 |
3,486,699,828 |
| NASDAQ |
Latest Close |
Previous
Close |
Week Ago |
| Issues
traded |
4,621 |
4,652 |
4,679 |
| Advances |
1,434 |
3,178 |
2,529 |
| Declines |
2,954 |
1,253 |
1,902 |
| Unchanged |
233 |
221 |
248 |
| New
highs |
71 |
86 |
58 |
| New
lows |
222 |
157 |
174 |
| Closing
Arms (TRIN)† |
0.84 |
0.95 |
0.80 |
| Block
trades |
34,284 |
35,708 |
25,410 |
| Adv.
volume |
1,688,306,366 |
3,559,121,426 |
2,380,999,968 |
| Decl.
volume |
2,919,482,262 |
1,337,052,213 |
1,437,945,363 |
| Total
volume |
4,655,748,770 |
4,942,992,222 |
3,862,808,885 |
|
Table 2 QUICKSILVER on ETFS - 4/14/2023 ---
Bullish = 5 COMPQX(.277), SPY(.273), TECL(+.408), QQQ(+.302), DBO(+.293)
Bearish = 2 RETL (-.480), WEAT(-.300)
ETF CLOSE CHANGE PIVOT-PT 5-dma AROC CL-PWR CANDLE IP21 ITRS POWER INDEX
==================================================================================================
DIA 338.84 -1.53 335.96 58.5% Bullish RED .295 0 ------
---------------------------------------------------------------------------------------------
COMPQX 12123.47 -42.8 12084.36 14.7% Bullish BLUE .245 .032 .277
---------------------------------------------------------------------------------------------
SPY 412.46 -1.01 409.61 39.9% Bullish RED .263 .01 .273
---------------------------------------------------------------------------------------------
QQQ 318.57 -.6 317.87 8.2% Bullish BLUE .237 .065 .302
---------------------------------------------------------------------------------------------
MDY 454.38 -2.52 452.09 85.6% Bearish RED .056 -.07 -.014
---------------------------------------------------------------------------------------------
IWM 176.51 -1.66 175.75 74.4% Bearish RED -.075 -.086 -.161
---------------------------------------------------------------------------------------------
FAS 61.4 1.85 56.98 415% Bearish BLUE .115 -.3 -.185
--------------------------------------------------------------------------------------------
RETL 6.92 -.01 7.09 135.6% Bearish ---- -.085 -.395 -.48
---------------------------------------------------------------------------------------------
SOXL 15.58 -.09 16.39 -25.2% Bearish RED .046 -.067 -.021
---------------------------------------------------------------------------------------------
TECL 35.23 -.64 35.59 -62.6% Bullish ---- .235 .173 .408
---------------------------------------------------------------------------------------------
IBB 132.43 -1.15 130.36 52.6% Bullish RED .148 -.025 .123
---------------------------------------------------------------------------------------------
GLD 186.36 -3.36 185.11 -3.5% Bullish RED .196 .032 .228
---------------------------------------------------------------------------------------------
DBO 15.61 .07 15.12 136.7% Bullish ---- .229 .064 .293
---------------------------------------------------------------------------------------------
OIH 288.08 -.64 282.04 171.3% ------- RED .023 -.114 -.091
---------------------------------------------------------------------------------------------
CPER 25.14 -.11 24.39 113.1% ------- RED .228 -.006 .222
---------------------------------------------------------------------------------------------
TAN 76.33 -.66 75.19 176.1% Bearish RED .024 -.07 -.046
---------------------------------------------------------------------------------------------
UUP 27.68 .16 27.9 -10.8% ------- BLUE -.107 .022 -.085
---------------------------------------------------------------------------------------------
CORN 25.11 .34 25.08 74.4% Bullish BLUE .047 -.053 -.006
---------------------------------------------------------------------------------------------
WEAT 6.95 .17 6.95 29.1% Bearish BLUE -.206 -.094 -.3
---------------------------------------------------------------------------------------------
YINN 43.16 -1.64 45.54 -330% ------- RED .165 -.356 -.191
|
Table 1: RANKING OF KEY DIRECTORIES BASED PCT.OF STOCKS ABOVE 65-DMA
4/14/23
Bullish = 20
Bearish = 28
---------------------------------------------------------------------------------------
Directory Current day-1 day-2 day-3 day-4 day-5
----------------------------------------------------------------------------------------
GOLD .891 .913 .869 .891 .847 .869
BEVERAGE .857 .928 .857 .857 .785 .857
UTILITY .736 .921 .894 .894 .842 .815
HOSPITAL .714 .785 .785 .714 .714 .571
GAMING .684 .736 .578 .789 .684 .684
EDU .666 .666 .666 .666 .5 .5
NIFTY .659 .704 .636 .704 .727 .681
ETFS .654 .709 .636 .6 .472 .472
COMPUTER .65 .7 .65 .65 .65 .55
NASD-100 .64 .64 .6 .67 .66 .61
FOOD .632 .612 .571 .591 .551 .571
COMODITY .615 .615 .564 .564 .512 .512
HIGHPRIC .614 .662 .58 .619 .567 .541
HOMEBLDG .611 .666 .666 .666 .666 .444
DOWJONES .6 .666 .633 .633 .566 .6
SOFTWARE .571 .571 .517 .553 .535 .517
HACKERS .562 .562 .562 .562 .562 .562
INDEXES .556 .605 .529 .572 .518 .475
SP-100 .544 .566 .444 .522 .477 .466
DJI-13 .538 .615 .615 .615 .615 .615
================================================================================================
COAL .5 .5 .5 .333 .166 .166
================================================================================================
FIDSTKS .497 .538 .455 .508 .467 .449
BONDFUND .494 .643 .655 .563 .425 .574
SP500 .451 .488 .443 .474 .441 .402
COPPER .428 .428 .285 .142 .142 .142
MILITARY .423 .538 .5 .5 .5 .461
RUS-1000 .418 .456 .41 .442 .399 .364
OILGAS .402 .484 .432 .432 .329 .268
GREEN .388 .555 .444 .388 .388 .333
BIOTECH .382 .413 .345 .365 .327 .324
SEMI .382 .382 .361 .436 .457 .382
ELECTRON .375 .375 .368 .421 .443 .36
INDMATER .361 .444 .361 .361 .319 .25
GUNS .357 .428 .428 .5 .428 .357
RETAIL .34 .382 .297 .446 .404 .319
INFRA .333 .333 .333 .303 .272 .272
TRANSP .315 .315 .315 .315 .21 .157
CHEM .302 .372 .325 .279 .255 .209
BIGBANKS .285 0 0 0 0 0
AUTO .283 .264 .264 .264 .188 .169
LOWPRICE .275 .257 .249 .226 .22 .209
FINANCE .237 .2 .175 .175 .125 .112
JETS .23 .23 .23 .23 .23 .153
INSURANC .2 .36 .44 .36 .28 .28
MARIJUAN .2 .2 .2 .2 .2 .1
CHINA .159 .159 .113 .159 .181 .204
SOLAR .125 .25 .125 .187 .187 .125
REIT .123 .169 .176 .184 .153 .153
REGBANKS .048 .024 .024 .048 .024 .024
|
===================================================================================
Friday - 4/14/2023 -
Inadvertently very late. Sorry. Next HL will be Monday AM before opening.
| |
The DJI has reached its
resistance-line. The internals for the DJI remain bullish. The
most important of these are the A/D Line, the rising
P-I, Accumulation Index and Closing Power.
The same cannot be said for SOXL, shown below.
The broken relative strength (RSQ) lines
for the NASDAQ, SPY and QQQ show us that the
defensive stocks in the DJI have become
the leaders at present. Bullish jobs and
inflation news has been the propellant. But tech stocks
could be a problem now. Note the head/shoulders
pattern in NVDA and some other semi-
conductors. |
|
| |
Charts - 4/13/2023
2022 PEERLESS DJI, Signals, Indicators Daily DJI Volume
10-DayUp/Down Vol Stoch-20 CCI RSI Pct of All Stocks above 65-dma
Inverted Traders Index
DJI-IPA DJI-OBV Short-Term Rates
NASDAQ S&P OEX NYSE DJ-15 DJ-20 DJI-30
Tiger Index of Big
Banks Bond
Funds Gold Stocks
Housing Stocks
Insurance-Stocks
Regional Bnnls
Russell-1000
Semi Conductors
Recent 2006 vers-Peerless signals
http://tigersoftware.com/oldpeer/UPD90413.bmp
ETFs: DIA QQQ SPY IWM MDY
TNA Short-Term Rates Ten Year Rates PST (Short Treasuries)
DOLLAR-UUP
ALLSTOCKs
COIN (Bit
Coin ETF)
USO-CrudeOil DBO
BLDP FAS GLD HD IBB JETS JNUG KOL NAIL NUGT
NRGU OIH PALL RSX RETL SDS AGQ SLV SOXL TAN TECL TLT TMF TNA
UGA USO China: YINN CHAU
Commodities: CANE
CORN DBC JJC, NIB CORN, CUT (paper)
MOO, NRGU
SOYB WEAT UUP (Dollar) LIT
(Lithium) PALL
(Palladium)
Stocks AA AAPL ADBE ALXN AMAT AMGN AMD AMZN ANET AXON AXP
BA BABA BAC BIDU BLDP BSX CAT CDNS CHKP CNX CPB CRM CVX CMG
DE DIS ENPH FB FSLR FTNT GILD GME GOOG GS HD IBM INTU JPM KO KR
LRCX MRK MRNA MOS MSFT NEM NFLX NKE NOC NUE NVDA PANW PG PYPL
QCOM QDEL REGN REV RE SNOW SO SQUARE TSLA TXN XOM V VRTX WFC
WMT XLE ZM ZOM
Leveraged Short
ETFs:
FAZ - financials, TZA and SRTY- small caps, MZZ - mid caps, TECS -Techs,
SOXS -
semi-conductors LABD
- Biotechs
Bullish MAXCPs www.tigersoftware.com/UPPING/4-13-2023/Bullish.htm
Bearish MINCPs www.tigersoftware.com/Downing/4-13-2023/BEARISH.htm
|
|
 |
 |
 |
 |
 |
 |
 |
 |
 |
| Table 1 - Not available |
Table 2 QUICKSILVER on ETFS - 4/13/2023 ---
Bullish = 6 COMPQX(.340), SPY(.353), TECL(+.579), QQQ(+.366), DBO(+.261), CPER(+.26)
Bearish = 2 RETL (-.334), WEAT(-.363)
ETF CLOSE CHANGE PIVOT-PT 5-dma AROC CL-PWR CANDLE IP21 ITRS POWER INDEX
==================================================================================================
DIA 340.37 3.76 334.9 82.6% Bullish BLUE .363 0 ----
---------------------------------------------------------------------------------------------
COMPQX 12166.27 236.93 12087.96 70.4% Bullish BLUE .288 .052 .34
---------------------------------------------------------------------------------------------
SPY 413.47 5.42 409.19 71.8% Bullish BLUE .334 .019 .353
---------------------------------------------------------------------------------------------
QQQ 319.17 6.13 318.05 51.4% Bullish BLUE .281 .085 .366
---------------------------------------------------------------------------------------------
MDY 456.9 3.24 446.62 107.2% ------- BLUE .113 -.054 .059
---------------------------------------------------------------------------------------------
IWM 178.17 2.33 173.89 129.5% Bearish BLUE .002 -.068 -.066
---------------------------------------------------------------------------------------------
FAS 59.55 1.38 56.59 297.7% Bearish BLUE .175 -.325 -.15
---------------------------------------------------------------------------------------------
RETL 6.93 .08 6.73 107.5% Bearish ---- .01 -.344 -.334
---------------------------------------------------------------------------------------------
SOXL 15.67 .34 15.66 -78.6% ------- BLUE .104 .081 .185
---------------------------------------------------------------------------------------------
TECL 35.87 1.84 35.67 105.7% Bullish BLUE .307 .272 .579
---------------------------------------------------------------------------------------------
IBB 133.58 3.02 131.05 156% Bullish BLUE .211 -.02 .191
---------------------------------------------------------------------------------------------
GLD 189.72 2.53 186.49 50.6% Bullish ---- .182 .059 .241
---------------------------------------------------------------------------------------------
DBO 15.54 -.09 15.19 111.1% Bullish RED .231 .03 .261
---------------------------------------------------------------------------------------------
OIH 288.72 .87 278.33 106.7% ------- BLUE .008 -.124 -.116
---------------------------------------------------------------------------------------------
CPER 25.25 .34 24.58 170.8% Bullish BLUE .274 -.014 .26
---------------------------------------------------------------------------------------------
TAN 76.99 2.35 73.68 221.2% ------- BLUE .044 -.046 -.002
---------------------------------------------------------------------------------------------
UUP 27.52 -.13 27.74 -36% Bearish ---- -.209 .002 -.207
---------------------------------------------------------------------------------------------
CORN 24.77 -.05 24.74 -28.1% ------- ---- -.026 -.067 -.093
---------------------------------------------------------------------------------------------
WEAT 6.78 -.09 6.91 -130.3% Bearish RED -.243 -.12 -.363
---------------------------------------------------------------------------------------------
YINN 44.8 2.93 46.12 41.3% Bullish BLUE .217 -.294 -.077
|
Table 3 RANKING OF KEY DIRECTORIES BASED PCT.OF STOCKS ABOVE 65-DMA
4/13/23
Bullish = 24
Bearish = 24
---------------------------------------------------------------------------------------
Directory Current day-1 day-2 day-3 day-4 day-5
----------------------------------------------------------------------------------------
BEVERAGE .928 .857 .857 .785 .857 .785
UTILITY .921 .894 .894 .842 .815 .736
GOLD .913 .869 .891 .847 .869 .847
HOSPITAL .785 .785 .714 .714 .571 .571
GAMING .736 .578 .736 .736 .684 .684
ETFS .709 .636 .6 .472 .49 .436
NIFTY .704 .636 .704 .727 .704 .704
COMPUTER .7 .65 .65 .65 .55 .55
DOWJONES .666 .633 .633 .566 .6 .6
-----
EDU .666 .666 .666 .5 .5 .5
HOMEBLDG .666 .666 .666 .666 .444 .666
HIGHPRIC .662 .58 .619 .567 .545 .558
BONDFUND .643 .655 .563 .425 .586 .54
NASD-100 .64 .6 .67 .66 .63 .67
-----
COMODITY .615 .589 .538 .512 .512 .512
DJI-13 .615 .615 .615 .615 .615 .615
FOOD .612 .591 .571 .551 .571 .551
INDEXES .605 .529 .572 .518 .486 .475
SOFTWARE .571 .535 .553 .535 .517 .535
SP-100 .566 .444 .522 .477 .466 .488
HACKERS .562 .562 .562 .562 .562 .625
GREEN .555 .444 .388 .388 .333 .277
FIDSTKS .538 .455 .508 .467 .455 .449
MILITARY .538 .5 .5 .5 .461 .461
================================================================================================
COAL .5 .5 .333 .166 .166 .166
================================================================================================
SP500 .488 .443 .476 .437 .41 .414
OILGAS .484 .432 .432 .329 .278 .34
RUS-1000 .456 .41 .442 .399 .368 .367
INDMATER .444 .361 .361 .319 .25 .263
COPPER .428 .285 .142 .142 .142 .142
GUNS .428 .428 .5 .428 .357 .357
BIOTECH .413 .342 .365 .329 .327 .297
RETAIL .382 .297 .446 .404 .319 .382
SEMI .382 .361 .436 .457 .404 .436
ELECTRON .375 .368 .421 .443 .375 .406
CHEM .372 .325 .279 .255 .209 .232
INSURANC .36 .44 .36 .28 .28 .28
INFRA .333 .333 .303 .272 .272 .272
TRANSP .315 .315 .315 .21 .157 .21
AUTO .264 .283 .264 .188 .169 .207
LOWPRICE .257 .252 .229 .22 .209 .203
SOLAR .25 .125 .187 .187 .125 .125
JETS .23 .23 .23 .23 .153 .153
FINANCE .2 .175 .175 .112 .112 .112
MARIJUAN .2 .2 .2 .2 .1 .1
REIT .169 .169 .192 .161 .146 .13
CHINA .159 .113 .159 .181 .204 .136
REGBANKS .024 .024 .048 .024 .024 .024
BIGBANKS 0 0 0 0 0 0
|
===================================================================================
Thursday 4/13/2023: 6:15 AM Futures: DJI +9
NASDAQ +25 Data Used 4/12/2023
| |
4 /12/2023
|
|
| |
The DJI is
challenging its overhead resistance-line a little above 34000. With the DIA's
Closing Power and the NYSE A/D
Line's rising, our best indicators tell us to give
more chance for a breakout.
The first chart below shows that trading the DJI on
trend-breaks of the P-I (the 21-day
ma of the Adv-Dec) would have gained 33%
over the last year. The
success here undoubtedly has a lot to do with the FED's
supporting and then pumping the
market up until it rallies to a level they feel they can
back away and let it settle back.
The DJI is used for this purpose because of how
much easier it is to manipulate it
with Professionals' help using UNH especially because
of how much extra weight it has
because of its very high price. See UNH below.
The rally now is dependent upon
defensive stocks in the DJI, I would argue, like UNH,
MRK, PG and MCD. They are
still rallying. But the tech stocks are showing more
and more weakness. The
Relative Strength and OBV Lines for the NASDAQ,
QQQ and TECL have now broken their
uptrends. Their Closing Power uptrends
are now in danger. It is not
clear how much risk there is here. On the one hand, their
Accumulation Indexes are rising
still, on the other hand SOXL and even SPY now show
automatic Sells. In addition,
NVDA - the leader of the whole bunch of them - has
formed a potential head and
shoulders pattern. Having run up a long ways, its H/S
pattern is riskier. The big
drop in Cirrus Logic (shown below) demonstrates how
much a semi-conductor can drop from
a position that looked quite bullish a week ago.
So, sell SOXL. And be careful
of tech stocks that form top patterns. Get out of them
if their Closing Powers are broken.
The seasonality for the DJI is
still bullish for another week. The DJI rises 80% of
the time in the week following
April 12th in the third years of Presidential Elections.
But after that, the seasonality
deteriorates quickly. So, that two weeks from now,
the odds of the DJI being higher
are only 46.7% in these 3rd years of the 4-yr cycle..
Trouble is brewing again for the
weakest regional stocks. See them in the Bearish
MINCPs. Short more of them
and do not buy FAS.
Just Out and Bullish PRODUCER PRICE INDEXES - MARCH 2023
The Producer Price Index for final demand declined 0.5 percent in March, seasonally adjusted,
the U.S. Bureau of Labor Statistics reported today. Final demand prices were unchanged in
February and increased 0.4 percent in January. (See table A.) On an unadjusted basis, the index
for final demand advanced 2.7 percent for the 12 months ended in March.
|
|
| |
Charts - 4/12/2023
2022 PEERLESS DJI, Signals, Indicators Daily DJI Volume
10-DayUp/Down Vol Stoch-20 CCI RSI Pct of All Stocks above 65-dma
Inverted Traders Index
DJI-IPA DJI-OBV Short-Term Rates
NASDAQ S&P OEX NYSE DJ-15 DJ-20 DJI-30
Tiger Index of Big
Banks Bond
Funds Gold Stocks
Housing Stocks
Insurance-Stocks
Regional Bnnls
Russell-1000
Semi Conductors
Recent 2006 vers-Peerless signals
http://tigersoftware.com/oldpeer/UPD90412.bmp
ETFs: DIA QQQ SPY IWM MDY
TNA Short-Term Rates Ten Year Rates PST (Short Treasuries)
DOLLAR-UUP
ALLSTOCKs
COIN (Bit
Coin ETF)
USO-CrudeOil DBO
BLDP FAS GLD HD IBB JETS JNUG KOL NAIL NUGT
NRGU OIH PALL RSX RETL SDS AGQ SLV SOXL TAN TECL TLT TMF TNA
UGA USO China: YINN CHAU
Commodities: CANE
CORN DBC JJC, NIB CORN, CUT (paper)
MOO, NRGU
SOYB WEAT UUP (Dollar) LIT
(Lithium) PALL
(Palladium)
Stocks AA AAPL ADBE ALXN AMAT AMGN AMD AMZN ANET AXON AXP
BA BABA BAC BIDU BLDP BSX CAT CDNS CHKP CNX CPB CRM CVX CMG
DE DIS ENPH FB FSLR FTNT GILD GME GOOG GS HD IBM INTU JPM KO KR
LRCX MRK MRNA MOS MSFT NEM NFLX NKE NOC NUE NVDA PANW PG PYPL
QCOM QDEL REGN REV RE SNOW SO SQUARE TSLA TXN XOM V VRTX WFC
WMT XLE ZM ZOM
Leveraged Short
ETFs:
FAZ - financials, TZA and SRTY- small caps, MZZ - mid caps, TECS -Techs,
SOXS -
semi-conductors LABD
- Biotechs
Bullish MAXCPs www.tigersoftware.com/UPPING/4-12-2023/Bullish.htm
Bearish MINCPs www.tigersoftware.com/Downing/4-12-2023/BEARISH.htm
|
|
 |
 |
 |
 |
 |
 |
 |
 |
 |
 |
 |
 |
Table 1 - Daily Breadth and Volume Statistics
| NYSE |
Latest Close |
Previous
Close |
Week Ago |
| Issues
traded |
3,134 |
3,127 |
3,100 |
| Advances |
1,380 |
2,218 |
1,125 |
| Declines |
1,617 |
787 |
1,872 |
| Unchanged |
137 |
122 |
103 |
| New
highs |
57 |
48 |
27 |
| New
lows |
28 |
20 |
51 |
| Adv.
volume* |
286,137,411 |
622,358,855 |
353,135,392 |
| Decl.
volume* |
510,653,671 |
172,006,053 |
542,679,121 |
| Total
volume* |
802,365,338 |
809,976,325 |
906,170,947 |
| Closing
Arms (TRIN)† |
1.44 |
0.81 |
1.04 |
| Block
trades* |
4,019 |
4,062 |
4,211 |
| Adv.
volume |
1,338,696,329 |
2,786,982,646 |
1,425,505,999 |
| Decl.
volume |
2,266,072,503 |
801,257,313 |
2,468,037,854 |
| Total
volume |
3,633,120,885 |
3,665,835,999 |
3,968,023,656 |
| NASDAQ |
Latest Close |
Previous
Close |
Week Ago |
| Issues
traded |
4,760 |
4,734 |
4,635 |
| Advances |
1,666 |
2,653 |
1,463 |
| Declines |
2,818 |
1,781 |
2,961 |
| Unchanged |
276 |
300 |
211 |
| New
highs |
80 |
71 |
53 |
| New
lows |
192 |
120 |
272 |
| Closing
Arms (TRIN)† |
1.19 |
0.80 |
1.11 |
| Block
trades |
35,400 |
35,754 |
28,296 |
| Adv.
volume |
1,609,661,012 |
3,009,483,222 |
1,334,404,295 |
| Decl.
volume |
3,250,559,887 |
1,611,058,957 |
3,000,298,259 |
| Total
volume |
4,909,770,894 |
4,676,966,194 |
4,378,598,260 |
|
Table 2 QUICKSILVER on ETFS - 4/11/2023 ---
Bullish = 4 COMPQX(.322), SPY(.34), TECL(+.562), QQQ(+.365)
Bearish = 2 UUP, WEAT
ETF CLOSE CHANGE PIVOT-PT 5-dma AROC CL-PWR CANDLE IP21 ITRS POWER INDEX
==================================================================================================
DIA 336.61 -.29 334.82 39.8% Bullish RED .344 ----- -------
---------------------------------------------------------------------------------------------
COMPQX 11929.34 -102.54 11996.86 -81.6% Bullish RED .274 .048 .322
---------------------------------------------------------------------------------------------
SPY 408.05 -1.67 407.6 -7.6% Bullish RED .32 .02 .34
---------------------------------------------------------------------------------------------
QQQ 313.04 -2.79 315.92 -95% Bullish RED .285 .08 .365
---------------------------------------------------------------------------------------------
MDY 453.66 -2.61 447.23 34.7% ------- RED .09 -.038 .052
---------------------------------------------------------------------------------------------
IWM 175.84 -1.3 173.63 14% Bearish RED -.028 -.058 -.086
---------------------------------------------------------------------------------------------
FAS 58.17 -.33 56.14 168.7% Bearish RED .14 -.315 -.175
---------------------------------------------------------------------------------------------
RETL 6.85 -.59 6.78 -283.4% Bearish RED -.028 -.298 -.326
---------------------------------------------------------------------------------------------
SOXL 15.33 -.88 15.92 -450.8% Bullish RED .11 .112 .222
---------------------------------------------------------------------------------------------
TECL 34.03 -.57 35.13 -334% Bullish RED .305 .257 .562
---------------------------------------------------------------------------------------------
IBB 130.56 -.15 129.51 65.3% Bullish RED .185 -.03 .155
---------------------------------------------------------------------------------------------
GLD 187.19 .91 187.83 -21.2% Bullish RED .179 .048 .227
---------------------------------------------------------------------------------------------
DBO 15.63 .28 15.2 144.6% Bullish BLUE .235 .053 .288
---------------------------------------------------------------------------------------------
OIH 287.85 1.66 282.67 66.2% ------- RED .002 -.108 -.106
---------------------------------------------------------------------------------------------
CPER 24.91 .23 24.41 126.7% Bullish BLUE .253 -.017 .236
---------------------------------------------------------------------------------------------
TAN 74.64 -1.08 73.69 -79.5% ------- RED -.001 -.044 -.045
---------------------------------------------------------------------------------------------
UUP 27.65 -.15 27.72 1.8% Bearish ---- -.29 .004 -.286
---------------------------------------------------------------------------------------------
CORN 24.82 -.09 24.91 -24.1% Bullish RED .019 -.065 -.046
---------------------------------------------------------------------------------------------
WEAT 6.87 .02 6.96 -129.6% Bearish ---- -.185 -.096 -.281
---------------------------------------------------------------------------------------------
YINN 41.87 -4.04 44.43 -473.3% Bullish RED .255 -.351 -.096
|
Table 3 RANKING OF KEY DIRECTORIES BASED PCT.OF STOCKS ABOVE 65-DMA
4/12/23
Bullish = 20
Bearish = 25
---------------------------------------------------------------------------------------
Directory Current day-1 day-2 day-3 day-4 day-5
----------------------------------------------------------------------------------------
UTILITY .894 .894 .842 .815 .736 .5
GOLD .869 .891 .847 .869 .869 .891
BEVERAGE .857 .857 .785 .857 .785 .785
HOSPITAL .785 .714 .714 .571 .571 .571
EDU .666 .666 .5 .5 .5 .5
HOMEBLDG .666 .666 .666 .444 .666 .666
BONDFUND .655 .563 .425 .586 .563 .425
COMPUTER .65 .65 .65 .55 .55 .65
ETFS .636 .6 .472 .49 .454 .472
NIFTY .636 .704 .727 .704 .704 .772
DOWJONES .633 .633 .566 .6 .6 .6
DJI-13 .615 .615 .615 .615 .615 .538
NASD-100 .6 .67 .66 .63 .67 .66
FOOD .591 .591 .53 .571 .551 .551
COMODITY .589 .564 .487 .512 .512 .487
HIGHPRIC .58 .619 .567 .545 .558 .571
GAMING .578 .736 .684 .736 .684 .684
HACKERS .562 .562 .562 .562 .625 .625
SOFTWARE .535 .571 .535 .517 .535 .553
INDEXES .529 .572 .518 .486 .481 .443
==============================================================================================
COAL .5 .333 .166 .166 .166 .166
MILITARY .5 .5 .5 .461 .461 .576
==============================================================================================
FIDSTKS .455 .508 .467 .455 .449 .426
GREEN .444 .388 .388 .333 .277 .333
SP-100 .444 .522 .477 .466 .477 .455
SP500 .443 .476 .439 .406 .416 .408
INSURANC .44 .36 .28 .28 .28 .24
OILGAS .432 .432 .329 .278 .34 .288
GUNS .428 .5 .428 .357 .357 .357
RUS-1000 .41 .442 .399 .368 .37 .381
ELECTRON .368 .421 .443 .375 .398 .443
INDMATER .361 .361 .319 .25 .263 .291
SEMI .361 .436 .457 .404 .425 .468
BIOTECH .342 .362 .332 .327 .302 .314
INFRA .333 .303 .272 .272 .272 .272
CHEM .325 .279 .255 .209 .232 .232
TRANSP .315 .315 .21 .157 .21 .157
RETAIL .297 .446 .404 .319 .382 .425
COPPER .285 .142 .142 .142 .142 .285
AUTO .283 .283 .188 .169 .207 .301
LOWPRICE .252 .232 .223 .209 .206 .229
JETS .23 .23 .23 .153 .153 .23
MARIJUAN .2 .2 .2 .1 .1 .2
FINANCE .175 .175 .112 .1 .112 .137
REIT .169 .184 .169 .153 .13 .161
SOLAR .125 .187 .187 .125 .125 .125
CHINA .113 .159 .181 .204 .136 .272
REGBANKS .024 .048 .024 .024 .024 .024
BIGBANKS 0 0 0 0 0 0
|
====================================================================================
Wednesday 4/12/2023:
5:58 AM Futures: DJI +202 NASDAQ +110
Data Used 4/11/2023
| |
4/11/2023
|
|
| |
Just released by Labor Dept. are the CPI numbers. The 12-month change
figure was
expected to show 5.2% growth. The actual number was 5%. This
shows a big
improvement on the 7% numbers of six months ago. It may take
take some of the
pressure on the FED to raise rates to 6% and allow them to
pause, perhaps
after one more rate hike. But it does not bring inflation down
to the goal of 2%
oe 3% proclaimed by Powell. The Consumer Price Index for All Urban Consumers (CPI-U) increased 5.0 percent
over the last 12 months to an index level of 301.836 (1982-84=100). For the month,
the index increased 0.3 percent prior to seasonal adjustment.
The Consumer Price Index for Urban Wage Earners and Clerical Workers (CPI-W)
increased 4.5 percent over the last 12 months to an index level of 296.021 (1982-84=100).
For the month, the index increased 0.3 percent prior to seasonal adjustment.
"Don't fight
the Fed." That's a very good idea, but can the FED's words be trusted?
How can we know what
they intend. But what if they are divided and Powell
shifts his position
accordingly? Or they what if their words simply reflect a desire
to say whatever their
particular audiences want to hear. Better, I think, to watch what
Professionals expect by
using our Closing Power's trend or the candle-sticks' color
in our Tiger charts.
The rise in the markets of late clearly reflected the expectation by
Professionals that the
forces of inflation were moderating and Labor demands were not
getting ahead of
productivity. These expectations appear to have been born out.
Now we have new
concerns besides interest rates. Bloomberg reports that
the banks have lost a
half trillion in deposits from a year ago and that national
"money
supply" has dropped sharply. Will the market continue to rally in the
face of these worries
and the risk of a government debt default this Summer?
Again, it's asking a
lot of Professionals to correctly predict the profits' and ecoomic
outcome ahead.
But Closing Power and the NYSE A/D Line are our best predictors
and they are rising
very nicely.
The market, as measured
by the major market ETFs and indexes, keeps rallying.
Clearly, the bulls and
:Professionals" believe a "soft landing" is likely and rates
will not shoot up to 6%
anytime soon. What the Closing Powers show now is
potentially very
bullish if the DJI can get past the 34300 resistance. Our technical
studies offer numerous
cases where very unusual Closing Power strength, like we
see now now in DIA,
SPY, QQQ and TECL, despite the overhead resistance
against a backdrop of
lower openings is very often the sign of a new bull market.
Close out the FAZ long.
Hold the weakest regional banks short. Buy SOXL.
Watch FAS, the 3x
leveraged financial ETF. It is on the verge of moving up
past its most recent
highs, whereupon it should try to close the big gap down
that occurred as the
Silicon Valley Bank failure frightened the market. I would
close out FAZ and be
prepared to buy FAS on a move above 61. |
|
| |
Charts - 4/11/2023
2022 PEERLESS DJI, Signals, Indicators Daily DJI Volume
10-DayUp/Down Vol Stoch-20 CCI RSI Pct of All Stocks above 65-dma
Inverted Traders Index
DJI-IPA DJI-OBV Short-Term Rates
NASDAQ S&P OEX NYSE DJ-15 DJ-20 DJI-30
Tiger Index of Big
Banks Bond
Funds Gold Stocks
Housing Stocks
Insurance-Stocks
Regional Bnnls
Russell-1000
Semi Conductors
Recent 2006 vers-Peerless signals
http://tigersoftware.com/oldpeer/UPD90411.bmp
ETFs: DIA QQQ SPY IWM MDY
TNA Short-Term Rates Ten Year Rates PST (Short Treasuries)
DOLLAR-UUP
ALLSTOCKs
COIN (Bit
Coin ETF)
USO-CrudeOil DBO
BLDP FAS GLD HD IBB JETS JNUG KOL NAIL NUGT
NRGU OIH PALL RSX RETL SDS AGQ SLV SOXL TAN TECL TLT TMF TNA
UGA USO China: YINN CHAU
Commodities: CANE
CORN DBC JJC, NIB CORN, CUT (paper)
MOO, NRGU
SOYB WEAT UUP (Dollar) LIT
(Lithium) PALL
(Palladium)
Stocks AA AAPL ADBE ALXN AMAT AMGN AMD AMZN ANET AXON AXP
BA BABA BAC BIDU BLDP BSX CAT CDNS CHKP CNX CPB CRM CVX CMG
DE DIS ENPH FB FSLR FTNT GILD GME GOOG GS HD IBM INTU JPM KO KR
LRCX MRK MRNA MOS MSFT NEM NFLX NKE NOC NUE NVDA PANW PG PYPL
QCOM QDEL REGN REV RE SNOW SO SQUARE TSLA TXN XOM V VRTX WFC
WMT XLE ZM ZOM
Leveraged Short
ETFs:
FAZ - financials, TZA and SRTY- small caps, MZZ - mid caps, TECS -Techs,
SOXS -
semi-conductors LABD
- Biotechs
Bullish MAXCPs www.tigersoftware.com/UPPING/4-11-2023/Bullish.htm
Bearish MINCPs www.tigersoftware.com/Downing/4-11-2023/BEARISH.htm
|
|
 |
 |
 |
 |
 |
 |
 |
 |
 |
 |
Table 1 - Daily Breadth Statistics
| NYSE |
Latest Close |
Previous
Close |
Week Ago |
| Issues
traded |
3,127 |
3,112 |
3,123 |
| Advances |
2,218 |
1,934 |
911 |
| Declines |
787 |
1,050 |
2,087 |
| Unchanged |
122 |
128 |
125 |
| New
highs |
48 |
34 |
48 |
| New
lows |
20 |
39 |
39 |
| Adv.
volume* |
622,358,855 |
565,773,443 |
258,113,620 |
| Decl.
volume* |
172,006,053 |
233,264,873 |
646,934,295 |
| Total
volume* |
809,976,325 |
816,590,143 |
912,176,579 |
| Closing
Arms (TRIN)† |
0.81 |
0.80 |
0.94 |
| Block
trades* |
4,062 |
3,773 |
4,473 |
| Adv.
volume |
2,786,982,646 |
2,322,338,997 |
1,326,085,898 |
| Decl.
volume |
801,257,313 |
1,014,061,268 |
2,865,893,913 |
| Total
volume |
3,665,835,999 |
3,423,659,343 |
4,227,803,625 |
| NASDAQ |
Latest Close |
Previous
Close |
Week Ago |
| Issues
traded |
4,734 |
4,642 |
4,682 |
| Advances |
2,653 |
2,560 |
1,374 |
| Declines |
1,781 |
1,845 |
3,114 |
| Unchanged |
300 |
237 |
194 |
| New
highs |
71 |
54 |
82 |
| New
lows |
120 |
167 |
233 |
| Closing
Arms (TRIN)† |
0.80 |
0.80 |
1.05 |
| Block
trades |
35,754 |
30,358 |
27,428 |
| Adv.
volume |
3,009,483,222 |
2,708,235,042 |
1,253,067,813 |
| Decl.
volume |
1,611,058,957 |
1,556,463,451 |
2,991,544,420 |
| Total
volume |
4,676,966,194 |
4,334,079,669 |
4,298,768,767 |
|
Table 2 QUICKSILVER on ETFS - 4/11/2023 ---
Bullish = 6 COMPQX(.37), SPY(.356), TECL(+.537), QQQ(+.406), GLD (.273), SOXL(.255)
Bearish = 1 UUP (-.296)
ETF CLOSE CHANGE PIVOT-PT 5-dma AROC CL-PWR CANDLE IP21 ITRS POWER INDEX
================================================================================================
DIA 336.9 .94 333.94 14.8% Bullish BLUE .324 ------ -----
(high)
---------------------------------------------------------------------------------------------
COMPQX 12031.88 -52.48 12126.33 -65.1% Bullish RED .327 .043 .37
---------------------------------------------------------------------------------------------
SPY 409.72 .11 408.67 -15% Bullish RED .338 .018 .356
---------------------------------------------------------------------------------------------
QQQ 315.83 -2.04 319.07 -67.9% Bullish RED .332 .074 .406
---------------------------------------------------------------------------------------------
MDY 456.27 4.18 450.53 -19.5% Bullish BLUE .093 -.037 .056
---------------------------------------------------------------------------------------------
IWM 177.14 1.39 175.35 -38.2% ------- BLUE -.014 -.058 -.072
---------------------------------------------------------------------------------------------
FAS 58.5 1.52 56.25 41.4% ------- BLUE .082 -.314 -.232
---------------------------------------------------------------------------------------------
RETL 7.44 .35 7.25 -70.6% ------- BLUE .03 -.246 -.216
---------------------------------------------------------------------------------------------
SOXL 16.21 -.18 16.79 -484.4% Bullish RED .165 .09 .255
---------------------------------------------------------------------------------------------
TECL 34.6 -.99 36.4 -332.4% Bullish RED .324 .213 .537
---------------------------------------------------------------------------------------------
IBB 130.71 .35 128.86 36.2% Bullish BLUE .23 -.04 .19
---------------------------------------------------------------------------------------------
GLD 186.28 1.17 187.98 46.7% Bullish BLUE .226 .047 .273
---------------------------------------------------------------------------------------------
DBO 15.35 .23 15.19 49.4% Bullish BLUE .202 .023 .225
---------------------------------------------------------------------------------------------
OIH 286.19 4.15 284.11 -128.6% ------- BLUE -.047 -.114 -.161
---------------------------------------------------------------------------------------------
CPER 24.68 .29 24.29 -18.4% Bullish BLUE .248 -.029 .219
---------------------------------------------------------------------------------------------
TAN 75.72 .53 75.83 -42.7% ------- BLUE .051 -.047 .004
---------------------------------------------------------------------------------------------
UUP 27.8 -.1 27.64 9% Bearish ---- -.316 .02 -.296
---------------------------------------------------------------------------------------------
CORN 24.91 -.17 24.94 -72% Bullish RED .016 -.053 -.037
---------------------------------------------------------------------------------------------
WEAT 6.85 -.1 7.05 -200% Bearish RED -.147 -.09 -.237
---------------------------------------------------------------------------------------------
YINN 45.91 .37 46.19 -103.6% Bullish RED .282 -.36 -.078
|
TABLE 3 RANKING OF KEY DIRECTORIES BASED PCT.OF STOCKS ABOVE 65-DMA
4/11/23
BULLISH = 23
Bearish = 24
---------------------------------------------------------------------------------------
Directory Current day-1 day-2 day-3 day-4 day-5
----------------------------------------------------------------------------------------
UTILITY .894 .842 .815 .736 .5 .473
GOLD .891 .847 .869 .869 .891 .869
-----
BEVERAGE .857 .785 .857 .785 .785 .928
GAMING .736 .684 .684 .736 .684 .684
HOSPITAL .714 .714 .571 .571 .571 .571
NIFTY .704 .727 .704 .704 .772 .818
NASD-100 .67 .66 .63 .67 .67 .74
-----
EDU .666 .5 .5 .5 .5 .5
HOMEBLDG .666 .666 .444 .666 .666 .722
COMPUTER .65 .65 .55 .55 .65 .65
DOWJONES .633 .566 .6 .6 .6 .466
-----
HIGHPRIC .619 .567 .545 .558 .571 .632
DJI-13 .615 .615 .615 .615 .538 .461
ETFS .6 .472 .49 .454 .49 .49
FOOD .591 .551 .551 .551 .551 .551
INDEXES .572 .518 .486 .481 .454 .54
SOFTWARE .571 .553 .517 .535 .553 .589
COMODITY .564 .512 .487 .512 .487 .512
BONDFUND .563 .425 .586 .563 .436 .425
HACKERS .562 .562 .562 .625 .687 .687
SP-100 .522 .477 .466 .477 .466 .488
FIDSTKS .508 .467 .455 .449 .431 .479
---------------------------------------------------------------------------------------------
GUNS .5 .428 .357 .357 .357 .5
MILITARY .5 .5 .461 .461 .576 .692
=============================================================================================
SP500 .476 .439 .408 .412 .412 .47
-----
RETAIL .446 .404 .319 .382 .425 .489
RUS-1000 .442 .399 .368 .37 .382 .448
-----
SEMI .436 .457 .404 .425 .457 .659
OILGAS .432 .329 .278 .34 .288 .443
ELECTRON .421 .443 .375 .398 .436 .609
GREEN .388 .388 .333 .277 .333 .555
BIOTECH .362 .329 .329 .302 .322 .342
INDMATER .361 .319 .25 .263 .291 .347
INSURANC .36 .28 .28 .28 .24 .32
COAL .333 .166 .166 .166 .166 .5
TRANSP .315 .21 .157 .21 .157 .263
INFRA .303 .272 .272 .272 .272 .363
AUTO .283 .207 .169 .207 .301 .32
CHEM .279 .255 .209 .232 .232 .302
LOWPRICE .232 .226 .212 .206 .229 .234
JETS .23 .23 .153 .153 .23 .23
MARIJUAN .2 .2 .1 .1 .2 .2
SOLAR .187 .187 .125 .125 .125 .187
REIT .184 .161 .161 .138 .153 .161
FINANCE .175 .112 .1 .1 .137 .137
CHINA .159 .181 .204 .136 .272 .181
COPPER .142 .142 .142 .142 .285 .428
REGBANKS .048 .024 .024 .024 .024 .024
BIGBANKS 0 0 0 0 0 0
|
====================================================================================
Tuesday 4/11/2023: 6:15 AM Futures: DJI +15 NASDAQ -29 Data Used 4/10/2023
| |
|
|
| |
The Peerless S10
sill tells us that the overhead resistance from 33600-33400
will probably stop the DJI's
advance. But Professionals remain bullish. They
must expect the coming CPI report
will show sufficient moderation in Inflation
to encourage the FED not to raise
rates in April. We judge this from the rising
Closing Powers in DIA, SPY, QQQ,
NASDAQ and TECL. The latest JOBS
report gives more hope for a
"smooth landing", thus reducing the risk in
owning growth tech stocks.
The Sell S10 we just saw is ususual
in that the IP21 values for DIA have been
rising steeply and are clearly
positive now. This reinforces our sense that we need
to see the Closing Powers turn down
and break their steep uptrends before
believing a DJI decline is
imminent. In this environment, I have suggested
being short the weakest banks.
They are at the bottom of our relative strength
rankings and show the highest
percentage of stocks below their 65-dma.
At the same time, we have a number
of tech stocks among the MAXCPs that
should be held. The fight
between the Professionals and those who are taking
profits on strength continues.
While a bull market is most unlikely until rates
are falling, the high IP21 and high
"bullish" scores in Table 2 below for QQQ
and TECL tell us that certain techs
remain are still quite strong. In this connection,
watch TSLA which is sitting on its
rising 65-dma now and SOXL whose
stocks as a group just gave a red
Buy signal. |
|
| |
Charts - 4/10/2023
2022 PEERLESS DJI, Signals, Indicators Daily DJI Volume
10-DayUp/Down Vol Stoch-20 CCI RSI Pct of All Stocks above 65-dma
Inverted Traders Index
DJI-IPA DJI-OBV Short-Term Rates
NASDAQ S&P OEX NYSE DJ-15 DJ-20 DJI-30
Tiger Index of Big
Banks Bond
Funds Gold Stocks
Housing Stocks
Insurance-Stocks
Regional Bnnls
Russell-1000
Semi Conductors
Recent 2006 vers-Peerless signals
http://tigersoftware.com/oldpeer/UPD904010.bmp
ETFs: DIA QQQ SPY IWM MDY
TNA Short-Term Rates Ten Year Rates PST (Short Treasuries)
DOLLAR-UUP
ALLSTOCKs
COIN (Bit
Coin ETF)
USO-CrudeOil DBO
BLDP FAS GLD HD IBB JETS JNUG KOL NAIL NUGT
NRGU OIH PALL RSX RETL SDS AGQ SLV SOXL TAN TECL TLT TMF TNA
UGA USO China: YINN CHAU
Commodities: CANE
CORN DBC JJC, NIB CORN, CUT (paper)
MOO, NRGU
SOYB WEAT UUP (Dollar) LIT
(Lithium) PALL
(Palladium)
Stocks AA AAPL ADBE ALXN AMAT AMGN AMD AMZN ANET AXON AXP
BA BABA BAC BIDU BLDP BSX CAT CDNS CHKP CNX CPB CRM CVX CMG
DE DIS ENPH FB FSLR FTNT GILD GME GOOG GS HD IBM INTU JPM KO KR
LRCX MRK MRNA MOS MSFT NEM NFLX NKE NOC NUE NVDA PANW PG PYPL
QCOM QDEL REGN REV RE SNOW SO SQUARE TSLA TXN XOM V VRTX WFC
WMT XLE ZM ZOM
Leveraged Short
ETFs:
FAZ - financials, TZA and SRTY- small caps, MZZ - mid caps, TECS -Techs,
SOXS -
semi-conductors LABD
- Biotechs
Bullish MAXCPs www.tigersoftware.com/UPPING/4-10-2023/Bullish.htm
Bearish MINCPs www.tigersoftware.com/Downing/4-10-2023/BEARISH.htm
|
|
 |
 |
 |
 |
 |
 |
 |
 |
 |
 |
Table 1 - Daily Breadth and Volume Statistics
| NYSE |
Latest Close |
Previous
Close |
Week Ago |
| Issues
traded |
3,112 |
3,121 |
3,134 |
| Advances |
1,934 |
1,625 |
1,548 |
| Declines |
1,050 |
1,350 |
1,481 |
| Unchanged |
128 |
146 |
105 |
| New
highs |
34 |
34 |
58 |
| New
lows |
39 |
39 |
11 |
| Adv.
volume* |
565,773,443 |
423,357,457 |
492,784,737 |
| Decl.
volume* |
233,264,873 |
317,050,830 |
436,059,060 |
| Total
volume* |
816,590,143 |
752,879,462 |
940,718,545 |
| Closing
Arms (TRIN)† |
0.80 |
0.80 |
0.91 |
| Block
trades* |
3,773 |
3,883 |
4,444 |
| Adv.
volume |
2,322,338,997 |
2,054,964,434 |
2,238,539,743 |
| Decl.
volume |
1,014,061,268 |
1,367,371,960 |
1,939,208,341 |
| Total
volume |
3,423,659,343 |
3,486,699,828 |
4,234,700,104 |
| NASDAQ |
Latest Close |
Previous
Close |
Week Ago |
| Issues
traded |
4,642 |
4,679 |
4,722 |
| Advances |
2,560 |
2,529 |
2,124 |
| Declines |
1,845 |
1,902 |
2,374 |
| Unchanged |
237 |
248 |
224 |
| New
highs |
54 |
58 |
93 |
| New
lows |
167 |
174 |
130 |
| Closing
Arms (TRIN)† |
0.80 |
0.80 |
1.56 |
| Block
trades |
30,358 |
25,410 |
38,020 |
| Adv.
volume |
2,708,235,042 |
2,380,999,968 |
1,734,044,333 |
| Decl.
volume |
1,556,463,451 |
1,437,945,363 |
3,030,582,910 |
| Total
volume |
4,334,079,669 |
3,862,808,885 |
4,816,443,796 |
|
Table 2 QUICKSILVER on ETFS - 4/10/2023 ---
Bullish = 5 COMPQX(.367), SPY(.294), TECL(+.510), QQQ(+.382), GLD (.307)
Bearish = 2 FAS (-.276), RETL (-.259)
ETF CLOSE CHANGE PIVOT-PT 5-dma AROC CL-PWR CANDLE IP21 ITRS POWER INDEX
================================================================================================
DIA 335.96 1.06 335.91 49.9% Bullish BLUE .253 0 . ---
high
---------------------------------------------------------------------------------------------
COMPQX 12084.36 -3.6 12189.45 -56.7% Bullish BLUE .307 .06 .367
---------------------------------------------------------------------------------------------
SPY 409.61 .42 410.95 2.7% Bullish BLUE .272 .022 .294
---------------------------------------------------------------------------------------------
QQQ 317.87 -.18 320.15 -48% Bullish BLUE .288 .094 .382
---------------------------------------------------------------------------------------------
MDY 452.09 5.47 458.03 -69.9% ------- BLUE .015 -.04 -.025
---------------------------------------------------------------------------------------------
IWM 175.75 1.86 178.48 -75.3% ------- BLUE -.045 -.058 -.103
---------------------------------------------------------------------------------------------
FAS 56.98 .39 58.03 -60.6% ------- BLUE .053 -.329 -.276
---------------------------------------------------------------------------------------------
RETL 7.09 .36 7.54 -203.2% ------- BLUE -.015 -.244 -.259
---------------------------------------------------------------------------------------------
SOXL 16.39 .73 17.81 -565.2% Bullish BLUE .131 .085 .216
---------------------------------------------------------------------------------------------
TECL 35.59 -.08 36.99 -219.2% Bullish BLUE .246 .264 .51
---------------------------------------------------------------------------------------------
IBB 130.36 -.69 129.77 46.3% Bullish RED .202 -.04 .162
---------------------------------------------------------------------------------------------
GLD 185.11 -1.38 184.54 50.8% Bullish RED .266 .041 .307
---------------------------------------------------------------------------------------------
DBO 15.12 -.07 15.2 182.5% Bullish RED .206 -.009 .197
---------------------------------------------------------------------------------------------
OIH 282.04 3.71 293.5 86.7% Bearish BLUE -.099 -.134 -.233
---------------------------------------------------------------------------------------------
CPER 24.39 -.19 24.77 -111.8% Bullish BLUE .182 -.05 .132
---------------------------------------------------------------------------------------------
TAN 75.19 1.51 76.36 -161.7% ------- BLUE -.001 -.044 -.045
---------------------------------------------------------------------------------------------
UUP 27.9 .16 27.75 3.6% Bearish ---- -.214 .027 -.187
---------------------------------------------------------------------------------------------
CORN 25.08 .34 25.27 -30% Bullish BLUE .082 -.046 .036
---------------------------------------------------------------------------------------------
WEAT 6.95 .04 7.13 -78.3% ------- ---- -.054 -.077 -.131
---------------------------------------------------------------------------------------------
YINN 45.54 -.58 46.86 -213.1% Bullish BLUE .279 -.366 -.087
|
Table 3 RANKING OF KEY DIRECTORIES BASED PCT.OF STOCKS ABOVE 65-DMA
4/10/23
Bullish = 17
Bearish = 30
---------------------------------------------------------------------------------------
Directory Current day-1 day-2 day-3 day-4 day-5
----------------------------------------------------------------------------------------
GOLD .847 .869 .869 .891 .891 .847
UTILITY .842 .815 .736 .5 .473 .473
BEVERAGE .785 .857 .785 .785 .928 .785
NIFTY .727 .704 .704 .772 .84 .84
HOSPITAL .714 .571 .571 .571 .571 .571
GAMING .684 .684 .684 .736 .684 .736
HOMEBLDG .666 .444 .666 .666 .722 .666
NASD-100 .66 .63 .67 .67 .75 .77
COMPUTER .65 .55 .55 .65 .65 .6
DJI-13 .615 .615 .615 .538 .461 .307
HIGHPRIC .567 .545 .558 .571 .627 .614
DOWJONES .566 .6 .6 .6 .466 .366
HACKERS .562 .562 .625 .687 .687 .812
SOFTWARE .553 .535 .535 .553 .589 .589
FOOD .551 .571 .53 .551 .551 .408
INDEXES .518 .486 .481 .454 .54 .481
COMODITY .512 .512 .487 .487 .538 .41
-----------------------------------------------------------------------------------------------
EDU .5 .5 .5 .5 .5 .5
MILITARY .5 .461 .461 .576 .73 .576
-----------------------------------------------------------------------------------------------
SP-100 .477 .466 .477 .466 .488 .444
ETFS .472 .49 .454 .49 .509 .49
FIDSTKS .467 .455 .449 .431 .473 .431
SEMI .457 .404 .425 .457 .67 .702
ELECTRON .443 .375 .398 .436 .616 .639
SP500 .439 .408 .414 .408 .472 .451
GUNS .428 .357 .357 .357 .5 .428
BONDFUND .425 .586 .563 .436 .448 .505
RETAIL .404 .319 .382 .425 .51 .425
RUS-1000 .399 .368 .37 .383 .451 .436
GREEN .388 .333 .277 .333 .555 .5
BIOTECH .329 .327 .304 .322 .34 .34
OILGAS .329 .278 .34 .288 .432 .226
INDMATER .319 .25 .263 .291 .361 .333
INSURANC .28 .28 .28 .24 .32 .16
INFRA .272 .272 .272 .272 .363 .333
CHEM .255 .209 .232 .232 .302 .255
JETS .23 .153 .153 .23 .23 .307
LOWPRICE .226 .214 .209 .229 .24 .232
TRANSP .21 .157 .21 .157 .263 .368
AUTO .207 .188 .207 .301 .32 .377
MARIJUAN .2 .1 .1 .2 .2 .1
SOLAR .187 .125 .125 .125 .25 .312
CHINA .181 .204 .136 .272 .204 .227
COAL .166 .166 .166 .166 .5 .166
REIT .161 .153 .146 .161 .153 .176
COPPER .142 .142 .142 .285 .428 .428
FINANCE .112 .1 .1 .125 .137 .137
REGBANKS .024 .024 .024 .024 .024 .048
BIGBANKS 0 0 0 0 0 0
|
====================================================================================
Monday 4/10/2023: 5:20 AM Futures: DJI -30 NASDAQ -82 Data Used 4/6/2023
| |
4/6/2023
|
|
| |
Friday's Job Report gave bulls lots to cheer about. March Jobs increased by
more than 300,000.
So, a "soft landing" is still a good bet. Wages rose by
only 3%, well below the
last reported monthly CPI number of 6%. That should
help big corporation
keep profits high if they are in a position to use Inflation as an
excuse to keep prices
high. (KO, MCD and PG can do this and their stocks refuse to
sell off.)
https://thehill.com/business/3939442-five-takeaways-from-a-strong-march-jobs-report/
Barron's this weekend
wants one more 1/4% rate hike in May. But will that bring
the CPI numbers down to
2% or 3%? If that really is what it will take to satisfy the
FED's inflation
":hawks", we will likely see 6% interest rates first. Can the stock
market happily absorb
such rates? Won't that draw a lot of money out of stocks
whose dividends are
much less? And won't that put banks' long-term bonds and
mortgages another
trillion dollars under water. Powell could make a lot clearer
how much more he thinks
he needs to raise rates to achieve his 3% CPI number.
Is he willing to 20%
drop in the market? Can he really fine-tune this? There is a lot
of risk that he cannot
control.
And what about the
wilder members of the Republican controlled House of
Representatives?
This is their best chance to get Dems to cut social programs.
Won't they fight hard
to get these cuts? At least, until the market starts to swoon,
as it did in 2011, when
the DJI dropped 17% from its highs before a political deal
was reached between a
Democrat President and the Republican-controlled House.
Such a decline now
would take the DJI back to the good support of 30000.
Mid-week, the CPI
number for inflation in March will be released. If it does not fall
from 6% to 5%, a lot of
traders may start to see the FED needing to raise the
Fed Funds' rates and
short-term interest rates to 6%. That would require
short-term rates to
rise another 1.29%. Rising rates have seldom been a benign
force for stocks.
Bull markets are much more likely to begin only when short-term
rates are starting to
fall, as part of a FED plan to re-inflate. (Then excellent
rallies can start::
examples: late 1920, early 1967 and August 1982)
For now, our Peerless
Sell S12 probably does reflect big investors' bearish
concerns. That is
what a negative IP21 at the upper band was designed to do.
A failure to increase
the debt-limit in 2011 also caused a Sell S9-V, where
the V-I was negative as
the DJI reached the upper band. S9-Vs are not allowed
by Peerless in April,
but the negative V-I now is clearly another warning.
Technically, NY
Professionals have not yet "clinched" the Sell S12 by causing our
Closing Powers to all
turn down. The Closing Powers for DIA, NASDAQ, SPY,
QQQ and TECL have not
decisively broken their uptrends by enough to cause their
Closing Power moving
averages to turn down. Word has apparently not leaked
out about the next
CPI number or what the FED plans to do next.
But the weakest ETFs,
FAS, IWM and even MDY have already lost favor in this
environment of likely
higher interest rates. See their falling Closing Power below.
The composite internal strength indicators (a new Tiger
dispplay) for SPY
have not yet clinched
the Sell S12 by breaking their uptrends. Presumably, traders
see the 10-year bond
rate hovering at support and that gives them enough confidence
to hold these a
little longer. But most often, pre-Easter gains are given up in the week
following. And if
the March CPI numbers do not quicken their decline later
this week, I would
think that there is much more downside than upside potential
for the market.
See in the DJI chart below how much time the DJI spent just uder
34000 two months ago.
That is likely to be pretty firm resistance.
The best way to trade
in this environment is to short bank stocks and be long only
a handful of the most
bullish-looking MAXCPs. Hold FAZ. We will short
IWM if the CPI numbers
remain very high and its Closing Power fails to recover
much..
|
|
| |
Charts - 4/6/2023
2022 PEERLESS DJI, Signals, Indicators Daily DJI Volume
10-DayUp/Down Vol Stoch-20 CCI RSI Pct of All Stocks above 65-dma
Inverted Traders Index
DJI-IPA DJI-OBV Short-Term Rates
NASDAQ S&P OEX NYSE DJ-15 DJ-20 DJI-30
Tiger Index of Big
Banks Bond
Funds Gold Stocks
Housing Stocks
Insurance-Stocks
Regional Bnnls
Russell-1000
Semi Conductors
Recent 2006 vers-Peerless signals
http://tigersoftware.com/oldpeer/UPD90406.bmp
ETFs: DIA QQQ SPY IWM MDY
TNA Short-Term Rates Ten Year Rates PST (Short Treasuries)
DOLLAR-UUP
ALLSTOCKs
COIN (Bit
Coin ETF)
USO-CrudeOil DBO
BLDP FAS GLD HD IBB JETS JNUG KOL NAIL NUGT
NRGU OIH PALL RSX RETL SDS AGQ SLV SOXL TAN TECL TLT TMF TNA
UGA USO China: YINN CHAU
Commodities: CANE
CORN DBC JJC, NIB CORN, CUT (paper)
MOO, NRGU
SOYB WEAT UUP (Dollar) LIT
(Lithium) PALL
(Palladium)
Stocks AA AAPL ADBE ALXN AMAT AMGN AMD AMZN ANET AXON AXP
BA BABA BAC BIDU BLDP BSX CAT CDNS CHKP CNX CPB CRM CVX CMG
DE DIS ENPH FB FSLR FTNT GILD GME GOOG GS HD IBM INTU JPM KO KR
LRCX MRK MRNA MOS MSFT NEM NFLX NKE NOC NUE NVDA PANW PG PYPL
QCOM QDEL REGN REV RE SNOW SO SQUARE TSLA TXN XOM V VRTX WFC
WMT XLE ZM ZOM
Leveraged Short
ETFs:
FAZ - financials, TZA and SRTY- small caps, MZZ - mid caps, TECS -Techs,
SOXS -
semi-conductors LABD
- Biotechs
Bullish MAXCPs www.tigersoftware.com/UPPING/4-6-2023/Bullish.htm
Bearish MINCPs www.tigersoftware.com/Downing/4-6-2023/BEARISH.htm
|
|
 |
 |
 |
 |
 |
 |
 |
 |
 |
 |
Table 1 - Daily Breadth and Volume Statistics
| NYSE |
Latest Close |
Previous
Close |
Week Ago |
| Issues
traded |
3,121 |
3,100 |
3,112 |
| Advances |
1,625 |
1,125 |
2,096 |
| Declines |
1,350 |
1,872 |
924 |
| Unchanged |
146 |
103 |
92 |
| New
highs |
34 |
27 |
44 |
| New
lows |
39 |
51 |
16 |
| Adv.
volume* |
423,357,457 |
353,135,392 |
528,118,888 |
| Decl.
volume* |
317,050,830 |
542,679,121 |
262,100,656 |
| Total
volume* |
752,879,462 |
906,170,947 |
796,836,328 |
| Closing
Arms (TRIN)† |
0.80 |
1.04 |
1.09 |
| Block
trades* |
3,883 |
4,211 |
4,142 |
| Adv.
volume |
2,054,964,434 |
1,425,505,999 |
2,630,491,036 |
| Decl.
volume |
1,367,371,960 |
2,468,037,854 |
1,268,992,220 |
| Total
volume |
3,486,699,828 |
3,968,023,656 |
3,930,865,429 |
| NASDAQ |
Latest Close |
Previous
Close |
Week Ago |
| Issues
traded |
4,679 |
4,635 |
4,630 |
| Advances |
2,529 |
1,463 |
2,380 |
| Declines |
1,902 |
2,961 |
2,051 |
| Unchanged |
248 |
211 |
199 |
| New
highs |
58 |
53 |
75 |
| New
lows |
174 |
272 |
153 |
| Closing
Arms (TRIN)† |
0.80 |
1.11 |
0.80 |
| Block
trades |
25,410 |
28,296 |
38,009 |
| Adv.
volume |
2,380,999,968 |
1,334,404,295 |
2,778,645,451 |
| Decl.
volume |
1,437,945,363 |
3,000,298,259 |
1,914,835,135 |
| Total
volume |
3,862,808,885 |
4,378,598,260 |
4,738,884,353 |
|
Table 2 QUICKSILVER on ETFS - 4/6/2023 ---
Bullish = 4 TECL(+.490), QQQ(+.323), GLD (.290), COMPQX(.300)
Bearish = 3 FAS (-.315), RETL (-.347), OIH(-.279)
ETF CLOSE CHANGE PIVOT-PT 5-dma AROC CL-PWR CANDLE IP21 ITRS POWER INDEX
================================================================================================
DIA 334.9 .08 332.62 96.4% Bullish BLUE .171 0 .171
---------------------------------------------------------------------------------------------
COMPQX 12087.96 91.1 12221.91 30.8% Bullish BLUE .224 .076 .3
---------------------------------------------------------------------------------------------
SPY 409.19 1.59 409.39 67.3% Bullish BLUE .197 .029 .226
---------------------------------------------------------------------------------------------
QQQ 318.05 2.13 320.93 37.2% Bullish BLUE .21 .113 .323
---------------------------------------------------------------------------------------------
MDY 446.62 -.61 458.41 -41.9% ------- RED -.062 -.046 -.108
---------------------------------------------------------------------------------------------
IWM 173.89 .26 178.4 -36.6% ------- BLUE -.101 -.065 -.166
---------------------------------------------------------------------------------------------
FAS 56.59 .45 57.67 64.3% ------- BLUE .012 -.327 -.315
---------------------------------------------------------------------------------------------
RETL 6.73 -.05 7.38 -83.8% ------- BLUE -.081 -.266 -.347
---------------------------------------------------------------------------------------------
SOXL 15.66 -.26 18.3 -659.8% ------- BLUE .058 .085 .143
---------------------------------------------------------------------------------------------
TECL 35.67 .54 37.18 1.4% Bullish BLUE .166 .324 .49
---------------------------------------------------------------------------------------------
IBB 131.05 1.54 129.16 148.2% Bullish BLUE .138 -.035 .103
---------------------------------------------------------------------------------------------
GLD 186.49 -1.34 183.22 62.2% Bullish RED .253 .037 .29
---------------------------------------------------------------------------------------------
DBO 15.19 -.01 14.57 278.4% Bullish ---- .204 -.004 .2
---------------------------------------------------------------------------------------------
OIH 278.33 -4.34 277.13 71.4% Bearish RED -.143 -.136 -.279
---------------------------------------------------------------------------------------------
CPER 24.58 .17 24.94 -109.3% Bullish BLUE .174 -.043 .131
---------------------------------------------------------------------------------------------
TAN 73.68 -.01 77.63 -136.4% ------- BLUE -.06 -.063 -.123
---------------------------------------------------------------------------------------------
UUP 27.74 .02 27.88 -7.2% Bearish ---- -.18 .021 -.159
---------------------------------------------------------------------------------------------
CORN 24.74 -.17 25.23 -83.7% ------- RED -.047 -.056 -.103
---------------------------------------------------------------------------------------------
WEAT 6.91 -.05 7.06 -99.3% Bearish RED -.14 -.067 -.207
---------------------------------------------------------------------------------------------
YINN 46.12 1.69 47.51 -347.7% Bullish BLUE .162 -.337 -.175
|
Table 3 RANKING OF KEY DIRECTORIES BASED PCT.OF STOCKS ABOVE 65-DMA
4/6/23
Bullish = 16 Gold is strongest
Bearish = 32 Big Banks are weakest
---------------------------------------------------------------------------------------
Directory Current day-1 day-2 day-3 day-4 day-5
----------------------------------------------------------------------------------------
GOLD .869 .869 .891 .891 .847 .847
BEVERAGE .857 .785 .785 .928 .785 .785
UTILITY .815 .736 .5 .473 .473 .421
NIFTY .704 .704 .772 .84 .84 .772
GAMING .684 .684 .684 .736 .736 .684
NASD-100 .63 .67 .67 .75 .77 .66
DJI-13 .615 .615 .538 .461 .307 .307
DOWJONES .6 .6 .6 .466 .4 .366
======
BONDFUND .586 .563 .436 .448 .528 .252
FOOD .571 .551 .53 .551 .408 .428
HOSPITAL .571 .571 .571 .571 .571 .5
HACKERS .562 .625 .687 .687 .812 .625
COMPUTER .55 .55 .65 .65 .6 .55
HIGHPRIC .545 .558 .571 .627 .619 .536
SOFTWARE .535 .553 .553 .589 .589 .535
COMODITY .512 .512 .461 .538 .41 .435
================================================================================================
EDU .5 .5 .5 .5 .5 .333
================================================================================================
ETFS .49 .454 .49 .509 .509 .509
INDEXES .486 .481 .454 .54 .491 .372
SP-100 .466 .477 .466 .488 .455 .344
MILITARY .461 .461 .576 .73 .576 .538
FIDSTKS .455 .449 .431 .473 .443 .349
HOMEBLDG .444 .666 .666 .722 .666 .666
-----
SP500 .408 .414 .41 .468 .459 .377
-----
SEMI .404 .425 .457 .67 .702 .648
-----
ELECTRON .375 .398 .436 .616 .631 .586
RUS-1000 .368 .37 .383 .451 .444 .358
-----
GUNS .357 .357 .357 .5 .428 .357
GREEN .333 .277 .333 .555 .5 .388
BIOTECH .327 .302 .324 .34 .34 .304
RETAIL .319 .382 .425 .51 .425 .361
INSURANC .28 .28 .24 .32 .2 .16
OILGAS .278 .34 .288 .432 .237 .175
INFRA .272 .272 .272 .363 .333 .303
INDMATER .25 .263 .291 .361 .347 .319
LOWPRICE .214 .212 .232 .24 .232 .212
CHEM .209 .232 .232 .302 .279 .232
CHINA .204 .136 .272 .204 .227 .181
AUTO .188 .226 .301 .32 .396 .283
COAL .166 .166 .166 .5 .166 0
TRANSP .157 .21 .157 .263 .368 .157
JETS .153 .153 .23 .23 .307 .307
REIT .153 .138 .169 .161 .176 .146
COPPER .142 .142 .285 .428 .428 .428
SOLAR .125 .125 .125 .25 .375 .25
FINANCE .1 .1 .125 .125 .137 .087
MARIJUAN .1 .1 .2 .2 .1 .1
REGBANKS .024 .024 .024 .024 .048 .024
BIGBANKS 0 0 0 0 0 0
|
====================================================================================
Thursday
4/6/2023: 5:35 AM Futures: DJI +14 NASDAQ -41 Data Used 4/5/2023
| |
|
|
| |
Our April Sell S12
is somehat tricky in that there can be a 3%-4% paper loss
in these before they work out.
I showed last night that in 5 of the 13 past March
and April S12s there were such
paper losses. What could cause this would be
an open statement from the FED
announcing a rate increase pause. Presumably,
they would take this new stance to
help prevent more more regional bank failures.
Otherwise, that there may be more
financial panic ahead is shown by the continued
weakness of the Regional Banks.
See the Tiger Index of these below and the
many representatives in this group
among our bearish MINCPs. I would think
the Regional Banks will be the
hardest hit group if the Sell S12 proves to be correct..
But a rate-hike pause is a
possibility, too. Announced or not, it would explain
why Utilities and Bonds rose
strongly today and why the 10-year rates are at the
support of their 3-month lows.
That the FED has let insiders believe that the
FED will not be boosting rates is
having the effect already of boosting the price of
Gold and Silver as inflation-plays
and is already hurting the Dollar.
Many traders are waiting to see
Friday's Jobs numbers. Another set of positive
numbers here should be bullish as
long as the FED is unwilling to continue to
aggressively raise rates for fear
of causing more regional bankfailures. But a
Jobs Report that is too robust and
raises fears of more inflation will
have the opposite effect and make
traders more fearful the the Inflation-hawks
in the FOMC will prevail.
The Regional Banks, as a whole,
look like they are teetering on their last
supports before starting another
leg down. Accordingly, watch them. We
are long FAZ, which should rally if
the Regional Banks continue to weaken.
Breadth was poor today. The
DJI's strength for the last two days looks
artificial in that UNH's 50-point
rally has served to lift the DJI 300 points, all
by itself. Meanwhile, IWM,
MDY and small caps are already in clear retreats.
See below how the tech leaders NVDA
and TSLA have started to break
below significiant internal
strength uptrend-lines. I think because of this and
out of respect for our Sell S12, we
should take profits in QQQ and TECL.
|
|
| |
Charts - 4/5/2023
2022 PEERLESS DJI, Signals, Indicators Daily DJI Volume
10-DayUp/Down Vol Stoch-20 CCI RSI Pct of All Stocks above 65-dma
Inverted Traders Index
DJI-IPA DJI-OBV Short-Term Rates
NASDAQ S&P OEX NYSE DJ-15 DJ-20 DJI-30
Tiger Index of Big
Banks Bond
Funds Gold Stocks
Housing Stocks
Insurance-Stocks
Regional Bnnls
Russell-1000
Semi Conductors
Recent 2006 vers-Peerless signals
http://tigersoftware.com/oldpeer/UPD90405.bmp
ETFs: DIA QQQ SPY IWM MDY
TNA Short-Term Rates Ten Year Rates PST (Short Treasuries)
DOLLAR-UUP
ALLSTOCKs
COIN (Bit
Coin ETF)
USO-CrudeOil DBO
BLDP FAS GLD HD IBB JETS JNUG KOL NAIL NUGT
NRGU OIH PALL RSX RETL SDS AGQ SLV SOXL TAN TECL TLT TMF TNA
UGA USO China: YINN CHAU
Commodities: CANE
CORN DBC JJC, NIB CORN, CUT (paper)
MOO, NRGU
SOYB WEAT UUP (Dollar) LIT
(Lithium) PALL
(Palladium)
Stocks AA AAPL ADBE ALXN AMAT AMGN AMD AMZN ANET AXON AXP
BA BABA BAC BIDU BLDP BSX CAT CDNS CHKP CNX CPB CRM CVX CMG
DE DIS ENPH FB FSLR FTNT GILD GME GOOG GS HD IBM INTU JPM KO KR
LRCX MRK MRNA MOS MSFT NEM NFLX NKE NOC NUE NVDA PANW PG PYPL
QCOM QDEL REGN REV RE SNOW SO SQUARE TSLA TXN XOM V VRTX WFC
WMT XLE ZM ZOM
Leveraged Short
ETFs:
FAZ - financials, TZA and SRTY- small caps, MZZ - mid caps, TECS -Techs,
SOXS -
semi-conductors LABD
- Biotechs
Bullish MAXCPs www.tigersoftware.com/UPPING/4-5-2023/Bullish.htm
Bearish MINCPs www.tigersoftware.com/Downing/4-5-2023/BEARISH.htm
|
|
 |
 |
 |
 |
 |
 |
 |
 |
 |
 |
 |
 |
 |
Table 1 - Daily Breadth and Volume Statistics
| NYSE |
Latest Close |
Previous
Close |
Week Ago |
| Issues
traded |
3,100 |
3,123 |
3,127 |
| Advances |
1,125 |
911 |
2,389 |
| Declines |
1,872 |
2,087 |
635 |
| Unchanged |
103 |
125 |
103 |
| New
highs |
27 |
48 |
41 |
| New
lows |
51 |
39 |
20 |
| Adv.
volume* |
353,135,392 |
258,113,620 |
765,954,200 |
| Decl.
volume* |
542,679,121 |
646,934,295 |
119,435,289 |
| Total
volume* |
906,170,947 |
912,176,579 |
892,340,980 |
| Closing
Arms (TRIN)† |
1.04 |
0.94 |
0.63 |
| Block
trades* |
4,211 |
4,473 |
4,370 |
| Adv.
volume |
1,425,505,999 |
1,326,085,898 |
3,528,207,127 |
| Decl.
volume |
2,468,037,854 |
2,865,893,913 |
588,148,294 |
| Total
volume |
3,968,023,656 |
4,227,803,625 |
4,145,256,202 |
| NASDAQ |
Latest Close |
Previous
Close |
Week Ago |
| Issues
traded |
4,635 |
4,682 |
4,700 |
| Advances |
1,463 |
1,374 |
3,044 |
| Declines |
2,961 |
3,114 |
1,443 |
| Unchanged |
211 |
194 |
213 |
| New
highs |
53 |
82 |
68 |
| New
lows |
272 |
233 |
143 |
| Closing
Arms (TRIN)† |
1.11 |
1.05 |
0.33 |
| Block
trades |
28,296 |
27,428 |
33,583 |
| Adv.
volume |
1,334,404,295 |
1,253,067,813 |
3,845,388,807 |
| Decl.
volume |
3,000,298,259 |
2,991,544,420 |
594,341,468 |
| Total
volume |
4,378,598,260 |
4,298,768,767 |
4,493,545,035 |
|
Table 2 QUICKSILVER on ETFS - 4/5/2023 ---
Bullish = 4 TECL(+.465), QQQ(+.308), GLD (.286), COMPQX(.277)
Bearish = 2 FAS (-.317), RETL (-.311)
ETF CLOSE CHANGE PIVOT-PT 5-dma AROC CL-PWR CANDLE IP21 ITRS POWER INDEX
================================================================================================
DIA 334.82 .88 328.48 116.7% Bullish BLUE .165 0 ----
---------------------------------------------------------------------------------------------
COMPQX 11996.86 -129.47 12013.47 29.2% Bullish RED .212 .065 .277
---------------------------------------------------------------------------------------------
SPY 407.6 -1.07 403.7 76.8% Bullish RED .188 .025 .213
---------------------------------------------------------------------------------------------
QQQ 315.92 -3.15 315.68 50.4% Bullish RED .206 .102 .308
---------------------------------------------------------------------------------------------
MDY 447.23 -3.3 450.42 -20.7% Bearish RED -.063 -.043 -.106
---------------------------------------------------------------------------------------------
IWM 173.63 -1.72 175.18 -50.7% Bearish RED -.107 -.064 -.171
---------------------------------------------------------------------------------------------
FAS 56.14 -.11 55.86 -12.3% Bearish BLUE .002 -.319 -.317
---------------------------------------------------------------------------------------------
RETL 6.78 -.47 6.85 63% Bearish RED -.07 -.241 -.311
---------------------------------------------------------------------------------------------
SOXL 15.92 -.87 17.95 -329.8% Bullish RED .082 .109 .191
---------------------------------------------------------------------------------------------
TECL 35.13 -1.27 35.66 87.1% Bullish RED .172 .293 .465
---------------------------------------------------------------------------------------------
IBB 129.51 .65 127.23 65.3% ------- BLUE .104 -.046 .058
---------------------------------------------------------------------------------------------
GLD 187.83 -.15 184.18 143.6% Bullish RED .237 .049 .286
---------------------------------------------------------------------------------------------
DBO 15.2 .01 14.36 353.8% Bullish ---- .194 -.004 .19
---------------------------------------------------------------------------------------------
OIH 282.67 -1.44 274.3 94% Bearish RED -.135 -.101 -.236
---------------------------------------------------------------------------------------------
CPER 24.41 .12 25.12 -102.8% ------- BLUE .148 -.049 .099
---------------------------------------------------------------------------------------------
TAN 73.69 -2.14 75.75 -33.6% Bearish RED -.05 -.08 -.13
---------------------------------------------------------------------------------------------
UUP 27.72 .08 27.78 -34.2% Bearish BLUE -.174 .017 -.157
---------------------------------------------------------------------------------------------
CORN 24.91 -.03 25.16 -75.5% ------- ---- -.106 -.053 -.159
---------------------------------------------------------------------------------------------
WEAT 6.96 -.09 7.05 -141% ------- ---- -.162 -.056 -.218
---------------------------------------------------------------------------------------------
YINN 44.43 -1.76 49.38 -277.4% Bullish RED .146 -.357 -.211
|
Table 3 RANKING OF KEY DIRECTORIES BASED PCT.OF STOCKS ABOVE 65-DMA
4/5/23
---------------------------------------------------------------------------------------
Directory Current day-1 day-2 day-3 day-4 day-5
----------------------------------------------------------------------------------------
GOLD .869 .891 .891 .847 .826 .804
=====
BEVERAGE .785 .785 .928 .785 .785 .857
UTILITY .736 .5 .473 .473 .421 .368
NIFTY .704 .772 .84 .84 .772 .727
GAMING .684 .684 .684 .789 .736 .684
NASD-100 .67 .67 .75 .77 .67 .64
=====
HOMEBLDG .666 .666 .722 .666 .666 .666
HACKERS .625 .687 .687 .812 .625 .562
DJI-13 .615 .538 .461 .307 .307 .307
DOWJONES .6 .6 .466 .4 .366 .366
======
HOSPITAL .571 .571 .571 .571 .5 .428
BONDFUND .563 .436 .448 .528 .287 .183
HIGHPRIC .558 .571 .627 .619 .541 .506
SOFTWARE .553 .571 .589 .589 .535 .553
FOOD .551 .551 .53 .408 .428 .387
COMPUTER .55 .65 .65 .6 .55 .45
COMODITY .512 .487 .512 .41 .435 .435
==========================================================================================================
EDU .5 .5 .5 .5 .333 0
INDEXES .481 .454 .54 .491 .378 .308
SP-100 .477 .466 .488 .455 .344 .277
MILITARY .461 .576 .73 .576 .538 .5
ETFS .454 .49 .509 .509 .527 .381
FIDSTKS .449 .431 .473 .443 .355 .313
SEMI .425 .457 .67 .702 .648 .638
SP500 .414 .41 .47 .455 .388 .33
======
ELECTRON .398 .436 .616 .631 .578 .556
RETAIL .382 .425 .51 .425 .361 .319
RUS-1000 .37 .383 .451 .444 .366 .331
=====
OILGAS .361 .314 .447 .266 .209 .228
GUNS .357 .357 .5 .428 .357 .357
BIOTECH .302 .322 .342 .34 .307 .294
INSURANC .28 .24 .32 .2 .16 .24
GREEN .277 .333 .555 .5 .388 .388
INFRA .272 .272 .363 .333 .303 .303
INDMATER .263 .291 .361 .347 .333 .305
CHEM .232 .232 .302 .279 .255 .209
AUTO .226 .32 .32 .396 .283 .264
LOWPRICE .212 .234 .243 .232 .212 .183
TRANSP .21 .157 .263 .368 .21 .21
COAL .166 .166 .5 .166 0 0
JETS .153 .23 .23 .307 .307 .307
COPPER .142 .285 .428 .428 .428 .428
REIT .138 .161 .169 .184 .138 .123
CHINA .136 .272 .204 .227 .204 .159
SOLAR .125 .125 .25 .375 .25 .312
FINANCE .1 .125 .125 .125 .1 .1
MARIJUAN .1 .2 .2 .1 .1 .1
REGBANKS .024 .024 .024 .048 .024 .024
BIGBANKS 0 0 0 0 0 0
=====
|
====================================================================================
Wednesday 4/5/2023: 5:15 AM Futures: DJI -12 NASDAQ
-7 Data Used 4/4/2023
| |
4/4/2023
|
|
| |
Peerless produced a
rare April Sell S12. Making this possible was our IP21-
Accumulation Index turning negative
with the DJI 2.9% over the 21-day ma,
the 21-day ma now falling and the
negative breadth P-Indicator falling more today.
These conditions do allow a Sell
S12 in the third years of the four-year Presidential
cycle despite its normal seasonal
bullishness.
I checked back over the history of
Sell S12s in March and April. As you can see
below they are reliable even in the third years of the four-year Presidential Cycle. If
we count the Depression era S12s in
these years, the average decline after a
S12 is more than 10%.
But 6 of the total 13 cases saw a paper loss of between
2.2% and 4.1%. That would
seem to be a good reason to stay a hedged
a little longer by holding QQQ and
TECL or some bullish MACPs while buying
FAZ and holding short some of the
weakest regional banks among the bearish MINCPs..
March and April Sell S12s since 1929.
Date Gain on next Buy
Paper Loss
---------- -------------------
-----------
4/30/29 .081
-.022
3/20/31 .223
0
4/4/34 .110
-.033
3/4/36 .045
-.033
4/2/36 .067
-.009
4/13/38 .042
-.035
4/25/38 .052
0
3/7/39 .17
-.019
4/8/40 .231
0
4/19/67 -.001
-.041
4/6/79 .057
-.003
4/5/2004 .056
0|
4/20/2020 -.001
-.042
The indictment of former President
Trump may be part of the reason the market fell
on Tuesday. If this is so, it
should go back up today.
The NY Times ran an article
yesterday setting forth how difficult it will be for the
Congress to agree to extend the
debt limit this Summer given the widely different
opinions in Republican ranks and
given Biden's declaration that he would not
abandon social security or the
military to reach an agreement. Its conclusion was
that it would probably take another
big market sell-off as we saw in 2011 to
force agreement and avoid a
government default. True or not, we saw two stocks
drop sharply today, CAT and DE,
that depend heavily on government road-building
equipment bills being paid.
Bank stocks were worried today,
too. See the way regional banks dropped more
today. They would seem to be
the best place to go short and hedge long positions
still held in TECL, QQQ and bullish
MAXCPs. Buy FAZ again with the plan to sell
it again above 25.
Peace in the Ukraine would be
bullish. Most experts do not expect Putin to stop
fighting until he can claim some
kind of victory to justify the heavy Russian losses.
But the return home by defeated
Russian soldiers over-turned the tsar in March
1917. Putin's
personal power is assailable. He does not have the power of Stalin.
Putin's days are probably
numbered.
|
|
| |
Charts - 4/4/2023
2022 PEERLESS DJI, Signals, Indicators Daily DJI Volume
10-DayUp/Down Vol Stoch-20 CCI RSI Pct of All Stocks above 65-dma
Inverted Traders Index
DJI-IPA DJI-OBV Short-Term Rates
NASDAQ S&P OEX NYSE DJ-15 DJ-20 DJI-30
Tiger Index of Big
Banks Bond
Funds Gold Stocks
Housing Stocks
Insurance-Stocks
Regional Bnnls
Russell-1000
Semi Conductors
Recent 2006 vers-Peerless signals
http://tigersoftware.com/oldpeer/UPD90404.bmp
ETFs: DIA QQQ SPY IWM MDY
TNA Short-Term Rates Ten Year Rates PST (Short Treasuries)
DOLLAR-UUP
ALLSTOCKs
COIN (Bit
Coin ETF)
USO-CrudeOil DBO
BLDP FAS GLD HD IBB JETS JNUG KOL NAIL NUGT
NRGU OIH PALL RSX RETL SDS AGQ SLV SOXL TAN TECL TLT TMF TNA
UGA USO China: YINN CHAU
Commodities: CANE
CORN DBC JJC, NIB CORN, CUT (paper)
MOO, NRGU
SOYB WEAT UUP (Dollar) LIT
(Lithium) PALL
(Palladium)
Stocks AA AAPL ADBE ALXN AMAT AMGN AMD AMZN ANET AXON AXP
BA BABA BAC BIDU BLDP BSX CAT CDNS CHKP CNX CPB CRM CVX CMG
DE DIS ENPH FB FSLR FTNT GILD GME GOOG GS HD IBM INTU JPM KO KR
LRCX MRK MRNA MOS MSFT NEM NFLX NKE NOC NUE NVDA PANW PG PYPL
QCOM QDEL REGN REV RE SNOW SO SQUARE TSLA TXN XOM V VRTX WFC
WMT XLE ZM ZOM
Leveraged Short
ETFs:
FAZ - financials, TZA and SRTY- small caps, MZZ - mid caps, TECS -Techs,
SOXS -
semi-conductors LABD
- Biotechs
Bullish MAXCPs www.tigersoftware.com/UPPING/4-4-2023/Bullish.htm
Bearish MINCPs www.tigersoftware.com/Downing/4-4-2023/BEARISH.htm
|
|
 |
 |
 |
 |
Still Bullish Internals for QQQ
 |
Still Bullish Internals for TECL
 |
SOXL is weakening. Avoid.
 |
Bank stocks look like shorts.
 |
Buy FAZ as a hedge for QQQ or TECL.
 |
Gold is being bought as a hedge against more financial panic.
 |
SLV could be starting a run to 30, but JPM is known to short this
to bring it back down in consultation with FED.
 |
Weakness in Dollar reflects expectation of higher gold prices
and FED not raising rates more, one of whose consequences
is to strengthn Dollar.
 |
Table 1 - Daily Breadth and Volume Statistics
| NYSE |
Latest Close |
Previous
Close |
Week Ago |
| Issues
traded |
3,123 |
3,134 |
3,120 |
| Advances |
911 |
1,548 |
1,790 |
| Declines |
2,087 |
1,481 |
1,200 |
| Unchanged |
125 |
105 |
130 |
| New
highs |
48 |
58 |
27 |
| New
lows |
39 |
11 |
50 |
| Adv.
volume* |
258,113,620 |
492,784,737 |
501,895,077 |
| Decl.
volume* |
646,934,295 |
436,059,060 |
281,187,913 |
| Total
volume* |
912,176,579 |
940,718,545 |
791,396,707 |
| Closing
Arms (TRIN)† |
0.94 |
0.91 |
0.75 |
| Block
trades* |
4,473 |
4,444 |
4,362 |
| Adv.
volume |
1,326,085,898 |
2,238,539,743 |
2,655,927,953 |
| Decl.
volume |
2,865,893,913 |
1,939,208,341 |
1,326,672,814 |
| Total
volume |
4,227,803,625 |
4,234,700,104 |
4,014,608,229 |
| NASDAQ |
Latest Close |
Previous
Close |
Week Ago |
| Issues
traded |
4,682 |
4,722 |
4,678 |
| Advances |
1,374 |
2,124 |
1,947 |
| Declines |
3,114 |
2,374 |
2,516 |
| Unchanged |
194 |
224 |
215 |
| New
highs |
82 |
93 |
43 |
| New
lows |
233 |
130 |
147 |
| Closing
Arms (TRIN)† |
1.05 |
1.56 |
1.44 |
| Block
trades |
27,428 |
38,020 |
29,850 |
| Adv.
volume |
1,253,067,813 |
1,734,044,333 |
1,401,831,304 |
| Decl.
volume |
2,991,544,420 |
3,030,582,910 |
2,606,464,774 |
| Total
volume |
4,298,768,767 |
4,816,443,796 |
4,036,916,842 |
|
Table 2 QUICKSILVER on ETFS - 4/4/2023 ---
Bullish = 3 TECL(+.477), QQQ(+.292), GLD (.257)
Bearish = 3 FAS (-.334), RETL (-.294), OIH(.272)
ETF CLOSE CHANGE PIVOT-PT 5-dma AROC CL-PWR CANDLE IP21 ITRS POWER INDEX
================================================================================================
DIA 333.94 -1.97 327.08 153.7% ------- RED .102 ---- -----
---------------------------------------------------------------------------------------------
COMPQX 12126.33 -63.12 11926.24 170.7% Bullish RED .173 .074 .247
---------------------------------------------------------------------------------------------
SPY 408.67 -2.28 401.35 161.7% ------- RED .138 .027 .165
---------------------------------------------------------------------------------------------
QQQ 319.07 -1.08 312.72 189.5% Bullish RED .181 .111 .292
---------------------------------------------------------------------------------------------
MDY 450.53 -7.5 449.11 76.1% ------- RED -.103 -.039 -.142
---------------------------------------------------------------------------------------------
IWM 175.35 -3.13 175.42 53.9% Bearish RED -.129 -.057 -.186
---------------------------------------------------------------------------------------------
FAS 56.25 -1.78 56.28 207.6% Bearish RED -.019 -.315 -.334
---------------------------------------------------------------------------------------------
RETL 7.25 -.29 6.69 463.5% ------- RED -.079 -.215 -.294
---------------------------------------------------------------------------------------------
SOXL 16.79 -1.02 17.08 334.2% Bullish RED .051 .146 .197
---------------------------------------------------------------------------------------------
TECL 36.4 -.59 34.5 554.3% Bullish RED .139 .338 .477
---------------------------------------------------------------------------------------------
IBB 128.86 -.91 127.83 109.4% ------- RED .044 -.051 -.007
---------------------------------------------------------------------------------------------
GLD 187.98 3.44 182.53 123.7% Bullish BLUE .204 .053 .257
---------------------------------------------------------------------------------------------
DBO 15.19 -.01 14.16 330.9% Bullish RED .161 -.02 .141
---------------------------------------------------------------------------------------------
OIH 284.11 -9.39 277.38 161.7% Bearish RED -.17 -.102 -.272
---------------------------------------------------------------------------------------------
CPER 24.29 -.48 24.92 -116.4% Bearish RED .089 -.052 .037
---------------------------------------------------------------------------------------------
TAN 75.83 -.53 74.2 217.1% Bearish RED -.052 -.064 -.116
---------------------------------------------------------------------------------------------
UUP 27.64 -.11 27.91 -35.9% Bearish RED -.13 .012 -.118
---------------------------------------------------------------------------------------------
CORN 24.94 -.33 25.29 -69.3% ------- ---- -.12 -.04 -.16
---------------------------------------------------------------------------------------------
WEAT 7.05 -.08 7.16 -49.3% Bearish ---- -.135 -.028 -.163
---------------------------------------------------------------------------------------------
YINN 46.19 -.67 47.06 -72.6% Bullish BLUE .086 -.334 -.248
|
TABLE 3 RANKING OF KEY DIRECTORIES BASED PCT.OF STOCKS ABOVE 65-DMA
4/4/23
Bullish = 15
Bearish = 32
---------------------------------------------------------------------------------------
Directory Current day-1 day-2 day-3 day-4 day-5
----------------------------------------------------------------------------------------
GOLD .891 .891 .847 .826 .804 .847
BEVERAGE .785 .928 .785 .785 .857 .714
NIFTY .772 .84 .84 .772 .727 .636
HACKERS .687 .687 .812 .625 .562 .437
GAMING .684 .684 .736 .789 .684 .578
NASD-100 .67 .75 .77 .67 .65 .56
=====
HOMEBLDG .666 .722 .666 .666 .666 .666
=====
COMPUTER .65 .65 .6 .55 .45 .4
DOWJONES .6 .466 .4 .366 .366 .3
=====
MILITARY .576 .73 .576 .538 .5 .423
HIGHPRIC .571 .627 .619 .541 .51 .424
HOSPITAL .571 .571 .571 .5 .428 .357
SOFTWARE .571 .607 .589 .535 .553 .464
FOOD .551 .551 .387 .428 .387 .408
DJI-13 .538 .461 .307 .307 .307 .23
==============================================================================================
EDU .5 .5 .5 .333 0 0
UTILITY .5 .473 .473 .421 .342 .21
==============================================================================================
ETFS .49 .509 .509 .527 .4 .309
COMODITY .487 .538 .384 .435 .435 .435
SP-100 .466 .488 .455 .344 .277 .244
SEMI .457 .67 .702 .648 .627 .5
=====
INDEXES .454 .54 .491 .378 .313 .27
BONDFUND .436 .448 .528 .287 .218 .183
ELECTRON .436 .616 .631 .578 .548 .458
FIDSTKS .431 .473 .443 .355 .313 .254
RETAIL .425 .51 .425 .361 .319 .34
SP500 .41 .47 .457 .383 .336 .264
RUS-1000 .383 .451 .444 .366 .337 .278
=====
GUNS .357 .5 .428 .357 .357 .357
GREEN .333 .555 .5 .388 .388 .277
BIOTECH .322 .34 .342 .307 .302 .274
AUTO .32 .339 .396 .283 .264 .264
OILGAS .314 .447 .266 .209 .219 .2
INDMATER .291 .361 .347 .333 .305 .291
COPPER .285 .428 .428 .428 .428 .428
CHINA .272 .204 .227 .204 .136 .181
INFRA .272 .363 .333 .303 .303 .242
INSURANC .24 .32 .2 .16 .24 .12
LOWPRICE .234 .246 .234 .212 .186 .191
CHEM .232 .302 .279 .255 .209 .186
JETS .23 .23 .307 .307 .307 .153
MARIJUAN .2 .2 .1 .1 .1 .1
COAL .166 .5 .166 0 0 0
REIT .161 .161 .192 .146 .123 .1
TRANSP .157 .263 .368 .21 .21 .21
FINANCE .125 .125 .125 .087 .1 .075
SOLAR .125 .25 .375 .25 .312 .187
REGBANKS .024 .024 .048 .024 .024 .024
BIGBANKS 0 0 0 0 0 0
|
====================================================================================
Tuesday 4/4/2023: 5:55 AM Futures: DJI +24 NASDAQ +33
Data Used 4/3/2023
| |
4-3-2023
|
|
| |
The
DJI's speedy rise has sent it knifing up through the expected resistance-levels
represented by 32500
and the 65-dma. Now it looks like it may go right up past
the borken support (and
now resistance) at 33600. The quickness of the advance
has again, like last
October, meant the DJI has reached the upper 3.5% band. Last
October it did not even
hesitate to go higher. History suggests it may do the same
here. Let's see
if the Closing Powers for the major ETFs turn down. If they do,
the DJI should sink
back to its rising 21-day ma, after which it will probably turn
back up. .
The current Peerless
has not produced an S9 or a S12 even though the DJI is
at the 3.5% upper band
with the P-Indicator below zero and the IP21 (Accum. Index)
at zero. The
reason why we have no Sell S9 signal is because our market studies show
that there are too many
cases between March and June in the third years of the four
year Presidential cycle
where S9/S12s fail and prices keep rising until July or later.
Look at the cases
below. There were 9 instances where the DJI continued to rise
and only 5 cases where
there was a pullback to the lower band.
Bad S9 - 6/12/1935
.
Bad S12 - 6/24/1935
Bad S12 - 5/10/1939
Good S9 - 4/30/1951
Bad S9 - 6/7/1955
Bad S9 - 4/27/1959
Good S9 - 5/29/1959
Good S9 - 3/17/1967
Good S9 - 5/6/1987
Bad S9 - 6/8/1987
Bad S9 - 3/29/1999
Good S9 - 6/30/2011
Bad S9 - 6/11/2019
Let's continue to watch
for the Closing Power to turn down before selling the
tech ETFS. AAPL
and NVDA are theirleaders. They show no sign yet of
reversing.
OPEC says it will try
to restrict the supply of crude to get oil prices to go back
up. They may or
may not succeed. In any case, the recovery of oil prices so
far does not represent
a threat to the FED fight with inflation. But gold's rally
and new weakness in the
Dollar work would against a pause by the FED in raising
rates. The hope
of a pause by the FED is probably the main force behind the current
rally. So, we
must watch Gold. A big advance by it has often brought an
intermediate-term
decline.
Continuing Regional
bank weakness belies the Administration's proclamation
that there is no reason
for financial panic. So, we must also watch FAZ and the
regional banks shown in
the Bearish MINCPs. |
|
| |
Charts - 4/3/2023
2022 PEERLESS DJI, Signals, Indicators Daily DJI Volume
10-DayUp/Down Vol Stoch-20 CCI RSI Pct of All Stocks above 65-dma
Inverted Traders Index
DJI-IPA DJI-OBV Short-Term Rates
NASDAQ S&P OEX NYSE DJ-15 DJ-20 DJI-30
Tiger Index of Big
Banks Bond
Funds Gold Stocks
Housing Stocks
Insurance-Stocks
Regional Bnnls
Russell-1000
Semi Conductors
Recent 2006 vers-Peerless signals
http://tigersoftware.com/oldpeer/UPD90403.bmp
ETFs: DIA QQQ SPY IWM MDY
TNA Short-Term Rates Ten Year Rates PST (Short Treasuries)
DOLLAR-UUP
ALLSTOCKs
COIN (Bit
Coin ETF)
USO-CrudeOil DBO
BLDP FAS GLD HD IBB JETS JNUG KOL NAIL NUGT
NRGU OIH PALL RSX RETL SDS AGQ SLV SOXL TAN TECL TLT TMF TNA
UGA USO China: YINN CHAU
Commodities: CANE
CORN DBC JJC, NIB CORN, CUT (paper)
MOO, NRGU
SOYB WEAT UUP (Dollar) LIT
(Lithium) PALL
(Palladium)
Stocks AA AAPL ADBE ALXN AMAT AMGN AMD AMZN AXP BA BABA
BAC BIDU BLDP CAT CHKP CNX CPB CRM CVX CMG DE DIS ENPH FB FSLR
FTNT GILD GME GOOG GS HD IBM INTU JPM KO KR LRCX MRK MRNA
MOS MSFT NEM NFLX NKE NOC NUE NVDA PANW PG PYPL QCOM QDEL
REGN REV RE SO SQUARE TSLA TXN XOM V VRTX WFC WMT XLE ZM ZOM
New stocks added: 3/24/2023: ANET AXON BSX CDNS SQSP
3/29/2023: SNOW
TWL0
Leveraged Short
ETFs:
FAZ - financials, TZA and SRTY- small caps, MZZ - mid caps, TECS -Techs,
SOXS -
semi-conductors LABD
- Biotechs
Bullish MAXCPs www.tigersoftware.com/UPPING/4-3-2023/Bullish.htm
Bearish MINCPs www.tigersoftware.com/Downing/4-3-2023/BEARISH.htm
|
|
 |
 |
 ---------------------------------------------------------------------------------------------------------------------------

|
 |
 |
 |
 |
 |
 |
 |
 |
 |
 |
 |
| NYSE |
Latest Close |
Previous
Close |
Week Ago |
| Issues
traded |
3,134 |
3,104 |
3,137 |
| Advances |
1,548 |
2,506 |
2,235 |
| Declines |
1,481 |
506 |
787 |
| Unchanged |
105 |
92 |
115 |
| New
highs |
58 |
64 |
34 |
| New
lows |
11 |
19 |
34 |
| Adv.
volume* |
492,784,737 |
965,090,955 |
690,906,576 |
| Decl.
volume* |
436,059,060 |
172,727,075 |
197,460,300 |
| Total
volume* |
940,718,545 |
1,154,381,937 |
904,402,261 |
| Closing
Arms (TRIN)† |
0.91 |
1.10 |
0.84 |
| Block
trades* |
4,444 |
5,020 |
4,233 |
| Adv.
volume |
2,238,539,743 |
3,649,452,174 |
3,200,264,369 |
| Decl.
volume |
1,939,208,341 |
809,243,166 |
950,586,338 |
| Total
volume |
4,234,700,104 |
4,525,122,338 |
4,233,540,874 |
| NASDAQ |
Latest Close |
Previous
Close |
Week Ago |
| Issues
traded |
4,722 |
4,652 |
4,718 |
| Advances |
2,124 |
3,151 |
2,648 |
| Declines |
2,374 |
1,298 |
1,832 |
| Unchanged |
224 |
203 |
238 |
| New
highs |
93 |
95 |
63 |
| New
lows |
130 |
142 |
147 |
| Closing
Arms (TRIN)† |
1.56 |
0.72 |
1.86 |
| Block
trades |
38,020 |
45,346 |
31,362 |
| Adv.
volume |
1,734,044,333 |
4,222,185,793 |
1,867,148,229 |
| Decl.
volume |
3,030,582,910 |
1,244,925,842 |
2,408,885,349 |
| Total
volume |
4,816,443,796 |
5,521,158,462 |
4,330,326,796 |
|
Table 2 QUICKSILVER on ETFS - 4/3/2023 ---
Bullish = 3 TECL(+.554), SOXL (+.434), QQQ(+.28),
Bearish = 2 FAS (-.295). YINN (-.288)
ETF CLOSE CHANGE PIVOT-PT 5-dma AROC CL-PWR CANDLE IP21 ITRS POWER INDEX
================================================================================================
DIA 335.91 3.29 323.81 177.2% ------- BLUE .095 ----- -----
---------------------------------------------------------------------------------------------
COMPQX 12189.45 -32.46 11716.08 176.3% Bullish BLUE .146 .087 .233
---------------------------------------------------------------------------------------------
SPY 410.95 1.56 395.6 180.2% Bullish BLUE .125 .031 .156
---------------------------------------------------------------------------------------------
QQQ 320.15 -.78 307.12 181.9% Bullish BLUE .154 .126 .28
---------------------------------------------------------------------------------------------
MDY 458.03 -.38 443.65 169% ------- RED -.117 -.024 -.141
---------------------------------------------------------------------------------------------
IWM 178.48 .08 173.45 136.4% ------- RED -.125 -.042 -.167
---------------------------------------------------------------------------------------------
FAS 58.03 .36 53.91 361.9% ------- BLUE -.012 -.283 -.295
---------------------------------------------------------------------------------------------
RETL 7.54 .16 6.6 817.4% ------- BLUE -.086 -.125 -.211
---------------------------------------------------------------------------------------------
SOXL 17.81 -.49 15.63 541.6% Bullish RED .048 .386 .434
---------------------------------------------------------------------------------------------
TECL 36.99 -.19 32.48 583.1% Bullish BLUE .116 .438 .554
---------------------------------------------------------------------------------------------
IBB 129.77 .61 126.06 146.9% ------- BLUE .036 -.049 -.013
---------------------------------------------------------------------------------------------
GLD 184.54 1.32 183.44 70.7% Bullish BLUE .144 .023 .167
---------------------------------------------------------------------------------------------
DBO 15.2 .63 14.23 370.8% ------- ---- .206 -.029 .177
---------------------------------------------------------------------------------------------
OIH 293.5 16.37 275.07 453.2% ------- RED -.151 -.091 -.242
---------------------------------------------------------------------------------------------
CPER 24.77 -.17 24.87 -42.1% ------- RED .113 -.051 .062
---------------------------------------------------------------------------------------------
TAN 76.36 -1.27 72.56 230.5% Bearish RED -.027 -.046 -.073
---------------------------------------------------------------------------------------------
UUP 27.75 -.13 27.84 -34.1% Bearish RED -.085 .005 -.08
---------------------------------------------------------------------------------------------
CORN 25.27 .04 25.29 4% ------- RED -.053 -.053 -.106
---------------------------------------------------------------------------------------------
WEAT 7.13 .07 7.12 21.1% Bearish RED -.152 -.06 -.212
---------------------------------------------------------------------------------------------
YINN 46.86 -.65 46.88 541.6% Bullish RED .03 -.317 -.287
|
Table 3 RANKING OF KEY DIRECTORIES BASED PCT.OF STOCKS ABOVE 65-DMA
4/3/23
Bullish = 20
Bearish = 26
---------------------------------------------------------------------------------------
Directory Current day-1 day-2 day-3 day-4 day-5
----------------------------------------------------------------------------------------
BEVERAGE .928 .785 .785 .857 .714 .714
GOLD .891 .847 .826 .804 .847 .739
NIFTY .84 .84 .772 .727 .636 .681
NASD-100 .75 .77 .67 .65 .56 .56
MILITARY .73 .576 .538 .5 .423 .384
HOMEBLDG .722 .666 .666 .666 .666 .666
HACKERS .687 .812 .625 .562 .437 .5
GAMING .684 .736 .736 .736 .631 .578
SEMI .67 .702 .648 .627 .5 .553
COMPUTER .65 .6 .55 .45 .4 .45
HIGHPRIC .627 .619 .541 .51 .432 .432
ELECTRON .616 .631 .578 .548 .451 .488
SOFTWARE .607 .607 .535 .553 .464 .517
HOSPITAL .571 .571 .5 .428 .357 .285
GREEN .555 .5 .388 .388 .277 .277
FOOD .551 .408 .408 .387 .408 .408
INDEXES .54 .491 .378 .313 .275 .27
COMODITY .538 .41 .41 .435 .435 .435
RETAIL .51 .425 .361 .319 .34 .297
ETFS .509 .509 .527 .4 .327 .272
===================================================================================================
COAL .5 .166 0 0 0 0
EDU .5 .5 .333 0 0 .333
GUNS .5 .428 .357 .357 .357 .357
==================================================================================================
SP-100 .488 .455 .344 .277 .244 .277
FIDSTKS .473 .443 .355 .313 .254 .278
UTILITY .473 .473 .421 .342 .21 .21
SP500 .47 .457 .386 .332 .275 .254
DOWJONES .466 .4 .366 .366 .3 .333
=====
DJI-13 .461 .307 .307 .307 .23 .23
RUS-1000 .451 .444 .366 .337 .285 .265
=====
BONDFUND .448 .528 .287 .218 .195 .16
OILGAS .447 .266 .209 .219 .2 .123
COPPER .428 .428 .428 .428 .428 .428
INFRA .363 .333 .303 .303 .242 .212
INDMATER .361 .347 .333 .305 .305 .263
BIOTECH .34 .34 .309 .302 .274 .259
AUTO .339 .415 .283 .264 .264 .207
INSURANC .32 .2 .16 .24 .12 .12
CHEM .302 .279 .255 .209 .209 .162
TRANSP .263 .368 .21 .21 .21 .21
SOLAR .25 .375 .25 .312 .187 .187
LOWPRICE .246 .237 .214 .186 .2 .203
JETS .23 .307 .307 .307 .153 .076
CHINA .204 .227 .204 .136 .159 .181
MARIJUAN .2 .1 .1 .1 .1 .1
REIT .161 .184 .153 .13 .092 .107
FINANCE .125 .125 .087 .087 .075 .075
REGBANKS .024 .048 .024 .024 .024 0
BIGBANKS 0 0 0 0 0 0
|
====================================================================================
Monday 4/3/2023: 1:40 AM Futures: DJI +68 NASDAQ
-97 Data Used 3/31/2023
| |
3/31/2023
|
|
| |
The DJI has
moved up just above its now rising 65-dma. That was our target unless
Peerless gave a new Buy
signal, which has did not. It is now 2.5% above its 21-dma
with the Tiger Accumulation
Index and P-Indicator slightly positive, thereby avoiding
a Sell S9 or S12 on Friday.
Since the year 2000, the DJI's reaching a rising 21-dma
with the P-I and IP21 just
barely positive, brings a re-testing of the lower band in at
least 2/3 of its cases.
So, we should probably take some profits. I recommended
buying SNOW and TWLO because
I expected higher prices from the market as
a whole (The DJI had just got
back above 32500.) and because the short-term
Stochastic (5-day) signals
have worked particularly well these two stocks this past year.
They have both made nice
short-term runs this past week. That was all I expected,
so they can be sold now.
The tech ETFs still show very
positive internals and the DJI's Closing Power is
rising. Let's wait for
the DJI's Closing Power to turn down before selling QQQ
or TECL and before buying
FAZ, as a short on the weakest sector, financials.
Look at the DJI chart.
See the congested area of trading just above 33550. It
will surprising if the DJI
can rise back above that level without a puulback. But
April in the third year of
the 4-year Presidential cycle is ordinarily quite bullish.
Since 1967, the DJI has risen
80% of the time in the month after April 3rd and
gained 4% on average.
So, let's let Professionals tell us when to sell by having
Closing Power of DIA turn
down. |
|
| |
Charts - 3/31/2023
2022 PEERLESS DJI, Signals, Indicators Daily DJI Volume
10-DayUp/Down Vol Stoch-20 CCI RSI Pct of All Stocks above 65-dma
Inverted Traders Index
DJI-IPA DJI-OBV Short-Term Rates
NASDAQ S&P OEX NYSE DJ-15 DJ-20 DJI-30
Tiger Index of Big
Banks Bond
Funds Gold Stocks
Housing Stocks
Insurance-Stocks
Regional Bnnls
Russell-1000
Semi Conductors
Recent 2006 vers-Peerless signals
http://www.tigersoftware.com/OLDPEER/UPD90331.bmp
ETFs: DIA QQQ SPY IWM MDY
TNA Short-Term Rates Ten Year Rates PST (Short Treasuries)
DOLLAR-UUP
ALLSTOCKs
COIN (Bit
Coin ETF)
USO-CrudeOil DBO
BLDP FAS GLD HD IBB JETS JNUG KOL NAIL NUGT
NRGU OIH PALL RSX RETL SDS AGQ SLV SOXL TAN TECL TLT TMF TNA
UGA USO China: YINN CHAU
Commodities: CANE
CORN DBC JJC, NIB CORN, CUT (paper)
MOO, NRGU
SOYB WEAT UUP (Dollar) LIT
(Lithium) PALL
(Palladium)
Stocks AA AAPL ADBE ALXN AMAT AMGN AMD AMZN AXP BA BABA
BAC BIDU BLDP CAT CHKP CNX CPB CRM CVX CMG DE DIS ENPH FB FSLR
FTNT GILD GME GOOG GS HD IBM INTU JPM KO KR LRCX MRK MRNA
MOS MSFT NEM NFLX NKE NOC NUE NVDA PANW PG PYPL QCOM QDEL
REGN REV RE SO SQUARE TSLA TXN XOM V VRTX WFC WMT XLE ZM ZOM
New stocks added: 3/24/2023: ANET AXON BSX CDNS SQSP
3/29/2023: SNOW
TWL0
Leveraged Short
ETFs:
FAZ - financials, TZA and SRTY- small caps, MZZ - mid caps, TECS -Techs,
SOXS -
semi-conductors LABD
- Biotechs
Bullish MAXCPs www.tigersoftware.com/UPPING/3-31-2023/Bullish.htm
Bearish MINCPs www.tigersoftware.com/Downing/3-31-2023/BEARISH.htm
|
|
 |
 |
 |
 |
 |
 |
 |
 |
 |
 |
 |
 |
Table 1 -
Daily Breadth and Volume Statistics
| NYSE |
Latest Close |
Previous
Close |
Week Ago |
| Issues
traded |
3,104 |
3,112 |
3,121 |
| Advances |
2,506 |
2,096 |
1,863 |
| Declines |
506 |
924 |
1,134 |
| Unchanged |
92 |
92 |
124 |
| New
highs |
64 |
44 |
23 |
| New
lows |
19 |
16 |
260 |
| Adv.
volume* |
965,090,955 |
528,118,888 |
625,603,537 |
| Decl.
volume* |
172,727,075 |
262,100,656 |
327,262,952 |
| Total
volume* |
1,154,381,937 |
796,836,328 |
970,636,038 |
| Closing
Arms (TRIN)† |
1.10 |
1.09 |
0.99 |
| Block
trades* |
5,020 |
4,142 |
4,487 |
| Adv.
volume |
3,649,452,174 |
2,630,491,036 |
2,796,189,248 |
| Decl.
volume |
809,243,166 |
1,268,992,220 |
1,680,272,501 |
| Total
volume |
4,525,122,338 |
3,930,865,429 |
4,583,971,376 |
| NASDAQ |
Latest Close |
Previous
Close |
Week Ago |
| Issues
traded |
4,652 |
4,630 |
4,647 |
| Advances |
3,151 |
2,380 |
2,458 |
| Declines |
1,298 |
2,051 |
1,952 |
| Unchanged |
203 |
199 |
237 |
| New
highs |
95 |
75 |
42 |
| New
lows |
142 |
153 |
333 |
| Closing
Arms (TRIN)† |
0.72 |
0.80 |
1.14 |
| Block
trades |
45,346 |
38,009 |
27,865 |
| Adv.
volume |
4,222,185,793 |
2,778,645,451 |
2,210,395,156 |
| Decl.
volume |
1,244,925,842 |
1,914,835,135 |
2,009,004,403 |
| Total
volume |
5,521,158,462 |
4,738,884,353 |
4,363,658,173 |
|
Table 2 QUICKSILVER on ETFS - 3/31/2023 ---
Bullish = 3 COMPQX(.266), TECL(+.677), SOXL (+.620), QQQ (+.324)
Bearish = 2 FAS (-.266)
ETF CLOSE CHANGE PIVOT-PT 5-dma AROC CL-PWR CANDLE IP21 ITRS POWER INDEX
================================================================================================
DIA 332.62 4.14 324.31 158.4% ------- BLUE .097 0 ----
---------------------------------------------------------------------------------------------
COMPQX 12221.91 208.44 11768.84 167.9% Bullish BLUE .146 .12 .266
---------------------------------------------------------------------------------------------
SPY 409.39 5.69 396.49 171.1% Bullish BLUE .137 .047 .184
---------------------------------------------------------------------------------------------
QQQ 320.93 5.25 308.76 161.4% Bullish BLUE .164 .16 .324
---------------------------------------------------------------------------------------------
MDY 458.41 7.99 442.86 224.1% ------- BLUE -.081 -.007 -.088
---------------------------------------------------------------------------------------------
IWM 178.4 3.22 173.7 190% ------- BLUE -.113 -.026 -.139
---------------------------------------------------------------------------------------------
FAS 57.67 1.81 54.01 535.1% Bearish BLUE -.012 -.254 -.266
---------------------------------------------------------------------------------------------
RETL 7.38 .53 6.43 758.7% ------- BLUE -.097 -.079 -.176
---------------------------------------------------------------------------------------------
SOXL 18.3 .35 15.97 519.8% Bullish BLUE .071 .549 .62
---------------------------------------------------------------------------------------------
TECL 37.18 1.52 32.96 509.4% Bullish BLUE .118 .559 .677
---------------------------------------------------------------------------------------------
IBB 129.16 1.93 126.03 129.9% ------- BLUE .016 -.042 -.026
---------------------------------------------------------------------------------------------
GLD 183.22 -.96 181.95 -11.7% Bullish RED .154 .012 .166
---------------------------------------------------------------------------------------------
DBO 14.57 .21 14.14 369.2% ------- BLUE .238 -.06 .178
---------------------------------------------------------------------------------------------
OIH 277.13 2.83 268.62 365% ------- BLUE -.113 -.129 -.242
---------------------------------------------------------------------------------------------
CPER 24.94 -.18 24.98 20% Bullish ---- .13 -.038 .092
---------------------------------------------------------------------------------------------
TAN 77.63 1.88 72.92 315.5% ------- BLUE .029 -.01 .019
---------------------------------------------------------------------------------------------
UUP 27.88 .1 27.94 -26.9% Bearish ---- -.098 .009 -.089
---------------------------------------------------------------------------------------------
CORN 25.23 .07 25.25 71.5% Bullish BLUE -.005 -.054 -.059
---------------------------------------------------------------------------------------------
WEAT 7.06 .01 7.1 21.2% Bearish ---- -.144 -.06 -.204
---------------------------------------------------------------------------------------------
YINN 47.51 -1.87 41.82 305.6% Bullish RED .053 -.257 -.204
|
Table 3 RANKING OF KEY DIRECTORIES BASED PCT.OF STOCKS ABOVE 65-DMA
3/31/23
Bullish = 16
Bearish = 31
---------------------------------------------------------------------------------------
Directory Current day-1 day-2 day-3 day-4 day-5
----------------------------------------------------------------------------------------
GOLD .847 .826 .804 .847 .739 .695
NIFTY .84 .772 .727 .636 .681 .681
HACKERS .812 .625 .562 .437 .5 .5
BEVERAGE .785 .785 .857 .714 .714 .714
NASD-100 .77 .67 .65 .56 .56 .57
GAMING .736 .736 .684 .684 .578 .473
SEMI .702 .648 .627 .5 .542 .574
HOMEBLDG .666 .666 .666 .666 .666 .666
ELECTRON .631 .578 .548 .451 .488 .496
HIGHPRIC .619 .541 .51 .432 .437 .424
SOFTWARE .607 .553 .553 .464 .517 .482
COMPUTER .6 .55 .45 .4 .45 .45
MILITARY .576 .538 .5 .423 .423 .307
HOSPITAL .571 .5 .428 .357 .357 .142
BONDFUND .528 .287 .218 .195 .183 .195
ETFS .509 .527 .4 .327 .309 .2
----------------------------------------------------------------------------------------------
EDU .5 .333 0 0 .333 0
GREEN .5 .388 .388 .277 .277 .277
==============================================================================================
INDEXES .491 .378 .313 .275 .27 .297
UTILITY .473 .421 .342 .21 .21 .184
SP500 .457 .386 .334 .271 .26 .252
SP-100 .455 .344 .277 .244 .277 .255
RUS-1000 .444 .366 .337 .285 .268 .254
FIDSTKS .443 .355 .313 .254 .278 .266
COPPER .428 .428 .428 .428 .428 .285
GUNS .428 .357 .357 .357 .357 .285
RETAIL .425 .361 .319 .34 .297 .276
AUTO .415 .301 .264 .264 .207 .169
COMODITY .41 .435 .41 .435 .435 .41
FOOD .408 .428 .367 .408 .408 .367
DOWJONES .4 .366 .366 .3 .333 .3
SOLAR .375 .25 .312 .187 .187 .187
TRANSP .368 .21 .21 .21 .21 .105
INDMATER .347 .333 .305 .305 .277 .222
BIOTECH .34 .307 .304 .274 .264 .256
INFRA .333 .303 .303 .242 .212 .181
DJI-13 .307 .307 .307 .23 .23 .23
JETS .307 .307 .307 .153 .076 0
CHEM .279 .255 .209 .209 .186 .139
OILGAS .266 .209 .219 .2 .123 .104
LOWPRICE .237 .217 .189 .2 .203 .2
CHINA .227 .204 .136 .159 .181 .204
INSURANC .2 .16 .24 .12 .12 .12
REIT .184 .146 .138 .1 .1 .107
COAL .166 0 0 0 0 0
FINANCE .125 .087 .087 .062 .075 .087
MARIJUAN .1 .1 .1 .1 .1 0
REGBANKS .048 .024 .024 .024 0 0
BIGBANKS 0 0 0 0 0 0
|
====================================================================================
Friday 3/31/2023: 5:50 AM Futures: DJI +123 NASDAQ +29 Data Used
3/30/2023
| |
3/30/2023
|
|
| |
The DJI still
looks like it is headed towards its red 65-dma at 33200, about
a percent higher. It
seems like it will have to reach it early in the day or at the
opening because its Closing
Power still has not turned up. A Sell S9 at the 2.4%
upper band is still a
possibility, too. But, the NYSE A/D Line is advancing well now,
so we can't be sure if we
will get a Sell S9. The NASDAQ also has about
one percent left in its rally
before i t reaches the resistance from its pervious high
The real strength has been in
tech stocks. See below in their ITRS reaching
how the QQQ, SOXL and TECL
are siginicantly outperforming the DJI. With
the help of INTC, which broke
out from its base today, semi-conductors are
challenging their previous
highs, as are QQQ and TECL. The internals for
these ETFs are bullishly
rising, but they now need price breakouts to clear the
way for a bigger advance.
Some profit-taking in them on a Friday would not be
surprising, but their Closing
Powers are still rising and that is our key now.
The underlying problems for
the markets remain the rising interest rates
and the dangerous
underpinnings of regional banks which are holding long-term
bonds that are alltogether
show paper losses of more than a trillion dollars
because of the rapid rise in
interest rates. Today, the Tiger-Regional Bank
index turned sharply lower.
The leveraged short on financials, FAZ, is holding
at tis lows and is inviting
us to buy it while holding TECL or SOXL lomg.
This has been a great way to
hedge the market ever since the Sell S10. That
it may still work well is
seen by how close GS (shown below) is to
breaking down again and also
how strong Gold is now, acting as a warning
that the recent financial
panic may be far from over. We will hold off on
buying FAZ until we see what
the weekend brings. |
|
| |
Charts - 3/30/2023
2022 PEERLESS DJI, Signals, Indicators Daily DJI Volume
10-DayUp/Down Vol Stoch-20 CCI RSI Pct of All Stocks above 65-dma
Inverted Traders Index
DJI-IPA DJI-OBV Short-Term Rates
NASDAQ S&P OEX NYSE DJ-15 DJ-20 DJI-30
Tiger Index of Big
Banks Bond
Funds Gold Stocks
Housing Stocks
Insurance-Stocks
Regional Bnnls
Russell-1000
Semi Conductors
Recent 2006 vers-Peerless signals
http://www.tigersoftware.com/OLDPEER/UPD90330.bmp
ETFs: DIA QQQ SPY IWM MDY
TNA Short-Term Rates Ten Year Rates PST (Short Treasuries)
DOLLAR-UUP
ALLSTOCKs
COIN (Bit
Coin ETF)
USO-CrudeOil DBO
BLDP FAS GLD HD IBB JETS JNUG KOL NAIL NUGT
NRGU OIH PALL RSX RETL SDS AGQ SLV SOXL TAN TECL TLT TMF TNA
UGA USO China: YINN CHAU
Commodities: CANE
CORN DBC JJC, NIB CORN, CUT (paper)
MOO, NRGU
SOYB WEAT UUP (Dollar) LIT
(Lithium) PALL
(Palladium)
Stocks AA AAPL ADBE ALXN AMAT AMGN AMD AMZN AXP BA BABA
BAC BIDU BLDP CAT CHKP CNX CPB CRM CVX CMG DE DIS ENPH FB FSLR
FTNT GILD GME GOOG GS HD IBM INTU JPM KO KR LRCX MRK MRNA
MOS MSFT NEM NFLX NKE NOC NUE NVDA PANW PG PYPL QCOM QDEL
REGN REV RE SO SQUARE TSLA TXN XOM V VRTX WFC WMT XLE ZM ZOM
New stocks added: 3/24/2023: ANET AXON BSX CDNS SQSP
3/29/2023: SNOW
TWL0
Leveraged Short
ETFs:
FAZ - financials, TZA and SRTY- small caps, MZZ - mid caps, TECS -Techs,
SOXS -
semi-conductors LABD
- Biotechs
Bullish MAXCPs www.tigersoftware.com/UPPING/3-30-2023/Bullish.htm
Bearish MINCPs www.tigersoftware.com/Downing/3-30-2023/BEARISH.htm
|
|
 |
DIA's Closing Power is not yet rising.
 |
NASDAQ is outperforming DJI by 10.9% over last 50 trading days
 |
Breakout here would be bullish.
 |
 |
 |
 |
 |
 |
 |
 |
Table 1 - Daily Breadth and Volume Statistics
| NYSE |
Latest Close |
Previous
Close |
Week Ago |
| Issues
traded |
3,112 |
3,127 |
3,136 |
| Advances |
2,096 |
2,389 |
1,080 |
| Declines |
924 |
635 |
1,931 |
| Unchanged |
92 |
103 |
125 |
| New
highs |
44 |
41 |
31 |
| New
lows |
16 |
20 |
212 |
| Adv.
volume* |
528,118,888 |
765,954,200 |
365,244,514 |
| Decl.
volume* |
262,100,656 |
119,435,289 |
694,836,983 |
| Total
volume* |
796,836,328 |
892,340,980 |
1,067,623,416 |
| Closing
Arms (TRIN)† |
1.09 |
0.63 |
0.94 |
| Block
trades* |
4,142 |
4,370 |
4,968 |
| Adv.
volume |
2,630,491,036 |
3,528,207,127 |
1,846,853,338 |
| Decl.
volume |
1,268,992,220 |
588,148,294 |
3,110,729,359 |
| Total
volume |
3,930,865,429 |
4,145,256,202 |
4,991,607,675 |
| NASDAQ |
Latest Close |
Previous
Close |
Week Ago |
| Issues
traded |
4,630 |
4,700 |
4,648 |
| Advances |
2,380 |
3,044 |
2,117 |
| Declines |
2,051 |
1,443 |
2,326 |
| Unchanged |
199 |
213 |
205 |
| New
highs |
75 |
68 |
57 |
| New
lows |
153 |
143 |
314 |
| Closing
Arms (TRIN)† |
0.80 |
0.33 |
0.79 |
| Block
trades |
38,009 |
33,583 |
32,908 |
| Adv.
volume |
2,778,645,451 |
3,845,388,807 |
2,597,768,328 |
| Decl.
volume |
1,914,835,135 |
594,341,468 |
2,254,885,764 |
| Total
volume |
4,738,884,353 |
4,493,545,035 |
4,917,466,613 |
|
Table 2 QUICKSILVER on ETFS - 3/30/2023 ---
Bullish = 3 TECL(+.572), SOXL (+.479), QQQ (+.303)
Bearish = 2 FAS (-.325), RETL (-.332)
ETF CLOSE CHANGE PIVOT-PT 5-dma AROC CL-PWR CANDLE IP21 ITRS POWER INDEX
================================================================================================
DIA 328.48 1.4 322.32 118% Bearish RED .091 0 =====
---------------------------------------------------------------------------------------------
COMPQX 12013.47 87.23 11823.96 95.8% Bullish BLUE .137 .11 .247
---------------------------------------------------------------------------------------------
SPY 403.7 2.35 395.75 132.8% Bullish RED .125 .045 .17
---------------------------------------------------------------------------------------------
QQQ 315.68 2.96 310.89 95.7% Bullish BLUE .153 .15 .303
---------------------------------------------------------------------------------------------
MDY 450.42 1.31 438.47 175.9% Bearish RED -.097 -.015 -.112
---------------------------------------------------------------------------------------------
IWM 175.18 -.24 171.79 142.5% Bearish RED -.132 -.033 -.165
---------------------------------------------------------------------------------------------
FAS 55.86 -.42 51.85 363.8% Bearish RED -.041 -.284 -.325
---------------------------------------------------------------------------------------------
RETL 6.85 .16 6.38 424.4% Bearish ---- -.157 -.175 -.332
---------------------------------------------------------------------------------------------
SOXL 17.95 .87 16.57 139% Bullish BLUE .065 .414 .479
---------------------------------------------------------------------------------------------
TECL 35.66 1.16 33.73 320% Bullish BLUE .109 .463 .572
---------------------------------------------------------------------------------------------
IBB 127.23 -.6 125.87 114.3% ------- RED .018 -.046 -.028
---------------------------------------------------------------------------------------------
GLD 184.18 1.65 183.65 -42.5% Bullish BLUE .175 .054 .229
---------------------------------------------------------------------------------------------
DBO 14.36 .2 13.53 301.8% Bullish BLUE .216 -.039 .177
---------------------------------------------------------------------------------------------
OIH 274.3 -3.08 257.38 292.8% ------- RED -.085 -.12 -.205
---------------------------------------------------------------------------------------------
CPER 25.12 .2 24.84 32.1% Bullish ---- .14 -.004 .136
---------------------------------------------------------------------------------------------
TAN 75.75 1.55 72.98 148.1% ------- RED .055 -.06 -.005
---------------------------------------------------------------------------------------------
UUP 27.78 -.13 28.03 -14.3% ------- ---- -.153 .022 -.131
---------------------------------------------------------------------------------------------
CORN 25.16 -.13 24.87 151.9% ------- RED -.029 -.045 -.074
---------------------------------------------------------------------------------------------
WEAT 7.05 -.11 7.03 234.8% Bearish RED -.173 -.048 -.221
---------------------------------------------------------------------------------------------
YINN 49.38 2.32 44.7 477.8% Bullish BLUE .122 -.16 -.038
|
Table 3 RANKING OF KEY DIRECTORIES BASED PCT.OF STOCKS ABOVE 65-DMA
3/30/23
---------------------------------------------------------------------------------------
Directory Current day-1 day-2 day-3 day-4 day-5
----------------------------------------------------------------------------------------
GOLD .826 .804 .847 .739 .695 .673
=====
BEVERAGE .785 .857 .714 .714 .714 .5
NIFTY .772 .727 .636 .681 .681 .636
GAMING .736 .684 .631 .631 .473 .421
NASD-100 .67 .65 .56 .56 .58 .55
-----
HOMEBLDG .666 .666 .666 .666 .666 .666
SEMI .648 .627 .5 .542 .563 .617
-----
HACKERS .625 .562 .437 .5 .5 .5
ELECTRON .578 .548 .451 .488 .488 .511
SOFTWARE .553 .571 .464 .517 .482 .446
COMPUTER .55 .45 .4 .45 .45 .45
HIGHPRIC .541 .51 .432 .437 .428 .367
MILITARY .538 .5 .423 .423 .307 .192
ETFS .527 .4 .327 .309 .218 .254
==============================================================================================
HOSPITAL .5 .428 .357 .357 .214 .214
==============================================================================================
COMODITY .435 .435 .41 .435 .41 .41
COPPER .428 .428 .428 .428 .285 .285
FOOD .428 .387 .387 .408 .367 .367
UTILITY .421 .342 .21 .21 .184 .078
GREEN .388 .388 .277 .277 .277 .277
SP500 .386 .334 .273 .256 .258 .213
=====
INDEXES .378 .313 .275 .27 .297 .302
DOWJONES .366 .366 .3 .333 .3 .266
=====
RUS-1000 .366 .337 .285 .268 .257 .226
=====
RETAIL .361 .319 .34 .297 .276 .234
GUNS .357 .357 .357 .357 .285 .214
FIDSTKS .355 .313 .254 .278 .266 .224
SP-100 .344 .277 .244 .277 .255 .233
EDU .333 0 0 .333 0 0
INDMATER .333 .305 .305 .277 .222 .208
BIOTECH .308 .303 .277 .264 .259 .249
DJI-13 .307 .307 .23 .23 .23 .153
JETS .307 .307 .153 .076 0 0
INFRA .303 .303 .242 .212 .181 .181
AUTO .301 .283 .264 .207 .169 .188
BONDFUND .287 .218 .195 .183 .206 .149
CHEM .255 .209 .209 .186 .139 .116
SOLAR .25 .312 .187 .187 .187 .187
LOWPRICE .217 .191 .203 .203 .203 .177
TRANSP .21 .21 .21 .21 .105 .105
OILGAS .209 .219 .2 .123 .104 .114
CHINA .204 .136 .159 .181 .204 .204
INSURANC .16 .24 .12 .12 .12 .08
REIT .146 .13 .107 .107 .1 .084
MARIJUAN .1 .1 .1 .1 0 0
FINANCE .087 .087 .062 .062 .087 .087
REGBANKS .024 .024 .024 0 0 0
BIGBANKS 0 0 0 0 0 0
COAL 0 0 0 0 0 0
|
====================================================================================
Thursday 3/30/2023: 5:42 AM Futures: DJI +182 NASDAQ +73 Data Used
3/29/2023
| |
3/29/2023
|
|
| |
The Sell S10 has not stopped the DJI from rallying back above the point
of
breakdown 32500. When this happens, the most a valid Sell S10 can
allow is a
rally to its 65-dma. At that point, a serious reversal down "should"
then occur.
But a close above the 65-dma with a break in the NYSE A/D Line
downtrend,.
which could take place tomorrow, would have to negate the
Sell S10 as
a false breakdown. This is mostly academic, at this point, if
you have
followed the suggestions here to be hedged by buying some
MAXCPs and
closing out FAZ and our REIT short-sales.
DJI has
risen back to its price-downtrendline and the level that stopped the
last rally.
NYSE breadth has improved substantially and the NYSE A/D Line has
reached its
downtrendline, but the P-I is still negative. A break in the down-trendline
would give
the rally a good boost. So will a break in the price downtrend of the
SP-500 and
SPY, which also could come tomorrow.
DIA's
Closing Power is classified as bearish, but a strong close today (Thursday)
could turn
it bullishly up. The DJI has been held back by its banking components
and the
weakness in its most heavily weighted component, UNH. See below.
FAZ, which
is the bearish ETF for financials is at its support. A turn-around back
up by it
would be a warning that the DJI is apt to stall out near 33300, about
1.5%
higher, where its 65-dma is. As usual, we will probably depend upon
our DIA and
SPY Closing Powers to turn back down to tell us when Professionals
have
decided the present rally is over.
Watch the
NASDAQ which is still below its price down-trendline, but shows
higher
relative strength than the DJI and also has a rising Closing Power. QQQ,
TECL and
SOXL have not broken out to new highs, but their ITRS-Relatve
Strength
readings show they are much stronger than the DJI.
This week's
Congressional hearings have failed to put much heat on the FED for
its failure
in oversight of the banks that have recently failed. This must be contrued
as part of
the reason for this week's rally. The media credits the rally to a growing
belief that
the "run" on banks is over and "big money" need not worry. It
can
also be
ascribed to how bullish April tends to be in the years before Presidential
Elections.
Our data since 1967, shows the DJI rallies 86.7% of the time in April
in third
years of the Presidential Four Year Cycle and shows an average gain
of 3%. |
|
| |
Charts - 3/29/2023
2022 PEERLESS DJI, Signals, Indicators Daily DJI Volume
10-DayUp/Down Vol Stoch-20 CCI RSI Pct of All Stocks above 65-dma
Inverted Traders Index
DJI-IPA DJI-OBV Short-Term Rates
NASDAQ S&P OEX NYSE DJ-15 DJ-20 DJI-30
Tiger Index of Big
Banks Bond
Funds Gold Stocks
Housing Stocks
Insurance-Stocks
Regional Bnnls
Russell-1000
Semi Conductors
Recent 2006 vers-Peerless signals
http://www.tigersoftware.com/OLDPEER/UPD90329.bmp
ETFs: DIA QQQ SPY IWM MDY
TNA Short-Term Rates Ten Year Rates PST (Short Treasuries)
DOLLAR-UUP
ALLSTOCKs
COIN (Bit
Coin ETF)
USO-CrudeOil DBO
BLDP FAS GLD HD IBB JETS JNUG KOL NAIL NUGT
NRGU OIH PALL RSX RETL SDS AGQ SLV SOXL TAN TECL TLT TMF TNA
UGA USO China: YINN CHAU
Commodities: CANE
CORN DBC JJC, NIB CORN, CUT (paper)
MOO, NRGU
SOYB WEAT UUP (Dollar) LIT
(Lithium) PALL
(Palladium)
Stocks AA AAPL ADBE ALXN AMAT AMGN AMD AMZN AXP BA BABA
BAC BIDU BLDP CAT CHKP CNX CPB CRM CVX CMG DE DIS ENPH FB FSLR
FTNT GILD GME GOOG GS HD IBM INTU JPM KO KR LRCX MRK MRNA
MOS MSFT NEM NFLX NKE NOC NUE NVDA PANW PG PYPL QCOM QDEL
REGN REV RE SO SQUARE TSLA TXN XOM V VRTX WFC WMT XLE ZM ZOM
New stocks added:
3/24/2023: ANET AXON BSX CDNS SQSP
3/29/2023: SNOW
TWL0
Leveraged Short
ETFs:
FAZ - financials, TZA and SRTY- small caps, MZZ - mid caps, TECS -Techs,
SOXS -
semi-conductors LABD
- Biotechs
Bullish MAXCPs www.tigersoftware.com/UPPING/3-29-2023/Bullish.htm
Bearish MINCPs
www.tigersoftware.com/Downing/3-29-2023/BEARISH.htm |
|
|
Table 1 - Daily Breadth and Volume Statistics
| NYSE |
Latest Close |
Previous
Close |
Week Ago |
| Issues
traded |
3,127 |
3,120 |
3,131 |
| Advances |
2,389 |
1,790 |
768 |
| Declines |
635 |
1,200 |
2,249 |
| Unchanged |
103 |
130 |
114 |
| New
highs |
41 |
27 |
28 |
| New
lows |
20 |
50 |
102 |
| Adv.
volume* |
765,954,200 |
501,895,077 |
101,874,758 |
| Decl.
volume* |
119,435,289 |
281,187,913 |
889,165,952 |
| Total
volume* |
892,340,980 |
791,396,707 |
999,211,770 |
| Closing
Arms (TRIN)† |
0.63 |
0.75 |
2.06 |
| Block
trades* |
4,370 |
4,362 |
4,730 |
| Adv.
volume |
3,528,207,127 |
2,655,927,953 |
637,823,546 |
| Decl.
volume |
588,148,294 |
1,326,672,814 |
3,847,219,253 |
| Total
volume |
4,145,256,202 |
4,014,608,229 |
4,533,010,566 |
| NASDAQ |
Latest Close |
Previous
Close |
Week Ago |
| Issues
traded |
4,700 |
4,678 |
4,697 |
| Advances |
3,044 |
1,947 |
1,282 |
| Declines |
1,443 |
2,516 |
3,229 |
| Unchanged |
213 |
215 |
186 |
| New
highs |
68 |
43 |
49 |
| New
lows |
143 |
147 |
189 |
| Closing
Arms (TRIN)† |
0.33 |
1.44 |
1.62 |
| Block
trades |
33,583 |
29,850 |
33,727 |
| Adv.
volume |
3,845,388,807 |
1,401,831,304 |
976,225,490 |
| Decl.
volume |
594,341,468 |
2,606,464,774 |
3,983,755,897 |
| Total
volume |
4,493,545,035 |
4,036,916,842 |
4,981,596,179 |
|
Table 2 QUICKSILVER on ETFS - 3/208/2023 ---
Bullish = 3 TECL(+.451), SOXL (+.391), QQQ (+.254)
Bearish = 2 FAS (-.331), RETL (-.341)
ETF CLOSE CHANGE PIVOT-PT 5-dma AROC CL-PWR CANDLE IP21 ITRS POWER INDEX
================================================================================================
DIA 327.08 3.27 320.84 107% ------- BLUE .087 ----- -----
---------------------------------------------------------------------------------------------
COMPQX 11926.24 210.16 11787.4 109% Bullish BLUE .098 .111 .209
---------------------------------------------------------------------------------------------
SPY 401.35 5.75 393.17 117.1% Bullish BLUE .101 .045 .146
---------------------------------------------------------------------------------------------
QQQ 312.72 5.6 309.75 107% Bullish BLUE .108 .146 .254
---------------------------------------------------------------------------------------------
MDY 449.11 5.46 434.88 139.2% Bearish BLUE -.073 -.008 -.081
---------------------------------------------------------------------------------------------
IWM 175.42 1.97 170.25 109.8% Bearish BLUE -.115 -.025 -.14
---------------------------------------------------------------------------------------------
FAS 56.28 2.37 51.96 294.5% Bearish BLUE -.034 -.297 -.331
---------------------------------------------------------------------------------------------
RETL 6.69 .09 6.3 124.1% Bearish RED -.136 -.205 -.341
---------------------------------------------------------------------------------------------
SOXL 17.08 1.45 17.49 256.4% ------- BLUE .048 .343 .391
---------------------------------------------------------------------------------------------
TECL 34.5 2.02 33.52 388.8% Bullish BLUE .066 .385 .451
---------------------------------------------------------------------------------------------
IBB 127.83 1.77 124.35 181% ------- BLUE .05 -.026 .024
---------------------------------------------------------------------------------------------
GLD 182.53 -.91 185.74 -24.8% Bullish ---- .138 .063 .201
---------------------------------------------------------------------------------------------
DBO 14.16 -.07 13.52 191.9% Bullish RED .225 -.043 .182
---------------------------------------------------------------------------------------------
OIH 277.38 2.31 258.64 219.2% ------- RED -.036 -.124 -.16
---------------------------------------------------------------------------------------------
CPER 24.92 .05 24.96 52.3% Bullish RED .186 .006 .192
---------------------------------------------------------------------------------------------
TAN 74.2 1.64 73.58 117.3% ------- BLUE .1 -.063 .037
---------------------------------------------------------------------------------------------
UUP 27.91 .07 27.86 16.1% Bearish ---- -.153 .049 -.104
---------------------------------------------------------------------------------------------
CORN 25.29 0 24.4 167% Bullish RED .059 -.027 .032
---------------------------------------------------------------------------------------------
WEAT 7.16 .04 6.72 295.2% ------- RED -.109 -.02 -.129
---------------------------------------------------------------------------------------------
YINN 47.06 .18 45.07 665.7% ------- BLUE .079 -.201 -.122
|
Table 3 RANKING OF KEY DIRECTORIES BASED PCT.OF STOCKS ABOVE 65-DMA
3/29/23
Bullish = 11
Bearish = 38
---------------------------------------------------------------------------------------
Directory Current day-1 day-2 day-3 day-4 day-5
----------------------------------------------------------------------------------------
BEVERAGE .857 .714 .714 .714 .571 .5
GOLD .804 .847 .739 .695 .673 .586
NIFTY .727 .636 .681 .681 .636 .59
=====
GAMING .684 .631 .578 .526 .421 .473
HOMEBLDG .666 .666 .666 .666 .666 .611
=====
NASD-100 .65 .56 .56 .58 .55 .52
SEMI .627 .5 .542 .563 .606 .563
=====
SOFTWARE .571 .482 .517 .482 .446 .428
HACKERS .562 .437 .5 .5 .5 .375
ELECTRON .548 .451 .488 .488 .503 .496
HIGHPRIC .51 .432 .437 .428 .385 .389
==================================================================================================
MILITARY .5 .423 .423 .307 .23 .269
==================================================================================================
COMPUTER .45 .4 .45 .45 .45 .4
COMODITY .435 .435 .41 .41 .41 .41
COPPER .428 .428 .428 .285 .285 .285
HOSPITAL .428 .357 .357 .214 .214 .285
ETFS .4 .327 .309 .218 .29 .218
GREEN .388 .277 .277 .277 .277 .277
FOOD .387 .408 .387 .367 .367 .367
DOWJONES .366 .3 .333 .3 .233 .233
=====
GUNS .357 .357 .357 .285 .214 .214
UTILITY .342 .21 .21 .184 .078 .078
RUS-1000 .337 .285 .268 .257 .23 .228
SP500 .334 .273 .258 .254 .223 .209
=====
RETAIL .319 .34 .297 .276 .234 .255
FIDSTKS .313 .254 .278 .266 .23 .218
INDEXES .313 .275 .27 .297 .302 .275
SOLAR .312 .187 .187 .187 .187 .25
DJI-13 .307 .23 .23 .23 .153 .153
JETS .307 .153 .076 0 0 0
INDMATER .305 .305 .277 .222 .208 .208
INFRA .303 .242 .212 .181 .181 .212
BIOTECH .301 .272 .267 .259 .251 .244
AUTO .283 .283 .207 .169 .188 .188
SP-100 .277 .244 .277 .255 .222 .177
INSURANC .24 .12 .12 .12 .08 .08
OILGAS .219 .2 .123 .104 .114 .133
BONDFUND .218 .195 .183 .206 .172 .172
TRANSP .21 .21 .21 .105 .105 .105
CHEM .209 .209 .186 .139 .116 .093
LOWPRICE .191 .206 .206 .203 .18 .2
CHINA .136 .159 .181 .204 .204 .204
REIT .13 .1 .115 .107 .076 .092
MARIJUAN .1 .1 .1 0 0 .2
FINANCE .087 .062 .062 .075 .087 .075
REGBANKS .024 .024 0 0 0 0
BIGBANKS 0 0 0 0 0 0
COAL 0 0 0 0 0 0
EDU 0 0 .333 0 0 0
|
====================================================================================
Wednesday 3/29/2023: 6:00 AM Futures: DJI +211 NASDAQ +110 Data Used
3/28/2023
| |
3/28/2023
|
|
| |
This morning the
DJI is moving up through its 32500 resistance and the NASDAQ may
breakout above its year-long
downtrend. The Peerless S10 warns us that
until there is a new Peerless Buy
signal the upside is probably limited to the
DJI's falling 65-dma. The
Closings Powers are rising for the SPY, QQQ and
NASDAQ. So, Professionals
should be observed closely now. As long as
their buying keeps the Closing
Powers rising, the rally can be considered alive.
Watch Boeing (shown below tomorrow)
to see if it can surpass its red 65-dma
resistance. This is now the highest
AI./200 DJI stock and is on a red Buy. Traders
looking for long positions should
buy BA and consider our Bullish MAXCPs as well as
SNOW and TWLO, which are on
automatic buys given by a short-term trading
system that has gained 500% on long
and short trades this past year. |
|
| |
Charts - 3/28/2023
2022 PEERLESS DJI, Signals, Indicators Daily DJI Volume
10-DayUp/Down Vol Stoch-20 CCI RSI Pct of All Stocks above 65-dma
Inverted Traders Index
DJI-IPA DJI-OBV Short-Term Rates
NASDAQ S&P OEX NYSE DJ-15 DJ-20 DJI-30
Tiger Index of Big
Banks Bond
Funds Gold Stocks
Housing Stocks
Insurance-Stocks
Regional Bnnls
Russell-1000
Semi Conductors
Recent 2006 vers-Peerless signals
http://www.tigersoftware.com/OLDPEER/UPD90328.bmp
ETFs: DIA QQQ SPY IWM MDY
TNA Short-Term Rates Ten Year Rates PST (Short Treasuries)
DOLLAR-UUP
ALLSTOCKs
COIN (Bit
Coin ETF)
USO-CrudeOil DBO
BLDP FAS GLD HD IBB JETS JNUG KOL NAIL NUGT
NRGU OIH PALL RSX RETL SDS AGQ SLV SOXL TAN TECL TLT TMF TNA
UGA USO China: YINN CHAU
Commodities: CANE
CORN DBC JJC, NIB CORN, CUT (paper)
MOO, NRGU
SOYB WEAT UUP (Dollar) LIT
(Lithium) PALL
(Palladium)
Stocks AA AAPL ADBE ALXN AMAT AMGN AMD AMZN AXP BA BABA
BAC BIDU BLDP CAT CHKP CNX CPB CRM CVX CMG DE DIS ENPH FB FSLR
FTNT GILD GME GOOG GS HD IBM INTU JPM KO KR LRCX MRK MRNA
MOS MSFT NEM NFLX NKE NOC NUE NVDA PANW PG PYPL REGN REV
SO QCOM QDEL TSLA TXN XOM V VRTX WFC WMT XLE ZM ZOM
New stocks added 3/24/2023: ANET AXON BSX CDNS SQSP
Leveraged Short
ETFs:
FAZ - financials, TZA and SRTY- small caps, MZZ - mid caps, TECS -Techs,
SOXS -
semi-conductors LABD
- Biotechs
Bullish MAXCPs www.tigersoftware.com/UPPING/3-28-2023/Bullish.htm
Bearish MINCPs www.tigersoftware.com/Downing/3-28-2023/BEARISH.htm
|
|
=====================================================================================
Tuesday 2/28 6:10 AM PCT Futures DJI + 101 NASDAQ +58
Data Used 2-27-2023
===================================================================================
===================================================================================
----------------------------------------------------------------------------------------------------------------------------
----------------------------------------------------------------------------------------------------------------------------
===================================================================================


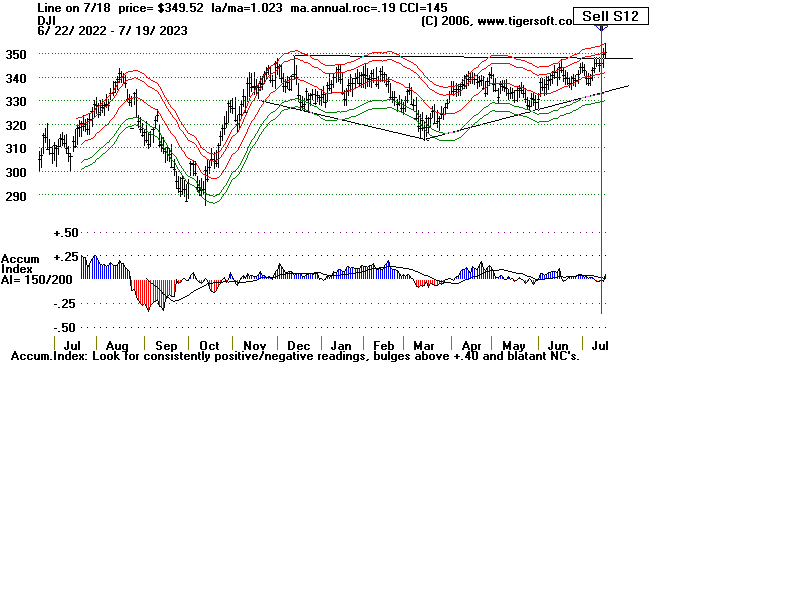
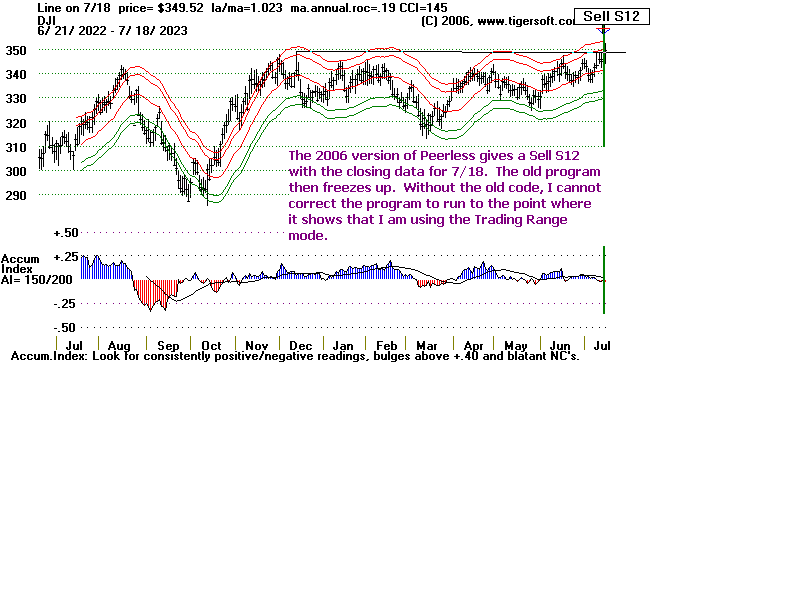
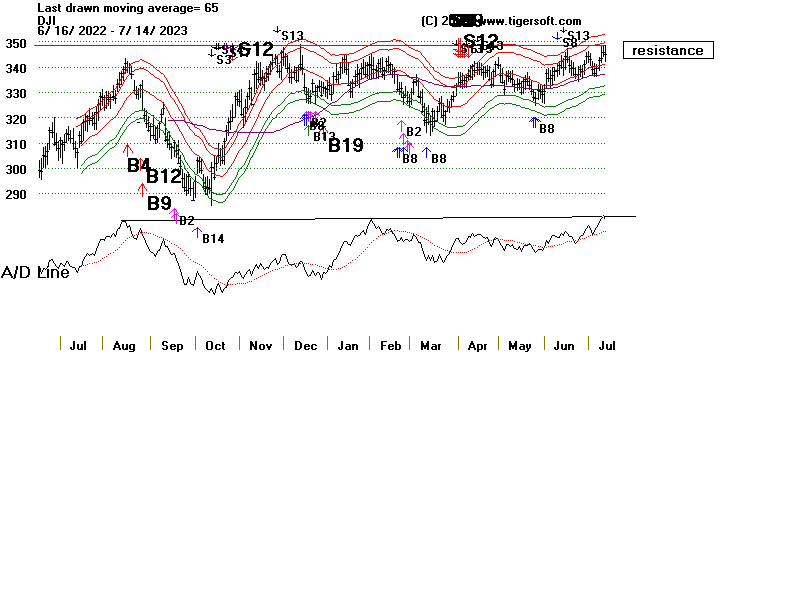
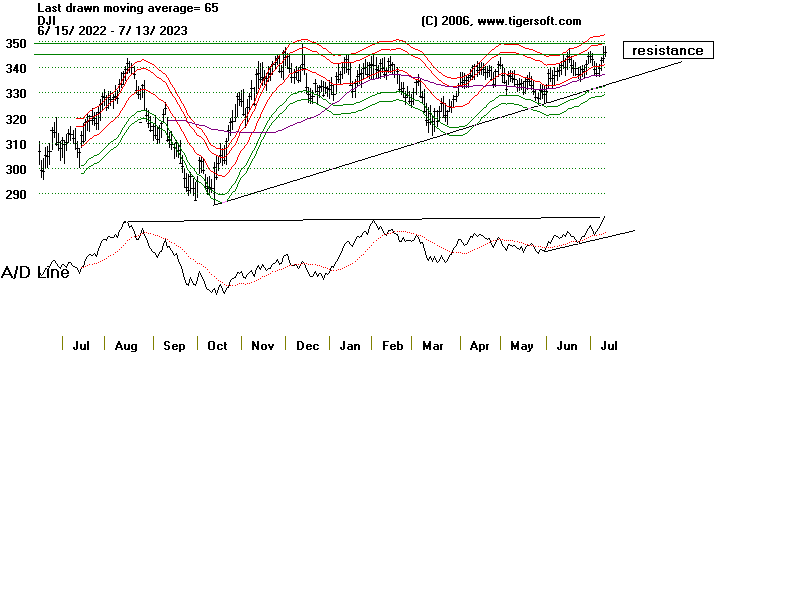
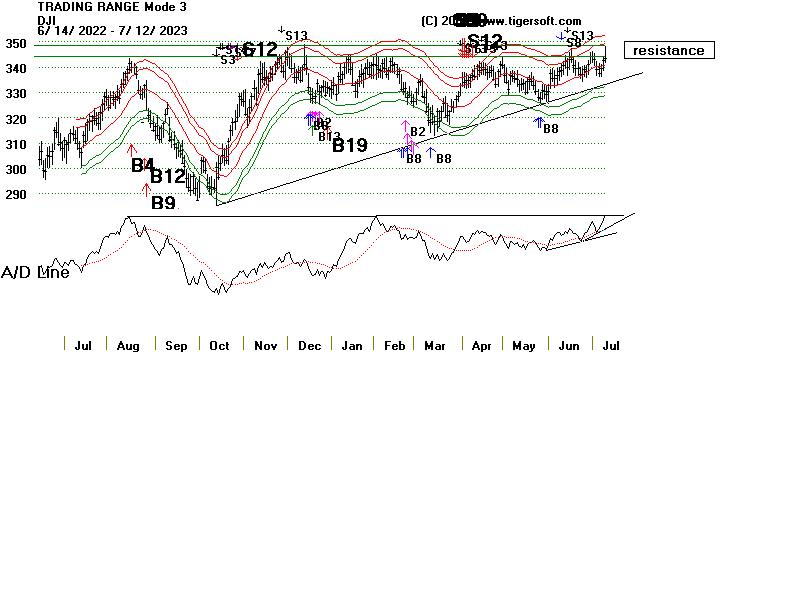
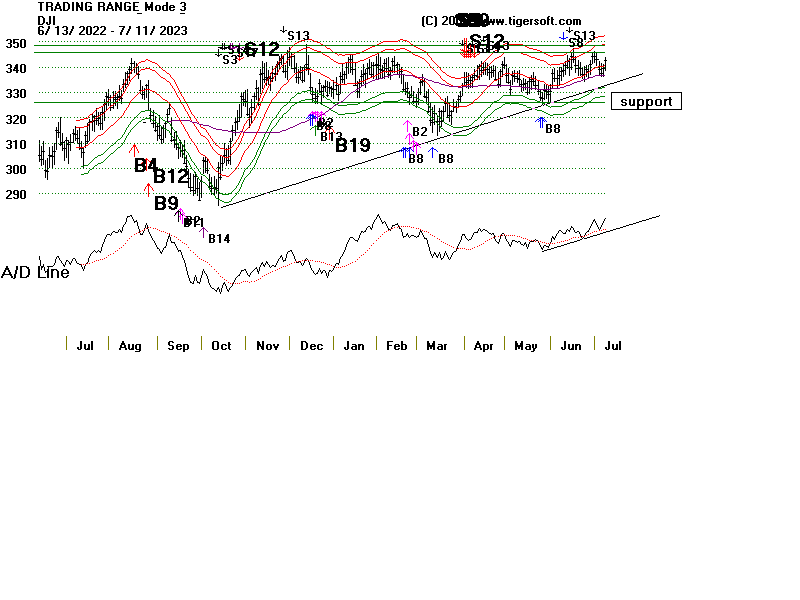
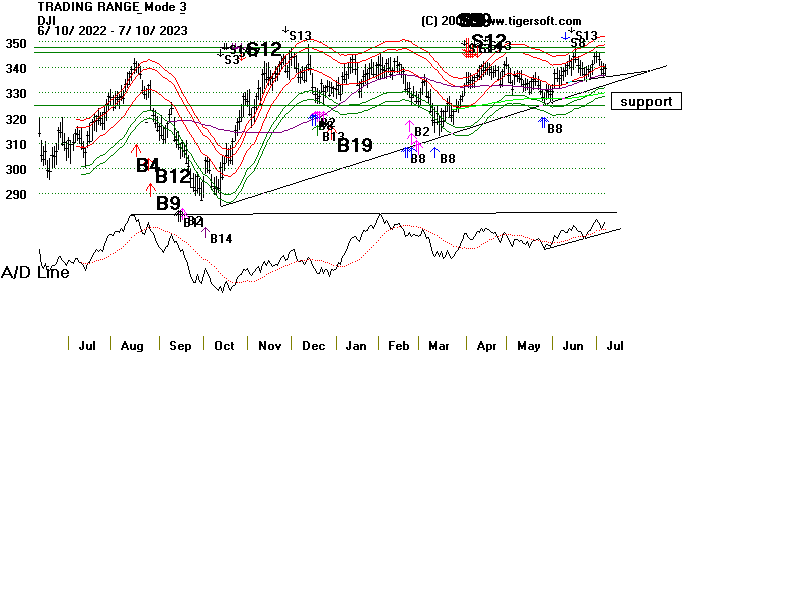
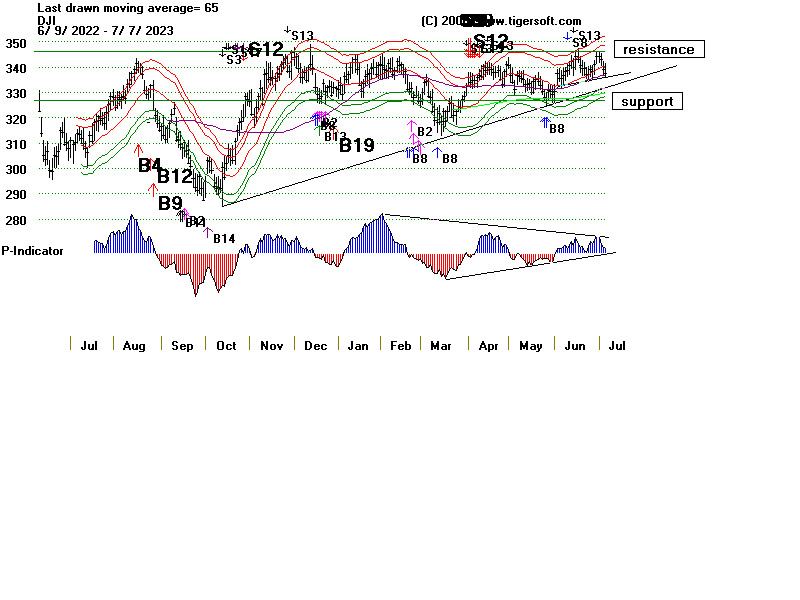
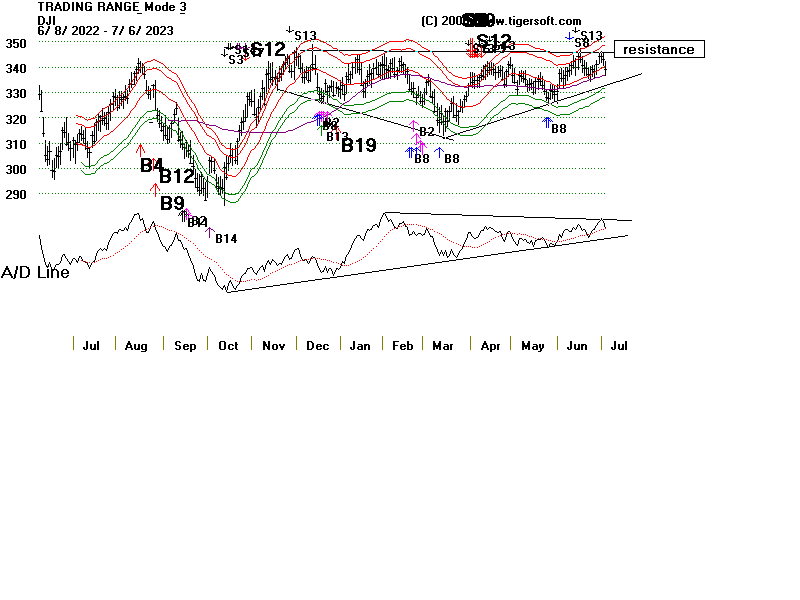
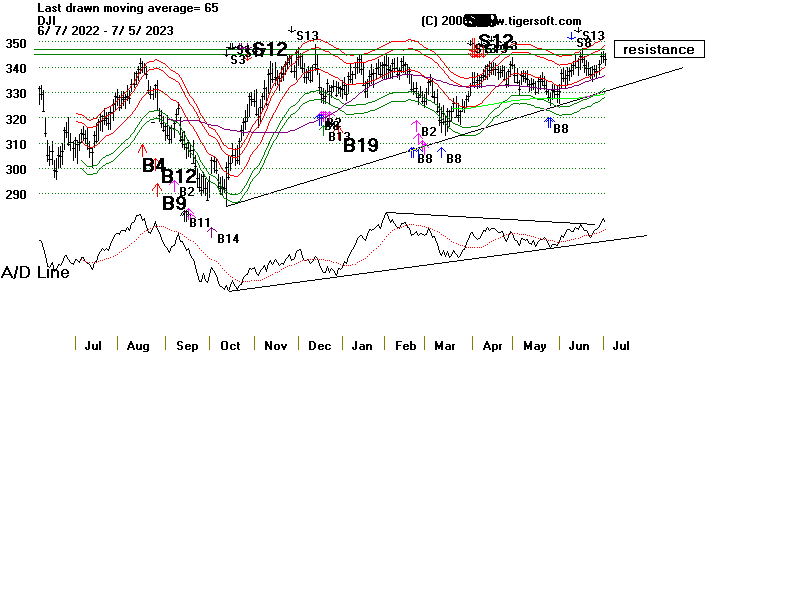
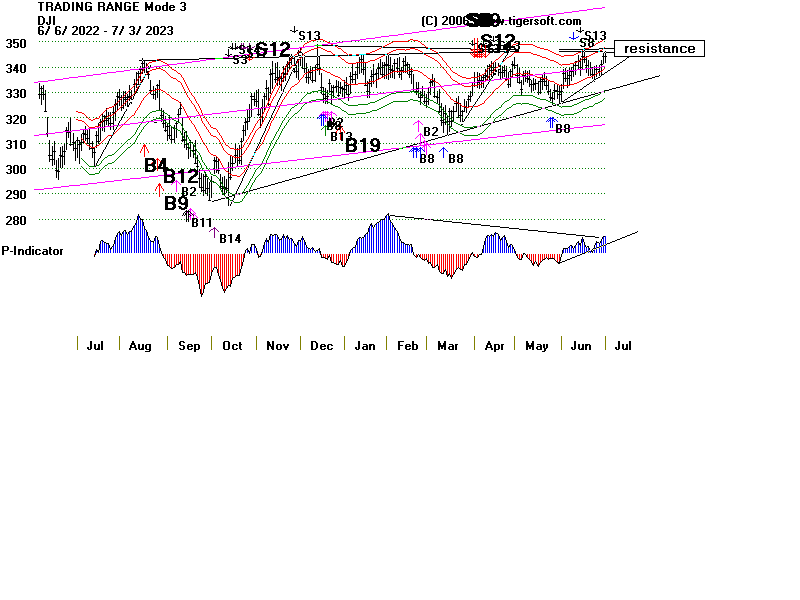
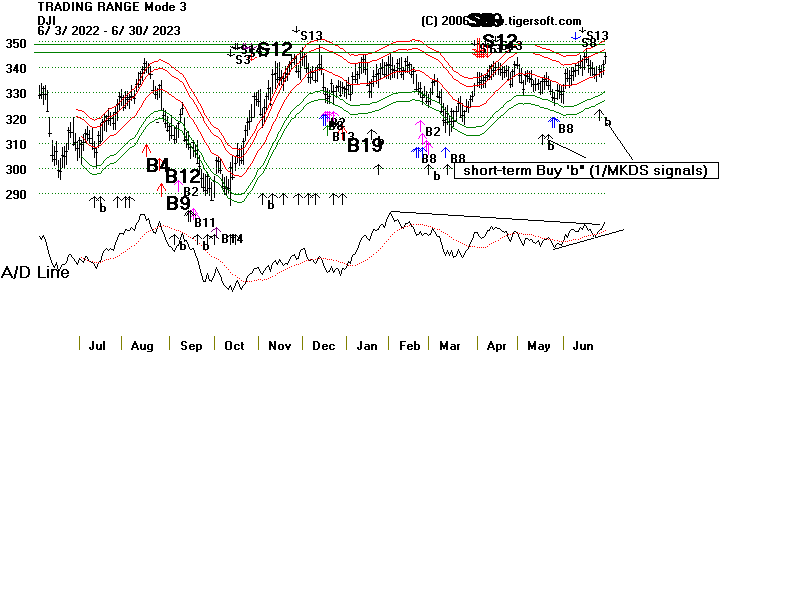
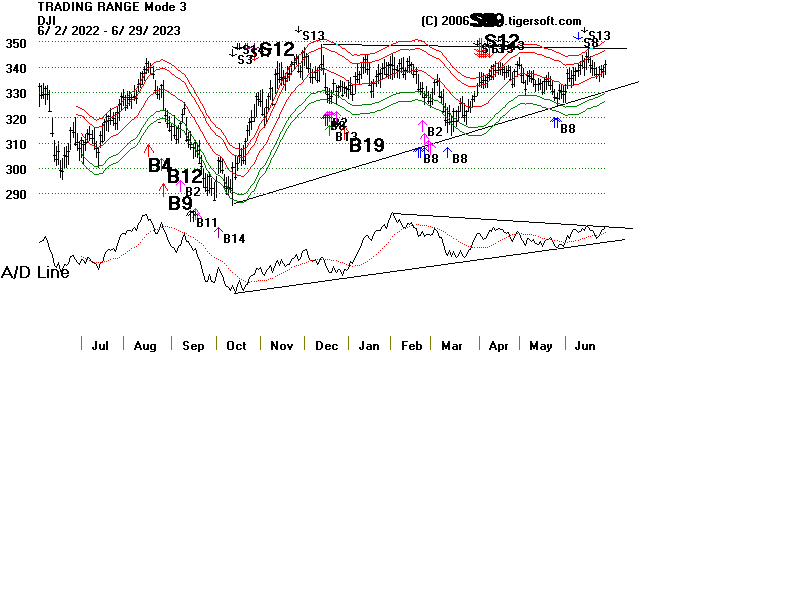
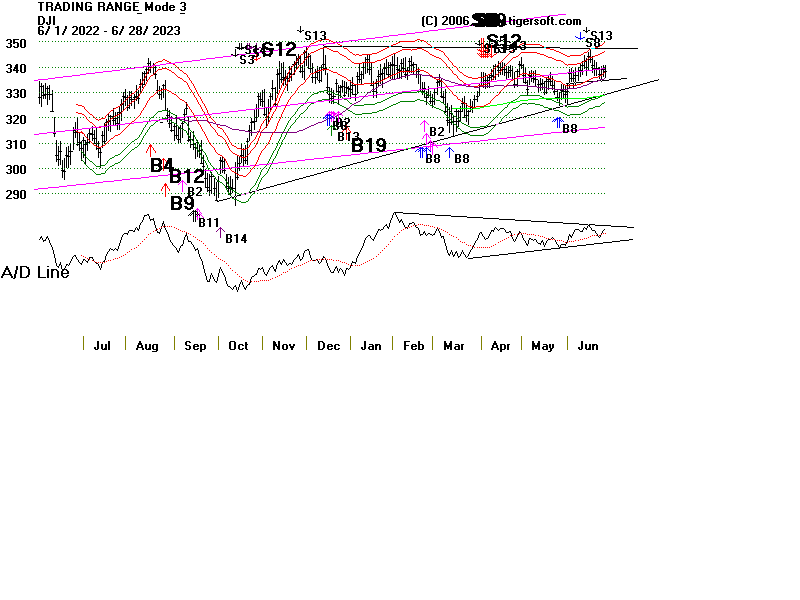
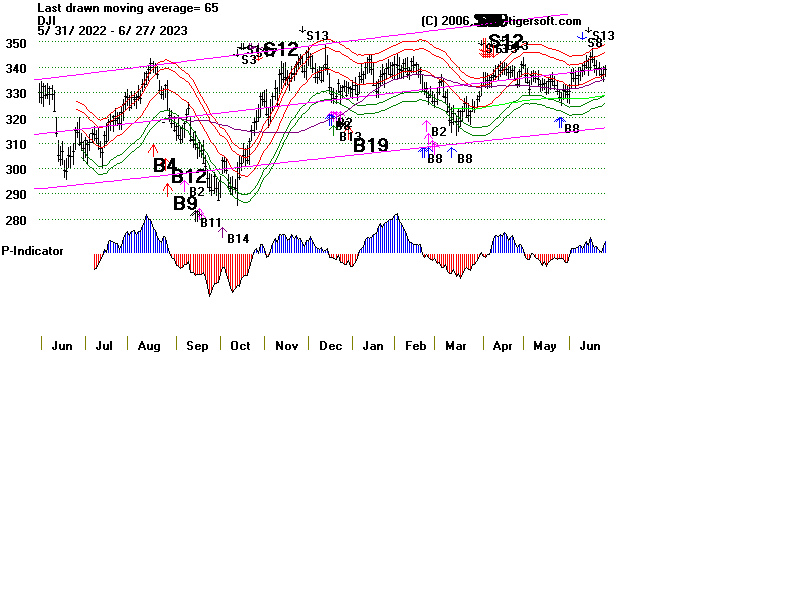
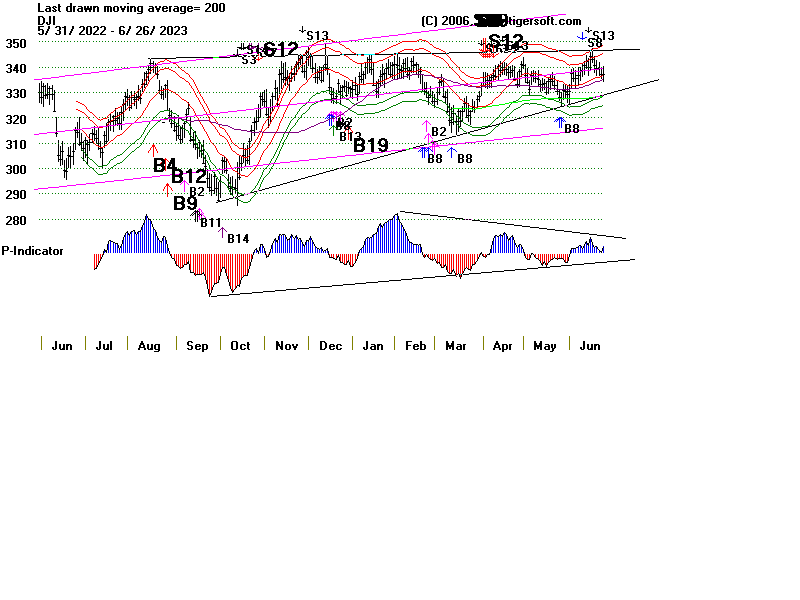
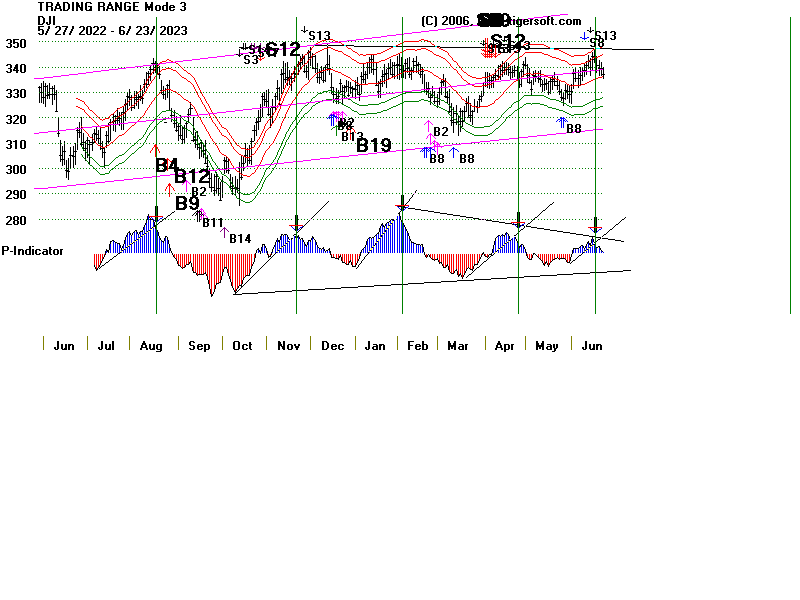
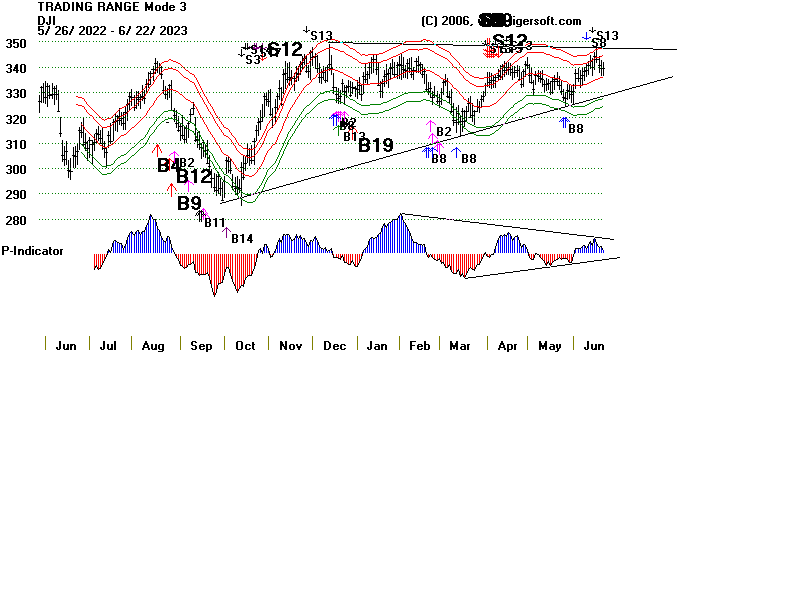
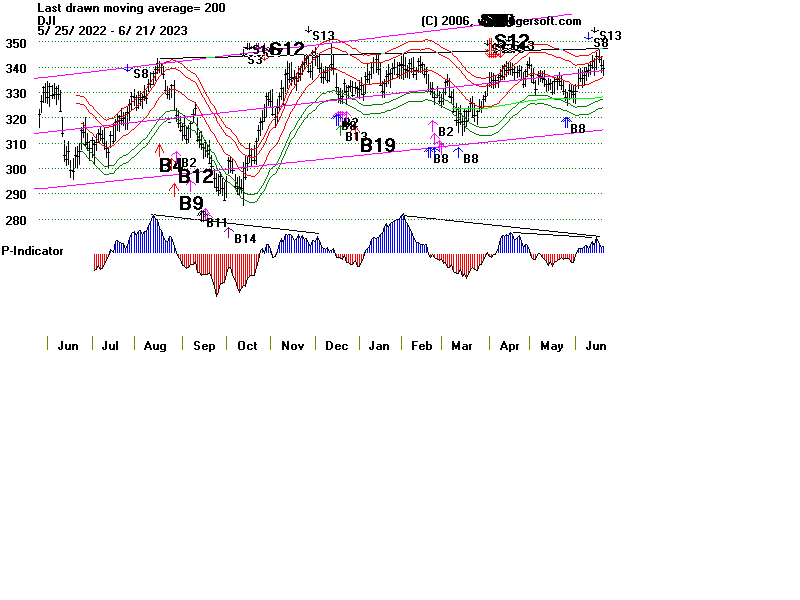
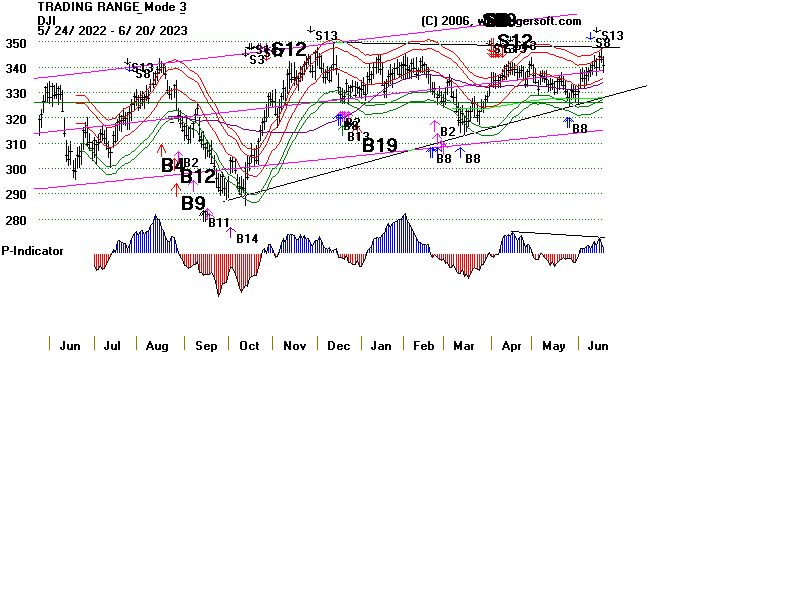
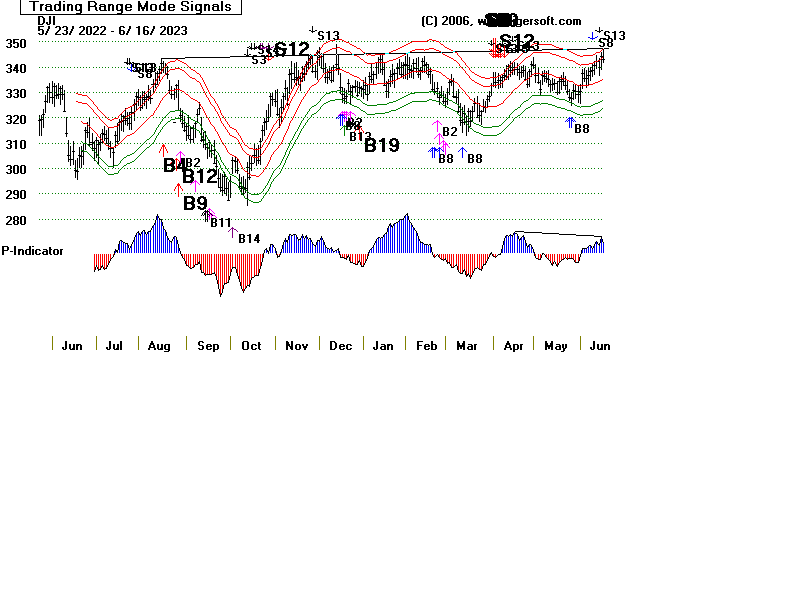
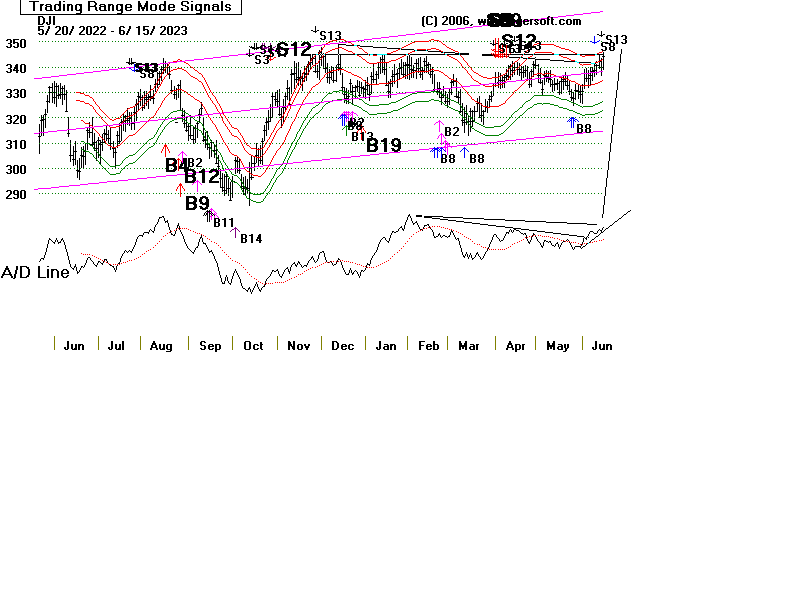
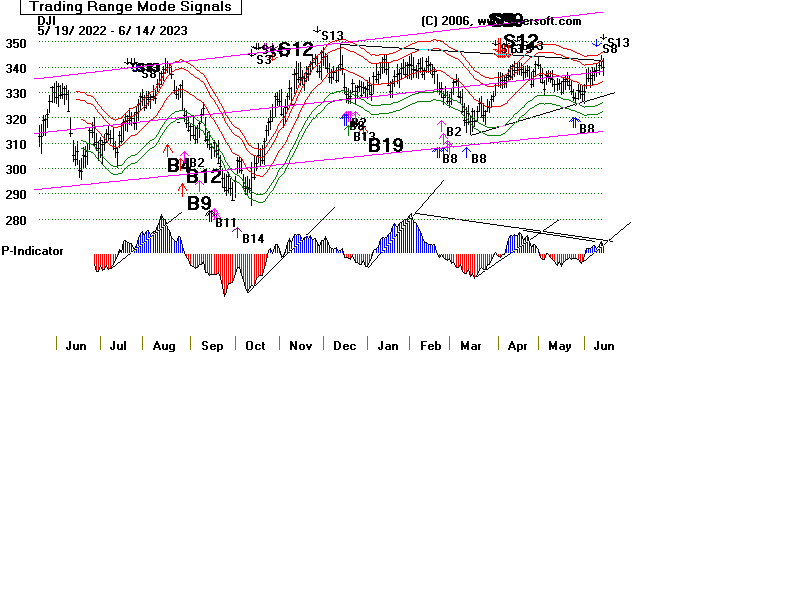
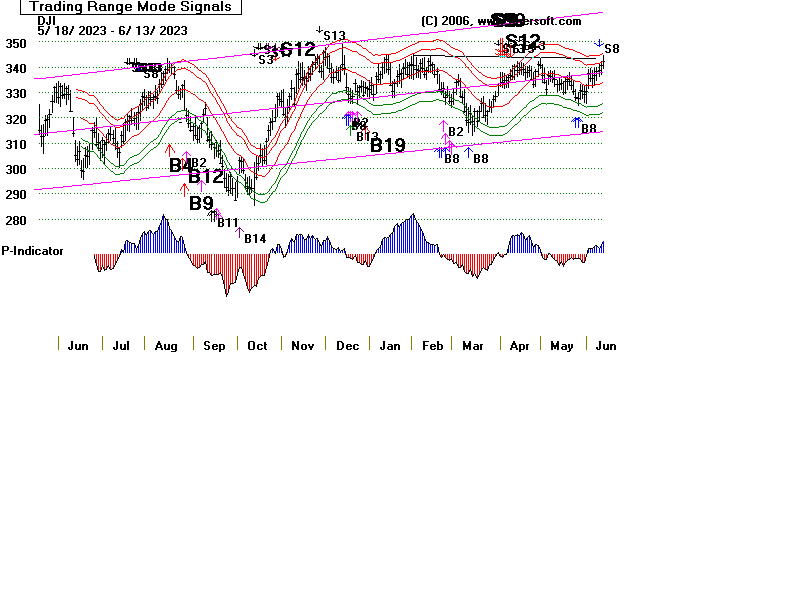
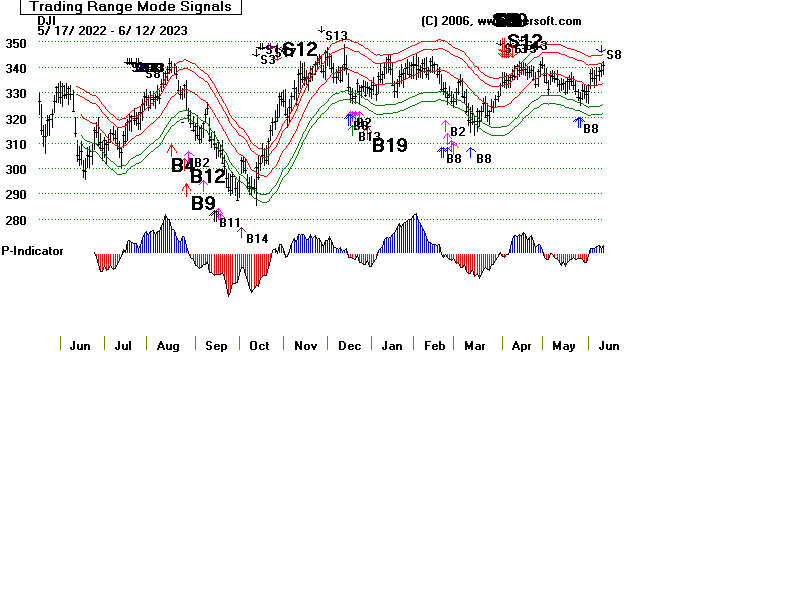
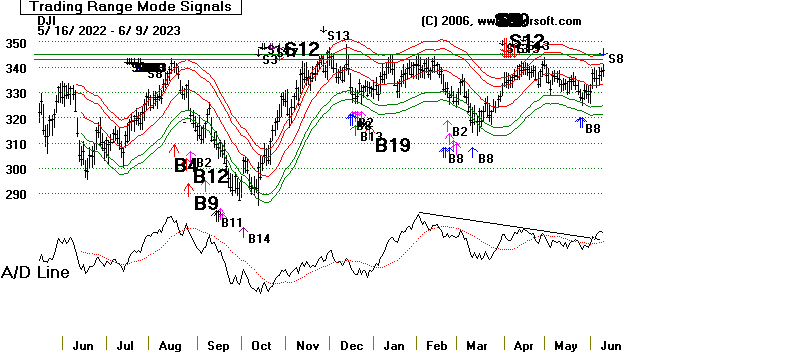
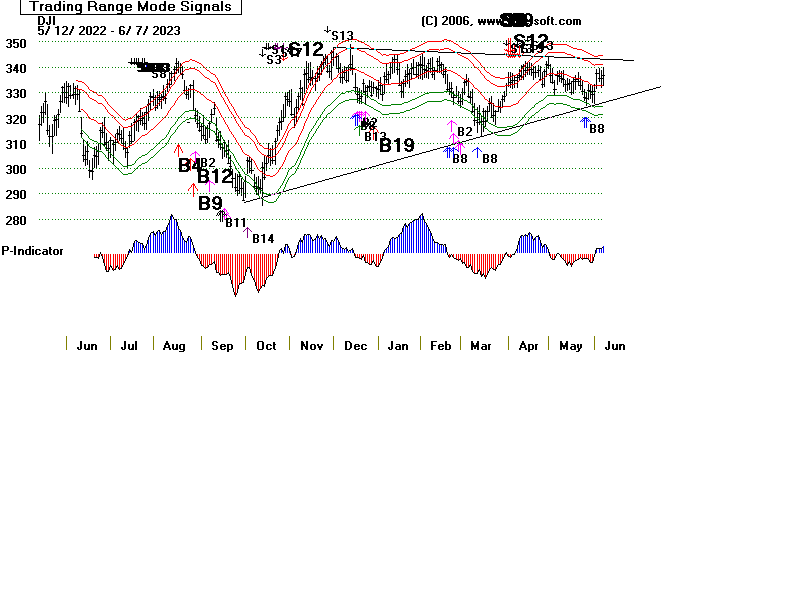
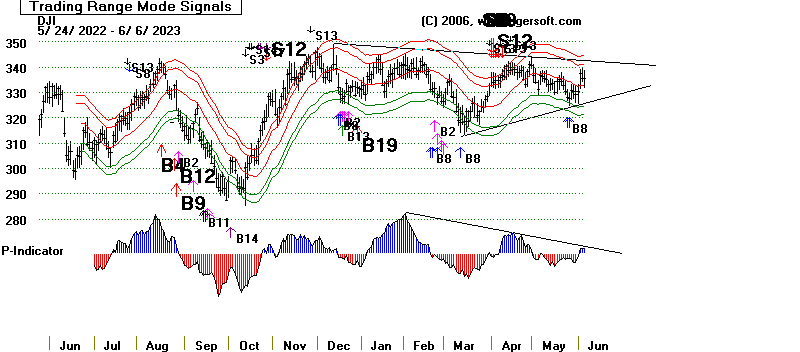
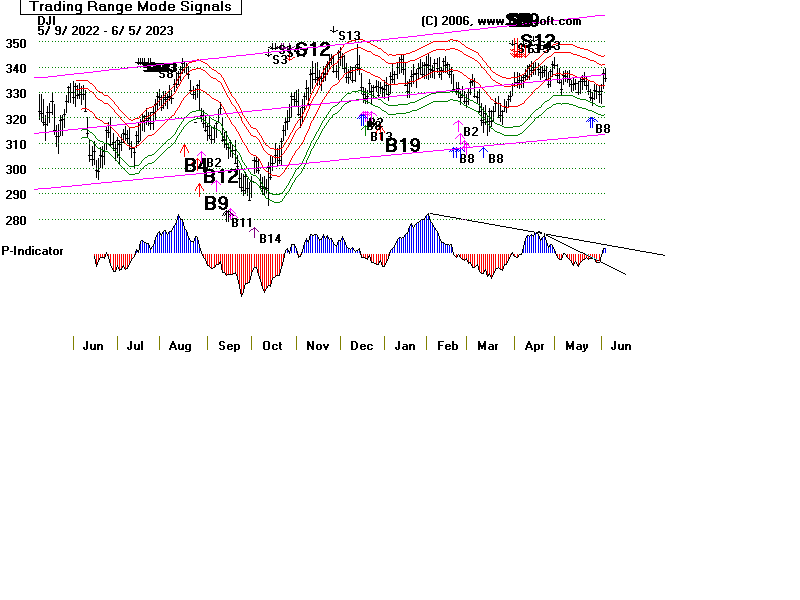
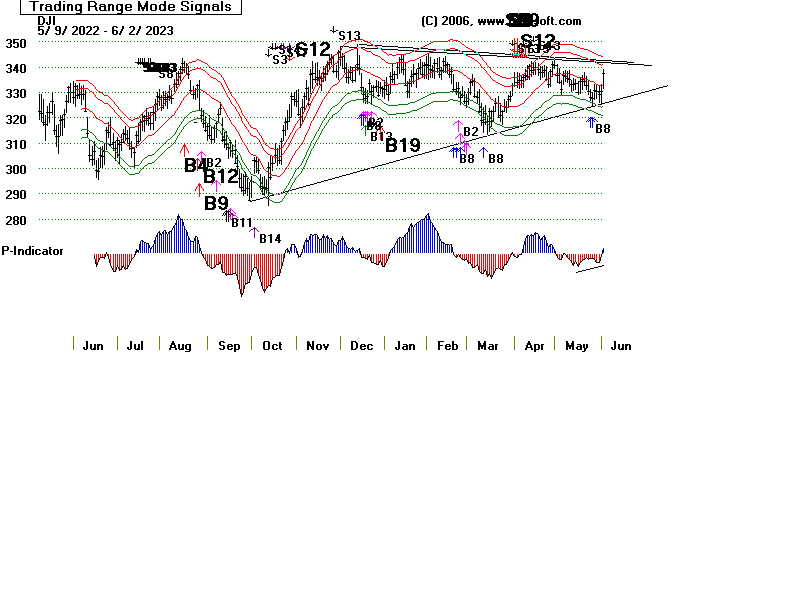
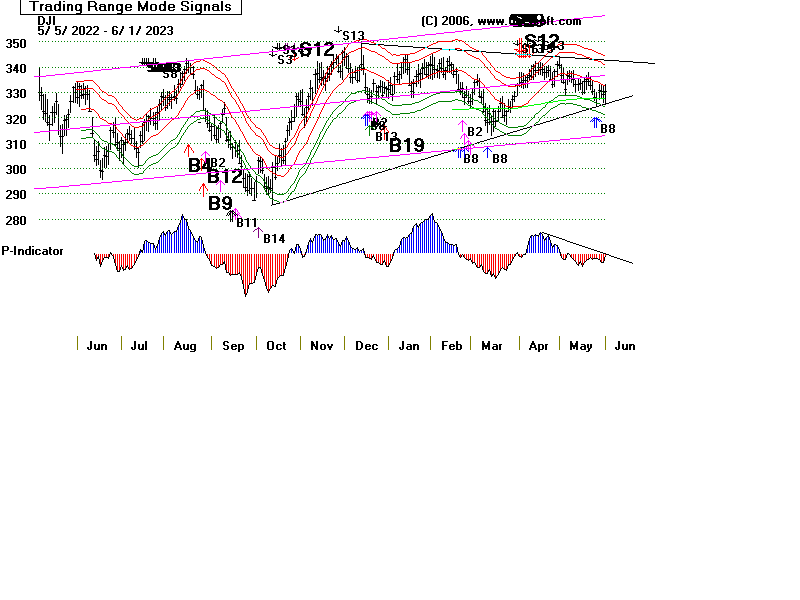
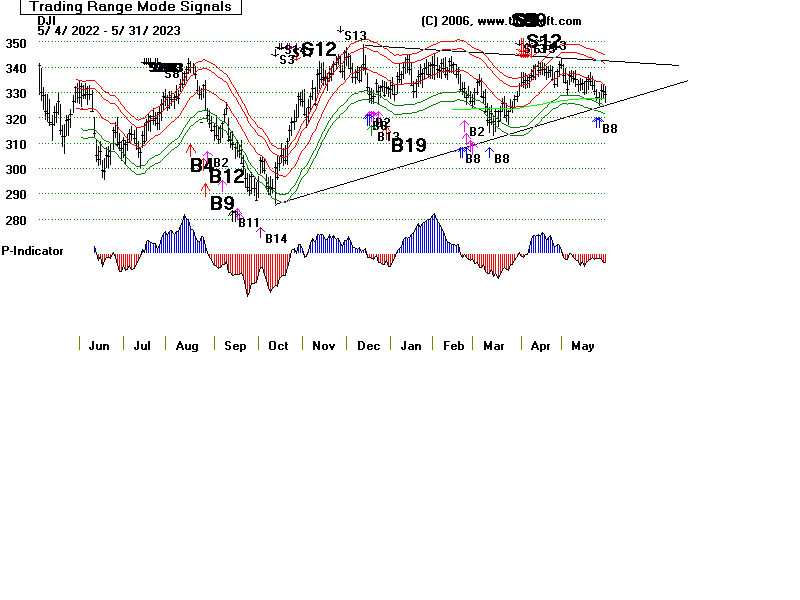
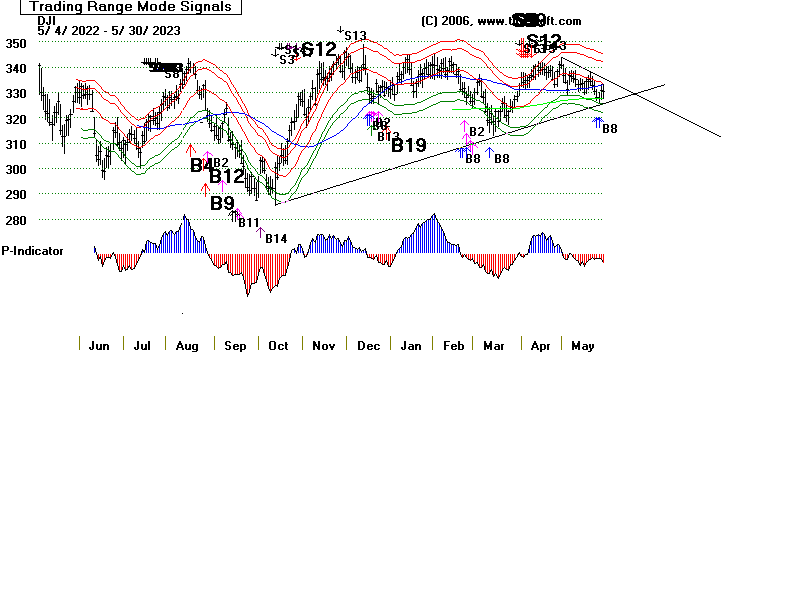
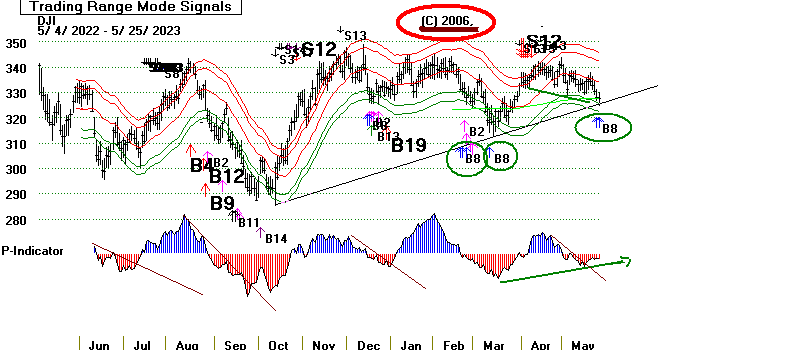
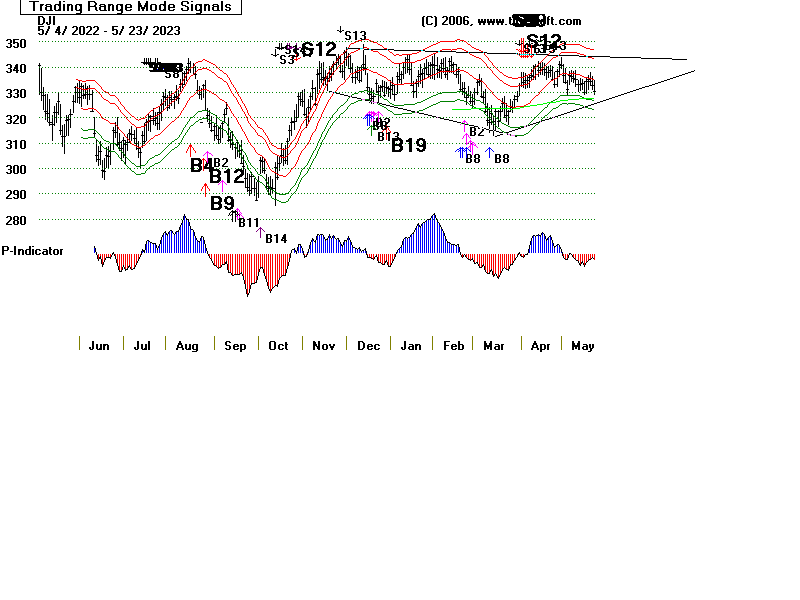
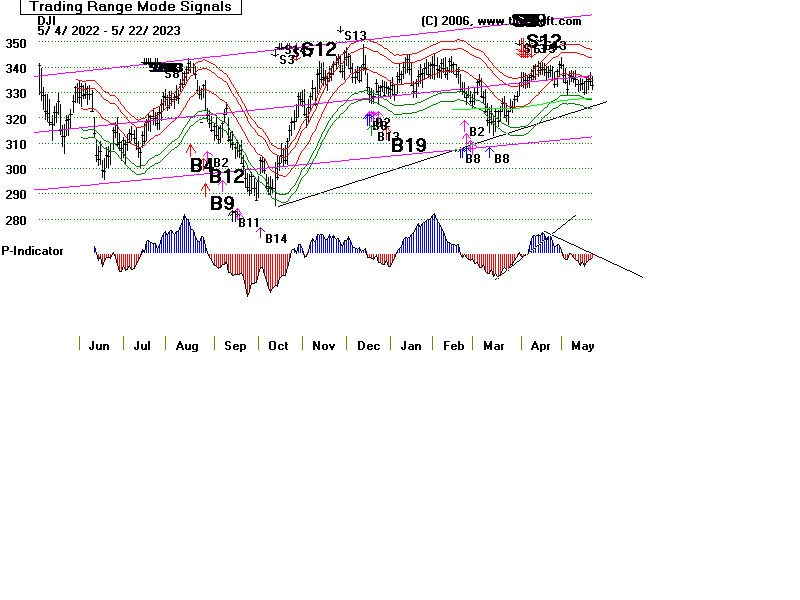
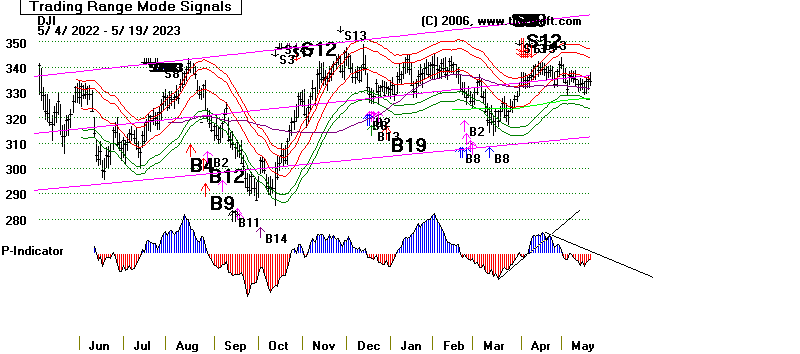
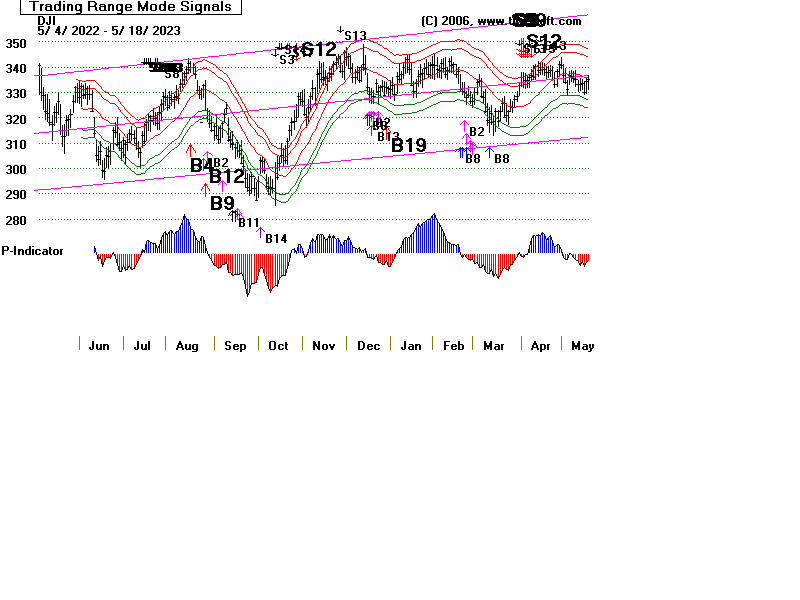
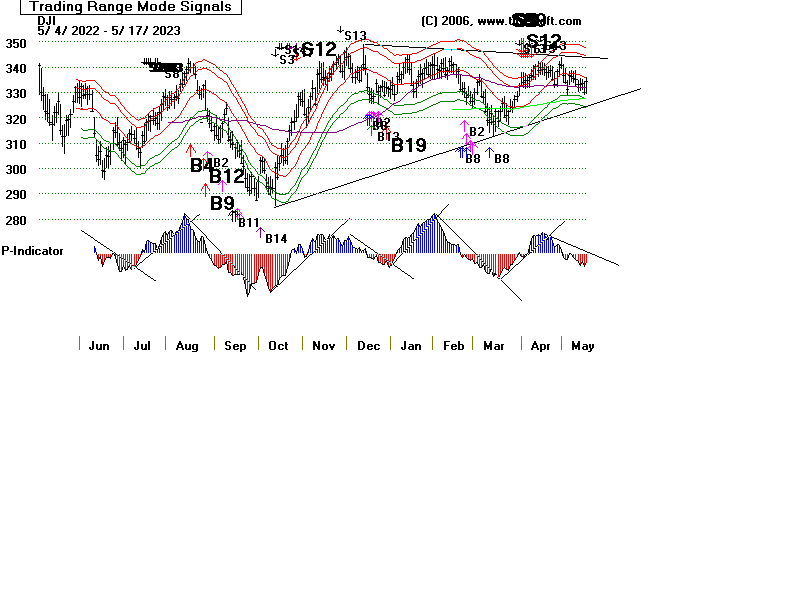
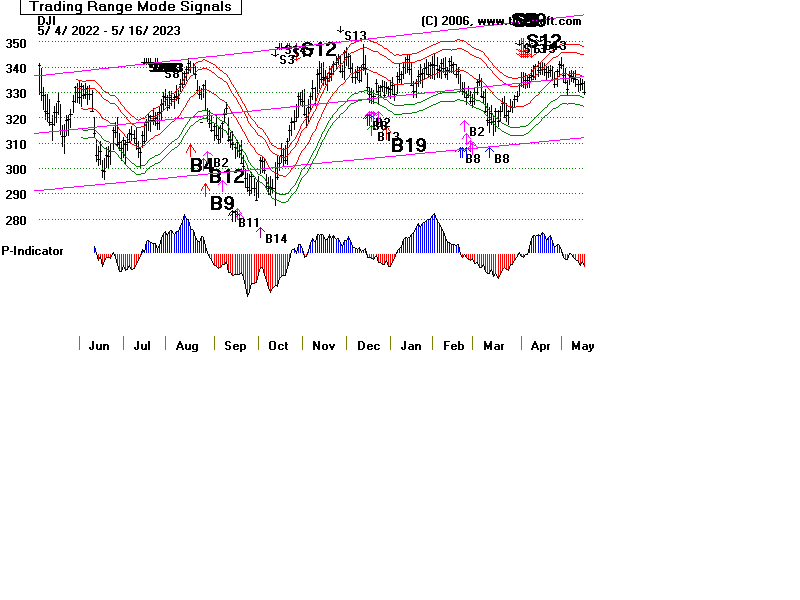
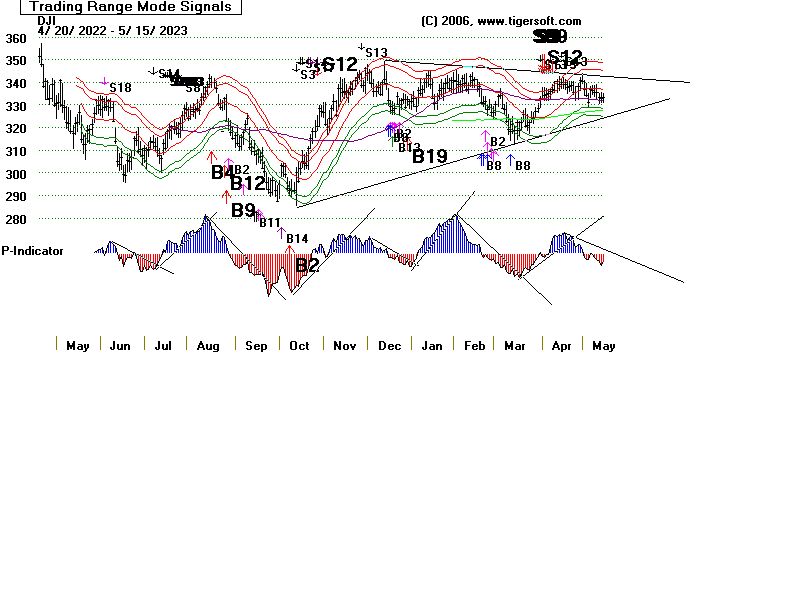
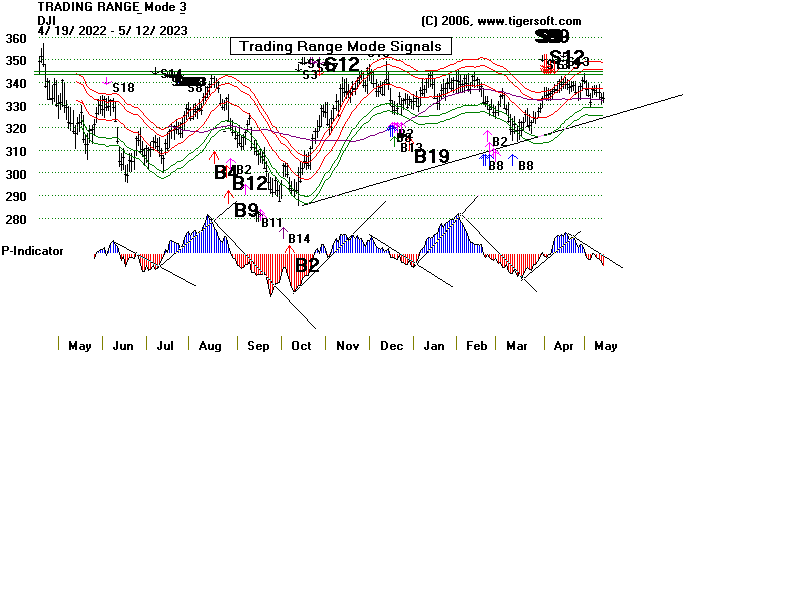
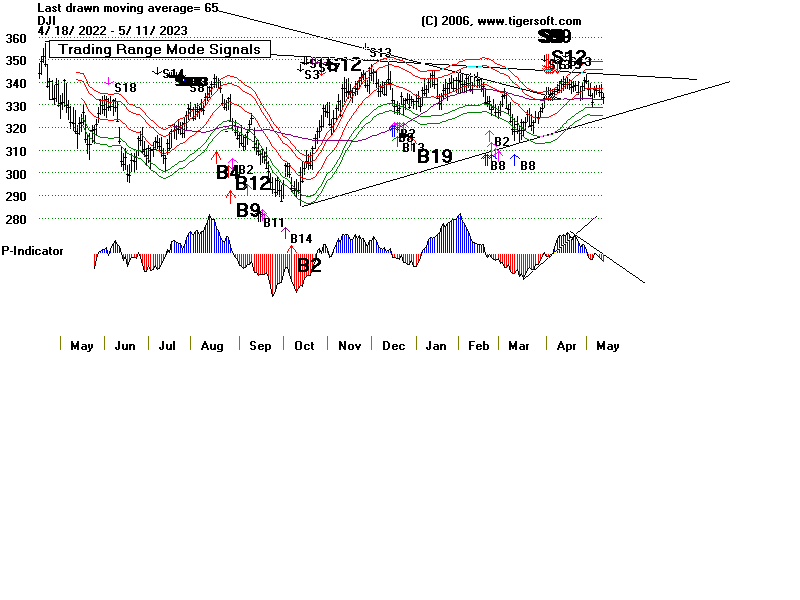
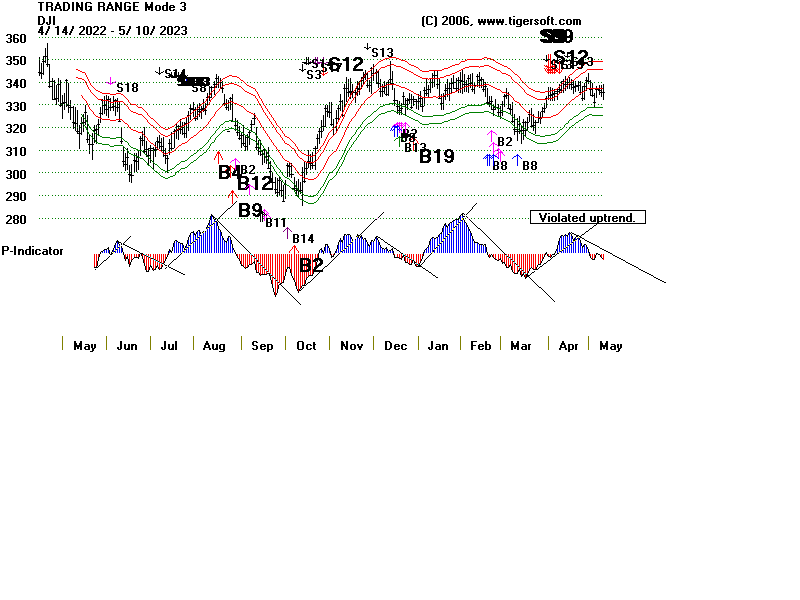
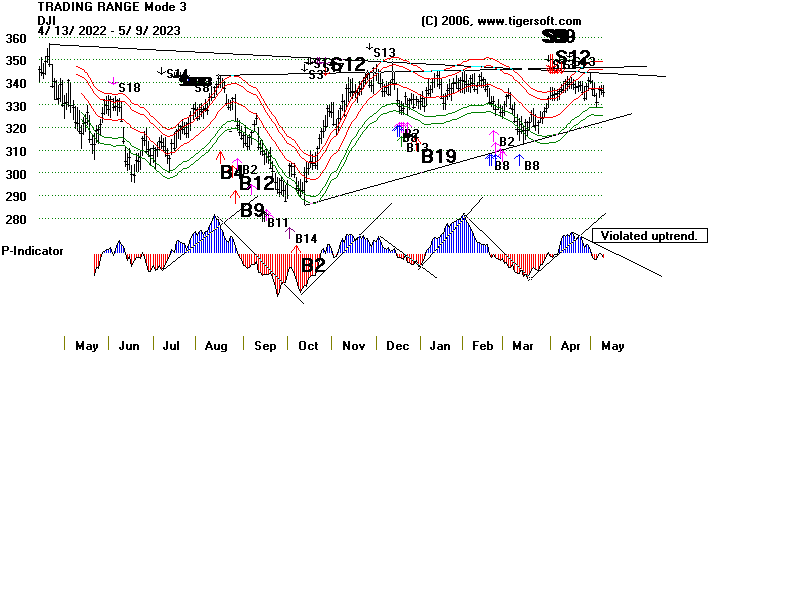
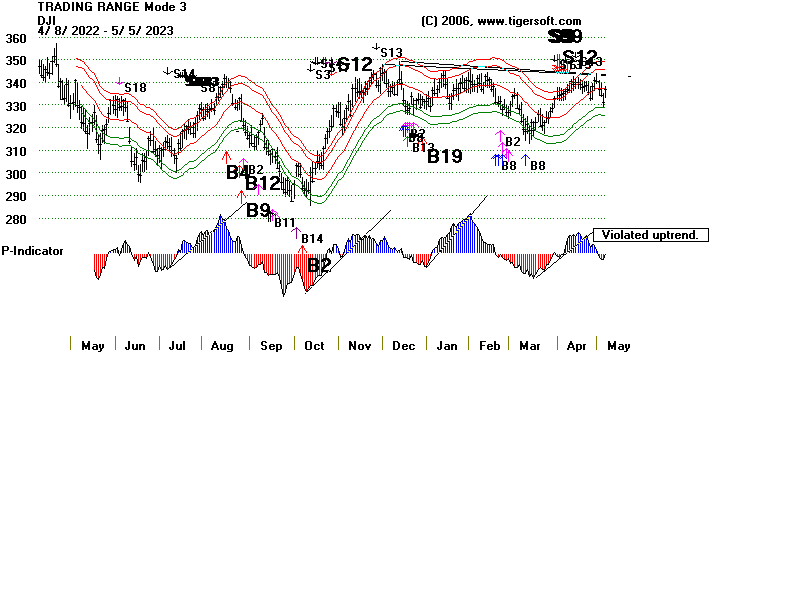
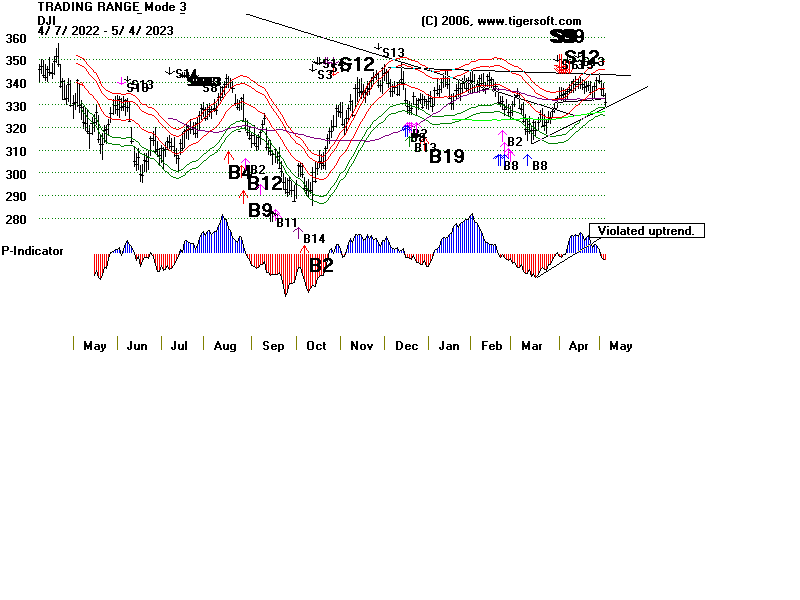
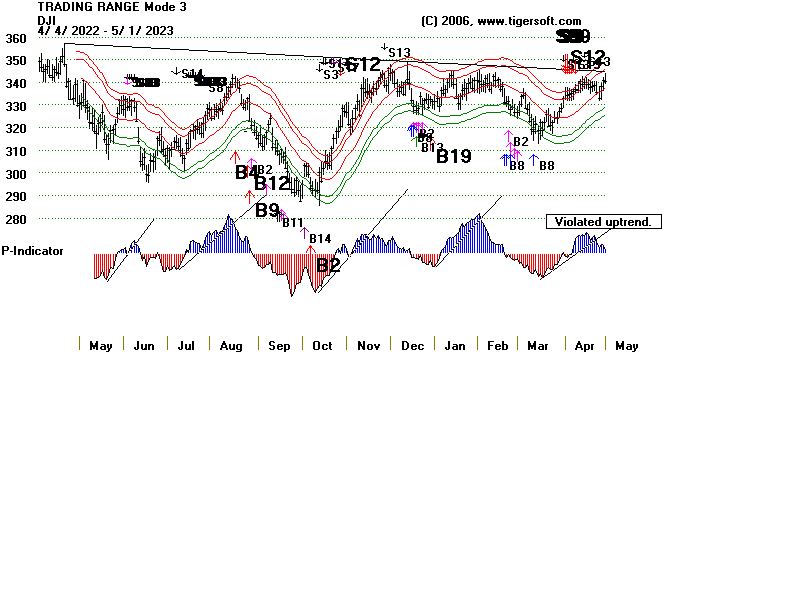
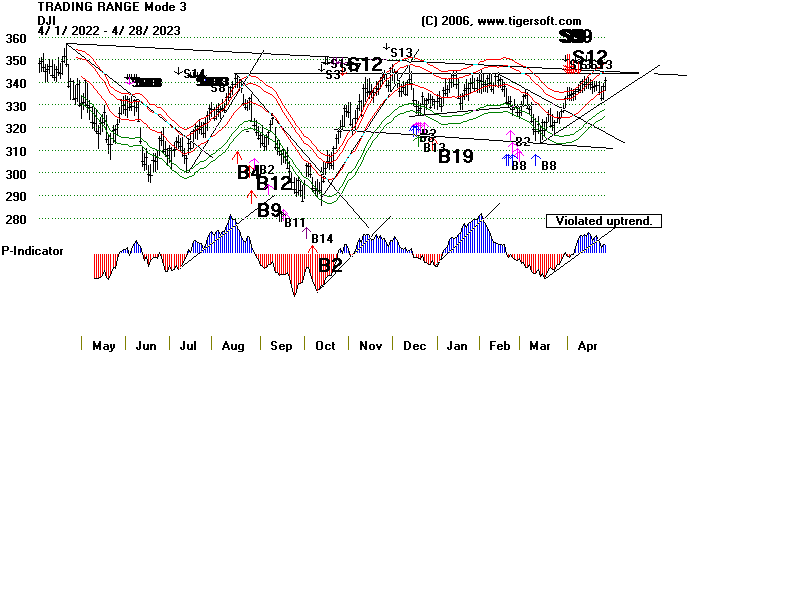
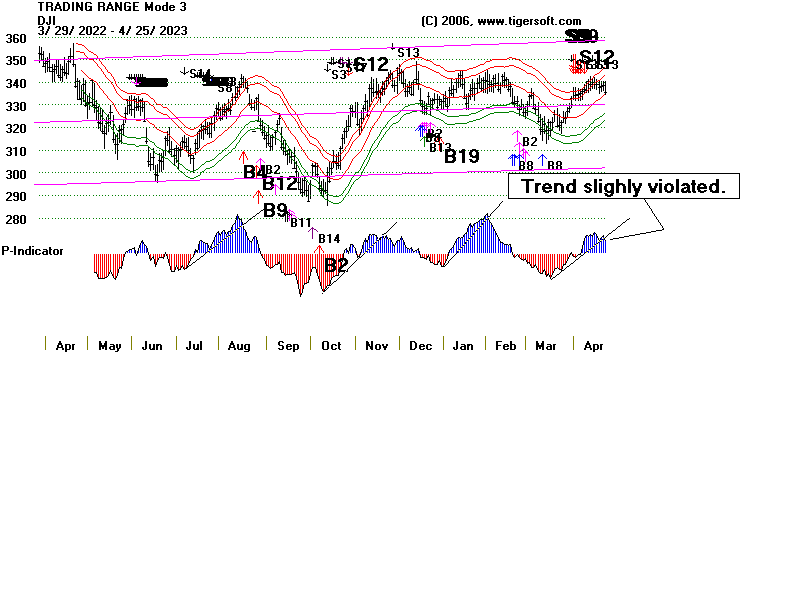
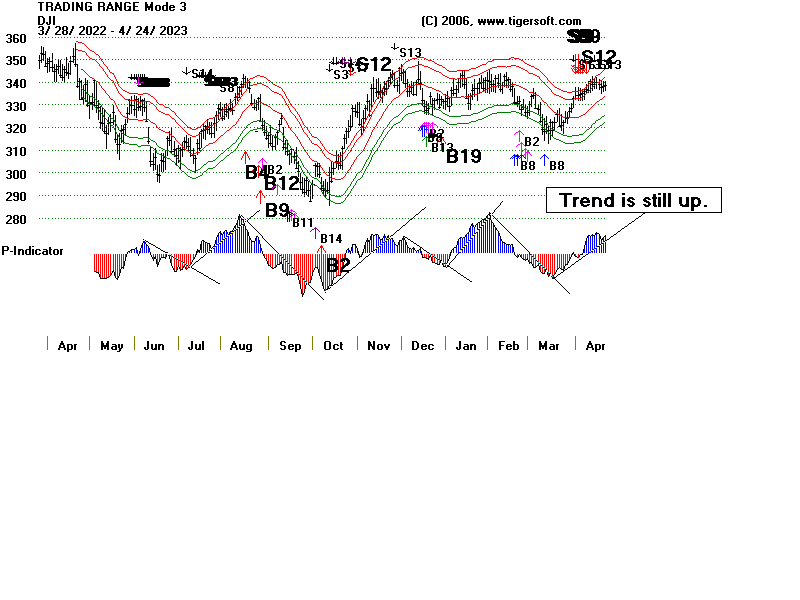
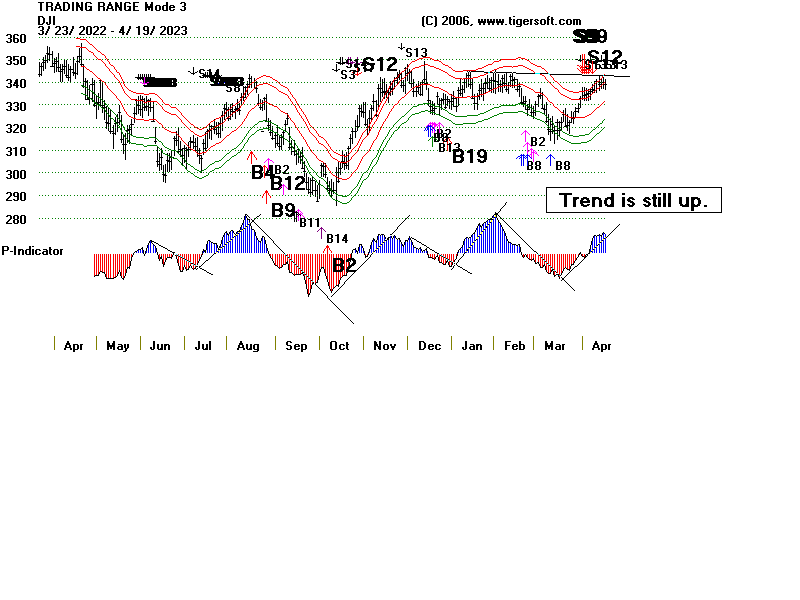
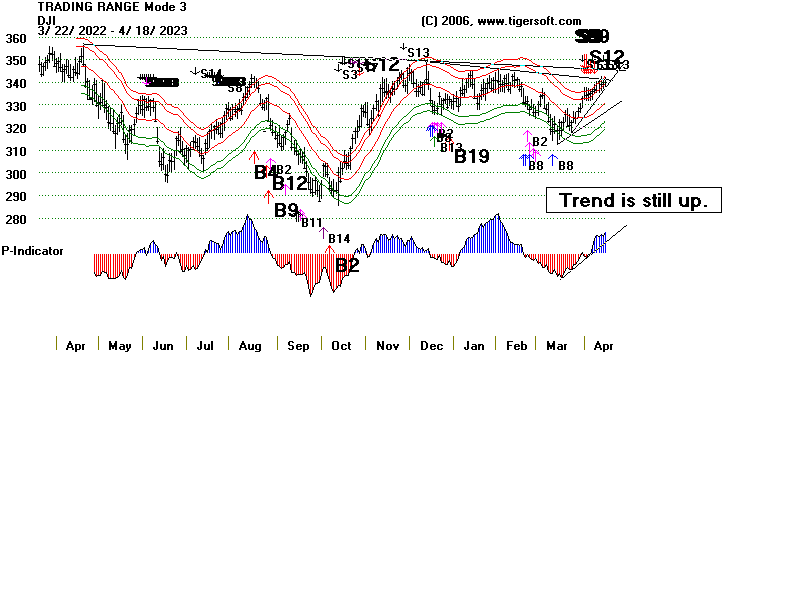
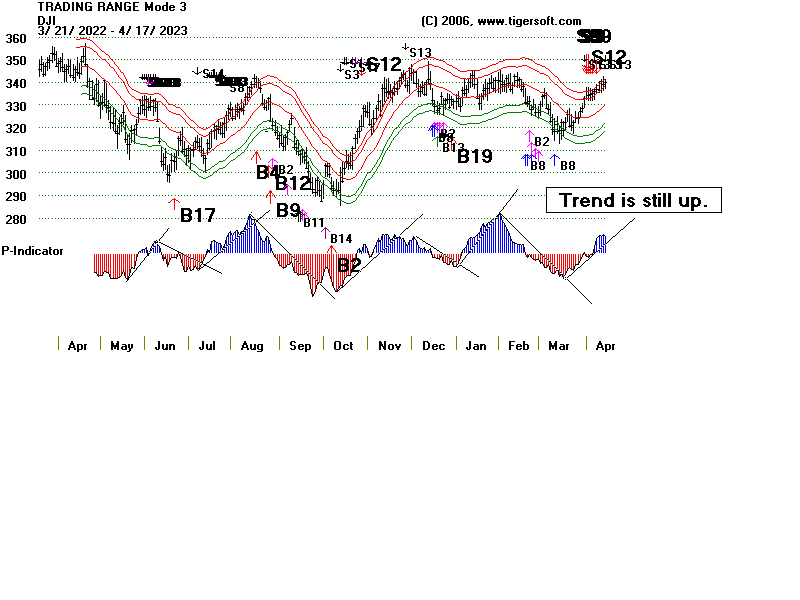
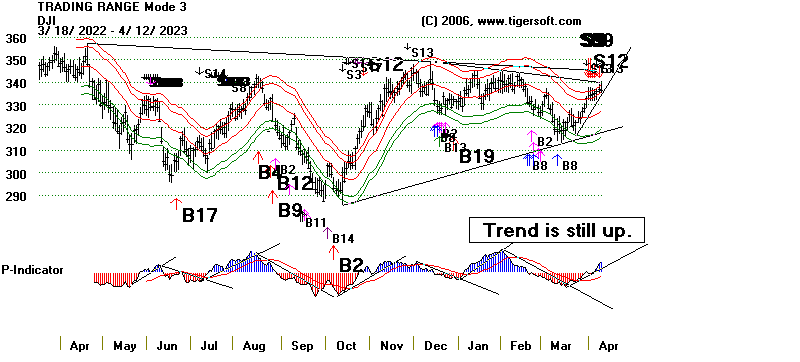
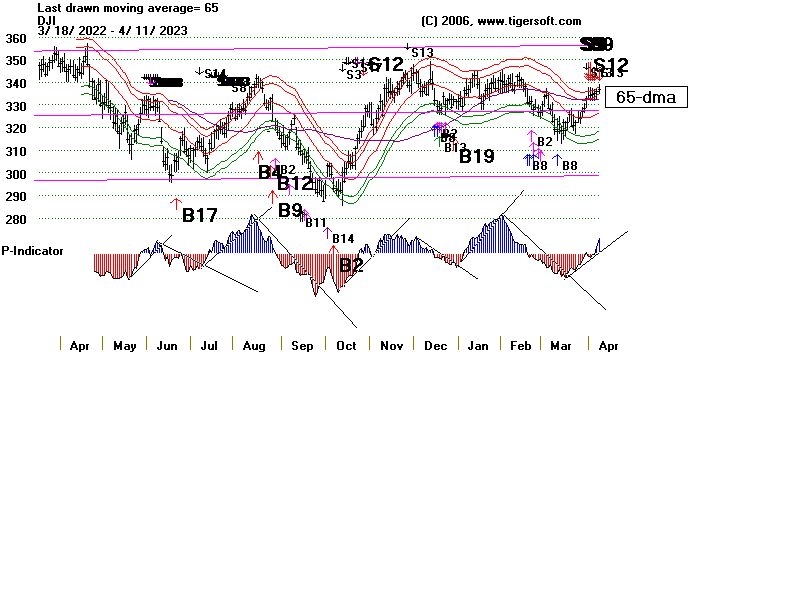
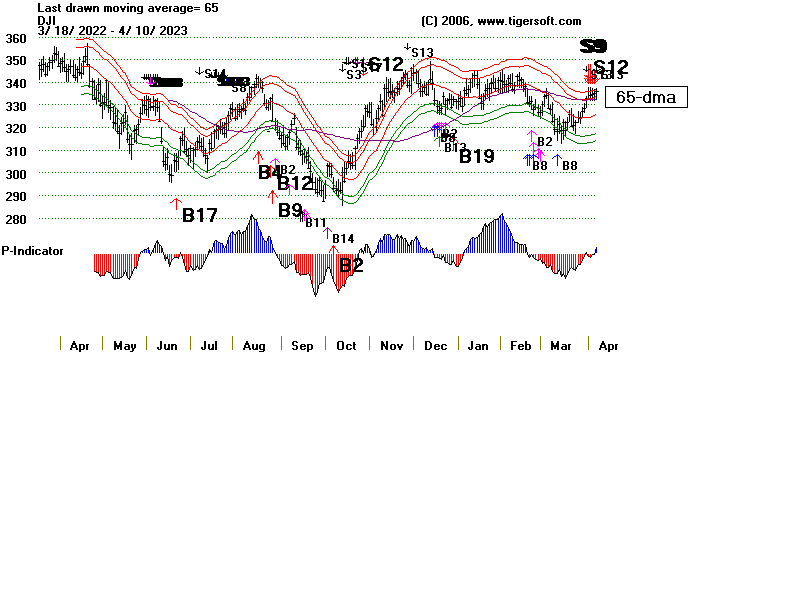
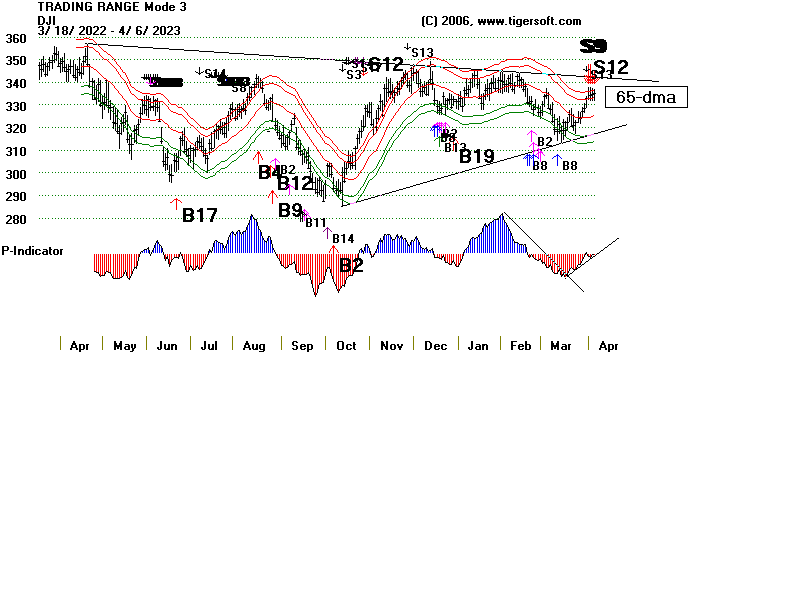
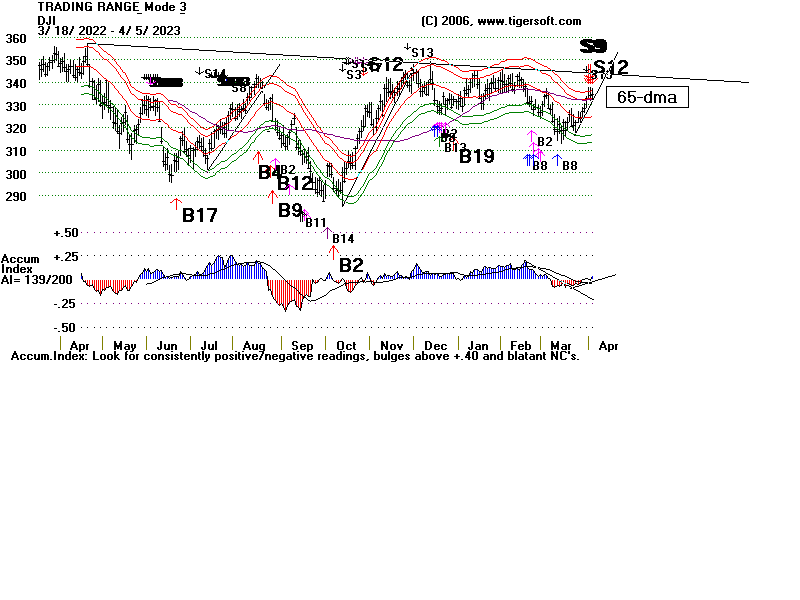
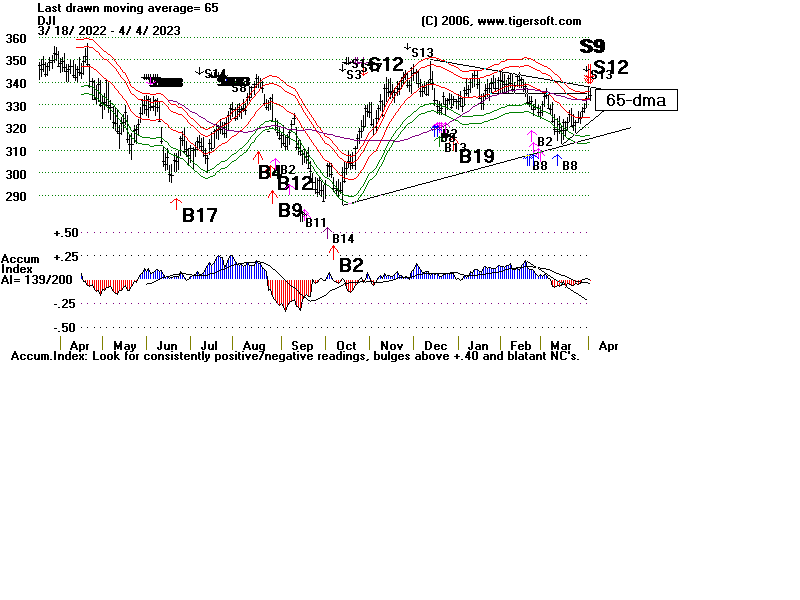
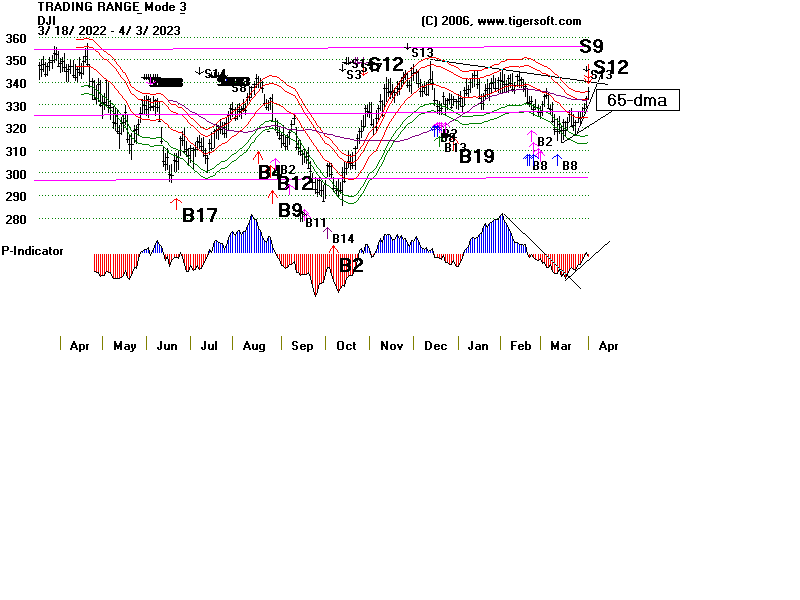