---TigerSoft HOTLINE --- 1/28/2022 (WRITTEN)
(C) 2022 William Schmidt, Ph.D. - All rights reserved.
www.tigersoftware.com/123ABCH/INDEX.htm
IMPORTANT
LOOK FOR AN EMAIL
SATURDAY GIVING NEW HOTLINE ADDRESS
STARTING SUNDAY NIGHT
====================================================================================
Always CLICK REFRESH. To refresh -
Point mouse at page and Hold down Control Key and hit F-5.
===> Please report any broken or
out-of-date links. william_schmidt@hotmail.com
Earlier Hotlines: www.tigersoftware.com/1111H/INDEX.htm
Hotline Help: See
bottom of this page...
January 28: 6:00 AM Futures - DJI -300
NASDAQ -100 Data used for 1/27/2022
| They key ETF's Closing Powers not only did not break their
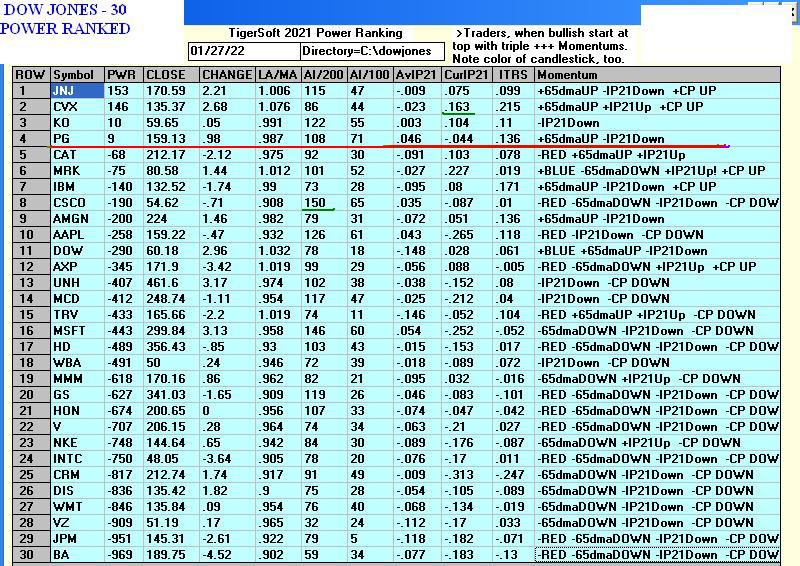
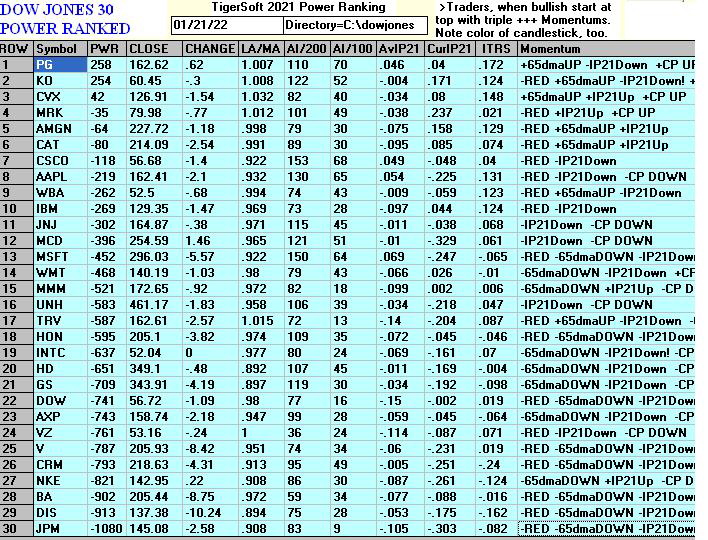
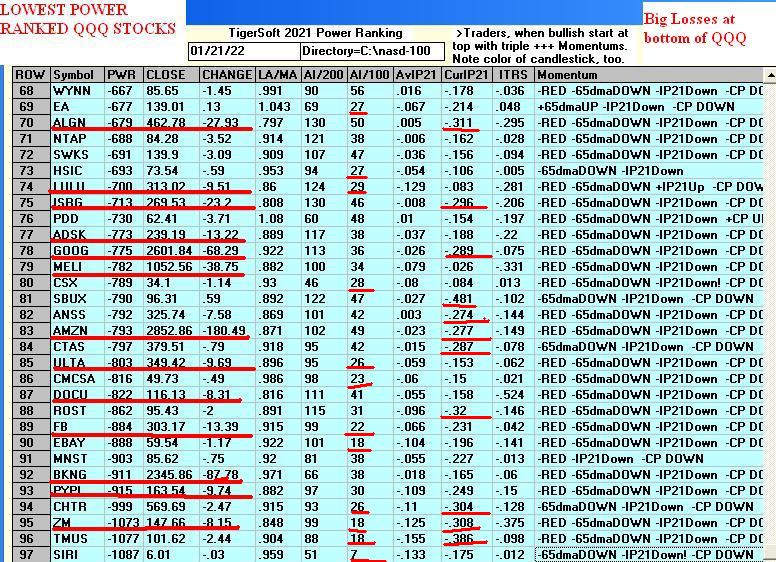
downtrends to indicate a recovery, they broke down to new lows and their IP21s (Accum. Indexes) joined them a negative new lows. In the context of an over-speculated bubble market, rising interest rates and only oil stocks acting now as leaders, this is a dangerous market. The disparity or contradiction between the DJI-30 and most stocks is enormous. This is very often the technical basis for a bear market. And when the divergences reach the degree that they have now, a bear market even in the blue chips occurs. Gold and silver are no longer havens. Eventually the blue-chips share the fate of the "glamour" stocks, the tech leaders (SOXL, QQQ and TECL). And if oil breaks its price uptrend and the Accumulation Index for UCO should turn negative, what's left to hold the market up. The DJI-30 is late or last to top out in many market cycles. The A/D Line can go down for months, as in 1929 or 1972-1973 or 1999-2000, without the DJIA collapsing. But eventually, it cracks its major support and gives way. First, it retreats to its 10%-13.5% support, then to its 19%-20% down support and then is falls through that last support and it, too, is hit by panic. That's where we are now. Watch to see if the DJI can still be shored up by the market makers who have that responsibility. The FED now has little lee-way. Short and stay short in the very weakest groups, Biotechs, Chinese stocks and Bonds. Look for them in the Bearish MINCPs. Holding long positions now is very risky. At the very least be hedged with shorts. |
||
|
Charts - 1/27/2022 2022 PEERLESS DJI, Signals, Indicators Daily DJI Volume 10-DayUp/Down Vol Stoch-20 Pct of All Stocks above 65-dma Inverted Traders Index Cum. Inverted Traders Index DJI-IPA DJI-OBV NASDAQ S&P OEX NYSE COMPQX DJI-15 DJI-20 DJI-30 DIA QQQ SPY IWM TNA Short-Term Rates DOLLAR-UUP ALLSTOCKs recent 2006 vers-Peerless signals http://tigersoftware.com/NEWPEER/UPD80127.BMP MDY - http://www.tigersoftware.com/CHARTZ/MDY.GIF USO-CrudeOil DBO FAS GLD HD IBB JETS JNUG KOL NUGT OIH PALL RSX RETL SDS AGQ SLV SOXL TAN TECL TLT TMF TNA UGA (gasoline) USO (oil) and China YINN CHAU Commodities: CANE CORN DBC JJC, NIB CORN, CUT (paper) MOO, SOYB WEAT UUP (Dollar) LIT (Lithium) STOCKS: MRNA DIS GE PYPL GME ZOM XLE NRGU AAPL ADBE ALXN AMAT AMGN AMD AMZN AXP BA BABA BAC BIDU BLDP CAT CRM CVX CMG DE ENPH FB GILD GOOG GS HD IBM INTU JPM LRCX M MRK MSFT NEM NFLX NKE NKE NVDA PG PYPL REGN REV SO SQ QCOM QDEL TSLA TXN XOM V VRTX WFC WMT ZM Bullish MAXCPs http://tigersoftware.com/UPPER/1-27/BULLISH.htm Bearish MAXCPs http://tigersoftware.com/DOWNER/1-27/BEARISH.htm |
Slow computer tonight. Patience for rest of Hotline, please.
 |
 |
 |
 |
 |
 |
 |
 |
 |
 |
Table 1 QUICKSILVER on ETFS - 1/26//2022 Bullish = 2 - Dollar Bearish = 7 - IWM, RETL, SOXL. TECL. IBB, YINN, Russia ETF CLOSE CHANGE PIVOT-PT 5-dma AROC CL-PWR CANDLE IP21 ITRS POWER INDEX ================================================================================================== DIA 341.55 .09 342.35 -84.1% Bearish RED -.038 --- ----- --------------------------------------------------------------------------------------------- SPY 431.24 -2.14 437.98 -176.9% Bearish RED -.133 -.023 -.156 --------------------------------------------------------------------------------------------- QQQ 341.1 -3.47 351.69 -293.5% Bearish RED -.186 -.081 -.267 --------------------------------------------------------------------------------------------- MDY 460.61 -7.2 472.3 -210.4% Bearish RED -.124 -.077 -.201 --------------------------------------------------------------------------------------------- IWM 191.52 -4.45 196.99 -232.1% Bearish RED -.249 -.143 -.392 --------------------------------------------------------------------------------------------- FAS 119.09 -2.79 119.53 -344% Bearish RED .022 -.116 -.094 --------------------------------------------------------------------------------------------- RETL 22.73 -.61 22.56 -177.2% ------- RED -.104 -.527 -.631 --------------------------------------------------------------------------------------------- SOXL 36.36 -5.76 43.71 -1107.1% Bearish RED -.236 -.37 -.606 --------------------------------------------------------------------------------------------- TECL 56.15 -1.1 59.57 -602% Bearish RED -.17 -.23 -.4 --------------------------------------------------------------------------------------------- IBB 123.68 -2.54 128.68 -271% Bearish RED -.16 -.138 -.298 --------------------------------------------------------------------------------------------- GLD 167.6 -2.19 171.09 -118.1% ------- RED .087 .017 .104 --------------------------------------------------------------------------------------------- OIH 226.32 -4.1 213.46 174.6% Bullish RED .064 .162 .226 --------------------------------------------------------------------------------------------- CPER 26.92 -.25 27.45 -120.9% ------- RED -.127 .054 -.073 --------------------------------------------------------------------------------------------- UUP 26.06 .22 25.61 73.9% ------- ---- .237 .071 .308 --------------------------------------------------------------------------------------------- CORN 22.41 -.16 22.26 78.4% Bullish RED .1 .098 .198 --------------------------------------------------------------------------------------------- WEAT 7.43 -.17 7.44 -59.2% Bullish RED .203 -.017 .186 --------------------------------------------------------------------------------------------- YINN 7.97 -.45 9.37 -1079.1% ------- RED -.046 -.268 -.314 --------------------------------------------------------------------------------------------- RSX 23.23 1.25 23.01 -70.8% Bearish RED -.076 -.204 -.28 |
Table 2    Count of Stocks in Key Directories
           20220127
-------------------------------
NEWHIGHS       58
NEWLOWS        1372  bearish
MAXCP          10
MINCP          450 approx.
TTTNH          27
TTTNL          334
CPCROSSA       19
CPCROSSD       90
ACCUMVER       6
HIGHIP21       4
HIUPPCT        5
VHIP21         69
LOWACCUM       217
REDSELL        142
AUGSELS7       18
TRAPDOOR       29
|
 Table 3   RANKING OF KEY DIRECTORIES BASED PCT.OF STOCKS ABOVE 65-DMA
              1/27/22
Bullish = 6 Bearish = 43 --------------------------------------------------------------------------------------- Directory Current day-1 day-2 day-3 day-4 day-5 ---------------------------------------------------------------------------------------- COAL 1 1 .833 .833 .833 1 COPPER .75 .75 .875 .875 .875 .875 OILGAS .695 .714 .704 .638 .638 .742 UTILITY .615 .564 .589 .564 .641 .641 FOOD .551 .693 .734 .714 .734 .755 COMODITY .512 .641 .692 .666 .692 .717 ============================================================================================== SP-100 .433 .444 .466 .444 .444 .511 BIGBANKS .428 .428 .285 .285 .285 .285 DOWJONES .4 .366 .4 .333 .366 .5 INSURANC .4 .48 .48 .48 .32 .56 DJI-13 .384 .384 .384 .307 .307 .461 REGBANKS .36 .48 .52 .6 .44 .48 BEVERAGE .357 .5 .571 .571 .642 .571 FIDSTKS .331 .343 .384 .372 .36 .449 FINANCE .327 .339 .38 .369 .357 .446 INDMATER .305 .333 .388 .416 .361 .527 SP500 .28 .298 .332 .334 .33 .384 INDEXES .248 .275 .297 .286 .318 .356 INFRA .242 .272 .272 .272 .272 .303 JETS .214 .214 .214 .214 .214 .428 CHEM .195 .217 .282 .26 .217 .326 HOSPITAL .187 .25 .25 .25 .312 .312 ETFS .181 .181 .181 .181 .254 .363 CHINA .18 .18 .16 .2 .2 .32 SOFTWARE .178 .196 .196 .196 .214 .214 EDU .166 .166 .166 .166 .166 .166 GAMING .157 .157 .157 .21 .21 .21 HACKERS .157 .21 .21 .21 .21 .21 TRANSP .157 .157 .157 .21 .21 .315 MILITARY .153 .423 .423 .461 .384 .538 NASD-100 .144 .164 .154 .195 .216 .257 RETAIL .127 .127 .148 .17 .106 .106 AUTO .113 .113 .113 .188 .188 .188 GOLD .108 .304 .456 .391 .413 .521 RUS-1000 .108 .136 .154 .144 .144 .189 GREEN .105 .105 .105 .157 .157 .105 COMPUTER .1 .1 .05 .15 .2 .35 NIFTY .086 .152 .13 .173 .195 .282 LOWPRICE .083 .106 .117 .096 .122 .15 BIOTECH .082 .098 .098 .098 .09 .101 GUNS .076 .153 .153 .076 .076 .076 ELECTRON .075 .12 .082 .097 .097 .127 REIT .069 .13 .161 .138 .13 .176 HIGHPRIC .065 .065 .072 .087 .087 .116 SEMI .052 .094 .073 .126 .094 .147 BONDFUND 0 0 0 0 0 .011 HOMEBLDG 0 0 .111 .111 .055 .055 MARIJUAN 0 0 0 0 0 0 SOLAR 0 0 0 0 0 0 |
==================================================================================
==================================================================================
January 27: 6:00 AM Futures - DJI +87 NASDAQ +101
Data used for 1/26/2022
| Watch to see if the key Closing Powers break their
downtrends. The FED said next month that they will begin to raise rates. They could have begun this month, but Chairman Powell chose to wait. The medicine of low rates will feed the market awhile longer. The 10-year Bonds' rate hit almost 1.9% today. That is still very low historically. As if to show they were not ready to tighten, short term rates bullishly fell again. The trick here I believe is to understand that the FED is most interested in the big indexes, the DJI, SPY and QQQ. So, if their Closing Powers break their downtrends, these will go back up to a level achieving a 50% recovery of what they have just lost. That will bring somewhat more inflation. Oil stocks should be good performers in here. But Bonds and Biotechs will remain very weak. With our short sales, cover them if they break their Closing Power trends or they rise more than 10% on a closing basis above their lowest closings. The rally today before the opening reverses earlier weakness this morning... It will be important that the rally this morning not give way to another round of selling like we saw yesterday. 600-800 plus intra-day point swings are becoming something to be expected. Opinions about where the market are very widely different now and professionals and market-makers are taking advantage of this. The best way to trade in this environment is to be long the strongest and short the weakest. Only day traders should play the leveraged ETFs in my opinion at this stage. |
||
|
Charts - 1/26/2022 2022 PEERLESS DJI, Signals, Indicators Daily DJI Volume 10-DayUp/Down Vol Stoch-20 Pct of All Stocks above 65-dma Inverted Traders Index Cum. Inverted Traders Index DJI-IPA DJI-OBV NASDAQ S&P OEX NYSE COMPQX DJI-15 DJI-20 DJI-30 DIA QQQ SPY IWM TNA Short-Term Rates DOLLAR-UUP ALLSTOCKs recent 2006 vers-Peerless signals http://tigersoftware.com/NEWPEER/UPD80126.BMP MDY - http://www.tigersoftware.com/CHARTZ/MDY.GIF USO-CrudeOil DBO FAS GLD HD IBB JETS JNUG KOL NUGT OIH PALL RSX RETL SDS AGQ SLV SOXL TAN TECL TLT TMF TNA UGA (gasoline) USO (oil) and China YINN CHAU Commodities: CANE CORN DBC JJC, NIB CORN, CUT (paper) MOO, SOYB WEAT UUP (Dollar) LIT (Lithium) STOCKS: MRNA DIS GE PYPL GME ZOM XLE NRGU AAPL ADBE ALXN AMAT AMGN AMD AMZN AXP BA BABA BAC BIDU BLDP CAT CRM CVX CMG DE ENPH FB GILD GOOG GS HD IBM INTU JPM LRCX M MRK MSFT NEM NFLX NKE NKE NVDA PG PYPL REGN REV SO SQ QCOM QDEL TSLA TXN XOM V VRTX WFC WMT ZM Bullish MAXCPs http://tigersoftware.com/UPPER/1-26/BULLISH.htm Bearish MAXCPs http://tigersoftware.com/DOWNER/1-26/BEARISH.htm |
 |
 |
 |
 |
 |
 |
 |
 |
 |
 |
 |
| Tables |
Table 1 QUICKSILVER on ETFS - 1/26//2022 Bullish = 2 - Dollar Wheat Bearish = 4 - IWM, RETL, SOXL. TECL. IBB, YINN, Russia ETF CLOSE CHANGE PIVOT-PT 5-dma AROC CL-PWR CANDLE IP21 ITRS POWER INDEX ================================================================================================== DIA 341.46 -1.5 347.33 -128.7% Bearish RED -.001 ---- ---- --------------------------------------------------------------------------------------------- SPY 433.38 -1.09 446.75 -207.7% Bearish RED -.099 -.018 -.117 --------------------------------------------------------------------------------------------- QQQ 344.57 -.54 361.72 -308% Bearish RED -.158 -.072 -.23 --------------------------------------------------------------------------------------------- MDY 467.81 -4.99 480.6 -223.7% Bearish RED -.089 -.061 -.15 --------------------------------------------------------------------------------------------- IWM 195.97 -2.87 200.75 -211.5% Bearish RED -.225 -.127 -.352 --------------------------------------------------------------------------------------------- FAS 121.88 1.01 127.49 -336.1% Bearish RED .033 -.097 -.064 --------------------------------------------------------------------------------------------- RETL 23.34 -1.94 23.59 -593.6% ------- RED -.105 -.51 -.615 --------------------------------------------------------------------------------------------- SOXL 42.12 1.93 45.99 -961.7% Bearish RED -.185 -.28 -.465 --------------------------------------------------------------------------------------------- TECL 57.25 .93 63.3 -710.8% Bearish RED -.153 -.218 -.371 --------------------------------------------------------------------------------------------- IBB 126.22 -1.37 130.65 -216.2% Bearish RED -.132 -.126 -.258 --------------------------------------------------------------------------------------------- GLD 169.79 -2.79 171.65 -66.6% ------- RED .125 .028 .153 --------------------------------------------------------------------------------------------- OIL 15.02 .11 14.86 43.7% Bullish ---- -.082 .073 -.009 --------------------------------------------------------------------------------------------- OIH 230.42 .98 218.57 203.8% Bullish RED .09 .171 .261 --------------------------------------------------------------------------------------------- CPER 27.17 -.01 27.58 14.7% ------- RED -.123 .054 -.069 --------------------------------------------------------------------------------------------- UUP 25.84 .14 25.68 46.8% Bullish BLUE .192 .068 .26 --------------------------------------------------------------------------------------------- CORN 22.57 .17 22.06 85.4% Bullish BLUE .108 .103 .211 --------------------------------------------------------------------------------------------- WEAT 7.6 -.18 7.52 6.6% Bullish RED .22 .012 .232 --------------------------------------------------------------------------------------------- YINN 8.42 -.55 9.94 -377.6% ------- RED -.027 -.243 -.27 --------------------------------------------------------------------------------------------- RSX 21.98 -.46 23.55 -417.8% Bearish RED -.078 -.242 -.32 |
Table 3      Count of Stocks in Key Directories
          20220126
-------------------------------
NEWHIGHS       78
NEWLOWS        565
MAXCP          6
MINCP          246
TTTNH          25
TTTNL          279
CPCROSSA       10
CPCROSSD       191
ACCUMVER       7
HIGHIP21       3
HIUPPCT        29
VHIP21         71
LOWACCUM       224
REDSELL        119
AUGSELS7       21
TRAPDOOR       8
|
 Table 3   RANKING OF KEY DIRECTORIES BASED PCT.OF STOCKS ABOVE 65-DMA
              1/26/22
  Bullish = 5
  Bearish = 43
---------------------------------------------------------------------------------------
Directory     Current       day-1         day-2         day-3         day-4         day-5
----------------------------------------------------------------------------------------
COAL           1             .833          .833          .833          1             1
COPPER         .75           .875          .875          .875          .875          .875
OILGAS         .714          .704          .638          .638          .723          .78
FOOD           .693          .734          .714          .734          .734          .816
COMODITY       .641          .692          .666          .692          .692          .794
UTILITY        .564          .589          .564          .641          .641          .641
==============================================================================================
BEVERAGE       .5            .571          .571          .642          .571          .642
==============================================================================================
INSURANC       .48           .48           .48           .32           .56           .6
REGBANKS       .48           .52           .6            .44           .48           .72
SP-100         .444          .466          .444          .444          .511          .6
BIGBANKS       .428          .285          .285          .285          .285          .428
MILITARY       .423          .423          .461          .384          .538          .653
DJI-13         .384          .384          .307          .307          .461          .615
DOWJONES       .366          .4            .333          .366          .5            .6
FIDSTKS        .343          .384          .372          .36           .449          .508
FINANCE        .339          .38           .369          .357          .446          .505
INDMATER       .333          .388          .416          .361          .513          .597
GOLD           .304          .456          .391          .413          .521          .76
SP500          .298          .332          .334          .33           .384          .456
INDEXES        .281          .297          .286          .318          .367          .372
INFRA          .272          .272          .272          .272          .303          .393
HOSPITAL       .25           .25           .25           .312          .312          .312
CHEM           .217          .282          .26           .217          .304          .434
JETS           .214          .214          .214          .214          .428          .357
HACKERS        .21           .21           .21           .21           .21           .21
SOFTWARE       .196          .196          .196          .214          .214          .25
ETFS           .181          .181          .181          .254          .345          .327
CHINA          .18           .16           .2            .2            .3            .26
EDU            .166          .166          .166          .166          .166          .166
NASD-100       .164          .154          .195          .216          .268          .309
GAMING         .157          .157          .21           .21           .21           .21
TRANSP         .157          .157          .21           .21           .315          .263
GUNS           .153          .153          .076          .076          .076          .23
NIFTY          .152          .13           .173          .195          .282          .304
RUS-1000       .136          .154          .144          .144          .192          .235
REIT           .13           .153          .146          .13           .2            .3
RETAIL         .127          .148          .17           .106          .106          .148
ELECTRON       .12           .082          .097          .097          .127          .172
AUTO           .113          .113          .188          .188          .188          .283
LOWPRICE       .109          .114          .094          .122          .15           .175
GREEN          .105          .105          .157          .157          .105          .21
COMPUTER       .1            .05           .15           .2            .35           .4
BIOTECH        .098          .098          .098          .09           .104          .12
SEMI           .094          .073          .126          .094          .147          .189
HIGHPRIC       .065          .072          .087          .087          .116          .141
BONDFUND       0             0             0             0             .011          .022
HOMEBLDG       0             .111          .111          .055          .055          .166
MARIJUAN       0             0             0             0             0             .25
SOLAR          0             0             0             0             0             0
|
====================================================================================
====================================================================================
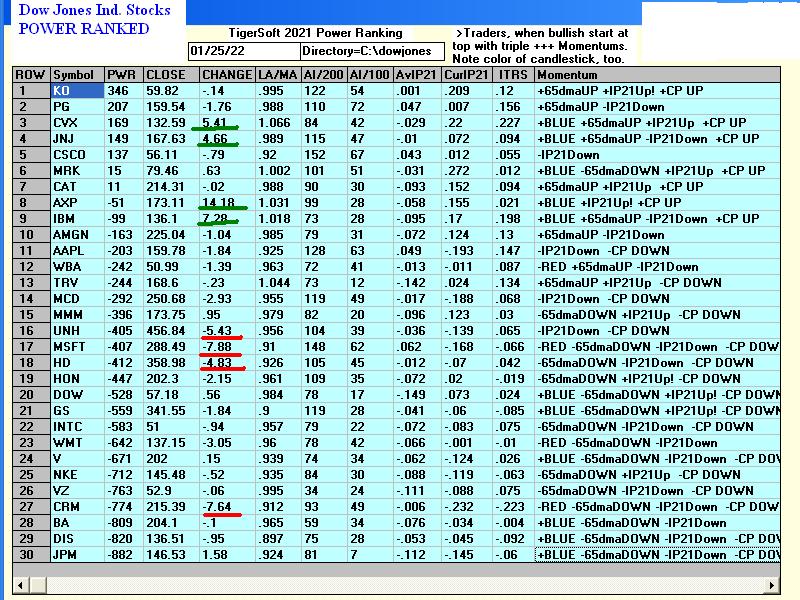
January 25: 6:00 AM Futures - DJI +370 NASDAQ +300
Data used for 1/25/2022
| The FED may be ready to announce a reversal away from a set
of tighter money policies. The leak about this to well-financed Professionals on Wall Street would account for the big jumps in our Closing Power in the last few days and the +400 point jump today before the Opening. The Powell crew at the FED turned on a dime on December 26th in 2018 after President Trump turned up the heat on them. This time around, I suspect that Wall Street's "cry-baby" routine was enough to get the FED to promise that they would moderate their plans for higher interest rates and a big reduction in their very bloated collection of debt intruments. If they do turn away from a tighter monetary policy to fight 7% inflation, it will be very inflationary and stocks should soar. It will make Powell seem timid and unwilling to tolerate even a 10% decline in the DJIA. Volatile tech growth stocks will quickly get the same message. If this is so, we will turn back on our QE-Infinity signals. So, today as the FED's Open Market Committee meets, we will eagerly await its outcome and how Professionals and our Closing Power behave. The key Closing Powers we watch each night are sitting on their downtrends and bear watching. If they do break above their downtrends, look for rallies by DIA, SPY, QQQ, TECL and SOXL. If the FED simply says inflation is retreating now, they may go all the way back to their 50% retracement levels and the points of recent breakdown. Instead of going long SOXL or QQQ, I would prefer to buy more Oil stocks that show high AI/200, AI/100 and IP21 scores. Buy the top ranked MAXCPs and the oil stocks whose graphs are shown just below. As for our short positions, we will cover them when their Closing Power downtrends are broken or they close more than 10% above their lows. |
||
|
Charts - 1/25/2022 2022 PEERLESS DJI, Signals, Indicators Daily DJI Volume 10-DayUp/Down Vol Stoch-20 Pct of All Stocks above 65-dma Inverted Traders Index Cum. Inverted Traders Index DJI-IPA DJI-OBV NASDAQ S&P OEX NYSE COMPQX DJI-15 DJI-20 DJI-30 DIA QQQ SPY IWM TNA Short-Term Rates DOLLAR-UUP ALLSTOCKs recent 2006 vers-Peerless signals http://tigersoftware.com/NEWPEER/UPD80126.BMP MDY - http://www.tigersoftware.com/CHARTZ/MDY.GIF USO-CrudeOil DBO FAS GLD HD IBB JETS JNUG KOL NUGT OIH PALL RSX RETL SDS AGQ SLV SOXL TAN TECL TLT TMF TNA UGA (gasoline) USO (oil) and China YINN CHAU Commodities: CANE CORN DBC JJC, NIB CORN, CUT (paper) MOO, SOYB WEAT UUP (Dollar) LIT (Lithium) STOCKS: MRNA DIS GE PYPL GME ZOM XLE NRGU AAPL ADBE ALXN AMAT AMGN AMD AMZN AXP BA BABA BAC BIDU BLDP CAT CRM CVX CMG DE ENPH FB GILD GOOG GS HD IBM INTU JPM LRCX M MRK MSFT NEM NFLX NKE NKE NVDA PG PYPL REGN REV SO SQ QCOM QDEL TSLA TXN XOM V VRTX WFC WMT ZM Bullish MAXCPs http://tigersoftware.com/UPPER/1-25/BULLISH.htm Bearish MAXCPs http://tigersoftware.com/DOWNER/1-25/BEARISH.htm |
|
POWELL shifts easily from Tight to almost "FREE Money". He does what he is told by the President and Wall Street. Inflation-fighting is not a priority. December 2018. Note how quickly market recovers to new highs.  |
| Current KEY CHARTS |
 |
 |
 |
 |
 |
 |
 |
| |
| 3 Attractive Oil Stocks |
 |
 |
Table 1 QUICKSILVER on ETFS - 1/25//2022 Bullish = 2 - GLD Wheat Bearish = 4 - IWM, RETL, SOXL. TECL. Russia ETF CLOSE CHANGE PIVOT-PT 5-dma AROC CL-PWR CANDLE IP21 ITRS POWER INDEX ================================================================================================= DIA 342.96 -.85 350.35 -156.7% Bearish BLUE .057 0 ------ --------------------------------------------------------------------------------------------- COMPQX 13539.3 -315.83 14340.26 -342.5% Bearish RED -.141 -.092 -.233 --------------------------------------------------------------------------------------------- SPY 434.47 -5.37 451.75 -246.6% Bearish BLUE -.044 -.017 -.061 --------------------------------------------------------------------------------------------- QQQ 345.11 -8.19 366.48 -352.6% Bearish RED -.099 -.071 -.17 --------------------------------------------------------------------------------------------- MDY 472.8 -8.52 489.25 -238.5% Bearish RED -.031 -.057 -.088 --------------------------------------------------------------------------------------------- IWM 198.84 -2.69 204.45 -222.2% Bearish BLUE -.167 -.123 -.29 --------------------------------------------------------------------------------------------- FAS 120.87 .18 130.2 -639% Bearish BLUE .063 -.107 -.044 --------------------------------------------------------------------------------------------- RETL 25.28 -1.25 26.29 -310% ------- BLUE -.05 -.471 -.521 --------------------------------------------------------------------------------------------- SOXL 40.19 -5.26 50.82 -1631.5% Bearish RED -.127 -.302 -.429 --------------------------------------------------------------------------------------------- TECL 56.32 -4.18 65.94 -980% Bearish RED -.086 -.214 -.3 --------------------------------------------------------------------------------------------- IBB 127.59 -2.27 131.83 -224.2% Bearish RED -.103 -.122 -.225 --------------------------------------------------------------------------------------------- GLD 172.58 .55 172.08 93.1% ------- BLUE .224 .037 .261 --------------------------------------------------------------------------------------------- OIL 14.91 .15 14.89 13.5% Bullish BLUE -.019 .053 .034 --------------------------------------------------------------------------------------------- OIH 229.44 11.87 221.45 99% Bullish BLUE .129 .142 .271 --------------------------------------------------------------------------------------------- CPER 27.18 .08 27.09 62.5% Bullish BLUE -.078 .056 -.022 --------------------------------------------------------------------------------------------- UUP 25.7 .01 25.6 7.8% ------- RED .118 .053 .171 --------------------------------------------------------------------------------------------- CORN 22.4 .05 22.19 126.5% Bullish ---- .118 .099 .217 --------------------------------------------------------------------------------------------- WEAT 7.78 .12 7.59 286.2% Bullish ---- .232 .029 .261 --------------------------------------------------------------------------------------------- YINN 8.97 .03 9.12 -16.2% Bullish BLUE .019 -.203 -.184 --------------------------------------------------------------------------------------------- RSX 22.44 .45 23.9 -110.5% ------- BLUE -.011 -.254 -.265 |
  Table 2  Count of Stocks in Key Directories
            20220125
-------------------------------
NEWHIGHS       43
NEWLOWS        440  Still 10:1 - bearish ratio
MAXCP          31
MINCP          45
TTTNH          24
TTTNL          91
CPCROSSA       176
CPCROSSD       31
ACCUMVER       6
HIGHIP21       10
HIUPPCT        23
VHIP21         71
LOWACCUM       221
REDSELL        382
AUGSELS7       14
TRAPDOOR       3
|
 Table 3   RANKING OF KEY DIRECTORIES BASED PCT.OF STOCKS ABOVE 65-DMA
             1/25/22
 Bullish = 8
 Bearish = 41
--------------------------------------------------------------------------------------- Directory Current day-1 day-2 day-3 day-4 day-5 ---------------------------------------------------------------------------------------- COPPER .875 .875 .875 .875 .875 .875 COAL .833 .833 .833 1 1 1 FOOD .734 .714 .734 .734 .836 .714 OILGAS .704 .638 .638 .723 .78 .8 COMODITY .692 .666 .692 .692 .82 .692 UTILITY .589 .564 .641 .641 .641 .589 BEVERAGE .571 .571 .642 .571 .642 .714 REGBANKS .52 .6 .44 .48 .72 .92 ====================================================================================================== INSURANC .48 .48 .32 .56 .6 .76 SP-100 .466 .444 .444 .511 .6 .633 GOLD .456 .391 .413 .521 .76 .26 MILITARY .423 .461 .384 .538 .653 .73 DOWJONES .4 .333 .366 .5 .6 .6 INDMATER .388 .416 .361 .513 .597 .583 DJI-13 .384 .307 .307 .461 .615 .615 FIDSTKS .384 .372 .36 .449 .502 .585 FINANCE .38 .369 .357 .446 .5 .583 SP500 .332 .334 .33 .384 .458 .517 INDEXES .297 .286 .318 .367 .372 .394 BIGBANKS .285 .285 .285 .285 .428 .428 CHEM .282 .26 .217 .304 .434 .543 INFRA .272 .272 .272 .303 .393 .484 HOSPITAL .25 .25 .312 .312 .312 .375 JETS .214 .214 .214 .428 .357 .5 HACKERS .21 .21 .21 .21 .21 .263 SOFTWARE .196 .196 .214 .214 .25 .25 ETFS .181 .181 .254 .345 .345 .29 EDU .166 .166 .166 .166 .166 .166 CHINA .16 .2 .2 .3 .26 .28 GAMING .157 .21 .21 .21 .21 .157 TRANSP .157 .21 .21 .315 .263 .315 NASD-100 .154 .195 .216 .268 .309 .371 RUS-1000 .154 .144 .144 .192 .23 .268 GUNS .153 .076 .076 .076 .23 .384 REIT .153 .138 .138 .2 .3 .438 RETAIL .148 .17 .106 .106 .148 .148 NIFTY .13 .173 .195 .282 .326 .369 LOWPRICE .117 .091 .119 .15 .17 .16 AUTO .113 .188 .188 .188 .283 .339 HOMEBLDG .111 .111 .055 .055 .166 .277 GREEN .105 .157 .157 .105 .21 .21 BIOTECH .098 .098 .09 .104 .115 .118 ELECTRON .082 .097 .097 .127 .172 .308 SEMI .073 .126 .094 .147 .189 .315 HIGHPRIC .072 .087 .087 .116 .141 .16 COMPUTER .05 .15 .2 .35 .4 .5 BONDFUND 0 0 0 .011 .022 .022 MARIJUAN 0 0 0 0 .25 .25 SOLAR 0 0 0 0 0 0 |
====================================================================================
January 25: 5:30 AM Futures - DJI -
272 NASDAQ -295 Data used for 1/24/2022
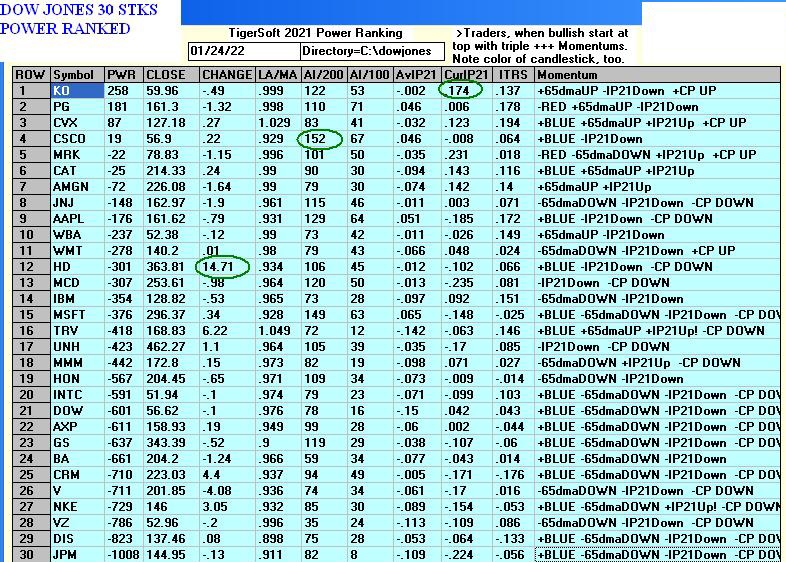
| The operative Peerless Signal remains a Sell S16. The key index and major market ETFs all show falling Closing Powers. This means that Professionals remain preponderately bearish despite whatever spooked the wild short-covering rally today. The DJI itself was inordinately influenced by Home Depot's 14.71 point gain. So, it probably had to do with a bullish "leak" from the FED. Notice that short-term interest and 10-year rates have not risen in the last three trading days. I found 17 previous occurrences where the DJI's hypothetical low was 3.7% or more below the previous day's close and the DJI still managed to close up for the day like today. Half of these occured in the 1930s. These are almost all late in a bear market phenomenon. In five cases the DJI rose in the two-four weeks afterward but in twelve cases the DJI fell significantly to new lows. From this, I would suggest the odds are 70.6% than the DJI will make more new lows within the next month 10% or more down from the recent highs. Bullish news, like Neville Chamberlain's returning to England after meeting Hitler and saying that "there will be peace in our times" rather than war over Czechoslavakia brought about a wild reversal up in 1938. But most of the time, the reversal up gives way to a decline to a new low below the reversay's low. We see this in 1929, 1962, 1987 and 2020, for example. See these charts here. http://www.tigersoftware.com/BEARISH/BIGRDS.htm So stay short the bearish MINCPs. Be careful with your longs. Limit your potential losses here by watching for Closing Power uptrends. |
||
|
Charts - 1/24/2022 2022 PEERLESS DJI, Signals, Indicators Daily DJI Volume 10-DayUp/Down Vol Stoch-20 Pct of All Stocks above 65-dma Inverted Traders Index Cum. Inverted Traders Index DJI-IPA DJI-OBV NASDAQ S&P OEX NYSE COMPQX DJI-15 DJI-20 DJI-30 DIA QQQ SPY IWM TNA Short-Term Rates DOLLAR-UUP ALLSTOCKs recent 2006 vers-Peerless signals http://tigersoftware.com/NEWPEER/UPD80124.BMP MDY - http://www.tigersoftware.com/CHARTZ/MDY.GIF USO-CrudeOil DBO FAS GLD HD IBB JETS JNUG KOL NUGT OIH PALL RSX RETL SDS AGQ SLV SOXL TAN TECL TLT TMF TNA UGA (gasoline) USO (oil) and China YINN CHAU Commodities: CANE CORN DBC JJC, NIB CORN, CUT (paper) MOO, SOYB WEAT UUP (Dollar) LIT (Lithium) STOCKS: MRNA DIS GE PYPL GME ZOM XLE NRGU AAPL ADBE ALXN AMAT AMGN AMD AMZN AXP BA BABA BAC BIDU BLDP CAT CRM CVX CMG DE ENPH FB GILD GOOG GS HD IBM INTU JPM LRCX M MRK MSFT NEM NFLX NKE NKE NVDA PG PYPL REGN REV SO SQ QCOM QDEL TSLA TXN XOM V VRTX WFC WMT ZM Bullish MAXCPs http://tigersoftware.com/UPPER/1-24/BULLISH.htm Bearish MAXCPs http://tigersoftware.com/DOWNER/1-24/BEARISH.htm |
 |
 |
 |
 |
 |
 |
 |
 |
 |
 |
 |
 |
 |
Table 1 QUICKSILVER on ETFS - 1/24//2022 Bullish = 3 - GLD Wheat CORN Bearish = 4 - IWM, RETL, SOXL. Russia ETF CLOSE CHANGE PIVOT-PT 5-dma AROC CL-PWR CANDLE IP21 ITRS POWER INDEX
=================================================================================================
DIA 343.81 1.46 353.85 -218.6% Bearish BLUE .008 ---- -----
---------------------------------------------------------------------------------------------
SPY 439.84 1.86 456.49 -275.5% Bearish BLUE -.058 -.003 -.061
---------------------------------------------------------------------------------------------
QQQ 353.3 1.61 370.55 -364.8% Bearish BLUE -.078 -.045 -.123
---------------------------------------------------------------------------------------------
MDY 481.32 9.02 495.88 -259.6% Bearish BLUE -.029 -.034 -.063
---------------------------------------------------------------------------------------------
IWM 201.53 4.54 207.83 -311.9% Bearish BLUE -.181 -.103 -.284
---------------------------------------------------------------------------------------------
FAS 120.69 1.16 137.1 -986.2% Bearish BLUE .01 -.1 -.09
---------------------------------------------------------------------------------------------
RETL 26.53 3.97 26.84 -429.7% ------- BLUE -.033 -.426 -.459
---------------------------------------------------------------------------------------------
SOXL 45.45 1.74 55.98 -1822.9% Bearish BLUE -.084 -.168 -.252
---------------------------------------------------------------------------------------------
TECL 60.5 .93 68.79 -1026.5% Bearish BLUE -.072 -.144 -.216
---------------------------------------------------------------------------------------------
IBB 129.86 1.18 133.46 -342.5% Bearish BLUE -.075 -.106 -.181
---------------------------------------------------------------------------------------------
GLD 172.03 .94 169.39 69.1% ------- BLUE .241 .041 .282
---------------------------------------------------------------------------------------------
OIL 14.76 -.14 14.87 37.1% Bullish ---- -.038 .044 .006
---------------------------------------------------------------------------------------------
OIH 217.57 4.11 225.1 -240.3% Bullish BLUE .063 .085 .148
---------------------------------------------------------------------------------------------
CPER 27.1 -.35 26.84 0% ------- BLUE -.062 .08 .018
---------------------------------------------------------------------------------------------
UUP 25.69 .08 25.66 37.1% ------- ---- .08 .056 .136
---------------------------------------------------------------------------------------------
CORN 22.35 .09 21.84 118% Bullish BLUE .259 .094 .353
---------------------------------------------------------------------------------------------
WEAT 7.66 .22 7.35 351% Bullish BLUE .294 .027 .321
---------------------------------------------------------------------------------------------
YINN 8.94 -.43 9 -219.1% ------- ---- .032 -.119 -.087
---------------------------------------------------------------------------------------------
RSX 21.99 -1.02 22.95 -608.7% Bearish BLUE -.085 -.259 -.344
|
 Table 2   Count of Stocks in Key Directories
            20220124
-------------------------------
NEWHIGHS       25
NEWLOWS        2547
MAXCP          10
MINCP          66
TTTNH          20
TTTNL          207
CPCROSSA       286
CPCROSSD       11
ACCUMVER       7
HIGHIP21       9
HIUPPCT        17
VHIP21         71
LOWACCUM       247
REDSELL        252
AUGSELS7       15
TRAPDOOR       10
|
Tabke 3      RANKING OF KEY DIRECTORIES BASED PCT.OF STOCKS ABOVE 65-DMA
                1/24/22
Bullish = 8 Bearish = 41 --------------------------------------------------------------------------------------- Directory Current day-1 day-2 day-3 day-4 day-5 ---------------------------------------------------------------------------------------- COPPER .875 .875 .875 .875 .625 .875 COAL .833 .833 1 1 1 1 FOOD .714 .734 .734 .836 .734 .673 COMODITY .666 .692 .692 .82 .641 .666 OILGAS .638 .638 .723 .78 .8 .828 REGBANKS .6 .44 .48 .72 .92 .92 BEVERAGE .571 .642 .571 .642 .714 .785 UTILITY .564 .641 .641 .641 .589 .641 ================================================================================================= INSURANC .48 .32 .56 .6 .76 .92 MILITARY .461 .384 .538 .653 .73 .769 SP-100 .444 .444 .511 .6 .633 .733 INDMATER .416 .361 .513 .597 .555 .694 GOLD .391 .413 .521 .76 .239 .347 FIDSTKS .372 .36 .449 .502 .585 .662 FINANCE .369 .357 .446 .5 .583 .66 SP500 .334 .33 .384 .458 .517 .603 DOWJONES .333 .366 .5 .6 .6 .733 DJI-13 .307 .307 .461 .615 .615 .769 INDEXES .286 .318 .367 .372 .394 .502 BIGBANKS .285 .285 .285 .428 .428 .571 INFRA .272 .272 .303 .393 .484 .606 CHEM .26 .217 .304 .434 .521 .586 HOSPITAL .25 .312 .312 .312 .375 .687 JETS .214 .214 .428 .357 .5 .857 GAMING .21 .21 .21 .21 .157 .052 HACKERS .21 .21 .21 .21 .263 .315 TRANSP .21 .21 .315 .263 .315 .684 CHINA .2 .2 .3 .26 .26 .28 SOFTWARE .196 .214 .214 .25 .25 .321 NASD-100 .195 .216 .268 .309 .371 .443 AUTO .188 .188 .188 .283 .339 .49 ETFS .181 .254 .345 .345 .309 .509 NIFTY .173 .195 .282 .326 .369 .391 RETAIL .17 .106 .106 .148 .148 .234 EDU .166 .166 .166 .166 .166 .333 GREEN .157 .157 .105 .21 .21 .157 COMPUTER .15 .2 .35 .4 .5 .55 RUS-1000 .144 .144 .192 .23 .27 .341 REIT .138 .13 .207 .3 .438 .584 SEMI .126 .094 .147 .189 .315 .463 HOMEBLDG .111 .055 .055 .166 .277 .5 BIOTECH .098 .09 .104 .115 .118 .156 ELECTRON .097 .097 .127 .172 .308 .428 LOWPRICE .094 .117 .147 .17 .16 .183 HIGHPRIC .087 .087 .116 .141 .16 .247 GUNS .076 .076 .076 .23 .384 .384 BONDFUND 0 0 .011 .022 .022 .045 MARIJUAN 0 0 0 .25 .25 .25 SOLAR 0 0 0 0 0 0 |
===================================================================================
January 24: 6:00 AM Futures - DJI -
150 NASDAQ -160 Data used for 1/21/2022
| The operative Peerless Signal remains a Sell S16. Support levels are being broken below as a knife goes through butter. Early pre-opening strength gives way. This morning the DJI futures were up +250. Now they are down 150. The well-tested DJI rising support line at 34200 looks like it will be broken. Note below how even as far back as 1890, when a well-tested DJI uptrendline was broken, a much bigger sell-off began. We seem to be on the cusp an even bigger leg down, one that is not going to allow any survivors, even gold and silver stocks. Such behavior is reminiscent of the 1987 Crash. If oil stocks breakdown, it will be like 2008, when their collapse signified a near-total collapse. Defensive stocks like CLX and PG are still holding up. Their giving way, would also be very bearish. The NYSE has not broken down, yet. But that is coming, I fear. It is significant that Peerless has not given a Buy signal yet. We exclude the QE-Infinity Buys because QE-Infinity appears no longer operative. The Closing Powers are in downtrends for all the key indexes. Seasonally, the next ten trading days are particularly bearish. We see rises in the DJI only 21.4% of the time in the second year of the 4-year Presidential cycle after January 23rd and only 40% of the time over the next month. The sell-off has now driven 1840 of the approximately 8000 NYSE and NASDAQ stocks to new lows. The real story is very ugly. And if the DJIA can no longer conceal it, we are in for a lot worse. CNN talked about the real causes of Inflation and did not once mention the FED or QE-Infinity. Biden, Yellen and the Administration do not want to face how daunting their economic tasks are. Wall traders have a much better idea. Because 34000 is a vital support for the DJI. We mus , if it gives way, short even more as well as consider selling the few long positions we still hold. . Ford is now down 10% from its breakout point and SLV and GLD have broken their Closing Power Uptrends. We will now have to try to sell them on their next bounces. |
||
|
Charts - 1/21/2022 2022 PEERLESS DJI, Signals, Indicators Daily DJI Volume 10-DayUp/Down Vol Stoch-20 Pct of All Stocks above 65-dma Inverted Traders Index Cum. Inverted Traders Index DJI-IPA DJI-OBV NASDAQ S&P OEX NYSE COMPQX DJI-15 DJI-20 DJI-30 DIA QQQ SPY IWM TNA Short-Term Rates DOLLAR-UUP ALLSTOCKs recent 2006 vers-Peerless signals http://tigersoftware.com/NEWPEER/UPD80121.BMP MDY - http://www.tigersoftware.com/CHARTZ/MDY.GIF USO-CrudeOil DBO FAS GLD HD IBB JETS JNUG KOL NUGT OIH PALL RSX RETL SDS AGQ SLV SOXL TAN TECL TLT TMF TNA UGA (gasoline) USO (oil) and China YINN CHAU Commodities: CANE CORN DBC JJC, NIB CORN, CUT (paper) MOO, SOYB WEAT UUP (Dollar) LIT (Lithium) STOCKS: MRNA DIS GE PYPL GME ZOM XLE NRGU AAPL ADBE ALXN AMAT AMGN AMD AMZN AXP BA BABA BAC BIDU BLDP CAT CRM CVX CMG DE ENPH FB GILD GOOG GS HD IBM INTU JPM LRCX M MRK MSFT NEM NFLX NKE NKE NVDA PG PYPL REGN REV SO SQ QCOM QDEL TSLA TXN XOM V VRTX WFC WMT ZM Bullish MAXCPs http://tigersoftware.com/UPPER/1-20/BULLISH.htm No stocks were found here for 1-21 Bearish MAXCPs http://tigersoftware.com/DOWNER/1-21/BEARISH.htm |
|
1890's bear market started when rising well-tested support gave way in Dow Jones average. When the trend comes to an end, selling intensifies. This has been true since the Dow Jones was first created.  |
||||||||||||||||||||||||||||||||||||||||||||||||||||||||||||||||||||||||||||||||||||||||||||||||||||||||||||||||||||||||||||||||||||||||||||||||||||||||||||||||||||||||||||||||||||||||||||||||||||||||||||||||||||||||||||||||||||||||||||||||||||||||||||||||||||||||||||||||||||||||||||||||||||||||||||||||||||||||||||||||||||||||||||||||||||||||||||||||||||||||||||||||||||||||||||||||||||||||||||||||||||||||||||||||||||||||||||||||||||||||||||||||||||||||||||||||||||||||||||||||||||||||||||||||||||||||||||||||||||||||||||||||||||||||||||||||||||||||||||||||||||||||||||||||||||||||||||||||||||||||||||||||||||||||||||||||||||||||||||||||||||||||||||||||||||||||||||||||||||||||||||||||||||||||||||||||||||||||||||||||||||||||||||||||||||||||||||||||||||||||||||||||||||||||||||||||||||||||||||||||||||||||||||||||
 |
||||||||||||||||||||||||||||||||||||||||||||||||||||||||||||||||||||||||||||||||||||||||||||||||||||||||||||||||||||||||||||||||||||||||||||||||||||||||||||||||||||||||||||||||||||||||||||||||||||||||||||||||||||||||||||||||||||||||||||||||||||||||||||||||||||||||||||||||||||||||||||||||||||||||||||||||||||||||||||||||||||||||||||||||||||||||||||||||||||||||||||||||||||||||||||||||||||||||||||||||||||||||||||||||||||||||||||||||||||||||||||||||||||||||||||||||||||||||||||||||||||||||||||||||||||||||||||||||||||||||||||||||||||||||||||||||||||||||||||||||||||||||||||||||||||||||||||||||||||||||||||||||||||||||||||||||||||||||||||||||||||||||||||||||||||||||||||||||||||||||||||||||||||||||||||||||||||||||||||||||||||||||||||||||||||||||||||||||||||||||||||||||||||||||||||||||||||||||||||||||||||||||||||||||
 ----------------------------------------------------------------------------------------------------  |
||||||||||||||||||||||||||||||||||||||||||||||||||||||||||||||||||||||||||||||||||||||||||||||||||||||||||||||||||||||||||||||||||||||||||||||||||||||||||||||||||||||||||||||||||||||||||||||||||||||||||||||||||||||||||||||||||||||||||||||||||||||||||||||||||||||||||||||||||||||||||||||||||||||||||||||||||||||||||||||||||||||||||||||||||||||||||||||||||||||||||||||||||||||||||||||||||||||||||||||||||||||||||||||||||||||||||||||||||||||||||||||||||||||||||||||||||||||||||||||||||||||||||||||||||||||||||||||||||||||||||||||||||||||||||||||||||||||||||||||||||||||||||||||||||||||||||||||||||||||||||||||||||||||||||||||||||||||||||||||||||||||||||||||||||||||||||||||||||||||||||||||||||||||||||||||||||||||||||||||||||||||||||||||||||||||||||||||||||||||||||||||||||||||||||||||||||||||||||||||||||||||||||||||||
 |
||||||||||||||||||||||||||||||||||||||||||||||||||||||||||||||||||||||||||||||||||||||||||||||||||||||||||||||||||||||||||||||||||||||||||||||||||||||||||||||||||||||||||||||||||||||||||||||||||||||||||||||||||||||||||||||||||||||||||||||||||||||||||||||||||||||||||||||||||||||||||||||||||||||||||||||||||||||||||||||||||||||||||||||||||||||||||||||||||||||||||||||||||||||||||||||||||||||||||||||||||||||||||||||||||||||||||||||||||||||||||||||||||||||||||||||||||||||||||||||||||||||||||||||||||||||||||||||||||||||||||||||||||||||||||||||||||||||||||||||||||||||||||||||||||||||||||||||||||||||||||||||||||||||||||||||||||||||||||||||||||||||||||||||||||||||||||||||||||||||||||||||||||||||||||||||||||||||||||||||||||||||||||||||||||||||||||||||||||||||||||||||||||||||||||||||||||||||||||||||||||||||||||||||||
| Table is a few minutes 4
---TigerSoft HOTLINE --- 1/24/2022 (WRITTEN)
====================================================================================
===================================================================================
----------------------------------------------------------------------------------------------------------------------------------------------------
Graphs and Tables
====================================================================================
====================================================================================
======================================================================================================
Hotline Help
|
||||||||||||||||||||||||||||||||||||||||||||||||||||||||||||||||||||||||||||||||||||||||||||||||||||||||||||||||||||||||||||||||||||||||||||||||||||||||||||||||||||||||||||||||||||||||||||||||||||||||||||||||||||||||||||||||||||||||||||||||||||||||||||||||||||||||||||||||||||||||||||||||||||||||||||||||||||||||||||||||||||||||||||||||||||||||||||||||||||||||||||||||||||||||||||||||||||||||||||||||||||||||||||||||||||||||||||||||||||||||||||||||||||||||||||||||||||||||||||||||||||||||||||||||||||||||||||||||||||||||||||||||||||||||||||||||||||||||||||||||||||||||||||||||||||||||||||||||||||||||||||||||||||||||||||||||||||||||||||||||||||||||||||||||||||||||||||||||||||||||||||||||||||||||||||||||||||||||||||||||||||||||||||||||||||||||||||||||||||||||||||||||||||||||||||||||||||||||||||||||||||||||||||||||
====================================================================================
====================================================================================
January 21:
5:50 AM Futures - DJI - 89 NASDAQ
-129 Data used for 1/20/2022
| Without FED support, the DJI
broke right through its 200-day ma. I would not allow QE-Infinity Buy B2 signals any more. Expect the DJIA to now test 34200. But that may not hold. So, stay short and watch how the downtrends of the Closing Powers for DIA, QQQ, SPY and COMPQX play out. Since 1966, the DJI has risen only 28.6% of the time over the next 21 trading days in the second year of the four-year Presidential cycle. Thursday's reversal downward produces a dangerous situation. All the key indexes' Closing Powers made new lows. In the DJI, this means that the 4x previously tested support at 34200 will almost certainly be tested. Since that does not even represent a 10% decline, there is a very good chance that it will be broken, so long as the Closing Power downtrend for DIA remains in tact. The NASDAQ's weakness, with 679 new lows, about 1/6 of all its stocks, shows us a bear market has already arrived for most stocks. The DJI's behavior - holding up up as much as it has - has deceived a lot of investors who watch only this average. That is why the FED puts so much energy and money into supporting the DJIA. And it may do so some more. But it looks like it is committed to raising interest rates, because of inflation, so there seems not much it can do to lift the DJI. Biden and CNN's sabre-rattling concerning Russia is having an effect, too. Just keep in mind that about 10 years ago Putin was asked about starting a war with Ukraine. To this replied that only a fool would risk doing that. Putin is many things, but he is no fool. The operative Peerless signal remains the Sell S16. With short term rates now at 1.68% and still rising, I would not expect the big banks to help turn the DJI up. Defensive stocks can only do so much. Traders are watching the implosion of SOXL and selling their tech stocks. I suspect the blue chips will be next. So, stay short some of the many very weak Bearish MINCPs. We remain long also GLD and SLV. But if the well-tested support at 34000 gives way, I would expect very little to hold up while we get a selling climax. and the FED figures out what it can do to hold up appearances. The Biden Administration's Public Works program is :"dead in the Senate". They want to raise taxes. So, I don't see them helping the market much. In fact, they may wish to get a bear market out of the way now, so that the market is improving in 2024 when the next Presidential Election occurs. |
||
|
Charts - 1/20/2022 2022 PEERLESS DJI, Signals, Indicators Daily DJI Volume 10-DayUp/Down Vol Stoch-20 Pct of All Stocks above 65-dma Inverted Traders Index Cum. Inverted Traders Index DJI-IPA DJI-OBV NASDAQ S&P OEX NYSE COMPQX DJI-15 DJI-20 DJI-30 DIA QQQ SPY IWM TNA Short-Term Rates DOLLAR-UUP ALLSTOCKs recent 2006 vers-Peerless signals http://tigersoftware.com/NEWPEER/UPD80119.BMP MDY - http://www.tigersoftware.com/CHARTZ/MDY.GIF USO-CrudeOil DBO FAS GLD HD IBB JETS JNUG KOL NUGT OIH PALL RSX RETL SDS AGQ SLV SOXL TAN TECL TLT TMF TNA UGA (gasoline) USO (oil) and China YINN CHAU Commodities: CANE CORN DBC JJC, NIB CORN, CUT (paper) MOO, SOYB WEAT UUP (Dollar) LIT (Lithium) STOCKS: MRNA DIS GE PYPL GME ZOM XLE NRGU AAPL ADBE ALXN AMAT AMGN AMD AMZN AXP BA BABA BAC BIDU BLDP CAT CRM CVX CMG DE ENPH FB GILD GOOG GS HD IBM INTU JPM LRCX M MRK MSFT NEM NFLX NKE NKE NVDA PG PYPL REGN REV SO SQ QCOM QDEL TSLA TXN XOM V VRTX WFC WMT ZM Bullish MAXCPs http://tigersoftware.com/UPPER/1-20/BULLISH.htm Bearish MAXCPs http://tigersoftware.com/DOWNER/1-20/BEARISH.htm |
|
 |
 |
 |
 |
 |
 |
 |
 |
 |
Table 1 QUICKSILVER on ETFS - 1/20//2022 Bullish = 3 - GLD (+.289), Wheat (+.366), CORN (+.276) Bearish = 2 - Russia (-.255, RETL(-.541), SOXL (-.283), TECL ETF CLOSE CHANGE PIVOT-PT 5-dma AROC CL-PWR CANDLE IP21 ITRS POWER INDEX
=================================================================================================
DIA 347.33 -3.02 361.2 -218.5% Bearish RED -.043 0 -----
---------------------------------------------------------------------------------------------
SPY 446.75 -5 464.53 -262.8% Bearish RED -.019 -.001 -.02
---------------------------------------------------------------------------------------------
QQQ 361.72 -4.76 377.66 -340.5% Bearish RED -.071 -.045 -.116
---------------------------------------------------------------------------------------------
MDY 480.6 -8.65 508.33 -290.3% Bearish RED -.002 -.046 -.048
---------------------------------------------------------------------------------------------
IWM 200.75 -3.7 214.01 -360.6% Bearish RED -.094 -.126 -.22
---------------------------------------------------------------------------------------------
FAS 127.49 -2.71 150.41 -881.1% Bearish RED .015 -.075 -.06
---------------------------------------------------------------------------------------------
RETL 23.59 -2.7 30.62 -1342.2% Bearish RED -.039 -.502 -.541
weakest
---------------------------------------------------------------------------------------------
SOXL 45.99 -4.83 60.2 -1569.8% Bearish RED -.053 -.23 -.283
weakest
---------------------------------------------------------------------------------------------
TECL 63.3 -2.64 72.4 -1047% Bearish RED -.094 -.16 -.254
---------------------------------------------------------------------------------------------
IBB 130.65 -1.18 138.05 -412.1% Bearish RED -.093 -.125 -.218
---------------------------------------------------------------------------------------------
GLD 171.65 -.43 170.16 26.7% Bullish RED .235 .054 .289
---------------------------------------------------------------------------------------------
OIL 14.86 -.03 14.33 143.5% Bullish RED -.09 .037 -.053
---------------------------------------------------------------------------------------------
OIH 218.57 -2.88 218.61 -22.2% Bullish RED .073 .04 .113
---------------------------------------------------------------------------------------------
CPER 27.58 .49 27.5 -51.3% Bullish ---- .039 .071 .11
---------------------------------------------------------------------------------------------
UUP 25.68 .08 25.43 47% ------- BLUE .012 .064 .076
---------------------------------------------------------------------------------------------
CORN 22.06 -.13 21.52 50.4% Bullish RED .169 .107 .276
---------------------------------------------------------------------------------------------
WEAT 7.52 -.07 7.15 164.3% Bullish RED .319 .047 .366
---------------------------------------------------------------------------------------------
YINN 9.94 .82 9.04 119% Bullish RED .093 -.024 .069
---------------------------------------------------------------------------------------------
RSX 23.55 -.35 25.26 -640.7% Bearish RED -.137 -.226 -.363
|
 Table 2   Count of Stocks in Key Directories
           20220120
-------------------------------
NEWHIGHS       58
NEWLOWS        943
MAXCP          6
MINCP          476
TTTNH          23
TTTNL          186
CPCROSSA       17
CPCROSSD       30
ACCUMVER       9
HIGHIP21       6
HIUPPCT        7
VHIP21         71
LOWACCUM       201
REDSELL        123
AUGSELS7       15
|
Table 3  RANKING OF KEY DIRECTORIES BASED PCT.OF STOCKS ABOVE 65-DMA
              1/20/22
         Bullish = 12
         Bearish = 36
---------------------------------------------------------------------------------------
Directory     Current       day-1         day-2         day-3         day-4         day-5
----------------------------------------------------------------------------------------
COAL           1             1             1             1             1             1
COPPER         .875          .875          .625          .875          .875          .875
FOOD           .734          .836          .734          .673          .632          .653
OILGAS         .723          .78           .8            .828          .8            .8
COMODITY       .692          .82           .641          .666          .666          .641
UTILITY        .641          .641          .589          .641          .666          .615
BEVERAGE       .571          .642          .714          .785          .714          .785
INSURANC       .56           .6            .76           .92           .92           .88
MILITARY       .538          .653          .73           .769          .769          .73
GOLD           .521          .76           .239          .347          .347          .434
INDMATER .513 .597 .555 .694 .694 .68 SP-100 .511 .6 .633 .733 .777 .822 =============================================================================================== DOWJONES .5 .6 .6 .733 .8 .8 =============================================================================================== REGBANKS .48 .72 .92 .92 .96 .96 DJI-13 .461 .615 .615 .769 .769 .846 FIDSTKS .449 .502 .585 .668 .668 .715 FINANCE .446 .5 .583 .666 .666 .714 JETS .428 .357 .5 .857 .857 .642 SP500 .384 .458 .517 .605 .643 .659 INDEXES .367 .372 .394 .502 .54 .589 COMPUTER .35 .4 .5 .55 .55 .7 ETFS .345 .345 .309 .527 .509 .6 TRANSP .315 .263 .315 .684 .684 .631 HOSPITAL .312 .312 .375 .687 .562 .312 CHEM .304 .434 .521 .586 .586 .608 INFRA .303 .393 .484 .606 .727 .787 CHINA .3 .26 .26 .24 .26 .32 BIGBANKS .285 .428 .428 .571 .857 .857 NIFTY .282 .326 .369 .413 .413 .478 NASD-100 .268 .309 .371 .453 .453 .525 SOFTWARE .214 .25 .25 .321 .303 .375 GAMING .21 .21 .157 .052 0 .105 HACKERS .21 .21 .263 .315 .263 .421 REIT .2 .3 .446 .576 .63 .592 RUS-1000 .192 .23 .27 .341 .356 .341 AUTO .188 .283 .339 .509 .471 .471 EDU .166 .166 .166 .333 .333 .333 LOWPRICE .147 .165 .157 .185 .18 .183 SEMI .147 .189 .315 .463 .473 .494 ELECTRON .127 .172 .308 .428 .428 .466 HIGHPRIC .116 .141 .16 .25 .254 .349 RETAIL .106 .148 .148 .234 .255 .276 GREEN .105 .21 .21 .157 .157 .157 BIOTECH .104 .115 .118 .156 .153 .162 GUNS .076 .23 .384 .384 .461 .384 HOMEBLDG .055 .166 .277 .5 .666 .611 BONDFUND .011 .022 .022 .045 .068 .126 MARIJUAN 0 .25 .25 .25 .25 .25 SOLAR 0 0 0 0 0 0 |
====================================================================================
====================================================================================
January 20: 5:50 Futures - DJI+126 NASDAQ +146 Data
used for 1/19/2022
| Today's early rally
turned into another down day. It would be better to to buy when a weak opening turns into an advance and our Closing Powers for the key ETFs thereby breaks its uptrend. So, today's apparent up-opening, by itself, should not be trusted. There were more than 1100 new lows on the NYSE and NASDAQ. We want to be careful.. The SP-500 is due a bounce. It remains true to its price-uptrend. The DJI has fallen back to its rising 200-day ma. Very often DJI declines pull back only to their 200-day ma and then rise again to new highs. I doubt that scenario here. That is asking a lot for the DJI now. SHort-term rates rose back above 1.5%. This is a long way up from the near zero rates that Wall Strret could "bank" on when the real yield was a -4% late last year and as it was in 1969-1970 as a deep bear market started. As you can see below, the Tiger charts of Bond Funds shows a disastrous breakdown in prices. This could lead to the failure of a Wall Street bank or brokerage whuch would shock the stock market. We did get a Peerless Buy B2 if we consider the QE-Infiity still operational. But that I cannot do given the abrupt take-off of short-term rates by 1%. Better support is nearly 1000 DJI points lower where the rising channel support-line is. So, as long as the Professionals are net bearish and the Closing Powers are falling I would stay short. I should mention that the market is now losing its strongest groups. Semi-conductors broke their support today and Ford sold off, too. WHat is rising are the DJI's most defensive stock, Proctor & Gamble (PG) and gold and silver, which now challenging their well-tested resistance lines. Watch GLD and SLV. They have a habit of rallying as the general market tops out or falls. And watch the rising food commodities and Oil. They become the best longs when the DJI is topping out. Biden's comments on inflation-fighting were not reassuring. The real threat is that the economy will slow-down but prices and interest rates will keep rising, all the while the professionals start using negative leveraged ETFs very aggressively. |
||
|
Charts - 1/19/2022 2022 PEERLESS DJI, Signals, Indicators Daily DJI Volume 10-DayUp/Down Vol Stoch-20 Pct of All Stocks above 65-dma Inverted Traders Index Cum. Inverted Traders Index DJI-IPA DJI-OBV NASDAQ S&P OEX NYSE COMPQX DJI-15 DJI-20 DJI-30 DIA QQQ SPY IWM TNA Short-Term Rates DOLLAR-UUP ALLSTOCKs recent 2006 vers-Peerless signals http://tigersoftware.com/NEWPEER/UPD80119.BMP MDY - http://www.tigersoftware.com/CHARTZ/MDY.GIF USO-CrudeOil DBO FAS GLD HD IBB JETS JNUG KOL NUGT OIH PALL RSX RETL SDS AGQ SLV SOXL TAN TECL TLT TMF TNA UGA (gasoline) USO (oil) and China YINN CHAU Commodities: CANE CORN DBC JJC, NIB CORN, CUT (paper) MOO, SOYB WEAT UUP (Dollar) LIT (Lithium) STOCKS: MRNA DIS GE PYPL GME ZOM XLE NRGU AAPL ADBE ALXN AMAT AMGN AMD AMZN AXP BA BABA BAC BIDU BLDP CAT CRM CVX CMG DE ENPH FB GILD GOOG GS HD IBM INTU JPM LRCX M MRK MSFT NEM NFLX NKE NKE NVDA PG PYPL REGN REV SO SQ QCOM QDEL TSLA TXN XOM V VRTX WFC WMT ZM Bullish MAXCPs http://tigersoftware.com/UPPER/1-19/BULLISH.htm Bearish MAXCPs http://tigersoftware.com/DOWNER/1-19/BEARISH.htm |
 |
 |
 |
 |
 |
 |
 |
 |
  |
 |
 |
 |
 |
Table 1 QUICKSILVER on ETFS - 1/19//2022 Bullish = 3 - GLD (+.30), Wheat (+.425), CORN (+.306) Bearish = 2 - Russia (-.255, RETL(-.436) ETF CLOSE CHANGE PIVOT-PT 5-dma AROC CL-PWR CANDLE IP21 ITRS POWER INDEX ================================================================================================= DIA 350.35 -3.5 362.95 -169.3% Bearish RED .073 0 .073 --------------------------------------------------------------------------------------------- SPY 451.75 -4.74 471.02 -193.4% Bearish RED .086 0 .086 --------------------------------------------------------------------------------------------- QQQ 366.48 -4.07 387.35 -254.3% Bearish RED .028 -.045 -.017 --------------------------------------------------------------------------------------------- MDY 489.25 -6.63 509.75 -218.3% Bearish RED .086 -.04 .046 --------------------------------------------------------------------------------------------- IWM 204.45 -3.38 215.99 -307.5% Bearish RED .013 -.119 -.106 --------------------------------------------------------------------------------------------- FAS 130.2 -6.9 152.77 -747.6% Bearish RED .083 -.056 .027 --------------------------------------------------------------------------------------------- RETL 26.29 -.55 31.31 -1046.2% Bearish RED .029 -.465 -.436 --------------------------------------------------------------------------------------------- SOXL 50.82 -5.16 64.58 -1010.4% Bearish RED .031 -.13 -.099 --------------------------------------------------------------------------------------------- TECL 65.94 -2.85 78.36 -770.1% Bearish RED .005 -.124 -.119 --------------------------------------------------------------------------------------------- IBB 131.83 -1.63 141.93 -420% Bearish RED -.062 -.124 -.186 --------------------------------------------------------------------------------------------- GLD 172.08 2.69 170.74 52.6% Bullish BLUE .251 .049 .3 --------------------------------------------------------------------------------------------- OIH 221.45 -3.65 219.56 18.2% Bullish RED .154 .059 .213 --------------------------------------------------------------------------------------------- CPER 27.09 .25 27.86 11% Bullish RED .147 .055 .202 --------------------------------------------------------------------------------------------- UUP 25.6 -.06 25.44 -2% Bearish ---- .01 .048 .058 --------------------------------------------------------------------------------------------- CORN 22.19 .35 21.84 73.5% Bullish BLUE .205 .101 .306 --------------------------------------------------------------------------------------------- WEAT 7.59 .24 7.28 130.8% Bullish BLUE .381 .044 .425 --------------------------------------------------------------------------------------------- YINN 9.12 .12 9.72 0% Bullish RED .144 -.086 .058 --------------------------------------------------------------------------------------------- RSX 23.9 .95 26.72 -506.9% Bearish ---- -.039 -.216 -.255 |
    Count of Stocks in Key Directories
          20220119
-------------------------------
NEWHIGHS       88
NEWLOWS        1081
MAXCP          14
MINCP          317
TTTNH          19
TTTNL          167
CPCROSSA       56
CPCROSSD       46
ACCUMVER       11
HIGHIP21       10
HIUPPCT        28
VHIP21         71
LOWACCUM       195
REDSELL        253
AUGSELS7       14
TRAPDOOR       7
|
 Table 3      RANKING OF KEY DIRECTORIES BASED PCT.OF STOCKS ABOVE 65-DMA
              1/19/22
    Bulllish = 16
    Bearish = 32
---------------------------------------------------------------------------------------
Directory     Current       day-1         day-2         day-3         day-4         day-5
----------------------------------------------------------------------------------------
COAL           1             1             1             1             1             1
COPPER         .875          .625          .875          .875          .875          .875
FOOD           .836          .734          .673          .632          .653          .673
COMODITY       .82           .641          .666          .666          .641          .666
OILGAS         .78           .8            .828          .8            .8            .8
GOLD           .76           .239          .347          .347          .434          .347
REGBANKS       .72           .92           .92           .96           .96           .96
MILITARY       .653          .73           .769          .769          .73           .769
BEVERAGE       .642          .714          .785          .714          .785          .857
UTILITY        .641          .589          .641          .666          .641          .615
DJI-13 .615 .615 .769 .769 .846 .846 DOWJONES .6 .6 .733 .8 .8 .833 INSURANC .6 .76 .92 .92 .88 .88 SP-100 .6 .633 .733 .777 .822 .822 INDMATER .597 .555 .694 .694 .68 .652 FIDSTKS .502 .585 .668 .668 .715 .727 ================================================================================================= FINANCE .5 .583 .666 .666 .714 .726 ================================================================================================== SP500 .458 .517 .605 .643 .661 .673 CHEM .434 .521 .586 .586 .608 .608 BIGBANKS .428 .428 .571 .857 .857 1 COMPUTER .4 .5 .55 .55 .65 .7 INFRA .393 .484 .606 .727 .787 .696 INDEXES .372 .394 .502 .54 .583 .562 JETS .357 .5 .857 .857 .642 .642 ETFS .345 .309 .527 .509 .6 .454 NIFTY .326 .369 .413 .413 .456 .478 HOSPITAL .312 .375 .687 .562 .375 .5 NASD-100 .309 .371 .453 .453 .525 .515 REIT .3 .438 .584 .63 .592 .6 AUTO .283 .339 .509 .471 .471 .49 TRANSP .263 .315 .684 .684 .631 .631 CHINA .26 .26 .24 .26 .32 .3 MARIJUAN .25 .25 .25 .25 .25 .25 SOFTWARE .25 .25 .321 .303 .375 .375 GUNS .23 .384 .384 .461 .384 .384 RUS-1000 .23 .27 .341 .356 .344 .346 GAMING .21 .157 .052 0 .105 .263 GREEN .21 .21 .157 .157 .157 .157 HACKERS .21 .263 .315 .263 .421 .473 SEMI .189 .315 .463 .473 .494 .505 ELECTRON .172 .308 .428 .428 .458 .458 LOWPRICE .167 .155 .183 .18 .185 .17 EDU .166 .166 .333 .333 .333 .5 HOMEBLDG .166 .277 .5 .666 .666 .611 RETAIL .148 .148 .234 .255 .276 .276 HIGHPRIC .141 .16 .25 .254 .349 .349 BIOTECH .115 .118 .156 .153 .162 .184 BONDFUND .022 .022 .045 .068 .126 .172 SOLAR 0 0 0 0 0 0 |
===================================================================================
===================================================================================
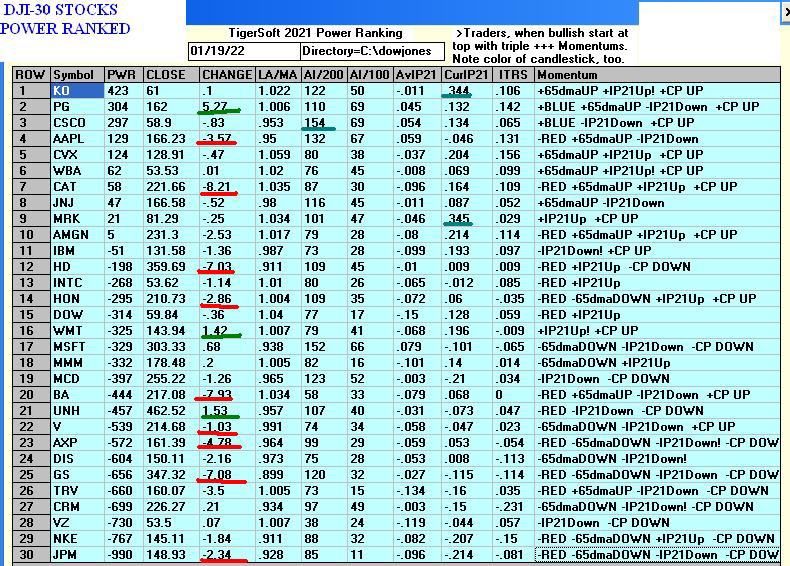
January 19: 6:05 Futures - DJI+76 NASDAQ +40
| It was a broad sell-off today.
There were 2906 decliners on the NYSE and coupled with the NASDAQ, there were 1116 new lows. Clearly the key indexes are masquerading and concealing the weakness of the overall market. Raising rates when the overall economy starts to weaken is a deadly procedure judging from what happened when the FEDs raised rates to 6% in mid-1929. Usually, it takes a series of rate hikes to kill the bull market for the DJI. That was so from 1928-1929, 1956-1957, 1973-1974, 1980-1981, 1996-1987 and 2000-2001. The Discount Rate has not even been raised once in the current environment, but never before has the fed gone so far to lift stock prices with near zero rates for banks and spending trillions on bonds to flood the banks with money. So, simply reverting to more normal policies is apt to be very hurtful to the big banks' share prices. (We see that in the plunges in GS and JPM of late.) And most of the time, as the big banks' go, so goes Wall Street and the DJIA. Before this decline is over, I would think the DJI will be 5% below its 21-day ma. It is now down only 2% below it. We have no new Peerless Buy yet and the Closing Powers are falling. So, there seems little reason to try to call a bottom yet. Watch SPY especially closely. It remains in an uptrend but has now retreated to a neckline support in a head/shoulders pattern it has formed. The DJI did not quite tag its still rising 200-day ma. That is the point from which it should attempt a rally. But seasonality predicts another month of decline for the DJIA and the NASDAQ's weakness versus the DJI shows how traders are avoiding more speculative stocks as well as bonds. . We are long F, SLV, G:LD and UCO and short numerous bearish MINCPs for now. Hold all these positions. Avoid bonds. |
||
|
Charts - 1/18/2022 2022 PEERLESS DJI, Signals, Indicators Daily DJI Volume 10-DayUp/Down Vol Stoch-20 Pct of All Stocks above 65-dma Inverted Traders Index Cum. Inverted Traders Index DJI-IPA DJI-OBV NASDAQ S&P OEX NYSE COMPQX DJI-15 DJI-20 DJI-30 DIA QQQ SPY IWM TNA Short-Term Rates DOLLAR-UUP ALLSTOCKs recent 2006 vers-Peerless signals http://tigersoftware.com/NEWPEER/UPD80118.BMP MDY - http://www.tigersoftware.com/CHARTZ/MDY.GIF USO-CrudeOil DBO FAS GLD HD IBB JETS JNUG KOL NUGT OIH PALL RSX RETL SDS AGQ SLV SOXL TAN TECL TLT TMF TNA UGA (gasoline) USO (oil) a nd China: YINN CHAU Commodities: CANE CORN DBC JJC, NIB CORN, CUT (paper) MOO, SOYB WEAT UUP (Dollar) LIT (Lithium) STOCKS: MRNA DIS GE PYPL GME ZOM XLE NRGU AAPL ADBE ALXN AMAT AMGN AMD AMZN AXP BA BABA BAC BIDU BLDP CAT CRM CVX CMG DE ENPH FB GILD GOOG GS HD IBM INTU JPM LRCX M MRK MSFT NEM NFLX NKE NKE NVDA PG PYPL REGN REV SO SQ QCOM QDEL TSLA TXN XOM V VRTX WFC WMT ZM Bullish MAXCPs http://tigersoftware.com/UPPER/1-18/BULLISH.htm Bearish MAXCPs http://tigersoftware.com/DOWNER/1-18/BEARISH.htm |
 |
 |
 |
 |
 |
 |
 |
 |
 |
 |
 |
 |
 |
Table 1 QUICKSILVER on ETFS - 1/18//2022 Bullish = 2 - OIH (+.263), Wheat Bearish = 1 - Russia , RETL(-.375) ETF CLOSE CHANGE PIVOT-PT 5-dma AROC CL-PWR CANDLE IP21 ITRS POWER INDEX ================================================================================================= DIA 353.85 -5.29 362.54 -96% ------- RED .079 ---- ----- --------------------------------------------------------------------------------------------- COMPQX 14506.9 -386.85 15153.45 -145.3% Bearish RED .164 -.069 .095 --------------------------------------------------------------------------------------------- SPY 456.49 -8.23 469.75 -96.6% ------- RED .107 -.002 .105 --------------------------------------------------------------------------------------------- QQQ 370.55 -9.46 385.82 -125.1% Bearish RED .083 -.049 .034 --------------------------------------------------------------------------------------------- MDY 495.88 -10.83 511.36 -104.7% ------- RED .127 -.035 .092 --------------------------------------------------------------------------------------------- IWM 207.83 -6.48 217.61 -173.8% Bearish RED .106 -.108 -.002 --------------------------------------------------------------------------------------------- FAS 137.1 -9.67 152.31 -380.6% Bearish RED .1 -.022 .078 --------------------------------------------------------------------------------------------- RETL 26.84 -1.89 32.57 -674.3% Bearish RED .078 -.453 -.375 --------------------------------------------------------------------------------------------- SOXL 55.98 -8.5 63.29 -321.5% ------- RED .097 -.032 .065 --------------------------------------------------------------------------------------------- TECL 68.79 -5.33 77.37 -388% ------- RED .051 -.09 -.039 --------------------------------------------------------------------------------------------- IBB 133.46 -5.49 143.52 -308.7% Bearish RED .048 -.155 -.107 --------------------------------------------------------------------------------------------- GLD 169.39 -.28 170.29 33.3% Bullish RED .103 .031 .134 --------------------------------------------------------------------------------------------- OIH 225.1 -3.11 220.64 300.3% Bullish RED .19 .073 .263 --------------------------------------------------------------------------------------------- CPER 26.84 -.26 27.03 42.2% Bullish RED .2 .039 .239 --------------------------------------------------------------------------------------------- UUP 25.66 .16 25.61 -11.7% Bearish BLUE .017 .035 .052 --------------------------------------------------------------------------------------------- CORN 21.84 .01 21.87 4.6% Bullish BLUE .122 .06 .182 --------------------------------------------------------------------------------------------- WEAT 7.35 .21 7.4 27.6% Bullish BLUE .342 -.006 .336 --------------------------------------------------------------------------------------------- YINN 9 -.35 9.12 373.2% Bullish BLUE .162 -.155 .007 --------------------------------------------------------------------------------------------- RSX 22.95 -1.92 26.46 -580.2% Bearish BLUE -.092 -.256 -.348 |
 Table 2   Count of Stocks in Key Directories
          20220118
-------------------------------
NEWHIGHS       186
NEWLOWS        1116
MAXCP          21
MINCP          257
TTTNH          14
TTTNL          152
CPCROSSA       30
CPCROSSD       90
ACCUMVER       7
HIGHIP21       13
HIUPPCT        17
VHIP21         69
LOWACCUM       206
REDSELL        131
AUGSELS7       14
TRAPDOOR       35
|
 TABLE 3        RANKING OF KEY DIRECTORIES BASED PCT.OF STOCKS ABOVE 65-DMA
             1/18/22
  bULLISH = 18
  BEARISH = 29
---------------------------------------------------------------------------------------
Directory     Current       day-1         day-2         day-3         day-4         day-5
----------------------------------------------------------------------------------------
COAL           1             1             1             1             1             .833
REGBANKS       .92           .92           .96           .96           .96           .96
OILGAS         .8            .828          .8            .8            .8            .685
INSURANC       .76           .92           .92           .88           .88           .84
FOOD           .734          .673          .632          .653          .673          .53
MILITARY .73 .769 .769 .73 .769 .653 BEVERAGE .714 .785 .714 .785 .857 .857 COMODITY .641 .666 .666 .641 .666 .487 SP-100 .633 .733 .777 .822 .833 .766 COPPER .625 .875 .875 .875 .875 .625 DJI-13 .615 .769 .769 .846 .846 .769 DOWJONES .6 .733 .8 .8 .833 .733 UTILITY .589 .641 .666 .641 .641 .692 FIDSTKS .585 .668 .668 .715 .739 .668 FINANCE .583 .666 .666 .714 .738 .666 INDMATER .555 .694 .694 .68 .652 .611 CHEM .521 .586 .586 .608 .608 .543 SP500 .517 .605 .643 .661 .681 .639 ============================================================================================== COMPUTER .5 .55 .55 .65 .7 .65 JETS .5 .857 .857 .642 .642 .5 ============================================================================================= INFRA .484 .606 .727 .787 .696 .727 REIT .438 .576 .638 .592 .6 .6 BIGBANKS .428 .571 .857 .857 1 1 INDEXES .394 .502 .54 .583 .572 .518 GUNS .384 .384 .461 .384 .384 .384 HOSPITAL .375 .687 .562 .375 .5 .5 NASD-100 .371 .453 .453 .525 .525 .463 NIFTY .369 .413 .413 .456 .478 .413 AUTO .339 .509 .471 .471 .471 .471 SEMI .315 .463 .473 .494 .505 .41 TRANSP .315 .684 .684 .631 .631 .631 ETFS .309 .527 .509 .6 .472 .254 ELECTRON .308 .428 .428 .458 .458 .406 HOMEBLDG .277 .5 .666 .666 .611 .5 RUS-1000 .27 .341 .356 .344 .349 .318 HACKERS .263 .315 .263 .421 .473 .368 CHINA .26 .24 .26 .32 .3 .2 MARIJUAN .25 .25 .25 .25 .25 .25 SOFTWARE .25 .321 .303 .375 .375 .321 GOLD .239 .347 .347 .434 .347 .239 GREEN .21 .157 .157 .157 .157 .157 EDU .166 .333 .333 .333 .5 .5 HIGHPRIC .16 .25 .254 .349 .37 .276 GAMING .157 .052 0 .105 .263 .052 LOWPRICE .157 .18 .18 .185 .17 .129 RETAIL .148 .234 .255 .276 .297 .276 BIOTECH .118 .156 .153 .162 .184 .162 BONDFUND .022 .045 .068 .126 .16 .172 SOLAR 0 0 0 0 0 0 |
====================================================================================
====================================================================================
January 18: 4:00 Futures - DJI -236
NASDAQ -247
|
Interest Rates are moving up at a faster clip. The next four weeks may become dangerous for stocks, but there remains good support 4% below in the DJI's case. It is not clear what the FED can do right now to prevent a greater wave of selling. Equity futures are down 1/2% at this writing across the board. Trust the Peerless Sell S16. Bearish Seasonality will last for the another month. Professionals remain wary. Our falling Closing Powers warn us to expect more price weakness for DJI, SP-500, NASDAQ and most stocks. Smaller stocks are much weaker than those in the key indexes, the DJI-30, SP-500 and QQQ. There were more than 800 new lows on Friday. There is no trasferrence of money into smaller epeculative stocks because we are in a new year. SOXL is still caught in its wide trading range. It needs to re-test the recent lows again. With expectations so high March will bring an official increase in the key lending rates in the US, it looks at present that the FED can do little to prevent another month's price weakness. This is apt to cause considerable technical damage to the price-uptrend of the NASDAQ. Will the DJI's key support be broken? Could be. But probably not. For now pick some Bearish MINCPs to go short. Oil stocks are the main bullish play now. Abide by their Closing Power uptrends. With oil taking the lead, let's see if gold and silver stocks start to play catchup and move up decidely above their 65-dma. Avoid bonds at all costs. See the growing weakness in bond funds. |
||
|
Charts - 1/14/2022 2022 PEERLESS DJI, Signals, Indicators Daily DJI Volume 10-DayUp/Down Vol Stoch-20 Pct of All Stocks above 65-dma Inverted Traders Index Cum. Inverted Traders Index DJI-IPA DJI-OBV NASDAQ S&P OEX NYSE COMPQX DJI-15 DJI-20 DJI-30 DIA QQQ SPY IWM TNA Short-Term Rates DOLLAR-UUP ALLSTOCKs recent 2006 vers-Peerless signals http://tigersoftware.com/NEWPEER/UPD80113.BMP MDY - http://www.tigersoftware.com/CHARTZ/MDY.GIF USO-CrudeOil DBO FAS GLD HD IBB JETS JNUG KOL NUGT OIH PALL RSX RETL SDS AGQ SLV SOXL TAN TECL TLT TMF TNA UGA (gasoline) USO (oil) a nd China: YINN CHAU Commodities: CANE CORN DBC JJC, NIB CORN, CUT (paper) MOO, SOYB WEAT UUP (Dollar) LIT (Lithium) STOCKS: MRNA DIS GE PYPL GME ZOM XLE NRGU AAPL ADBE ALXN AMAT AMGN AMD AMZN AXP BA BABA BAC BIDU BLDP CAT CRM CVX CMG DE ENPH FB GILD GOOG GS HD IBM INTU JPM LRCX M MRK MSFT NEM NFLX NKE NKE NVDA PG PYPL REGN REV SO SQ QCOM QDEL TSLA TXN XOM V VRTX WFC WMT ZM Bullish MAXCPs http://tigersoftware.com/UPPER/1-14/BULLISH.htm Bearish MAXCPs http://tigersoftware.com/DOWNER/1-14/BEARISH.htm |
 |
 |
 |
 |
 |
Bondfund Breakdown |
 |
 |
 |
 |
|
 |
 |
 |
Table 1 QUICKSILVER on ETFS - 1/11//2022 Bullish = 2 - SOXL (+.251), Copper Bearish = 1 - Russia ETF CLOSE CHANGE PIVOT-PT 5-dma AROC CL-PWR CANDLE IP21 ITRS POWER INDEX
=================================================================================================
DIA 361.2 -1.75 362.31 -16.4% Bullish RED .077 ---- -----
---------------------------------------------------------------------------------------------
SPY 464.53 -6.49 466.09 -36.4% ------- RED .11 .004 .114
---------------------------------------------------------------------------------------------
QQQ 377.66 -9.69 379.86 -82.9% Bearish RED .074 -.031 .043
---------------------------------------------------------------------------------------------
MDY 508.33 -1.42 508.52 -40.6% Bullish RED .133 -.026 .107
---------------------------------------------------------------------------------------------
IWM 214.01 -1.98 216.07 -105.9% Bearish RED .111 -.089 .022
---------------------------------------------------------------------------------------------
FAS 150.41 -2.36 149.66 170.7% ------- RED .083 .023 .106
---------------------------------------------------------------------------------------------
RETL 30.62 -.69 32.67 -507.9% Bearish RED .118 -.332 -.214
---------------------------------------------------------------------------------------------
SOXL 60.2 -4.38 59.74 -426.3% Bearish RED .091 .16 .251
---------------------------------------------------------------------------------------------
TECL 72.4 -5.96 74.49 -284.3% Bearish RED .065 -.006 .059
---------------------------------------------------------------------------------------------
IBB 138.05 -3.88 140.55 -153.7% Bearish RED .059 -.153 -.094
---------------------------------------------------------------------------------------------
GLD 170.16 -.58 167.75 93.9% Bullish BLUE .295 .016 .311
---------------------------------------------------------------------------------------------
OIH 218.61 -.95 211.88 222.5% Bullish RED .176 .013 .189
---------------------------------------------------------------------------------------------
CPER 27.5 -.36 26.89 168.5% Bullish RED .231 .027 .258
---------------------------------------------------------------------------------------------
UUP 25.43 -.01 25.66 -72.1% Bearish BLUE -.093 .006 -.087
---------------------------------------------------------------------------------------------
CORN 21.52 -.32 22.02 -84.5% Bullish RED .065 .001 .066
---------------------------------------------------------------------------------------------
WEAT 7.15 -.13 7.31 -47.9% Bullish RED .231 -.074 .157
---------------------------------------------------------------------------------------------
YINN 9.04 -.68 8.3 698.8% Bullish RED .079 -.169 -.09
---------------------------------------------------------------------------------------------
RSX 25.26 -1.46 25.95 -82.2% Bearish RED -.081 -.214 -.295
QUICKSILVER on ETFS - 01/14/22
ETF CLOSE CHANGE PIVOT-PT 5-dma AROC CL-PWR CANDLE IP21 ITRS POWER INDEX --------------------------------------------------------------------------------------------- DIA 359.14 -2.06 360.79 -43.8% ------- BLUE .048 0 .048 --------------------------------------------------------------------------------------------- COMPQX 14893.75 86.94 14942.83 -14% Bearish BLUE .071 -.051 .02 --------------------------------------------------------------------------------------------- SPY 464.72 .19 465.51 -14.7% Bearish BLUE .099 .007 .106 --------------------------------------------------------------------------------------------- QQQ 380.01 2.35 380.11 2% Bearish BLUE .076 -.027 .049 --------------------------------------------------------------------------------------------- MDY 506.71 -1.62 506.53 -17.8% Bullish BLUE .13 -.031 .099 --------------------------------------------------------------------------------------------- IWM 214.31 .3 215.32 -40.8% Bearish BLUE .109 -.095 .014 --------------------------------------------------------------------------------------------- FAS 146.77 -3.64 148.53 -95.9% Bullish BLUE .112 -.008 .104 --------------------------------------------------------------------------------------------- RETL 28.73 -1.89 31 -622.7% Bearish RED .08 -.43 -.35 --------------------------------------------------------------------------------------------- SOXL 64.48 4.28 60 385% Bearish BLUE .104 .208 .312 --------------------------------------------------------------------------------------------- TECL 74.12 1.72 74.64 -24.5% Bearish BLUE .047 .008 .055 --------------------------------------------------------------------------------------------- IBB 138.95 .9 142.16 -56.6% Bearish BLUE .047 -.15 -.103 --------------------------------------------------------------------------------------------- GLD 169.67 -.49 168.26 56.7% Bullish RED .196 .03 .226 --------------------------------------------------------------------------------------------- OIL 14.65 .32 13.91 214.7% Bullish BLUE .011 .012 .023 --------------------------------------------------------------------------------------------- OIH 228.21 9.6 211.9 377.1% Bullish BLUE .205 .07 .275 --------------------------------------------------------------------------------------------- CPER 27.1 -.4 26.61 38.6% Bullish BLUE .179 .023 .202 --------------------------------------------------------------------------------------------- UUP 25.5 .07 25.72 -31.3% ------- BLUE -.043 .02 -.023 --------------------------------------------------------------------------------------------- CORN 21.83 .31 21.82 -43.6% Bullish BLUE .12 .038 .158 --------------------------------------------------------------------------------------------- WEAT 7.14 -.01 7.31 -116.6% Bullish ---- .313 -.059 .254 --------------------------------------------------------------------------------------------- YINN 9.35 .31 8.32 589.9% Bullish BLUE .105 -.15 -.045 --------------------------------------------------------------------------------------------- RSX 24.87 -.39 25.95 -207.2% Bearish BLUE -.083 -.21 -.293 |
Table 3    Count of Stocks in Key Directories
             20220114
-------------------------------
NEWHIGHS       180
NEWLOWS        878   Bearish
MAXCP          39
MINCP          123
TTTNH          36
TTTNL          106
CPCROSSA       140
CPCROSSD       31
HIGHIP21       14
HIUPPCT        19
VHIP21         71
LOWACCUM       188
REDSELL        126
AUGSELS7       18
TRAPDOOR       4
|
 Table  4       RANKING OF KEY DIRECTORIES BASED PCT.OF STOCKS ABOVE 65-DMA
               1/14/22
 Bullish = 28
 Bearish = 20
---------------------------------------------------------------------------------------
Directory     Current       day-1         day-2         day-3         day-4         day-5
----------------------------------------------------------------------------------------
COAL           1             1             1             1             .833          .833
INSURANC       .92           .92           .88           .88           .84           .88
REGBANKS       .92           .96           .96           .96           .96           .96
COPPER         .875          .875          .875          .875          .625          .875
JETS           .857          .857          .642          .642          .5            .714
OILGAS         .828          .8            .8            .8            .676          .714
BEVERAGE       .785          .714          .785          .857          .857          .857
DJI-13         .769          .769          .846          .846          .769          .846
MILITARY       .769          .769          .73           .769          .653          .692
DOWJONES       .733          .8            .8            .833          .733          .833
SP-100 .733 .777 .822 .833 .766 .811 INDMATER .694 .694 .68 .652 .611 .625 HOSPITAL .687 .562 .375 .5 .5 .375 TRANSP .684 .684 .631 .631 .631 .684 FOOD .673 .632 .653 .673 .551 .53 FIDSTKS .668 .668 .715 .739 .674 .686 COMODITY .666 .666 .641 .666 .512 .512 FINANCE .666 .666 .714 .738 .672 .684 UTILITY .641 .666 .641 .641 .692 .717 INFRA .606 .727 .787 .696 .727 .787 SP500 .605 .643 .661 .681 .639 .667 CHEM .586 .586 .608 .608 .543 .543 REIT .576 .63 .6 .6 .6 .669 BIGBANKS .571 .857 .857 1 1 .857 COMPUTER .55 .55 .65 .7 .65 .6 ETFS .527 .509 .6 .472 .254 .309 AUTO .509 .471 .471 .471 .471 .452 INDEXES .502 .54 .583 .572 .518 .502 =============================================================================================== HOMEBLDG .5 .666 .666 .611 .555 .5 =============================================================================================== SEMI .463 .473 .494 .505 .431 .442 NASD-100 .453 .453 .525 .525 .474 .463 ELECTRON .428 .428 .458 .458 .421 .451 NIFTY .413 .413 .456 .478 .413 .413 GUNS .384 .461 .384 .384 .384 .384 GOLD .347 .347 .434 .347 .26 .152 RUS-1000 .341 .356 .344 .349 .316 .341 EDU .333 .333 .333 .5 .5 .5 SOFTWARE .321 .303 .375 .375 .339 .339 HACKERS .315 .263 .421 .473 .421 .421 HIGHPRIC .25 .254 .349 .37 .283 .298 MARIJUAN .25 .25 .25 .25 .25 .25 CHINA .24 .26 .32 .3 .2 .24 RETAIL .234 .255 .276 .297 .276 .34 LOWPRICE .183 .178 .185 .17 .129 .155 GREEN .157 .157 .157 .157 .157 .21 BIOTECH .156 .153 .162 .184 .162 .167 GAMING .052 0 .105 .263 .052 .157 BONDFUND .045 .068 .126 .16 .172 .218 SOLAR 0 0 0 0 0 0 |
====================================================================================
Tech Leaders Decline as Rally Ends Abruptly Mid-Day
Professionals Turn Bearish. So, Must We.
January 13: 5:40 Futures - DJI -212
NASDAQ -109
| SOXL rose 4.6 Thursday morning and
then suddenly reversed and fell more than 10. This brought its candle stick chart a glaring example of a bearish "red popsicle". Leveraged ETFs in the middle of a broad trading range behave this way. It closed exactly at its rising 65-dma. Assuming it follows through on the downside tomorrow, its next support is 10% lower. Professional traders are notorious for whipping these 3x leveraged vehicles around like this. Violent swings are now a regular part of doing business with these artificial creations. Imagine the carnage ahead if a bear market starts. I've mentioned the need to be on the ready for "red pipsicles", so I hope some of you sold SOXL or its leveraged tech companions. We have no choice, especially this late in a bull market, but trade in the direction most of the time with, not against, the well-informed Professionals as they manifest their expectations on our Closing Power charts. See the change in DIA and SPY below. See how their brief Closing Power uptrends were violated today. Professionals are now bearish in these. They expect lower prices and so should we. This also means, in my opinion, that we should bring back life to our Peerless Sell S16. Selling short some of the current bearish MINCPs seems reasonable if we hold long Ford (which rose today), Gold, Silver and some Oil stocks provided the latter do not break their CP uptrends. |
||
|
Charts - 1/13/2022 2022 PEERLESS DJI, Signals, Indicators Daily DJI Volume 10-DayUp/Down Vol Stoch-20 Pct of All Stocks above 65-dma Inverted Traders Index Cum. Inverted Traders Index DJI-IPA DJI-OBV NASDAQ S&P OEX NYSE COMPQX DJI-15 DJI-20 DJI-30 DIA QQQ SPY IWM TNA Short-Term Rates DOLLAR-UUP ALLSTOCKs recent 2006 vers-Peerless signals http://tigersoftware.com/NEWPEER/UPD80113.BMP MDY - http://www.tigersoftware.com/CHARTZ/MDY.GIF USO-CrudeOil DBO FAS GLD HD IBB JETS JNUG KOL NUGT OIH PALL RSX RETL SDS AGQ SLV SOXL TAN TECL TLT TMF TNA UGA (gasoline) USO (oil) a nd China: YINN CHAU Commodities: CANE CORN DBC JJC, NIB CORN, CUT (paper) MOO, SOYB WEAT UUP (Dollar) LIT (Lithium) STOCKS: MRNA DIS GE PYPL GME ZOM XLE NRGU AAPL ADBE ALXN AMAT AMGN AMD AMZN AXP BA BABA BAC BIDU BLDP CAT CRM CVX CMG DE ENPH FB GILD GOOG GS HD IBM INTU JPM LRCX M MRK MSFT NEM NFLX NKE NKE NVDA PG PYPL REGN REV SO SQ QCOM QDEL TSLA TXN XOM V VRTX WFC WMT ZM Bullish MAXCPs http://tigersoftware.com/UPPER/1-13/BULLISH.htm Bearish MAXCPs http://tigersoftware.com/DOWNER/1-13/BEARISH.htm |
 |
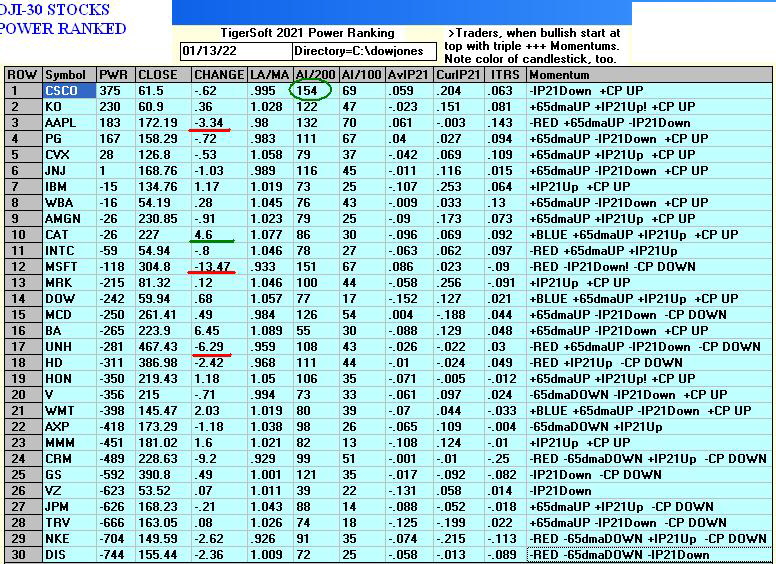 |
 |
|
|
 |
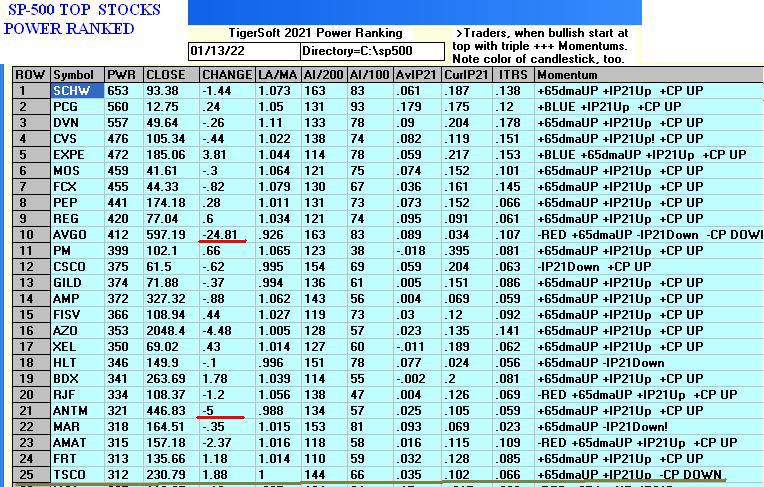 |
 |
 |
 |
 |
 |
 |
Table 1 QUICKSILVER on ETFS - 1/11//2022 Bullish = 2 - SOXL (+.251), Copper Bearish = 1 - Russia ETF CLOSE CHANGE PIVOT-PT 5-dma AROC CL-PWR CANDLE IP21 ITRS POWER INDEX ================================================================================================= DIA 361.2 -1.75 362.31 -16.4% Bullish RED .077 ---- ----- --------------------------------------------------------------------------------------------- SPY 464.53 -6.49 466.09 -36.4% ------- RED .11 .004 .114 --------------------------------------------------------------------------------------------- QQQ 377.66 -9.69 379.86 -82.9% Bearish RED .074 -.031 .043 --------------------------------------------------------------------------------------------- MDY 508.33 -1.42 508.52 -40.6% Bullish RED .133 -.026 .107 --------------------------------------------------------------------------------------------- IWM 214.01 -1.98 216.07 -105.9% Bearish RED .111 -.089 .022 --------------------------------------------------------------------------------------------- FAS 150.41 -2.36 149.66 170.7% ------- RED .083 .023 .106 --------------------------------------------------------------------------------------------- RETL 30.62 -.69 32.67 -507.9% Bearish RED .118 -.332 -.214 --------------------------------------------------------------------------------------------- SOXL 60.2 -4.38 59.74 -426.3% Bearish RED .091 .16 .251 --------------------------------------------------------------------------------------------- TECL 72.4 -5.96 74.49 -284.3% Bearish RED .065 -.006 .059 --------------------------------------------------------------------------------------------- IBB 138.05 -3.88 140.55 -153.7% Bearish RED .059 -.153 -.094 --------------------------------------------------------------------------------------------- GLD 170.16 -.58 167.75 93.9% Bullish BLUE .295 .016 .311 --------------------------------------------------------------------------------------------- OIH 218.61 -.95 211.88 222.5% Bullish RED .176 .013 .189 --------------------------------------------------------------------------------------------- CPER 27.5 -.36 26.89 168.5% Bullish RED .231 .027 .258 --------------------------------------------------------------------------------------------- UUP 25.43 -.01 25.66 -72.1% Bearish BLUE -.093 .006 -.087 --------------------------------------------------------------------------------------------- CORN 21.52 -.32 22.02 -84.5% Bullish RED .065 .001 .066 --------------------------------------------------------------------------------------------- WEAT 7.15 -.13 7.31 -47.9% Bullish RED .231 -.074 .157 --------------------------------------------------------------------------------------------- YINN 9.04 -.68 8.3 698.8% Bullish RED .079 -.169 -.09 --------------------------------------------------------------------------------------------- RSX 25.26 -1.46 25.95 -82.2% Bearish RED -.081 -.214 -.295 |
Table 2    Count of Stocks in Key Directories
           20220113
-------------------------------
NEWHIGHS       250
NEWLOWS        534
MAXCP          18
MINCP          190
TTTNH          24
TTTNL          136
CPCROSSA       87
CPCROSSD       80
ACCUMVER       4
HIGHIP21       9
HIUPPCT        22
VHIP21         72
LOWACCUM       180
REDSELL        133
AUGSELS7       16
TRAPDOOR       22
|
 Table 3    RANKING OF KEY DIRECTORIES BASED PCT.OF STOCKS ABOVE 65-DMA
              1/13/22
 Bullish = 28
 Bearish = 21
---------------------------------------------------------------------------------------
Directory     Current       day-1         day-2         day-3         day-4         day-5
----------------------------------------------------------------------------------------
COAL           1             1             1             .833          .833          .833
REGBANKS       .96           .96           .96           .96           .96           .96
INSURANC       .92           .88           .88           .84           .88           .76
COPPER         .875          .875          .875          .625          .875          .75
BIGBANKS       .857          .857          1             1             .857          .714
JETS           .857          .642          .642          .5            .714          .428
DOWJONES       .8            .8            .833          .733          .833          .7
               ^^^^^
OILGAS         .8            .8            .8            .676          .704          .666
SP-100         .777          .822          .833          .766          .811          .755
DJI-13         .769          .846          .846          .769          .846          .769
MILITARY       .769          .73           .769          .653          .692          .615
INFRA          .727          .787          .696          .727          .787          .787
BEVERAGE       .714          .785          .857          .857          .857          .785
INDMATER       .694          .68           .652          .611          .597          .597
TRANSP         .684          .631          .631          .631          .684          .631
FIDSTKS        .668          .715          .739          .674          .686          .662
COMODITY       .666          .641          .666          .512          .512          .435
FINANCE        .666          .714          .738          .672          .684          .66
HOMEBLDG       .666          .666          .611          .555          .555          .666
UTILITY        .666          .641          .641          .692          .717          .692
SP500          .643          .661          .681          .639          .669          .675
               ^^^^
FOOD           .632          .653          .673          .551          .53           .53
REIT           .63           .592          .607          .6            .669          .661
CHEM           .586          .608          .608          .543          .543          .673
HOSPITAL       .562          .375          .5            .5            .312          .437
COMPUTER       .55           .65           .7            .65           .6            .65
INDEXES        .529          .583          .572          .518          .508          .583
ETFS           .509          .6            .472          .254          .309          .309
=================================================================================================
SEMI           .473          .494          .505          .431          .452          .557
               ^^^^^
AUTO           .471          .471          .471          .471          .452          .528
GUNS           .461          .384          .384          .384          .384          .461
NASD-100       .453          .525          .525          .474          .463          .505
               ^^^^^
ELECTRON       .428          .458          .458          .421          .458          .511
NIFTY          .413          .456          .478          .413          .413          .521
RUS-1000       .356          .344          .349          .316          .341          .336
GOLD           .347          .434          .347          .26           .152          .065
EDU            .333          .333          .5            .5            .5            .666
SOFTWARE       .303          .375          .375          .339          .339          .339
HACKERS .263 .421 .473 .421 .421 .421 CHINA .26 .32 .3 .2 .24 .12 RETAIL .255 .276 .297 .276 .34 .361 HIGHPRIC .254 .349 .37 .283 .301 .37 MARIJUAN .25 .25 .25 .25 .25 .25 LOWPRICE .18 .183 .17 .129 .152 .132 GREEN .157 .157 .157 .157 .21 .21 BIOTECH .153 .162 .184 .162 .167 .167 BONDFUND .068 .126 .16 .172 .218 .149 GAMING 0 .105 .263 .052 .157 .157 SOLAR 0 0 0 0 0 0 |
====================================================================================
====================================================================================
7% CPI Rise for 2021
but Powell Is in No Hurray To Raise Rates
Buy Oil Stocks, Gold and Silver
January 12: 5:40 Futures- DJI +54 NASDAQ +20
| There's no point troubling ourselves
over the reversal day on Tuesday. The FED does not want the market to go down now. It is willing to let the Dollar form a top pattern, which it did today. It is not going to raise rates until March, if then, despite the official 7% inflation rate for 2021 and it is willing to sit on $9 trillion dollars in various debt instruments, thereby breaking all records wildly. Not surprisingly, we now have an inflation rate that was last matched in 1982. This is sending up Oil Stocks, despite the Electric Cars' boom and the growing acceptance of the need for alternative energies. It is also bound to boost gold and silver. And until the FED actually does something to raise rates, the natural inflation fighters - growth stocks - are bound to rise and in the case of SOXL, retest its highs. The Bearish MINCPs have seriously shrunk tonight. Buy some more of the Bullish MAXCPs. I favor those with Blue candle-sticks, high IP21 and strong Closing Power uptrends. Ideally, they are near their point of breakouts. But with our Closing Power, we can chase a little more, provided we abide by the ability of the stock's Closing Power up-trend to stay unviolated.
|
||
|
Charts - 1/12/2022
2022 PEERLESS DJI, Signals, Indicators Daily DJI Volume 10-DayUp/Down Vol Stoch-20 Pct of All Stocks above 65-dma Inverted Traders Index Cum. Inverted Traders Index DJI-IPA DJI-OBV NASDAQ S&P OEX NYSE COMPQX DJI-15 DJI-20 DJI-30 DIA QQQ SPY IWM TNA Short-Term Rates DOLLAR-UUP ALLSTOCKs recent 2006 vers-Peerless signals http://tigersoftware.com/NEWPEER/UPD80112.BMP MDY - http://www.tigersoftware.com/CHARTZ/MDY.GIF USO-CrudeOil DBO FAS GLD HD IBB JETS JNUG KOL NUGT OIH PALL RSX RETL SDS AGQ SLV SOXL TAN TECL TLT TMF TNA UGA (gasoline) USO (oil) a nd China: YINN CHAU Commodities: CANE CORN DBC JJC, NIB CORN, CUT (paper) MOO, SOYB WEAT UUP (Dollar) LIT (Lithium) STOCKS: MRNA DIS GE PYPL GME ZOM XLE NRGU AAPL ADBE ALXN AMAT AMGN AMD AMZN AXP BA BABA BAC BIDU BLDP CAT CRM CVX CMG DE ENPH FB GILD GOOG GS HD IBM INTU JPM LRCX M MRK MSFT NEM NFLX NKE NKE NVDA PG PYPL REGN REV SO SQ QCOM QDEL TSLA TXN XOM V VRTX WFC WMT ZM Bullish MAXCPs http://tigersoftware.com/UPPER/1-12/BULLISH.htm Bearish MAXCPs http://tigersoftware.com/DOWNER/1-12/BEARISH.htm |
 |
 |
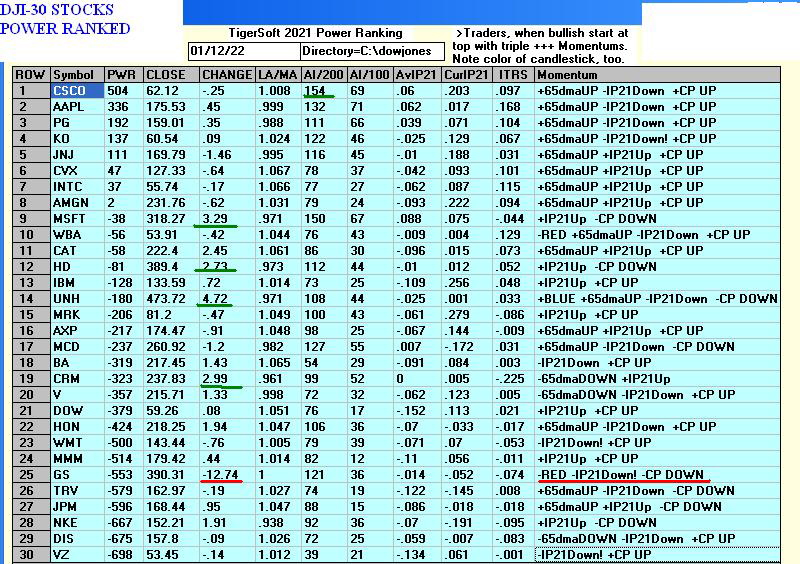 |
 |
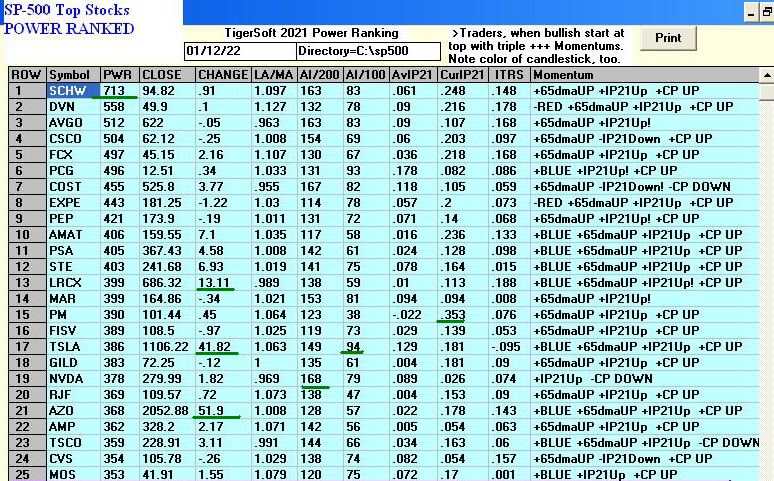 |
 |
 |
 |
 |
 |
 |
 |
|
 |
Table 1 QUICKSILVER on ETFS - 1/11//2022 Bullish = 2 - SOXL (+.463), Copper Bearish = 0 - ETF CLOSE CHANGE PIVOT-PT 5-dma AROC CL-PWR CANDLE IP21 ITRS POWER INDEX ================================================================================================= DIA 362.95 .41 362.39 -15.7% Bullish RED .105 ---- ---- --------------------------------------------------------------------------------------------- SPY 471.02 1.27 467.94 28.2% Bullish RED .16 .013 .173 --------------------------------------------------------------------------------------------- QQQ 387.35 1.53 384.02 40% ------- RED .157 -.011 .146 --------------------------------------------------------------------------------------------- MDY 509.75 -1.61 512.47 -.8% Bullish RED .155 -.03 .125 --------------------------------------------------------------------------------------------- IWM 215.99 -1.62 218.6 -31.6% Bearish RED .116 -.087 .029 --------------------------------------------------------------------------------------------- FAS 152.77 .46 145.3 477.2% Bullish RED .115 .044 .159 --------------------------------------------------------------------------------------------- RETL 31.31 -1.26 33.9 -299.9% Bearish RED .144 -.313 -.169 --------------------------------------------------------------------------------------------- SOXL 64.58 1.29 65.54 45.6% Bullish RED .181 .282 .463 --------------------------------------------------------------------------------------------- TECL 78.36 .99 76.74 25.6% ------- RED .109 .093 .202 --------------------------------------------------------------------------------------------- IBB 141.93 -1.59 142.42 -20% Bearish RED .119 -.133 -.014 --------------------------------------------------------------------------------------------- GLD 170.74 .45 166.99 49.9% Bullish BLUE .23 .009 .239 --------------------------------------------------------------------------------------------- OIH 219.56 -1.08 209.06 392.1% Bullish RED .186 .002 .188 --------------------------------------------------------------------------------------------- CPER 27.86 .83 26.59 216.7% Bullish BLUE .264 .027 .291 --------------------------------------------------------------------------------------------- UUP 25.44 -.17 25.8 -66.1% Bearish RED -.222 0 -.222 --------------------------------------------------------------------------------------------- CORN 21.84 -.03 21.89 4.6% Bullish ---- .088 -.002 .086 --------------------------------------------------------------------------------------------- WEAT 7.28 -.12 7.22 -27.4% Bullish RED .26 -.072 .188 --------------------------------------------------------------------------------------------- YINN 9.72 .6 7.83 1402.8% Bullish ---- .154 -.187 -.033 --------------------------------------------------------------------------------------------- RSX 26.72 .26 25.69 297.9% Bearish ---- -.021 -.184 -.205 |
    Count of Stocks in Key Directories
          20220112
-------------------------------
NEWHIGHS       260
NEWLOWS        234
MAXCP          29
MINCP          82
TTTNH          19
TTTNL          35
CPCROSSA       52
CPCROSSD       59
HIGHIP21       29
HIUPPCT        22
VHIP21         72
LOWACCUM       188
REDSELL        140
AUGSELS7       13
TRAPDOOR       7
|
 Table 3    RANKING OF KEY DIRECTORIES BASED PCT.OF STOCKS ABOVE 65-DMA
              1/12/22
 Bullish = 28
 Bearish = 21
---------------------------------------------------------------------------------------
Directory     Current       day-1         day-2         day-3         day-4         day-5
----------------------------------------------------------------------------------------
COAL           1             1             .833          .833          .833          .666
REGBANKS       .96           .96           .96           .96           .96           .84
INSURANC       .88           .88           .84           .88           .76           .68
COPPER         .875          .875          .625          .875          .75           .75
BIGBANKS       .857          1             1             .857          .857          .714
DJI-13         .846          .846          .769          .846          .846          .923
SP-100         .822          .833          .766          .811          .766          .755
DOWJONES       .8            .833          .733          .833          .733          .766
              ^^^^^^^
OILGAS         .8            .8            .676          .704          .666          .571
INFRA          .787          .696          .727          .787          .787          .787
BEVERAGE       .785          .857          .857          .857          .785          .857
MILITARY       .73           .769          .653          .692          .615          .615
FIDSTKS        .715          .739          .674          .686          .668          .644
FINANCE        .714          .738          .672          .684          .666          .642
INDMATER       .68           .652          .611          .597          .597          .583
HOMEBLDG       .666          .611          .555          .555          .666          .777
SP500          .661          .681          .639          .669          .675          .671
FOOD           .653          .673          .551          .53           .51           .53
COMPUTER       .65           .7            .65           .6            .65           .7
JETS           .642          .642          .5            .714          .428          .5
COMODITY       .641          .666          .512          .512          .41           .435
UTILITY        .641          .641          .692          .717          .692          .743
TRANSP         .631          .631          .631          .684          .631          .684
CHEM           .608          .608          .543          .543          .673          .652
ETFS           .6            .472          .254          .309          .309          .327
REIT           .592          .6            .607          .669          .661          .615
INDEXES        .583          .572          .518          .508          .589          .594
NASD-100       .525          .525          .474          .463          .505          .474
================================================================================================
SEMI           .494          .505          .431          .452          .547          .547
AUTO           .471          .471          .471          .452          .528          .49
ELECTRON       .458          .458          .421          .458          .511          .496
NIFTY          .456          .478          .413          .413          .521          .456
GOLD           .434          .347          .26           .152          .065          .239
HACKERS        .421          .473          .421          .421          .421          .315
GUNS           .384          .384          .384          .384          .384          .538
HOSPITAL       .375          .5            .5            .312          .437          .562
SOFTWARE       .375          .375          .339          .339          .339          .321
HIGHPRIC       .349          .37           .283          .301          .378          .36
RUS-1000 .344 .349 .316 .341 .339 .339 EDU .333 .5 .5 .5 .666 .666 CHINA .32 .3 .2 .24 .12 .16 RETAIL .276 .297 .276 .34 .361 .404 MARIJUAN .25 .25 .25 .25 .25 .25 LOWPRICE .185 .167 .129 .152 .137 .142 BIOTECH .162 .184 .162 .167 .167 .162 GREEN .157 .157 .157 .21 .21 .368 BONDFUND .126 .16 .172 .218 .149 .241 GAMING .105 .263 .052 .157 .157 .052 SOLAR 0 0 0 0 0 0 |
===============================================================================
Sell S16 vs Powell and Professionals
January 12 :5:25 AM DJI
+40 NASDAQ +50 Data through 1/11/2022
| Despite the fact that
short-term rates rose above 1.1% today, a broad market rally ensued. There were 2400+ more up than down and the DJI's Closing Power has turned up from its test of its rising 21-day ma. Wall Street Professionals are pleased to see so many support-levels hold and to see that the FED will somehow still protect them even if Inflation is now acknowledged to be the main threat by the FED. Fed Chairman Powell admitted rates would have to go up because of inflation: perhaps, as soon as March and in four increases in 2022. But he avoided talking about the 9 Trillion Dollars in debt instruments that thr FED now has on its books. Silence is golden to Wall Street bond traders and the market, too. It is how the FED deals with all the junk bonds and debt on its book that really counts, says Barrons.: https://www.barrons.com/articles/federal-reserve-rate-hikes-balance-sheet-51641587526 Thus, though short-term rates jumped well above 1%, 10-year rates actually declined. The leading tech stocks in the NASDAQ, QQQ, TECL and SOXL have shown themselves to be much more responsive to the competing yield of 10-year bonds. Powell's testimony was boost enough to all the tech ETFs to cause then to rise further from their rather obvious supports. And Professionals piled on. TECL, QQQ and SOXL now look like they will go right back to their recent highs. This will boost the SP-500 and SPY unless the Inflation numbers that are released today are extraordinarily high. (6:00 AM - The 5% CPI rise in December over January actually seems tame compared to what they might have been.) Our Peerless Sell S16 may still play out if the CPI number today shows 10% inflation, but Professionals have become net buyers of DIA again. See the charts below. DJI-High priced leader UNH seems to have turned up from its 65-dma. Along with AAPL, BA and oil and gas stocks look like they are again in rally mode. So, I would cover our short sale in DIA and buy some of the bullish MAXCPs and SOXL. |
||
|
Charts - 1/11/2022 2022 PEERLESS DJI, Signals, Indicators Daily DJI Volume 10-DayUp/Down Vol Stoch-20 Pct of All Stocks above 65-dma Inverted Traders Index Cum. Inverted Traders Index DJI-IPA DJI-OBV NASDAQ S&P OEX NYSE COMPQX DJI-15 DJI-20 DJI-30 DIA QQQ SPY IWM TNA Short-Term Rates DOLLAR-UUP ALLSTOCKs recent 2006 vers-Peerless signals http://tigersoftware.com/NEWPEER/UPD80111.BMP MDY - http://www.tigersoftware.com/CHARTZ/MDY.GIF USO-CrudeOil DBO FAS GLD HD IBB JETS JNUG KOL NUGT OIH PALL RSX RETL SDS AGQ SLV SOXL TAN TECL TLT TMF TNA UGA (gasoline) USO (oil) a nd China: YINN CHAU Commodities: CANE CORN DBC JJC, NIB CORN, CUT (paper) MOO, SOYB WEAT UUP (Dollar) LIT (Lithium) STOCKS: MRNA DIS GE PYPL GME ZOM XLE NRGU AAPL ADBE ALXN AMAT AMGN AMD AMZN AXP BA BABA BAC BIDU BLDP CAT CRM CVX CMG DE ENPH FB GILD GOOG GS HD IBM INTU JPM LRCX M MRK MSFT NEM NFLX NKE NKE NVDA PG PYPL REGN REV SO SQ QCOM QDEL TSLA TXN XOM V VRTX WFC WMT ZM Bullish MAXCPs http://tigersoftware.com/UPPER/1-11/BULLISH.htm Bearish MAXCPs http://tigersoftware.com/DOWNER/1-11/BEARISH.htm |
 |
 |
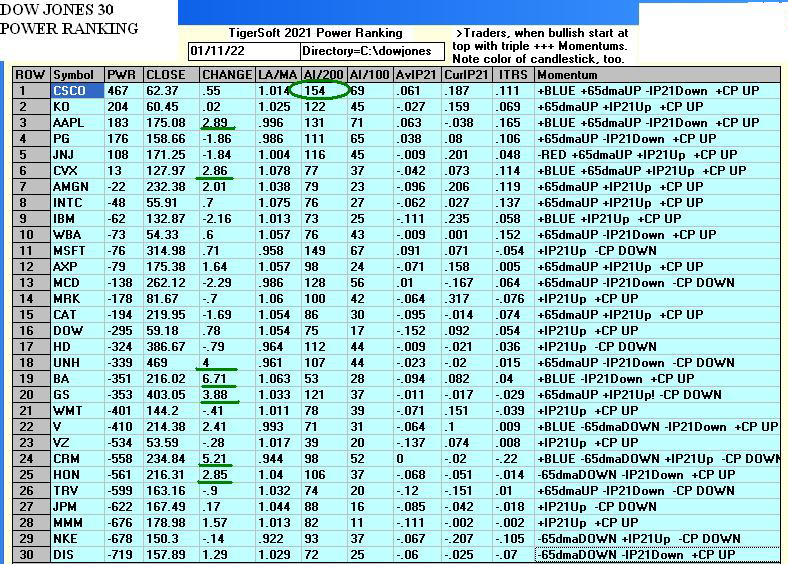 |
 |
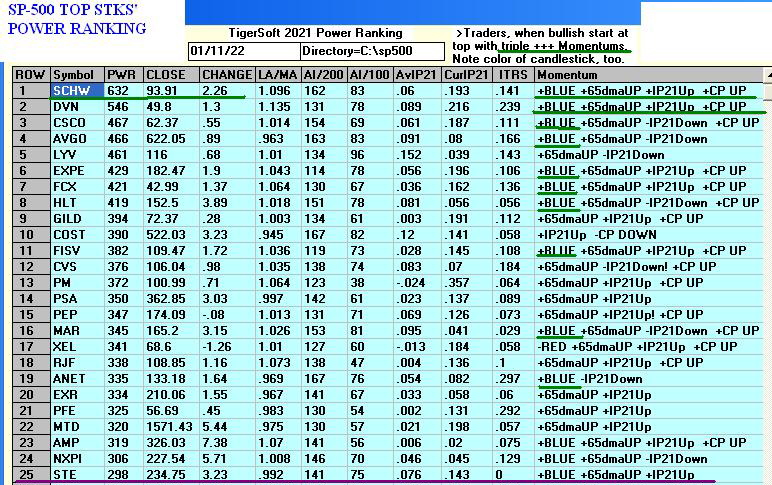 |
 |
 |
 |
 |
 |
 |
 |
Table 1 QUICKSILVER on ETFS - 1/11//2022 Bullish = 1 - SOXL (+.455), Wheat Bearish = 1 - RSX ETF CLOSE CHANGE PIVOT-PT 5-dma AROC CL-PWR CANDLE IP21 ITRS POWER INDEX ================================================================================================= DIA 362.54 1.75 364.09 -73.3% Bullish BLUE .08 ---- ---- --------------------------------------------------------------------------------------------- SPY 469.75 4.24 468.38 -83.1% Bullish BLUE .116 .011 .127 --------------------------------------------------------------------------------------------- QQQ 385.82 5.71 384.29 -138.3% Bullish BLUE .124 -.013 .111 --------------------------------------------------------------------------------------------- MDY 511.36 4.83 509.83 -101% Bullish BLUE .145 -.008 .137 --------------------------------------------------------------------------------------------- IWM 217.61 2.29 217.36 -168.7% ------- BLUE .12 -.058 .062 --------------------------------------------------------------------------------------------- FAS 152.31 3.78 138.75 284.3% Bullish BLUE .106 .04 .146 --------------------------------------------------------------------------------------------- RETL 32.57 1.57 33.27 -670% ------- BLUE .122 -.238 -.116 --------------------------------------------------------------------------------------------- SOXL 63.29 3.29 64.01 -607.1% Bullish BLUE .149 .316 .465 --------------------------------------------------------------------------------------------- TECL 77.37 2.73 77.97 -545.3% ------- BLUE .099 .077 .176 --------------------------------------------------------------------------------------------- IBB 143.52 1.36 142.5 -166.6% ------- BLUE .171 -.113 .058 --------------------------------------------------------------------------------------------- GLD 170.29 2.03 169.06 21.4% Bullish BLUE .196 .01 .206 --------------------------------------------------------------------------------------------- OIH 220.64 8.74 202.99 353.7% Bullish BLUE .175 .037 .212 --------------------------------------------------------------------------------------------- CPER 27.03 .42 26.7 -42.9% Bullish BLUE .302 -.005 .297 --------------------------------------------------------------------------------------------- UUP 25.61 -.11 25.78 -38.8% Bearish RED -.138 .002 -.136 --------------------------------------------------------------------------------------------- CORN 21.87 .05 21.82 -38.8% Bullish ---- .037 .011 .048 --------------------------------------------------------------------------------------------- WEAT 7.4 .09 7.32 6.8% Bullish BLUE .307 -.029 .278 --------------------------------------------------------------------------------------------- YINN 9.12 .8 7.42 786.4% Bullish BLUE .125 -.198 -.073 --------------------------------------------------------------------------------------------- RSX 26.46 .51 25.18 -25.1% Bearish BLUE -.104 -.185 -.289 |
  Table 2  Count of Stocks in Key Directories
           20220111
-------------------------------
NEWHIGHS       141
NEWLOWS        224
MAXCP          15
MINCP          79
TTTNH          30
TTTNL          105
CPCROSSA       96
CPCROSSD       99
HIGHIP21       16
HIUPPCT        17
VHIP21         67
LOWACCUM       191
REDSELL        148
AUGSELS7       20
TRAPDOOR       8
|
Table 3 RANKING OF KEY DIRECTORIES BASED PCT.OF STOCKS ABOVE 65-DMA
             1/11/22
  Nullish = 28 including Dow Jones (83%)
  Bearish = 19
---------------------------------------------------------------------------------------
Directory     Current       day-1         day-2         day-3         day-4         day-5
----------------------------------------------------------------------------------------
BIGBANKS       1             1             .857          .857          .714          .857
COAL           1             .833          .833          .833          .833          .833
REGBANKS       .96           .96           .96           .96           .84           .92
INSURANC       .88           .84           .88           .76           .68           .8
COPPER         .875          .625          .875          .75           .75           1
BEVERAGE       .857          .857          .857          .785          .857          .857
DJI-13         .846          .769          .846          .846          .923          .923
DOWJONES       .833          .733          .833          .733          .766          .833
SP-100         .833          .766          .811          .766          .755          .8
OILGAS         .8            .676          .704          .666          .571          .676
MILITARY .769 .653 .692 .615 .615 .692 FIDSTKS .739 .674 .686 .668 .644 .763 FINANCE .738 .672 .684 .666 .642 .761 COMPUTER .7 .65 .6 .65 .7 .85 INFRA .696 .727 .787 .787 .787 .818 SP500 .681 .639 .669 .675 .677 .779 FOOD .673 .551 .53 .51 .53 .591 COMODITY .666 .512 .512 .41 .435 .564 INDMATER .652 .611 .597 .597 .597 .722 JETS .642 .5 .714 .428 .5 .714 UTILITY .641 .692 .717 .692 .743 .794 TRANSP .631 .631 .684 .631 .684 .789 HOMEBLDG .611 .555 .555 .666 .777 .944 CHEM .608 .543 .543 .673 .652 .739 REIT .6 .6 .676 .661 .615 .746 INDEXES .572 .518 .508 .589 .605 .686 NASD-100 .525 .474 .463 .505 .494 .639 SEMI .505 .431 .452 .547 .568 .631 -------------------------------------------------------------------------------------------------- EDU .5 .5 .5 .666 .666 .5 HOSPITAL .5 .5 .312 .437 .562 .687 -------------------------------------------------------------------------------------------------- NIFTY .478 .413 .413 .521 .5 .586 HACKERS .473 .421 .421 .421 .315 .473 ETFS .472 .254 .309 .309 .327 .363 AUTO .471 .471 .452 .528 .509 .603 ELECTRON .458 .421 .458 .511 .511 .578 GUNS .384 .384 .384 .384 .538 .538 SOFTWARE .375 .339 .339 .339 .339 .464 HIGHPRIC .37 .283 .301 .378 .378 .578 RUS-1000 .349 .316 .341 .339 .339 .405 GOLD .347 .26 .152 .065 .239 .391 CHINA .3 .2 .24 .12 .16 .16 RETAIL .297 .276 .34 .361 .404 .489 GAMING .263 .052 .157 .157 .052 .473 MARIJUAN .25 .25 .25 .25 .25 .25 BIOTECH .214 .181 .178 .195 .186 .25 LOWPRICE .17 .127 .152 .137 .142 .162 BONDFUND .16 .172 .218 .149 .241 .436 GREEN .157 .157 .21 .21 .315 .421 SOLAR 0 0 0 0 0 0 |
--------------------------------------------------------------------------------------------------------------------------------------
January 11 :5:50 AM DJI +40 NASDAQ +50 Data through
1/10/2022
Sell S16
| The reversal day took place
as the NASDAQ (COMPQX), QQQ, TECL each reached the uptrending channel-line that is parallel to each's rising reistance line. The SPY's came about as it fell to its 65-dma. Clearly chartist-bargain hunters were busy and so were Professionals who rushed in once the chartists began buying. The DJI has only retreated to its 21-dma. Usually, the DJI goes lower, below its 65-dma. With our Sell S16 unreversed and the CPI (Inflation) number coming out soon, it would be risky to chase even the strongest ETF, SOXL until today's lows hold again. SOXL's broadening pattern shows a potential broadening top, so we would need put a sell stop below 53 if we were to buy it. The number of new lows and MINCPs are many times the number of new highs and MAXCPs. The real market, as opposed to the indexes which the hedge funds trade most is not healthy. In addition, I want to see red Buys SOXL and TECL to buy them. So, let's just hold DIA short and avoid most longs, other than oil stocks, electric autos and special situations with rising Closing Powers. |
||
|
Charts - 1/10/2022 2022 PEERLESS DJI, Signals, Indicators Daily DJI Volume 10-DayUp/Down Vol Stoch-20 Pct of All Stocks above 65-dma Inverted Traders Index Cum. Inverted Traders Index DJI-IPA DJI-OBV NASDAQ S&P OEX NYSE COMPQX DJI-15 DJI-20 DJI-30 DIA QQQ SPY IWM TNA Short-Term Rates DOLLAR-UUP ALLSTOCKs recent 2006 vers-Peerless signals http://tigersoftware.com/NEWPEER/UPD80110.BMP MDY - http://www.tigersoftware.com/CHARTZ/MDY.GIF USO-CrudeOil DBO FAS GLD HD IBB JETS JNUG KOL NUGT OIH PALL RSX RETL SDS AGQ SLV SOXL TAN TECL TLT TMF TNA UGA (gasoline) USO (oil) a nd China: YINN CHAU Commodities: CANE CORN DBC JJC, NIB CORN, CUT (paper) MOO, SOYB WEAT UUP (Dollar) LIT (Lithium) STOCKS: MRNA DIS GE PYPL GME ZOM XLE NRGU AAPL ADBE ALXN AMAT AMGN AMD AMZN AXP BA BABA BAC BIDU BLDP CAT CRM CVX CMG DE ENPH FB GILD GOOG GS HD IBM INTU JPM LRCX M MRK MSFT NEM NFLX NKE NKE NVDA PG PYPL REGN REV SO SQ QCOM QDEL TSLA TXN XOM V VRTX WFC WMT ZM Bullish MAXCPs http://tigersoftware.com/UPPER/1-10/BULLISH.htm Bearish MAXCPs http://tigersoftware.com/DOWNER/1-10/BEARISH.htm |
 |
 |
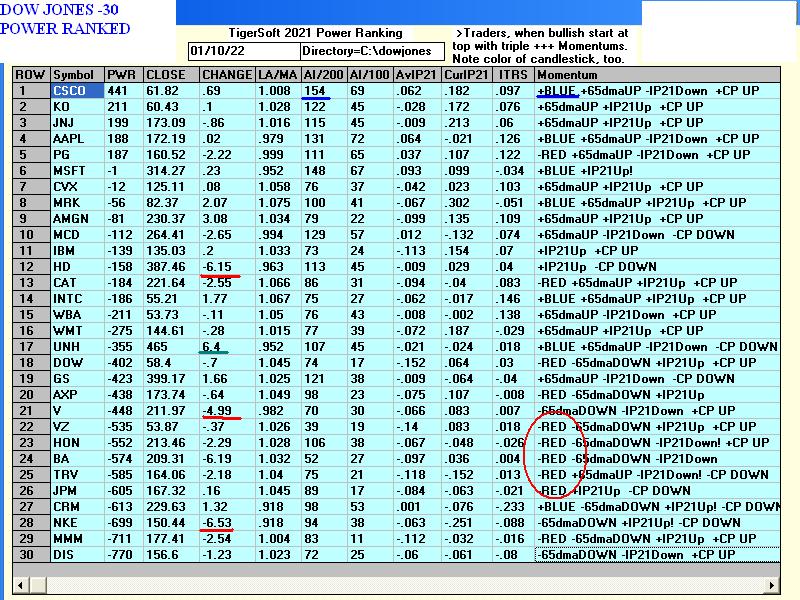 |
 |
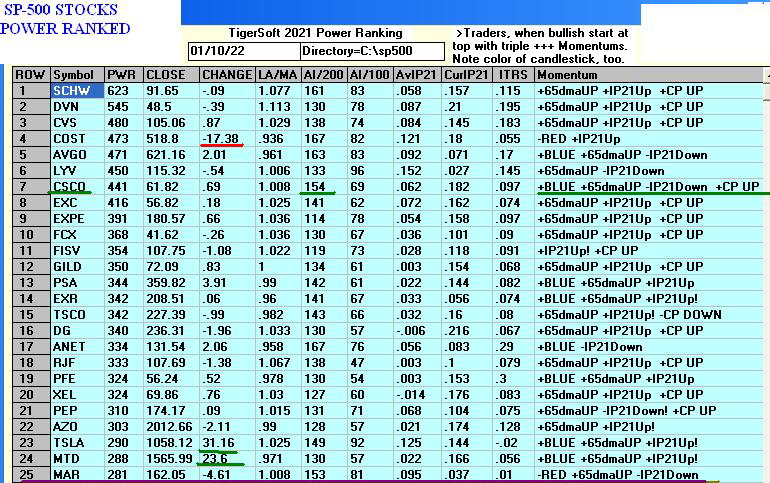 |
 |
 |
 |
| Tables below |
Table 1 QUICKSILVER on ETFS - 1/10//2022 Bullish = 1 - SOXL (+.381) Bearish = 1 - RSX ETF CLOSE CHANGE PIVOT-PT 5-dma AROC CL-PWR CANDLE IP21 ITRS POWER INDEX ================================================================================================= DIA 360.79 -1.52 367.87 -67.1% Bullish RED .055 ---- ---- --------------------------------------------------------------------------------------------- SPY 465.51 -.58 477.55 -129.4% ------- BLUE .115 .006 .121 --------------------------------------------------------------------------------------------- QQQ 380.11 .25 396.47 -277.1% Bearish BLUE .108 -.02 .088 --------------------------------------------------------------------------------------------- MDY 506.53 -1.99 521.7 -123.1% Bullish BLUE .096 -.014 .082 --------------------------------------------------------------------------------------------- IWM 215.32 -.75 224.98 -226.8% Bearish BLUE .064 -.066 -.002 --------------------------------------------------------------------------------------------- FAS 148.53 -1.13 144.05 491% ------- RED .069 .004 .073 --------------------------------------------------------------------------------------------- RETL 31 -1.67 37.07 -984% Bearish RED .082 -.256 -.174 --------------------------------------------------------------------------------------------- SOXL 60 .26 71.07 -909.9% Bearish BLUE .091 .267 .358 --------------------------------------------------------------------------------------------- TECL 74.64 .15 85.87 -869.3% Bearish BLUE .093 .055 .148 --------------------------------------------------------------------------------------------- IBB 142.16 1.61 148.29 -351.5% Bearish BLUE .09 -.122 -.032 --------------------------------------------------------------------------------------------- GLD 168.26 .51 169.57 -2.1% ------- BLUE .149 -.009 .14 --------------------------------------------------------------------------------------------- OIL 13.91 -.13 13.91 61.1% Bullish RED .03 -.092 -.062 --------------------------------------------------------------------------------------------- OIH 211.9 .02 205.9 355.6% Bullish BLUE .17 -.033 .137 --------------------------------------------------------------------------------------------- CPER 26.61 -.28 27.26 -65.1% Bullish RED .266 -.028 .238 --------------------------------------------------------------------------------------------- UUP 25.72 .06 25.81 -13.6% ------- ---- -.102 .017 -.085 --------------------------------------------------------------------------------------------- CORN 21.82 -.2 22.04 73.2% Bullish RED .038 .018 .056 --------------------------------------------------------------------------------------------- WEAT 7.31 0 7.39 27.4% Bullish BLUE .288 -.043 .245 --------------------------------------------------------------------------------------------- YINN 8.32 .02 7.87 6.3% ------- RED .067 -.309 -.242 --------------------------------------------------------------------------------------------- RSX 25.95 0 26.59 -168.9% Bearish ---- -.147 -.215 -.362 |
 Table 2   Count of Stocks in Key Directories
           20220110
-------------------------------
NEWHIGHS       182
NEWLOWS        945
MAXCP          15
MINCP          79
TTTNH          30
TTTNL          105
CPCROSSA       96
CPCROSSD       99
HIGHIP21       16
HIUPPCT        17
VHIP21         67
LOWACCUM       191
REDSELL        148
AUGSELS7       20
TRAPDOOR       8
|
Table 3       RANKING OF KEY DIRECTORIES BASED PCT.OF STOCKS ABOVE 65-DMA
              1/10/22
   Bullish = 25
   Bearish = 21
---------------------------------------------------------------------------------------
Directory     Current       day-1         day-2         day-3         day-4         day-5
----------------------------------------------------------------------------------------
BIGBANKS       1             .857          .857          .714          .857          .571
REGBANKS       .96           .96           .96           .84           .92           .8
BEVERAGE       .857          .857          .785          .857          .857          .785
INSURANC       .84           .88           .76           .68           .8            .68
COAL           .833          .833          .833          .833          .833          .666
DJI-13         .769          .846          .846          .923          .923          .615
SP-100         .766          .811          .766          .755          .8            .722
DOWJONES       .733          .833          .733          .766          .833          .6
INFRA          .727          .787          .787          .787          .818          .666
UTILITY        .692          .717          .692          .743          .794          .846
OILGAS         .676          .704          .666          .571          .676          .523
FIDSTKS        .674          .686          .668          .644          .763          .721
FINANCE        .672          .684          .666          .642          .761          .72
MILITARY       .653          .692          .615          .615          .692          .5
COMPUTER       .65           .6            .65           .7            .85           .85
SP500          .639          .669          .675          .677          .783          .733
TRANSP         .631          .684          .631          .684          .736          .684
COPPER         .625          .875          .75           .75           1             1
INDMATER       .611          .597          .597          .597          .722          .638
REIT           .6            .669          .669          .615          .753          .692
HOMEBLDG       .555          .555          .666          .777          .944          .944
FOOD           .551          .53           .51           .53           .591          .408
CHEM           .543          .543          .673          .652          .739          .63
INDEXES        .518          .508          .589          .605          .691          .637
COMODITY       .512          .512          .41           .435          .564          .384
===========================================================================================
EDU            .5            .5            .666          .666          .5            .666
HOSPITAL       .5            .312          .437          .562          .687          .625
JETS           .5            .714          .428          .5            .642          .428
===========================================================================================
NASD-100       .474          .463          .505          .494          .639          .701
AUTO           .471          .452          .528          .509          .603          .415
SEMI           .431          .452          .547          .568          .631          .663
               ^^^^^
ELECTRON       .421          .458          .511          .511          .571          .616
HACKERS        .421          .421          .421          .315          .473          .578
NIFTY          .413          .413          .521          .5            .586          .652
GUNS           .384          .384          .384          .538          .615          .461
SOFTWARE       .339          .339          .339          .339          .464          .517
RUS-1000       .316          .341          .339          .339          .405          .374
HIGHPRIC       .283          .301          .378          .378          .581          .585
RETAIL .276 .34 .361 .404 .489 .489 GOLD .26 .152 .065 .239 .391 .347 ETFS .254 .309 .309 .327 .363 .345 MARIJUAN .25 .25 .25 .25 .25 .25 CHINA .2 .24 .12 .16 .16 .18 BONDFUND .172 .218 .149 .241 .425 .528 BIOTECH .162 .168 .168 .159 .22 .28 GREEN .157 .21 .21 .315 .421 .368 LOWPRICE .129 .15 .137 .142 .157 .134 GAMING .052 .157 .157 .052 .473 .421 SOLAR 0 0 0 0 0 0 |
==================================================================================
January 10
:4:30 AM DJI - 5 NASDAQ -
63 Data through 1/7/2022
Sell S16
| This week we get the
latest CPI-inflation figueres. This could cause the 10-year and short-term rates to go to new yearly highs. The big banks have boldly gone up this past week, but Professionals have been cautious and suspicious of the rally as the financial ETF, FAS, gets back to its yearly high near 140. Watch FAS to see if it can make a new high. That ought to be bullish for the DJI short-term. But the over-head supply of stock in the DJI seems too considerable to allow much of a rally. But more important, watch the NASDAQ (COMPQX here), QQQ and TECL. These tech-heavy indexes and ETFs have retreated to key supporta. Their breakdowns below the green support levels below will be dangerous. Techs have made huge gains because the FED could guarantee their share holders there would be no big declines for the last year and a half. Now the FED is probably reversing course, so the failures of these three indexes and ETFs will likely yield another wave of selling, at the least, to match their recent sell-offs. Given the number of NASDAQ new lows, the real NASDAQ is now in danger of being revealed for all to see SOXL (Semiconductors) are naturally volatile. Friday's sell-off in them is a bearish sign for this week. Biotechs are also particularly weak. Only Oil stocks and possibly electric autos seem attractive. The weaknesss now seen in previously strong AAPL, MSFT, HD (Home Depot) and UNH (United Health) leaves the DJI-30 very little leadership to save day. So, remain short DIA. If the tech ETFs break the support shown below, go short QQQ, too. In this event, as long as their Closing Powers are falling, they appear to be quite vulnerable. Seasonality calls for a rally only one third of the time in the month after January 10th if we consider every fourth year since 1966 (1970, 1974, 1978, 1982, 1986, 1990...) |
||
|
Charts - 1/7/2022 2022 PEERLESS DJI, Signals, Indicators Daily DJI Volume 10-DayUp/Down Vol Stoch-20 Pct of All Stocks above 65-dma Inverted Traders Index Cum. Inverted Traders Index DJI-IPA DJI-OBV NASDAQ S&P OEX NYSE COMPQX DJI-15 DJI-20 DJI-30 DIA QQQ SPY IWM TNA Short-Term Rates DOLLAR-UUP ALLSTOCKs recent 2006 vers-Peerless signals http://tigersoftware.com/NEWPEER/UPD80107.BMP MDY - http://www.tigersoftware.com/CHARTZ/MDY.GIF USO-CrudeOil DBO FAS GLD HD IBB JETS JNUG KOL NUGT OIH PALL RSX RETL SDS AGQ SLV SOXL TAN TECL TLT TMF TNA UGA (gasoline) USO (oil) a nd China: YINN CHAU Commodities: CANE CORN DBC JJC, NIB CORN, CUT (paper) MOO, SOYB WEAT UUP (Dollar) LIT (Lithium) STOCKS: MRNA DIS GE PYPL GME ZOM XLE NRGU AAPL ADBE ALXN AMAT AMGN AMD AMZN AXP BA BABA BAC BIDU BLDP CAT CRM CVX CMG DE ENPH FB GILD GOOG GS HD IBM INTU JPM LRCX M MRK MSFT NEM NFLX NKE NKE NVDA PG PYPL REGN REV SO SQ QCOM QDEL TSLA TXN XOM V VRTX WFC WMT ZM Bullish MAXCPs http://tigersoftware.com/UPPER/1-7/BULLISH.htm Bearish MAXCPs http://tigersoftware.com/DOWNER/1-7/BEARISH.htm |
 |
 |
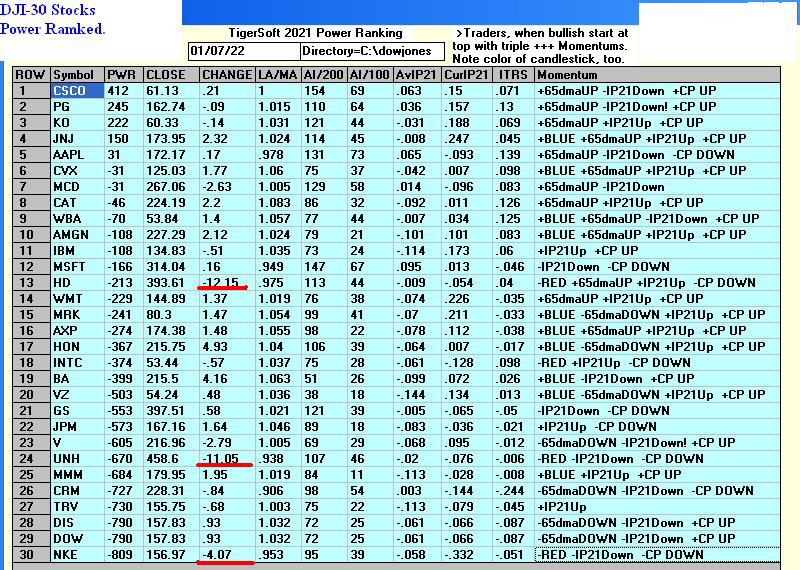 |
 |
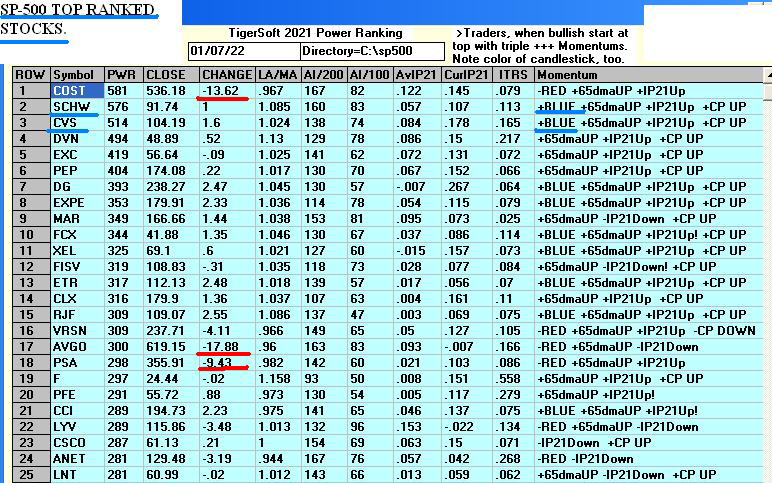 |
 |
 |
 |
 |
 |
 |
 |
Table 1 QUICKSILVER on ETFS - 1/7//2022 Bullish = 1 - SOXL (+.321) Bearish = 2 - RSX, YINN ETF CLOSE CHANGE PIVOT-PT 5-dma AROC CL-PWR CANDLE IP21 ITRS POWER INDEX ================================================================================================= DIA 362.31 -.08 365.68 -13.8% Bullish BLUE .004 ---- --- --------------------------------------------------------------------------------------------- SPY 466.09 -1.85 477.71 -93.7% Bearish RED .015 .006 .021 --------------------------------------------------------------------------------------------- QQQ 379.86 -4.16 401.68 -229% Bearish RED -.004 -.021 -.025 --------------------------------------------------------------------------------------------- MDY 508.52 -3.95 519.19 -88.7% ------- RED -.02 -.006 -.026 --------------------------------------------------------------------------------------------- IWM 216.07 -2.53 225.32 -143.9% Bearish RED -.044 -.055 -.099 --------------------------------------------------------------------------------------------- FAS 149.66 4.36 134.54 682.5% Bullish BLUE .058 .044 .102 --------------------------------------------------------------------------------------------- RETL 32.67 -1.23 37.88 -526.5% ------- RED -.017 -.184 -.201 --------------------------------------------------------------------------------------------- SOXL 59.74 -5.8 72.1 -606.8% Bearish RED -.013 .334 .321 +++ --------------------------------------------------------------------------------------------- TECL 74.49 -2.25 88.68 -706.4% Bearish RED -.006 .073 .067 --------------------------------------------------------------------------------------------- IBB 140.55 -1.87 152.37 -408.8% Bearish RED .029 -.128 -.099 --------------------------------------------------------------------------------------------- GLD 167.75 .76 168.33 -95% ------- BLUE .093 -.023 .07 --------------------------------------------------------------------------------------------- OIH 211.88 2.82 197.29 675.9% Bullish BLUE .174 -.03 .144 --------------------------------------------------------------------------------------------- CPER 26.89 .3 26.96 -59.4% Bullish BLUE .232 -.018 .214 --------------------------------------------------------------------------------------------- UUP 25.66 -.14 25.79 5.8% Bullish RED -.083 -.002 -.085 --------------------------------------------------------------------------------------------- CORN 22.02 .13 21.5 110.3% Bullish BLUE .054 .026 .08 --------------------------------------------------------------------------------------------- WEAT 7.31 .09 7.27 -54.7% Bullish BLUE .27 -.039 .231 --------------------------------------------------------------------------------------------- YINN 8.3 .47 8.31 -18.9% Bullish BLUE .06 -.317 -.257 --------------------------------------------------------------------------------------------- RSX 25.95 .26 26.83 -135.5% Bearish RED -.213 -.223 -.436 |
 Table 2   Count of Stocks in Key Directories
            20220107
-------------------------------
NEWHIGHS       204
NEWLOWS        402
MAXCP          19
MINCP          121
TTTNH          33
TTTNL          72
CPCROSSA       76
CPCROSSD       94
HIGHIP21       7
HIUPPCT        20
VHIP21         66
LOWACCUM       188
REDSELL        150
AUGSELS7       32
TRAPDOOR       6
|
RANKING OF KEY DIRECTORIES BASED PCT.OF STOCKS ABOVE 65-DMA 1/7/22 --------------------------------------------------------------------------------------- Directory Current day-1 day-2 day-3 day-4 day-5 ---------------------------------------------------------------------------------------- REGBANKS .96 .96 .84 .92 .8 .56 INSURANC .88 .76 .68 .8 .64 .56 COPPER .875 .75 .75 1 1 1 BEVERAGE .857 .785 .857 .857 .785 .785 BIGBANKS .857 .857 .714 .857 .571 0 DJI-13 .846 .846 .923 .923 .615 .692 COAL .833 .833 .833 .833 .666 .666 SP-100 .811 .766 .755 .8 .711 .6 INFRA .787 .787 .787 .818 .666 .606 DOWJONES .766 .7 .733 .8 .633 .6 UTILITY .717 .692 .743 .794 .82 .82 JETS .714 .428 .5 .642 .357 .214 OILGAS .704 .666 .571 .676 .533 .304 MILITARY .692 .615 .615 .692 .5 .5 FIDSTKS .686 .668 .644 .763 .71 .597 FINANCE .684 .666 .642 .761 .708 .595 TRANSP .684 .631 .684 .736 .631 .526 REIT .669 .661 .623 .753 .692 .615 SP500 .669 .675 .679 .785 .729 .667 COMPUTER .6 .65 .7 .85 .85 .75 INDMATER .597 .597 .597 .722 .611 .652 CHEM .543 .673 .652 .739 .586 .586 FOOD .53 .51 .53 .591 .469 .448 COMODITY .512 .41 .435 .564 .435 .41 INDEXES .508 .589 .605 .691 .637 .567 EDU .5 .666 .666 .5 .666 .5 NASD-100 .463 .505 .505 .649 .701 .721 ELECTRON .458 .511 .511 .571 .616 .586 AUTO .452 .528 .509 .603 .433 .415 SEMI .452 .547 .568 .631 .663 .61 HOMEBLDG .444 .555 .666 .944 .944 .944 HACKERS .421 .421 .315 .473 .578 .578 NIFTY .413 .521 .5 .586 .652 .63 GUNS .384 .384 .538 .615 .461 .538 RUS-1000 .341 .339 .339 .405 .377 .344 RETAIL .34 .361 .404 .489 .489 .404 SOFTWARE .339 .339 .339 .464 .517 .5 HOSPITAL .312 .437 .562 .687 .625 .625 ETFS .309 .309 .327 .363 .363 .236 HIGHPRIC .301 .378 .381 .585 .589 .632 MARIJUAN .25 .25 .25 .25 .25 .5 CHINA .24 .12 .16 .16 .18 .18 BONDFUND .218 .149 .241 .425 .528 .563 GREEN .21 .21 .315 .421 .368 .368 BIOTECH .168 .168 .159 .22 .283 .245 GAMING .157 .157 .052 .473 .421 .368 GOLD .152 .065 .239 .391 .369 .478 LOWPRICE .152 .134 .142 .157 .134 .109 SOLAR 0 0 0 0 0 0 |
---------------------------------------------------------------------------------------------------------------------------
Written 5:00 AM - 1-7-2022 DJI -3 NASDAQ +29
(data used ended on 1/6/2022)
| Our Peerless Sell 16, the Fed's
reversion to an anti-Inflationary monetary policy-slant, the broken Closing Powers and the bearish seasonality should all keep us short DIA. The NASDAQ looks especially dangerous. What the FED so easily gave the market in safety for the last twenty months, it seems now to be ready to take way. How can the market possibly hold up if this is so? Keep in mind all the leveraged tools that shorts have to magnify their negative influence on prices. Tonight's highlighted charts show that DJI has little immidiate support, the NASDAQ's is at 14500-15000 and while the SP-500 is safely in its 12-month uptrend, the NASDAQ is coming down to very important support that it must not break. With 600 NASDAQ new lows, it does not look like beaten-down, low-priced will get much of a bounce. Biotechs and Chinese stocks do not seem to want want that role. To many stocks are stuck in a deep bear markets. So, Bulls must be very careful. You can see from our Bullish MAXCPs how few look like buys. The plunge in DOGZ, shown on the Bullish MAXCPs for the lessons it offers, is a clear warning that unseasoned stocks are very unsafe. Traders should start looking for these "piffle stocks" as potential short sales. Even Table 3's perennial leading group, semi-conductors, is pulling back. The electric auto-makers like Ford are fighting a downtrend in stocks that could get much deeper if the NASDAQ Index and QQQ do not hold above their recent lows' support. As we have seen, the seasonality ahead is clearly bearish for the next three months in this second year of a Presidential Election since 1966. The odds of a DJI rally, based on this historical sampling, over the next two weeks are only 20% and 24% over the next month. If we go back before 1966, we find that there DJI was quite weak in 1930 after July, in early 1934, early 1938 and early 1942. In 1946 it dropped below the lower band in February and fell 26%from May to October. The exceptions to the bearish seasonality came in 1950, 1954 and 1958. And of course 1962 featured a steep 25% sell-off until May. The strength now seen in Crude Oil and some oil/gas stocks and ETFs gives bulls an outlet for their investments. But, at the same time, it reflects and reinforces Inflation, thereby making for higher interest rates and reminding us of 1976-1977 and early 2008, which were not good times to be bullish. |
||
|
Charts - 1/6/2022 2022 PEERLESS DJI, Signals, Indicators Daily DJI Volume 10-DayUp/Down Vol Stoch-20 Pct of All Stocks above 65-dma Inverted Traders Index Cum. Inverted Traders Index DJI-IPA DJI-OBV NASDAQ S&P OEX NYSE COMPQX DJI-15 DJI-20 DJI-30 DIA QQQ SPY IWM TNA Short-Term Rates DOLLAR-UUP ALLSTOCKs recent 2006 vers-Peerless signals http://tigersoftware.com/NEWPEER/UPD80106.BMP MDY - http://www.tigersoftware.com/CHARTZ/MDY.GIF USO-CrudeOil DBO FAS GLD HD IBB JETS JNUG KOL NUGT OIH PALL RSX RETL SDS AGQ SLV SOXL TAN TECL TLT TMF TNA UGA (gasoline) USO (oil) a nd China: YINN CHAU Commodities: CANE CORN DBC JJC, NIB CORN, CUT (paper) MOO, SOYB WEAT UUP (Dollar) LIT (Lithium) STOCKS: MRNA DIS GE PYPL GME ZOM XLE NRGU AAPL ADBE ALXN AMAT AMGN AMD AMZN AXP BA BABA BAC BIDU BLDP CAT CRM CVX CMG DE ENPH FB GILD GOOG GS HD IBM INTU JPM LRCX M MRK MSFT NEM NFLX NKE NKE NVDA PG PYPL REGN REV SO SQ QCOM QDEL TSLA TXN XOM V VRTX WFC WMT ZM Bullish MAXCPs http://tigersoftware.com/UPPER/1-6/BULLISH.htm Bearish MAXCPs http://tigersoftware.com/DOWNER/1-6/BEARISH.htm |
 |
 |
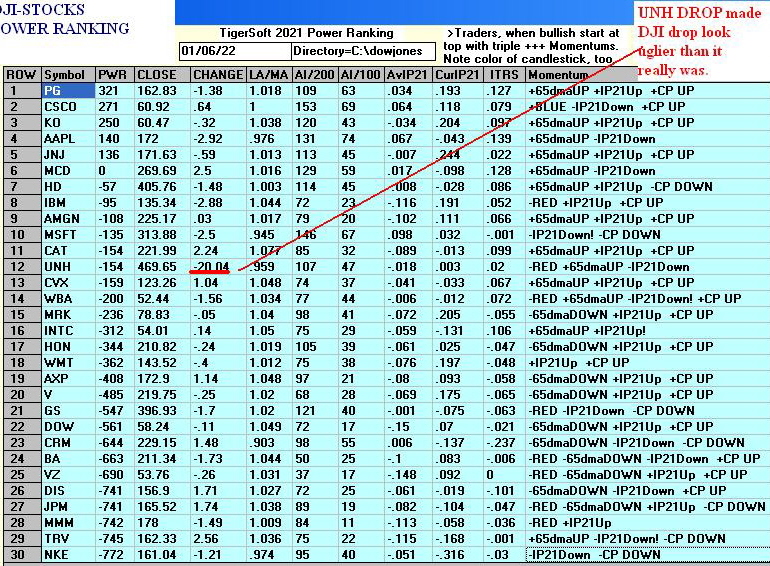 |
 |
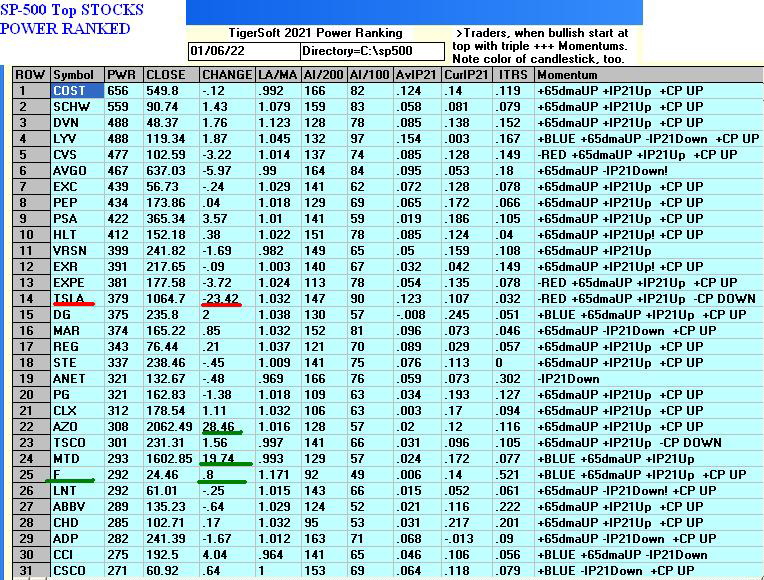 |
 |
 |
  |
|
Table 1 QUICKSILVER on ETFS - 1/6//2022 Bullish = 1 - SOXL (+.51) Bearish = 2 - RSX, YINN ETF CLOSE CHANGE PIVOT-PT 5-dma AROC CL-PWR CANDLE IP21 ITRS POWER INDEX ================================================================================================= DIA 362.39 -1.7 363.32 -23% ------- RED .021 ---- ----- --------------------------------------------------------------------------------------------- SPY 467.94 -.44 474.96 -86.5% ------- RED .064 .013 .077 --------------------------------------------------------------------------------------------- QQQ 384.02 -.27 397.85 -206.1% Bearish BLUE .065 -.001 .064 --------------------------------------------------------------------------------------------- MDY 512.47 2.64 517.68 -44.7% Bullish BLUE .05 -.007 .043 --------------------------------------------------------------------------------------------- IWM 218.6 1.24 222.45 -97.3% Bearish BLUE .022 -.054 -.032 --------------------------------------------------------------------------------------------- FAS 145.3 6.55 130.73 515.9% Bearish BLUE .002 -.034 -.032 --------------------------------------------------------------------------------------------- RETL 33.9 .63 36.43 -440.2% Bearish BLUE -.015 -.204 -.219 --------------------------------------------------------------------------------------------- SOXL 65.54 1.53 68.01 -205.2% Bearish BLUE .066 .444 .51 --------------------------------------------------------------------------------------------- TECL 76.74 -1.23 86.23 -633.9% Bearish BLUE .042 .109 .151 --------------------------------------------------------------------------------------------- IBB 142.42 -.08 152.62 -378.2% Bearish BLUE .108 -.124 -.016 --------------------------------------------------------------------------------------------- GLD 166.99 -2.07 170.96 -82.9% ------- RED .089 -.018 .071 --------------------------------------------------------------------------------------------- OIL 14.08 .27 13.55 127.3% Bullish RED .069 -.101 -.032 --------------------------------------------------------------------------------------------- OIH 209.06 6.07 184.84 630.7% Bullish BLUE .159 -.086 .073 --------------------------------------------------------------------------------------------- CPER 26.59 -.11 27.21 -27.8% Bullish BLUE .216 -.047 .169 --------------------------------------------------------------------------------------------- UUP 25.8 .02 25.63 11.7% Bullish ---- -.087 .01 -.077 --------------------------------------------------------------------------------------------- CORN 21.89 .07 21.54 73.8% Bullish BLUE .04 .054 .094 --------------------------------------------------------------------------------------------- WEAT 7.22 -.1 7.39 -176.4% Bullish ---- .208 -.029 .179 --------------------------------------------------------------------------------------------- YINN 7.83 .41 8.33 -475% ------- BLUE .066 -.37 -.304 --------------------------------------------------------------------------------------------- RSX 25.69 .51 26.66 -149.9% Bearish BLUE -.163 -.238 -.401 |
Table 2    Count of Stocks in Key Directories
           20220106
-------------------------------
NEWHIGHS       154
NEWLOWS        197 (612 on NASDAQ today)
MAXCP          14
MINCP          86
TTTNH          22
TTTNL          59
CPCROSSA       81
CPCROSSD       78
HIGHIP21       9
HIUPPCT        25
VHIP21         65
LOWACCUM       187
REDSELL        151
AUGSELS7       31
TRAPDOOR       9
|
Table 3 RANKING OF KEY DIRECTORIES BASED PCT.OF STOCKS ABOVE 65-DMA
              1/6/22
  Bullish = 30
  Bearish = 19
---------------------------------------------------------------------------------------
Directory     Current       day-1         day-2         day-3         day-4         day-5
----------------------------------------------------------------------------------------
REGBANKS       .96           .84           .92           .8            .56           .48
BIGBANKS       .857          .714          .857          .571          0             0
DJI-13         .846          .923          .923          .615          .692          .692
COAL           .833          .833          .833          .666          .666          .666
INFRA          .787          .787          .818          .666          .606          .545
BEVERAGE       .785          .857          .857          .785          .785          .785
SP-100         .766          .755          .8            .711          .6            .6
INSURANC       .76           .68           .8            .64           .6            .6
COPPER         .75           .75           1             1             1             1
DOWJONES       .733          .766          .833          .6            .633          .666
               +++++
HOMEBLDG       .705          .823          .941          .941          .941          .941
UTILITY        .692          .743          .794          .82           .846          .82
SP500          .675          .679          .785          .729          .673          .665
CHEM           .673          .652          .739          .586          .586          .586
FIDSTKS        .668          .644          .763          .71           .603          .603
EDU            .666          .666          .5            .666          .5            .5
FINANCE        .666          .642          .761          .708          .601          .601
OILGAS         .666          .571          .676          .533          .304          .285
REIT           .661          .615          .761          .692          .63           .623
COMPUTER       .65           .7            .85           .85           .75           .8
TRANSP         .631          .684          .736          .631          .526          .526
MILITARY       .615          .615          .692          .5            .5            .5
INDMATER       .597          .597          .722          .611          .652          .638
INDEXES        .589          .605          .691          .637          .572          .6
SEMI           .547          .568          .631          .663          .61           .61
AUTO           .528          .509          .603          .433          .415          .358
NIFTY          .521          .5            .586          .652          .63           .63
ELECTRON       .511          .511          .571          .616          .586          .586
FOOD           .51           .53           .591          .469          .448          .53
NASD-100       .505          .505          .649          .701          .721          .721
==========================================================================================
HOSPITAL       .437          .562          .687          .625          .625          .625
JETS           .428          .5            .642          .357          .214          .214
HACKERS        .421          .315          .473          .578          .578          .631
COMODITY       .41           .435          .564          .435          .41           .487
GUNS           .384          .538          .615          .461          .538          .538
HIGHPRIC       .378          .381          .585          .589          .636          .643
RETAIL         .361          .404          .489          .489          .404          .404
RUS-1000       .339          .339          .405          .377          .346          .334
SOFTWARE       .339          .339          .464          .517          .5            .517
ETFS           .309          .327          .363          .363          .29           .254
MARIJUAN .25 .25 .25 .25 .5 .25 GREEN .21 .315 .421 .368 .368 .368 BIOTECH .168 .159 .22 .283 .242 .242 GAMING .157 .052 .473 .421 .421 .368 BONDFUND .149 .241 .425 .528 .574 .54 LOWPRICE .137 .139 .157 .134 .111 .094 CHINA .12 .16 .16 .18 .18 .18 GOLD .065 .239 .391 .369 .478 .413 SOLAR 0 0 0 0 0 0 |
----------------------------------------------------------------------------------------------------------------------------------------------
Written 5:35 AM - 1-6-2022 DJI +99 NASDAQ -71 (data used ended on 1/5/2022)
| The operative Peerless Sell S16 predicts a 7%-8%
decline from here. This signal has never failed. The seasonality for the next month is particularly bearish. Since 1966 the odds are only 20% for a rally over the next 21 trading days in the second year of the four year cycle. Today, we learned that many members of the FED's committee that set interest rate and bond buying/selling policies now believe Inflation is not "transient". They now consider it a more serious threat than Unemployment to the national economy. Full employment and Labor shortages, in particular, are making wages rise too fast, causing strikes and bottlenecks of supply. All these things could get out of control. They threaten predictability, as well as corporate profits. This endangers the "health" of the US economy, says Powell. Small wonder that his reversal dropped the DJI by a percent today. The dangers that he will do what he says seems bound to hurt the market. What the FED created, in the way the market more than doubled since March 2020, it now is threatening to take away. Even the big indexes are in danger if their highest priced components break down. As long as our Closing Powers show that Professionals are bearish for DIA, SPY and QQQ, we must be, too. Watch to see if more breakdowns occur. I highlight IBB, BBH and NVDA tonight for that purpose. What Powell does not say is that the FED now faces the real challenge. Will Wall Street let it deflate via higher rates and selling back all the bonds it bought? What if the stock market starts to fall too fast? What if renegade hedge funds use all the tools of leverage at their disposal to sell short the market? Is the FED ready to pay the price of a steep sell-off in stocks to fight inflation? To be effective, the FED's tightening must be credible. The worst part of the sell-off today was more in tech stocks than anywhere else. But the financials did get clipped, too. This is profit-taking so far. We will need to see more very bad breadth days and more new lows on the NYSE. Today, the NASDAQ saw 500 new lows while the NYSE was not much worse than the day before. Our Closing Powers for the key ETFs are all falling. When we compare the nominal new high made by the DJI's theortetical high with our internal strength indicators, we see they all bearishly diverged. The DJI may try to recover a small amount, but seasonality is particularly bearish now. The resistance at 37000 in the DJI seems very imposing. As long as our Closing Powers show that Professionals are bearish, we must be, too. Sell short DIA and some of the bearish MINCPs, if you did not today. |
||
|
Charts - 1/5/2022 2022 PEERLESS DJI, Signals, Indicators Daily DJI Volume 10-DayUp/Down Vol Stoch-20 Pct of All Stocks above 65-dma Inverted Traders Index Cum. Inverted Traders Index DJI-IPA DJI-OBV NASDAQ S&P OEX NYSE COMPQX DJI-15 DJI-20 DJI-30 DIA QQQ SPY IWM TNA Short-Term Rates DOLLAR-UUP ALLSTOCKs recent 2006 vers-Peerless signals http://tigersoftware.com/NEWPEER/UPD80105.BMP MDY - http://www.tigersoftware.com/CHARTZ/MDY.GIF USO-CrudeOil DBO FAS GLD HD IBB JETS JNUG KOL NUGT OIH PALL RSX RETL SDS AGQ SLV SOXL TAN TECL TLT TMF TNA UGA (gasoline) USO (oil) a nd China: YINN CHAU Commodities: CANE CORN DBC JJC, NIB CORN, CUT (paper) MOO, SOYB WEAT UUP (Dollar) LIT (Lithium) STOCKS: MRNA DIS GE PYPL GME ZOM XLE NRGU AAPL ADBE ALXN AMAT AMGN AMD AMZN AXP BA BABA BAC BIDU BLDP CAT CRM CVX CMG DE ENPH FB GILD GOOG GS HD IBM INTU JPM LRCX M MRK MSFT NEM NFLX NKE NKE NVDA PG PYPL REGN REV SO SQ QCOM QDEL TSLA TXN XOM V VRTX WFC WMT ZM Bullish MAXCPs http://tigersoftware.com/UPPER/1-5/BULLISH.htm Bearish MAXCPs http://tigersoftware.com/DOWNER/1-5/BEARISH.htm |
 |
 |
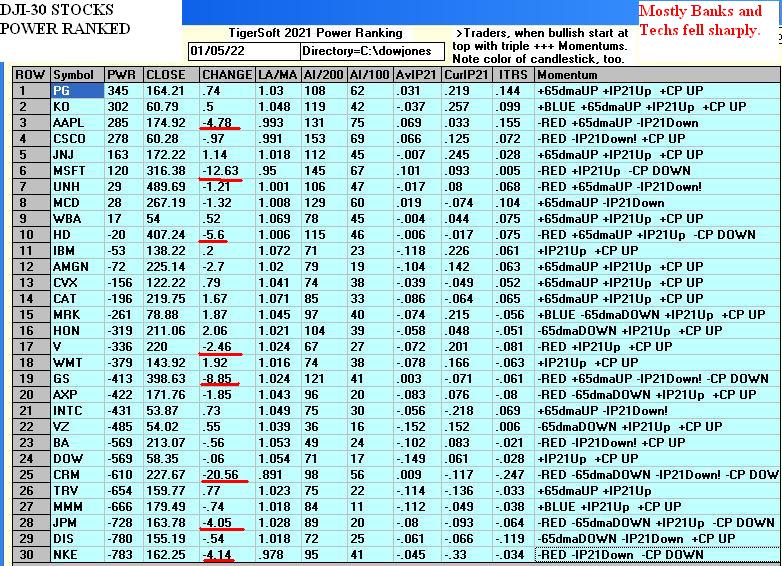 |
 |
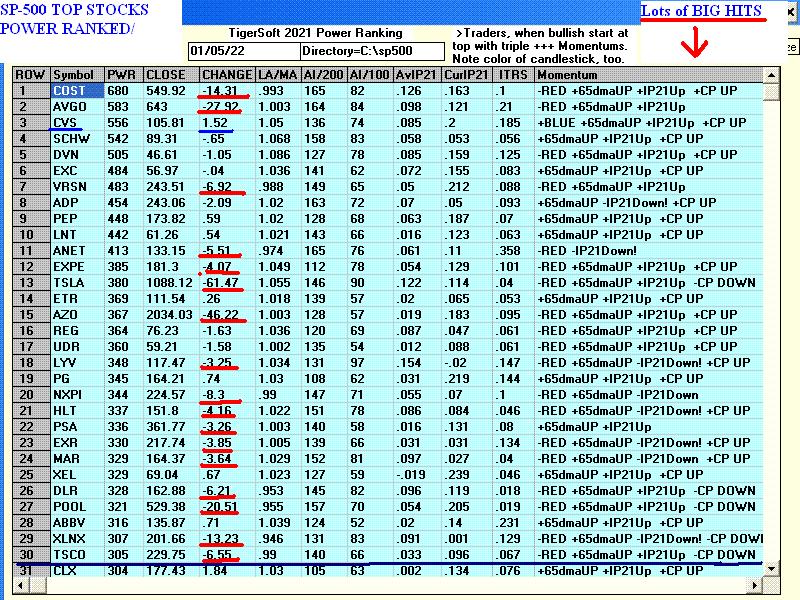 |
 |
 |
 |
 |
 |
|
Table 1 QUICKSILVER on ETFS - 1/5//2022 Bullish = 1 - SOXL (+.484), TECL (.45), WEAT Bearish = 3 - RETL, RSX, YINN ETF CLOSE CHANGE PIVOT-PT 5-dma AROC CL-PWR CANDLE IP21 ITRS POWER INDEX ================================================================================================= DIA 364.09 -3.78 364.07 -10.3% Bullish RED .086 ------ ---- --------------------------------------------------------------------------------------------- SPY 468.38 -9.17 476.16 -95.4% ------- RED .118 .01 .128 --------------------------------------------------------------------------------------------- QQQ 384.29 -12.18 400.35 -216% Bearish RED .101 -.001 .1 --------------------------------------------------------------------------------------------- MDY 509.83 -11.87 517.09 -83.9% Bullish RED .029 -.023 .006 --------------------------------------------------------------------------------------------- IWM 217.36 -7.62 222.93 -125.8% Bearish RED .014 -.071 -.057 --------------------------------------------------------------------------------------------- FAS 138.75 -5.3 131.28 240% Bearish RED -.031 -.078 -.109 --------------------------------------------------------------------------------------------- RETL 33.27 -3.8 37.1 -367.3% Bearish RED -.054 -.27 -.324 --------------------------------------------------------------------------------------------- SOXL 64.01 -7.06 68.36 -498.5% Bearish RED .082 .402 .484 --------------------------------------------------------------------------------------------- TECL 77.97 -7.9 87.55 -646.1% Bearish RED .102 .131 .233 --------------------------------------------------------------------------------------------- IBB 142.5 -5.79 153.76 -339.9% Bearish RED .13 -.129 .001 --------------------------------------------------------------------------------------------- GLD 169.06 -.51 169.8 13.9% Bullish RED .158 -.018 .14 --------------------------------------------------------------------------------------------- OIH 202.99 -2.91 184.45 457.8% Bullish RED .148 -.116 .032 --------------------------------------------------------------------------------------------- CPER 26.7 -.56 26.74 -49.9% Bullish RED .145 -.054 .091 --------------------------------------------------------------------------------------------- UUP 25.78 -.03 25.74 15.5% ------- BLUE -.194 .006 -.188 --------------------------------------------------------------------------------------------- CORN 21.82 -.22 21.57 -34.5% Bullish RED .024 .052 .076 --------------------------------------------------------------------------------------------- WEAT 7.32 -.07 7.48 -175.2% Bullish ---- .241 -.033 .208 --------------------------------------------------------------------------------------------- YINN 7.42 -.45 8.6 -220.1% ------- RED .031 -.446 -.415 --------------------------------------------------------------------------------------------- RSX 25.18 -1.41 26.48 -227.5% Bearish RED -.175 -.263 -.438 |
Table 2 Count of Stocks in Key Directories
20220105
-------------------------------
NEWHIGHS 67
NEWLOWS 104
MAXCP 17
MINCP 162
TTTNH 39
TTTNL 107
CPCROSSA 8
CPCROSSD 439
ACCUMVER 4
HIGHIP21 10
HIUPPCT 21
VHIP21 65
LOWACCUM 214
REDSELL 145
AUGSELS7 28
TRAPDOOR 41
|
 Table 3      RANKING OF KEY DIRECTORIES BASED PCT.OF STOCKS ABOVE 65-DMA
               1/5/22
 Bullish = 31
 Bearish = 18
---------------------------------------------------------------------------------------
Directory     Current       day-1         day-2         day-3         day-4         day-5
----------------------------------------------------------------------------------------
DJI-13         .923          .923          .615          .692          .692          .769
BEVERAGE       .857          .857          .785          .785          .714          .785
REGBANKS       .84           .92           .8            .56           .48           .64
COAL           .833          .833          .666          .666          .833          .833
HOMEBLDG       .823          .941          .941          .941          .941          1
INFRA          .787          .818          .666          .606          .545          .545
DOWJONES       .766          .833          .6            .633          .666          .7
               ^^^^^
SP-100         .755          .8            .711          .6            .6            .633
COPPER         .75           1             1             1             1             1
UTILITY        .743          .794          .82           .846          .82           .82
BIGBANKS       .714          .857          .571          0             0             0
COMPUTER       .7            .85           .85           .75           .8            .8
TRANSP         .684          .736          .631          .526          .526          .526
INSURANC       .68           .8            .64           .6            .6            .64
SP500          .679          .785          .729          .673          .663          .681
EDU            .666          .5            .666          .5            .5            .5
CHEM           .652          .739          .586          .586          .586          .63
FIDSTKS        .644          .763          .71           .603          .603          .633
FINANCE        .642          .761          .708          .601          .601          .63
MILITARY       .615          .692          .5            .5            .5            .5
REIT           .615          .753          .7            .63           .623          .653
INDEXES        .605          .691          .637          .572          .605          .589
INDMATER       .597          .722          .611          .652          .652          .611
OILGAS         .575          .632          .518          .301          .292          .358
SEMI           .568          .631          .663          .61           .61           .61
HOSPITAL       .562          .687          .625          .625          .625          .625
GUNS           .538          .615          .461          .538          .538          .538
FOOD           .53           .591          .469          .448          .551          .551
ELECTRON       .511          .571          .616          .586          .586          .586
AUTO           .509          .603          .433          .415          .377          .396
NASD-100       .505          .649          .701          .721          .721          .721
================================================================================================
JETS           .5            .642          .357          .214          .214          .142
NIFTY          .5            .586          .652          .63           .63           .652
COMODITY       .435          .564          .435          .41           .512          .512
RETAIL         .404          .489          .489          .404          .425          .382
HIGHPRIC       .381          .585          .589          .636          .643          .636
RUS-1000       .339          .405          .377          .346          .336          .326
SOFTWARE       .339          .464          .517          .5            .517          .517
ETFS           .327          .363          .363          .29           .254          .29
GREEN          .315          .421          .368          .368          .368          .368
HACKERS        .315          .473          .578          .578          .631          .578
MARIJUAN .25 .25 .25 .5 .25 .5 BONDFUND .241 .425 .528 .574 .528 .425 GOLD .239 .391 .369 .478 .434 .369 CHINA .16 .16 .18 .18 .18 .12 BIOTECH .159 .22 .283 .242 .242 .253 LOWPRICE .142 .155 .134 .111 .094 .096 GAMING .052 .473 .421 .421 .368 .315 SOLAR 0 0 0 0 0 0 |
-----------------------------------------------------------------------------------------------------------------------------------------------------
Written 5:35 AM - 1-5-2022 DJI + 8
NASDAQ -67 (data used ended on
1/4/2022)
I posited a goal yesterday of 37,218 for the DJI. We're slowly moving up towards 37000. Today, the DJI sold off after reaching the round number 37000. Tech stocks followed Tesla's profit taking lead down as short-term rates rose steeply towards 1%. Very interestingly, the big banks advanced again, despite this. But it was less with Professional buying than year-beginning optimism from the Feds and foreigners who liked the rise in the Dollar. Electric Autos and Property Owning stocks were popular. They ignored the rising rates. Buyers of REITS and Property stocks kept sight of rising rents, housing shortages and do not disapprove so much of President Biden's silence on how he will deal with the worst sign of inflation affecting middle-America, housing.. . The failure of many leading tech stocks to breakout to new highs and instead retreat should be viewed with concern. Historically, the first six months in the second year of the four- year Presidential cycle is much more likely to bring a retreat in the market. See the statistics for this year if one bought the DJI at close today just below. Note how a whole new group of down-side leaders has appeared in our Bearish MINCPs. New hea and shoulders and support failures now could be establishing the downside leadership for 2022 just a Ford's breakout should be considered a harbinger of big growth ahead for electric auto stocks. https://www.barrons.com/articles/umh-stock-pick-housing-shortage-51638570545 https://swingtradebot.com/stocks-tagged-as/16736-mobile-home The Peerless Sell S16 has never failed. So shorting DIA over 370 seems a reasonable trade to initiate. But recalling how fast and far mobile home stocks rose when they boomed in the early 1970s, I would suggest buying more Ford on its breakout 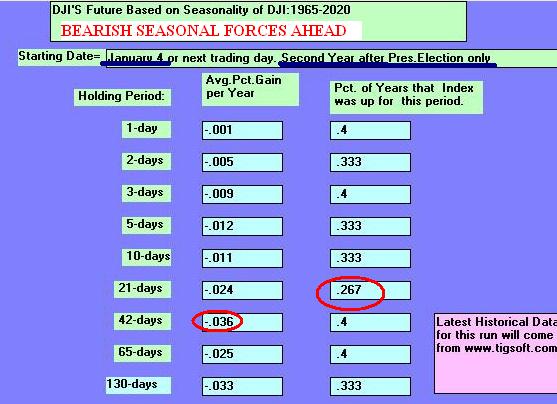 |
||
|
Charts - 1/4/2022 2022 PEERLESS DJI, Signals, Indicators Daily DJI Volume 10-DayUp/Down Vol Stoch-20 Inverted Traders Index Cum. Inverted Traders Index DJI-IPA DJI-OBV NASDAQ S&P OEX NYSE COMPQX DJI-15 DJI-20 DJI-30 DIA QQQ SPY IWM TNA Short-Term Rates DOLLAR-UUP ALLSTOCKs recent 2006 vers-Peerless signals http://tigersoftware.com/NEWPEER/UPD80104.BMP MDY - http://www.tigersoftware.com/CHARTZ/MDY.GIF USO-CrudeOil DBO FAS GLD HD IBB JETS JNUG KOL NUGT OIH PALL RSX RETL SDS AGQ SLV SOXL TAN TECL TLT TMF TNA UGA (gasoline) USO (oil) a nd China: YINN CHAU Commodities: CANE CORN DBC JJC, NIB CORN, CUT (paper) MOO, SOYB WEAT UUP (Dollar) LIT (Lithium) STOCKS: MRNA DIS GE PYPL GME ZOM XLE NRGU AAPL ADBE ALXN AMAT AMGN AMD AMZN AXP BA BABA BAC BIDU BLDP CAT CRM CVX CMG DE ENPH FB GILD GOOG GS HD IBM INTU JPM LRCX M MRK MSFT NEM NFLX NKE NKE NVDA PG PYPL REGN REV SO SQ QCOM QDEL TSLA TXN XOM V VRTX WFC WMT ZM Bullish MAXCPs http://tigersoftware.com/UPPER/1-4/BULLISH.htm Bearish MAXCPs http://tigersoftware.com/DOWNER/1-4/BEARISH.htm |
 |
 |
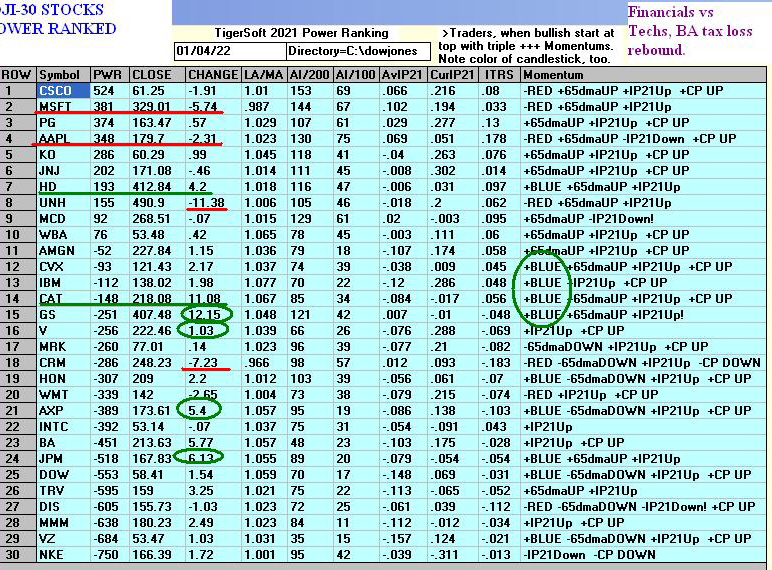 |
 |
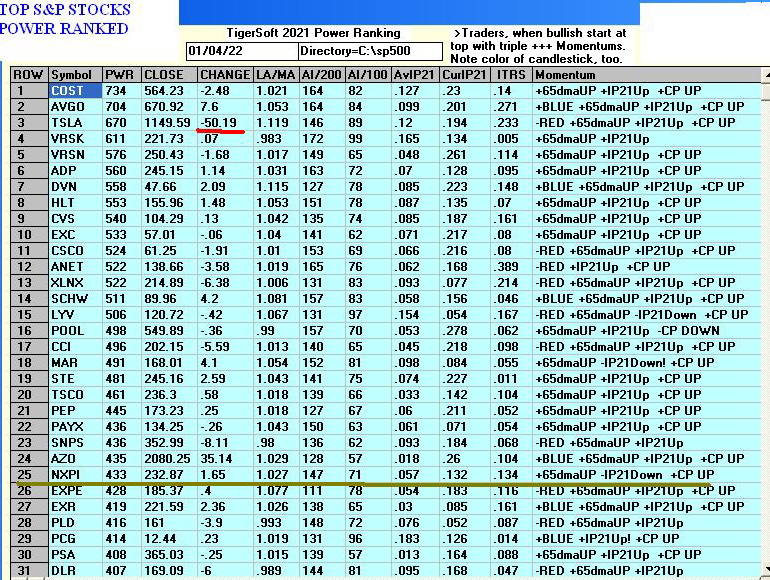 |
 |
 |
 |
 |
 |
 |
Table 1 QUICKSILVER on ETFS - 1/04//2022 Bullish = 3 - SOXL (+.761), TECL (.45), WEAT Bearish = 2 - RSX, YINN ETF CLOSE CHANGE PIVOT-PT 5-dma AROC CL-PWR CANDLE IP21 ITRS POWER INDEX ================================================================================================= DIA 367.87 2.19 364.84 53.2% Bullish BLUE .193 --------------- --------------------------------------------------------------------------------------------- SPY 477.55 -.16 477.48 7.1% Bullish RED .205 .023 .228 --------------------------------------------------------------------------------------------- QQQ 396.47 -5.21 401.55 -64.2% Bullish RED .213 .029 .242 --------------------------------------------------------------------------------------------- MDY 521.7 2.51 518.54 57.6% Bullish BLUE .118 -.007 .111 --------------------------------------------------------------------------------------------- IWM 224.98 -.34 222.99 49.9% Bullish RED .101 -.042 .059 --------------------------------------------------------------------------------------------- FAS 144.05 9.51 132.29 436.2% Bullish BLUE .031 -.053 -.022 --------------------------------------------------------------------------------------------- RETL 37.07 -.81 35.98 254.7% ------- RED .014 -.157 -.143 --------------------------------------------------------------------------------------------- SOXL 71.07 -1.03 71 39.3% Bullish RED .179 .582 .761 --------------------------------------------------------------------------------------------- TECL 85.87 -2.81 89.28 -182% Bullish RED .201 .249 .45 --------------------------------------------------------------------------------------------- IBB 148.29 -4.08 152.83 -128% Bullish RED .195 -.095 .1 --------------------------------------------------------------------------------------------- GLD 169.57 1.24 168.59 27.5% Bullish BLUE .203 -.02 .183 --------------------------------------------------------------------------------------------- OIH 205.9 8.61 185.45 457.6% Bullish BLUE .24 -.103 .137 --------------------------------------------------------------------------------------------- CPER 27.26 .3 26.97 40.8% Bullish BLUE .241 -.041 .2 --------------------------------------------------------------------------------------------- UUP 25.81 .02 25.7 7.8% ------- ---- -.238 -.004 -.242 --------------------------------------------------------------------------------------------- CORN 22.04 .54 21.97 41.5% Bullish BLUE .128 .05 .178 --------------------------------------------------------------------------------------------- WEAT 7.39 .12 7.58 -114% Bullish BLUE .307 -.031 .276 --------------------------------------------------------------------------------------------- YINN 7.87 -.44 7.78 -109.6% Bullish RED .159 -.419 -.26 --------------------------------------------------------------------------------------------- RSX 26.59 -.24 26.39 28.2% Bearish RED -.159 -.217 -.376 |
    Count of Stocks in Key Directories
          20220104
-------------------------------
NEWHIGHS       270
NEWLOWS        105
MAXCP          41
MINCP          35
TTTNH          39
TTTNL          55
CPCROSSA       48
CPCROSSD       104
HIGHIP21       22
HIUPPCT        17
VHIP21         68
LOWACCUM       205
REDSELL        145
AUGSELS7       22
TRAPDOOR       22
|
 RANKING OF KEY DIRECTORIES BASED PCT.OF STOCKS ABOVE 65-DMA
              1/4/22
 Bullish = 34
 Bearish = 14
---------------------------------------------------------------------------------------
Directory     Current       day-1         day-2         day-3         day-4         day-5
----------------------------------------------------------------------------------------
COPPER         1             1             1             1             1             1
HOMEBLDG       .941          .941          .941          .941          1             .941
DJI-13         .923          .615          .692          .692          .769          .692
REGBANKS       .92           .8            .56           .48           .64           .68
BEVERAGE       .857          .785          .785          .714          .785          .714
BIGBANKS       .857          .571          0             0             0             .142
COMPUTER       .85           .85           .75           .8            .8            .8
COAL           .833          .666          .666          .833          .833          .833
DOWJONES       .833          .6            .633          .666          .666          .633
               ====
INFRA          .818          .666          .606          .545          .545          .575
INSURANC       .8            .64           .6            .6            .64           .64
SP-100         .8            .711          .6            .6            .611          .611
UTILITY        .794          .82           .846          .82           .82           .794
SP500          .785          .729          .673          .663          .681          .675
FIDSTKS        .763          .71           .603          .603          .639          .621
FINANCE        .761          .708          .601          .601          .636          .619
REIT           .753          .692          .638          .623          .653          .623
CHEM           .739          .586          .586          .586          .608          .586
TRANSP         .736          .631          .526          .526          .526          .526
INDMATER       .722          .611          .652          .652          .611          .638
MILITARY       .692          .5            .5            .5            .5            .5
INDEXES        .691          .637          .572          .605          .6            .627
HOSPITAL       .687          .625          .625          .625          .625          .625
OILGAS         .673          .528          .307          .278          .365          .355
NASD-100       .649          .701          .721          .721          .711          .711
JETS           .642          .357          .214          .214          .142          .142
SEMI           .631          .663          .61           .61           .61           .631
GUNS           .615          .461          .538          .538          .538          .461
AUTO           .603          .433          .415          .377          .415          .377
FOOD           .591          .469          .448          .551          .551          .53
NIFTY          .586          .652          .63           .63           .652          .652
HIGHPRIC       .585          .589          .636          .643          .636          .64
ELECTRON       .571          .616          .586          .586          .586          .586
COMODITY       .564          .435          .41           .512          .512          .512
===========================================================================================
EDU            .5            .666          .5            .5            .5            .5
===========================================================================================
RETAIL         .489          .489          .404          .425          .382          .361
GAMING         .473          .421          .421          .368          .315          .368
HACKERS        .473          .578          .578          .631          .578          .631
SOFTWARE       .464          .517          .5            .517          .517          .535
BONDFUND       .425          .528          .574          .528          .425          .471
GREEN          .421          .368          .368          .368          .368          .368
RUS-1000       .405          .377          .346          .336          .329          .326
GOLD           .391          .369          .478          .434          .369          .413
ETFS           .363          .363          .29           .254          .29           .309
MARIJUAN .25 .25 .5 .25 .5 .25 BIOTECH .22 .283 .242 .242 .247 .247 CHINA .16 .18 .18 .18 .12 .18 LOWPRICE .157 .132 .111 .094 .099 .104 SOLAR 0 0 0 0 0 0 |
----------------------------------------------------------------------------------------------------------------------------------------------
1/4/2022
5:30 AM DJI +153 NASDAQ +60 Data used is
through 1/3
The stock market is now a game of only a few musical chairs and a couch, TSLA.
It rose 143, while most of the other leaders like MSFT, HD, SOXL and
NVDA fell back as we start the key beginning of the new year. If TSLA loses
its charge, what's left for performance investors? Electrical Auto
Stocks?
Ford road to a new high today. Otherwise, a brief short-squeeze in
beaten-down low-priced stocks? Then what? The FED better get real busy.
| Typically the DJI advances 2% higher after a Sell S16. Since our
Peerless S16 this time around took place with the DJI at 36489, we could easily see the DJI reach 37218 before turning down to the lower band. But seasonality seriously reinforces the bearishness of our S16. The odds are 2:1 that theDJI will be lower in two months in this the start of the second year of the 4-year Presidential cycle and by 3.6% on average. Covid, the FED and Inflation could change this prediction. Today, at the close, the FED allowed interest rates to jump sharply back up. Will this start a new trend. We must wait and see. But for the time being, we must be cautiously bearish since most of the DJI-30's rally on Monday resulted from big gains in the five financials in the DJI early in the day when rates were lower. Financials in DJI-30 today GS +12.78 V + 4.72 AXP + 4.61 JPM + 4.35 -------------------- 26. 46 (About 170 points in the DJI's gain today. Breakouts from big index compentent's flat-topped trading ranges are the market's best hope along with lower interest rates. In particular, bulls would be happy to see flat topped breakouts by AAPL. BRKB, CVX, LRCX and SOXL. Another big jump by would be great, too. But triple-tops rather than flap-top breakouts look more likely in AMATT, MSFT, HD and VRSK. The potential head/shoulders patterns in NFLX and NVDA ware worrsime. And whereas a few days ago, bulls might hoped that HD might lead a recovery, it was down steeply today. I would place less billish hope on breakouts now than possible 10%-20% rallies from the the Bearish MINCPS of late when we see their Closing Power downtrends are broken. With the FED still a powerful force to be reckones with, I think the bears will be safer to see the key ETFs' CLosing Powers turn down again and for the NYSE A/D Line breaking its uptrend. |
||
|
Charts - 1/3/2021 2021 PEERLESS DJI, Signals, Indicators Daily DJI Volume 10-DayUp/Down Vol Stoch-20 Inverted Traders Index Graph of Pct of All Stocks above 65-dma Cum. Inverted Traders Index DJI-IPA DJI-OBV NASDAQ S&P OEX NYSE COMPQX DJI-15 DJI-20 DJI-30 DIA QQQ SPY IWM TNA Short-Term Rates DOLLAR-UUP ALLSTOCKs recent 2006 vers-Peerless signals http://tigersoftware.com/NEWPEER/UPD80103.BMP MDY - http://www.tigersoftware.com/CHARTZ/MDY.GIF USO-CrudeOil DBO FAS GLD HD IBB JETS JNUG KOL NUGT OIH PALL RSX RETL SDS AGQ SLV SOXL TAN TECL TLT TMF TNA UGA (gasoline) USO (oil) a nd China: YINN CHAU Commodities: CANE CORN DBC JJC, NIB CORN, CUT (paper) MOO, SOYB WEAT UUP (Dollar) LIT (Lithium) STOCKS: MRNA DIS GE PYPL GME ZOM XLE NRGU AAPL ADBE ALXN AMAT AMGN AMD AMZN AXP BA BABA BAC BIDU BLDP CAT CRM CVX CMG DE ENPH FB GILD GOOG GS HD IBM INTU JPM LRCX M MRK MSFT NEM NFLX NKE NKE NVDA PG PYPL REGN REV SO SQ QCOM QDEL TSLA TXN XOM V VRTX WFC WMT ZM Bullish MAXCPs http://tigersoftware.com/UPPER/1-3/BULLISH.htm Bearish MAXCPs http://tigersoftware.com/DOWNER/1-3/BEARISH.htm |
 |
 |
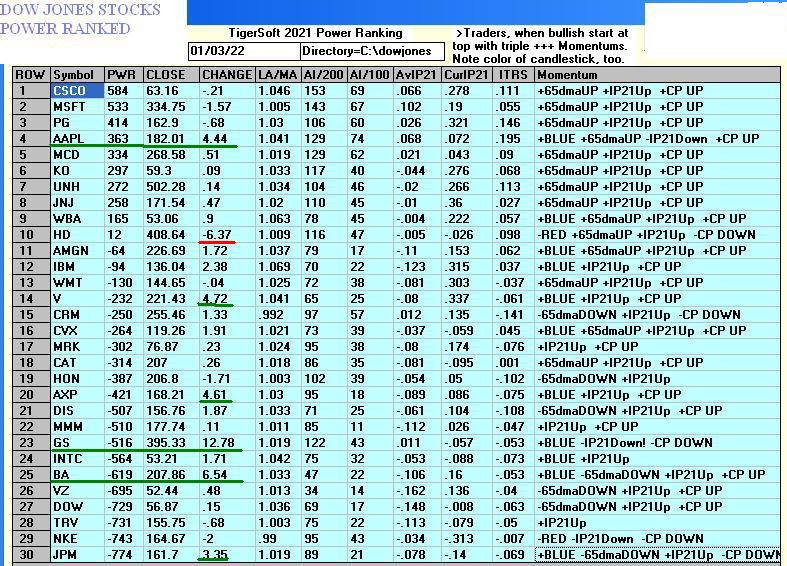 |
 |
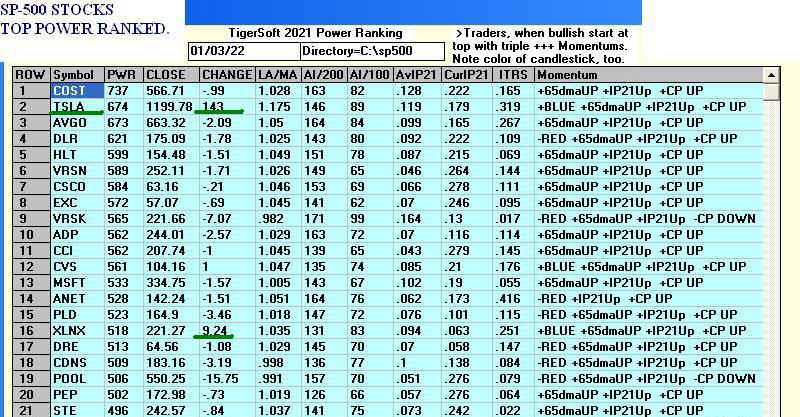 |
 |
 |
Top Pattern now? |
Table 1 QUICKSILVER on ETFS - 1/3//2022 Bullish = 2 - SOXL (+.6937), TECL (.466) Bearish = 2 - RSX , UUP (Dollar) ETF CLOSE CHANGE PIVOT-PT 5-dma AROC CL-PWR CANDLE IP21 ITRS POWER INDEX ================================================================================================== DIA 365.68 2.36 363.99 37.9% Bullish BLUE .216 --------------------------------------------------------------------------------------------- SPY 477.71 2.75 476.87 4.7% Bullish BLUE .184 .026 .21 --------------------------------------------------------------------------------------------- QQQ 401.68 3.83 401.61 -22.4% Bullish BLUE .184 .037 .221 --------------------------------------------------------------------------------------------- MDY 519.19 1.51 515.74 32.2% Bullish BLUE .093 -.007 .086 --------------------------------------------------------------------------------------------- IWM 225.32 2.87 222.75 26.9% Bullish BLUE .058 -.039 .019 --------------------------------------------------------------------------------------------- FAS 134.54 3.81 132.51 76.6% Bearish BLUE -.062 -.084 -.146 --------------------------------------------------------------------------------------------- RETL 37.88 1.45 35.21 299.3% ------- BLUE .01 -.149 -.139 --------------------------------------------------------------------------------------------- SOXL 72.1 4.09 70.52 -63.4% Bullish BLUE .143 .554 .697 --------------------------------------------------------------------------------------------- TECL 88.68 2.45 89.08 -102.8% Bullish BLUE .185 .281 .466 --------------------------------------------------------------------------------------------- IBB 152.37 -.25 152.2 -32.7% Bullish BLUE .203 -.068 .135 --------------------------------------------------------------------------------------------- GLD 168.33 -2.63 168.64 -30.7% ------- RED .211 -.018 .193 --------------------------------------------------------------------------------------------- OIH 197.29 12.45 188.68 205.8% Bullish BLUE .178 -.136 .042 --------------------------------------------------------------------------------------------- CPER 26.96 -.25 27.04 -57.3% Bullish BLUE .208 -.06 .148 --------------------------------------------------------------------------------------------- UUP 25.79 .16 25.77 9.7% ------- ---- -.302 -.003 -.305 --------------------------------------------------------------------------------------------- CORN 21.5 -.04 21.86 -176.3% Bullish RED .088 .037 .125 --------------------------------------------------------------------------------------------- WEAT 7.27 -.12 7.56 -304.7% Bullish RED .171 -.023 .148 --------------------------------------------------------------------------------------------- YINN 8.31 -.02 8.05 -24.3% ------- ---- .137 -.379 -.242 --------------------------------------------------------------------------------------------- RSX 26.83 .17 26.44 47.2% Bearish RED -.15 -.201 -.351 |
Table 2    Count of Stocks in Key Directories
          20220103
-------------------------------
NEWHIGHS       194
NEWLOWS        115
MAXCP          45
MINCP          10
TTTNH          29
TTTNL          2
CPCROSSA       48
CPCROSSD       70
ACCUMVER       2
HIGHIP21       18
HIUPPCT        10
VHIP21         65
LOWACCUM       109
REDSELL        152
AUGSELS7       14
TRAPDOOR       18
|
-------------------------------------------------------------------------------------------------------------------------------------------------
1/3/2022
6:15 AM DJI +160 NASDAQ +120
Data used is through 12/31
Will the January Bounce Turn into Another Leg Up?
It depends on what you look at and what Inflation Numbers
look like. Arguing with the FED is seldom a good idea.
| The Fed does not want a decline to start in here. It is
afraid that the bull market it has engineered will quickly unravel. It looks at its closest pal, JP Morgan's chart and sees great vulnerability, possibly like JPM showed in late 2007. It undertands" it must do something to help the hundreds of stocks making new lows. And it sees the beginning of the year and undertands that we are at a high inflextion point, where the market can go either way. And it notes the rise of Covid cases and it has a perfect excuse to lower short-term rates again and keep the key 10-year rates below 1.5%. All this makes lot of dividend stocks on the NYSE more attractive and sends a good number to new highs, especially those stocks that can collect higher rents and attract investors to the the broad housing boom. It remains to be seen if the NASDAQ high techs will have another very happy new year. But until, the basic uptrends of the NASDAQ, QQQ, SOXL and TECL are broken, we must assume the trends of the 65-day ma in many big techs will keep rising despite our Sell S16 in the DJI. Note how the FED's quick lowering of rates a week ago has turned all the main Peerless Indicators up. The Sell S16 averages a 2% paper loss. So, I see no reason, why the DJI will not move back to its highs in the next week. In that time, we will see if beaten-down stocks among Biotechs and Chinese stocks can get a good bounce/ recovery going. In the meantime, HD and housing stocks appear to do very well. Look at the MAXCPs'. There we see lots of property stocks and REITs running in all-time high territory.. They definitely are positioned well to enjoy the lower rates. Look for flat-top breakouts to show some of the best investments for the next month of two. Most important, there are very few MINCPs now for good reasons. First, the FED does not want a bear market and apparently has the means to prevent it and second, tax loss selling and window-dressing have come to an end. Where beaten-down stocks can break their price and CLosing Power downtrends, quick rallies of 20%, 30% and more may well be at hand. H A P P Y N E W Y E A R Charts and Tables will be posted in a few minutes. |
||
|
Charts - 12/30/2021 2021 PEERLESS DJI, Signals, Indicators Daily DJI Volume 10-DayUp/Down Vol Stoch-20 Inverted Traders Index Graph of Pct of All Stocks above 65-dma Cum. Inverted Traders Index DJI-IPA DJI-OBV NASDAQ S&P OEX NYSE COMPQX DJI-15 DJI-20 DJI-30 DIA QQQ SPY IWM TNA Short-Term Rates DOLLAR-UUP ALLSTOCKs recent 2006 vers-Peerless signals http://tigersoftware.com/NEWPEER/UPD71231.BMP MDY - http://www.tigersoftware.com/CHARTZ/MDY.GIF USO-CrudeOil DBO FAS GLD BBH IBB JETS JNUG KOL NUGT OIH PALL RSX RETL SDS AGQ SLV SOXL TAN TECL TLT TMF TNA UGA (gasoline) USO (oil) a nd China: YINN CHAU Commodities: CANE CORN DBC JJC, NIB CORN, CUT (paper) MOO, SOYB WEAT UUP (Dollar) LIT (Lithium) STOCKS: MRNA DIS GE PYPL GME ZOM XLE NRGU AAPL ADBE ALXN AMAT AMGN AMD AMZN AXP BA BABA BAC BIDU BLDP CAT CRM CVX CMG DE ENPH FB GILD GOOG GS HD IBM INTU JPM LRCX M MRK MSFT NEM NFLX NKE NKE NVDA PG PYPL REGN REV SO SQ QCOM QDEL TSLA TXN XOM V VRTX WFC WMT ZM Bullish MAXCPs http://tigersoftware.com/UPPER/12-31/BULLISH.htm Bearish MAXCPs http://tigersoftware.com/DOWNER/12-31/BEARISH.htm |
 |
 |
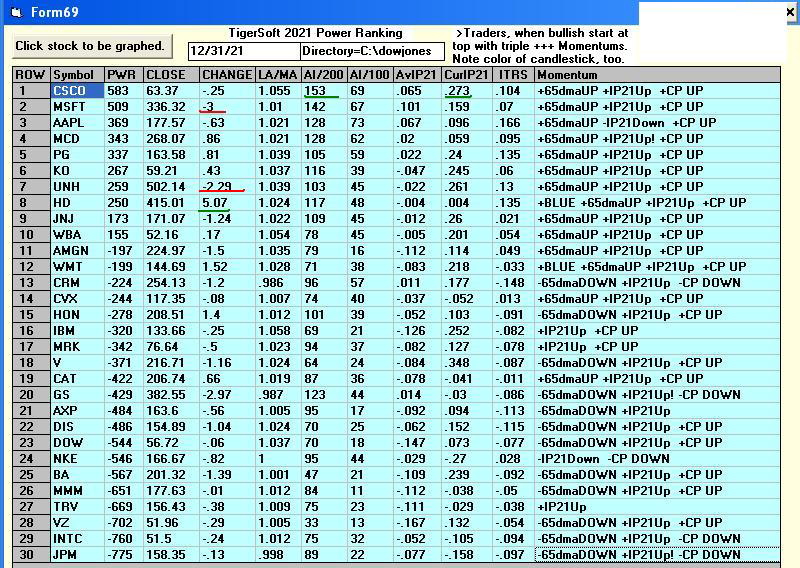 |
 |
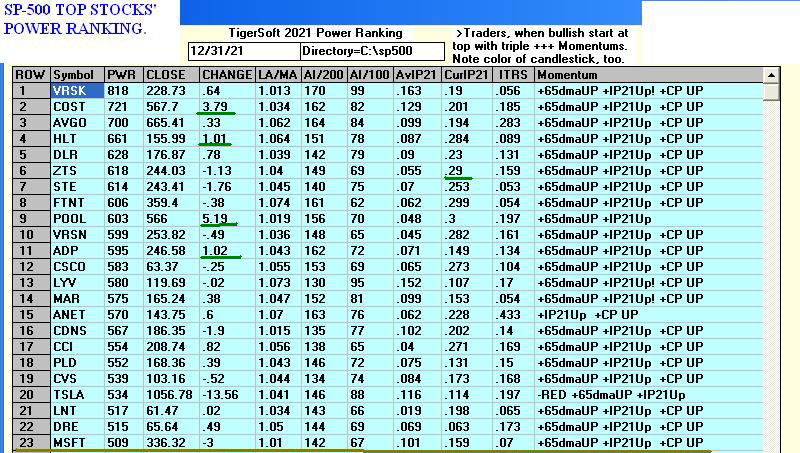 |
 |
 |
 |
 |
 |
 |
Table 1 QUICKSILVER on ETFS - 12/31/2021 Bullish = 2 - SOXL (+.637), TECL (.429) Bearish = 3 - RSX , YINN, UUP (Dollar) ETF CLOSE CHANGE PIVOT-PT 5-dma AROC CL-PWR CANDLE IP21 ITRS POWER INDEX ================================================================================================== DIA 363.32 -.75 362.92 54.5% Bullish RED .211 ---- ---- --------------------------------------------------------------------------------------------- SPY 474.96 -1.2 477.26 45.8% Bullish RED .187 .029 .216 --------------------------------------------------------------------------------------------- QQQ 397.85 -2.5 403.48 11.6% Bullish RED .184 .041 .225 --------------------------------------------------------------------------------------------- MDY 517.68 .59 515.86 84.1% Bullish BLUE .163 0 .163 --------------------------------------------------------------------------------------------- IWM 222.45 -.48 224.12 9.2% Bullish ---- .105 -.042 .063 --------------------------------------------------------------------------------------------- FAS 130.73 -.55 132.52 73.8% Bearish ---- -.001 -.106 -.107 --------------------------------------------------------------------------------------------- RETL 36.43 -.67 35.72 254.7% ------- RED .071 -.13 -.059 --------------------------------------------------------------------------------------------- SOXL 68.01 -.35 72.99 42.8% Bearish RED .119 .518 .637 --------------------------------------------------------------------------------------------- TECL 86.23 -1.32 90.5 66.8% Bullish RED .163 .266 .429 --------------------------------------------------------------------------------------------- IBB 152.62 -1.14 153.37 -67.5% Bullish RED .152 -.053 .099 --------------------------------------------------------------------------------------------- GLD 170.96 1.16 169.37 58.8% Bullish BLUE .228 .004 .232 --------------------------------------------------------------------------------------------- OIH 184.84 .39 189.61 -59.1% Bullish BLUE .186 -.208 -.022 --------------------------------------------------------------------------------------------- CPER 27.21 .47 27.27 70.4% Bullish BLUE .199 -.083 .116 --------------------------------------------------------------------------------------------- UUP 25.63 -.11 25.74 -19.4% ------- RED -.379 0 -.379 --------------------------------------------------------------------------------------------- CORN 21.54 -.03 22.27 -116.2% Bullish ---- -.013 .033 .02 --------------------------------------------------------------------------------------------- WEAT 7.39 -.09 7.73 -262.2% Bullish ---- .259 -.01 .249 --------------------------------------------------------------------------------------------- YINN 8.33 -.27 8.35 -36.4% Bullish RED .07 -.374 -.304 --------------------------------------------------------------------------------------------- RSX 26.66 .18 26.58 102.3% Bearish RED -.109 -.216 -.325 |
Table 2    Count of Stocks in Key Directories
           20211231
-------------------------------
NEWHIGHS       215   131 NYSE New highs
NEWLOWS        216   174 Nasdaq new lows
MAXCP          45
MINCP          10
TTTNH          29
TTTNL          2
CPCROSSA       48
CPCROSSD       70
ACCUMVER       2
HIGHIP21       18
HIUPPCT        10
VHIP21         65
LOWACCUM       109
REDSELL        152
AUGSELS7       14
TRAPDOOR       18
|
 Table 3       RANKING OF KEY DIRECTORIES BASED PCT.OF STOCKS ABOVE 65-DMA
               12/31/21
 Bullish = 29
 Bearish = 16
---------------------------------------------------------------------------------------
Directory     Current       day-1         day-2         day-3         day-4         day-5
----------------------------------------------------------------------------------------
COPPER         1             1             1             1             1             1
HOMEBLDG       .941          .941          1             .941          .941          .941
               ====
UTILITY        .846          .82           .82           .794          .769          .743
BEVERAGE       .785          .714          .785          .714          .714          .714
COMPUTER       .75           .8            .8            .8            .8            .8
NASD-100       .721          .721          .711          .711          .701          .69
DJI-13         .692          .692          .769          .692          .615          .615
SP500          .673          .663          .681          .677          .663          .599
COAL           .666          .833          .833          .833          .833          .833
INDMATER       .652          .652          .611          .625          .652          .5
HIGHPRIC       .636          .643          .636          .64           .636          .614
DOWJONES       .633          .666          .666          .633          .6            .6
                ---
NIFTY          .63           .63           .652          .652          .63           .652
REIT           .63           .623          .661          .623          .615          .546
HOSPITAL       .625          .625          .625          .625          .562          .562
SEMI           .61           .61           .61           .631          .663          .578
INFRA          .606          .545          .545          .575          .606          .515
FIDSTKS        .603          .603          .639          .621          .633          .591
FINANCE        .601          .601          .636          .619          .63           .589
INSURANC       .6            .6            .64           .64           .6            .44
SP-100         .6            .6            .611          .611          .611          .566
CHEM           .586          .586          .608          .586          .63           .5
ELECTRON       .586          .586          .586          .586          .631          .541
HACKERS        .578          .631          .578          .631          .631          .526
BONDFUND       .574          .528          .425          .459          .448          .517
INDEXES        .572          .605          .6            .627          .664          .578
REGBANKS       .56           .48           .64           .68           .64           .36
GUNS           .538          .538          .538          .461          .384          .307
TRANSP         .526          .526          .526          .526          .526          .526
----------------------------------------------------------------------------------------------
EDU            .5            .5            .5            .5            .5            .5
MARIJUAN       .5            .25           .5            .25           .25           .25
MILITARY       .5            .5            .5            .5            .5            .5
SOFTWARE       .5            .517          .517          .535          .517          .482
----------------------------------------------------------------------------------------------
GOLD           .478          .434          .369          .413          .434          .413
FOOD           .448          .551          .551          .53           .551          .469
GAMING         .421          .368          .315          .368          .368          .421
AUTO           .415          .377          .415          .377          .358          .339
COMODITY       .41           .512          .512          .512          .538          .435
RETAIL .404 .425 .382 .361 .361 .361 GREEN .368 .368 .368 .368 .368 .315 RUS-1000 .346 .336 .329 .329 .329 .288 OILGAS .307 .278 .365 .355 .355 .23 ETFS .29 .254 .29 .309 .309 .254 BIOTECH .242 .242 .247 .247 .269 .286 JETS .214 .214 .142 .142 .142 .142 CHINA .18 .18 .12 .18 .16 .16 LOWPRICE .111 .091 .099 .104 .119 .106 BIGBANKS 0 0 0 .142 .142 0 SOLAR 0 0 0 0 0 0 |
-------------------------------------------------------------------------------------------------------------------------------------------------------
12/31/2021
6:10 AM DJI -53 NASDAQ
+5 Data used is through 12/30.
| Yesterday's Sell S16 tells us to expect the DJI
to drop about 6% to 10% by February. It allows for a 2% additional gain before the final top is made. The Federal Reserve must be expected to do all it can to fight off a decline. Their historic connection to JP Morgan, in particular, is about as close as any government agency can be since its inception after the Crash of 1907. Given JPM's, the country's biggest bank's very weak internals now (consistently negative IP21- Accumulation Index and falling Closing Power), we should not be exactly surprised by how the FED just dropped short-term interest rates by 0.2% to 0.25%.. This will likely allow the DJI to recover a bit as the cross-currents of year-end are digested by traders. Home-builders, REITs and Utilities will do well because of the FED. The reaction of tech stocks is less certain because of the withdrawl in Janaury of the bullish forces of window-dressing that have recently lifted them back to the resistance of their highs. The Closing Powers for the big ETFs have broken their steep uptrends, but they are not yet in downtrends. Look for Chinese stocks, like BABA, to be big bouncers in the new year. Biotechs should do well, too. But small stocks are not yet ready to make a big recovery as they did last year. The number of bearish MINCPs is quite low, as professionals await a recovery in the beaten-down stocks now that year-end tax selling pressures on them are waning. H A P P Y N E W Y E A R |
||
|
Charts - 12/30/2021 2021 PEERLESS DJI, Signals, Indicators Daily DJI Volume 10-DayUp/Down Vol Stoch-20 Inverted Traders Index Graph of Pct of All Stocks above 65-dma Cum. Inverted Traders Index DJI-IPA DJI-OBV NASDAQ S&P OEX NYSE COMPQX DJI-15 DJI-20 DJI-30 DIA QQQ SPY IWM TNA Short-Term Rates DOLLAR-UUP ALLSTOCKs recent 2006 vers-Peerless signals http://tigersoftware.com/NEWPEER/UPD71230.BMP MDY - http://www.tigersoftware.com/CHARTZ/MDY.GIF USO-CrudeOil DBO FAS GLD BBH IBB JETS JNUG KOL NUGT OIH PALL RSX RETL SDS AGQ SLV SOXL TAN TECL TLT TMF TNA UGA (gasoline) USO (oil) a nd China: YINN CHAU Commodities: CANE CORN DBC JJC, NIB CORN, CUT (paper) MOO, SOYB WEAT UUP (Dollar) LIT (Lithium) STOCKS: MRNA DIS GE PYPL GME ZOM XLE NRGU AAPL ADBE ALXN AMAT AMGN AMD AMZN AXP BA BABA BAC BIDU BLDP CAT CRM CVX CMG DE ENPH FB GILD GOOG GS HD IBM INTU JPM LRCX M MRK MSFT NEM NFLX NKE NKE NVDA PG PYPL REGN REV SO SQ QCOM QDEL TSLA TXN XOM V VRTX WFC WMT ZM Bullish MAXCPs http://tigersoftware.com/UPPER/12-30/BULLISH.htm Bearish MAXCPs http://tigersoftware.com/DOWNER/12-30/BEARISH.htm |
 |
 |
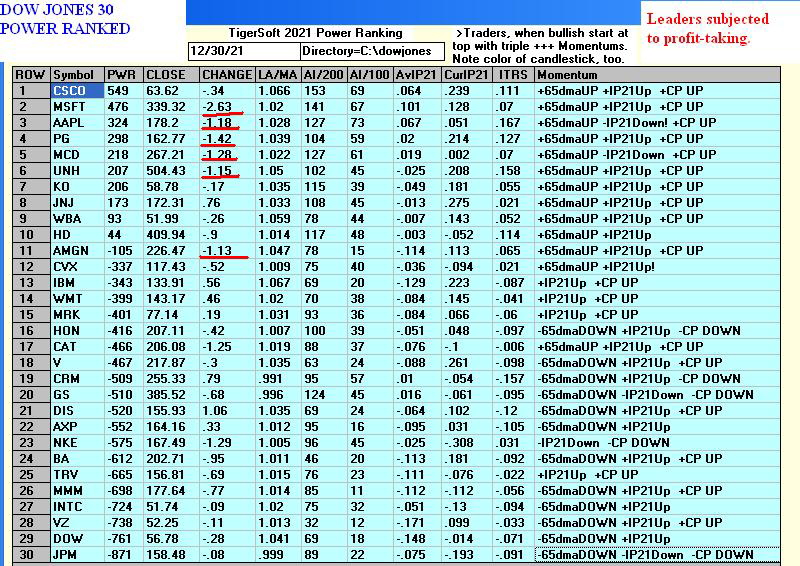 |
 |
 |
 |
 |
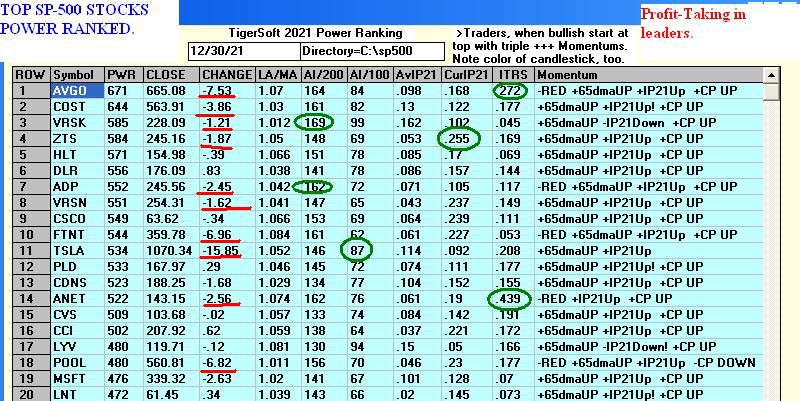 |
 |
 |
 |
 |
 |
 |
 |
Table 1 QUICKSILVER on ETFS - 12/30/2021 Bullish = 2 - SOXL (+.579), TECL (.424) Bearish = 1 - RSX , YINN ETF CLOSE CHANGE PIVOT-PT 5-dma AROC CL-PWR CANDLE IP21 ITRS POWER INDEX ================================================================================================== DIA 364.07 -.77 359.36 92.3% Bullish RED .147 0 .147 --------------------------------------------------------------------------------------------- SPY 476.16 -1.32 470.6 89.3% Bullish RED .137 .03 .167 --------------------------------------------------------------------------------------------- QQQ 400.35 -1.2 396.92 80.1% ------- RED .137 .039 .176 --------------------------------------------------------------------------------------------- MDY 517.09 -1.45 509.01 111.3% Bullish RED .097 0 .097 --------------------------------------------------------------------------------------------- IWM 222.93 -.06 222.04 59.6% ------- ---- .045 -.04 .005 --------------------------------------------------------------------------------------------- FAS 131.28 -1.01 128.79 187.4% Bearish RED -.069 -.085 -.154 --------------------------------------------------------------------------------------------- RETL 37.1 1.12 34.61 472% ------- BLUE .013 -.11 -.097 --------------------------------------------------------------------------------------------- SOXL 68.36 -2.64 67.41 214.5% Bearish RED .068 .511 .579 --------------------------------------------------------------------------------------------- TECL 87.55 -1.73 85.05 218.8% Bullish RED .155 .269 .424 --------------------------------------------------------------------------------------------- IBB 153.76 .93 154.69 0% Bullish BLUE .122 -.05 .072 --------------------------------------------------------------------------------------------- GLD 169.8 1.21 168.97 35.8% Bullish BLUE .139 -.001 .138 --------------------------------------------------------------------------------------------- OIL 13.73 -.01 13.26 226.5% Bullish RED .04 -.116 -.076 --------------------------------------------------------------------------------------------- OIH 184.45 -1 187.05 -67.2% Bullish RED .093 -.211 -.118 --------------------------------------------------------------------------------------------- CPER 26.74 -.23 26.83 -7.4% Bullish RED .052 -.093 -.041 --------------------------------------------------------------------------------------------- UUP 25.74 .04 25.73 -1.9% Bullish ---- -.263 -.004 -.267 --------------------------------------------------------------------------------------------- CORN 21.57 -.4 22.05 -75% Bullish RED -.015 .045 .03 --------------------------------------------------------------------------------------------- WEAT 7.48 -.1 7.79 -182.2% Bullish RED .211 .007 .218 --------------------------------------------------------------------------------------------- YINN 8.6 .82 8.39 152.7% Bullish BLUE .072 -.352 -.28 --------------------------------------------------------------------------------------------- RSX 26.48 .09 26.12 49.3% Bearish BLUE -.157 -.226 -.383 |
 Table 2    Count of Stocks in Key Directories
            20211230
-------------------------------
NEWHIGHS       264
NEWLOWS        343
MAXCP          25
MINCP          8
TTTNH          14
TTTNL          5
CPCROSSA       33
CPCROSSD       105
HIUPPCT        12
VHIP21         64
REDSELL        182
AUGSELS7       20
TRAPDOOR       3
|
 Table 3       RANKING OF KEY DIRECTORIES BASED PCT.OF STOCKS ABOVE 65-DMA
               12/30/21
   Bearish = 16
   Bullish = 31
---------------------------------------------------------------------------------------
Directory     Current       day-1         day-2         day-3         day-4         day-5
----------------------------------------------------------------------------------------
COPPER         1             1             1             1             1             .875
HOMEBLDG       .941          1             .941          .941          .941          .941
COAL           .833          .833          .833          .833          .833          .666
UTILITY        .82           .82           .794          .769          .743          .769
COMPUTER       .8            .8            .8            .8            .8            .7
NASD-100       .721          .711          .711          .701          .68           .628
BEVERAGE       .714          .785          .714          .714          .714          .714
DJI-13         .692          .769          .692          .615          .615          .615
DOWJONES       .666          .666          .633          .6            .566          .566
               -----
SP500          .663          .681          .677          .663          .601          .573
INDMATER       .652          .611          .625          .652          .541          .513
HACKERS        .647          .588          .647          .647          .529          .529
HIGHPRIC       .643          .636          .64           .636          .61           .563
NIFTY          .63           .652          .652          .63           .63           .565
HOSPITAL       .625          .625          .625          .562          .562          .562
REIT           .622          .653          .622          .614          .543          .543
SEMI           .617          .617          .638          .67           .574          .553
INDEXES        .608          .603          .63           .668          .581          .543
FIDSTKS        .601          .636          .619          .63           .589          .559
FINANCE        .601          .636          .619          .63           .589          .559
INSURANC       .6            .64           .64           .6            .44           .44
SP-100         .6            .611          .611          .611          .566          .533
ELECTRON       .596          .596          .596          .643          .542          .519
CHEM           .586          .608          .586          .63           .521          .5
FOOD           .551          .551          .53           .551          .469          .408
INFRA          .545          .545          .575          .606          .515          .484
GUNS           .538          .538          .461          .384          .307          .23
BONDFUND       .528          .425          .459          .448          .505          .505
TRANSP         .526          .526          .526          .526          .526          .473
SOFTWARE       .518          .518          .537          .518          .481          .462
COMODITY       .512          .512          .512          .538          .435          .384
-----------------------------------------------------------------------------------------------
EDU            .5            .5            .5            .5            .5            .5
MILITARY       .5            .5            .5            .5            .5            .423
-----------------------------------------------------------------------------------------------
REGBANKS       .48           .64           .68           .64           .36           .32
GOLD           .434          .369          .413          .434          .434          .391
RETAIL         .425          .382          .361          .361          .361          .361
GREEN          .388          .388          .388          .388          .333          .388
AUTO           .377          .415          .377          .358          .32           .283
GAMING         .368          .315          .368          .368          .421          .315
RUS-1000       .336          .329          .329          .329          .288          .286
OILGAS         .278          .365          .355          .355          .25           .221
ETFS           .254          .29           .309          .309          .254          .163
MARIJUAN       .25           .5            .25           .25           .25           .25
BIOTECH .242 .247 .247 .27 .284 .259 JETS .214 .142 .142 .142 .142 .142 CHINA .18 .12 .18 .16 .16 .14 LOWPRICE .09 .095 .1 .116 .105 .1 BIGBANKS 0 0 .142 .142 0 0 SOLAR 0 0 0 0 0 0 |
----------------------------------------------------------------------------------------------------------------------------------------------------
12/30/2021
6:00 AM DJI +45 NASDAQ +16 Edited 6:30 AM
| Peerless prodiced a new
Sell S16 today. The DJI has slowed down since reaching its 2.7 band. There have been six S16s since 1970. They are based on multiple negatve divergences for DJI's advance towards the 3% upper band in late December and early January. These Peerless Sells would have all been profitable if the DJI was shorted on the S16s. The average gain was +7.5%. The average paper loss was 2.0%. The biggest paper loss was 3.3%; so all shorts on the S16 would have been profitable without extending too much risk. But the declines are usually not big. Also, note that a small rally for a few more days in deference to window-dressing and tax selling is exactly what our general seasonality program predicts using the DJI's data at the end of the first year after a Presidential Election. The top is most likely to come after 5 more trading days but before ten more trading days have passed. The Sell S16 detects that to much money is going into too few advancing stocks and too much money is coming out of falling stocks in the normally very bullish second half of December. We should not, if the market was healthy, see negative V-I readings, a neutral 0 in the Accumulation Index and a negative OBVPct. See the cases of S16s and their old charts here: http://www.tigersoftware.com/Sell-S16/S16.htm |
||
|
Charts - 12/29/2021 2021 PEERLESS DJI, Signals, Indicators Daily DJI Volume 10-DayUp/Down Vol Stoch-20 Inverted Traders Index Graph of Pct of All Stocks above 65-dma Cum. Inverted Traders Index DJI-IPA DJI-OBV NASDAQ S&P OEX NYSE COMPQX DJI-15 DJI-20 DJI-30 DIA QQQ SPY IWM TNA Short-Term Rates DOLLAR-UUP ALLSTOCKs recent 2006 vers-Peerless signals http://tigersoftware.com/NEWPEER/UPD71229.BMP MDY - http://www.tigersoftware.com/CHARTZ/MDY.GIF USO-CrudeOil DBO FAS GLD BBH IBB JETS JNUG KOL NUGT OIH PALL RSX RETL SDS AGQ SLV SOXL TAN TECL TLT TMF TNA UGA (gasoline) USO (oil) a nd China: YINN CHAU Commodities: CANE CORN DBC JJC, NIB CORN, CUT (paper) MOO, SOYB WEAT UUP (Dollar) LIT (Lithium) STOCKS: MRNA DIS GE PYPL GME ZOM XLE NRGU AAPL ADBE ALXN AMAT AMGN AMD AMZN AXP BA BABA BAC BIDU BLDP CAT CRM CVX CMG DE ENPH FB GILD GOOG GS HD IBM INTU JPM LRCX M MRK MSFT NEM NFLX NKE NKE NVDA PG PYPL REGN REV SO SQ QCOM QDEL TSLA TXN XOM V VRTX WFC WMT ZM Bullish MAXCPs http://tigersoftware.com/UPPER/12-29/BULLISH.htm Bearish MAXCPs http://tigersoftware.com/DOWNER/12-29/BEARISH.htm |
 |
 |
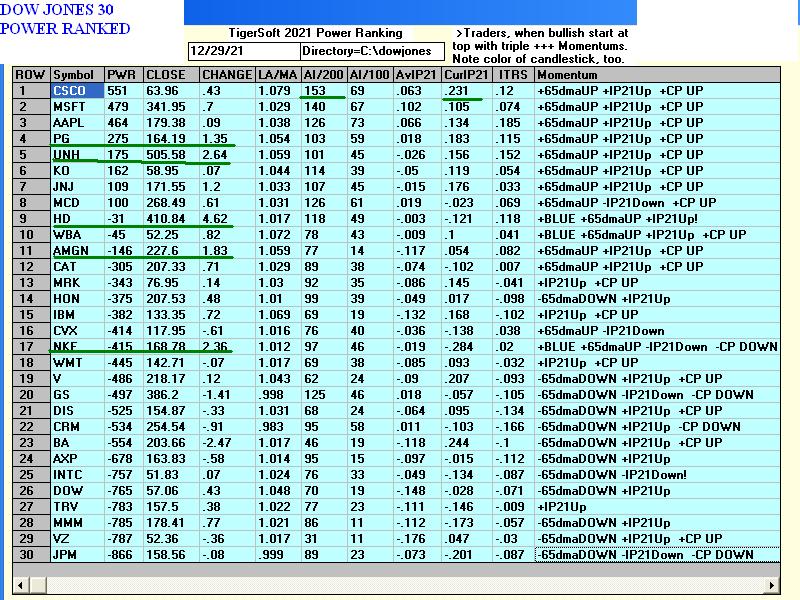 |
 |
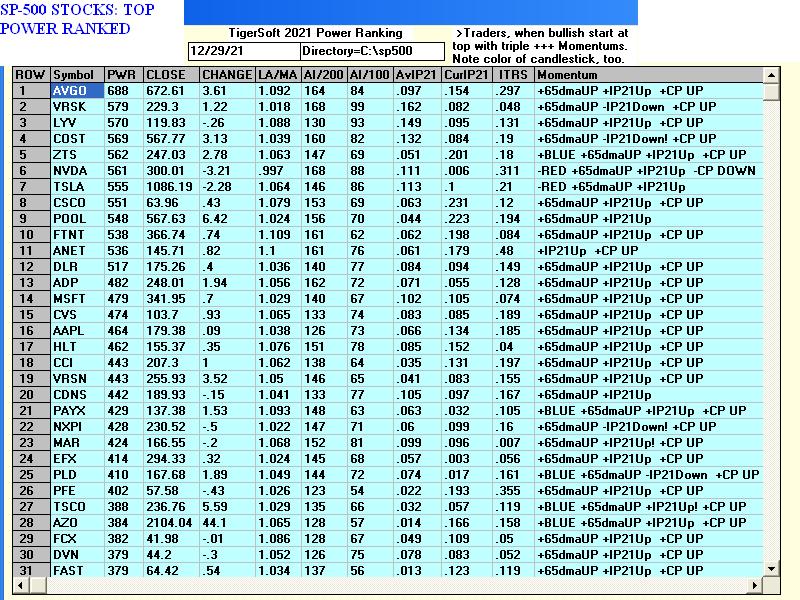 |
 |
|
Semi-conductors have formed a bullish box pattern given their strong upwards momentu. A new high would set up a minimum upside target of 85-87, but the non-confirmation by CLosing Power and the Accum. Index makes such a breakout seem unlikely, except in the current game of "musical chairs" these will probably be the last favorite group for performance players to take advantage of.
|
|
Might beaten-down biotech lead a new year rally? To do that they will need to break the red price downtrend shown in the chart just below.  |
|
Stick with the leaders among the biggest capitalization
stocks. Interest is the smaller Russell 2000 stocks remains limited. The Black Relative Strength Line at the bottom of the IWM chart is still in a downtrend since its speculative peak in March 2021. A new Red Sell is flashing.  |
|
The muted rally and new RED Sell wans that this is far from being a speculative rally involving the "little guy". It arises from trust that the FED will keep rates low and not let SPY and DIA fall below their recent lows.  |
Crude Oil's advance has reached resistance. |
Table 1 QUICKSILVER on ETFS - 12/29/2021 Bullish = 2 - SOXL (+.683), TECL (.490) Bearish = 2 - RSX , YINN ETF CLOSE CHANGE PIVOT-PT 5-dma AROC CL-PWR CANDLE IP21 ITRS POWER INDEX --------------------------------------------------------------------------------------------- DIA 364.84 .85 357.39 138% Bullish BLUE .093 --- ---- --------------------------------------------------------------------------------------------- SPY 477.48 .61 467.69 153% Bullish BLUE .08 .033 .113 --------------------------------------------------------------------------------------------- QQQ 401.55 -.06 393.95 155.4% ------- RED .106 .043 .149 --------------------------------------------------------------------------------------------- MDY 518.54 2.8 505.67 173.8% ------- BLUE .075 -.002 .073 --------------------------------------------------------------------------------------------- IWM 222.99 .24 220.28 108.6% ------- BLUE .047 -.044 .003 --------------------------------------------------------------------------------------------- FAS 132.29 -.22 126.39 324.5% ------- RED -.115 -.058 -.173 --------------------------------------------------------------------------------------------- RETL 35.98 .77 33.79 339.7% Bearish BLUE -.016 -.159 -.175 --------------------------------------------------------------------------------------------- SOXL 71 .48 65.38 551.8% ------- BLUE .061 .622 .683 --------------------------------------------------------------------------------------------- TECL 89.28 .2 83.72 514.2% Bullish BLUE .166 .324 .49 --------------------------------------------------------------------------------------------- IBB 152.83 .63 153.76 -36.5% Bullish BLUE .114 -.054 .06 --------------------------------------------------------------------------------------------- GLD 168.59 -.05 168.59 46.6% ------- BLUE .016 -.013 .003 --------------------------------------------------------------------------------------------- OIL 13.74 .11 13.12 274% Bullish BLUE .078 -.115 -.037 --------------------------------------------------------------------------------------------- OIH 185.45 -3.23 186.97 -18.1% Bullish RED .108 -.212 -.104 --------------------------------------------------------------------------------------------- CPER 26.97 -.07 26.78 76.2% Bullish BLUE .062 -.098 -.036 --------------------------------------------------------------------------------------------- UUP 25.7 -.07 25.75 -29.1% Bullish ---- -.286 -.016 -.302 --------------------------------------------------------------------------------------------- CORN 21.97 .11 21.9 61.5% Bullish BLUE -.004 .055 .051 --------------------------------------------------------------------------------------------- WEAT 7.58 .02 7.76 -13% Bullish BLUE .126 .015 .141 --------------------------------------------------------------------------------------------- YINN 7.78 -.27 8.35 -373.1% Bearish RED .03 -.374 -.344 --------------------------------------------------------------------------------------------- RSX 26.39 -.05 26.22 64.7% Bearish ---- -.176 -.225 -.401 |
 Table 2   Count of Stocks in Key Directories
          20211229
-------------------------------
NEWHIGHS       283
NEWLOWS        537  including 448 new lows on NASDAQ
MAXCP          68
MINCP          30
TTTNH          34
TTTNL          14
CPCROSSA       5
CPCROSSD       90
HIGHIP21       12
HIUPPCT        11
VHIP21         57
LOWACCUM       174
REDSELL        188
AUGSELS7       17
TRAPDOOR       5
|
   Table 3
   RANKING OF KEY DIRECTORIES BASED PCT.OF STOCKS ABOVE 65-DMA
Bullish = 31 Bearish = 15 12/29/21 --------------------------------------------------------------------------------------- Directory Current day-1 day-2 day-3 day-4 day-5 ---------------------------------------------------------------------------------------- COPPER 1 1 1 1 .875 .625 HOMEBLDG 1 .941 .941 .941 .941 .882 COAL .833 .833 .833 .833 .666 .666 UTILITY .82 .794 .769 .743 .769 .769 COMPUTER .8 .8 .8 .8 .75 .7 BEVERAGE .785 .714 .714 .714 .714 .714 DJI-13 .769 .692 .615 .615 .615 .538 NASD-100 .711 .711 .701 .68 .628 .577 SP500 .681 .677 .663 .601 .577 .531 DOWJONES .666 .633 .6 .566 .566 .5 REIT .653 .622 .614 .543 .543 .511 NIFTY .652 .652 .63 .63 .565 .543 INSURANC .64 .64 .6 .44 .44 .4 REGBANKS .64 .68 .64 .36 .36 .4 FIDSTKS .636 .619 .63 .589 .559 .523 FINANCE .636 .619 .63 .589 .559 .523 HIGHPRIC .636 .64 .636 .61 .57 .505 HOSPITAL .625 .625 .562 .562 .562 .375 SEMI .617 .638 .67 .574 .553 .542 INDMATER .611 .625 .652 .541 .527 .375 SP-100 .611 .611 .611 .566 .533 .511 CHEM .608 .586 .63 .521 .5 .391 INDEXES .603 .63 .668 .581 .548 .478 ELECTRON .596 .596 .643 .542 .519 .496 HACKERS .588 .647 .647 .529 .529 .529 FOOD .551 .53 .551 .469 .408 .306 INFRA .545 .575 .606 .515 .484 .484 GUNS .538 .461 .384 .307 .23 .153 TRANSP .526 .526 .526 .526 .473 .526 SOFTWARE .518 .537 .518 .481 .462 .462 COMODITY .512 .512 .538 .435 .384 .256 ============================================================================================== EDU .5 .5 .5 .5 .5 .5 MARIJUAN .5 .25 .25 .25 .25 .25 MILITARY .5 .5 .5 .5 .423 .346 ============================================================================================== BONDFUND .425 .459 .448 .505 .494 .402 AUTO .415 .377 .358 .32 .283 .188 GREEN .388 .388 .388 .333 .388 .277 RETAIL .382 .361 .361 .361 .361 .319 GOLD .369 .413 .434 .434 .391 .217 OILGAS .365 .355 .355 .25 .23 .23 RUS-1000 .329 .329 .329 .288 .283 .258 GAMING .315 .368 .368 .421 .315 .21 ETFS .29 .309 .309 .254 .163 .127 BIOTECH .247 .247 .27 .284 .256 .239 JETS .142 .142 .142 .142 .142 .142 CHINA .12 .18 .16 .16 .14 .14 LOWPRICE .095 .1 .116 .105 .098 .087 BIGBANKS 0 .142 .142 0 0 0 SOLAR 0 0 0 0 0 0 |
------------------------------------------------------------------------------------------------------------------------------------------------------
12/29/2021
5:40 AM - DJI -7 NASDAQ -11- Churning must be expected based on
Internal Weaknesses with DJI at its 2.7% Upper Band.
Edited at 6:50 AM
| The unusually large intra-day drop in short-term
rates, (-.20%), was reversed today. That and the negative IP21 and glaringly big breadth and negative volume divergences from the DJI's seasonal strength warn of a reversal in early January. True, the FED will not allow a big decline, but a drop of 8% would not come as a surprise. The funds' window-dressing buying in the leading DJI stocks and the window-dressing and tax-loss selling in beaten down stocks like Boeing and Visa will likely change their short-term directions. New industries like all-electric autos other than Tesla could become the new year's leaders. See the chart of Autos less Tesla below. It looks attractive. With Santa Claus leaving, changes in investment concentrations other than a fervent devotion to semi-conductors seems mst likely. Let's wait for a small retreat in Semi-conductors to buy them again and see what the next few trading days bring. As for the market as a whole, watch what Professionals in DIA, SPY and QQQ. Today, they took profits in the leaders. I would expect more of that. With short-sales, watch for trend-breaks in the Closing Powers to close out positions. Look for more reversal days, where early strength fives way to selling. One exception: CSCO is the highest AI/200 stock in the DJI-30. It should hold up well. |
|
Charts - 12/28/2021 2021 PEERLESS DJI, Signals, Indicators Daily DJI Volume 10-DayUp/Down Vol Stoch-20 Inverted Traders Index Graph of Pct of All Stocks above 65-dma Cum. Inverted Traders Index DJI-IPA DJI-OBV NASDAQ S&P OEX NYSE COMPQX DJI-15 DJI-20 DJI-30 DIA QQQ SPY IWM TNA Short-Term Rates DOLLAR-UUP ALLSTOCKs recent 2006 vers-Peerless signals http://tigersoftware.com/NEWPEER/UPD71228.BMP MDY - http://www.tigersoftware.com/CHARTZ/MDY.GIF USO-CrudeOil DBO FAS GLD BBH IBB JETS JNUG KOL NUGT OIH PALL RSX RETL SDS AGQ SLV SOXL TAN TECL TLT TMF TNA UGA (gasoline) USO (oil) a nd China: YINN CHAU Commodities: CANE CORN DBC JJC, NIB CORN, CUT (paper) MOO, SOYB WEAT UUP (Dollar) LIT (Lithium) STOCKS: MRNA DIS GE PYPL GME ZOM XLE NRGU AAPL ADBE ALXN AMAT AMGN AMD AMZN AXP BA BABA BAC BIDU BLDP CAT CRM CVX CMG DE ENPH FB GILD GOOG GS HD IBM INTU JPM LRCX M MRK MSFT NEM NFLX NKE NKE NVDA PG PYPL REGN REV SO SQ QCOM QDEL TSLA TXN XOM V VRTX WFC WMT ZM Bullish MAXCPs http://tigersoftware.com/UPPER/12-28/BULLISH.htm Bearish MAXCPs http://tigersoftware.com/DOWNER/12-28/BEARISH.htm
|
----------------------------------------------------------------------------------------------------------------------------------------------------
12/28/2021
5:00 AM - DJI +91 NASDAQ +89- Santa Claus Rally is expected to continue.
|
The "Santa Claus" rally has a special hero, Fed Chairman Powell. Today we saw why JP Morgan's Jamie Dimon could so confidently predict that there will be no 20% decline in the first Quarter of 2022. No doubt, he got the word that the FED would sharply drop rates later today. Sure enough, the FED dropped short-term interest rates from 0.63% in the morning to 0.43% at the close. Once again, the FED is practically giving the special green paper away to the big banks. So, with no real risk in the market, traders piled into the volatile tech leaders, especially semi-conductors. Will our favorites in the techs get significantly past the resistance of their previous highs? To continue our football metaphor from Sunday night, will SOXL, TECL and MSFT make a "first down". It looks so, now, but their IP21-Accumulation Index values are mostly well below a current +.23 value. IP21 levels below this level tend to suggest that an additional rally will be more limited. As bulls, we prefer to see bulges of Accumulation well above +.35 on price breakouts. These powerfully augment a new take-off in prices. Peerless Signals Ahead It will be hard to get a Peerless Sell this year the way the DJI is advancing. Most likely we will get a Sell at the full 3.5% upper band in January. A trip to the lower band could then follow. Right now, the DJI has reached the 2.7% upper band with the A/D Line, OBV-Line, P-indicator, OBV-Pct and V-I seriously lagging. However, note that the IP21 has improved markedly and is now positive, thus averting a Sell S12 for the time being. The dropping of interest rates is likely to boost dividend stocks and be a lift to the P-Indicator and A/D line. A Sell S9 at the 3.5% upper band early in January seems the most likely scenario. But who knows how low the FED may drop rates, now that the Biden Public Works' stimulus plan is dead?. And with a special surtax on those making billions from Wall Street no longer threatening, we could see the IP21 shoot-up much higher. Remember the lesson of 1927-1929, how the FED courted and then lost control of the market to runaway speculation. Big positive bulges from our Accumulation Index and our P-Indicator would be very bullish. They would really drive the bears crazy. .So, watch the daily breadth. More days with 2200+ advancers would be bullish. A Big Jump in New Highs and Breakouts Would Be a Sign of Runaway Speculation. If you are interested in short-term Tiger B5 breakouts, study the comments I have added to B5s in the charts below. The signal here has been tightened to only occur when the IP21 and ITRS values meet tighter standards. They also must be 21 trading days apart. Even measured this way, they seem of limited value unless we also draw in a visible, well-tested flat resistance-line. And even then, too often, the B5 breakout does not overcome all the overhead resistance or must still cope with a general lack of volatility which denies the stock the ability to make a serious run. So, two suggestions now. Use the Buy B5 mainly now when they also produce all-time highs and when the stock has already risen 50% in the past year. Volatility is our ally, as long as you also use our tools to spot a reversal. I may try to add a special notation on all the Tiger stocks nearing all-time highs. I could put a special symbol on the chart where the all-time high in the past was. |
||
|
Charts - 12/27/2021 2021 PEERLESS DJI, Signals, Indicators Daily DJI Volume 10-DayUp/Down Vol Stoch-20 Inverted Traders Index Graph of Pct of All Stocks above 65-dma Cum. Inverted Traders Index DJI-IPA DJI-OBV NASDAQ S&P OEX NYSE COMPQX DJI-15 DJI-20 DJI-30 DIA QQQ SPY IWM TNA Short-Term Rates DOLLAR-UUP ALLSTOCKs recent 2006 vers-Peerless signals http://tigersoftware.com/NEWPEER/UPD71227.BMP MDY - http://www.tigersoftware.com/CHARTZ/MDY.GIF USO-CrudeOil DBO FAS GLD BBH IBB JETS JNUG KOL NUGT OIH PALL RSX RETL SDS AGQ SLV SOXL TAN TECL TLT TMF TNA UGA (gasoline) USO (oil) a nd China: YINN CHAU Commodities: CANE CORN DBC JJC, NIB CORN, CUT (paper) MOO, SOYB WEAT UUP (Dollar) LIT (Lithium) STOCKS: MRNA DIS GE PYPL GME ZOM XLE NRGU AAPL ADBE ALXN AMAT AMGN AMD AMZN AXP BA BABA BAC BIDU BLDP CAT CRM CVX CMG DE ENPH FB GILD GOOG GS HD IBM INTU JPM LRCX M MRK MSFT NEM NFLX NKE NKE NVDA PG PYPL REGN REV SO SQ QCOM QDEL TSLA TXN XOM V VRTX WFC WMT ZM Bullish MAXCPs http://tigersoftware.com/UPPER/12-27/BULLISH.htm Bearish MAXCPs http://tigersoftware.com/DOWNER/12-27/BEARISH.htm |
 |
|
 |
|
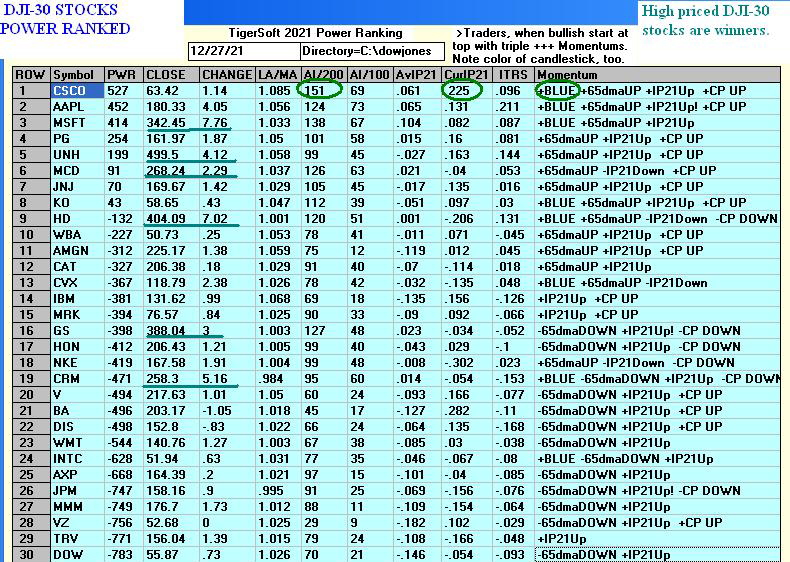 |
|
 |
|
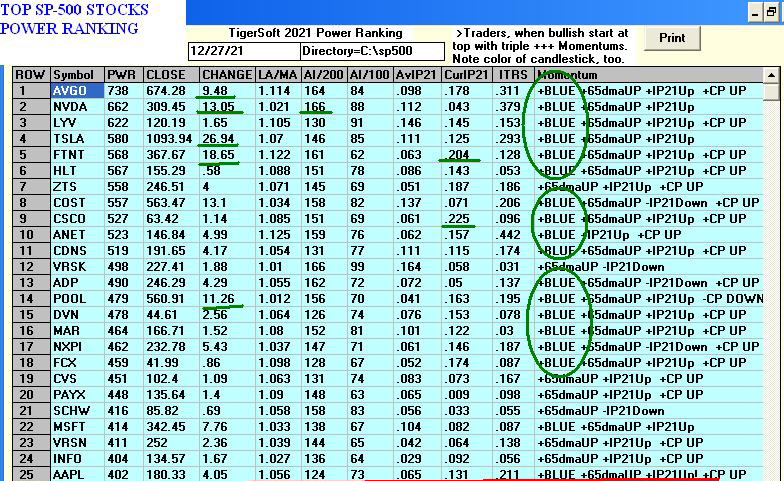 |
|
 |
|
 |
|
 |
|
 |
|
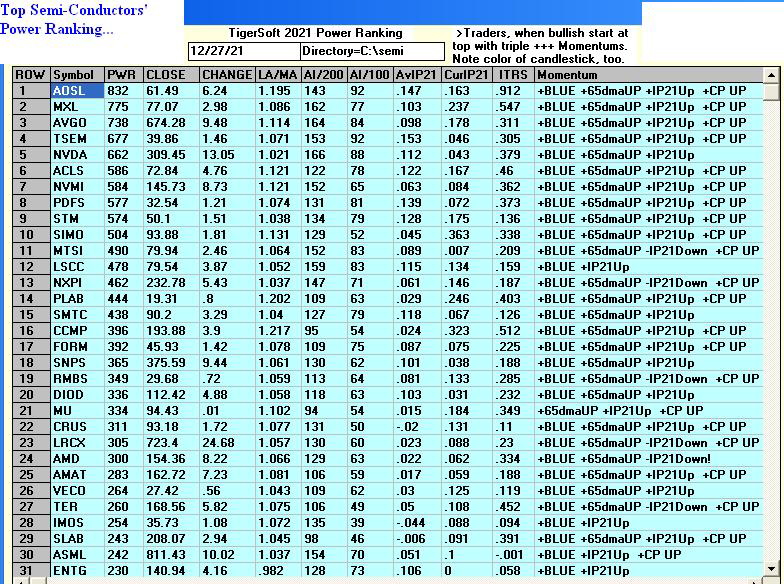 |
|
 |
|
 |
|
Table 1 QUICKSILVER on ETFS - 12/27/2021 Bullish = 2 - SOXL (+.848), TECL (.596) Bearish = 1 - RSX ETF CLOSE CHANGE PIVOT-PT 5-dma AROC CL-PWR CANDLE IP21 ITRS POWER INDEX ------------------------------------------------------------------------------------------------ DIA 362.92 3.56 349.27 130.9% Bullish BLUE .079 --- ---- --------------------------------------------------------------------------------------------- SPY 477.26 6.66 454.98 187.7% Bullish BLUE .053 .039 .092 --------------------------------------------------------------------------------------------- QQQ 403.48 6.56 380.69 238.6% ------- BLUE .11 .061 .171 --------------------------------------------------------------------------------------------- MDY 515.86 6.85 487.8 197.3% ------- BLUE .044 -.009 .035 --------------------------------------------------------------------------------------------- IWM 224.12 2.08 212.12 206.4% ------- BLUE .028 -.047 -.019 --------------------------------------------------------------------------------------------- FAS 132.52 3.73 117.01 330.8% ------- BLUE -.037 -.02 -.057 --------------------------------------------------------------------------------------------- RETL 35.72 1.11 30.74 405.6% Bearish BLUE .006 -.121 -.115 --------------------------------------------------------------------------------------------- SOXL 72.99 5.58 57.55 1121.3% Bullish BLUE .109 .739 .848 --------------------------------------------------------------------------------------------- TECL 90.5 5.45 74.87 804.1% Bullish BLUE .188 .408 .596 --------------------------------------------------------------------------------------------- IBB 153.37 -1.32 153.01 -35.4% ------- RED .015 -.068 -.053 --------------------------------------------------------------------------------------------- GLD 169.37 .4 167.09 46.8% ------- BLUE -.047 -.031 -.078 --------------------------------------------------------------------------------------------- OIH 189.61 2.56 176.85 184.8% Bullish BLUE .165 -.178 -.013 --------------------------------------------------------------------------------------------- CPER 27.27 .44 26.25 209.3% Bullish BLUE .093 -.073 .02 --------------------------------------------------------------------------------------------- UUP 25.74 .01 25.88 -32.9% Bullish ---- -.309 -.019 -.328 --------------------------------------------------------------------------------------------- CORN 22.27 .22 21.5 174.9% Bullish BLUE .043 .093 .136 --------------------------------------------------------------------------------------------- WEAT 7.73 -.06 7.45 197.2% ------- RED .136 .052 .188 --------------------------------------------------------------------------------------------- YINN 8.35 -.04 7.7 54.7% ------- ---- .028 -.296 -.268 --------------------------------------------------------------------------------------------- RSX 26.58 .46 25.91 -165.1% ------- BLUE -.199 -.22 -.419 |
Table 2    Count of Stocks in Key Directories
           20211227
-------------------------------
NEWHIGHS       264
NEWLOWS        241
MAXCP          67
MINCP          17
TTTNH          23
TTTNL          11
CPCROSSA       24
CPCROSSD       60
ACCUMVER       1
HIGHIP21       4
HIUPPCT        11
VHIP21         65
REDSELL        187
AUGSELS7       26
TRAPDOOR       8
|
|
 RANKING OF KEY DIRECTORIES BASED PCT.OF STOCKS ABOVE 65-DMA
             12/27/21
 Bullish = 30
 Bearish = 19
---------------------------------------------------------------------------------------
Directory     Current       day-1         day-2         day-3         day-4         day-5
----------------------------------------------------------------------------------------
COPPER         1             1             .875          .625          .5            .625
HOMEBLDG       .941          .941          .941          .882          .764          .823
COAL           .833          .833          .666          .833          .5            .666
COMPUTER       .8            .8            .75           .7            .45           .5
UTILITY        .769          .743          .769          .769          .717          .743
BEVERAGE       .714          .714          .714          .714          .642          .642
NASD-100       .701          .68           .628          .577          .463          .505
SEMI           .67           .574          .553          .542          .446          .489
INDEXES        .668          .581          .548          .478          .385          .445
SP500          .663          .601          .577          .535          .44           .519
INDMATER .652 .541 .527 .402 .319 .486 HACKERS .647 .529 .529 .529 .529 .529 ELECTRON .643 .542 .519 .496 .364 .418 REGBANKS .64 .36 .36 .4 .08 .28 HIGHPRIC .636 .61 .57 .505 .349 .458 CHEM .63 .521 .5 .413 .326 .456 FIDSTKS .63 .589 .559 .535 .416 .488 FINANCE .63 .589 .559 .535 .416 .488 NIFTY .63 .63 .565 .543 .413 .521 REIT .617 .546 .546 .523 .375 .445 DJI-13 .615 .615 .615 .538 .461 .615 SP-100 .611 .566 .533 .511 .411 .488 INFRA .606 .515 .484 .484 .303 .484 DOWJONES .6 .566 .566 .5 .433 .5 INSURANC .6 .44 .44 .4 .36 .48 HOSPITAL .562 .562 .562 .375 .312 .312 FOOD .551 .469 .408 .326 .224 .387 COMODITY .538 .435 .384 .256 .205 .307 SOFTWARE .527 .49 .472 .472 .381 .418 TRANSP .526 .526 .473 .526 .473 .526 ============================================================================================== EDU .5 .5 .5 .5 .5 .5 MILITARY .5 .5 .423 .346 .153 .269 BONDFUND .448 .505 .494 .402 .448 .517 GOLD .434 .434 .391 .217 .217 .282 GREEN .388 .333 .388 .277 .166 .277 GUNS .384 .307 .23 .153 .153 .23 GAMING .368 .421 .315 .315 .157 .157 RETAIL .361 .361 .361 .319 .276 .276 AUTO .358 .32 .283 .207 .132 .226 OILGAS .355 .25 .23 .221 .125 .153 RUS-1000 .329 .288 .283 .26 .197 .237 ETFS .309 .254 .163 .127 .127 .127 BIOTECH .272 .286 .258 .241 .222 .211 MARIJUAN .25 .25 .25 .25 0 .25 CHINA .16 .16 .14 .14 .08 .16 BIGBANKS .142 0 0 0 0 0 JETS .142 .142 .142 .142 0 0 LOWPRICE .116 .105 .098 .087 .082 .082 SOLAR 0 0 0 0 0 0 |
----------------------------------------------------------------------------------------------------------------------------------------------------
12/26/2021
10:00 PM - DJI +1 NASDAQ +20 - Santa Claus Rally is expected to continue.
| Note
that our Hotline only shows the regularly posted TigerSoft charts through 12/23. There was no trading on Friday. HAPPY HOLIDAYS: Peace, Joy and Good Health The probability is good of still higher prices thanks to the very light volumed Santa Claus rally. Our data shows that years after a Presidential Election year since 1965, produce additional gains of DJI rallies of about 1.1% while rising 67.7% of the time over the next five trading days. But at year end, the DJI is likely to turn down. The cross-currents of tax pressures and wind-dressing generally stop the DJI and produce new leadrship, often in the most beaten-down sectors. But this coming year may be shaped more by Covid developments. The Fed is more likely to delay rate hikes until February or March. The DJI is still quite capable of making a nominal new high. That should send our recommendations, QQQ, SOXL, NVDA and MSFT higher. We might wait to see a big red "popsicle" from their candle-sticks and a Closing Power reversal day. But it usually works out best to take nice profits on strength at resistance when the general market's internals are as weak as the DJI's are now. See the price targets in the charts just below. I would stay long the market's leaders a little longer but take profits at their old highs's resistance. .
The bearish MINCPs that show heavy
red Distribution and falling Closing |
||
|
Charts - 12/23/2021 2021 PEERLESS DJI, Signals, Indicators Daily DJI Volume 10-DayUp/Down Vol Stoch-20 Inverted Traders Index Graph of Pct of All Stocks above 65-dma Cum. Inverted Traders Index DJI-IPA DJI-OBV NASDAQ S&P OEX NYSE COMPQX DJI-15 DJI-20 DJI-30 DIA QQQ SPY IWM TNA Short-Term Rates DOLLAR-UUP ALLSTOCKs recent 2006 vers-Peerless signals http://tigersoftware.com/NEWPEER/UPD71223.BMP MDY - http://www.tigersoftware.com/CHARTZ/MDY.GIF USO-CrudeOil DBO FAS GLD BBH IBB JETS JNUG KOL NUGT OIH PALL RSX RETL SDS AGQ SLV SOXL TAN TECL TLT TMF TNA UGA (gasoline) USO (oil) a nd China: YINN CHAU Commodities: CANE CORN DBC JJC, NIB CORN, CUT (paper) MOO, SOYB WEAT UUP (Dollar) LIT (Lithium) STOCKS: MRNA DIS GE PYPL GME ZOM XLE NRGU AAPL ADBE ALXN AMAT AMGN AMD AMZN AXP BA BABA BAC BIDU BLDP CAT CRM CVX CMG DE ENPH FB GILD GOOG GS HD IBM INTU JPM LRCX M MRK MSFT NEM NFLX NKE NKE NVDA PG PYPL REGN REV SO SQ QCOM QDEL TSLA TXN XOM V VRTX WFC WMT ZM Bullish MAXCPs http://tigersoftware.com/UPPER/12-23/BULLISH.htm Bearish MAXCPs http://tigersoftware.com/DOWNER/12-23/BEARISH.htm |
|
||||||
 |
||||||
 |
||||||
 |
||||||
Table 1 QUICKSILVER on ETFS - 12/23/2021 Bullish = 2 - SOXL (+.745), TECL (.569) Bearish = 1 - RSX ETF CLOSE CHANGE PIVOT-PT 5-dma AROC CL-PWR CANDLE IP21 ITRS POWER INDEX ------------------------------------------------------------------------------------------------ DIA 359.36 1.97 353.63 -1.1% Bullish BLUE .086 ----- ----- --------------------------------------------------------------------------------------------- SPY 470.6 2.91 459.87 44.9% ------- BLUE .056 .036 .092 --------------------------------------------------------------------------------------------- QQQ 396.92 2.97 384.91 130.2% ------- BLUE .117 .058 .175 --------------------------------------------------------------------------------------------- MDY 509.01 3.34 496.13 104.7% ------- BLUE .041 -.011 .03 --------------------------------------------------------------------------------------------- IWM 222.04 1.76 215.14 205.3% ------- BLUE .026 -.047 -.021 --------------------------------------------------------------------------------------------- FAS 128.79 2.4 124.31 -144.6% Bearish BLUE -.049 -.004 -.053 --------------------------------------------------------------------------------------------- RETL 34.61 .82 33.03 325.3% Bearish BLUE .008 -.118 -.11 --------------------------------------------------------------------------------------------- SOXL 67.41 2.03 58.96 671.3% Bullish BLUE .107 .745 .852 --------------------------------------------------------------------------------------------- TECL 85.05 1.33 77.58 366.3% Bullish BLUE .163 .406 .569 --------------------------------------------------------------------------------------------- IBB 154.69 .93 154.46 140.4% Bullish BLUE .05 -.051 -.001 --------------------------------------------------------------------------------------------- GLD 168.97 .38 167.8 24.1% ------- BLUE -.056 -.037 -.093 --------------------------------------------------------------------------------------------- OIL 13.26 .14 12.81 54.1% ------- BLUE -.054 -.14 -.194 --------------------------------------------------------------------------------------------- OIH 187.05 .08 182.81 29.9% Bullish RED .138 -.184 -.046 --------------------------------------------------------------------------------------------- CPER 26.83 .05 26.16 121.3% Bullish BLUE .099 -.07 .029 --------------------------------------------------------------------------------------------- UUP 25.73 -.02 25.91 0% ------- RED -.258 -.025 -.283 --------------------------------------------------------------------------------------------- CORN 22.05 .15 21.51 110.9% Bullish BLUE -.046 .084 .038 --------------------------------------------------------------------------------------------- WEAT 7.79 .03 7.43 259% ------- ---- .123 .06 .183 --------------------------------------------------------------------------------------------- YINN 8.39 .04 8.26 -103% ------- BLUE .071 -.307 -.236 --------------------------------------------------------------------------------------------- RSX 26.12 -.1 27.45 -290.7% Bearish RED -.224 -.232 -.456 |
||||||
    Count of Stocks in Key Directories
          20211223
-------------------------------
NEWHIGHS       118
NEWLOWS        11
MAXCP          30
MINCP          8
TTTNH          17
TTTNL          9
CPCROSSA       24
CPCROSSD       30
ACCUMVER       2
HIGHIP21       4
HIUPPCT        12
VHIP21         60
LOWACCUM       162
REDSELL        172
AUGSELS7       26
TRAPDOOR       5
|
||||||
 Table 3    RANKING OF KEY DIRECTORIES BASED PCT.OF STOCKS ABOVE 65-DMA
             12/23/21
 Bullish = 26
 Bearish = 23
---------------------------------------------------------------------------------------
Directory     Current       day-1         day-2         day-3         day-4         day-5
----------------------------------------------------------------------------------------
COPPER         1             .875          .625          .5            .625          .625
HOMEBLDG       .941          .941          .882          .764          .823          .882
COAL           .833          .666          .833          .5            .666          .5
COMPUTER       .8            .75           .7            .45           .5            .45
UTILITY        .743          .769          .769          .717          .743          .717
BEVERAGE       .714          .714          .714          .642          .642          .642
NASD-100       .68           .628          .577          .463          .494          .546
NIFTY          .63           .565          .543          .413          .5            .521
DJI-13         .615          .615          .538          .461          .615          .692
HIGHPRIC       .61           .57           .505          .349          .454          .48
SP500 .601 .577 .535 .44 .519 .573 FIDSTKS .589 .559 .535 .416 .488 .529 FINANCE .589 .559 .535 .416 .488 .529 INDEXES .581 .548 .478 .385 .445 .472 SEMI .574 .553 .542 .446 .489 .478 DOWJONES .566 .566 .5 .433 .5 .566 SP-100 .566 .533 .511 .411 .477 .588 HOSPITAL .562 .562 .375 .312 .312 .25 REIT .546 .546 .523 .375 .445 .445 ELECTRON .542 .519 .496 .364 .418 .426 INDMATER .541 .527 .402 .319 .486 .513 HACKERS .529 .529 .529 .529 .529 .529 TRANSP .526 .473 .526 .473 .526 .526 CHEM .521 .5 .413 .326 .456 .5 INFRA .515 .484 .484 .303 .484 .545 BONDFUND .505 .494 .402 .448 .505 .471 ============================================================================================= EDU .5 .5 .5 .5 .5 .333 MILITARY .5 .423 .346 .153 .269 .269 ============================================================================================= SOFTWARE .49 .472 .472 .381 .418 .418 FOOD .469 .408 .326 .224 .387 .428 INSURANC .44 .44 .4 .36 .48 .68 COMODITY .435 .384 .256 .205 .307 .384 GOLD .434 .391 .217 .217 .282 .282 GAMING .421 .315 .315 .157 .157 .157 RETAIL .361 .361 .319 .276 .276 .319 REGBANKS .36 .36 .4 .08 .32 .52 GREEN .333 .388 .277 .166 .277 .333 AUTO .32 .283 .207 .132 .226 .301 GUNS .307 .23 .153 .153 .153 .23 RUS-1000 .288 .283 .26 .197 .237 .25 BIOTECH .286 .258 .241 .222 .211 .155 ETFS .254 .163 .127 .127 .145 .127 MARIJUAN .25 .25 .25 0 .25 .25 OILGAS .25 .23 .221 .125 .163 .23 CHINA .16 .14 .14 .08 .16 .18 JETS .142 .142 .142 0 0 0 LOWPRICE .105 .098 .087 .082 .082 .085 BIGBANKS 0 0 0 0 0 .428 SOLAR 0 0 0 0 0 0 |
----------------------------------------------------------------------------------------------------------------------------------------------------
12/23/2021 4:00 AM - DJI Futures +100 NASDAQ +40
Data 12/23/2021
| The Santa Claus Rally is behaving normally. The volume
is low. That is not of concern. The leaders, AAPL, MSFT, NVDA, SOXL, NVDA and TECL continue to rally up from just above their rising 65-dma. Closing Power downtrends were broken. Rallies back up to recent highs would seem reasonable for them. Typically, we see a 1.2% DJI gain over the next 5 trading days and the DJI rallies 80% of the time, after December 22nd in the first year after a Presidential Election since 1965. But keep in mind that it would be unusual for the seasonality here to begin a powerful new rally. We will need to see more strength in the beaten-down stocks of 2021 to expect that. But at least, the number of NASDAQ new lows has shrunken to 137. It had been over 600 just two weeks ago. Two Announcement. 1.) I need to back-up this computer and would like to do it Thursday night and Friday. So, there will be no Hotline tomorrow and the Data will be later than usual. 2) Due the rapid rise in rents and other costs here, I regret to have to be raising the price of the Hotline by $50.00 to $450 starting next year. The Data's price will be unchanged. |
||
| Charts - 12/22/2021 2021 PEERLESS DJI, Signals, Indicators Daily DJI Volume 10-DayUp/Down Vol Stoch-20 Inverted Traders Index Graph of Pct of All Stocks above 65-dma Cum. Inverted Traders Index DJI-IPA DJI-OBV NASDAQ S&P OEX NYSE COMPQX DJI-15 DJI-20 DJI-30 DIA QQQ SPY IWM TNA Short-Term Rates DOLLAR-UUP ALLSTOCKs recent 2006 vers-Peerless signals http://tigersoftware.com/NEWPEER/UPD71222.BMP MDY - http://www.tigersoftware.com/CHARTZ/MDY.GIF USO-CrudeOil DBO FAS GLD BBH IBB JETS JNUG KOL NUGT OIH PALL RSX RETL SDS AGQ SLV SOXL TAN TECL TLT TMF TNA UGA (gasoline) USO (oil) a nd China: YINN CHAU Commodities: CANE CORN DBC JJC, NIB CORN, CUT (paper) MOO, SOYB WEAT UUP (Dollar) LIT (Lithium) STOCKS: MRNA DIS GE PYPL GME ZOM XLE NRGU AAPL ADBE ALXN AMAT AMGN AMD AMZN AXP BA BABA BAC BIDU BLDP CAT CRM CVX CMG DE ENPH FB GILD GOOG GS HD IBM INTU JPM LRCX M MRK MSFT NEM NFLX NKE NKE NVDA PG PYPL REGN REV SO SQ QCOM QDEL TSLA TXN XOM V VRTX WFC WMT ZM Bullish MAXCPs http://tigersoftware.com/UPPER/12-22/BULLISH.htm Bearish MAXCPs http://tigersoftware.com/DOWNER/12-22/BEARISH.htm |
 |
 |
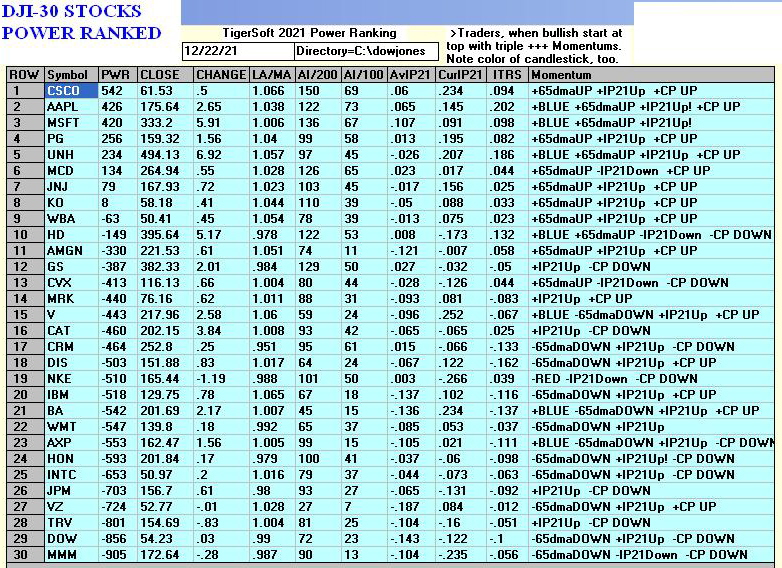 |
 |
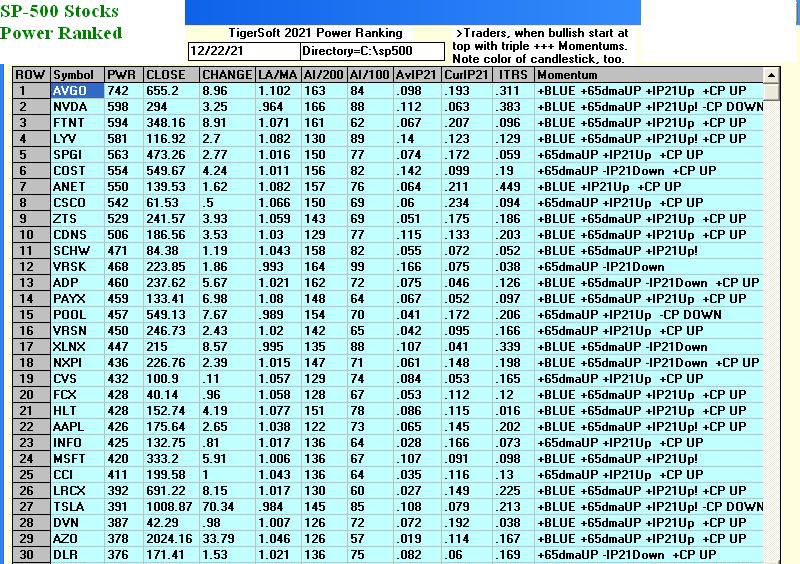 |
 |
 |
 |
 |
 |
Table 1 QUICKSILVER on ETFS - 12/22/2021 Bullish = 2 - SOXL (+.842), TECL (.606) Bearish = 1 - RSX ETF CLOSE CHANGE PIVOT-PT 5-dma AROC CL-PWR CANDLE IP21 ITRS POWER INDEX ------------------------------------------------------------------------------------------------ DIA 357.39 2.48 359.44 -34% Bullish BLUE .116 ---- --- --------------------------------------------------------------------------------------------- SPY 467.69 4.63 466.45 -31.4% ------- BLUE .073 .039 .112 --------------------------------------------------------------------------------------------- QQQ 393.95 4.74 386.84 -40% ------- BLUE .12 .063 .183 --------------------------------------------------------------------------------------------- MDY 505.67 4.84 498.59 4% ------- BLUE .031 -.008 .023 --------------------------------------------------------------------------------------------- IWM 220.28 2.1 213.18 62.7% ------- BLUE .025 -.045 -.02 --------------------------------------------------------------------------------------------- FAS 126.39 2.46 132.4 -92.2% Bearish BLUE .01 -.03 -.02 --------------------------------------------------------------------------------------------- RETL 33.79 .16 32.48 -267.5% Bearish BLUE .002 -.118 -.116 --------------------------------------------------------------------------------------------- SOXL 65.38 1.88 59.23 -222.9% ------- BLUE .117 .725 .842 --------------------------------------------------------------------------------------------- TECL 83.72 3.26 79.25 -178.1% Bullish BLUE .192 .414 .606 --------------------------------------------------------------------------------------------- IBB 153.76 -.19 150.39 60.9% ------- BLUE .068 -.046 .022 --------------------------------------------------------------------------------------------- GLD 168.59 1.57 168.16 72.9% ------- BLUE -.053 -.016 -.069 --------------------------------------------------------------------------------------------- OIH 186.97 .84 185.95 49.6% Bullish BLUE .171 -.174 -.003 --------------------------------------------------------------------------------------------- UUP 25.75 -.1 25.73 -17.4% Bullish ---- -.178 -.025 -.203 --------------------------------------------------------------------------------------------- CORN 25.75 -.1 25.73 -17.4% ------- ---- -.188 .198 .01 --------------------------------------------------------------------------------------------- YINN 8.35 -.05 8.56 -66.5% Bearish BLUE .026 -.265 -.239 --------------------------------------------------------------------------------------------- RSX 26.22 .17 27.67 -195.4% Bearish RED -.151 -.224 -.375 |
 Table 2   Count of Stocks in Key Directories
           20211222
-------------------------------
NEWHIGHS       117
NEWLOWS        193
MAXCP          34
MINCP          12 low
TTTNH          21
TTTNL          10 low
CPCROSSA       65
CPCROSSD       19
ACCUMVER       1
HIGHIP21       7
HIUPPCT        11
VHIP21         63
REDSELL        175
AUGSELS7       29
TRAPDOOR       2
|
Table 1
RANKING OF KEY DIRECTORIES BASED PCT.OF STOCKS ABOVE 65-DMA
12/22/21
  Bullish = 21
  Bearish = 25
---------------------------------------------------------------------------------------
Directory     Current       day-1         day-2         day-3         day-4         day-5
----------------------------------------------------------------------------------------
HOMEBLDG       .941          .882          .764          .823          .882          .941
COPPER         .875          .625          .5            .625          .625          .5
UTILITY        .789          .789          .736          .763          .736          .71
COMPUTER       .75           .7            .45           .5            .45           .5
BEVERAGE       .714          .714          .642          .642          .642          .642
COAL .666 .833 .5 .666 .5 .5 NASD-100 .628 .577 .463 .494 .546 .587 DJI-13 .615 .538 .461 .615 .692 .615 SP500 .577 .535 .44 .519 .573 .571 NIFTY .574 .553 .425 .51 .531 .638 HIGHPRIC .57 .505 .349 .454 .483 .534 DOWJONES .566 .5 .433 .5 .533 .533 FIDSTKS .562 .538 .42 .491 .538 .52 HOSPITAL .562 .375 .312 .312 .25 .312 FINANCE .559 .535 .416 .488 .535 .517 INDEXES .548 .478 .385 .445 .472 .451 SEMI .547 .536 .442 .484 .473 .568 REIT .546 .523 .384 .446 .446 .461 SP-100 .533 .511 .411 .477 .577 .555 INDMATER .527 .402 .319 .486 .513 .486 ELECTRON .511 .488 .36 .413 .421 .518 =========================================================================================== CHEM .5 .413 .326 .456 .5 .5 EDU .5 .5 .5 .5 .333 .333 HACKERS .5 .5 .5 .5 .5 .5 =========================================================================================== BONDFUND .494 .402 .448 .505 .471 .494 INFRA .484 .484 .303 .484 .545 .454 TRANSP .473 .526 .473 .526 .526 .526 SOFTWARE .464 .464 .375 .41 .41 .428 INSURANC .44 .4 .36 .48 .68 .6 ILITARY .423 .346 .153 .269 .269 .307 FOOD .408 .326 .224 .387 .428 .244 GOLD .391 .217 .217 .282 .282 .108 COMODITY .384 .256 .205 .307 .384 .23 GREEN .368 .263 .157 .263 .315 .368 RETAIL .361 .319 .276 .276 .297 .425 REGBANKS .36 .4 .08 .32 .56 .48 GAMING .315 .315 .157 .157 .157 .157 RUS-1000 .285 .262 .198 .239 .25 .255 AUTO .283 .207 .132 .226 .301 .452 BIOTECH .256 .239 .22 .209 .154 .187 GUNS .23 .153 .153 .153 .23 .307 OILGAS .23 .221 .125 .163 .23 .211 MARIJUAN .2 .2 0 .2 .2 .2 ETFS .163 .127 .127 .145 .145 .145 JETS .153 .153 0 0 0 0 CHINA .14 .14 .08 .16 .18 .2 LOWPRICE .1 .087 .084 .084 .087 .082 BIGBANKS 0 0 0 0 .428 0 SOLAR 0 0 0 0 0 .062 |
----------------------------------------------------------------------------------------------------------------------------------------------------
12/22/2021 6:07 AM - DJI Futures -43
NASDAQ -48
Data 12/21/2021
| I see no reason that the Santa Claus
- year end rally will not continue after a limited pull-back Wednesday. The number of new lows dropped off from 664 to 129 on NASDAQ and NYSE today. The number of MINCP fell below the New Highs. There were 2125 more NYSE advances than declines. This certainly looks like a reversal day. And the seasonality for the two weeks after December 21st in the year after the Presidential Election calls for a move higher for the next 10 trading days, until January in 73.8% of the time since the year 1965. Unfortunately, the bullish seasonality is short-lived. If this period of history is to continue to guide us, we would have to expect the DJI to be lower 2/3 of the time for the next month and down on average 2.5% over the next two months. One reason: inflation is getting entrenched and the FED will probably raise rates after the shopping season is over. Today, short-term rates jumped up above +0.65%. Without the FED "giving" the big banks in the DJI-30 nearly free money, the DJI will lose one of its most important thrusters. Cover most of your shorts on the early weakness today and stay long what was recommended for long positions before Tuesday's opening, the powerful SOXL and TECL ETFs as well as NVDA and MSFT. |
||
|
Charts - 12/21/2021 2021 PEERLESS DJI, Signals, Indicators Daily DJI Volume 10-DayUp/Down Vol Stoch-20 Inverted Traders Index Graph of Pct of All Stocks above 65-dma Cum. Inverted Traders Index DJI-IPA DJI-OBV NASDAQ S&P OEX NYSE COMPQX DJI-15 DJI-20 DJI-30 DIA QQQ SPY IWM TNA Short-Term Rates DOLLAR-UUP ALLSTOCKs recent 2006 vers-Peerless signals http://tigersoftware.com/NEWPEER/UPD71221.BMP MDY - http://www.tigersoftware.com/CHARTZ/MDY.GIF USO-CrudeOil DBO FAS GLD BBH IBB JETS JNUG KOL NUGT OIH PALL RSX RETL SDS AGQ SLV SOXL TAN TECL TLT TMF TNA UGA (gasoline) USO (oil) a nd China: YINN CHAU Commodities: CANE CORN DBC JJC, NIB CORN, CUT (paper) MOO, SOYB WEAT UUP (Dollar) LIT (Lithium) STOCKS: MRNA DIS GE PYPL GME ZOM XLE NRGU AAPL ADBE ALXN AMAT AMGN AMD AMZN AXP BA BABA BAC BIDU BLDP CAT CRM CVX CMG DE ENPH FB GILD GOOG GS HD IBM INTU JPM LRCX M MRK MSFT NEM NFLX NKE NKE NVDA PG PYPL REGN REV SO SQ QCOM QDEL TSLA TXN XOM V VRTX WFC WMT ZM Bullish MAXCPs http://tigersoftware.com/UPPER/12-21/BULLISH.htm Bearish MAXCPs http://tigersoftware.com/DOWNER/12-21/BEARISH.htm |
 |
 |
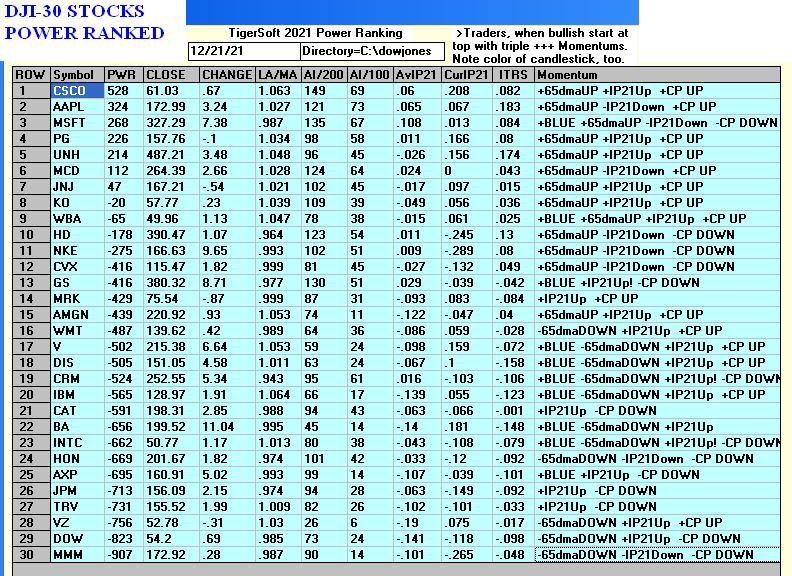 |
 |
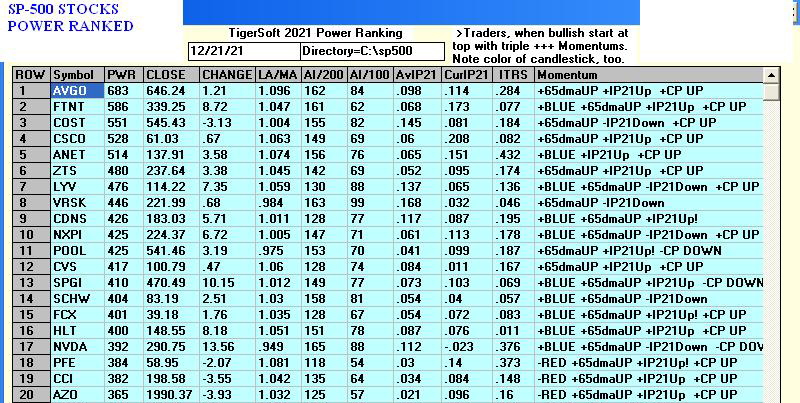 |
 |
 |
 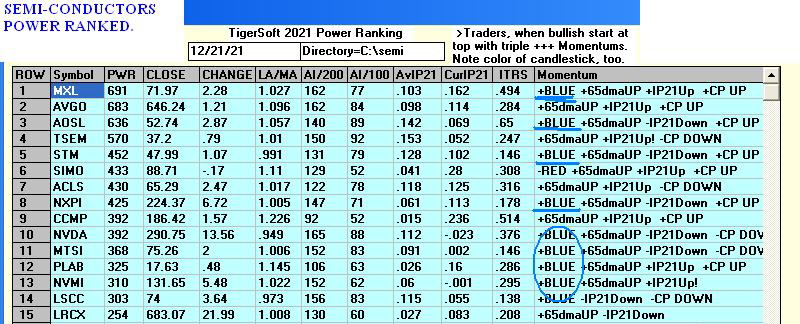 |
 |
 |
 |
 |
Table 1 QUICKSILVER on ETFS - 12/21/2021 Bullish = 2 - SOXL (+.667), TECL (.455) Bearish = 2 - RSX, YINN ETF CLOSE CHANGE PIVOT-PT 5-dma AROC CL-PWR CANDLE IP21 ITRS POWER INDEX --------------------------------------------------------------------------------------------- DIA 354.91 5.64 359.81 -17.7% ------- BLUE .062 0 --- --------------------------------------------------------------------------------------------- SPY 463.06 8.08 470.6 -3.2% ------- BLUE .014 .036 .05 --------------------------------------------------------------------------------------------- QQQ 389.21 8.52 397.05 13% ------- BLUE .049 .057 .106 --------------------------------------------------------------------------------------------- MDY 500.83 13.03 505.27 6.9% ------- BLUE -.04 -.001 -.041 --------------------------------------------------------------------------------------------- IWM 218.18 6.06 217.58 93.3% ------- BLUE -.037 -.038 -.075 --------------------------------------------------------------------------------------------- FAS 123.93 6.92 128.7 -146.4% Bearish BLUE -.029 -.046 -.075 --------------------------------------------------------------------------------------------- RETL 33.63 2.89 35.56 -168.1% Bearish BLUE .016 -.088 -.072 --------------------------------------------------------------------------------------------- SOXL 63.5 5.95 68.12 162.1% Bearish BLUE .041 .626 .667 --------------------------------------------------------------------------------------------- TECL 80.46 5.59 86.56 15.1% ------- BLUE .108 .347 .455 --------------------------------------------------------------------------------------------- IBB 153.95 .94 151.9 175.7% ------- BLUE .039 -.032 .007 --------------------------------------------------------------------------------------------- GLD 167.02 -.07 166.15 47.3% ------- RED -.129 -.01 -.139 --------------------------------------------------------------------------------------------- OIH 186.13 9.28 185.15 18.8% Bullish BLUE .132 -.165 -.033 --------------------------------------------------------------------------------------------- UUP 25.85 -.03 25.84 -5.8% Bullish ---- -.08 -.009 -.089 --------------------------------------------------------------------------------------------- CORN 25.85 -.03 25.84 -5.8% ------- ---- -.126 .213 .087 --------------------------------------------------------------------------------------------- YINN 8.4 .7 8.46 -497.4% Bearish BLUE -.023 -.26 -.283 --------------------------------------------------------------------------------------------- RSX 26.05 .14 27.27 -160.8% Bearish BLUE -.156 -.218 -.374 |
Tsble 2    Count of Stocks in Key Directories
           20211221
-------------------------------
NEWHIGHS       85
NEWLOWS        129
MAXCP          15
MINCP          15  big drop
TTTNH          10
TTTNL          15
CPCROSSA       87
CPCROSSD       88
HIUPPCT        8
VHIP21         64
LOWACCUM       187
REDSELL        195
AUGSELS7       35
TRAPDOOR       1
|
Table 3    RANKING OF KEY DIRECTORIES BASED PCT.OF STOCKS ABOVE 65-DMA
              12/21/21
  Bullish = 17
  Bearish = 28
---------------------------------------------------------------------------------------
Directory     Current       day-1         day-2         day-3         day-4         day-5
----------------------------------------------------------------------------------------
HOMEBLDG       .882          .764          .823          .882          .941          .941
COAL           .833          .5            .666          .5            .5            .333
UTILITY        .789          .736          .763          .736          .71           .684
BEVERAGE       .714          .642          .642          .642          .642          .642
COMPUTER       .7            .45           .5            .45           .5            .45
               +++++
COPPER         .625          .5            .625          .625          .5            .5
NASD-100       .577          .463          .494          .546          .587          .525
               +++++
NIFTY          .553          .425          .51           .531          .638          .531
DJI-13         .538          .461          .615          .692          .615          .615
FIDSTKS        .538          .42           .491          .538          .526          .467
SEMI           .536          .442          .484          .473          .568          .494
FINANCE        .535          .416          .488          .535          .523          .464
SP500          .535          .44           .519          .573          .571          .507
TRANSP         .526          .473          .526          .526          .526          .526
REIT           .523          .376          .453          .446          .469          .376
SP-100 .511 .411 .477 .577 .566 .522 HIGHPRIC .503 .346 .452 .481 .532 .456 ============================================================================================== DOWJONES .5 .433 .5 .533 .533 .533 EDU .5 .5 .5 .333 .333 .333 HACKERS .5 .5 .5 .5 .5 .388 ============================================================================================== ELECTRON .488 .36 .413 .421 .518 .436 INFRA .484 .303 .484 .545 .454 .393 INDEXES .478 .385 .445 .472 .456 .413 SOFTWARE .464 .375 .41 .41 .428 .375 CHEM .413 .326 .456 .5 .5 .456 BONDFUND .402 .448 .505 .471 .471 .436 INDMATER .402 .319 .486 .513 .486 .458 INSURANC .4 .36 .48 .68 .6 .64 REGBANKS .4 .08 .32 .56 .48 .4 HOSPITAL .375 .312 .312 .25 .312 .25 MILITARY .346 .153 .269 .269 .307 .307 FOOD .326 .224 .387 .428 .224 .326 RETAIL .319 .276 .276 .297 .425 .404 GAMING .315 .157 .157 .157 .157 .105 GREEN .263 .157 .263 .315 .368 .315 RUS-1000 .262 .198 .239 .25 .257 .227 COMODITY .256 .205 .307 .384 .205 .282 BIOTECH .239 .22 .209 .154 .187 .143 OILGAS .221 .125 .163 .23 .221 .163 GOLD .217 .217 .282 .282 .108 .13 AUTO .207 .132 .226 .301 .452 .339 MARIJUAN .2 0 .2 .2 .2 0 GUNS .153 .153 .153 .23 .307 .23 JETS .153 0 0 0 0 0 CHINA .14 .08 .16 .18 .2 .22 ETFS .127 .127 .145 .145 .145 .109 LOWPRICE .091 .084 .086 .089 .084 .091 BIGBANKS 0 0 0 .428 .142 0 SOLAR 0 0 0 0 .062 0 |
----------------------------------------------------------------------------------------------------------------------------------------------------
12/21/2021 6:00 AM - DJI Futures +297 NASDAQ +180 Data
12/20/2021
| A Santa inspired reversal is probably at hand. We have
no new Peerless Buy unless we dub in a Santa-Claus Buy in here because the DJI has an 80% chance of rallying over the next ten trading days based on history (since 1965) in this the year after a Presidential Election starting with the close of December 20th. Butressing this is the way a number of key stocks shown below and leading ETFs are positioned now in the "Sweet Spot" right at their rising 65-dma. We probably should cover many of the short sales now because of the probability that the professional shorts will start to cover their shorts now due to the expectation that the heavy selling because of window-dressing will soon be ending as will be tax-loss selling. Use a turning up by the Closing Power of your shorts as reason to cover. In addition, longs who want to trade short-term should consider buying MSFT, NVDA, QQQ, SOXL and SOYB. The recovery is expected mainly for seasonal reasons. This means the recovery it is likely to be quite limited, about two weeks. The DJI's seasonal outlook from December 20th gives the DJI only a 33% chance of being higher two months from now and shows the trypical action to be a 2.5% decline between December 20th and February 20th. But first, we "should" see a rally until early January. |
||
|
Charts - 12/20/2021 2021 PEERLESS DJI, Signals, Indicators Daily DJI Volume 10-DayUp/Down Vol Stoch-20 Inverted Traders Index Graph of Pct of All Stocks above 65-dma Cum. Inverted Traders Index DJI-IPA DJI-OBV NASDAQ S&P OEX NYSE COMPQX DJI-15 DJI-20 DJI-30 DIA QQQ SPY IWM TNA Short-Term Rates DOLLAR-UUP ALLSTOCKs recent 2006 vers-Peerless signals http://tigersoftware.com/NEWPEER/UPD71220.BMP MDY - http://www.tigersoftware.com/CHARTZ/MDY.GIF USO-CrudeOil DBO FAS GLD BBH IBB JETS JNUG KOL NUGT OIH PALL RSX RETL SDS AGQ SLV SOXL TAN TECL TLT TMF TNA UGA (gasoline) USO (oil) a nd China: YINN CHAU Commodities: CANE CORN DBC JJC, NIB CORN, CUT (paper) MOO, SOYB WEAT UUP (Dollar) LIT (Lithium) STOCKS: MRNA DIS GE PYPL GME ZOM XLE NRGU AAPL ADBE ALXN AMAT AMGN AMD AMZN AXP BA BABA BAC BIDU BLDP CAT CRM CVX CMG DE ENPH FB GILD GOOG GS HD IBM INTU JPM LRCX M MRK MSFT NEM NFLX NKE NKE NVDA PG PYPL REGN REV SO SQ QCOM QDEL TSLA TXN XOM V VRTX WFC WMT ZM Bullish MAXCPs http://tigersoftware.com/UPPER/12-20/BULLISH.htm Bearish MAXCPs http://tigersoftware.com/DOWNER/12-20/BEARISH.htm |
| Charts and Tables in a few minutes... |
 |
 |
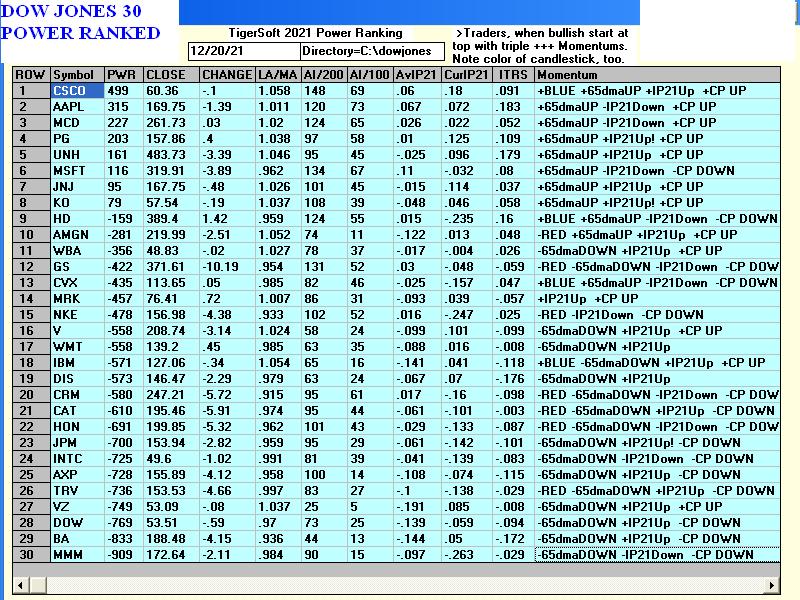 |
 |
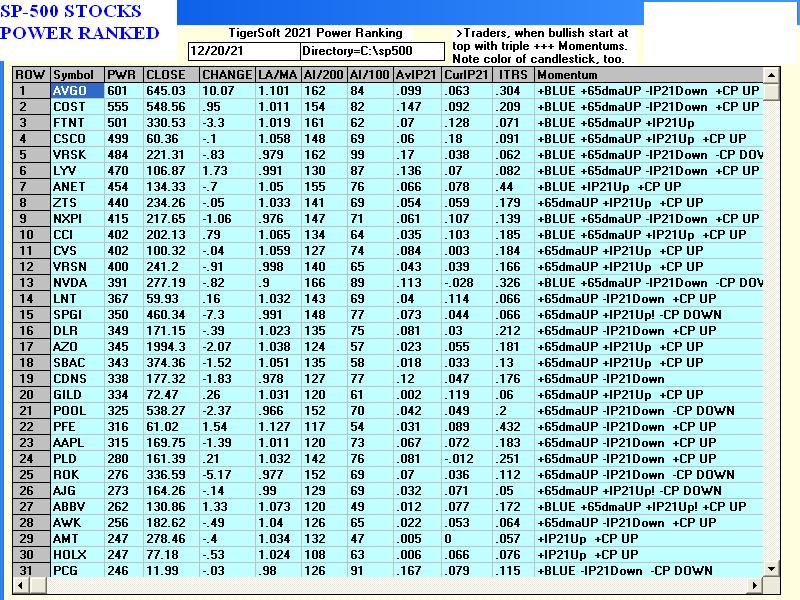 |
 |
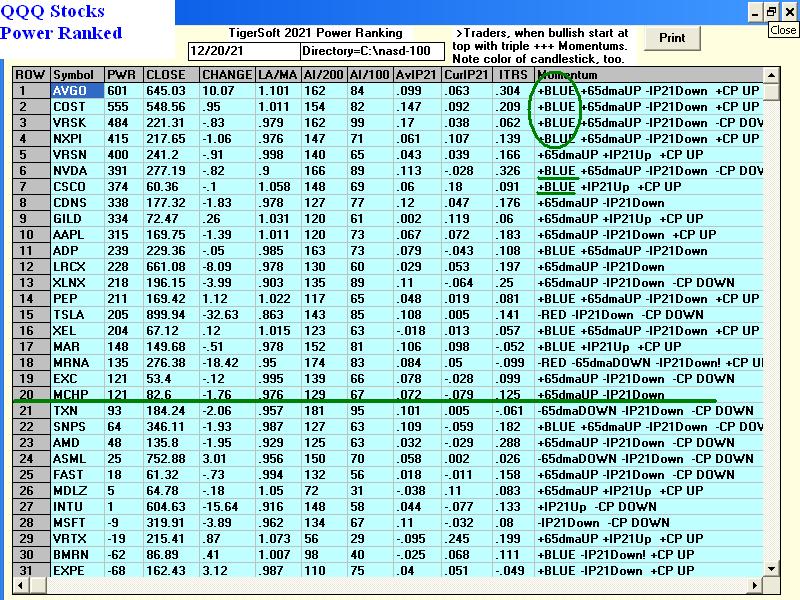 |
 |
 |
 |
 |
Table 1 QUICKSILVER on ETFS - 12/20/2021 Bullish = 2 - SOXL (+.453), TECL (.335) Bearish = 32 - RETL, RSX, YINN ETF CLOSE CHANGE PIVOT-PT 5-dma AROC CL-PWR CANDLE IP21 ITRS POWER INDEX --------------------------------------------------------------------------------------------- DIA 349.27 -4.36 356.17 -108.8% Bearish RED .016 ---- ----- --------------------------------------------------------------------------------------------- SPY 454.98 -4.89 463.36 -124.5% Bearish BLUE -.038 .034 -.004 --------------------------------------------------------------------------------------------- QQQ 380.69 -4.22 388.2 -148.4% Bearish BLUE .017 .049 .066 --------------------------------------------------------------------------------------------- MDY 487.8 -8.33 500.14 -143.2% Bearish RED -.089 -.009 -.098 --------------------------------------------------------------------------------------------- IWM 212.12 -3.02 214.18 -91.1% Bearish ---- -.094 -.048 -.142 --------------------------------------------------------------------------------------------- FAS 117.01 -7.3 127.62 -320.4% Bearish RED -.043 -.103 -.146 --------------------------------------------------------------------------------------------- RETL 30.74 -2.29 34.75 -592% Bearish RED -.076 -.195 -.271 --------------------------------------------------------------------------------------------- SOXL 57.55 -1.41 61.52 -386.1% Bearish BLUE -.005 .458 .453 --------------------------------------------------------------------------------------------- TECL 74.87 -2.71 80.22 -580.3% Bearish BLUE .081 .254 .335 --------------------------------------------------------------------------------------------- IBB 153.01 -1.45 148.62 120.9% ------- RED .011 -.018 -.007 --------------------------------------------------------------------------------------------- GLD 167.09 -.71 165.44 2.7% ------- RED -.144 .012 -.132 --------------------------------------------------------------------------------------------- OIH 176.85 -5.96 185.44 -321.1% ------- BLUE .04 -.179 -.139 --------------------------------------------------------------------------------------------- UUP 25.88 -.03 25.88 9.7% Bullish ---- -.018 .019 .001 --------------------------------------------------------------------------------------------- CORN 25.88 -.03 25.88 9.7% ------- ---- -.088 .226 .138 --------------------------------------------------------------------------------------------- YINN 7.7 -.56 9.24 -912.8% Bearish RED -.089 -.303 -.392 --------------------------------------------------------------------------------------------- RSX 25.91 -1.54 26.92 -139.7% Bearish BLUE -.211 -.195 -.406 |
 Table 2   Count of Stocks in Key Directories
           20211220
-------------------------------
NEWHIGHS       42
NEWLOWS        664
MAXCP          18
MINCP          93
TTTNH          18
TTTNL          174
CPCROSSA       46
CPCROSSD       88
ACCUMVER       8
HIGHIP21       2
HIUPPCT        7
VHIP21         64
LOWACCUM       196
REDSELL        210
AUGSELS7       35
TRAPDOOR       12
|
Table 3RANKING OF KEY DIRECTORIES BASED PCT.OF STOCKS ABOVE 65-DMA 12/20/21 BULLISH = 3 Bearish = 42 --------------------------------------------------------------------------------------- Directory Current day-1 day-2 day-3 day-4 day-5 ---------------------------------------------------------------------------------------- HOMEBLDG .764 .823 .882 .941 .941 .941 UTILITY .736 .763 .736 .71 .684 .684 BEVERAGE .642 .642 .642 .642 .642 .571 ---------------------------------------------------------------------------- cOAL .5 .666 .5 .5 .333 .333 COPPER .5 .625 .625 .5 .5 .5 EDU .5 .5 .333 .333 .333 .333 HACKERS .5 .5 .5 .5 .388 .5 ---------------------------------------------------------------------------- TRANSP .473 .526 .526 .526 .526 .526 NASD-100 .463 .494 .546 .587 .536 .556 DJI-13 .461 .615 .692 .615 .615 .538 COMPUTER .45 .5 .45 .5 .45 .5 BONDFUND .448 .505 .471 .471 .425 .517 SEMI .442 .484 .473 .568 .505 .515 SP500 .44 .519 .573 .571 .513 .549 DOWJONES .433 .5 .533 .533 .533 .5 NIFTY .425 .51 .531 .638 .553 .617 FIDSTKS .42 .491 .538 .526 .479 .502 FINANCE .416 .488 .535 .523 .476 .5 SP-100 .411 .477 .577 .566 .533 .522 INDEXES .385 .445 .472 .456 .413 .445 REIT .376 .446 .453 .469 .376 .461 SOFTWARE .375 .41 .41 .428 .375 .41 ELECTRON .36 .413 .421 .518 .443 .458 INSURANC .36 .48 .68 .6 .64 .56 HIGHPRIC .346 .452 .481 .532 .459 .5 CHEM .326 .456 .5 .5 .456 .521 INDMATER .319 .486 .513 .486 .458 .458 HOSPITAL .312 .312 .25 .312 .25 .25 INFRA .303 .484 .545 .454 .393 .363 RETAIL .276 .276 .297 .425 .404 .382 FOOD .224 .387 .428 .224 .326 .306 BIOTECH .22 .209 .154 .187 .146 .157 GOLD .217 .282 .282 .108 .13 .195 COMODITY .205 .307 .384 .205 .256 .23 RUS-1000 .228 .239 .25 .257 .227 .25 GAMING .157 .157 .157 .157 .105 .105 GREEN .157 .263 .315 .368 .315 .368 GUNS .153 .153 .23 .307 .23 .153 MILITARY .153 .269 .269 .307 .307 .307 AUTO .132 .226 .301 .452 .396 .471 ETFS .127 .145 .145 .145 .109 .127 OILGAS .125 .163 .23 .221 .173 .269 LOWPRICE .086 .083 .089 .083 .091 .089 CHINA .08 .16 .18 .2 .22 .24 REGBANKS .08 .32 .56 .48 .44 .4 BIGBANKS 0 0 .428 .142 .142 0 JETS 0 0 0 0 0 0 MARIJUAN 0 .2 .2 .2 0 0 SOLAR 0 0 0 .062 .062 .062 |
----------------------------------------------------------------------------------------------------------------------------------------------------
12/20/2021 6:00 AM - DJI Futures -356
NASDAQ -195 Data 12/17/2021
| The DJI's 530 point drop Friday was accompanied by only
modestly negative breadth. Keeping us still hopeful, we see the SP-500 is still in its uptrend and Semi-Conductors (SOXL) have not broken their "box" support. The DJI's well-tested support down at 34000 is the real key. A move below 34000 would mean a break in a 5x tested support. That would be hard to miss if you follow the market and would likely bring a big new sell-off. Though the FED dropped short-term rates on Friday all the way down to 0.3%, and a Santa Claus rally usully starts this week, we still find the DJI and NASDAQ down more than one percent as today's Hotline Opening is now being written. Technically, the biggest problem is the extreme negativity of the Peerless V-Indicator and OBVPct. Very low V-I readings show serious big-money dumping. This is what prevented a Buy B13 on Friday's close. In addition, if we accord a new Sell S9 to Thursday's dramatic reversal down because the DJI's hypothetical high reached the 3% upper band with all our key Peerless indicators deeply negative, then we will not be able to get a Buy B13 (Santa Claus) buy over the next nine trading days. Because of this, the bullish December seasonality probably cannot be counted on until we see Professionals again buying and the key Closing Powers for DIA, SPY and QQQ not falling. For us to believe a bottom has been made that can be traded well, we need to see SOXL, IWM and RETL to recover convincingly above their support-levels and IBB and BBH (representing biotechs) to make breakouts, too, above their down-trend lines. Tuesday may bring a recovery, of sorts, but for now stay short some of many bearish MINCPs. There just is almost nothing that looks good enough to buy. This is something we have been regularly commenting on simply based on the very negative ratio of new lows to newhighs. Trading ranges set up their own dynamics and magnetic forces. Until 34000 is again successfully tested on the DJI, a 1000-point rally would seem unlikely. |
||
|
Charts - 12/17/2021 2021 PEERLESS DJI, Signals, Indicators Daily DJI Volume 10-DayUp/Down Vol Stoch-20 Inverted Traders Index Graph of Pct of All Stocks above 65-dma Cum. Inverted Traders Index DJI-IPA DJI-OBV NASDAQ S&P OEX NYSE COMPQX DJI-15 DJI-20 DJI-30 DIA QQQ SPY IWM TNA Short-Term Rates DOLLAR-UUP ALLSTOCKs recent 2006 vers-Peerless signals http://tigersoftware.com/NEWPEER/UPD71217.BMP MDY - http://www.tigersoftware.com/CHARTZ/MDY.GIF USO-CrudeOil DBO FAS GLD BBH IBB JETS JNUG KOL NUGT OIH PALL RSX RETL SDS AGQ SLV SOXL TAN TECL TLT TMF TNA UGA (gasoline) USO (oil) a nd China: YINN CHAU Commodities: CANE CORN DBC JJC, NIB CORN, CUT (paper) MOO, SOYB WEAT UUP (Dollar) LIT (Lithium) STOCKS: MRNA DIS GE PYPL GME ZOM XLE NRGU AAPL ADBE ALXN AMAT AMGN AMD AMZN AXP BA BABA BAC BIDU BLDP CAT CRM CVX CMG DE ENPH FB GILD GOOG GS HD IBM INTU JPM LRCX M MRK MSFT NEM NFLX NKE NKE NVDA PG PYPL REGN REV SO SQ QCOM QDEL TSLA TXN XOM V VRTX WFC WMT ZM Bullish MAXCPs http://tigersoftware.com/UPPER/12-17/BULLISH.htm Bearish MAXCPs http://tigersoftware.com/DOWNER/12-17/BEARISH.htm |
 |
 |
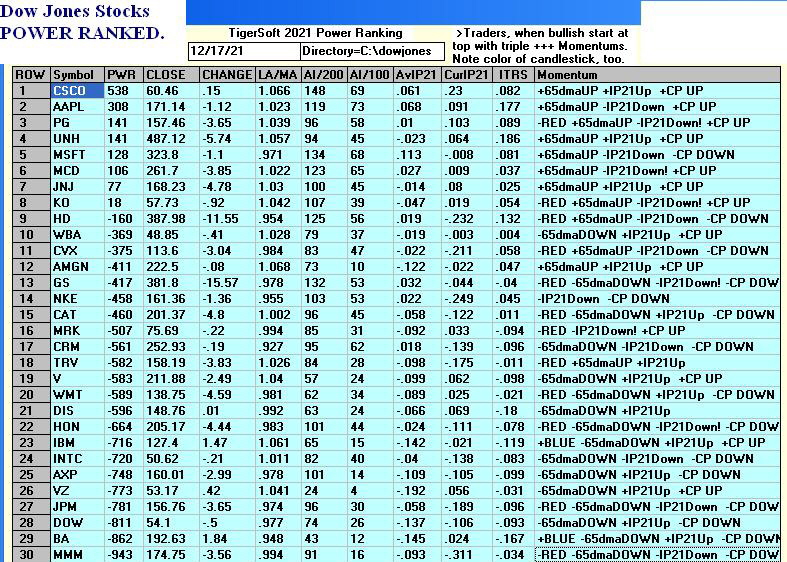 |
 |
 |
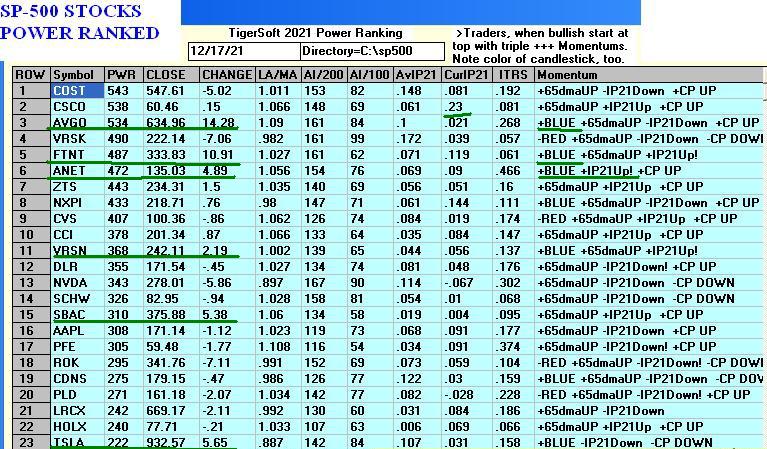 |
 |
|
 |
 |
 |
 |
Table 1 QUICKSILVER on ETFS - 12/17/2021 Bullish = 2 - SOXL (+.441), TECL (.335) Bearish = 2 - RSX, YINN ETF CLOSE CHANGE PIVOT-PT 5-dma AROC CL-PWR CANDLE IP21 ITRS POWER INDEX --------------------------------------------------------------------------------------------- DIA 353.63 -5.81 357.04 -92% ------- RED -.012 0 ---- --------------------------------------------------------------------------------------------- SPY 459.87 -6.58 466.57 -116.2% Bearish RED -.058 .031 -.027 --------------------------------------------------------------------------------------------- QQQ 384.91 -1.93 392.26 -166.9% Bearish BLUE .015 .043 .058 --------------------------------------------------------------------------------------------- MDY 496.13 -2.46 502.13 -111.4% Bearish BLUE -.121 -.011 -.132 --------------------------------------------------------------------------------------------- IWM 215.14 1.96 216.04 -110.3% Bearish BLUE -.131 -.054 -.185 --------------------------------------------------------------------------------------------- FAS 124.31 -8.09 125.19 -212.8% Bearish RED -.083 -.042 -.125 --------------------------------------------------------------------------------------------- RETL 33.03 .55 34.78 -753.3% Bearish BLUE -.06 -.168 -.228 --------------------------------------------------------------------------------------------- SOXL 58.96 -.27 62.34 -677.5% Bearish BLUE -.002 .443 .441 --------------------------------------------------------------------------------------------- TECL 77.58 -1.67 84.34 -648.8% Bearish BLUE .082 .273 .355 --------------------------------------------------------------------------------------------- IBB 154.46 4.07 149.36 241.5% ------- BLUE .012 -.029 -.017 --------------------------------------------------------------------------------------------- GLD 167.8 -.36 167 36.6% ------- RED -.107 .005 -.102 --------------------------------------------------------------------------------------------- OIH 182.81 -3.14 188.77 -382.7% ------- RED -.006 -.139 -.145 --------------------------------------------------------------------------------------------- UUP 25.91 .18 25.83 31% Bullish BLUE -.098 .007 -.091 --------------------------------------------------------------------------------------------- CORN 25.91 .18 25.83 31% ------- BLUE -.096 .207 .111 --------------------------------------------------------------------------------------------- YINN 8.26 -.3 9.3 -843.4% Bearish BLUE -.077 -.243 -.32 --------------------------------------------------------------------------------------------- RSX 27.45 -.22 26.67 -111.6% Bearish RED -.25 -.152 -.402 |
 Table 2   Count of Stocks in Key Directories
           20211217
-------------------------------
NEWHIGHS       90
NEWLOWS        600 Bearish
MAXCP          8
MINCP          202
TTTNH          42
TTTNL          189
CPCROSSA       44
CPCROSSD       88
HIGHIP21       2
HIUPPCT        7
VHIP21         64
REDSELL        219
AUGSELS7       63
TRAPDOOR       6
|
| Table 3 IS NOT AVAILABLE TONIGHT. |
----------------------------------------------------------------------------------------------------------------------------------------------------
12/17/2021 6:00 AM - DJI Futures -157
NASDAQ -160 Data 12/16/2021
| 12/16/2021 The DJI's Buy B19 took the DJI's
intra-day high up to the 2.0%+ upper band with all the key Peerless internals negative. At that point, the weakness in tech stocks brought about by talk of four rate hikes next year turned the DJIs down and it lost all its 150 point gain. The rally was already getting increasingly defensive, led by utilities and big banks enjoying short-term rates being pushed lower by the FED. The longer term belief in higher rates has caused Home Depot to form a bearish head and shoulders pattern. As the second highest priced DJI-30 stock, a breakdown by HD below its neckline will cause a big problem for the bulls expecting a visit by Santa Claus next week. The DJI can still be moved upwards if MCD and UNH (United Health Care) keep rising. But the Breakdown by RETL below its very well-tested flat support is dangerous, especially if low-priced stocks (TNA) break their own very well-tested support. Statistically, the close of December 17th offers the best day of the year to buy if one wants a two week trade. That could still be true with the DJI falling until right before Christmas. Right now, I hope most of you are short some of the Bearish MINCPs There are nearly 3x more new lows than new highs. And if you compare the Bearish MINCPS with Bullish MAXCPs, the difference in size and quality is enormous. Almost nothing looks as bullish as most of the bearish MINCPs look bearish. This cannot be good and is a warning not to trust seasonality all the time. |
||
|
Charts - 12/16/2021 2021 PEERLESS DJI, Signals, Indicators Daily DJI Volume 10-DayUp/Down Vol Stoch-20 Inverted Traders Index Graph of Pct of All Stocks above 65-dma Cum. Inverted Traders Index DJI-IPA DJI-OBV NASDAQ S&P OEX NYSE COMPQX DJI-15 DJI-20 DJI-30 DIA QQQ SPY IWM TNA Short-Term Rates DOLLAR-UUP ALLSTOCKs recent 2006 vers-Peerless signals http://tigersoftware.com/NEWPEER/UPD71216.BMP MDY - http://www.tigersoftware.com/CHARTZ/MDY.GIF USO-CrudeOil DBO FAS GLD BBH IBB JETS JNUG KOL NUGT OIH PALL RSX RETL SDS AGQ SLV SOXL TAN TECL TLT TMF TNA UGA (gasoline) USO (oil) a nd China: YINN CHAU Commodities: CANE CORN DBC JJC, NIB CORN, CUT (paper) MOO, SOYB WEAT UUP (Dollar) LIT (Lithium) STOCKS: MRNA DIS GE PYPL GME ZOM XLE NRGU AAPL ADBE ALXN AMAT AMGN AMD AMZN AXP BA BABA BAC BIDU BLDP CAT CRM CVX CMG DE ENPH FB GILD GOOG GS HD IBM INTU JPM LRCX M MRK MSFT NEM NFLX NKE NKE NVDA PG PYPL REGN REV SO SQ QCOM QDEL TSLA TXN XOM V VRTX WFC WMT ZM Bullish MAXCPs http://tigersoftware.com/UPPER/12-16/BULLISH.htm Bearish MAXCPs http://tigersoftware.com/DOWNER/12-16/BEARISH.htm |
| Stocks and Graphs |
 |
 |
 |
 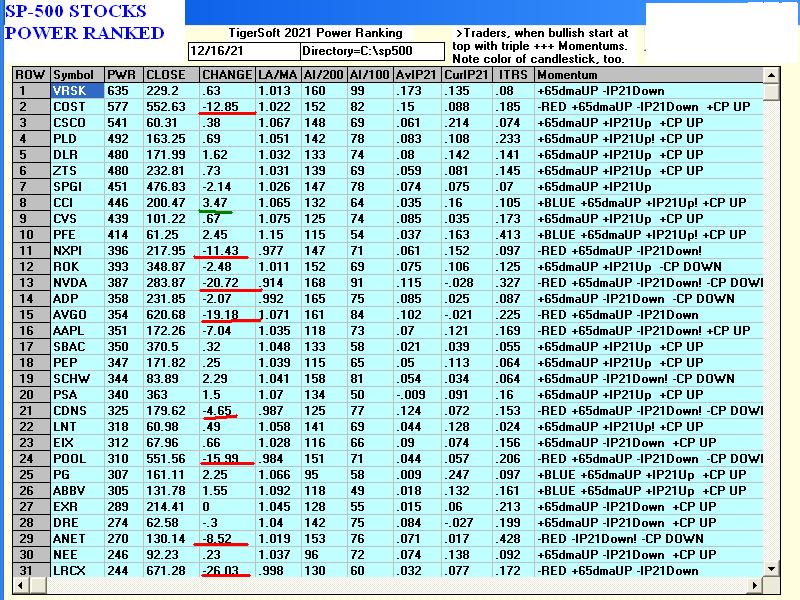 |
 |
 |
 |
 |
 |
 |
|
Table 1 QUICKSILVER on ETFS - 12/16/2021 Bullish = 2 - SOXL (+.465), TECL (.385) Bearish = 1 - IWM, RETL, RSX, YINN ETF CLOSE CHANGE PIVOT-PT 5-dma AROC CL-PWR CANDLE IP21 ITRS POWER INDEX --------------------------------------------------------------------------------------------- DIA 359.44 -.37 360.23 18.6% ------- RED .018 --------------------------------------------------------------------------------------------- SPY 466.45 -4.15 470.74 1.1% Bearish RED -.034 .028 -.006 --------------------------------------------------------------------------------------------- QQQ 386.84 -10.21 398.01 -87.5% Bearish RED .017 .031 .048 --------------------------------------------------------------------------------------------- MDY 498.59 -6.68 507.33 -80.6% Bearish RED -.123 -.018 -.141 --------------------------------------------------------------------------------------------- IWM 213.18 -4.4 219.91 -168.6% Bearish RED -.175 -.075 -.25 --------------------------------------------------------------------------------------------- FAS 132.4 3.7 129.79 119% Bearish RED -.083 .015 -.068 --------------------------------------------------------------------------------------------- RETL 32.48 -3.08 38.33 -829.9% Bearish RED -.136 -.157 -.293 --------------------------------------------------------------------------------------------- SOXL 59.23 -8.89 67.6 -512.3% Bearish RED -.007 .472 .465 --------------------------------------------------------------------------------------------- TECL 79.25 -7.31 88.45 -241.8% Bearish RED .075 .31 .385 --------------------------------------------------------------------------------------------- IBB 150.39 -1.51 147.24 29.1% ------- RED -.042 -.067 -.109 --------------------------------------------------------------------------------------------- GLD 168.16 2.01 166.58 68.6% Bearish BLUE -.029 -.026 -.055 --------------------------------------------------------------------------------------------- OIH 185.95 .8 197.24 -198.4% ------- RED -.044 -.126 -.17 --------------------------------------------------------------------------------------------- UUP 25.73 -.11 25.75 -11.6% Bullish ---- -.139 -.028 -.167 --------------------------------------------------------------------------------------------- CORN 25.73 -.11 25.75 -11.6% ------- ---- -.094 .154 .06 --------------------------------------------------------------------------------------------- YINN 8.56 .1 9.79 -665.4% Bearish RED -.121 -.143 -.264 --------------------------------------------------------------------------------------------- RSX 27.67 .4 28.06 -93% Bearish RED -.23 -.16 -.39 |
Table 2 Count of Stocks in Key Directories
20211216
-------------------------------
NEWHIGHS 193
NEWLOWS 316
MAXCP 26
MINCP 265 Bearish
TTTNH 42
TTTNL 189
CPCROSSA 21
CPCROSSD 168
ACCUMVER 253
HIUPPCT 8
VHIP21 64
REDSELL 218
AUGSELS7 85
TRAPDOOR 11
|
Table 3 RANKING OF KEY DIRECTORIES BASED PCT.OF STOCKS ABOVE 65-DMA Bullish = 27 Bearish = 29 12/16/21 --------------------------------------------------------------------------------------- Directory Current day-1 day-2 day-3 day-4 day-5 ---------------------------------------------------------------------------------------- HOMEBLDG .882 .941 .941 .941 .941 .941 UTILITY .736 .71 .684 .684 .71 .631 DJI-13 .692 .615 .615 .538 .538 .538 INSURANC .68 .6 .64 .56 .56 .52 BEVERAGE .642 .642 .642 .571 .714 .5 COPPER .625 .5 .5 .5 .5 .5 SP-100 .577 .566 .533 .533 .566 .544 SP500 .574 .572 .514 .556 .614 .58 REGBANKS .56 .48 .44 .4 .72 .56 NASD-100 .546 .587 .536 .556 .628 .577 INFRA .545 .454 .393 .363 .393 .424 FIDSTKS .538 .526 .479 .514 .556 .52 DOWJONES .533 .533 .533 .5 .466 .466 NIFTY .531 .638 .553 .617 .638 .595 TRANSP .526 .526 .526 .526 .526 .526 INDMATER .513 .486 .458 .458 .5 .458 RUS-1000 .51 .519 .47 .495 .569 .541 ============================================================================================ CHEM .5 .5 .456 .521 .608 .565 COAL .5 .5 .333 .333 .333 .333 HACKERS .5 .5 .388 .5 .444 .388 ============================================================================================ HIGHPRIC .483 .534 .461 .501 .516 .505 SEMI .474 .567 .505 .515 .567 .608 INDEXES .472 .456 .413 .456 .532 .554 BONDFUND .471 .471 .425 .505 .471 .367 FINANCE .469 .407 .345 .358 .469 .456 COMPUTER .45 .5 .45 .5 .55 .6 REIT .446 .469 .384 .461 .453 .553 BIGBANKS .428 .142 .142 0 .142 .285 FOOD .428 .224 .326 .265 .387 .387 ELECTRON .421 .518 .443 .458 .496 .518 SOFTWARE .41 .428 .375 .41 .428 .357 COMODITY .375 .2 .25 .175 .3 .325 EDU .333 .333 .333 .333 .333 .333 GREEN .315 .368 .315 .368 .421 .421 AUTO .301 .452 .396 .471 .566 .603 RETAIL .297 .425 .404 .382 .489 .489 GOLD .282 .108 .13 .195 .173 .217 MILITARY .269 .307 .307 .307 .307 .307 HOSPITAL .25 .312 .25 .25 .312 .312 OILGAS .238 .228 .18 .304 .419 .4 GUNS .23 .307 .23 .153 .307 .307 CHINA .196 .215 .235 .254 .254 .274 MARIJUAN .166 .166 0 0 0 0 GAMING .157 .157 .105 .105 .157 .157 BIOTECH .154 .187 .146 .159 .157 .159 ETFS .142 .142 .107 .125 .214 .196 LOWPRICE .089 .081 .092 .092 .107 .102 JETS 0 0 0 0 0 .153 SOLAR 0 .062 .062 .062 .062 .125 |
====================================================================================
====================================================================================
12/16/2021 6:20 AM - DJI Futures +150
NASDAQ +50 Data 12/15/2021
| The Buy B19 and the faith in FED's extreme loyalty to Wall
Street were rewarded today. But we still must be very narrow in our selections. The ratio of new lows to new highs shows that Professionals are highly focused in their buying and we must be too, at this point. If the DJI jumps another 500 points, we may get a very rare S9/S12, though these are usually silenced and postponed around Christmas Despite record inflation as signalled by the nearly 7% annualized jumps in the CPI and Producer Price Index, Chairman Powell and the FED are not going to immediately raise interest rates until sometime next year. The less economically poisonous FED selling of Treasury Bills is their preferred instrument for fighting inflation for the next two or three months. They still have their foot on the gas. Look for much higher stock prices, especially where momentum is strongest, especially among Semi-conductors and Tech stocks. I expect Biotechs to start to rebound, too, But the highest ranked Bullish MAXCPs, those semi-conductors above a +500 Power Ranking are clearly the most favored, based on momentum and because Window-Dressing plays such a large role now. Look at SOXL's top ranked stocks as well as its Power Score (+.89) in Table 1. Do not buy its laggards like Intel. I think we should cover the Biotech MINCPs as soon as their Closing Powers simply turn up. But hold other recent Bearish MINCPs as long as their CP stay below their 21-dma and their IP2Is are below the IP21-day ma. Look at the start of the Bullish MAXCP section tonight to see how to avoid disaster buying "pump and dump" stocks when a bubble is pierced, as occured last February and March. Do no believe that high priced blue chips cannot become disasters. That was the lesson for all in late 1929 and in 1937, October 1987 and in early 2020. |
||
|
Charts - 12/15/2021 2021 PEERLESS DJI, Signals, Indicators Daily DJI Volume 10-DayUp/Down Vol Stoch-20 Inverted Traders Index Graph of Pct of All Stocks above 65-dma Cum. Inverted Traders Index DJI-IPA DJI-OBV NASDAQ S&P OEX NYSE COMPQX DJI-15 DJI-20 DJI-30 DIA QQQ SPY IWM TNA Short-Term Rates DOLLAR-UUP ALLSTOCKs recent 2006 vers-Peerless signals http://tigersoftware.com/NEWPEER/UPD71215.BMP MDY - http://www.tigersoftware.com/CHARTZ/MDY.GIF USO-CrudeOil DBO FAS GLD BBH IBB JETS JNUG KOL NUGT OIH PALL RSX RETL SDS AGQ SLV SOXL TAN TECL TLT TMF TNA UGA (gasoline) USO (oil) a nd China: YINN CHAU Commodities: CANE CORN DBC JJC, NIB CORN, CUT (paper) MOO, SOYB WEAT UUP (Dollar) LIT (Lithium) STOCKS: MRNA DIS GE PYPL GME ZOM XLE NRGU AAPL ADBE ALXN AMAT AMGN AMD AMZN AXP BA BABA BAC BIDU BLDP CAT CRM CVX CMG DE ENPH FB GILD GOOG GS HD IBM INTU JPM LRCX M MRK MSFT NEM NFLX NKE NKE NVDA PG PYPL REGN REV SO SQ QCOM QDEL TSLA TXN XOM V VRTX WFC WMT ZM Bullish MAXCPs http://tigersoftware.com/UPPER/12-15/BULLISH.htm Bearish MAXCPs http://tigersoftware.com/DOWNER/12-15/BEARISH.htm |
| Graphs and Tabled to be posted soon. |
 |
 |
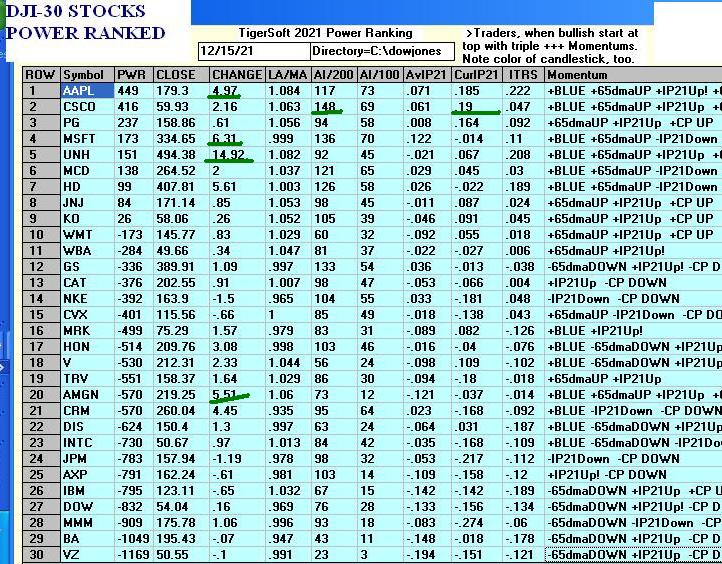 |
 |
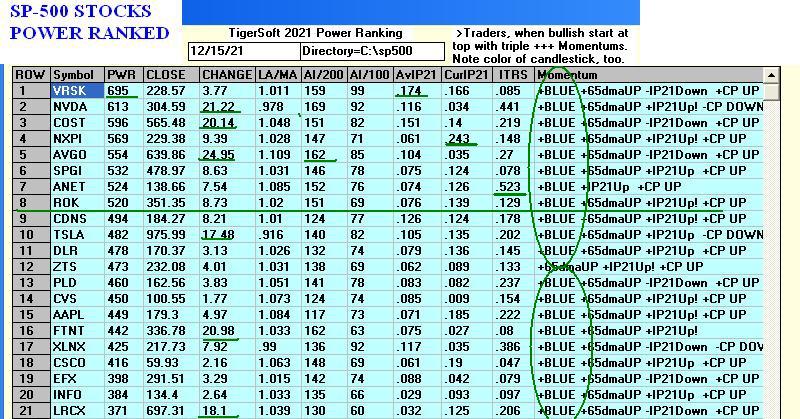 |
 |
 |
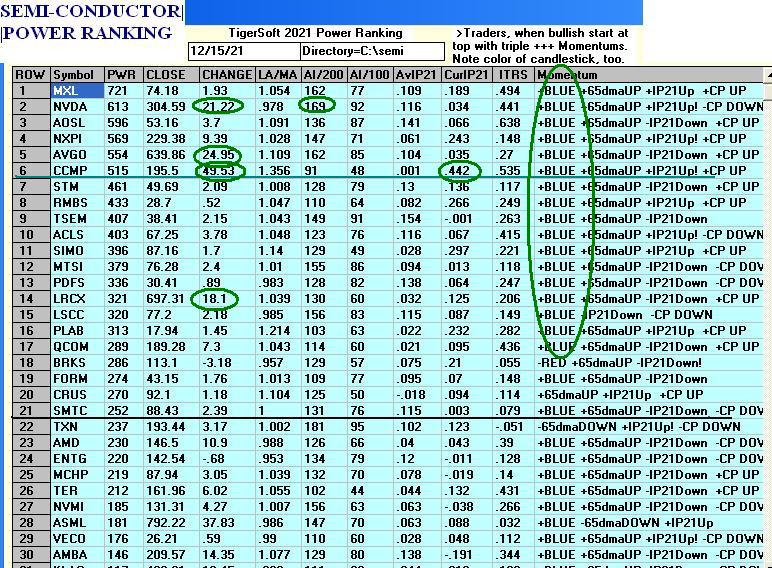 |
Table 1 QUICKSILVER on ETFS - 12/15/2021 Bullish = 2 - SOXL (+.803), TECL (.621) Bearish = 1 - RSX ETF CLOSE CHANGE PIVOT-PT 5-dma AROC CL-PWR CANDLE IP21 ITRS POWER INDEX --------------------------------------------------------------------------------------------- DIA 359.81 3.64 358.11 25.4% ------- BLUE .039 0 ---- --------------------------------------------------------------------------------------------- SPY 470.6 7.24 466.35 11.6% ------- BLUE .009 .038 .047 --------------------------------------------------------------------------------------------- QQQ 397.05 8.85 393.73 -32.5% ------- BLUE .087 .062 .149 --------------------------------------------------------------------------------------------- MDY 505.27 5.13 506.72 -89.1% Bearish BLUE -.091 -.01 -.101 --------------------------------------------------------------------------------------------- IWM 217.58 3.4 220.52 -183.6% Bearish BLUE -.119 -.064 -.183 --------------------------------------------------------------------------------------------- FAS 128.7 1.08 129.35 -92.1% Bearish BLUE -.072 -.012 -.084 --------------------------------------------------------------------------------------------- RETL 35.56 .81 38.52 -662.2% Bearish BLUE -.07 - .096 -.166 --------------------------------------------------------------------------------------------- SOXL 68.12 6.6 65.9 -195.9% ------- BLUE .089 .714 .803 --------------------------------------------------------------------------------------------- TECL 86.56 6.34 83.34 8.3% Bullish BLUE .16 .461 .621 --------------------------------------------------------------------------------------------- IBB 151.9 3.28 149.52 -26.1% ------- BLUE .021 -.074 -.053 --------------------------------------------------------------------------------------------- GLD 166.15 .71 165.88 -22.5% Bearish BLUE -.141 -.039 -.18 --------------------------------------------------------------------------------------------- OIH 185.15 -.29 193.49 -258.8% ------- BLUE -.013 -.17 -.183 --------------------------------------------------------------------------------------------- UUP 25.84 -.04 25.79 27.1% Bullish ---- -.057 -.024 -.081 --------------------------------------------------------------------------------------------- CORN 25.84 -.04 25.79 27.1% ------- ---- -.109 .144 .035 --------------------------------------------------------------------------------------------- YINN 8.46 -.78 9.8 -704% Bearish RED -.073 -.171 -.244 --------------------------------------------------------------------------------------------- RSX 27.27 .35 28.18 -184.6% Bearish BLUE -.218 -.18 -.398 |
Table 2 Count of Stocks in Key Directories
20211215
-------------------------------
NEWHIGHS 125
NEWLOWS 871
MAXCP 30
MINCP 80
TTTNH 32
TTTNL 85
CPCROSSA 93
CPCROSSD 30
ACCUMVER 253
HIGHIP21 3
HIUPPCT 10
VHIP21 64
LOWACCUM 190
REDSELL 228
AUGSELS7 55
TRAPDOOR 6
|
Table 3 RANKING OF KEY DIRECTORIES BASED PCT.OF STOCKS ABOVE 65-DMA
12/15/21
Bullish = 16 Bearish - 28 --------------------------------------------------------------------------------------- Directory Current day-1 day-2 day-3 day-4 day-5 ---------------------------------------------------------------------------------------- HOMEBLDG .941 .941 .941 .941 .941 .941 UTILITY .71 .684 .684 .71 .631 .763 BEVERAGE .642 .642 .571 .714 .5 .571 NIFTY .638 .553 .617 .659 .574 .617 DJI-13 .615 .615 .538 .538 .538 .538 INSURANC .6 .64 .56 .56 .52 .52 NASD-100 .587 .536 .556 .628 .577 .618 SP500 .572 .514 .556 .614 .586 .65 SEMI .567 .505 .515 .567 .608 .67 SP-100 .566 .533 .533 .566 .544 .544 HIGHPRIC .534 .461 .501 .516 .501 .607 DOWJONES .533 .533 .5 .466 .466 .466 FIDSTKS .526 .479 .514 .556 .52 .556 TRANSP .526 .526 .526 .526 .526 .526 RUS-1000 .519 .47 .495 .569 .544 .603 ELECTRON .518 .443 .458 .496 .518 .601 ---------------------------------------------------------------------------------------------- CHEM .5 .456 .521 .608 .565 .63 COAL .5 .333 .333 .333 .333 .333 COMPUTER .5 .45 .5 .55 .6 .6 COPPER .5 .5 .5 .5 .5 .75 HACKERS .5 .388 .5 .444 .388 .444 ---------------------------------------------------------------------------------------------- INDMATER .486 .458 .458 .5 .472 .555 REGBANKS .48 .44 .4 .72 .6 .72 BONDFUND .471 .425 .505 .471 .367 .333 REIT .469 .376 .469 .453 .561 .646 INDEXES .456 .413 .456 .532 .554 .657 INFRA .454 .393 .363 .393 .424 .484 AUTO .452 .396 .471 .566 .603 .641 SOFTWARE .428 .375 .41 .428 .357 .428 RETAIL .425 .404 .382 .489 .489 .51 FINANCE .407 .345 .358 .469 .469 .493 GREEN .368 .315 .368 .421 .421 .421 EDU .333 .333 .333 .333 .333 .333 HOSPITAL .312 .25 .25 .312 .312 .312 GUNS .307 .23 .153 .307 .307 .384 MILITARY .307 .307 .307 .307 .307 .269 OILGAS .228 .18 .304 .419 .4 .476 FOOD .224 .326 .265 .387 .387 .387 CHINA .215 .235 .254 .254 .274 .294 COMODITY .2 .25 .175 .3 .325 .375 BIOTECH .187 .146 .159 .157 .157 .217 MARIJUAN .166 0 0 0 0 0 GAMING .157 .105 .105 .157 .157 .368 BIGBANKS .142 .142 0 .142 .285 .285 ETFS .142 .107 .125 .214 .196 .285 GOLD .108 .13 .195 .173 .217 .326 LOWPRICE .083 .088 .091 .106 .101 .121 SOLAR .062 .062 .062 .062 .125 .125 JETS 0 0 0 0 .153 .153 |
====================================================================================
====================================================================================
12/15/2021 Wednesday 6:20 AM Data used through
12/14/2021
Futures: DJI =-12 NASDAQ -15
| Because of the bullishness from December 18th through
early January and because of the FED's usually keeping rates low in December, the Buy B19 is working to hold up the DJI despite the nearly 10:1 ratio of new lows to new highs and the almost compete lack of bullish Power Ranked stocks. We are getting clear warnings to not try to buy most stocks. But historically the odds do favor a year end rally in blue chips. Continue to hold the most low-ranked Bearish MINCPs as short sales. Today even the highest-ranked blue chip DJI stocks got hit. Inflation news is clearly bad. The FED is not expected to ignore it much longer. Buyers are clearly waiting to see how Powell reacts and whether the end of tax-loss selling in low priced stocks will start to dry up. Be patient today. |
||
|
Charts - 12/14/2021 2021 PEERLESS DJI, Signals, Indicators Daily DJI Volume 10-DayUp/Down Vol Stoch-20 Inverted Traders Index Graph of Pct of All Stocks above 65-dma Cum. Inverted Traders Index DJI-IPA DJI-OBV NASDAQ S&P OEX NYSE COMPQX DJI-15 DJI-20 DJI-30 DIA QQQ SPY IWM TNA Short-Term Rates DOLLAR-UUP ALLSTOCKs recent 2006 vers-Peerless signals http://tigersoftware.com/NEWPEER/UPD71214.BMP MDY - http://www.tigersoftware.com/CHARTZ/MDY.GIF USO-CrudeOil DBO FAS GLD BBH IBB JETS JNUG KOL NUGT OIH PALL RSX RETL SDS AGQ SLV SOXL TAN TECL TLT TMF TNA UGA (gasoline) USO (oil) a nd China: YINN CHAU Commodities: CANE CORN DBC JJC, NIB CORN, CUT (paper) MOO, SOYB WEAT UUP (Dollar) LIT (Lithium) STOCKS: MRNA DIS GE PYPL GME ZOM XLE NRGU AAPL ADBE ALXN AMAT AMGN AMD AMZN AXP BA BABA BAC BIDU BLDP CAT CRM CVX CMG DE ENPH FB GILD GOOG GS HD IBM INTU JPM LRCX M MRK MSFT NEM NFLX NKE NKE NVDA PG PYPL REGN REV SO SQ QCOM QDEL TSLA TXN XOM V VRTX WFC WMT ZM Bullish MAXCPs http://tigersoftware.com/UPPER/12-14/BULLISH.htm Bearish MAXCPs http://tigersoftware.com/DOWNER/12-14/BEARISH.htm |
 |
| n |
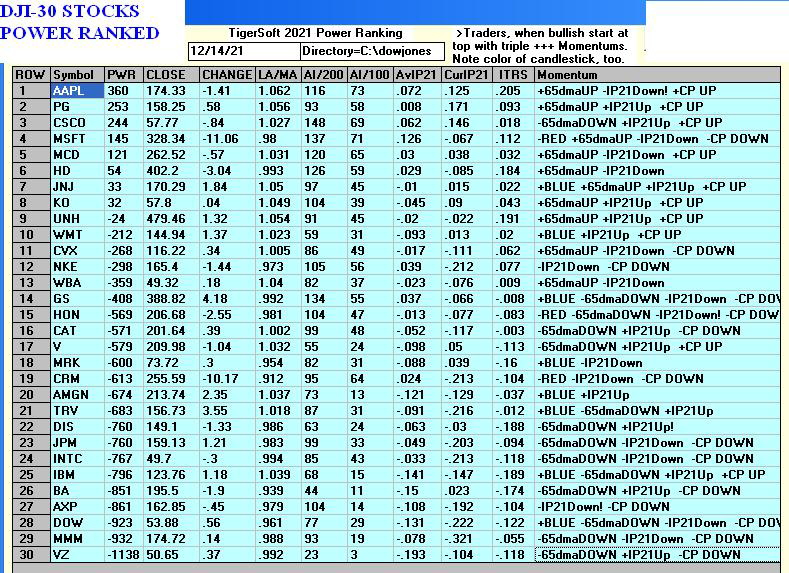 |
 |
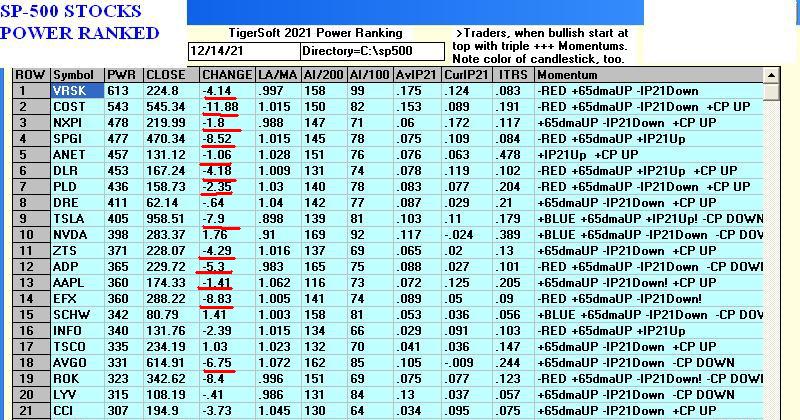 |
 |
 |
 |
Table 1 QUICKSILVER on ETFS - 12/14/2021 Bullish = 2 - SOXL (+.655), TECL (.507) Bearish = 4 - IWM, GLD, IBB, RSX ETF CLOSE CHANGE PIVOT-PT 5-dma AROC CL-PWR CANDLE IP21 ITRS POWER INDEX --------------------------------------------------------------------------------------------- DIA 356.17 -.87 357.99 -21.9% ------- BLUE -.045 ---- ----- --------------------------------------------------------------------------------------------- SPY 463.36 -3.21 469.52 -52.5% Bearish BLUE -.052 .033 -.019 --------------------------------------------------------------------------------------------- QQQ 388.2 -4.06 399.61 -121.5% Bearish BLUE .04 .053 .093 --------------------------------------------------------------------------------------------- MDY 500.14 -1.99 514.29 -113.1% Bearish BLUE -.133 -.018 -.151 --------------------------------------------------------------------------------------------- IWM 214.18 -1.86 225.63 -224.2% Bearish RED -.183 -.075 -.258 --------------------------------------------------------------------------------------------- FAS 127.62 2.43 131.07 -196% Bearish BLUE -.11 .036 -.074 --------------------------------------------------------------------------------------------- RETL 34.75 -.03 40.51 -841.5% Bearish BLUE -.112 -.121 -.233 --------------------------------------------------------------------------------------------- SOXL 61.52 -.82 70.69 -773.2% Bearish BLUE .041 .614 .655 --------------------------------------------------------------------------------------------- TECL 80.22 -4.12 86.42 -294.5% Bearish RED .096 .411 .507 --------------------------------------------------------------------------------------------- IBB 148.62 -.74 152.68 -78.4% Bearish BLUE -.057 -.093 -.15 --------------------------------------------------------------------------------------------- GLD 165.44 -1.56 166.9 -41.1% Bearish BLUE -.218 -.047 -.265 --------------------------------------------------------------------------------------------- OIH 185.44 -3.33 195.09 -172.5% ------- RED -.046 -.166 -.212 --------------------------------------------------------------------------------------------- UUP 25.88 .05 25.7 11.6% Bullish BLUE -.011 -.02 -.031 --------------------------------------------------------------------------------------------- CORN 25.88 .05 25.7 11.6% ------- BLUE -.104 .164 .06 --------------------------------------------------------------------------------------------- YINN 9.24 -.06 9.81 -227.4% Bearish BLUE -.133 -.051 -.184 --------------------------------------------------------------------------------------------- RSX 26.92 .25 28.29 -300.4% Bearish BLUE -.263 -.167 -.43 |
Table 2 Count of Stocks in Key Directories
20211214
-------------------------------
NEWHIGHS 70
NEWLOWS 654
MAXCP 9
MINCP 173
TTTNH 19
TTTNL 81
CPCROSSA 15
CPCROSSD 48
ACCUMVER 253
HIGHIP21 3
HIUPPCT 9
VHIP21 66
REDSELL 232
AUGSELS7 70
TRAPDOOR 6
|
Table 3 RANKING OF KEY DIRECTORIES BASED PCT.OF STOCKS ABOVE 65-DMA
12/14/21
Bullish = 12
Bearish = 36
---------------------------------------------------------------------------------------
Directory Current day-1 day-2 day-3 day-4 day-5
----------------------------------------------------------------------------------------
HOMEBLDG .941 .941 .941 .941 .941 .941
UTILITY .684 .684 .71 .631 .763 .736
BEVERAGE .642 .571 .714 .5 .571 .571
INSURANC .64 .56 .56 .52 .52 .48
DJI-13 .615 .538 .538 .538 .538 .615
NIFTY .553 .617 .659 .595 .595 .595 NASD-100 .536 .556 .628 .577 .618 .639 DOWJONES .533 .5 .466 .466 .466 .533 SP-100 .533 .533 .566 .544 .544 .577 TRANSP .526 .526 .526 .526 .526 .578 SP500 .514 .556 .614 .586 .644 .632 SEMI .505 .515 .567 .608 .67 .67 =============================================================================================== COPPER .5 .5 .5 .5 .75 .375 =============================================================================================== FIDSTKS .479 .514 .556 .52 .556 .568 RUS-1000 .47 .495 .569 .544 .6 .584 HIGHPRIC .461 .501 .516 .501 .596 .549 INDMATER .458 .458 .5 .472 .541 .527 CHEM .456 .521 .608 .565 .63 .608 COMPUTER .45 .5 .55 .6 .6 .7 ELECTRON .443 .458 .496 .518 .601 .578 REGBANKS .44 .4 .72 .6 .72 .76 BONDFUND .425 .505 .471 .367 .333 .321 INDEXES .418 .456 .532 .554 .652 .641 RETAIL .404 .382 .489 .489 .51 .574 AUTO .396 .471 .566 .603 .641 .698 INFRA .393 .363 .393 .424 .484 .484 HACKERS .388 .5 .444 .388 .444 .388 REIT .376 .461 .461 .561 .646 .576 SOFTWARE .375 .41 .428 .357 .428 .392 FINANCE .345 .358 .469 .469 .493 .567 COAL .333 .333 .333 .333 .333 .333 EDU .333 .333 .333 .333 .333 .333 FOOD .326 .265 .387 .387 .387 .346 GREEN .315 .368 .421 .421 .421 .421 MILITARY .307 .307 .307 .307 .269 .23 COMODITY .25 .175 .3 .325 .375 .275 HOSPITAL .25 .25 .312 .312 .312 .25 CHINA .235 .254 .254 .274 .294 .294 GUNS .23 .153 .307 .307 .384 .307 OILGAS .18 .304 .419 .4 .476 .428 BIOTECH .146 .159 .157 .157 .212 .198 BIGBANKS .142 0 .142 .285 .285 .571 GOLD .13 .195 .173 .217 .326 .304 ETFS .107 .125 .214 .196 .285 .285 GAMING .105 .105 .157 .157 .368 .157 LOWPRICE .091 .089 .106 .101 .124 .109 SOLAR .062 .062 .062 .125 .125 .125 JETS 0 0 0 .153 .153 0 MARIJUAN 0 0 0 0 0 0 |
-------------------------------------------------------------------------------------------------------------------------------------------------
12/14/2021 Tuesday 5:55 AM Data used through 12/13/2021
Futures: DJI =+2 NASDAQ -68
| B19 Today's sell-off caused the uptrend of the Closing
Powers for DIA, NASDAQ and QQQ to break their uptrends. Fortunately for the bulls,
the market usually gets a Santa Clause rally for two weeks after December 17th. That
tendency has been strong during the year after the Presidential Election. Since
1965, the DJI has averaged a gain of 1.3% over the next ten trading days. But late
in December or in January, a market top is usually seen and the DJI averages a 2.6%
decline over the next two months from the close we have just seen. That means the top brings a decline of almost 4% or 1100 points, based on today's level. Year-end tax selling ordinarily comes to a sudden end in many of the most beaten down stocks and groups. Presently, new lows are three times the number of new highs and we are not yet seeing a recovery in low-priced stocks, jets or biotechs. We will watch these groups for any change. Profit-taking also is evident now in the big banks because next year is expected to bring two or three rate hikes. This is a time when considerable shifting of leadership is expected. Watch for shifts in leadership in Table 3. Hedging with short sales remains advisable. Many more stocks look downright ugly than look bullish. The highest Power-Ranked stocks would seem to be the ones favored by a Santa Clause Rally. |
||
|
Charts - 12/13/2021 2021 PEERLESS DJI, Signals, Indicators Daily DJI Volume 10-DayUp/Down Vol Stoch-20 Inverted Traders Index Graph of Pct of All Stocks above 65-dma Cum. Inverted Traders Index DJI-IPA DJI-OBV NASDAQ S&P OEX NYSE COMPQX DJI-15 DJI-20 DJI-30 DIA QQQ SPY IWM TNA Short-Term Rates DOLLAR-UUP ALLSTOCKs recent 2006 vers-Peerless signals http://tigersoftware.com/NEWPEER/UPD71213.BMP MDY - http://www.tigersoftware.com/CHARTZ/MDY.GIF USO-CrudeOil DBO FAS GLD BBH IBB JETS JNUG KOL NUGT OIH PALL RSX RETL SDS AGQ SLV SOXL TAN TECL TLT TMF TNA UGA (gasoline) USO (oil) a nd China: YINN CHAU Commodities: CANE CORN DBC JJC, NIB CORN, CUT (paper) MOO, SOYB WEAT UUP (Dollar) LIT (Lithium) STOCKS: MRNA DIS GE PYPL GME ZOM XLE NRGU AAPL ADBE ALXN AMAT AMGN AMD AMZN AXP BA BABA BAC BIDU BLDP CAT CRM CVX CMG DE ENPH FB GILD GOOG GS HD IBM INTU JPM LRCX M MRK MSFT NEM NFLX NKE NKE NVDA PG PYPL REGN REV SO SQ QCOM QDEL TSLA TXN XOM V VRTX WFC WMT ZM Bullish MAXCPs http://tigersoftware.com/UPPER/12-13/BULLISH.htm Bearish MAXCPs http://tigersoftware.com/DOWNER/12-13/BEARISH.htm |
Graphs and Tables
 |
 |
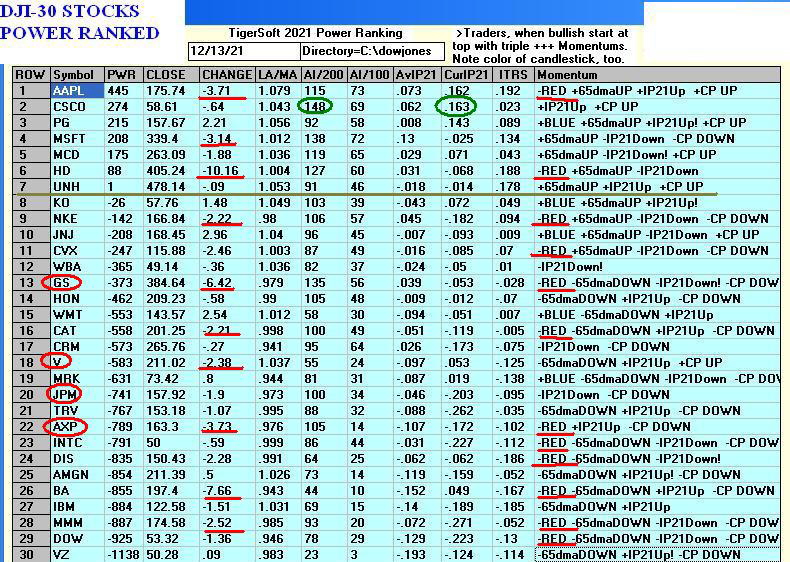 |
 |
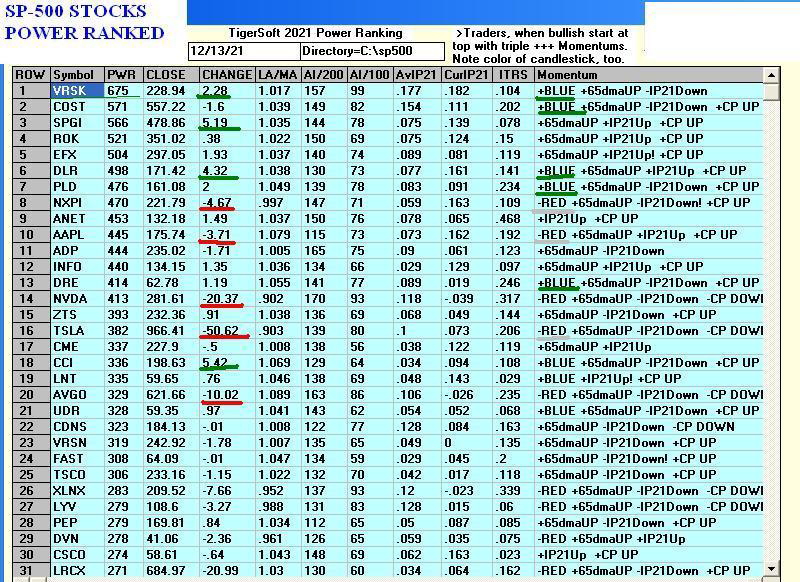 |
 |
 |
 |
 |
 |
 |
Table 1 QUICKSILVER on ETFS - 12/13/2021 Bullish = Bearish = 2 - IBB, RSX ETF CLOSE CHANGE PIVOT-PT 5-dma AROC CL-PWR CANDLE IP21 ITRS POWER INDEX
---------------------------------------------------------------------------- ----------------
DIA 357.04 -3.19 357.74 59% Bearish RED -.019 0
---------------------------------------------------------------------------------------------
SPY 466.57 -4.17 468.28 83.3% Bearish RED -.04 .034 -.006
---------------------------------------------------------------------------------------------
QQQ 392.26 -5.75 397.83 76.7% Bearish RED .038 .049 .087
---------------------------------------------------------------------------------------------
MDY 502.13 -5.2 511.64 -8.4% Bearish RED -.106 -.013 -.119
---------------------------------------------------------------------------------------------
IWM 216.04 -3.87 224.1 -67.2% Bearish RED -.161 -.068 -.229
---------------------------------------------------------------------------------------------
FAS 125.19 -4.6 132.7 -38.1% Bearish RED -.096 -.003 -.099
---------------------------------------------------------------------------------------------
RETL 34.78 -3.55 41.26 -509.1% Bearish RED -.104 -.138 -.242
---------------------------------------------------------------------------------------------
SOXL 62.34 -5.26 71.99 -19.2% Bearish RED .037 .515 .552
---------------------------------------------------------------------------------------------
TECL 84.34 -4.11 85.26 419.5% Bearish RED .118 .386 .504
---------------------------------------------------------------------------------------------
IBB 149.36 2.12 150.97 137.1% Bearish BLUE -.069 -.101 -.17
---------------------------------------------------------------------------------------------
GLD 167 .42 166.81 23.4% Bearish BLUE -.164 -.026 -.19
---------------------------------------------------------------------------------------------
OIH 188.77 -8.47 192.11 66.9% ------- RED -.016 -.117 -.133
---------------------------------------------------------------------------------------------
UUP 25.83 .08 25.82 3.9% ------- BLUE -.04 -.018 -.058
---------------------------------------------------------------------------------------------
CORN 25.83 .08 25.82 3.9% ------- BLUE -.064 .176 .112
---------------------------------------------------------------------------------------------
YINN 9.3 -.49 9.68 5.2% Bearish RED -.14 -.11 -.25
---------------------------------------------------------------------------------------------
RSX 26.67 -1.39 28.6 -249.6% Bearish RED -.281 -.164 -.445
---------------------------------------------------------------------------------------------
QQQ 392.26 -5.75 397.83 76.7% Bearish RED .038 .049 .087
---------------------------------------------------------------------------------------------
MDY 502.13 -5.2 511.64 -8.4% Bearish RED -.106 -.013 -.119
---------------------------------------------------------------------------------------------
IWM 216.04 -3.87 224.1 -67.2% Bearish RED -.161 -.068 -.229
---------------------------------------------------------------------------------------------
FAS 125.19 -4.6 132.7 -38.1% Bearish RED -.096 -.003 -.099
---------------------------------------------------------------------------------------------
RETL 34.78 -3.55 41.26 -509.1% Bearish RED -.104 -.138 -.242
---------------------------------------------------------------------------------------------
SOXL 62.34 -5.26 71.99 -19.2% Bearish RED .037 .515 .552
---------------------------------------------------------------------------------------------
TECL 84.34 -4.11 85.26 419.5% Bearish RED .118 .386 .504
---------------------------------------------------------------------------------------------
IBB 149.36 2.12 150.97 137.1% Bearish BLUE -.069 -.101 -.17
---------------------------------------------------------------------------------------------
GLD 167 .42 166.81 23.4% Bearish BLUE -.164 -.026 -.19
---------------------------------------------------------------------------------------------
OIL 167 .42 166.81 23.4% Bullish BLUE -.214 9.983 9.769
---------------------------------------------------------------------------------------------
OIH 188.77 -8.47 192.11 66.9% ------- RED -.016 -.117 -.133
---------------------------------------------------------------------------------------------
CPER 188.77 -8.47 192.11 66.9% Bullish RED -.004 5.925 5.921
---------------------------------------------------------------------------------------------
UUP 25.83 .08 25.82 3.9% ------- BLUE -.04 -.018 -.058
---------------------------------------------------------------------------------------------
CORN 25.83 .08 25.82 3.9% ------- BLUE -.064 .176 .112
---------------------------------------------------------------------------------------------
WEAT 25.83 .08 25.82 3.9% ------- BLUE -.052 2.376 2.324
---------------------------------------------------------------------------------------------
YINN 9.3 -.49 9.68 5.2% Bearish RED -.14 -.11 -.25
---------------------------------------------------------------------------------------------
RSX 26.67 -1.39 28.6 -249.6% Bearish RED -.281 -.164 -.445
-- BLUE -.04 -.018 -.058
---------------------------------------------------------------------------------------------
CORN 25.83 .08 25.82 3.9% ------- BLUE -.064 .176 .112
---------------------------------------------------------------------------------------------
WEAT 25.83 .08 25.82 3.9% ------- BLUE -.052 2.376 2.324
---------------------------------------------------------------------------------------------
YINN 9.3 -.49 9.68 5.2% Bearish RED -.14 -.11 -.25
---------------------------------------------------------------------------------------------
RSX 26.67 -1.39 28.6 -249.6% Bearish RED -.281 -.164 -.445
|
Table 3 Count of Stocks in Key Directories
20211213
-------------------------------
NEWHIGHS 154 vs 106 vs 108 vs 132
NEWLOWS 452 vs 205 vs 142 vs 162
MAXCP 17
MINCP 237
TTTNH 22
TTTNL 149
CPCROSSA 40
CPCROSSD 95
ACCUMVER 252
HIGHIP21 4
HIUPPCT 11
REDSELL 229
AUGSELS7 72
TRAPDOOR 15
|
RANKING OF KEY DIRECTORIES BASED PCT.OF STOCKS ABOVE 65-DMA
12/13/21
Bullish = 15 Bearish = 30 --------------------------------------------------------------------------------------- Directory Current day-1 day-2 day-3 day-4 day-5 ---------------------------------------------------------------------------------------- HOMEBLDG .941 .941 .941 .941 .941 .941 UTILITY .684 .71 .631 .763 .71 .657 NIFTY .617 .659 .595 .617 .595 .51 BEVERAGE .571 .714 .5 .571 .571 .571 INSURANC .56 .56 .52 .52 .48 .48 NASD-100 .556 .628 .577 .618 .639 .577 SP500 .556 .614 .586 .644 .628 .542 TRANSP .55 .55 .55 .55 .6 .6 DJI-13 .538 .538 .538 .538 .615 .461 SP-100 .533 .566 .544 .544 .566 .477 CHEM .521 .608 .565 .63 .586 .456 SEMI .515 .567 .608 .67 .67 .525 FIDSTKS .514 .556 .52 .556 .568 .455 BONDFUND .505 .471 .367 .333 .31 .287 HIGHPRIC .503 .518 .503 .597 .547 .42 ======================================================================================== COMPUTER .5 .55 .6 .6 .7 .55 COPPER .5 .5 .5 .75 .375 .5 DOWJONES .5 .466 .466 .466 .533 .433 HACKERS .5 .444 .388 .444 .388 .388 ========================================================================================= RUS-1000 .496 .569 .544 .6 .583 .511 AUTO .471 .566 .603 .641 .698 .584 REIT .461 .453 .569 .646 .584 .553 ELECTRON .458 .496 .518 .601 .578 .458 INDMATER .458 .5 .472 .541 .527 .486 INDEXES .456 .532 .554 .652 .652 .456 SOFTWARE .41 .428 .357 .428 .392 .339 REGBANKS .4 .72 .6 .72 .76 .88 RETAIL .382 .489 .489 .51 .574 .489 GREEN .368 .421 .421 .421 .421 .315 INFRA .363 .393 .424 .484 .484 .363 FINANCE .358 .469 .469 .493 .567 .518 COAL .333 .333 .333 .333 .333 .333 EDU .333 .333 .333 .333 .333 .333 MILITARY .307 .307 .307 .269 .23 .192 OILGAS .295 .409 .39 .466 .428 .333 FOOD .265 .387 .387 .387 .346 .326 CHINA .254 .254 .274 .294 .294 .254 HOSPITAL .25 .312 .312 .312 .25 .25 GOLD .195 .173 .217 .326 .282 .282 COMODITY .175 .3 .325 .375 .275 .275 BIOTECH .159 .157 .157 .212 .198 .129 GUNS .153 .307 .307 .384 .307 .23 ETFS .125 .214 .196 .285 .285 .125 GAMING .105 .157 .157 .368 .157 .157 LOWPRICE .091 .104 .101 .124 .109 .086 SOLAR .062 .062 .125 .125 .125 .062 BIGBANKS 0 .142 .285 .285 .571 .142 JETS 0 0 .153 .153 0 0 MARIJUAN 0 0 0 0 0 .166 |
==================================================================================
12/13/2021 Monday 5:50 AM Data used through 12/10/2021
Futures: DJI =+2 NASDAQ +61
Raising Rates from 3.5% to 6.0% did not prevent the DJI from
zooming
from 200 to over 360 between January 1928 and September 1929.
- Chart forthcoming new PEERLESS History of the DJIA 1885-2021-
| Buy B19. News Friday before the opening that the CPI's annual rate
of inflation had jumped to 6.8% did not send the market reeling. One could take this
to be a bullish reaction by a market that refuses to decline. It could also be the
market's choosing to believe the White House over the official CPI numbers. Or
perhaps, Wall Street is showing that it will not be intimidated by Russia in the the
matter of the Ukraine. The weakness shown by Goldman Sachs on Friday demonstrates that the big banks are very aware that inflation could spoil the QE Infinity party for Wall Street Banks. But the market's rally on Friday may also show that even if interest rates were to rise considerably from here, the market's upward momentum has now reached a self-sustaining level of intensifying speculation. In 1928 (See the first chart above), the FED sought to curb what it considered was a dangerous level of market speculation by raising interest rates. Despite the FED's boosting rates throughout the year and then in the Summer of 1929, the DJI did not stop advancing and rose until September 3rd, 1929 to 381.2. But then it crashed 47% in 11 weeks. This suggests that we may have not yet begun to see the real speculative boom. Low-priced stocks, especially beaten-down biotechs, may get a bright lift-off starting next year when their tax-loss selling comes off. Another thing to note from 1929, the DJI did not top-out until there were four separate sets of S9-Adv-Decline non-conconfirmations and the British Key Discount Rate was raised in September to 6.5%. Seasonality becomes particularly bullish starting with the close on December 17th. At the very least, the DJI ought to rise at least another 500 points for a Sell S9. When looking for what to buy use the top-ranked SP-500 and DJI stocks. For now hold short the lowest ranked MINCPs. Charts - 12/10/2021 2021 PEERLESS DJI, Signals, Indicators Daily DJI Volume 10-DayUp/Down Vol Stoch-20 Inverted Traders Index Graph of Pct of All Stocks above 65-dma Cum. Inverted Traders Index DJI-IPA DJI-OBV NASDAQ S&P OEX NYSE COMPQX DJI-15 DJI-20 DJI-30 DIA QQQ SPY IWM TNA Short-Term Rates DOLLAR-UUP ALLSTOCKs recent 2006 vers-Peerless signals http://tigersoftware.com/NEWPEER/UPD71210.BMP MDY - http://www.tigersoftware.com/CHARTZ/MDY.GIF USO-CrudeOil DBO FAS GLD BBH IBB JETS JNUG KOL NUGT OIH PALL RSX RETL SDS AGQ SLV SOXL TAN TECL TLT TMF TNA UGA (gasoline) USO (oil) a nd China: YINN CHAU Commodities: CANE CORN DBC JJC, NIB CORN, CUT (paper) MOO, SOYB WEAT UUP (Dollar) LIT (Lithium) STOCKS: MRNA DIS GE PYPL GME ZOM XLE NRGU AAPL ADBE ALXN AMAT AMGN AMD AMZN AXP BA BABA BAC BIDU BLDP CAT CRM CVX CMG DE ENPH FB GILD GOOG GS HD IBM INTU JPM LRCX M MRK MSFT NEM NFLX NKE NKE NVDA PG PYPL REGN REV SO SQ QCOM QDEL TSLA TXN XOM V VRTX WFC WMT ZM Bullish MAXCPs http://tigersoftware.com/UPPER/12-10/BULLISH.htm Bearish MAXCPs http://tigersoftware.com/DOWNER/12-10/BEARISH.htm |
 |
||
 |
||
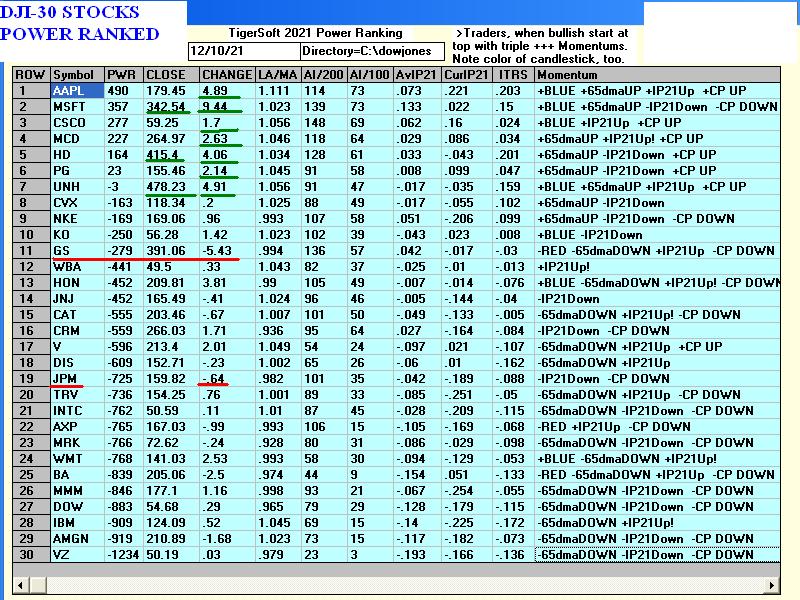 |
||
 |
||
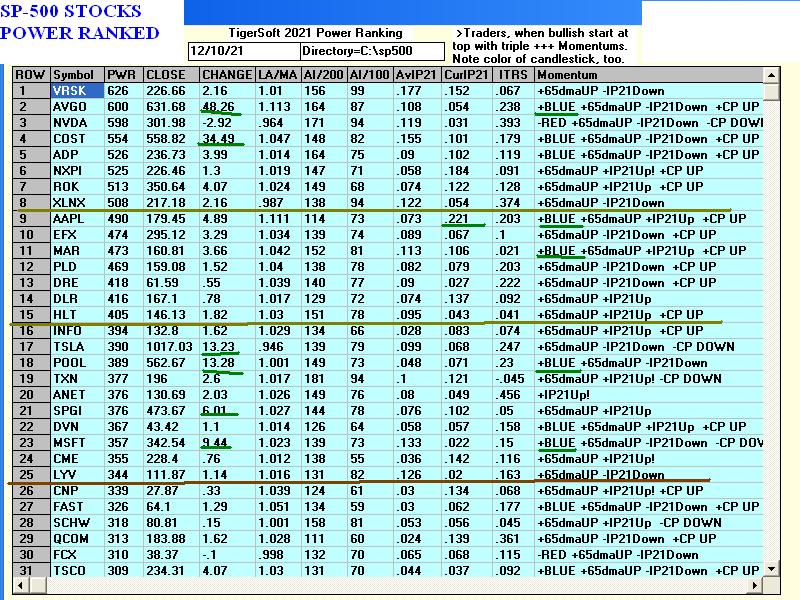 |
||
 |
||
|
||
|
||
Setting up January Rallies |
||
 |
||
Table 1 QUICKSILVER on ETFS - 12/10/2021 Bullish = 0 (SOXL and TECL have dropped off bullish >+.25) Bearish = 1 - RSX ETF CLOSE CHANGE PIVOT-PT 5-dma AROC CL-PWR CANDLE IP21 ITRS POWER INDEX
-------------------------------------------------------------------------------------------------
DIA 360.23 2.12 352.82 197.3% Bearish BLUE -.009 0 -----
---------------------------------------------------------------------------------------------
SPY 470.74 4.39 458.79 186.9% Bearish BLUE -.018 .032 .014
---------------------------------------------------------------------------------------------
QQQ 398.01 4.28 386.2 189.7% Bearish BLUE .057 .047 .104
---------------------------------------------------------------------------------------------
MDY 507.33 .61 502.98 145.9% Bearish RED -.079 -.01 -.089
---------------------------------------------------------------------------------------------
IWM 219.91 -.61 219.02 117.8% Bearish RED -.145 -.06 -.205
---------------------------------------------------------------------------------------------
FAS 129.79 .44 126.18 321.4% Bearish RED -.075 .058 -.017
---------------------------------------------------------------------------------------------
RETL 38.33 -.19 38.8 209.4% Bearish RED -.06 -.044 -.104
---------------------------------------------------------------------------------------------
SOXL 67.6 1.7 62.6 349.4% Bearish RED .102 .623 .725
---------------------------------------------------------------------------------------------
TECL 88.45 5.11 77.28 824.3% Bullish BLUE .158 .497 .655
---------------------------------------------------------------------------------------------
IBB 147.24 -2.28 145.27 -38.5% Bearish RED -.122 -.154 -.276
---------------------------------------------------------------------------------------------
GLD 166.58 .7 166.22 -1.5% Bearish RED -.153 -.05 -.203
---------------------------------------------------------------------------------------------
OIH 197.24 3.75 186.19 452.2% ------- BLUE -.018 -.064 -.082
---------------------------------------------------------------------------------------------
UUP 25.75 -.04 25.81 -3.9% ------- ---- -.038 -.047 -.085
---------------------------------------------------------------------------------------------
CORN 25.75 -.04 25.81 -3.9% ------- ---- -.061 .159 .098
---------------------------------------------------------------------------------------------
YINN 9.79 -.01 9.29 533.2% Bearish ---- -.073 -.11 -.183
---------------------------------------------------------------------------------------------
RSX 28.06 -.12 28.08 -133.8% Bearish RED -.258 -.139 -.397
|
||
Table 2 Count of Stocks in Key Directories
20211210
-------------------------------
NEWHIGHS 106
NEWLOWS 205
MAXCP 12
MINCP 160 Bearish
TTTNH 17
TTTNL 82
CPCROSSA 36
CPCROSSD 64
ACCUMVER 251
HIGHIP21 3
HIUPPCT 12
VHIP21 68
REDSELL 229
AUGSELS7 67
TRAPDOOR 5
|
||
Table 3 RANKING OF KEY DIRECTORIES BASED PCT.OF STOCKS ABOVE 65-DMA
12/10/21
Bullish = 19 Bearish = 28 --------------------------------------------------------------------------------------- Directory Current day-1 day-2 day-3 day-4 day-5 ---------------------------------------------------------------------------------------- HOMEBLDG .941 .941 .941 .941 .941 .882 REGBANKS .72 .6 .72 .76 .88 .32 BEVERAGE .714 .5 .571 .571 .571 .357 UTILITY .71 .631 .763 .71 .631 .342 NIFTY .659 .595 .617 .595 .51 .446 NASD-100 .628 .577 .618 .639 .567 .474 SP500 .614 .586 .644 .628 .542 .425 CHEM .608 .565 .63 .586 .478 .456 RUS-1000 .57 .545 .601 .583 .51 .394 SEMI .567 .608 .67 .67 .525 .505 AUTO .566 .603 .641 .698 .603 .528 SP-100 .566 .544 .544 .566 .466 .388 INSURANC .56 .52 .52 .48 .48 .32 FIDSTKS .556 .52 .556 .568 .455 .349 COMPUTER .55 .6 .6 .7 .55 .55 TRANSP .55 .55 .55 .6 .6 .5 DJI-13 .538 .538 .538 .615 .384 .307 INDEXES .532 .554 .652 .652 .456 .38 HIGHPRIC .518 .503 .597 .547 .42 .347 ========================================================================================= COPPER .5 .5 .75 .375 .5 .25 INDMATER .5 .472 .541 .527 .5 .361 ========================================================================================= ELECTRON .496 .518 .601 .578 .458 .436 RETAIL .489 .489 .51 .574 .468 .446 BONDFUND .471 .367 .333 .31 .287 .298 FINANCE .469 .469 .493 .567 .518 .345 DOWJONES .466 .466 .466 .533 .4 .3 REIT .453 .561 .653 .584 .553 .376 HACKERS .444 .388 .444 .388 .388 .388 SOFTWARE .428 .357 .428 .392 .339 .232 GREEN .421 .421 .421 .421 .315 .157 OILGAS .419 .4 .476 .438 .352 .276 INFRA .393 .424 .484 .484 .363 .272 FOOD .387 .387 .387 .346 .326 .306 COAL .333 .333 .333 .333 .333 .166 EDU .333 .333 .333 .333 .333 .333 HOSPITAL .312 .312 .312 .25 .25 .062 GUNS .307 .307 .384 .307 .307 .153 MILITARY .307 .307 .269 .23 .192 .115 COMODITY .3 .325 .375 .275 .275 .225 CHINA .254 .274 .294 .294 .254 .235 ETFS .214 .196 .285 .285 .125 .107 GOLD .173 .217 .326 .282 .282 .173 BIOTECH .157 .157 .212 .198 .129 .148 GAMING .157 .157 .368 .157 .157 .105 BIGBANKS .142 .285 .285 .571 .142 0 LOWPRICE .106 .099 .124 .109 .086 .076 SOLAR .062 .125 .125 .125 .062 .062 JETS 0 .153 .153 0 0 0 MARIJUAN 0 0 0 0 .166 0 |
====================================================================================
====================================================================================
12/10/2021 Friday 6:00 AM Data used through 12/9/2021
Futures: DJI =+210 NASDAQ +110
| Buy B19. The DJI fought back from an early loss
all day and almost closed up.; Someone who knows something bullish is happy to steadily buy the blue chips for a rally back to the upper bands, probably 3% to 4%, at year end. Most likely, the tech stocks will breakout above the closes of Wednesday. But the probem is we will almost certainly see Peerless Sells when the DJI closes above the 2.5% upper band, about 600 ppoints higher. The channel the DJI is in has tested its lows, now it needs to go to the top of its channel. It remains to be seen where the strength outside the DJI leaders and tech stocks will come from to take the DJI and the market up another 2.5% to 3.0%. But the Christmas-New Year's period does ordinarily bring a rally. What is surpsing is the higher opening this morning. Charts - 12/9/2021 2021 PEERLESS DJI, Signals, Indicators Daily DJI Volume 10-DayUp/Down Vol Stoch-20 Inverted Traders Index Graph of Pct of All Stocks above 65-dma Cum. Inverted Traders Index DJI-IPA DJI-OBV NASDAQ S&P OEX NYSE COMPQX DJI-15 DJI-20 DJI-30 DIA QQQ SPY IWM TNA Short-Term Rates DOLLAR-UUP ALLSTOCKs recent 2006 vers-Peerless signals http://tigersoftware.com/NEWPEER/UPD71209.BMP MDY - http://www.tigersoftware.com/CHARTZ/MDY.GIF USO-CrudeOil DBO FAS GLD BBH IBB JETS JNUG KOL NUGT OIH PALL RSX RETL SDS AGQ SLV SOXL TAN TECL TLT TMF TNA UGA (gasoline) USO (oil) a nd China: YINN CHAU Commodities: CANE CORN DBC JJC, NIB CORN, CUT (paper) MOO, SOYB WEAT UUP (Dollar) LIT (Lithium) STOCKS: MRNA DIS GE PYPL GME ZOM XLE NRGU AAPL ADBE ALXN AMAT AMGN AMD AMZN AXP BA BABA BAC BIDU BLDP CAT CRM CVX CMG DE ENPH FB GILD GOOG GS HD IBM INTU JPM LRCX M MRK MSFT NEM NFLX NKE NKE NVDA PG PYPL REGN REV SO SQ QCOM QDEL TSLA TXN XOM V VRTX WFC WMT ZM Bullish MAXCPs http://tigersoftware.com/UPPER/12-9/BULLISH.htm Bearish MAXCPs http://tigersoftware.com/DOWNER/12-9/BEARISH.htm |
|
Tables and Channels |
 |
 |
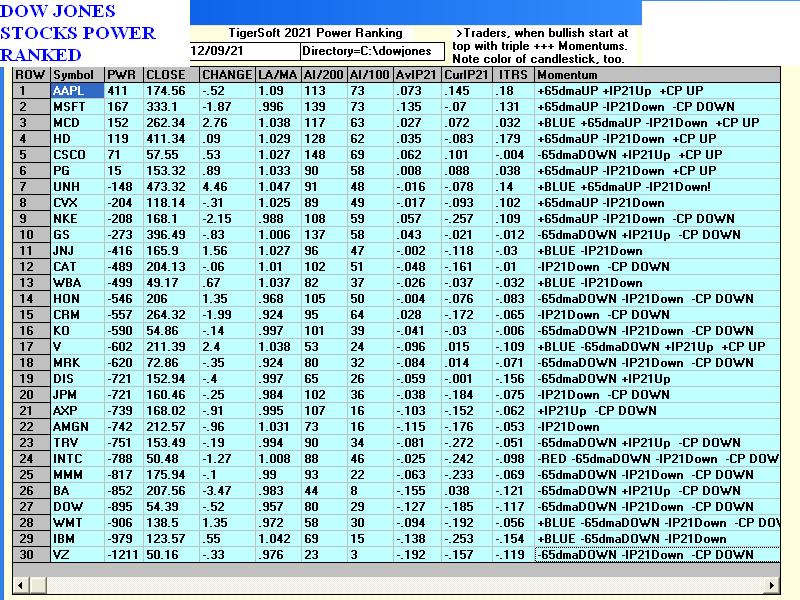 |
 |
 |
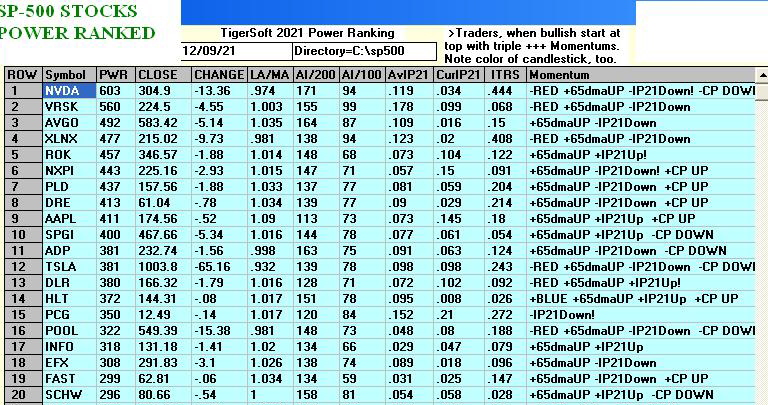 |
 |
 |
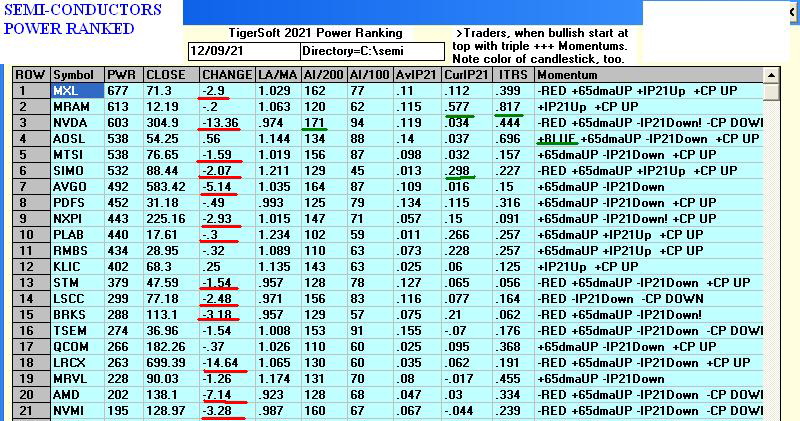 |
 |
 |
 |
 |
Table 1 QUICKSILVER on ETFS - 12/9/2021 Bullish = 2 - SOXL (+.669), TECL Bearish = 2 - IBB, RSX ETF CLOSE CHANGE PIVOT-PT 5-dma AROC CL-PWR CANDLE IP21 ITRS POWER INDEX --------------------------------------------------------------------------------------------- DIA 358.11 .12 346.24 163.2% Bearish BLUE -.059 0 ----- --------------------------------------------------------------------------------------------- SPY 466.35 -3.17 453.42 97% Bearish RED -.078 .032 -.046 --------------------------------------------------------------------------------------------- QQQ 393.73 -5.88 383.13 48.8% Bearish RED -.009 .054 .045 --------------------------------------------------------------------------------------------- MDY 506.72 -7.57 492.58 66.6% Bearish RED -.097 -.004 -.101 --------------------------------------------------------------------------------------------- IWM 220.52 -5.11 214.71 29.7% Bearish RED -.157 -.043 -.2 --------------------------------------------------------------------------------------------- FAS 129.35 -1.72 121.55 69.2% Bearish BLUE -.083 .026 -.057 --------------------------------------------------------------------------------------------- RETL 38.52 -1.99 36.69 -54.8% Bearish RED -.078 -.157 -.235 --------------------------------------------------------------------------------------------- SOXL 65.9 -4.79 62.93 199.9% ------- RED .068 .601 .669 --------------------------------------------------------------------------------------------- TECL 83.34 -3.08 75.02 268.6% ------- RED .076 .398 .474 --------------------------------------------------------------------------------------------- IBB 149.52 -3.16 148.39 -57.1% Bearish RED -.139 -.115 -.254 --------------------------------------------------------------------------------------------- GLD 165.88 -1.02 166.63 19.2% Bearish RED -.164 -.013 -.177 --------------------------------------------------------------------------------------------- OIH 193.49 -1.6 180.11 324.9% ------- BLUE -.109 -.071 -.18 --------------------------------------------------------------------------------------------- UUP 25.79 .09 25.77 1.9% ------- ---- .057 -.024 .033 --------------------------------------------------------------------------------------------- CORN 25.79 .09 25.77 1.9% Bearish ---- -.061 .224 .163 --------------------------------------------------------------------------------------------- YINN 9.8 -.01 8.78 186.1% Bearish ---- -.076 -.057 -.133 --------------------------------------------------------------------------------------------- RSX 28.18 -.11 28.82 -171.4% Bearish RED -.277 -.104 -.381 |
Table 2 Count of Stocks in Key Directories
20211209
-------------------------------
NEWHIGHS 108
NEWLOWS 142
MAXCP 4
MINCP 91
TTTNH 16
TTTNL 40
CPCROSSA 18
CPCROSSD 107
ACCUMVER 251
HIGHIP21 3
HIUPPCT 11
REDSELL 225
AUGSELS7 73
TRAPDOOR 8
|
Table 3 RANKING OF KEY DIRECTORIES BASED PCT.OF STOCKS ABOVE 65-DMA
12/9/21
Bullish = 20
Bearish = 27
--------------------------------------------------------------------------------------- Directory Current day-1 day-2 day-3 day-4 day-5 ---------------------------------------------------------------------------------------- HOMEBLDG .941 .941 .941 .941 .882 .941 UTILITY .631 .763 .71 .631 .315 .263 SEMI .608 .67 .67 .525 .505 .525 COMPUTER .6 .6 .7 .55 .55 .5 REGBANKS .6 .72 .76 .88 .36 .68 NIFTY .595 .617 .595 .51 .425 .489 SP500 .586 .644 .628 .542 .421 .457 AUTO .584 .641 .698 .603 .528 .547 NASD-100 .577 .618 .639 .567 .474 .494 CHEM .565 .63 .586 .478 .478 .478 REIT .561 .646 .592 .553 .376 .392 INDEXES .554 .652 .652 .456 .385 .418 TRANSP .55 .55 .6 .6 .5 .35 RUS-1000 .545 .601 .583 .51 .389 .426 SP-100 .544 .544 .566 .466 .377 .4 DJI-13 .538 .538 .615 .384 .307 .307 FIDSTKS .52 .556 .568 .455 .355 .396 INSURANC .52 .52 .48 .48 .32 .36 ELECTRON .518 .601 .578 .458 .436 .451 HIGHPRIC .503 .597 .547 .42 .344 .427 ========================================================================================= BEVERAGE .5 .571 .571 .571 .357 .357 COPPER .5 .75 .375 .5 .25 .375 ========================================================================================= RETAIL .489 .51 .574 .468 .446 .468 INDMATER .472 .541 .527 .5 .375 .388 FINANCE .469 .493 .567 .518 .345 .53 DOWJONES .466 .466 .533 .4 .3 .266 INFRA .424 .484 .484 .363 .272 .333 GREEN .421 .421 .421 .315 .157 .368 OILGAS .4 .476 .438 .352 .295 .304 HACKERS .388 .444 .388 .388 .388 .388 BONDFUND .367 .333 .31 .287 .298 .298 FOOD .367 .367 .346 .326 .306 .285 SOFTWARE .357 .428 .392 .339 .232 .303 COMODITY .35 .4 .325 .325 .275 .25 COAL .333 .333 .333 .333 .166 .166 EDU .333 .333 .333 .333 .333 .333 HOSPITAL .312 .312 .25 .25 .062 .187 GUNS .307 .384 .307 .307 .153 .153 MILITARY .307 .269 .23 .192 .115 .076 BIGBANKS .285 .285 .571 .142 0 .285 CHINA .274 .294 .294 .254 .235 .235 GOLD .217 .326 .282 .282 .173 .26 ETFS .196 .285 .285 .125 .107 .125 BIOTECH .157 .212 .198 .129 .151 .179 GAMING .157 .368 .157 .157 .105 .157 JETS .153 .153 0 0 0 0 SOLAR .125 .125 .125 .062 .062 .187 LOWPRICE .101 .121 .108 .086 .075 .103 MARIJUAN 0 0 0 .166 0 .166 |
==================================================================================
==================================================================================
12/09/2021 Thursday 5:45 AM Data used through 12/8/2021
Futures: DJI = -130 NASDAQ
-55
| Buy B19. But the DJI is now 0.7% above its 21-day with
all its internal strength indicators negative. Short-Term rates are rising and now above 0.6%. This caused GS and JPM to weaken today. Look at the indexes below. Each is at resistance with negative IP21 and falling Closing Power. A minor retreat seems in order. Most likely, we will see a rally after December 16th that will take the DJI to a top near year-end. If there is no rally as December ends, that itself will bring a Sell. The most bullish behavior now would be a big improvement in breadth and a steep rise in the negative Accumulation Index. Charts - 12/8/2021 2021 PEERLESS DJI, Signals, Indicators Daily DJI Volume 10-DayUp/Down Vol Stoch-20 Inverted Traders Index Graph of Pct of All Stocks above 65-dma Cum. Inverted Traders Index DJI-IPA DJI-OBV NASDAQ S&P OEX NYSE COMPQX DJI-15 DJI-20 DJI-30 DIA QQQ SPY IWM TNA Short-Term Rates DOLLAR-UUP ALLSTOCKs recent 2006 vers-Peerless signals http://tigersoftware.com/NEWPEER/UPD71208BMP MDY - http://www.tigersoftware.com/CHARTZ/MDY.GIF USO-CrudeOil DBO FAS GLD BBH IBB JETS JNUG KOL NUGT OIH PALL RSX RETL SDS AGQ SLV SOXL TAN TECL TLT TMF TNA UGA (gasoline) USO (oil) a nd China: YINN CHAU Commodities: CANE CORN DBC JJC, NIB CORN, CUT (paper) MOO, SOYB WEAT UUP (Dollar) LIT (Lithium) STOCKS: MRNA DIS GE PYPL GME ZOM XLE NRGU AAPL ADBE ALXN AMAT AMGN AMD AMZN AXP BA BABA BAC BIDU BLDP CAT CRM CVX CMG DE ENPH FB GILD GOOG GS HD IBM INTU JPM LRCX M MRK MSFT NEM NFLX NKE NKE NVDA PG PYPL REGN REV SO SQ QCOM QDEL TSLA TXN XOM V VRTX WFC WMT ZM Bullish MAXCPs http://tigersoftware.com/UPPER/12-8AA/BULLISH.htm Bearish MAXCPs http://tigersoftware.com/DOWNER/12-8-A/BEARISH.htm |
 |
| |
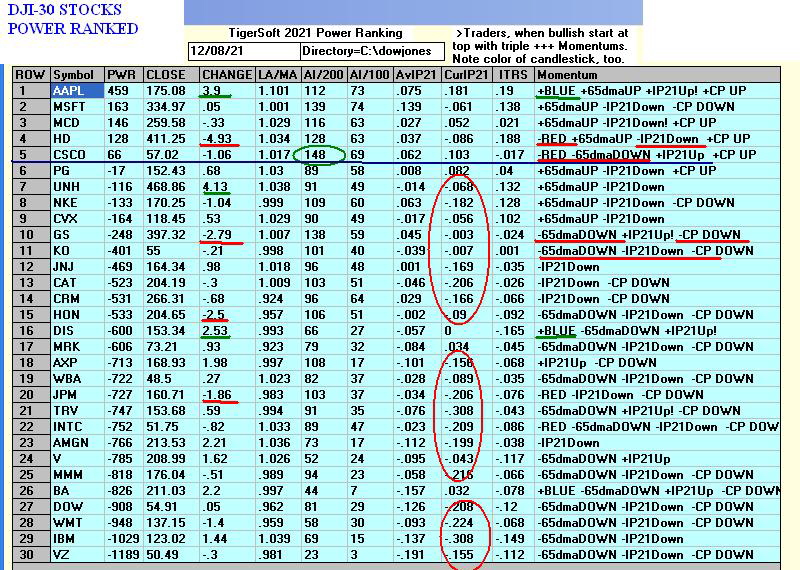 |
 |
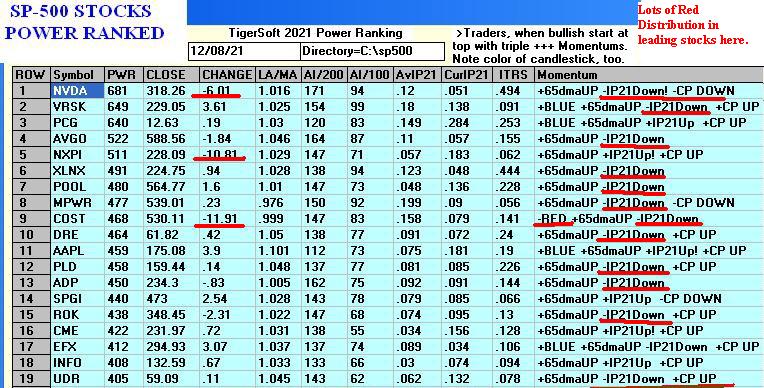 |
 |
 |
 |
 |
 |
|
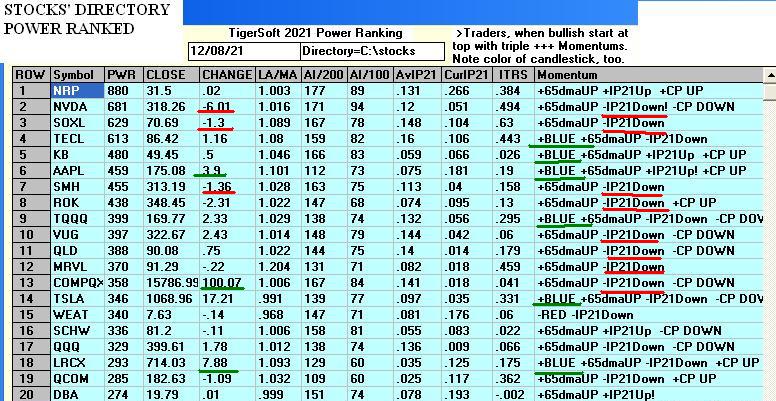 |
Table 1 QUICKSILVER on ETFS - 12/8/2021 Bullish = 2 - SOXL (+.734), TECL Bearish = 2 - IBB, RSX ETF CLOSE CHANGE PIVOT-PT 5-dma AROC CL-PWR CANDLE IP21 ITRS POWER INDEX --------------------------------------------------------------------------------------------- DIA 357.99 .25 346.61 251.3% Bearish RED -.061 ----- -.061 --------------------------------------------------------------------------------------------- SPY 469.52 1.24 457.4 207.8% Bearish BLUE -.052 .039 -.013 --------------------------------------------------------------------------------------------- QQQ 399.61 1.78 389.91 160.6% Bearish BLUE .009 .066 .075 --------------------------------------------------------------------------------------------- MDY 514.29 2.65 500 285.2% Bearish BLUE -.054 .01 -.044 --------------------------------------------------------------------------------------------- IWM 225.63 1.53 219.21 283.6% Bearish BLUE -.114 -.024 -.138 --------------------------------------------------------------------------------------------- FAS 131.07 -1.63 127.58 535.4% Bearish RED -.068 .045 -.023 --------------------------------------------------------------------------------------------- RETL 40.51 -.75 38.95 489.8% Bearish RED -.033 -.115 -.148 --------------------------------------------------------------------------------------------- SOXL 70.69 -1.3 63.25 581.1% ------- RED .104 .63 .734 --------------------------------------------------------------------------------------------- TECL 86.42 1.16 79.01 606.8% ------- BLUE .106 .443 .549 --------------------------------------------------------------------------------------------- IBB 152.68 1.71 151.23 65% Bearish BLUE -.162 -.102 -.264 --------------------------------------------------------------------------------------------- GLD 166.9 .09 165.24 22.3% Bearish BLUE -.114 -.014 -.128 --------------------------------------------------------------------------------------------- OIH 195.09 2.98 181.34 551% ------- BLUE -.1 -.075 -.175 --------------------------------------------------------------------------------------------- UUP 25.7 -.12 25.78 -13.6% ------- RED .052 -.023 .029 --------------------------------------------------------------------------------------------- CORN 25.7 -.12 25.78 -13.6% ------- RED -.043 .217 .174 --------------------------------------------------------------------------------------------- YINN 9.81 .13 9.45 279.6% Bearish BLUE -.084 -.079 -.163 --------------------------------------------------------------------------------------------- RSX 28.29 -.31 29.16 -50.6% ------- ---- -.266 -.108 -.374 |
Table 2 Count of Stocks in Key Directories
2021-12-08
-------------------------------
NEWHIGHS 132 vs 162
NEWLOWS 65 vs 89
MAXCP 12
MINCP 51
TTTNH 15
TTTNL 23
CPCROSSA 48
CPCROSSD 30
ACCUMVER 251
HIGHIP21 4
HIUPPCT 16
REDSELL 225
AUGSELS7 69
TRAPDOOR 5
|
Table 3 RANKING OF KEY DIRECTORIES BASED PCT.OF STOCKS ABOVE 65-DMA
12/8/2021
Bullish = 24
Bearish = 25
---------------------------------------------------------------------------------------
Directory Current day-1 day-2 day-3 day-4 day-5
----------------------------------------------------------------------------------------
HOMEBLDG .941 .941 .941 .882 .882 .705
UTILITY .763 .71 .631 .315 .263 .184
COPPER .75 .375 .5 .25 .375 .125
REGBANKS .72 .76 .88 .36 .64 .2
SEMI .67 .67 .525 .505 .525 .515
INDEXES .652 .652 .456 .385 .418 .298 REIT .646 .584 .553 .376 .392 .238 SP500 .644 .628 .542 .421 .461 .311 AUTO .641 .698 .603 .528 .547 .471 CHEM .63 .586 .478 .478 .478 .456 NASD-100 .618 .639 .567 .474 .494 .432 NIFTY .617 .595 .51 .446 .468 .446 ELECTRON .601 .578 .458 .436 .451 .421 RUS-1000 .601 .583 .51 .389 .427 .279 COMPUTER .6 .7 .55 .55 .5 .5 HIGHPRIC .597 .547 .42 .344 .427 .304 BEVERAGE .571 .571 .571 .357 .357 .357 FIDSTKS .556 .568 .455 .355 .402 .313 TRANSP .55 .6 .6 .5 .35 .3 SP-100 .544 .566 .466 .377 .4 .311 INDMATER .541 .527 .5 .375 .388 .277 DJI-13 .538 .615 .384 .307 .307 .23 INSURANC .52 .48 .48 .32 .36 .24 RETAIL .51 .574 .468 .446 .468 .425 =============================================================================================== FINANCE .493 .567 .518 .345 .53 .246 INFRA .484 .484 .363 .272 .333 .212 DOWJONES .466 .533 .4 .3 .266 .233 OILGAS .462 .424 .339 .283 .292 .216 HACKERS .444 .388 .388 .388 .388 .388 SOFTWARE .428 .392 .339 .232 .303 .285 GREEN .421 .421 .315 .157 .368 .21 COMODITY .4 .325 .325 .275 .25 .3 GUNS .384 .307 .307 .153 .153 .153 GAMING .368 .157 .157 .105 .157 .105 FOOD .367 .346 .326 .306 .285 .285 BONDFUND .333 .31 .287 .298 .287 .379 COAL .333 .333 .333 .166 .166 .166 EDU .333 .333 .333 .333 .333 .333 GOLD .326 .282 .282 .173 .26 .195 HOSPITAL .312 .25 .25 .062 .187 0 CHINA .294 .294 .254 .235 .235 .176 BIGBANKS .285 .571 .142 0 .285 0 ETFS .285 .285 .125 .107 .125 .089 MILITARY .269 .23 .192 .115 .076 .038 BIOTECH .212 .198 .129 .151 .174 .171 JETS .153 0 0 0 0 0 SOLAR .125 .125 .062 .062 .187 .25 LOWPRICE .124 .106 .086 .076 .104 .091 MARIJUAN 0 0 .166 0 .166 0 |
====================================================================================
====================================================================================
12/08/2021 Wesdesday 5:45 AM Data used through 12/7/2021
Futures: DJI = +56 NASDAQ +16
| Buy B19. DIA's Closing Power uptrend is
still intact. Expect it to make a top at end of the month near its 2.5%-4.0% upper band. Let's see if tech stocks can take back the leadership. The DJIA did its job perfectly. Having tagged the key support level down at 34000, it was bought heavily by Professionals before the opening and afterwards so that it rose almost 1800 points. Now 0.5% over its 21-day ma, we see all the Peerless internals are still negative. This could set up a dangerous Sell S9/S12, as took place on December 10th, 2007, also following a Buy B19 reversal day up. It would be helpful to the bulls if the DJI went no higher here and did not approach the upper band where we will almost certainly get a Sell S9/S12, just as in December 2007. That would be dangerous and could lead to a bear market, especially if the bank stocks do not improve much internally. Making that a real risk now is the rise by short-term rates above 1/2% for the first time in many months. The FAS Closing Power did turn up today, but it is lagging. The DJI's advance did improve markedly the ratio of new highs to new lows. Smaller company stocks (See TNX below) also got a boost. The Public has been made more optimistic. The real change brought about by the DJI rally was in tech stocks, especially semi-conductos. They are attempting to take the lead back from defensive stocks. Watch what SOXL can do tomorrow now that it is back to its recent highs. Will it fall back or retake the lead? We have no previous early December Buy B19 (reversal days) going all the way back to 1929 to guide us abut how high the DJI may go in here. But the evidence is strong for the first year-ends in the full year after a Preidential Election that therewill be a significant top at the very end of December or next January. (See yesterday's Hotline.) As long as your shorts do not have their Closing Powers get above their falling 21-day ma hold them short. SOXL did not close below 59, so I hope some of you are still long it. Look for stocks in trading ranges or uptrends that give Red Stochastic Buys and show a high success rate, like RETL and TNX) to buy. Charts - 12/8/2021 2021 PEERLESS DJI, Signals, Indicators Daily DJI Volume 10-DayUp/Down Vol Stoch-20 Inverted Traders Index Graph of Pct of All Stocks above 65-dma Cum. Inverted Traders Index DJI-IPA DJI-OBV NASDAQ S&P OEX NYSE COMPQX DJI-15 DJI-20 DJI-30 DIA QQQ SPY IWM TNA Short-Term Rates DOLLAR-UUP ALLSTOCKs recent 2006 vers-Peerless signals http://tigersoftware.com/NEWPEER/UPD71208BMP MDY - http://www.tigersoftware.com/CHARTZ/MDY.GIF USO-CrudeOil DBO FAS GLD BBH IBB JETS JNUG KOL NUGT OIH PALL RSX RETL SDS AGQ SLV SOXL TAN TECL TLT TMF TNA UGA (gasoline) USO (oil) a nd China: YINN CHAU Commodities: CANE CORN DBC JJC, NIB CORN, CUT (paper) MOO, SOYB WEAT UUP (Dollar) LIT (Lithium) STOCKS: MRNA DIS GE PYPL GME ZOM XLE NRGU AAPL ADBE ALXN AMAT AMGN AMD AMZN AXP BA BABA BAC BIDU BLDP CAT CRM CVX CMG DE ENPH FB GILD GOOG GS HD IBM INTU JPM LRCX M MRK MSFT NEM NFLX NKE NKE NVDA PG PYPL REGN REV SO SQ QCOM QDEL TSLA TXN XOM V VRTX WFC WMT ZM Bullish MAXCPs http://tigersoftware.com/UPPER/12-8/BULLISH.htm Bearish MAXCPs http://tigersoftware.com/DOWNER/12-8/BEARISH.htm |
 |
 |
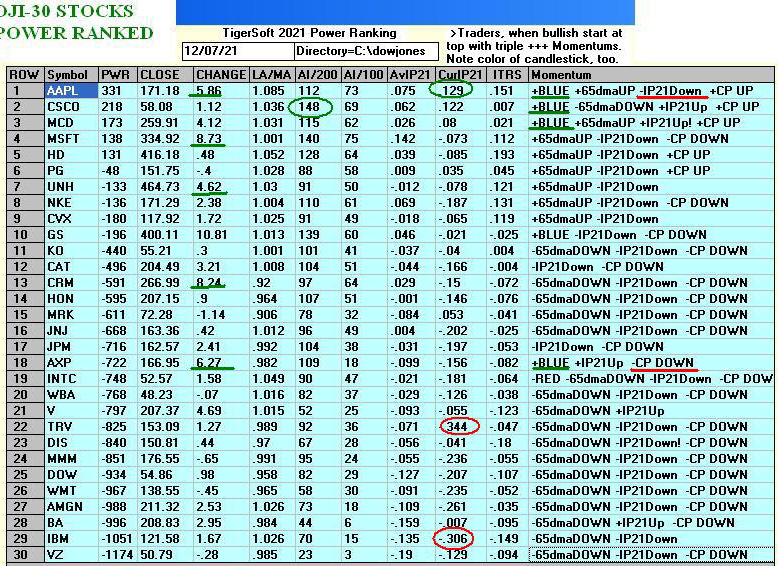 |
 |
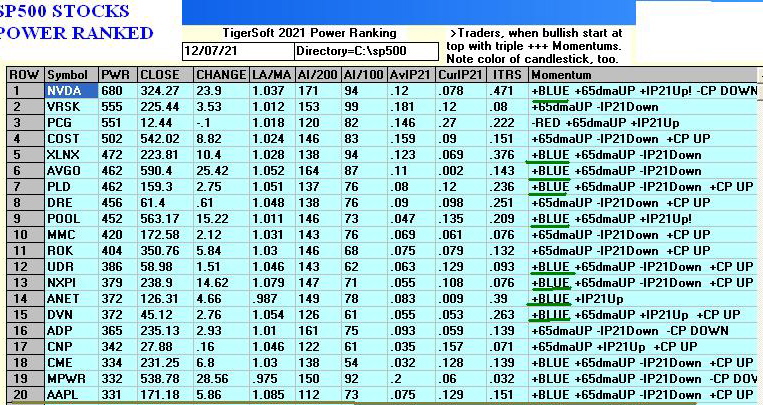 |
 |
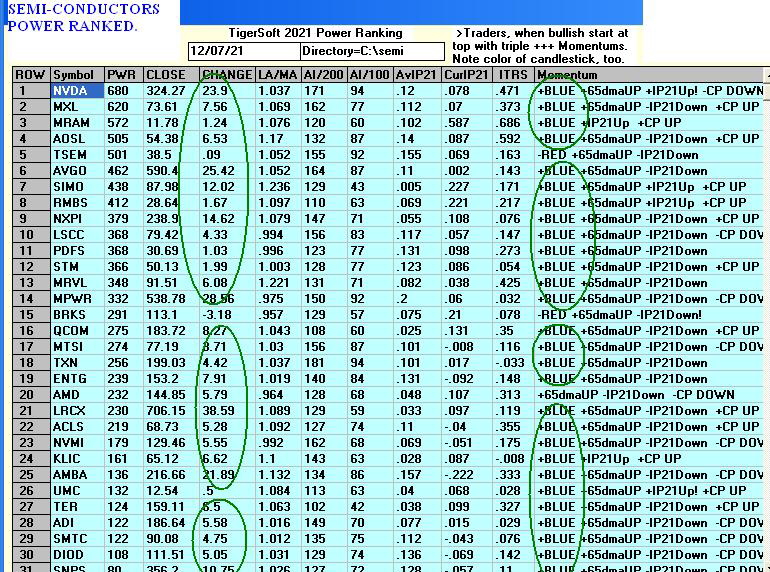 |
 |
 |
 |
 |
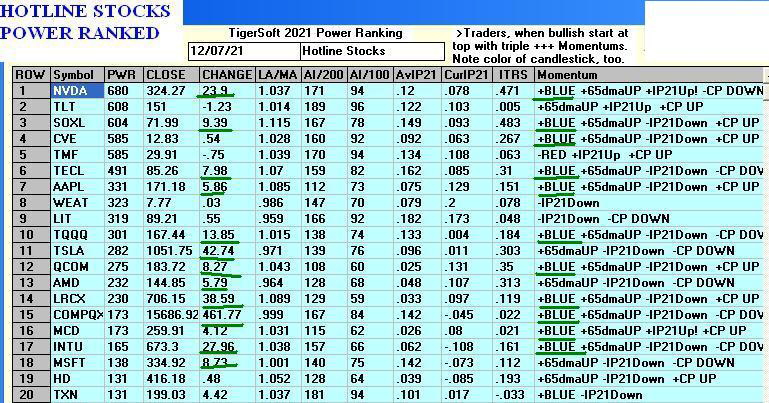 |
Table 1 QUICKSILVER on ETFS - 12/8/1 Bullish = 2 - SOXL (+.576), TECL, CORN Bearish = 3 - IBB, RSX ETF CLOSE CHANGE PIVOT-PT 5-dma AROC CL-PWR CANDLE IP21 ITRS POWER INDEX --------------------------------------------------------------------------------------------- DIA 357.74 4.92 340.46 185.4% Bearish BLUE -.074 0 --- --------------------------------------------------------------------------------------------- SPY 468.28 9.49 450.5 139.7% Bearish BLUE -.091 .032 -.059 --------------------------------------------------------------------------------------------- QQQ 397.83 11.63 387.12 51.7% Bearish BLUE -.032 .048 .016 --------------------------------------------------------------------------------------------- MDY 511.64 8.66 485.85 180.2% Bearish BLUE -.109 .006 -.103 --------------------------------------------------------------------------------------------- IWM 224.1 5.08 213.26 136.7% Bearish BLUE -.156 -.037 -.193 --------------------------------------------------------------------------------------------- FAS 132.7 6.52 117.67 448.2% Bearish BLUE -.072 .023 -.049 --------------------------------------------------------------------------------------------- RETL 41.26 2.46 36.74 61.2% Bearish BLUE -.028 -.132 -.16 --------------------------------------------------------------------------------------------- SOXL 71.99 9.39 63.16 578% Bullish BLUE .093 .483 .576 --------------------------------------------------------------------------------------------- TECL 85.26 7.98 76.87 324.4% ------- BLUE .085 .31 .395 --------------------------------------------------------------------------------------------- IBB 150.97 5.7 150.74 -108.4% Bearish BLUE -.186 -.125 -.311 --------------------------------------------------------------------------------------------- GLD 166.81 .59 166.16 39.5% Bearish BLUE -.128 -.007 -.135 --------------------------------------------------------------------------------------------- OIH 192.11 5.92 174.93 381.6% ------- BLUE -.12 -.07 -.19 --------------------------------------------------------------------------------------------- UUP 25.82 .01 25.77 23.3% Bullish RED .068 .003 .071 --------------------------------------------------------------------------------------------- CORN 25.82 .01 25.77 23.3% ------- RED .091 .241 .332 --------------------------------------------------------------------------------------------- YINN 9.68 .39 9.29 178.7% Bearish ---- -.073 -.072 -.145 --------------------------------------------------------------------------------------------- RSX 28.6 .52 28.58 56% Bearish BLUE -.278 -.089 -.367 |
Table 2 Count of Stocks in Key Directories
20211208
-------------------------------
NEWHIGHS 162
NEWLOWS 89
MAXCP 10
MINCP 40
TTTNH 19
TTTNL 20
CPCROSSA 56
CPCROSSD 28
ACCUMVER 250
HIGHIP21 3
HIUPPCT 18
VHIP21 73
LOWACCUM 164
REDSELL 203
AUGSELS7 73
TRAPDOOR 3
|
Table 3 RANKING OF KEY DIRECTORIES BASED PCT.OF STOCKS ABOVE 65-DMA
12/8/21
Bullish = 24
Bearish = 25
---------------------------------------------------------------------------------------
Directory Current day-1 day-2 day-3 day-4 day-5
----------------------------------------------------------------------------------------
HOMEBLDG .941 .941 .882 .882 .705 .823
REGBANKS .76 .88 .36 .64 .2 .24
UTILITY .71 .631 .315 .263 .184 .157
COMPUTER .7 .55 .55 .5 .5 .55
AUTO .698 .603 .528 .547 .471 .509
SEMI .67 .525 .505 .525 .515 .546
-Jump-
INDEXES .652 .456 .385 .418 .298 .38
NASD-100 .639 .567 .474 .494 .432 .484
SP500 .628 .542 .421 .461 .311 .383
DJI-13 .615 .384 .307 .307 .23 .307
TRANSP .6 .6 .5 .35 .25 .3
NIFTY .595 .51 .446 .489 .446 .51 REIT .587 .549 .381 .396 .244 .358 CHEM .586 .478 .478 .478 .456 .478 RUS-1000 .584 .511 .39 .428 .28 .355 ELECTRON .578 .458 .436 .451 .421 .451 RETAIL .574 .468 .446 .468 .425 .51 BEVERAGE .571 .571 .357 .357 .357 .357 BIGBANKS .571 .142 0 .285 0 .142 FIDSTKS .568 .455 .355 .402 .307 .343 FINANCE .567 .518 .345 .53 .259 .296 SP-100 .566 .466 .377 .4 .311 .333 HIGHPRIC .547 .42 .344 .427 .307 .405 DOWJONES .533 .4 .3 .266 .233 .266 INDMATER .527 .5 .375 .388 .291 .375 ========================================================================================= INFRA .484 .363 .272 .333 .212 .242 INSURANC .48 .48 .32 .36 .24 .24 OILGAS .433 .349 .292 .301 .235 .311 GREEN .421 .315 .157 .368 .21 .315 SOFTWARE .392 .339 .232 .303 .285 .392 HACKERS .388 .388 .388 .388 .333 .5 COPPER .375 .5 .25 .375 .125 .375 FOOD .346 .326 .306 .285 .285 .285 COAL .333 .333 .166 .166 .166 .333 EDU .333 .333 .333 .333 .333 .333 COMODITY .325 .325 .275 .25 .275 .275 BONDFUND .31 .287 .298 .287 .379 .367 GUNS .307 .307 .153 .153 .153 .461 CHINA .294 .254 .235 .235 .176 .196 ETFS .285 .125 .107 .125 .107 .142 GOLD .282 .282 .173 .26 .195 .347 HOSPITAL .25 .25 .062 .187 0 .125 MILITARY .23 .192 .115 .076 .038 .038 BIOTECH .198 .129 .151 .174 .165 .196 GAMING .157 .157 .105 .157 .105 .157 SOLAR .125 .062 .062 .187 .25 .5 LOWPRICE .109 .083 .076 .104 .093 .119 JETS 0 0 0 0 0 0 MARIJUAN 0 .166 0 .166 0 0 |
================================================================================================
================================================================================================
12/07/2021 Tuesday 5:50 AM Data used through 12/6/2021
Futures: DJI = +351 NASDAQ +303
| The DJI is up nearly 1000 points since last
Friday's close but the Peerless internals are mostly deeply negative. The DJI is now 1% below the 21-day ma and recovered about half what it lost in the recent decline. Most of the market is lagging noticeably. See the charts below. I warned that we might see a top and a significant decline at the end of the year if 2021 acts like the other years after a Presidential Election since 2001. But there is another more dangerous scenario. That would be like the top in December 2007 when the DJI reached its 4% upper band on December 10th with much less negative IP21 and V-I readings and a positive P-I. Back then, we could see the tops in the big banks and mortgage companies. I mentioned how bearish the biggest US bank, JPM, looked last night. Also bearish is article about Tesla in the NY Tmes this morning about how unsafe driver-less Tesla cars are. This is not hurting their opening today. That will be impressive if the NASDAQ's rise of 300 at the opening can be built upon during the day. Reits go up when interest rates are low and rents are rising. Reits' and Housing stocks' leaders would seem to be favored now. But for how long? Meanwhile, the President is blasting how high drug prices are in the US. That dropped them as a group to their support levels. Charts - 12/6/2021 2021 PEERLESS DJI, Signals, Indicators Daily DJI Volume 10-DayUp/Down Vol Stoch-20 Inverted Traders Index Graph of Pct of All Stocks above 65-dma Cum. Inverted Traders Index DJI-IPA DJI-OBV NASDAQ S&P OEX NYSE COMPQX DJI-15 DJI-20 DJI-30 DIA QQQ SPY IWM TNA Short-Term Rates DOLLAR-UUP ALLSTOCKs recent 2006 vers-Peerless signals http://tigersoftware.com/NEWPEER/UPD71206BMP MDY - http://www.tigersoftware.com/CHARTZ/MDY.GIF USO-CrudeOil DBO FAS GLD BBH IBB JETS JNUG KOL NUGT OIH PALL RSX RETL SDS AGQ SLV SOXL TAN TECL TLT TMF TNA UGA (gasoline) USO (oil) a nd China: YINN CHAU Commodities: CANE CORN DBC JJC, NIB CORN, CUT (paper) MOO, SOYB WEAT UUP (Dollar) LIT (Lithium) STOCKS: MRNA DIS GE PYPL GME ZOM XLE NRGU AAPL ADBE ALXN AMAT AMGN AMD AMZN AXP BA BABA BAC BIDU BLDP CAT CRM CVX CMG DE ENPH FB GILD GOOG GS HD IBM INTU JPM LRCX M MRK MSFT NEM NFLX NKE NKE NVDA PG PYPL REGN REV SO SQ QCOM QDEL TSLA TXN XOM V VRTX WFC WMT ZM Bullish MAXCPs http://tigersoftware.com/UPPER/12-6/BULLISH.htm Bearish MAXCPs http://tigersoftware.com/DOWNER/12-6/BEARISH.htm |
|
DJIA is trying to save market. It along with defensive utilities and REITs is getting most of the bulls' attentiion and is trying to close its gap downward.  |
Professionals are buying DIA aggressively |
|
Big money is selling into rally of individual DJI-30 stocks. Look at how many show red Distribution (IP21). 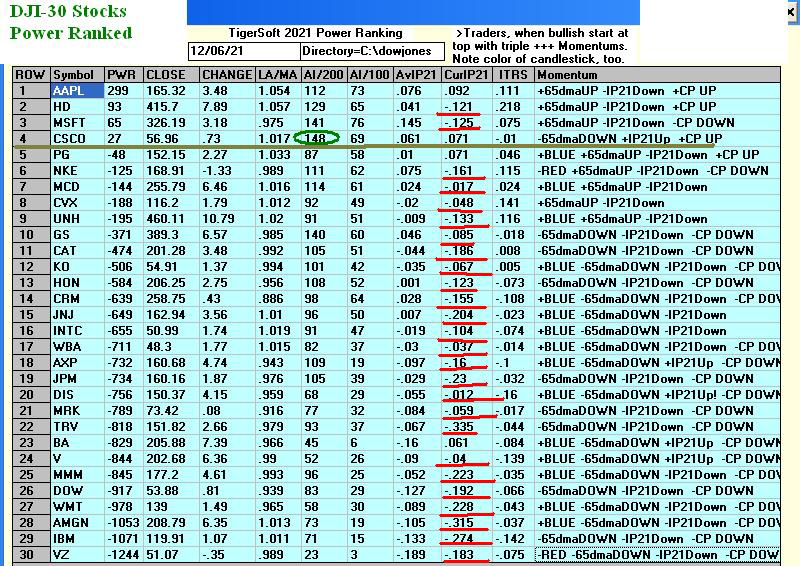 |
|
SPY has turned up from its rising 65-dma despite head/shoulders caused by Covid fears. NYSE Professionals remain cautious because of many weak high techs.  |
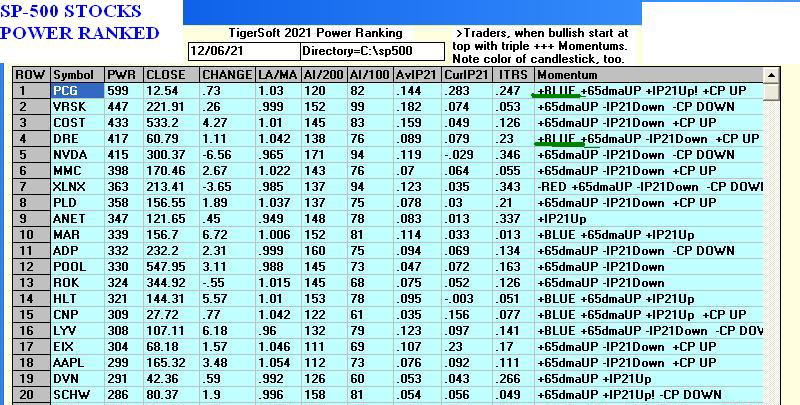 |
|
Most techs are weaker than DJI, especially Biotechs.  |
 |
 |
 |
Big Banks are recovering |
|
Table 1 QUICKSILVER on ETFS - 12/6/2021 Bullish = 2 - SOXL (+.336), CORN Bearish = 3 - IBB, RSX ETF CLOSE CHANGE PIVOT-PT 5-dma AROC CL-PWR CANDLE IP21 ITRS POWER INDEX --------------------------------------------------------------------------------------------- DIA 352.82 6.58 344.9 23.6% Bearish BLUE -.095 ----- ------ --------------------------------------------------------------------------------------------- SPY 458.79 5.37 455.56 -63.7% Bearish BLUE -.15 .019 -.131 --------------------------------------------------------------------------------------------- QQQ 386.2 3.07 393.82 -172.6% Bearish BLUE -.08 .02 -.06 --------------------------------------------------------------------------------------------- MDY 502.98 10.4 493.8 -40.9% Bearish BLUE -.109 .01 -.099 --------------------------------------------------------------------------------------------- IWM 219.02 4.31 218.17 -83.9% Bearish BLUE -.159 -.032 -.191 --------------------------------------------------------------------------------------------- FAS 126.18 4.63 121.68 -212.9% Bearish BLUE -.109 .022 -.087 --------------------------------------------------------------------------------------------- RETL 38.8 2.11 40.79 -719.7% Bearish BLUE -.019 -.13 -.149 --------------------------------------------------------------------------------------------- SOXL 62.6 -.33 64.67 -450.5% Bearish BLUE .045 .291 .336 --------------------------------------------------------------------------------------------- TECL 77.28 2.26 80.22 -316.5% Bearish BLUE .028 .161 .189 --------------------------------------------------------------------------------------------- IBB 145.27 -3.12 154.22 -354.6% Bearish RED -.212 -.162 -.374 --------------------------------------------------------------------------------------------- GLD 166.22 -.41 165.5 -12% Bearish BLUE -.086 .004 -.082 --------------------------------------------------------------------------------------------- OIH 186.19 6.08 178.36 71.5% ------- BLUE -.142 -.036 -.178 --------------------------------------------------------------------------------------------- UUP 25.81 .04 25.7 -1.9% Bullish ---- .159 .016 .175 --------------------------------------------------------------------------------------------- CORN 25.81 .04 25.7 -1.9% ------- ---- .211 .263 .474 --------------------------------------------------------------------------------------------- YINN 9.29 .51 9.35 -123.9% Bearish BLUE -.096 -.058 -.154 --------------------------------------------------------------------------------------------- RSX 28.08 -.74 28.28 -43.7% Bearish RED -.307 -.082 -.389 |
Table 2 Count of Stocks in Key Directories
20211206
-------------------------------
NEWHIGHS 96
NEWLOWS 794 Bearish
MAXCP 8
MINCP 63 Bearish
TTTNH 27
TTTNL 82
CPCROSSA 68
CPCROSSD 19
ACCUMVER 249
HIGHIP21 4
HIUPPCT 9
VHIP21 79
REDSELL 203
AUGSELS7 61
TRAPDOOR 3
|
Table 3 RANKING OF KEY DIRECTORIES BASED PCT.OF STOCKS ABOVE 65-DMA
12/6/21
Bullish = 14
Bearish = 33
---------------------------------------------------------------------------------------
Directory Current day-1 day-2 day-3 day-4 day-5
----------------------------------------------------------------------------------------
HOMEBLDG .941 .882 .882 .705 .823 .882
REGBANKS .88 .36 .64 .2 .24 .52
UTILITY .631 .315 .263 .184 .157 .368
AUTO .603 .528 .547 .471 .509 .584
TRANSP .6 .5 .35 .25 .35 .55
BEVERAGE .571 .357 .357 .357 .357 .357 NASD-100 .567 .474 .494 .432 .484 .587 COMPUTER .55 .55 .5 .5 .55 .55 REIT .549 .374 .396 .244 .358 .412 SP500 .542 .421 .461 .311 .383 .546 SEMI .525 .505 .525 .515 .536 .618 FINANCE .518 .345 .53 .259 .32 .506 RUS-1000 .511 .39 .428 .28 .358 .534 NIFTY .51 .446 .489 .446 .51 .595 ========================================================================================= COPPER .5 .25 .375 .125 .25 .25 INDMATER .5 .375 .388 .291 .361 .486 ========================================================================================= INSURANC .48 .32 .36 .24 .24 .44 CHEM .478 .478 .478 .456 .478 .608 RETAIL .468 .446 .468 .425 .51 .659 SP-100 .466 .377 .4 .311 .344 .433 ELECTRON .458 .436 .451 .421 .451 .556 INDEXES .456 .385 .418 .298 .385 .576 FIDSTKS .455 .355 .402 .307 .343 .467 HIGHPRIC .421 .345 .429 .309 .41 .523 DOWJONES .4 .3 .266 .233 .266 .3 HACKERS .388 .388 .388 .333 .5 .555 DJI-13 .384 .307 .307 .23 .307 .384 INFRA .363 .272 .333 .212 .212 .333 OILGAS .349 .292 .301 .235 .311 .386 SOFTWARE .339 .232 .303 .285 .392 .428 COAL .333 .166 .166 .166 .333 .333 EDU .333 .333 .333 .333 .333 .333 FOOD .326 .306 .285 .285 .285 .326 COMODITY .325 .275 .25 .275 .275 .275 GREEN .315 .157 .368 .21 .315 .578 GUNS .307 .153 .153 .153 .384 .384 BONDFUND .287 .298 .287 .379 .379 .321 GOLD .282 .173 .26 .195 .326 .434 CHINA .254 .235 .235 .176 .215 .196 HOSPITAL .25 .062 .187 0 .125 .25 MILITARY .192 .115 .076 .038 .038 .076 MARIJUAN .166 0 .166 0 0 .333 GAMING .157 .105 .157 .105 .21 .315 BIGBANKS .142 0 .285 0 .142 .285 BIOTECH .129 .151 .174 .165 .196 .212 ETFS .125 .107 .125 .107 .142 .125 LOWPRICE .086 .073 .103 .093 .118 .149 SOLAR .062 .062 .187 .25 .437 .562 JETS 0 0 0 0 0 0 |
===================================================================
===================================================================
12/06/2021 Monday 4:20 AM Data used through 12/3/2021
Futures: DJI = +235 NASDAQ -49
| Peerless now has a Buy B19 operating. The probability is
good that the DJI will recover 33% to 50% of what it lost in its recent sell-off, then pullback before going back upwards in the last two weeks of December to a point 1.7% or higher above the 21-day ma. The problem is the dark shadow of the bear looms over the market in the fact that there were well more than 900 new lows today, combining the NYSE and the NASDAQ. December tends to be bullish, but the odds greatly favor the many new lows in our Bearish MINCPs going still lower under the weight of negative window-dressing and tax-loss selling. I hope you have chosen a handful of these the weakest to be short to hedge any long positions. With the DJI having dropped only 6 1/2% from it highs at its recent lows, one would think that it will hard to believe that the DJI's correction is over unless the FED gets very busy propping up the bank stocks and blue chips. So far, they are neglecting this task. Table 3 below shows no financials are now above their 65-dma. This makes the market quite dangerous when the December bullishness ends. The DJI's push upwards does not mean we will see commensurate strength in tech stocks. Significantly, the NASDAQ, QQQ and TECL have not decided which way to go from here. They show bearish head and shoulders tops but they also have not broken their 65-dma decisively. A detailed study I did back in 2005 showed that many stocks with head/shoulders patterns that are completed above their 65-dma often hold up near that ma and do not drop much further. Now we advise using the Closing Power trend to judge when these case's declines are over. SOXL's high Power Ranking has fallen into the 400s from the 700s a week ago. Its IP21 has almost turned negative, its Closing Power is falling and its key price support I take to be 59. Watch it. A break- down would be a Sell and hurt all techs. The DJI can be stronger than the tech stocks now for the rest of December. Remember that the DJI-30 are supposed to be safer than most stocks. The Fed and Professionals often use them to make the general market look safer than it really is. After a big decline, they also are used to jump-start a rally. In that case, we would expect the FED to be keeping short-term rates low, which it is now. And we would expect big bank stocks (especially GS and JPM) and FAS to be showing strength and a Closing Power that has hooked back up and is zig-zagging up, too. We do have a rising DJI now before Monday's opening and we did get a Buy B19 (reversal day) up from the key support at 34050. What bulls need to see today is positive breadth, a strong Closing Power nnd ideally a recovery by the tech sector ETFs from their still strong 65-dma. Because we are in December, too, the odds would seem to favor the DJI advancing this month especially after the 17th. Odds of DJI Advancing after December 5th in Year after Presidential Election Years since 1965. Percent of Years Avg. DJI Gain over next 5 trading days 46.7% 0% over next 10 trading day 53.3% +0.4% over next 21 trading days 73.3% +1.9% over next 42 trading days 40.0% -3.2% This same seasonality since the year-end 2001-2 is clearly at work. The tops were on January 4, 2002, January 11th, 2006, January 14, 1010, December 31, 2013 and January 26th, 2018.
Charts - 12/3 /2021 |
| Charts and Tables |
 |
 |
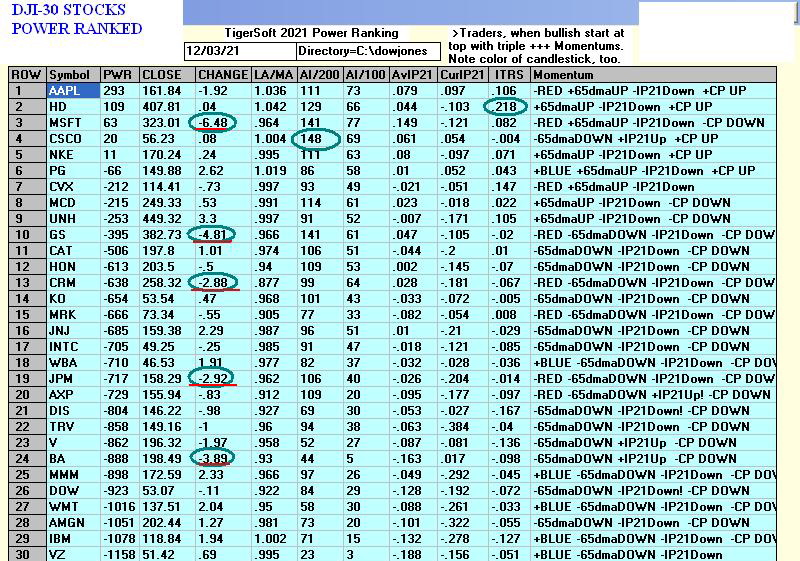 |
Very Weak Big Banks - Comparable to 2007! |
 |
 |
 |
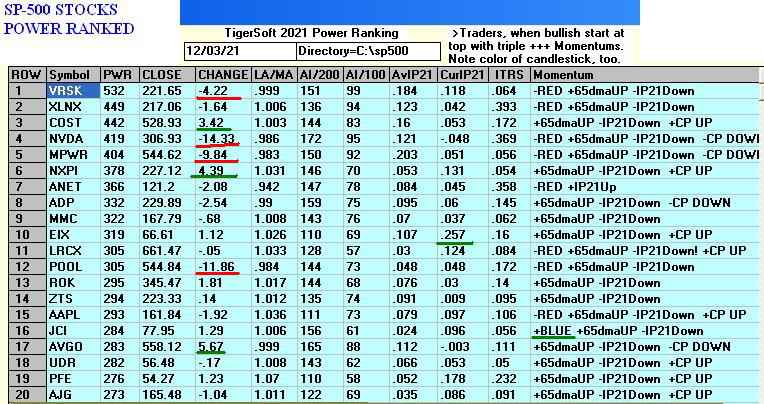 |
 |
 |
 |
Table 1 QUICKSILVER on ETFS - 12/3/1 Bullish = 2 - SOXL (+.368), CORN Bearish = 3 - IBB, YINN, RSX ETF CLOSE CHANGE PIVOT-PT 5-dma AROC CL-PWR CANDLE IP21 ITRS POWER INDEX ====================================================================================================== DIA 346.24 -.37 351.19 -40.1% Bearish RED -.11 0 ----- --------------------------------------------------------------------------------------------- SPY 453.42 -3.98 464.6 -60.7% Bearish RED -.154 .027 -.127 --------------------------------------------------------------------------------------------- QQQ 383.13 -6.78 399.69 -102.8% Bearish RED -.099 .031 -.068 --------------------------------------------------------------------------------------------- MDY 492.58 -7.42 507.04 -138.1% Bearish RED -.166 .004 -.162 --------------------------------------------------------------------------------------------- IWM 214.71 -4.5 222.67 -185.6% Bearish RED -.205 -.041 -.246 --------------------------------------------------------------------------------------------- FAS 121.55 -6.03 131.46 -340.1% Bearish RED -.12 .014 -.106 --------------------------------------------------------------------------------------------- RETL 36.69 -2.26 44.49 -1057.5% Bearish RED -.056 -.17 -.226 --------------------------------------------------------------------------------------------- SOXL 62.93 -.32 68.41 121.5% ------- RED .056 .312 .368 --------------------------------------------------------------------------------------------- TECL 75.02 -3.99 82.26 -101.9% Bearish RED .035 .148 .183 --------------------------------------------------------------------------------------------- IBB 148.39 -2.84 156.06 -212.1% Bearish RED -.223 -.143 -.366 --------------------------------------------------------------------------------------------- GLD 166.63 1.39 166.62 -6.6% Bearish BLUE -.086 .023 -.063 --------------------------------------------------------------------------------------------- OIH 180.11 -1.23 183.62 -45% Bearish RED -.186 -.047 -.233 --------------------------------------------------------------------------------------------- UUP 25.77 -.01 25.82 0% Bullish ---- .159 .035 .194 --------------------------------------------------------------------------------------------- CORN 25.77 -.01 25.82 0% Bearish ---- .204 .283 .487 --------------------------------------------------------------------------------------------- YINN 8.78 -.67 9.52 -537.9% Bearish RED -.171 -.151 -.322 --------------------------------------------------------------------------------------------- RSX 28.82 -.34 28.33 202.4% Bearish RED -.26 -.044 -.304 |
Table 2 Number of Stocks in Key Directories
20211203
-------------------------------
NEWHIGHS 55
NEWLOWS 940 Bearish
MAXCP 11
MINCP 251 Bearish
TTTNH 22
TTTNL 201 Bearish
CPCROSSA 20
CPCROSSD 81
ACCUMVER 249
HIGHIP21 5
HIUPPCT 10
VHIP21 77
REDSELL 201
AUGSELS7 40
TRAPDOOR 3
|
Table 3 RANKING OF KEY DIRECTORIES BASED PCT.OF STOCKS ABOVE 65-DMA
12/3/21
Bullish = 4
Bearish = 44
---------------------------------------------------------------------------------------
Directory Current day-1 day-2 day-3 day-4 day-5
----------------------------------------------------------------------------------------
HOMEBLDG .882 .882 .705 .823 .882 .882
COMPUTER .55 .5 .5 .55 .55 .5
AUTO .528 .547 .471 .509 .584 .66
SEMI .505 .525 .515 .536 .608 .587
-----------------------------------------------------------------------------------------
TRANSP .5 .35 .25 .35 .55 .55
-----------------------------------------------------------------------------------------
CHEM .478 .478 .456 .478 .608 .586
NASD-100 .474 .494 .432 .484 .587 .484
NIFTY .446 .489 .446 .51 .595 .553
RETAIL .446 .468 .425 .51 .659 .659
ELECTRON .436 .451 .421 .451 .548 .503
SP500 .421 .461 .311 .383 .544 .506
RUS-1000 .39 .428 .28 .358 .53 .503
HACKERS .388 .388 .333 .5 .555 .444
INDEXES .385 .418 .298 .385 .57 .532
SP-100 .377 .4 .311 .344 .433 .411
INDMATER .375 .388 .291 .361 .486 .486
REIT .374 .389 .244 .358 .412 .435
REGBANKS .36 .64 .2 .24 .48 .52
BEVERAGE .357 .357 .357 .357 .357 .5
FIDSTKS .355 .402 .307 .343 .467 .42
FINANCE .345 .53 .259 .32 .518 .518
HIGHPRIC .345 .429 .309 .41 .523 .516
EDU .333 .333 .333 .333 .333 .333
FOOD .326 .306 .346 .367 .367 .367
INSURANC .32 .36 .24 .24 .44 .48
UTILITY .315 .263 .184 .157 .342 .289
DJI-13 .307 .307 .23 .307 .384 .384
DOWJONES .3 .266 .233 .266 .3 .333
BONDFUND .295 .284 .375 .375 .318 .295
OILGAS .292 .301 .235 .311 .396 .349
COMODITY .275 .25 .275 .275 .275 .275
INFRA .272 .333 .212 .212 .333 .424
COPPER .25 .375 .125 .25 .25 .25
CHINA .235 .235 .176 .215 .196 .235
SOFTWARE .232 .303 .285 .392 .428 .41
GOLD .173 .26 .195 .326 .413 .391
COAL .166 .166 .166 .333 .333 .333
GREEN .157 .368 .21 .315 .578 .473
GUNS .153 .153 .153 .384 .384 .384
BIOTECH .151 .174 .165 .196 .212 .218
MILITARY .115 .076 .038 .038 .076 .115
ETFS .107 .125 .107 .142 .125 .142
GAMING .105 .157 .105 .21 .315 .368
LOWPRICE .076 .101 .093 .119 .149 .147
HOSPITAL .062 .187 0 .125 .25 .25
SOLAR .062 .187 .25 .437 .562 .562
BIGBANKS 0 .285 0 .142 .285 .285
^^^^
JETS 0 0 0 0 0 0
MARIJUAN 0 .166 0 0 .333 .166
|
=====================================================================================
12/03/2021 Friday 5:50 AM Data used through 12/2/2021
Futures: DJI = +2 NASDAQ -3
| New Buy B19 TODAY Expect the DJIA to recover one third (to 35000) to one half (35375) of what it has recently lost, before there is the expected test of the lows. Stay long SOLX and hedge with some bearish MINCPs. We saw a reversal day Buy B19 in terms of the DJIA (Wednesday -461 and Thursday + 618) and and in terms of NYSE breadth (Wednesday 987 advances and Thursday 2520 advances). The NYSE, SP-500 and NASDAQ each moved up from their support of the 65-dma despite their newly completed bearish head/shoulders. The most we can expect from this rally for the DJI is likely to be a 50% retracement and the DJI's 65-dma. The odds heavily favor a retest to the lows near 34000. I say this for several reasons. #1. If we ascribe the rally today to the "test" Buy B2 of last Sunday. The decline to 34000 is similar to what happened in each of the four instances of this 6/28/39, 11/19/47, 5/18/51 and 8/10/88. You will remember the type of Buy B2 occurs when the 3% lower band is reached by the DJI and the OBV Pct is above +.05 AND then when we add the additional condition that the P-I was less than zero, so that it is not confused with Buy B9s. (See last Sunday's Hotline for details.) These four cases exactly average a paper loss of 2.5%, which is what was saw happen this week to the DJI. That is why I suggested this signal might work if we employ it on a further drop of 2% from when it occurred. #2 We can also judge the amount of decline from the DJI's peak when there is a head/shoulders pattern of 4-6 weeks like we have now. When Peerless gives a Sell signal - like the S12 we see on our current DJI chart - on these H/S patterns, the DJI fell 6%-8% from its peak in 4 past cases going back to 1929, but it fell 8%-10% on 7 cases from its top and in 5 more times the sell-off was more than 12%. So, given the head/shoulders pattern alone, the odds would seem to be 3:1 in favor a sell-off by than 8% or 33538. #3 The FED is the wild card. Today, they caused the short-term rates to fall appreciably. Since April 2020, the FED and Powell has engineered 8 earlier bottoms after DJI sell-offs: 5/13/20, 5/26/20, 9/23/20, 10/28/20, 1/29/20, 3/14/21, 5/18/21, and 9/20/21. The deepest it has let the DJI drop is to the 5.7% lower band. The lowest level so far on the current decline is 4.9% below the 21-day ma. If the FED is srll in control anymore, we can predict that they will not allow the DJI srop below 34000. So, we need to see another successful test of the lows with a strong Closing. Until then remained hedged with the weakest Bearish MINCPs as long as their Closing Powers do not rise above their 21-day ma. SOXL can still be held long provided shorts are hed to hedge it. Traders, buy RETL (second chart below). Charts - 12/2/2021 2021 PEERLESS DJI, Signals, Indicators Daily DJI Volume 10-DayUp/Down Vol Stoch-20 Inverted Traders Index Graph of Pct of All Stocks above 65-dma Cum. Inverted Traders Index DJI-IPA DJI-OBV NASDAQ S&P OEX NYSE COMPQX DJI-15 DJI-20 DJI-30 DIA QQQ SPY IWM TNA Short-Term Rates DOLLAR-UUP ALLSTOCKs recent 2006 vers-Peerless signals http://tigersoftware.com/NEWPEER/UPD71202BMP MDY - http://www.tigersoftware.com/CHARTZ/MDY.GIF USO-CrudeOil DBO FAS GLD BBH IBB JETS JNUG KOL NUGT OIH PALL RSX RETL SDS AGQ SLV SOXL TAN TECL TLT TMF TNA UGA (gasoline) USO (oil) a nd China: YINN CHAU Commodities: CANE CORN DBC JJC, NIB CORN, CUT (paper) MOO, SOYB WEAT UUP (Dollar) LIT (Lithium) STOCKS: MRNA DIS GE PYPL GME ZOM XLE NRGU AAPL ADBE ALXN AMAT AMGN AMD AMZN AXP BA BABA BAC BIDU BLDP CAT CRM CVX CMG DE ENPH FB GILD GOOG GS HD IBM INTU JPM LRCX M MRK MSFT NEM NFLX NKE NKE NVDA PG PYPL REGN REV SO SQ QCOM QDEL TSLA TXN XOM V VRTX WFC WMT ZM Bullish MAXCPs http://tigersoftware.com/UPPER/12-2/BULLISH.htm Bearish MAXCPs http://tigersoftware.com/DOWNER/12-2/BEARISH.htm |
 |
 |
 |
 |
 |
 |
 |
 |
Table 1 QUICKSILVER on ETFS - 12/2/1 Bullish = 3 - SOXL (+.463), TECL, CORN Bearish = 2 - IBB, RSX ETF CLOSE CHANGE PIVOT-PT 5-dma AROC CL-PWR CANDLE IP21 ITRS POWER INDEX ====================================================================================================== DIA 346.61 6.15 349.02 -163.7% Bearish BLUE -.108 0 ------- --------------------------------------------------------------------------------------------- SPY 457.4 6.9 458.97 -130.9% Bearish BLUE -.115 .033 -.082 --------------------------------------------------------------------------------------------- QQQ 389.91 2.79 391.2 -112.3% Bearish BLUE -.04 .043 .003 --------------------------------------------------------------------------------------------- MDY 500 14.15 506.35 -234.7% Bearish BLUE -.102 .018 -.084 --------------------------------------------------------------------------------------------- IWM 219.21 5.95 222.85 -279% Bearish BLUE -.132 -.02 -.152 --------------------------------------------------------------------------------------------- FAS 127.58 9.91 130.1 -615% Bearish BLUE -.076 .124 .048 --------------------------------------------------------------------------------------------- RETL 38.95 2.21 45.42 -1131.1% Bearish BLUE .036 -.105 -.069 --------------------------------------------------------------------------------------------- SOXL 63.25 .09 61.37 -279.7% ------- BLUE .108 .355 .463 --------------------------------------------------------------------------------------------- TECL 79.01 2.14 76.63 -236.4% ------- BLUE .095 .24 .335 --------------------------------------------------------------------------------------------- IBB 151.23 .49 154.9 -70.5% Bearish BLUE -.178 -.131 -.309 --------------------------------------------------------------------------------------------- GLD 165.24 -.92 166.85 -56.5% Bearish RED -.083 -.013 -.096 --------------------------------------------------------------------------------------------- OIH 181.34 6.41 181.73 -303.5% ------- BLUE -.164 -.005 -.169 --------------------------------------------------------------------------------------------- UUP 25.78 .01 25.77 -36.8% Bullish BLUE .12 .016 .136 --------------------------------------------------------------------------------------------- CORN 25.78 .01 25.77 -36.8% Bearish BLUE .232 .268 .5 --------------------------------------------------------------------------------------------- YINN 9.45 .16 9.8 -637.2% Bearish RED -.105 -.123 -.228 --------------------------------------------------------------------------------------------- RSX 29.16 .58 27.67 49.4% Bearish BLUE -.227 -.039 -.266 |
Table 2 Count of Stocks in Key Directories
20211202
-------------------------------
NEWHIGHS 48
NEWLOWS 807 Bearish
MAXCP 13
MINCP 84
TTTNH 28
TTTNL 47
CPCROSSA 125
CPCROSSD 8
ACCUMVER 248
HIGHIP21 5
HIUPPCT 13
REDSELL 200
AUGSELS7 26
TRAPDOOR 3
|
Table 3 RANKING OF KEY DIRECTORIES BASED PCT.OF STOCKS ABOVE 65-DMA
12/2/21
Bullish = 5
Bearish = 43
---------------------------------------------------------------------------------------
Directory Current day-1 day-2 day-3 day-4 day-5
----------------------------------------------------------------------------------------
HOMEBLDG .882 .705 .823 .882 .882 .882
REGBANKS .64 .2 .24 .48 .52 .96
AUTO .547 .471 .509 .584 .641 .754
FINANCE .53 .259 .32 .518 .518 .679
SEMI .53 .52 .54 .612 .591 .693
==========================================================================================
COMPUTER .5 .5 .55 .55 .55 .6
==========================================================================================
NASD-100 .494 .432 .484 .587 .484 .608
NIFTY .489 .446 .51 .595 .531 .638
CHEM .478 .456 .478 .608 .586 .652
RETAIL .468 .425 .51 .659 .659 .744
SP500 .461 .311 .383 .544 .508 .646
ELECTRON .455 .425 .455 .552 .507 .589
RUS-1000 .428 .28 .358 .53 .5 .666
HIGHPRIC .427 .307 .413 .525 .514 .605
INDEXES .418 .298 .385 .57 .543 .673
FIDSTKS .402 .307 .343 .467 .414 .568
SP-100 .4 .311 .344 .433 .411 .588
REIT .389 .236 .358 .412 .435 .694
HACKERS .388 .333 .5 .555 .444 .444
INDMATER .388 .291 .361 .486 .472 .625
COPPER .375 .125 .25 .25 .25 .5
GREEN .368 .21 .315 .578 .473 .578
INSURANC .36 .24 .24 .44 .48 .8
BEVERAGE .357 .357 .357 .357 .428 .642
TRANSP .35 .25 .35 .55 .55 .65
EDU .333 .333 .333 .333 .333 .333
INFRA .333 .212 .212 .333 .393 .636
DJI-13 .307 .23 .307 .384 .384 .538
FOOD .306 .346 .367 .367 .346 .612
SOFTWARE .303 .285 .392 .428 .41 .5
OILGAS .301 .235 .311 .396 .358 .537
BIGBANKS .285 0 .142 .285 .285 .428
BONDFUND .284 .375 .375 .318 .284 .193
DOWJONES .266 .233 .266 .3 .333 .5
UTILITY .263 .184 .157 .342 .289 .473
GOLD .26 .195 .326 .413 .413 .543
COMODITY .25 .275 .275 .275 .25 .55
CHINA .235 .176 .215 .196 .235 .352
HOSPITAL .187 0 .125 .25 .25 .312
SOLAR .187 .25 .437 .562 .562 .75
BIOTECH .174 .165 .196 .212 .215 .245
COAL .166 .166 .333 .333 .333 .333
MARIJUAN .166 0 0 .333 .166 .333
GAMING .157 .105 .21 .315 .368 .421
GUNS .153 .153 .384 .384 .384 .538
ETFS .125 .107 .142 .125 .125 .232
LOWPRICE .104 .091 .119 .149 .154 .2
MILITARY .076 .038 .038 .076 .115 .346
JETS 0 0 0 0 0 .076
|
====================================================================================
====================================================================================
12/02/2021 Thursday 5:50 AM Data used through 12/1/2021
Futures: DJI = +139 NASDAQ -50
====================================================================================
| The way the market
seems to be kniving down through various support levels, it is too dangerous to take a stand. The DJI's decline today owed mostly to CRM's decline of 10%. It is one of the DJI-30. So, there may be a brief DJI recovery to try to bring some stability. But the FED has not lowered short-term rates, as witnessed by the steeply declining FAS and its Closing Power. Today we saw SPY and QQQ crack below their necklines. Unless they can quickly recover, it looks like we are not done with the decline. 34000 would seem to be the key support now. If it fails, the rate of decline may become brutal. With so many new lows, it remains necessary to be short some of the bearish MICPs. SOXL is now in danger of breaking its price uptrendline, having today broken its steep CP uptrendline. If that happens, there will be lots of profit-taking. Capital gains tax talk may behind a good part of the sell-off. If there is a DJI rally next, it would be in keeping with the general bullishness of December, but not until the second half. In other words, we might see a 3% bounce up soon towards the 21-day ma and then another test of the lows, afterwhich we could get a Santa Cluas rally near the end of the year. Charts - 12/1/2021 (Friday) 2021 PEERLESS DJI, Signals, Indicators Daily DJI Volume 10-DayUp/Down Vol Stoch-20 Inverted Traders Index Graph of Pct of All Stocks above 65-dma Cum. Inverted Traders Index DJI-IPA DJI-OBV NASDAQ S&P OEX NYSE COMPQX DJI-15 DJI-20 DJI-30 DIA QQQ SPY IWM TNA Short-Term Rates DOLLAR-UUP ALLSTOCKs recent 2006 vers-Peerless signals http://tigersoftware.com/NEWPEER/UPD71201BMP MDY - http://www.tigersoftware.com/CHARTZ/MDY.GIF USO-CrudeOil DBO FAS GLD BBH IBB JETS JNUG KOL NUGT OIH PALL RSX RETL SDS AGQ SLV SOXL TAN TECL TLT TMF TNA UGA (gasoline) USO (oil) and China: YINN CHAU Commodities: CANE CORN DBC JJC, NIB CORN, CUT (paper) MOO, SOYB WEAT UUP (Dollar) LIT (Lithium) STOCKS: MRNA DIS GE PYPL GME ZOM XLE NRGU AAPL ADBE ALXN AMAT AMGN AMD AMZN AXP BA BABA BAC BIDU BLDP CAT CRM CVX CMG DE ENPH FB GILD GOOG GS HD IBM INTU JPM LRCX M MRK MSFT NEM NFLX NKE NKE NVDA PG PYPL REGN REV SO SQ QCOM QDEL TSLA TXN XOM V VRTX WFC WMT ZM Bullish MAXCPs http://tigersoftware.com/UPPER/12-1/BULLISH.htm Bearish MAXCPs http://tigersoftware.com/DOWNER/12-1/BEARISH.htm |
 |
 |
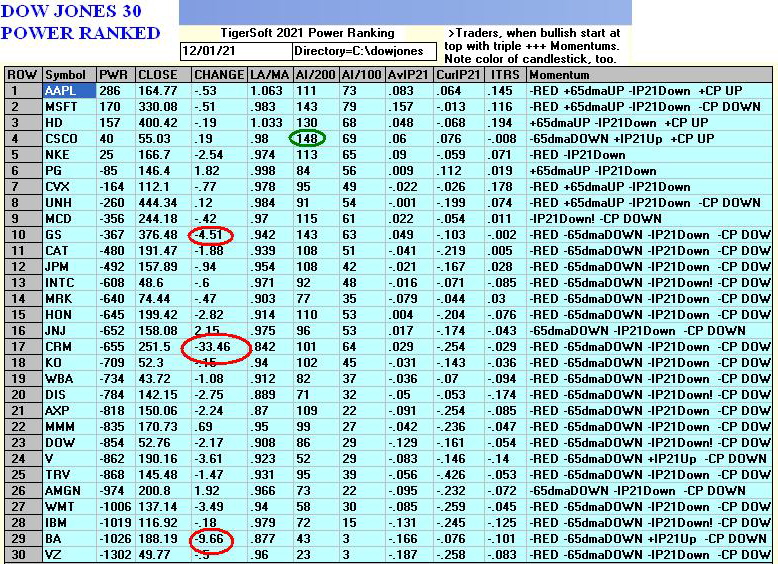 |
 |
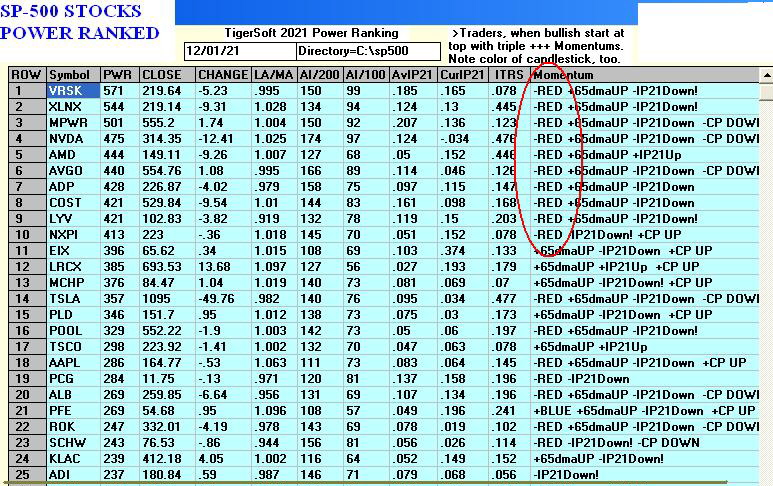 |
 |
 |
 |
 |
 |
 |
Table 1 QUICKSILVER on ETFS - 12/1/1 Bullish = 3 - SOXL (+.567), TECL, CORN Bearish = 2 - IBB, RSX ETF CLOSE CHANGE PIVOT-PT 5-dma AROC CL-PWR CANDLE IP21 ITRS POWER INDEX ====================================================================================================== DIA 340.46 -4.44 358.03 -249.3% Bearish RED -.149 0 ------ --------------------------------------------------------------------------------------------- SPY 450.5 -5.06 469.44 -190.9% Bearish RED -.154 .035 -.119 --------------------------------------------------------------------------------------------- QQQ 387.12 -6.7 398.76 -130.7% Bearish RED -.07 .053 -.017 --------------------------------------------------------------------------------------------- MDY 485.85 -7.95 523.63 -371.3% Bearish RED -.188 .011 -.177 --------------------------------------------------------------------------------------------- IWM 213.26 -4.91 231.58 -401% Bearish RED -.185 -.024 -.209 --------------------------------------------------------------------------------------------- FAS 117.67 -4.01 143.43 -986.1% Bearish RED -.109 .089 -.02 --------------------------------------------------------------------------------------------- RETL 36.74 -4.05 48.73 -1537.9% Bearish RED .032 -.099 -.067 --------------------------------------------------------------------------------------------- SOXL 63.16 -1.51 66.88 -121.1% ------- RED .122 .445 .567 --------------------------------------------------------------------------------------------- TECL 76.87 -3.35 82.78 -261.8% Bearish RED .076 .266 .342 --------------------------------------------------------------------------------------------- IBB 150.74 -3.48 153.4 -73.5% Bearish RED -.156 -.125 -.281 --------------------------------------------------------------------------------------------- GLD 166.16 .66 167.12 -33.6% Bearish RED -.091 -.003 -.094 --------------------------------------------------------------------------------------------- OIH 174.93 -3.43 192.4 -468% Bearish RED -.219 -.021 -.24 --------------------------------------------------------------------------------------------- UUP 25.77 .07 25.97 -19.4% Bullish BLUE .1 .026 .126 --------------------------------------------------------------------------------------------- CORN 25.77 .07 25.97 -19.4% ------- BLUE .171 .276 .447 --------------------------------------------------------------------------------------------- YINN 9.29 -.06 10.69 -655.5% Bearish RED -.128 -.081 -.209 --------------------------------------------------------------------------------------------- RSX 28.58 .3 28.88 -159.5% Bearish RED -.241 -.035 -.276 |
Count of Stocks in Key Directories
20211201
-------------------------------
NEWHIGHS 98 vs 72 vs 92 vs 54 vs 138 vs 166 vs 348 vs 251 vs 272 vs 222
NEWLOWS 807 vs 908 vs 471 vs 549 vs 263 vs 704 vs 683 vs 434 vs 518 vs 324
(NHs and NLs on NYSE + NASDAQ, for last 10 trading days)
MAXCP 10
MINCP 471 Bearish
TTTNH 28
TTTNL 340 Bearish
CPCROSSA 8
CPCROSSD 136 Bearish
ACCUMVER 248
HIGHIP21 6
HIUPPCT 13
REDSELL 195
AUGSELS7 25
TRAPDOOR 15
|
Table 3 RANKING OF KEY DIRECTORIES BASED PCT.OF STOCKS ABOVE 65-DMA
12/1/21
Bullish = only 2
Bearish = 46 Only 30% of 10 of DJI 30 stocks are above their 65-dma.
---------------------------------------------------------------------------------------
Directory Current day-1 day-2 day-3 day-4 day-5
----------------------------------------------------------------------------------------
HOMEBLDG .705 .823 .882 .882 .882 .882
SEMI .52 .54 .612 .591 .693 .683
===========================================================================================
COMPUTER .5 .55 .55 .55 .6 .55
===========================================================================================
AUTO .471 .509 .584 .641 .754 .754
CHEM .456 .478 .608 .586 .652 .739
NIFTY .446 .51 .595 .553 .617 .659
NASD-100 .432 .484 .587 .484 .608 .628
ELECTRON .425 .455 .552 .507 .589 .582
RETAIL .425 .51 .659 .659 .744 .872
BONDFUND .375 .375 .318 .284 .193 .193
BEVERAGE .357 .357 .357 .428 .642 .714
FOOD .346 .367 .367 .346 .612 .673
EDU .333 .333 .333 .333 .333 .333
HACKERS .333 .5 .555 .444 .444 .5
SP-100 .311 .344 .433 .411 .588 .622
SP500 .311 .383 .544 .508 .646 .658
FIDSTKS .307 .343 .467 .414 .568 .579
HIGHPRIC .307 .413 .525 .514 .605 .597
INDEXES .304 .385 .57 .543 .695 .69
INDMATER .291 .361 .486 .472 .611 .666
SOFTWARE .285 .392 .428 .41 .5 .5
RUS-1000 .28 .358 .53 .5 .668 .675
COMODITY .275 .275 .275 .25 .55 .6
FINANCE .259 .32 .518 .518 .679 .716
SOLAR .25 .437 .562 .562 .75 .75
TRANSP .25 .35 .55 .55 .65 .65
INSURANC .24 .24 .44 .48 .8 .84
REIT .236 .351 .412 .435 .679 .648
OILGAS .235 .311 .396 .358 .537 .5
DOWJONES .233 .266 .3 .333 .5 .566
^^^^
DJI-13 .23 .307 .384 .384 .538 .615
INFRA .212 .212 .333 .393 .636 .575
GREEN .21 .315 .578 .473 .578 .578
REGBANKS .2 .24 .48 .52 .96 .96
GOLD .195 .326 .413 .413 .521 .565
UTILITY .184 .157 .342 .289 .473 .473
CHINA .176 .215 .196 .235 .352 .333
COAL .166 .333 .333 .333 .333 .5
BIOTECH .165 .196 .212 .215 .245 .245
GUNS .153 .384 .384 .384 .538 .615
COPPER .125 .25 .25 .25 .5 .5
ETFS .107 .142 .125 .125 .232 .285
GAMING .105 .21 .315 .368 .421 .315
LOWPRICE .093 .116 .149 .154 .197 .162
MILITARY .038 .038 .076 .115 .346 .346
BIGBANKS 0 .142 .285 .285 .428 .857
HOSPITAL 0 .125 .25 .25 .312 .375
JETS 0 0 0 0 .076 .076
MARIJUAN 0 0 .333 .166 .333 .333
|
====================================================================================
12/01/2021
Tuesday : 4:30 AM Data used through 11/30/2021
Futures: DJI = +290 NASDAQ +234
| The DJI today
fulfilled its minimum price objective based on its head and shoulders pattern. At
the same time, it has intra-day tagged its still rising 200-day ma and the bottom of its
price channel. This week's decline is in keeping with the Buy B2 we talked about on
Sunday that occurs when the lower 3% band is tagged with the OBV Pct well above zero.
First, there is an additional 2% loss and then a rally. A rally is certainly over-due, especially if it turns out that the Omicron Covid variation is less serious in the symptoms it causes. In over-night trading, the NASDAQ is up a higher percentage than the DJI. I would again suggest buying SOXL. This is the strongest ETF by a wide margin. It will be helpful to a tech rally generally if TECL and QQQ can destroy their potential head and shoulders patterns. The DJI's neckline will probably turn back the next advance. There were more than 900 new lows on NASDAQ and NYSE. This shows that the selling pressure on the weakest Power Ranked stocks whose Closing Powers are making new lows remains very high. Being short some of these for hedging purposes is still recommended. Tax loss selling could hurt them for the entire month of December. As to whether we should consider the Buy B2 a valid Peerless signal, my fears remain. Downside volatility in here is very high. Too much of the price activity is now taking place off the NYSE before we can trade it. And if we did use it, I would add the caveat that it is not an immediate Buy signal, but should be used after an additional 2% decline from when it first occurred and not stick with it if its loss gets bigger than 5%. If there is a rally next, it would be in keeping with the general bullishness of December, especially in the second half. In other words, we might see a 3% bounce up soon towards the 21-day ma and then another test of the lower 3.5% band, afterwhich we could get a Santa Cluas rally until the end of the year. |
|
Charts - 11/30/2021 (Friday) 2021 PEERLESS DJI, Signals, Indicators Daily DJI Volume 10-DayUp/Down Vol Stoch-20 Inverted Traders Index Graph of Pct of All Stocks above 65-dma Cum. Inverted Traders Index DJI-IPA DJI-OBV NASDAQ S&P OEX NYSE COMPQX DJI-15 DJI-20 DJI-30 DIA QQQ SPY IWM TNA Short-Term Rates DOLLAR-UUP ALLSTOCKs recent 2006 vers-Peerless signals http://tigersoftware.com/NEWPEER/UPD71130.BMP MDY - http://www.tigersoftware.com/CHARTZ/MDY.GIF USO-CrudeOil DBO FAS GLD BBH IBB JETS JNUG KOL NUGT OIH PALL RSX RETL SDS AGQ SLV SOXL TAN TECL TLT TMF TNA UGA (gasoline) USO (oil) and China: YINN CHAU Commodities: CANE CORN DBC JJC, NIB CORN, CUT (paper) MOO, SOYB WEAT UUP (Dollar) LIT (Lithium) STOCKS: MRNA DIS GE PYPL GME ZOM XLE NRGU AAPL ADBE ALXN AMAT AMGN AMD AMZN AXP BA BABA BAC BIDU BLDP CAT CRM CVX CMG DE ENPH FB GILD GOOG GS HD IBM INTU JPM LRCX M MRK MSFT NEM NFLX NKE NKE NVDA PG PYPL REGN REV SO SQ QCOM QDEL TSLA TXN XOM V VRTX WFC WMT ZM Bullish MAXCPs http://tigersoftware.com/UPPER/11-30/BULLISH.htm Bearish MAXCPs http://tigersoftware.com/DOWNER/11-30/BEARISH.htm |
DJI has fallen to good support of 200-dma |
Minimum downside objective of DJI H/S achieved on Tuesday. |
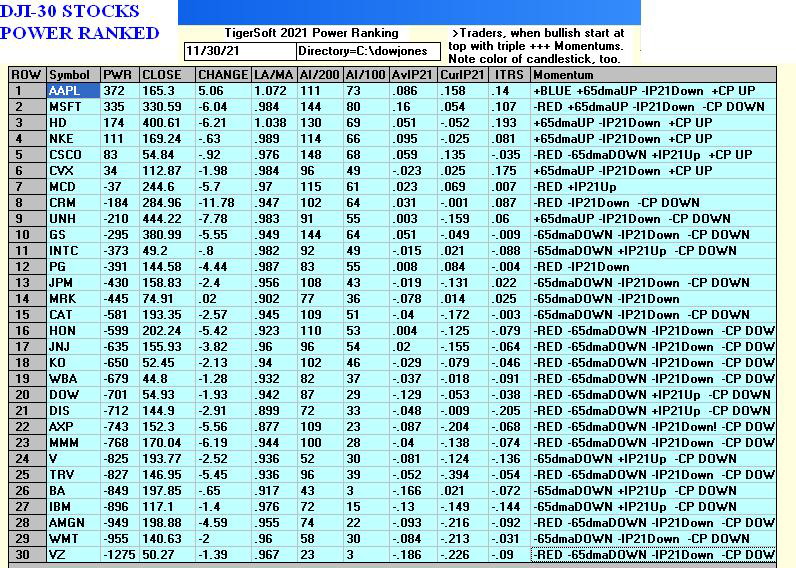 |
 |
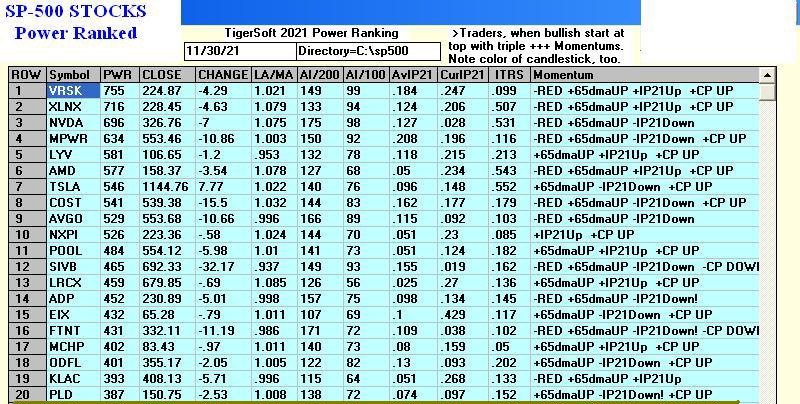 |
 |
 |
 |
 |
 |
Table 1 QUICKSILVER on ETFS - 11/30/21 Bullish = 2 - SOXL (+.724), TECL Bearish = 0 ETF CLOSE CHANGE PIVOT-PT 5-dma AROC CL-PWR CANDLE IP21 ITRS POWER INDEX ====================================================================================================== DIA 344.9 -6.29 358.02 -159.4% Bearish RED -.062 0 --- --------------------------------------------------------------------------------------------- SPY 455.56 -9.04 468.19 -128.9% Bearish RED -.05 .033 -.017 --------------------------------------------------------------------------------------------- QQQ 393.82 -5.87 397.48 -69% Bearish RED .036 .061 .097 --------------------------------------------------------------------------------------------- MDY 493.8 -13.24 523.79 -294% Bearish RED -.028 .014 -.014 --------------------------------------------------------------------------------------------- IWM 218.17 -4.5 231.33 -297.3% Bearish RED -.051 -.012 -.063 --------------------------------------------------------------------------------------------- FAS 121.68 -9.78 144.13 -600.2% Bearish RED -.045 .106 .061 --------------------------------------------------------------------------------------------- RETL 40.79 -3.7 50.91 -1282.9% Bearish RED .161 -.013 .148 --------------------------------------------------------------------------------------------- SOXL 64.67 -3.74 64.74 -58.1% Bullish RED .247 .477 .724 --------------------------------------------------------------------------------------------- TECL 80.22 -2.04 81.09 -89% ------- RED .172 .309 .481 --------------------------------------------------------------------------------------------- IBB 154.22 -1.84 153.01 17.5% Bearish RED -.043 -.109 -.152 --------------------------------------------------------------------------------------------- GLD 165.5 -1.12 167.28 -96.8% Bearish RED -.042 -.013 -.055 --------------------------------------------------------------------------------------------- OIH 178.36 -5.26 192.31 -198.5% ------- RED -.128 -.02 -.148 --------------------------------------------------------------------------------------------- UUP 25.7 -.12 25.87 -34.8% Bullish ---- -.083 .011 -.072 --------------------------------------------------------------------------------------------- CORN 21.03 -.52 21.77 -129.2% Bearish RED -.15 .057 -.093 --------------------------------------------------------------------------------------------- WEAT 7.58 -.34 8.31 -393.9% ------- RED .132 .094 .226 --------------------------------------------------------------------------------------------- YINN 9.35 -.17 10.6 -676.7% Bearish RED -.037 -.056 -.093 --------------------------------------------------------------------------------------------- RSX 28.28 -.05 29.49 -14% Bearish RED -.155 -.052 -.207 |
Table 2 Count of Stocks in Key Directories
20211130
-------------------------------
NEWHIGHS 72
NEWLOWS 908 Bearish
MAXCP 9
MINCP 308
TTTNH 17
TTTNL 259 Bearish
CPCROSSA 30
CPCROSSD 113 Bearish
ACCUMVER 247
HIGHIP21 9
HIUPPCT 15
VHIP21 82
REDSELL 181
AUGSELS7 13
TRAPDOOR 12
|
Table 3 RANKING OF KEY DIRECTORIES BASED PCT.OF STOCKS ABOVE 65-DMA
11/30/21
Bullish = 6
Bearish = 42
---------------------------------------------------------------------------------------
Directory Current day-1 day-2 day-3 day-4 day-5
----------------------------------------------------------------------------------------
HOMEBLDG .823 .882 .882 .882 .882 .882
COMPUTER .55 .55 .55 .6 .55 .55
SEMI .54 .612 .591 .693 .683 .704
NIFTY .51 .595 .553 .638 .638 .638
RETAIL .51 .659 .659 .744 .851 .829
AUTO .509 .584 .641 .754 .754 .773
=========================================================================================
HACKERS .5 .555 .444 .444 .5 .5
=========================================================================================
NASD-100 .484 .587 .484 .608 .597 .567
CHEM .478 .608 .586 .652 .717 .673
ELECTRON .455 .552 .507 .589 .582 .611
SOLAR .437 .562 .562 .75 .75 .75
HIGHPRIC .413 .525 .514 .605 .59 .59
SOFTWARE .392 .428 .41 .5 .5 .517
INDEXES .385 .57 .543 .695 .695 .673
GUNS .384 .384 .384 .538 .615 .538
SP500 .383 .544 .508 .646 .65 .596
BONDFUND .375 .318 .284 .193 .193 .329
FOOD .367 .367 .346 .612 .673 .836
INDMATER .361 .486 .472 .611 .666 .638
RUS-1000 .358 .53 .5 .668 .672 .632
BEVERAGE .357 .357 .428 .642 .714 .714
REIT .351 .404 .435 .679 .641 .625
TRANSP .35 .55 .55 .65 .65 .65
SP-100 .344 .433 .411 .588 .6 .488
FIDSTKS .343 .467 .414 .568 .568 .502
COAL .333 .333 .333 .333 .5 .333
EDU .333 .333 .333 .333 .333 .333
GOLD .326 .413 .413 .521 .565 .804
FINANCE .32 .518 .518 .679 .728 .641
GREEN .315 .578 .473 .578 .578 .631
OILGAS .311 .396 .358 .537 .528 .433
DJI-13 .307 .384 .384 .538 .615 .461
COMODITY .275 .275 .25 .55 .6 .775
DOWJONES .266 .3 .333 .5 .533 .4
^^^^^
COPPER .25 .25 .25 .5 .5 .5
INSURANC .24 .44 .48 .8 .84 .68
REGBANKS .24 .48 .52 .96 .96 .92
CHINA .215 .196 .235 .352 .333 .352
INFRA .212 .333 .393 .636 .575 .575
GAMING .21 .315 .368 .421 .315 .421
BIOTECH .196 .212 .215 .245 .243 .259
UTILITY .157 .342 .289 .473 .473 .5
BIGBANKS .142 .285 .285 .428 .857 .285
ETFS .142 .125 .125 .232 .303 .285
HOSPITAL .125 .25 .25 .312 .375 .312
LOWPRICE .119 .147 .154 .197 .167 .164
MILITARY .038 .076 .115 .346 .384 .307
JETS 0 0 0 .076 .076 .076
MARIJUAN 0 .333 .166 .333 .333 .333
|
====================================================================================
11/30/2021 Tuesday : 3:32 AM
DJI = -447 NASDAQ
- 85
|
"Run for The Hills?" Not Yet... We need to see if Professionals will be buyers today and hold |
|
Charts - 11/29/2021 (Friday)
2021 PEERLESS DJI, Signals, Indicators Daily DJI Volume 10-DayUp/Down Vol Stoch-20 Inverted Traders Index Graph of Pct of All Stocks above 65-dma Cum. Inverted Traders Index DJI-IPA DJI-OBV NASDAQ S&P OEX NYSE COMPQX DJI-15 DJI-20 DJI-30 DIA QQQ SPY IWM TNA Short-Term Rates DOLLAR-UUP ALLSTOCKs recent 2006 vers-Peerless signals http://tigersoftware.com/NEWPEER/UPD71129.BMP MDY - http://www.tigersoftware.com/CHARTZ/MDY.GIF USO-CrudeOil DBO FAS GLD BBH IBB JETS JNUG KOL NUGT OIH PALL RSX RETL SDS AGQ SLV SOXL TAN TECL TLT TMF TNA UGA (gasoline) USO (oil) and China: YINN CHAU Commodities: CANE CORN DBC JJC, NIB CORN, CUT (paper) MOO, SOYB WEAT UUP (Dollar) LIT (Lithium) STOCKS: MRNA DIS GE PYPL GME ZOM XLE NRGU AAPL ADBE ALXN AMAT AMGN AMD AMZN AXP BA BABA BAC BIDU BLDP CAT CRM CVX CMG DE ENPH FB GILD GOOG GS HD IBM INTU JPM LRCX M MRK MSFT NEM NFLX NKE NKE NVDA PG PYPL REGN REV SO SQ QCOM QDEL TSLA TXN XOM V VRTX WFC WMT ZM Bullish MAXCPs http://tigersoftware.com/UPPER/11-29/BULLISH.htm Bearish MAXCPs http://tigersoftware.com/DOWNER/11-29/BEARISH.htm |
 |
 |
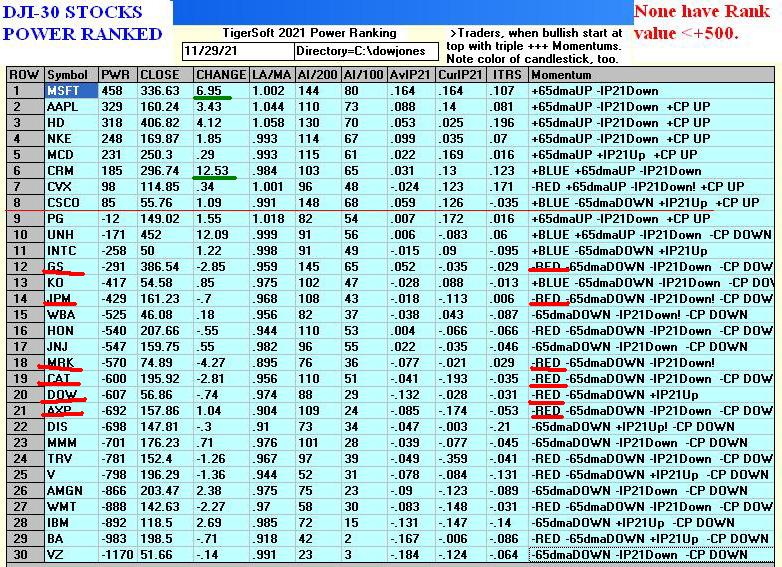 |
 |
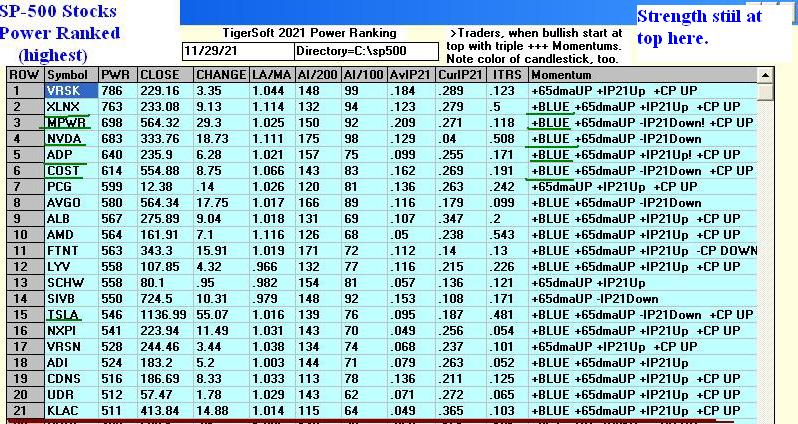 |
 |
 |
 |
 |
 |
 |
Table 1 QUICKSILVER on ETFS - 11/29/21 Bullish = 2 - SOXL (+.774), TECL Bearish = 0 ETF CLOSE CHANGE PIVOT-PT 5-dma AROC CL-PWR CANDLE IP21 ITRS POWER INDEX ====================================================================================================== DIA 351.19 2.17 356.2 -66.4% Bearish RED .055 0 ------- --------------------------------------------------------------------------------------------- SPY 464.6 5.63 467.57 -46% ------- BLUE .101 .037 .138 --------------------------------------------------------------------------------------------- QQQ 399.69 8.49 399.3 -54% ------- BLUE .13 .053 .183 --------------------------------------------------------------------------------------------- MDY 507.04 .69 524.2 -158.9% Bearish RED .034 .025 .059 --------------------------------------------------------------------------------------------- IWM 222.67 -.18 231.73 -218.4% Bearish RED -.026 -.015 -.041 --------------------------------------------------------------------------------------------- FAS 131.46 1.36 138.18 -49% Bearish RED .044 .112 .156 --------------------------------------------------------------------------------------------- RETL 44.49 -.93 53.25 -658.7% ------- RED .224 .019 .243 --------------------------------------------------------------------------------------------- SOXL 68.41 7.04 65.43 -15.3% Bullish BLUE .327 .447 .774 --------------------------------------------------------------------------------------------- TECL 82.26 5.63 81.66 -136.5% Bullish BLUE .238 .268 .506 --------------------------------------------------------------------------------------------- IBB 156.06 1.16 153.68 48.7% Bearish RED -.013 -.117 -.13 --------------------------------------------------------------------------------------------- GLD 166.62 -.23 168.74 -177.7% Bearish RED .074 .001 .075 --------------------------------------------------------------------------------------------- OIH 183.62 1.89 185.79 -4% Bearish RED -.177 -.026 -.203 --------------------------------------------------------------------------------------------- CPER 26.43 .15 26.73 -63.4% Bearish RED .086 -.002 .084 --------------------------------------------------------------------------------------------- UUP 25.82 .05 25.88 13.5% Bullish ---- -.02 .016 -.004 --------------------------------------------------------------------------------------------- CORN 25.82 4.27 21.77 975.6% Bearish ---- -.227 .302 .075 --------------------------------------------------------------------------------------------- YINN 9.52 -.28 10.74 -773.7% Bearish RED -.058 -.162 -.22 --------------------------------------------------------------------------------------------- RSX 28.33 .66 28.36 -275.4% Bearish RED -.119 -.072 -.191 |
Count of Stocks in Key Directories
20211129
-------------------------------
NEWHIGHS 92
NEWLOWS 471 Bearish
MAXCP 21
MINCP 213 Bearish
TTTNH 24
TTTNL 166
CPCROSSA 62
CPCROSSD 108
HIGHIP21 12
HIUPPCT 22
REDSELL 179
AUGSELS7 22
TRAPDOOR 5
|
Table 1 RANKING OF KEY DIRECTORIES BASED PCT.OF STOCKS ABOVE 65-DMA
11/29/21
Bullish = 18
Bearish = 31
---------------------------------------------------------------------------------------
Directory Current day-1 day-2 day-3 day-4 day-5
----------------------------------------------------------------------------------------
HOMEBLDG .882 .882 .882 .882 .882 .882
RETAIL .659 .659 .744 .851 .829 .765
SEMI .612 .591 .693 .683 .714 .765
CHEM .608 .586 .652 .717 .673 .652
GREEN .6 .5 .6 .6 .65 .65
NIFTY .595 .553 .638 .659 .638 .68 NASD-100 .587 .484 .608 .597 .577 .577 AUTO .584 .641 .754 .754 .773 .735 INDEXES .57 .543 .695 .695 .679 .673 SOLAR .562 .562 .75 .75 .75 .875 HACKERS .555 .444 .444 .5 .5 .5 ELECTRON .552 .507 .589 .582 .619 .686 COMPUTER .55 .55 .6 .55 .55 .6 TRANSP .55 .55 .65 .65 .65 .6 SP500 .544 .508 .646 .65 .6 .59 RUS-1000 .531 .502 .669 .673 .638 .607 HIGHPRIC .525 .514 .605 .59 .59 .652 FINANCE .518 .518 .679 .728 .666 .654 ========================================================================================= INDMATER .486 .472 .611 .666 .638 .583 REGBANKS .48 .52 .96 .96 .92 .92 FIDSTKS .467 .414 .568 .568 .508 .508 INSURANC .44 .48 .8 .84 .68 .52 SP-100 .433 .411 .588 .6 .511 .455 SOFTWARE .428 .41 .5 .5 .517 .553 GOLD .413 .413 .521 .565 .804 .804 REIT .404 .427 .679 .641 .625 .648 OILGAS .396 .358 .537 .528 .433 .415 DJI-13 .384 .384 .538 .615 .461 .384 GUNS .384 .384 .538 .615 .538 .615 FOOD .367 .346 .612 .673 .836 .755 BEVERAGE .357 .428 .642 .714 .714 .5 UTILITY .342 .289 .473 .473 .5 .368 COAL .333 .333 .333 .5 .333 .333 EDU .333 .333 .333 .333 .333 .333 INFRA .333 .393 .636 .575 .575 .484 MARIJUAN .333 .166 .333 .333 .333 .5 BONDFUND .318 .284 .193 .193 .329 .352 GAMING .315 .368 .421 .315 .421 .421 DOWJONES .3 .333 .5 .533 .433 .366 BIGBANKS .285 .285 .428 .857 .428 .285 COMODITY .275 .25 .55 .6 .775 .7 COPPER .25 .25 .5 .5 .5 .5 HOSPITAL .25 .25 .312 .375 .312 .312 BIOTECH .212 .215 .245 .243 .259 .29 CHINA .196 .235 .352 .333 .352 .411 LOWPRICE .147 .149 .195 .164 .177 .203 ETFS .125 .125 .232 .303 .285 .339 MILITARY .076 .115 .346 .384 .307 .384 JETS 0 0 .076 .076 .076 .076 |
====================================================================================
11/29/2021
- Monday 3:10 AM
data 11/26 - DJI +223 NASDAQ +160
|
Peerless Buy B2 - Buy
at lower band. The DJIA sold off 900 points on Friday to its 2.9% lower band. (LA/MA = .981 in our key values parlance. What stood out was how the IP21-Accumulation Index did not drop below Zero. IP21 was registered as 0.0. Equally impressive from a bullish point of view was that OBV-PCT ("OP") stood at +.082. We have to also take note of the sharp drop in Crdue Oil and most other commodities. This works to reduce inflation and allows the FED to keep low rates longer. I tested a new Buy B2 based on the DJI dropping 2.9% down from its 21-day with the IP21 at 0 or above, the OBVPct at least +.05% IMPORTANTLY the change in the last 65 days' DJI not being down more than 3.7%, I found only six instances since 1929 other than the present case. Buying the DJI at the close when this happens and selling on the next Peerless Sell would have gained a trader +10.7% on average. He would have had to endure an average 2.4% paper loss. That makes the set up we see now in the market look attractive to buy. But do not be surprised if there is still 2% more downside. That would fulfill the head and shoulder pattern's downside objective. Additional 2% weakness did occur in 5 of the 6 cases. Only once did this new Buy signal (a Buy B2) bring an immediate take-off and this was when the P-I was quite positive. These statistics makes this trade seem attractive. The odds are also good that the FED do its best not to allow a much deeper decline in the period when December retail sales are so important. The new year may be quite different if Inflation takes off again to the upside and the new Covid starts sweeping the World. Watch the Closing Power now. It will be bullish if it turns up. Watch also to see which stocks take off the most and if tech stocks in QQQ, SOXL and TECL again starting taking the leadership. That would seem likely. New Buy B2 - 1929-2021 1 6/28/1939 Gain = 16.0% Paper loss = 2.0% (132.8 fell to 130.1 the next day.) Other buys there. la/ma= .969 P=-70 IP21= +.022 VI=-84 OPMA=+.106 ---------------------------------------------------------------------------------------------------- 2 11/19/1947 Gain = 1.8% Paper loss = 3.3% (177 to 171.2 Other nearby Buys. la/ma=.972 P=-39 IP21= +.101 VI=-99 OPMA=+.069 ------------------------------------------------------------------------ 3 12/4/1951 Gain = 16.6% zero paper Loss B9 also because P= +198 and IP21=+.193 la/ma= .971 P=+198 IP21= +.103 VI=+264 OPMA=+.244 ------------------------------------------------------------------------ 4 5/18/1951 Gain = +10.0% Paper loss = 2.3% (250.1 to 245.8) No no other Buys until later. la/ma= .971 P=-60 IP21= +0 VI=-178 OPMA=+.099 most similar to present case ------------------------------------------------------------------------ 5 10/5/1955 Gain = 12.5% Paper loss = 4.9% (461.1 to 438.6 in two day) A Buy B17 took place at bottom. la/ma= .973 P=+10 IP21= +.047 VI=-271 OPMA=+.095 ------------------------------------------------------------------------ 6 8/10/1988 Gain = +7.3% Paper loss = 2.2% (2034.14 to 1990.22) A better Buy B2 a week later at bottom. la/ma= .969 P=-153 IP21= +.042 VI=-15 OPMA=+.088 ------------------------------------------------------------------------ N=6 Average Gain = 10.7% Highest losses under 4.9%. Avg Paper Loss = 2.4%. ==================================================================== Code added to produce new B2 in Peerless today. I will post revised Peerless to ESP Page later this week For I = 66 To rn CHAN65 = (LA(I) - LA(I - 65)) / LA(I - 65) If CHAN65 < -.037 Then 44765 If LA(I) / MA(I) < .968 Then 44765 If LA(I) / MA(I) < .972 And opMA(I) > .05 And NEWIPXXX(I) > -.005 Then PI = I: BUYB2ARROWS (PI) If LA(I) / MA(I) < .97 And p(I) > 27 Then PI = I: buyb9arrows (PI) 44765 Next I |
|
Thoughts of DJI's H/S Pattern. Much of size of the sudden decline on Friday came from overseas selling where the fear is greatest that the new Covid strain will cause a repeat of the earlier emergency shut-downs of world trade and national commerces closest to South Africa. Because of the way US trading was diminished the day after Thanksgiving, we may need more of next week to take the full measure to the market of the new Covind. . The decline would not have been so bad if the DJI had not been flashing a bearish looking head and shoulders. Such patterns when completed usually bring declines to the lower band. Below are the examples of earlier month to 6 week long head and shoulders patterns that were completed. Something bearish has suddenly spooked the market. That is the lesson of most of these top patterns. This is important because the US economy was improving amd rates remain very low. Two thirds of these formations with a Peerless Sell signal fall 10% or more from the DJI's peak. 4-6 weeks DJI H/S in Bull Markets: 1929-2021 1. May 1929 - 10% S9/S12 2. Aug.-Sept 1941 - 27.7% S17 - S10 3 July 1943 - 8% S4 - S9V 4. March 1945 -6% No sell signal 5. Jan-Feb 1946 - 10% ES9 - S6 (E=early) 6. June 1950 - 13.5% ES8 7. Jan-Feb 1952 -6% S1 8. April - 1956 -10% S2 - S5 - one last false rally 9. July-Aug 1956 - 10% S2 10. July 1959 - 9% S9 - one last false rally 11. Oct-Nov - 1963 - 6.3% No sell signal. JFK assass. 12. July 1964 - false break down. No Sell signal 13. Nov. 1965 - false break down. No Sell signal 14. Sept-Oct 1967 - 11% S2-S9 15. Apr-May 1971 - 12% S19 16. Oct -1988 - 6.8% S1 17. Jan-Feb - 11% S4 18. Dec - 1997 - 6% No Sell signal. 19. Dec - 2007 - 13% S9, S12, S14 20. Apr-May 2008 - 16% ES4, S5, S11, S15 21. Sept-Oct 2012 - 7.6% S6,S4 22. Nov-Dec. 2014 - 5.5% No Sell signal 23. Sept 2020 - 8% S2, S9V, S20 24 Oct-Nov 2021 4% (so far) ES12 There have been 17 such cases with a Peerless Sell. In 10 of these cases the DJI fell 10% or more from its pinnacle. In 4 more instances it fell 7.6% to 9% from its peak. Since QE-123...Infinity was begun in 2009, the declines have been significantly smaller. |
| The Power of Powell's QE Infinity: 2020-2021: Each Reversal Brought A Rally to 2.5% Upper Band or More. Key Values of Peerless When
8 Previous QE Infinity Reversal back upwards Occurs.
2020-2012
Date la/ma 21droc P-I PI ch. IP21 V-I OP 65dup% Ann.65dma ------------------------------------------------------------------------ 5/13/2020 .976 -.35 -99 -182 -.122 -146 .039 -.206 -.96 6/26/2020 .96 -.176 118 -67 -.106 -163 -.054 .179 .60 9/23/2020 .956 -.656 -264 -180 -.102 -219 -.130 .023 .08 10/28/2020 .943 -.394 -24 -85 -.12 -47 -.033 .005 .01 1/29/2021 .974 -.163 17 -77 -.062 -41 -.166 .058 .21 3/4/2021 .986 .09 56 -167 -.016 -47 .170 .035 .13 6/18/2021 .969 -.210 263 -33 -.166 -110 -.013 .008 .03 9/20/2021 .969 -.313 28 -42 -.113 -111 -.354 .004 .01 11/26/2021 .971 -.196 -106 -46 0.0 -96 .082 -.015 -.06 |
DJIA
NEW BUY B2 |
DIA  |
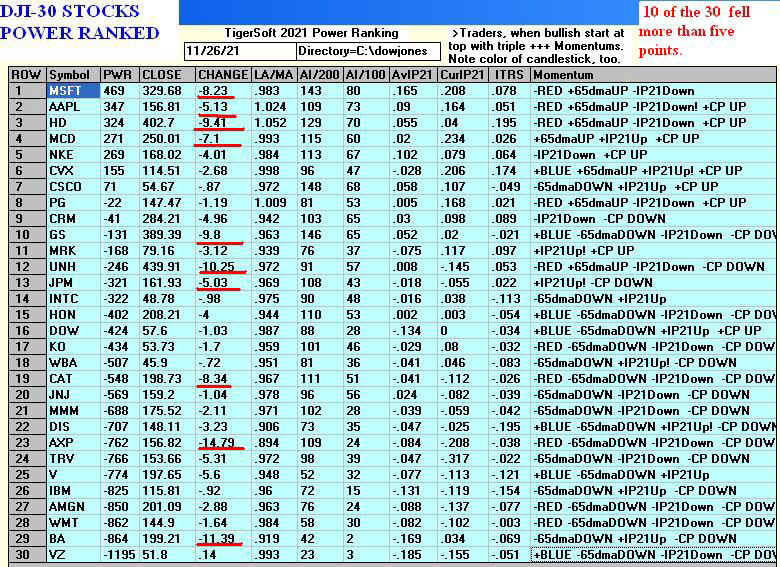 |
 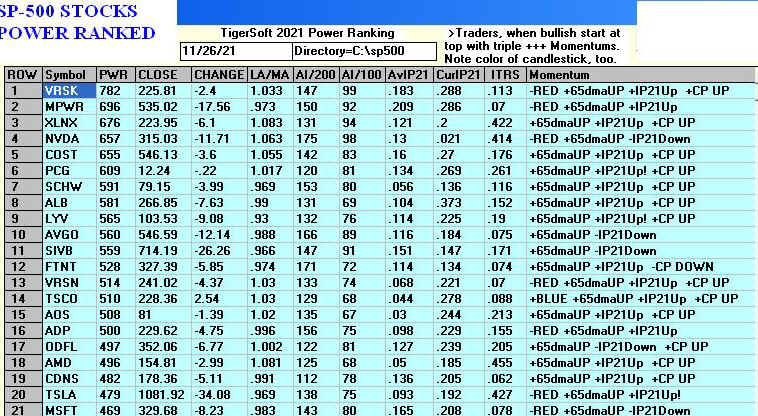 |
 |
 |
Table 1 QUICKSILVER on ETFS - 11/24/21 Bullish = 3 - RETL, SOXL (+.569), TECL Bearish = 0 ETF CLOSE CHANGE PIVOT-PT 5-dma AROC CL-PWR CANDLE IP21 ITRS POWER INDEX ====================================================================================================== DIA 349.02 -9.01 355.91 -144.5% Bearish RED .073 0 ===== --------------------------------------------------------------------------------------------- SPY 458.97 -10.47 468.89 -114.8% ------- RED .131 .024 .155 --------------------------------------------------------------------------------------------- QQQ 391.2 -7.56 403.99 -131.8% ------- RED .13 .032 .162 --------------------------------------------------------------------------------------------- MDY 506.35 -17.28 523.58 -186.6% ------- RED .095 .026 .121 --------------------------------------------------------------------------------------------- IWM 222.85 -8.73 232.72 -258.3% Bearish RED .04 .001 .041 --------------------------------------------------------------------------------------------- FAS 130.1 -13.33 132.81 -248% ------- RED .086 .097 .183 --------------------------------------------------------------------------------------------- RETL 45.42 -3.31 51.06 -948.1% ------- BLUE .271 .06 .331 +++ --------------------------------------------------------------------------------------------- SOXL 61.37 -5.51 68.61 -495.3% Bullish RED .321 .248 .569 +++ --------------------------------------------------------------------------------------------- TECL 76.63 -6.15 84.48 -357.5% Bullish RED .225 .139 .364 +++ --------------------------------------------------------------------------------------------- IBB 154.9 1.5 154.56 39.7% Bearish RED .107 -.104 .003 --------------------------------------------------------------------------------------------- GLD 166.85 -.27 172.61 -208.6% Bearish RED .08 .015 .095 --------------------------------------------------------------------------------------------- OIH 181.73 -10.67 183.77 -327.1% ------- BLUE -.136 -.048 -.184 --------------------------------------------------------------------------------------------- UUP 25.77 -.2 25.75 29% Bullish ---- -.016 .031 .015 --------------------------------------------------------------------------------------------- CORN 25.77 -.2 21.77 926.3% Bearish ---- -.125 .313 .188 --------------------------------------------------------------------------------------------- YINN 9.8 -.89 11.16 -558.1% Bearish RED .012 -.108 -.096 --------------------------------------------------------------------------------------------- RSX 27.67 -1.21 29.92 -532.3% Bearish RED -.054 -.09 -.144 |
Table 2 Count of Stocks in Key Directories
20211126
-------------------------------
NEWHIGHS 54
NEWLOWS 549 (Bearish)
MAXCP 16
MINCP 102
TTTNH 21
TTTNL 106
CPCROSSA 5
CPCROSSD 8
ACCUMVER 241
HIGHIP21 9
HIUPPCT 31
REDSELL 18
AUGSELS7 12
TRAPDOOR 25
|
Table 3 RANKING OF KEY DIRECTORIES BASED PCT.OF STOCKS ABOVE 65-DMA
11/26/21
Bullish = 16
Bearish = 32
---------------------------------------------------------------------------------------
Directory Current day-1 day-2 day-3 day-4 day-5
----------------------------------------------------------------------------------------
HOMEBLDG .882 .882 .882 .882 .882 .882
^^^^^^^^
RETAIL .659 .744 .851 .829 .765 .851
AUTO .641 .754 .754 .773 .735 .792
SEMI .591 .693 .683 .714 .765 .765
^^^^
CHEM .586 .652 .717 .673 .652 .739
SOLAR .562 .75 .75 .75 .875 .812 NIFTY .553 .638 .659 .659 .68 .744 COMPUTER .55 .6 .55 .55 .6 .6 TRANSP .55 .65 .65 .65 .6 .65 INDEXES .543 .695 .695 .679 .673 .679 REGBANKS .52 .96 .96 .92 .92 .92 FINANCE .518 .679 .728 .666 .654 .679 HIGHPRIC .514 .605 .59 .59 .652 .681 SP500 .508 .646 .65 .6 .592 .634 ELECTRON .507 .589 .582 .619 .686 .701 RUS-1000 .502 .669 .673 .638 .61 .651 ========================================================================================= GREEN .5 .6 .6 .65 .65 .7 ======================================================================================== NASD-100 .484 .608 .597 .577 .577 .608 INSURANC .48 .8 .84 .68 .52 .64 INDMATER .472 .611 .666 .638 .597 .652 HACKERS .444 .444 .5 .5 .5 .5 BEVERAGE .428 .642 .714 .714 .5 .642 REIT .427 .671 .641 .625 .648 .709 FIDSTKS .414 .568 .568 .508 .514 .568 GOLD .413 .521 .565 .804 .826 .826 SP-100 .411 .588 .6 .511 .455 .522 SOFTWARE .41 .5 .5 .517 .553 .589 INFRA .393 .636 .575 .575 .484 .515 DJI-13 .384 .538 .615 .461 .384 .461 GUNS .384 .538 .615 .538 .615 .692 GAMING .368 .421 .315 .421 .421 .421 OILGAS .358 .537 .528 .433 .433 .575 FOOD .346 .612 .673 .836 .755 .795 COAL .333 .333 .5 .333 .333 .333 DOWJONES .333 .5 .533 .433 .366 .433 ^^^^^^^^ EDU .333 .333 .333 .333 .333 .333 UTILITY .289 .473 .473 .5 .368 .315 BIGBANKS .285 .428 .857 .428 .285 .285 BONDFUND .284 .193 .193 .329 .329 .363 COMODITY .25 .55 .6 .775 .7 .675 ^^^^^^^^ COPPER .25 .5 .5 .5 .5 .25 HOSPITAL .25 .312 .375 .312 .312 .437 CHINA .235 .352 .333 .352 .411 .313 BIOTECH .215 .245 .243 .259 .29 .287 MARIJUAN .166 .333 .333 .333 .5 .333 LOWPRICE .154 .195 .167 .177 .205 .23 ^^^^^^^^ ETFS .125 .232 .303 .285 .357 .446 MILITARY .115 .346 .384 .307 .384 .461 JETS 0 .076 .076 .076 .076 .153 ^^^^ |
==================================================================================
Friday AM
11/26 - data 11/24 - DJI is
-822 and NASDAQ - 196 2:50 AM PCT
| I was hoping for a day-off to work
some more on my history of "What Really Moves The DJI: 1885-2021.", but no rest
tonight. Bloomberg is busy searching for reasons why the DJI futures are down so much. They chiefly blame the deadly new variations on Covid and Russia's hardliners in the tensions with the Ukraine. I would prefer to blame the DJI's wicked-looking head/shulders pattern and the fears that the next few inflation reports will be very scary and force the FED to raise short-term and 10-year rates. Inflation is also eating up the buying power of lots of people who have not been in a position to buy stocks or have been scared away from them. Stocks like Visa are in trouble already. And the number of stocks making new 12-month lows on the NYSE and NASDAQ is twice as large as those making new highs. The DJI's job is to hold up the appearance that all is well. But that will be difficult until the DJI successfully tests its lower 3.5% band. Even the bullish seasonality is not strong enough to prevent the completion of the DJI's (and DIA's) dangerous head and shoulders patttern. See the second table below. We have emphasized the DJI's (and DIA's) head and shoulders pattern and now we see all our Peerless key Indicators for the DJI in negative territory. Watch Professionals today. They will have a very hard time holding the market up like they did in the light trading just before Thanksgiving. The Closing Powers for DIA did break its up-trend on Wednesday, But this occurred on a light volume day when manipulation is much easier. We need more proof of a bottom. Normally the day after Thanksgiving is also one of very low volume. It will be very interesting to see if the same Professionals who bought on Wednesday to boost the DJI to prevent a completed hand and shoulders pattern there from being completed will do so again today in the shorter hours of trading. When a head and shoulder pattern suddenly appears and is quickly completed, we are in dangerous times. Wall Street is quickly adapting to some very bad news. Be careful now. I recommend staying short the weakest Bearish MINCPS. Wait for Peerless to give a Buy signal before buying any on the Bullish MAXCPs, except DBA which is an ETF shown below that is a long play on agricultural commodites. Inflation, Global Warming and the new Covid types are all lifting food prices globally. |
 |
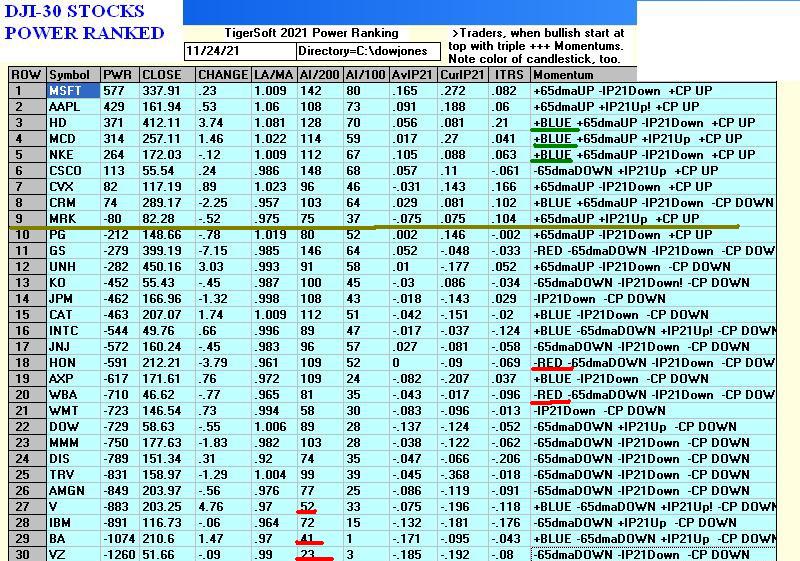 |
 |
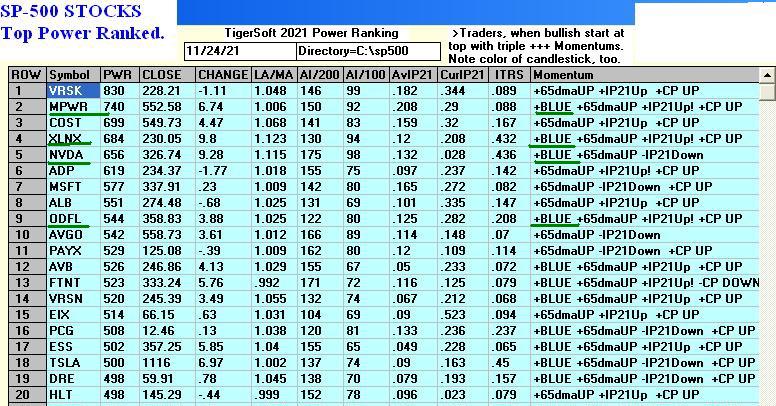 |
DBA - Agricultural Commodites |
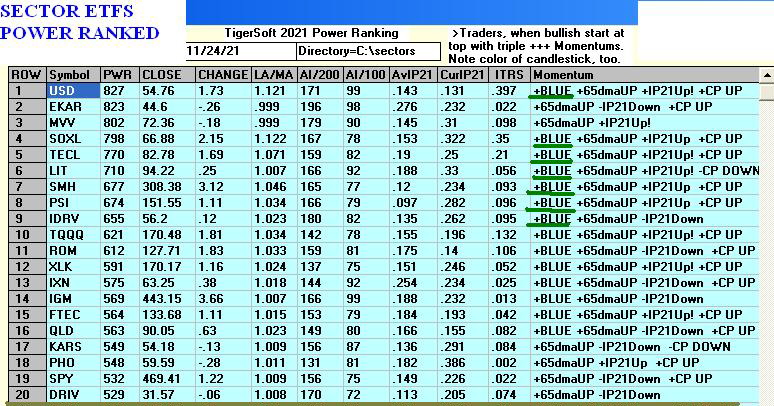 |
Table 1 QUICKSILVER on ETFS - 11/24/21 Bullish = 4 - RETL, SOXL (+.672), TECL, CORN Bearish = 1 - OIH ETF CLOSE CHANGE PIVOT-PT 5-dma AROC CL-PWR CANDLE IP21 ITRS POWER INDEX
======================================================================================================
DIA 358.03 .01 359.35 -25.4% Bearish BLUE .057 ---- -----
---------------------------------------------------------------------------------------------
SPY 469.44 1.25 469.73 13.9% ------- BLUE .153 .022 .175
---------------------------------------------------------------------------------------------
QQQ 398.76 1.28 401.75 14.1% Bullish BLUE .137 .028 .165
---------------------------------------------------------------------------------------------
MDY 523.63 -.16 525.91 -27.9% Bullish BLUE .078 .035 .113
---------------------------------------------------------------------------------------------
IWM 231.58 .25 234.86 -91.7% Bearish BLUE .002 .017 .019
---------------------------------------------------------------------------------------------
FAS 143.43 -.7 137 167.9% ------- BLUE -.034 .179 .145
---------------------------------------------------------------------------------------------
RETL 48.73 -2.18 55.25 -335% ------- BLUE .207 .161 .368
---------------------------------------------------------------------------------------------
SOXL 66.88 2.14 67.98 178.1% Bullish BLUE .322 .35 .672
=====
---------------------------------------------------------------------------------------------
TECL 82.78 1.69 82.53 156.7% Bullish BLUE .25 .209 .459
---------------------------------------------------------------------------------------------
IBB 153.4 .39 153.68 -22.8% Bearish BLUE .125 -.134 -.009
---------------------------------------------------------------------------------------------
GLD 167.12 -.16 173.94 -215.3% ------- BLUE .153 -.031 .122
---------------------------------------------------------------------------------------------
OIH 192.4 .09 194.14 -172% ------- BLUE -.234 -.039 -.273
---------------------------------------------------------------------------------------------
UUP 25.97 .1 25.62 54.3% Bullish ---- .017 .02 .037
---------------------------------------------------------------------------------------------
CORN 25.97 .1 21.77 938.2% Bearish ---- .078 .299 .377
---------------------------------------------------------------------------------------------
YINN 10.69 .09 11.01 -484% Bearish BLUE -.035 -.096 -.131
---------------------------------------------------------------------------------------------
RSX 28.88 -.61 30.81 -402% ------- ---- -.056 -.085 -.141
|
Table 2 Count of Stocks in Key Directories
20211124
-------------------------------
NEWHIGHS 138
NEWLOWS 263
MAXCP 39
MINCP 39
TTTNH 27
TTTNL 35
CPCROSSA 116
CPCROSSD 33
ACCUMVER 242
HIGHIP21 10
HIUPPCT 31
REDSELL 171
AUGSELS7 26
TRAPDOOR 7
|
Table 3 RANKING OF KEY DIRECTORIES BASED PCT.OF STOCKS ABOVE 65-DMA
11/24/21
---------------------------------------------------------------------------------------
Directory Current day-1 day-2 day-3 day-4 day-5
----------------------------------------------------------------------------------------
REGBANKS .96 .96 .92 .92 .92 .96
=====
HOMEBLDG .882 .882 .882 .882 .882 .882
INSURANC .8 .84 .68 .52 .64 .68
AUTO .754 .754 .773 .735 .792 .773
SOLAR .75 .75 .75 .875 .812 1
RETAIL .744 .851 .829 .765 .851 .808
INDEXES .695 .695 .679 .673 .679 .711
SEMI .693 .683 .714 .765 .765 .795
FINANCE .679 .728 .666 .654 .679 .74
REIT .671 .633 .625 .648 .702 .717
RUS-1000 .669 .673 .638 .61 .653 .696
CHEM .652 .717 .673 .652 .739 .804
TRANSP .65 .65 .65 .6 .65 .75
SP500 .644 .648 .599 .595 .634 .687
=====
BEVERAGE .642 .714 .714 .5 .642 .714
NIFTY .638 .659 .659 .68 .723 .765
INFRA .636 .575 .575 .484 .515 .606
FOOD .612 .673 .836 .755 .795 .795
INDMATER .611 .666 .638 .597 .652 .694
NASD-100 .608 .597 .577 .577 .608 .649
HIGHPRIC .603 .589 .589 .65 .676 .72
COMPUTER .6 .55 .55 .6 .6 .7
GREEN .6 .6 .65 .65 .7 .65
ELECTRON .589 .582 .619 .686 .701 .731
SP-100 .588 .6 .511 .455 .522 .6
FIDSTKS .568 .568 .508 .514 .568 .668
COMODITY .55 .6 .775 .7 .675 .675
DJI-13 .538 .615 .461 .384 .461 .538
GUNS .538 .615 .538 .615 .692 .692
OILGAS .537 .528 .433 .433 .594 .622
GOLD .521 .565 .804 .826 .847 .826
=========================================================================================
COPPER .5 .5 .5 .5 .25 .25
DOWJONES .5 .533 .433 .366 .433 .533
====
SOFTWARE .5 .5 .517 .553 .589 .625
UTILITY .473 .473 .5 .368 .315 .368
HACKERS .444 .5 .5 .5 .5 .555
BIGBANKS .428 .857 .428 .285 .285 .571
GAMING .421 .315 .421 .421 .421 .631
CHINA .352 .333 .352 .411 .313 .49
MILITARY .346 .384 .307 .384 .461 .5
COAL .333 .5 .333 .333 .333 .333
EDU .333 .333 .333 .333 .333 .166
MARIJUAN .333 .333 .333 .5 .333 .5
HOSPITAL .312 .375 .312 .312 .437 .375
BIOTECH .245 .243 .259 .29 .287 .323
ETFS .232 .303 .285 .357 .446 .625
LOWPRICE .196 .164 .176 .204 .242 .277
BONDFUND .183 .183 .321 .321 .356 .333
JETS .076 .076 .076 .076 .153 .307
--------------------
|
======================================================================================
Wednesday AM
======================================================================================
Written 11-24- 5:45 AM DJI -145 NASDAQ -63 Data through 11/23
| Happy Thanksgiving, everyone.
There will be no full Hotline Thursday night. The next one will be on Sunday. Look
for our email giving a new address on Saturday. If you need to renew, email william_schmidt@hotmail.com the CC, exp
date, Sec code & zio code in four separate emails for security. This Hotline is still $400.00 for a year. It will be $450 next year for a year. ----------------------------------------------------------------------------------------------- Now let's catch up on the market. First,
the Closing Powers for the DJI (DIA), NASDAQ, SP-500 (SPY), SOXL (Semi-conductors) and
TECL are all in downtrends. This is bearish. I see no reason to fight the
Professionals right now. Possibly, the bearish pattern in DIA, the falling
Closing Powers and the shadow of the bear on so many stocks will be explained by a
forthcoming upside breakout by the short-term rates and by the 10-year bond rates breaking
out. If the CPI jumps to 7%, I think you can count on that. If this happens,
expect the DJIA and DIA to complete a new head and shoulders pattern. See their
charts below. |
|
Charts - 11/23/2021
2021 PEERLESS DJI, Signals, Indicators Daily DJI Volume 10-DayUp/Down Vol Stoch-20 Inverted Traders Index Graph of Pct of All Stocks above 65-dma Cum. Inverted Traders Index DJI-IPA DJI-OBV NASDAQ S&P OEX NYSE COMPQX DJI-15 DJI-20 DJI-30 DIA QQQ SPY IWM TNA Short-Term Rates DOLLAR-UUP ALLSTOCKs recent 2006 vers-Peerless signals http://tigersoftware.com/NEWPEER/UPD71123.BMP MDY - http://www.tigersoftware.com/CHARTZ/MDY.GIF USO-CrudeOil DBO FAS GLD BBH IBB JETS JNUG KOL NUGT OIH PALL RSX RETL SDS AGQ SLV SOXL TAN TECL TLT TMF TNA UGA (gasoline) USO (oil) and China: YINN CHAU Commodities: CANE CORN DBC JJC, NIB CORN, CUT (paper) MOO, SOYB WEAT UUP (Dollar) LIT (Lithium) STOCKS: MRNA DIS GE PYPL GME ZOM XLE NRGU AAPL ADBE ALXN AMAT AMGN AMD AMZN AXP BA BABA BAC BIDU BLDP CAT CRM CVX CMG DE ENPH FB GILD GOOG GS HD IBM INTU JPM LRCX M MRK MSFT NEM NFLX NKE NVDA PG PYPL REGN REV SO SQ QCOM QDEL TSLA TXN XOM V VRTX WFC WMT ZM more added Bullish MAXCPs http://tigersoftware.com/UPPER/11-23/BULLISH.htm more added Bearish MAXCPs http://tigersoftware.com/DOWNER/11-23/BEARISH.htm |
||
DJI with Peerless Signals - Dangerous Potential Head/Shoulders |
||
| DIA - Heed direction of Closing Power trends. This shows what
Professionals Expect In an era of FED domination, well-connected Professionals can show us the way. The DJIA's H/P and falling CP are clearer on the candle-stick chart.  |
||
| SPY - Heed direction of Closing Power trends. This shows what
Professionals Expect In an era of FED domination, well-connected Professionals can show us the way.  |
||
SP-500 - Top Tiger Power Ranked. |
||
NASDAQ - Heed the falling Closing Power and IP21 trend. Observe
Price trend. |
||
QQQ
|
||
| TECL
|
||
|
||
 |
||
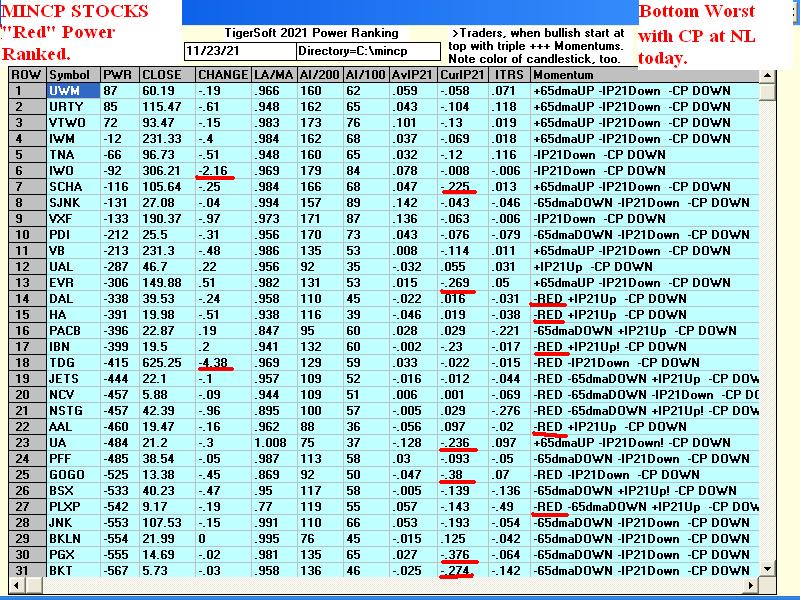 |
||
Table 1 Count of Stocks in Key Directories
20211123
-------------------------------
NEWHIGHS 166
NEWLOWS 704 Bearish
MAXCP 23
MINCP 149 Bearish
TTTNH 23
TTTNL 104
CPCROSSA 78
CPCROSSD 30
ACCUMVER 240
HIGHIP21 10
HIUPPCT 33
REDSELL 175
AUGSELS7 51
TRAPDOOR 7
|
||
Table 3 RANKING OF KEY DIRECTORIES BASED PCT.OF STOCKS ABOVE 65-DMA
11/23/21
Bullish = 33
Bearish = 12
---------------------------------------------------------------------------------------
Directory Current day-1 day-2 day-3 day-4 day-5
----------------------------------------------------------------------------------------
REGBANKS .96 .92 .92 .92 .96 .96
HOMEBLDG .882 .882 .882 .882 .882 .882
BIGBANKS .857 .428 .285 .285 .571 .714
RETAIL .851 .829 .765 .851 .808 .893
INSURANC .84 .68 .52 .64 .68 .84
AUTO .754 .773 .735 .792 .773 .83
SOLAR .75 .75 .875 .812 1 .937
FINANCE .728 .666 .654 .679 .74 .765
CHEM .717 .673 .652 .739 .804 .826
BEVERAGE .714 .714 .5 .642 .714 .785
INDEXES .695 .679 .673 .679 .701 .739
SEMI .683 .714 .765 .765 .795 .795
FOOD .673 .836 .755 .795 .795 .795
RUS-1000 .673 .638 .61 .653 .696 .727
INDMATER .666 .638 .597 .652 .694 .722
NIFTY .659 .659 .68 .744 .744 .787
TRANSP .65 .65 .6 .65 .75 .75
SP500 .648 .599 .595 .634 .687 .707
REIT .633 .618 .648 .702 .717 .748
DJI-13 .615 .461 .384 .461 .538 .692
GUNS .615 .538 .615 .692 .692 .692
COMODITY .6 .775 .7 .675 .675 .7
GREEN .6 .65 .65 .7 .65 .7
SP-100 .6 .511 .455 .522 .6 .633
NASD-100 .597 .577 .577 .608 .649 .68
HIGHPRIC .589 .589 .65 .676 .72 .745
ELECTRON .582 .619 .686 .701 .731 .761
INFRA .575 .575 .484 .515 .606 .666
FIDSTKS .568 .508 .514 .568 .668 .692
GOLD .565 .804 .826 .847 .826 .869
COMPUTER .55 .55 .6 .6 .7 .75
DOWJONES .533 .433 .366 .433 .533 .6
OILGAS .528 .433 .433 .594 .622 .735
=========================================================================================
COAL .5 .333 .333 .333 .333 .5
COPPER .5 .5 .5 .25 .25 .5
HACKERS .5 .5 .5 .5 .555 .555
SOFTWARE .5 .517 .553 .589 .625 .625
=========================================================================================
UTILITY .473 .5 .368 .315 .342 .394
MILITARY .384 .307 .384 .461 .5 .538
HOSPITAL .375 .312 .312 .437 .375 .437
CHINA .333 .352 .411 .313 .47 .509
EDU .333 .333 .333 .333 .166 .333
MARIJUAN .333 .333 .5 .333 .5 .5 GAMING .315 .421 .421 .421 .631 .684 ETFS .303 .285 .357 .446 .625 .696 BIOTECH .247 .263 .293 .291 .326 .368 BONDFUND .193 .329 .329 .363 .329 .375 LOWPRICE .167 .174 .205 .243 .275 .326 JETS .076 .076 .076 .153 .307 .307 |
======================================================================================================
=====================================================================================
Written 11-23- 6:00 AM DJI +28 NASDAQ -18 Data through 11/22
| Powell's renomination as FED
chairman had the expected upward push on bank stocks and FAS, but coincided with a last
minute sell-off on the DJI, as a whole. In addition, we see bearish inverted red
popsicles on most of the leading tech ETFS and tech stocks as well as the NASDAQ. I
suggested taking profits in them in this event and going short some of many bearish
MINCPs. The number of new lows on the NYSE and NASDAQ has reached 683 on the NYSE and NASDAQ. So a bear market has spread its shadow quite widely. But Powell has come through time and again in holding up the market. And I would expect him to do so again. Short-term rates fell back to 0.4% today. I suspect that the rest of Thanksgiving week will see a small recovery of what was lost this afternoon. But Professionals are not yet ready to buy aggressively. The many Closing Power non-confirmations of new highs today in the tech sector followed by breaks in the steep CP uptrends show that there are other problems for the market, such as the enormous debt, rising Covid statistics, 6%+ inflation and limits on liquidity insertions by the FED. Without a new Peerless Buy signal or breaks in the Closing Power downtrends of the key ETFs, I would wait to buy again. Instead, study how well the Power Ranking work with the MINCP stocks in the third Power Ranking shown below today. We are going to make a lot of money when the market turns broadly down using the Power Ranker. |
|
Charts - 11/23/2021
2021 PEERLESS DJI, Signals, Indicators Daily DJI Volume 10-DayUp/Down Vol Stoch-20 Inverted Traders Index Graph of Pct of All Stocks above 65-dma Cum. Inverted Traders Index DJI-IPA DJI-OBV NASDAQ S&P OEX NYSE COMPQX DJI-15 DJI-20 DJI-30 DIA QQQ SPY IWM TNA Short-Term Rates DOLLAR-UUP ALLSTOCKs recent 2006 vers-Peerless signals http://tigersoftware.com/NEWPEER/UPD71122.BMP MDY - http://www.tigersoftware.com/CHARTZ/MDY.GIF USO-CrudeOil DBO FAS GLD BBH IBB JETS JNUG KOL NUGT OIH PALL RSX RETL SDS AGQ SLV SOXL TAN TECL TLT TMF TNA UGA (gasoline) USO (oil) and China: YINN CHAU Commodities: CANE CORN DBC JJC, NIB CORN, CUT (paper) MOO, SOYB WEAT UUP (Dollar) LIT (Lithium) STOCKS: MRNA DIS GE PYPL GME ZOM XLE NRGU AAPL ADBE ALXN AMAT AMGN AMD AMZN AXP BA BABA BAC BIDU BLDP CAT CRM CVX CMG DE ENPH FB GILD GOOG GS HD IBM INTU JPM LRCX M MRK MSFT NEM NFLX NKE NVDA PG PYPL REGN REV SO SQ QCOM QDEL TSLA TXN XOM V VRTX WFC WMT ZM Bullish MAXCPs http://tigersoftware.com/UPPER/11-22/BULLISH.htm Bearish MAXCPs http://tigersoftware.com/DOWNER/11-22/BEARISH.htm |
  Approaching oversold.  |
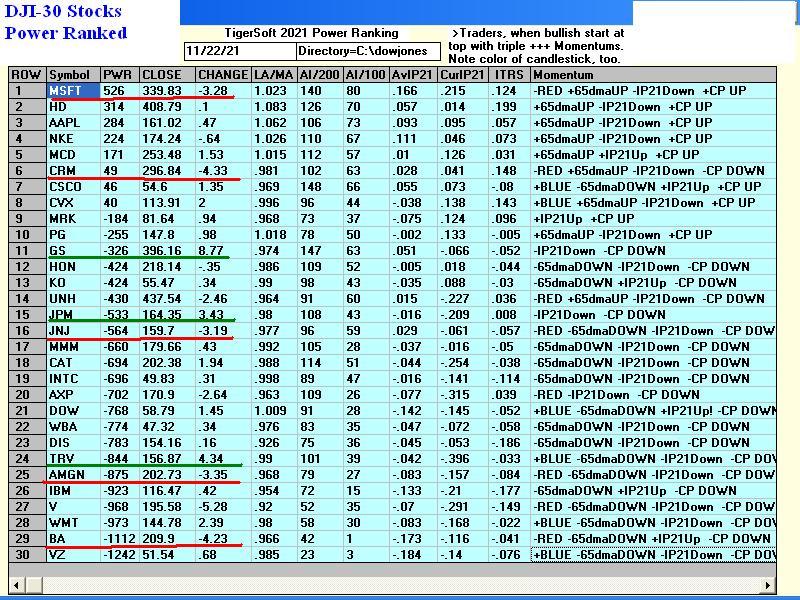 |
 |
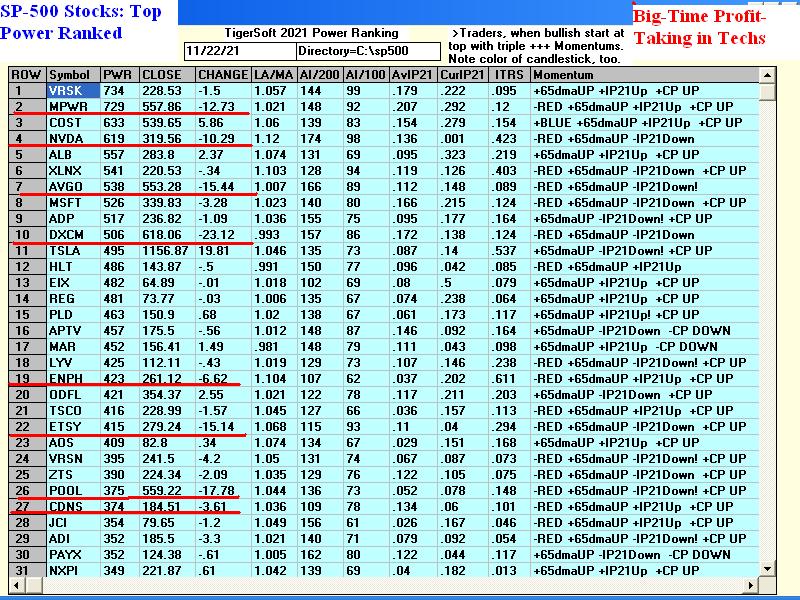 |
 |
 |
 |
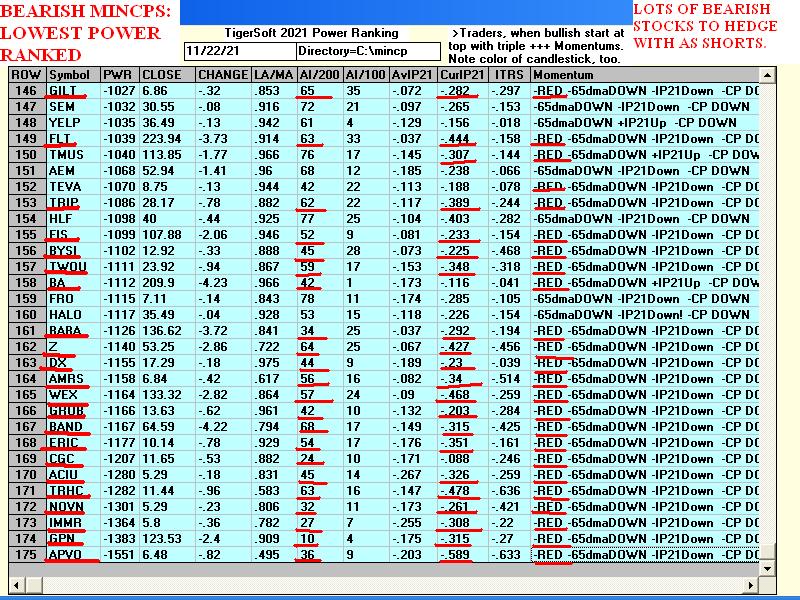 |
Table 1 QUICKSILVER on ETFS - 11/22/21 Bullish = 4 - RETL, SOXL (+.598), TECL, CORN Bearish = 1 - OIH ETF CLOSE CHANGE PIVOT-PT 5-dma AROC CL-PWR CANDLE IP21 ITRS POWER INDEX ================================================================================================ DIA 356.2 .29 361.93 -70.1% Bearish RED -.077 ---- ----- --------------------------------------------------------------------------------------------- SPY 467.57 -1.32 469.28 1.5% ------- RED .063 .027 .09 --------------------------------------------------------------------------------------------- QQQ 399.3 -4.69 397.42 58.8% ------- RED .066 .041 .107 --------------------------------------------------------------------------------------------- MDY 524.2 .62 531.03 -55.8% ------- RED -.002 .043 .041 --------------------------------------------------------------------------------------------- IWM 231.73 -.99 238.99 -144.4% Bearish RED -.065 .02 -.045 --------------------------------------------------------------------------------------------- FAS 138.18 5.37 143.26 -193.4% Bearish BLUE -.127 .127 0 --------------------------------------------------------------------------------------------- RETL 53.25 2.19 56.2 -99.4% ------- BLUE .151 .293 .444 --------------------------------------------------------------------------------------------- SOXL 65.43 -3.18 66.15 168.7% Bullish RED .251 .347 .598 --------------------------------------------------------------------------------------------- TECL 81.66 -2.82 80.96 193% Bullish RED .112 .226 .338 --------------------------------------------------------------------------------------------- IBB 153.68 -.88 154.06 16.2% Bearish RED .027 -.117 -.09 --------------------------------------------------------------------------------------------- GLD 168.74 -3.87 172.92 -156.7% ------- RED .152 -.014 .138 --------------------------------------------------------------------------------------------- OIH 185.79 2.02 206.64 -471.2% Bearish BLUE -.299 -.047 -.346 --------------------------------------------------------------------------------------------- UUP 25.88 .13 25.74 46.7% Bullish ---- .016 .021 .037 --------------------------------------------------------------------------------------------- CORN 25.88 .13 25.74 862.2% Bearish ---- .173 .301 .474 --------------------------------------------------------------------------------------------- YINN 10.74 -.42 12.16 -445% Bearish RED -.084 -.165 -.249 --------------------------------------------------------------------------------------------- RSX 28.36 -1.56 31.03 -482.5% Bearish RED -.121 -.088 -.209 |
Table 2 Count of Stocks in Key Directories
20211122
-------------------------------
NEWHIGHS 348
NEWLOWS 683 bearish.
MAXCP 10
MINCP 175 bearish
TTTNH 23
TTTNL 117
CPCROSSA 58
CPCROSSD 56
ACCUMVER 239
HIGHIP21 12
HIUPPCT 27
VHIP21 85
LOWACCUM 154
REDSELL 181
AUGSELS7 52
TRAPDOOR 10
|
Tablle 3 RANKING OF KEY DIRECTORIES BASED PCT.OF STOCKS ABOVE 65-DMA
11/22/21
Bullish = 30
Bearish = 16
---------------------------------------------------------------------------------------
Directory Current day-1 day-2 day-3 day-4 day-5
----------------------------------------------------------------------------------------
REGBANKS .92 .92 .92 .96 .96 .96
HOMEBLDG .882 .882 .882 .882 .882 .882
FOOD .836 .755 .795 .795 .795 .755
RETAIL .829 .765 .851 .808 .893 .936
GOLD .804 .826 .847 .826 .869 .913
COMODITY .775 .7 .675 .675 .7 .7
AUTO .773 .735 .792 .773 .83 .83
SOLAR .75 .875 .812 1 .937 .937
BEVERAGE .714 .5 .642 .714 .714 .785
SEMI .714 .765 .765 .795 .795 .795
^^^^^
INSURANC .68 .52 .64 .68 .84 .84
INDEXES .679 .673 .679 .701 .733 .771
CHEM .673 .652 .739 .804 .826 .804
FINANCE .666 .654 .679 .74 .765 .753
NIFTY .659 .68 .744 .765 .787 .808
GREEN .65 .65 .7 .65 .7 .8 TRANSP .65 .6 .65 .75 .75 .9 INDMATER .638 .597 .652 .694 .722 .763 RUS-1000 .638 .61 .653 .696 .727 .736 ELECTRON .619 .686 .701 .731 .761 .738 REIT .618 .641 .702 .717 .74 .801
SP500 .599 .595 .634 .687 .707 .719
^^^^^
HIGHPRIC .59 .652 .677 .721 .75 .728
NASD-100 .577 .577 .608 .649 .69 .69
^^^^^
INFRA .575 .484 .515 .606 .666 .727
COMPUTER .55 .6 .6 .7 .75 .7
GUNS .538 .615 .692 .692 .692 .692
SOFTWARE .517 .553 .589 .625 .625 .589
SP-100 .511 .455 .522 .6 .633 .677
FIDSTKS .508 .514 .568 .668 .692 .704
-----------------------------------------------------------------------------------------
COPPER .5 .5 .25 .25 .5 .625
HACKERS .5 .5 .5 .555 .555 .555
UTILITY .5 .368 .315 .342 .394 .473
-----------------------------------------------------------------------------------------
DJI-13 .461 .384 .461 .538 .692 .692
DOWJONES .433 .366 .433 .533 .6 .733
^^^^^
OILGAS .433 .433 .594 .622 .735 .735
BIGBANKS .428 .285 .285 .571 .714 .714
GAMING .421 .421 .421 .631 .684 .684
CHINA .352 .411 .313 .47 .509 .509 COAL .333 .333 .333 .333 .5 .5 EDU .333 .333 .333 .166 .333 .333 MARIJUAN .333 .5 .333 .5 .5 .666 BONDFUND .329 .329 .363 .329 .352 .34 HOSPITAL .312 .312 .437 .375 .437 .437 MILITARY .307 .384 .461 .5 .538 .653 ETFS .285 .357 .446 .625 .696 .714 BIOTECH .263 .293 .291 .326 .37 .37 LOWPRICE .176 .204 .244 .277 .323 .358 JETS .076 .076 .153 .307 .307 .615 |
=====================================================================================
Written
11-22- 3:57 AM DJI +173 NASDAQ +63 Data
through 11/19
| Word may have leaked out that Biden
will re-appoint Wall Street's friend and supporter, Jerome Powell, as Fed Chairman. That would explain the strength this morning before the opening. If so, Professionals will likely buy steadily all day. And we should, too. Afterall, the FAS ETF (representing financials) has fallen back to good support at its 65-dma and there usually is a rally the week of Thanksgiving. Historically, the DJI rises modestly two thirds of the time over the next week, two weeks and month in the first year of a Presidential Election since 1965. Since the Closing Powers have not yet turned up for DIA and FAS, I would rather be long the much stronger tech ETFs: SOXL and TECL. QQQ stands right at the top of its price channel. Watch it. A breakout move higher by QQQ would be quite bullish for it and other tech stocks. More shorts there will be run in. MSFT and NVDA made new highs on Friday. This bodes well for QQQ. See their lofty position in our SP-500 Tiger power- ranking. Note how the highest IP21 rankings. This correlates closely with big daily gains at the top of the Power Ranking while the very lowest IP21 stocks over-populate the stocks down the most frequently. This is now a market where there are more new lows than new highs. Professional money has a habit in this market environment of playing "musical chairs" and still pushing up the best performing stocks at the end of the year and selling off quickly those that break support. We can confirm breakdowns by looking for negative Accumulation and falling Closing Power. Once the "dumping" starts, these stocks often drop a long ways. Shorting them soon after they break support in this manner, is a good way to hedge, as is shorting the very lowest Power Ranked MINCPs, which can fall day after day until there is a selling climax. Watch the Closing Powers for the leading tech stocks. It may be bearish when Professionals become net sellers of them and their over-extended Closing Power uptrends are violated. "Big red popsicles" in their candle-sticks will cause traders to take profits in them at this point. If that were happen today, the early rumors may be wrong and Biden may still be about to pick a new Fed Chairman with all the risks for the market that that may bring. Biden is probably delaying making an announcement because he using that as a bargaining chip with some Senators over his big Public Works legislation. |
Hotline Help
====================================================================================
Earlier Hotlines:
www.tigersofware.com/1111H/INDEX.htm
www.tigersoftware.com/1247/INDEX.htm
www.tigersoftware.com/1247HL/OLDINDEX.htm
www.tigersoftware.com/1492THL/INDEX.htm
www.tigersoftware.com/212THEN/INDEX.htm
www.tigersoft.com/711THL/INDEX.htm
www.tigersoft.com/1919H/OLDINDEX.htm
2020
www.tigersoft.com/777BLM/INDEX.htm
www.tigersoft.com/20HLM/INDEX.htm
www.tigersoft.com/2020NIGHT/INDEX.htm
www.tigersoft.com/4ACES1/INDEX.htm
www.tigersoft.com/48HLA/INDEX.htm
www.tigersoft.com/QUICKER/INDEX.htm
www.tigersoft.com/QUICK/INDEX.htm
www.tigersoft.com/77HLZ/INDEX.htm
www.tigersoft.com/44THL/INDEX.htm
www.tigersoft.com/21PEY3/INDEX-2.htm
www.tigersoft.com/19HLK5/INDEX.htm
www.tigersoft.com/44UHL/INDEX.htm
www.tigersoft.com/NHLP/INDEX.htm
www.tigersoft.com/7LHL/INDEX.htm
www.tigersoft.com/NHL718/INDEX.htm
www.tigersoft.com/21MAY18/INDEX.htm
www.tigersoft.com/55HEP/INDEX.htm
www.tigersoft.com/44H4L/INDEX2.htm
==============================================================================
Hotline Help:
INDICATORS' DEFINITIONS and
EXPLANATIONS
A Guide
To Profitably Using The Tiger Nightly HOTLINE
Introduction to Tiger/Peerless Buys and
Sells.
Peerless Buy and
Sell Signals: 1928-2016
Individual Peerless signals explained:
http://tigersoftware.com/PeerlessStudies/Signals-Res/index.htm
http://www.tigersoft.com/PeerInst-2012-2013/
Explanation of each Peerless signal. http://www.tigersoft.com/PeerInst-2012-2013/
Different
Types of TigerSoft/Peerless CHARTS, Signals and Indicators
-----> More HELP
LINKS
Documentation for TigerSoft
Automatic and Optimized Signals.
How reliable support is the
DJI's rising 200-day ma?
SPY Charts since 1994:
Advisory Closing Power S7s, Accum. Index, 65-dma, Optimized Signals.
^^^^^^^^^^^^^^^^^^^^^^^^^^^^^^^^^^^^^^^^^^^^^^^^
1/19/2016 ---> Corrections,Deeper
Declines and Bear Markets since 1945.
1/21/2016 ---> High
Velocity Declines since 1929
2/12/2016 --->
Presidential
Elections Years and Bullish IP21 Positive Non-Confirmations at Lower Band.
2/12/2016
---> OBV
NNCs on DJI's Rally to 2.7% Upper Band when DJI's 65-dma is falling.
11/6/2016 --->
Killer Short Selling
Techniques:
TigerSoft
"Combination" Short-Selling... Easy as 1-2-3 Short Sales
Earlier Q-Answers
QuickSilver Documentation (1/11/2016)
Our Different Signals
Better understand the difference between
Peerless DJI-based signals,
the one-year optiized red Signals and the fixed signals based on technical developments.
Introduction to Tiger/Peerless Buys and Sells.
Different Types of
TigerSoft/Peerless CHARTS, Signals and Indicators
================================================================
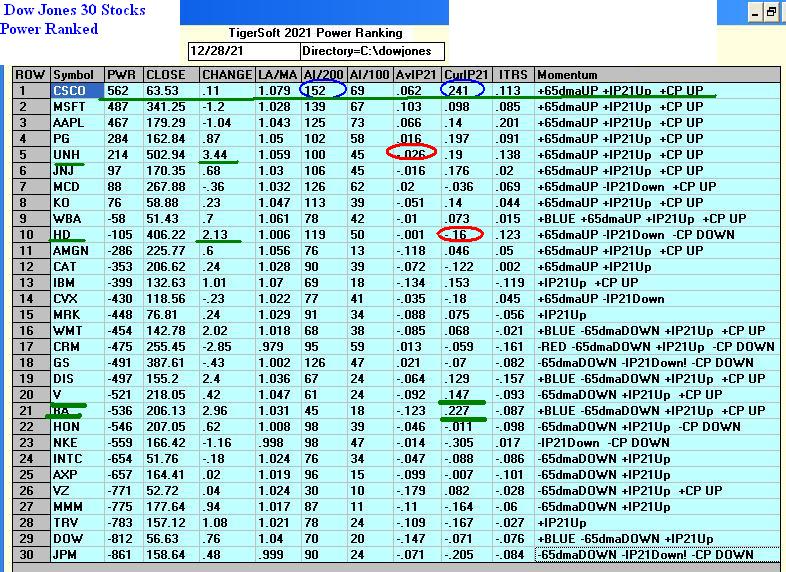
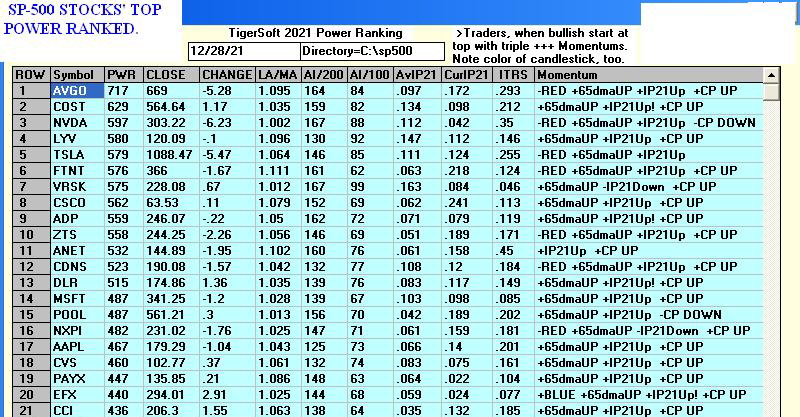
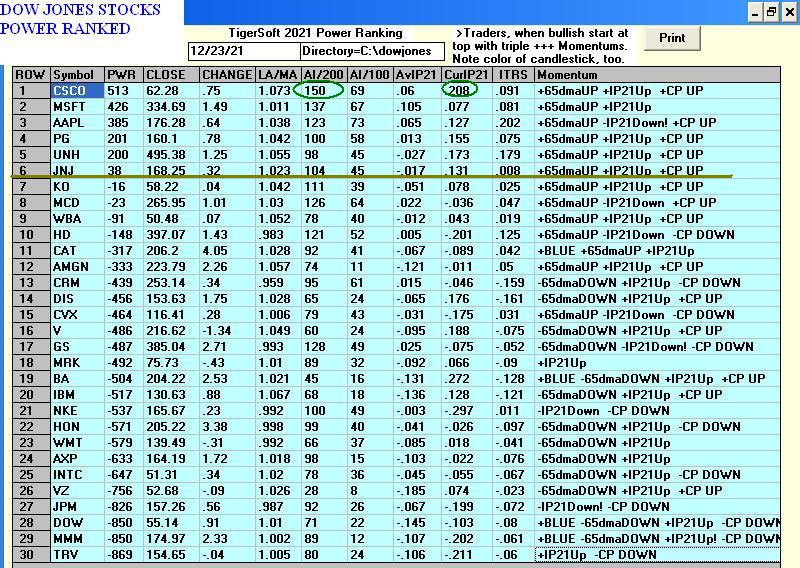

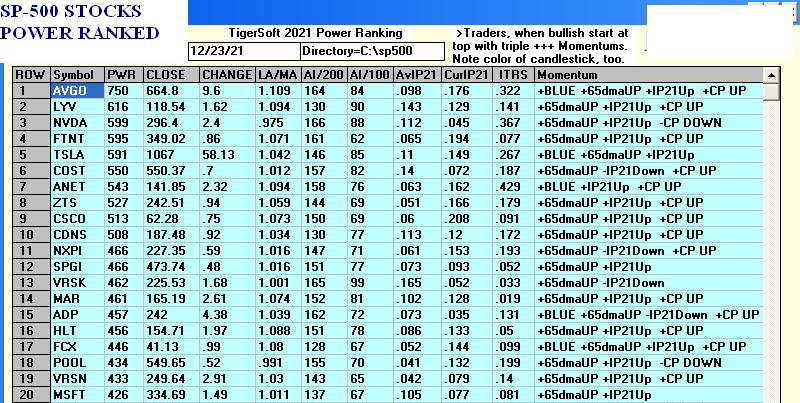
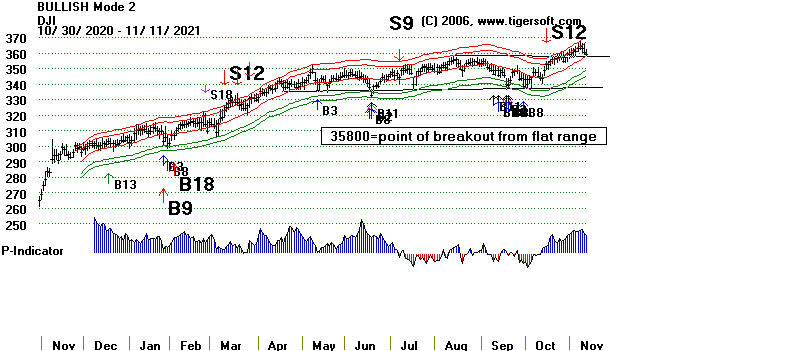
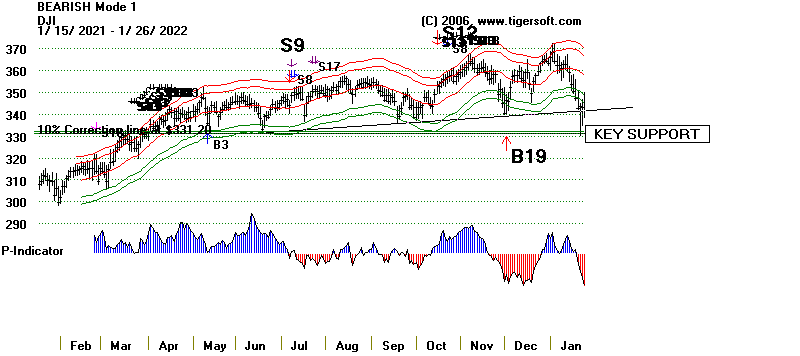
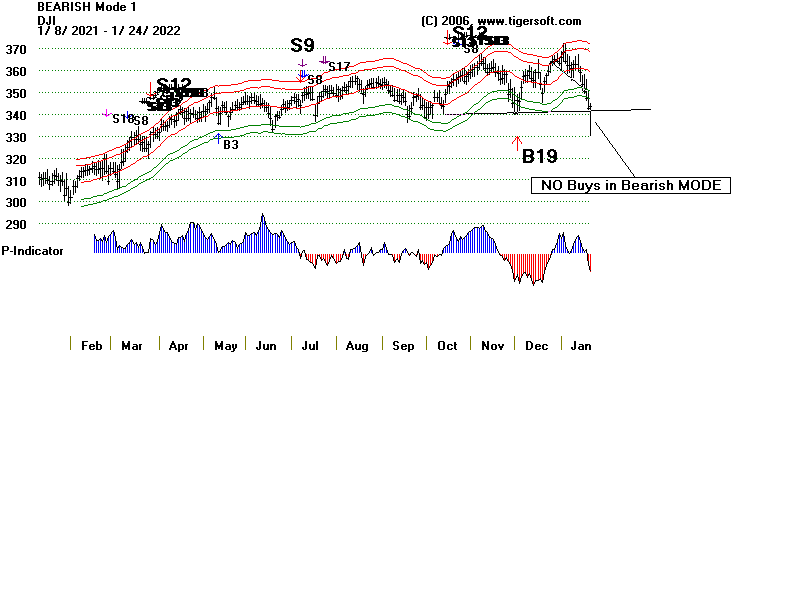
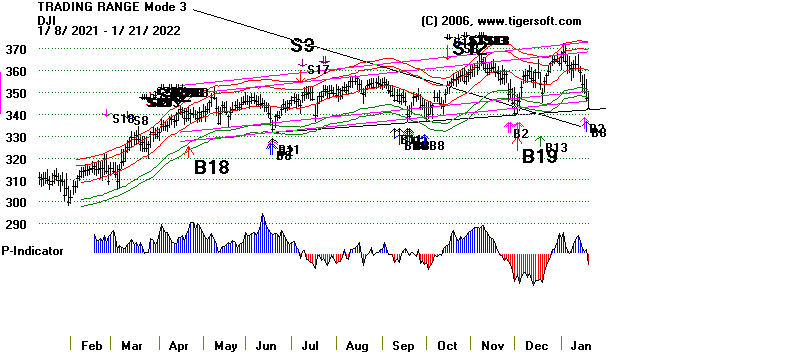
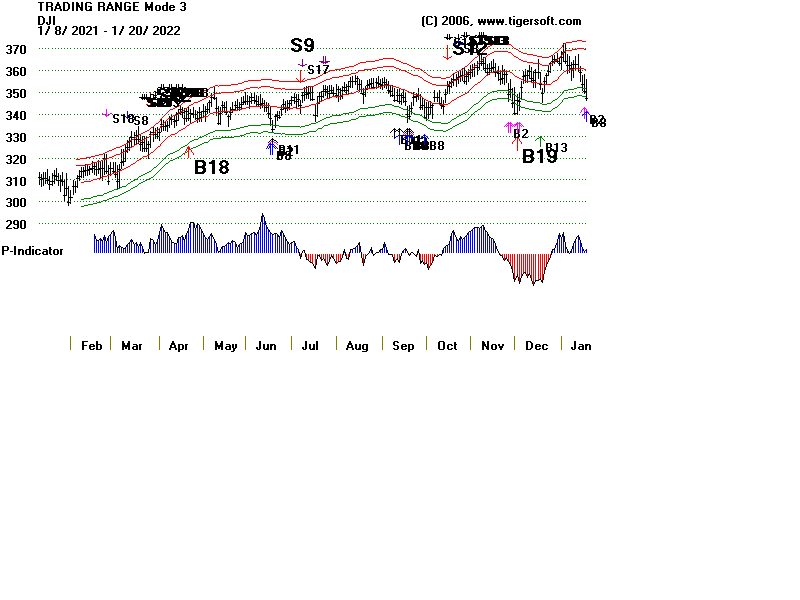
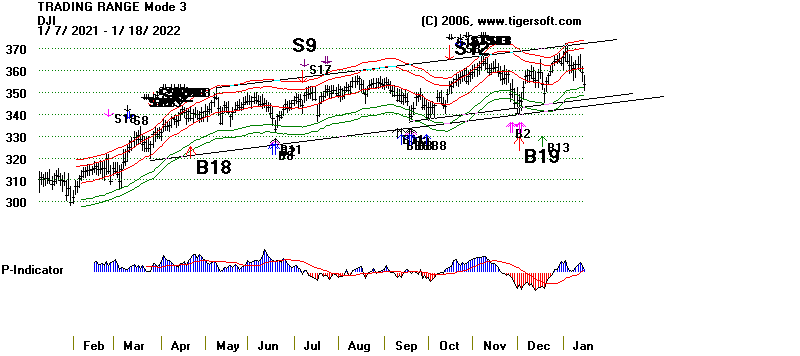
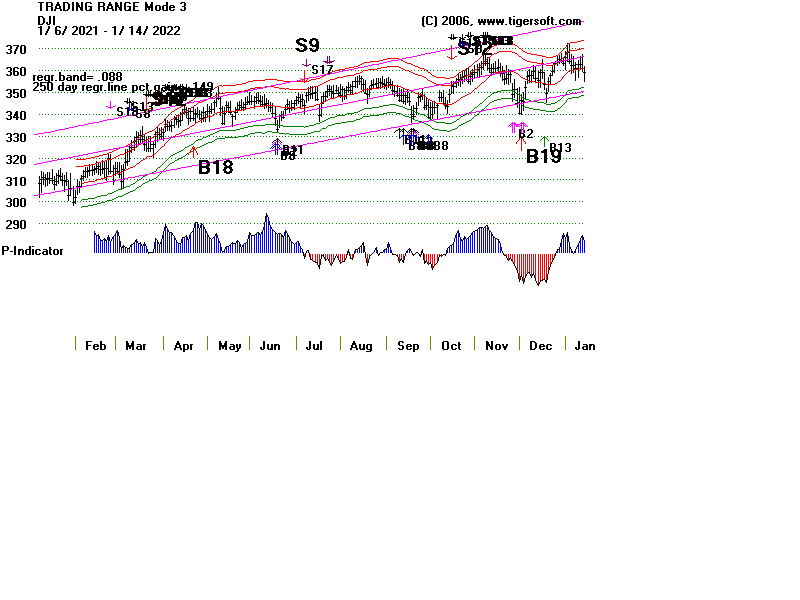
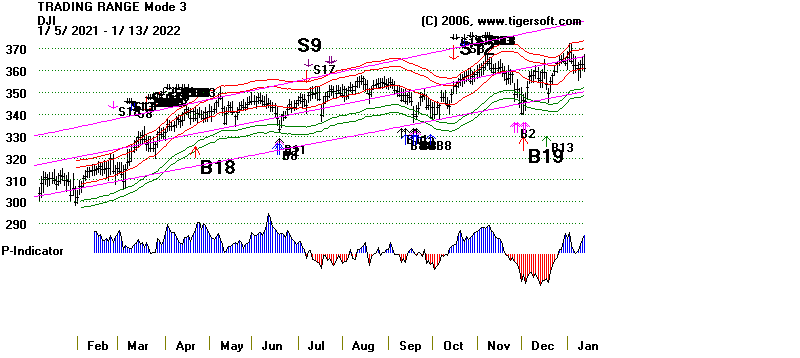
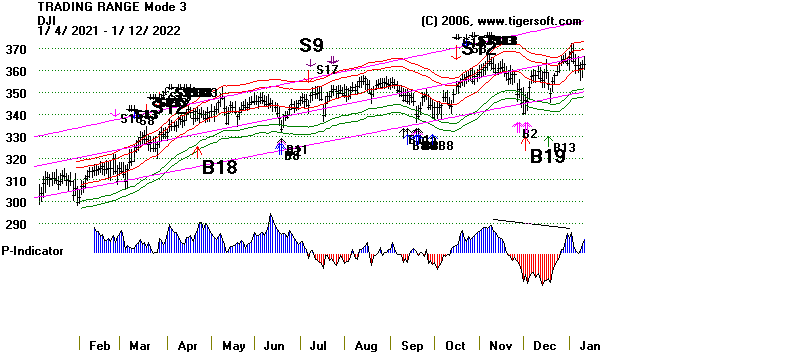
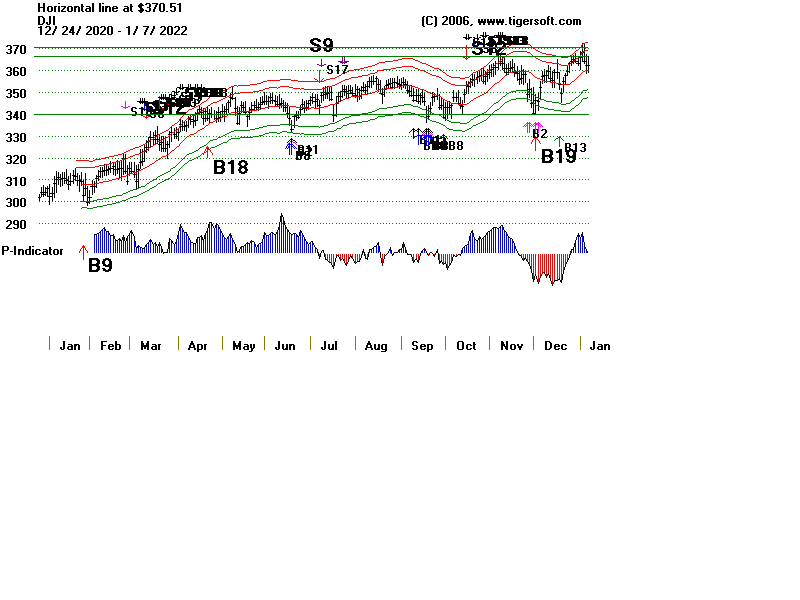
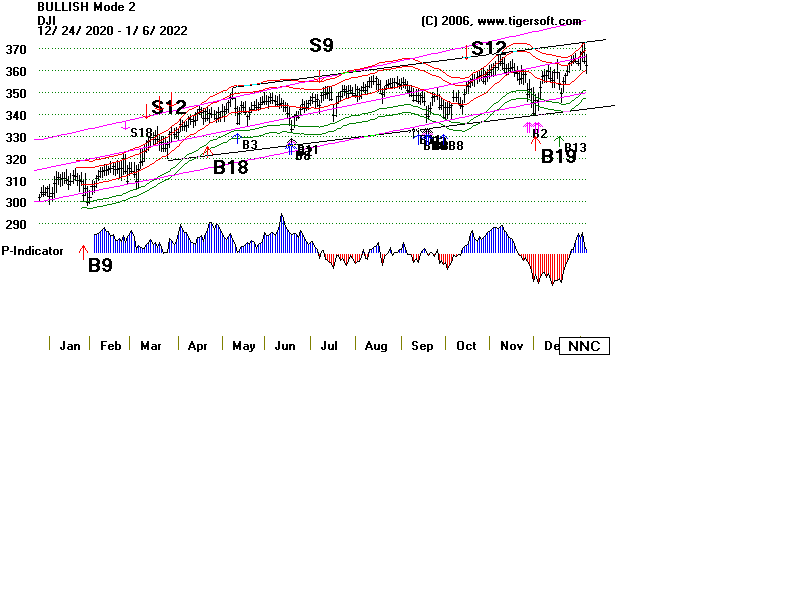
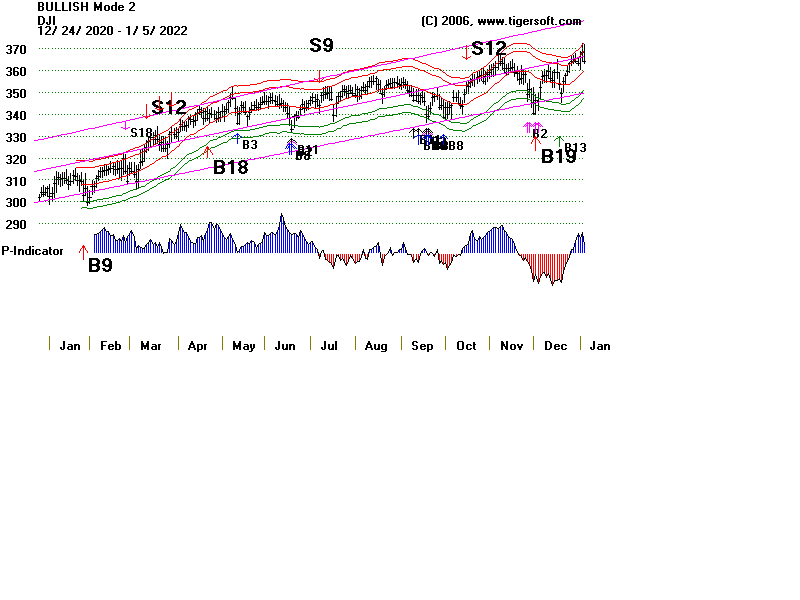
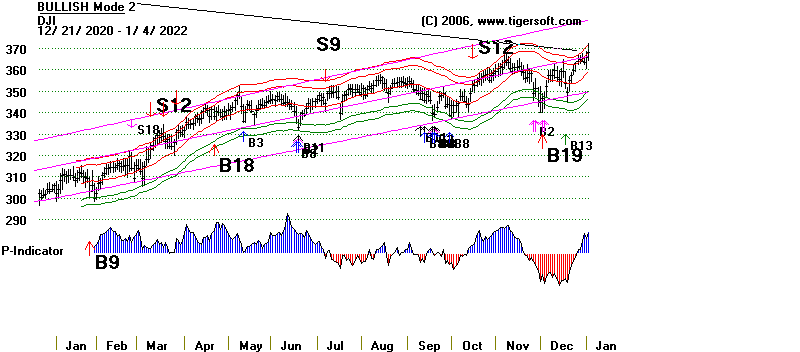
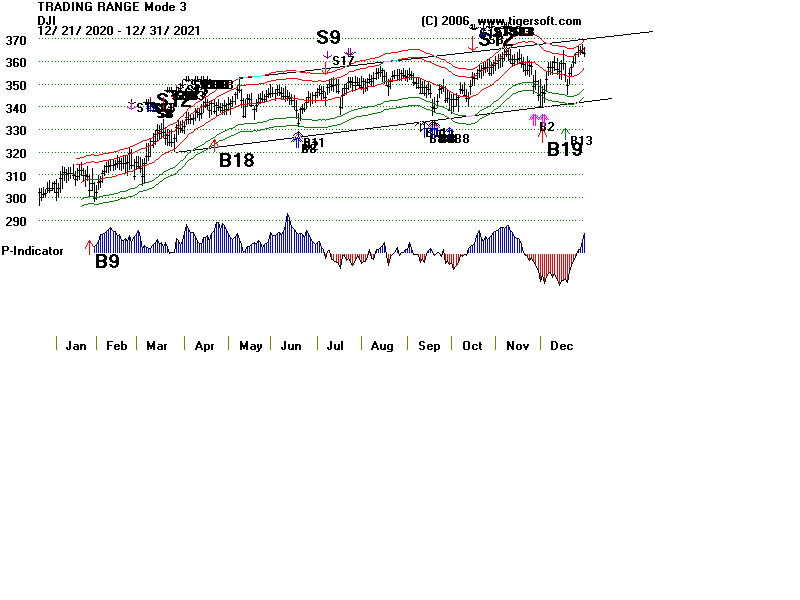
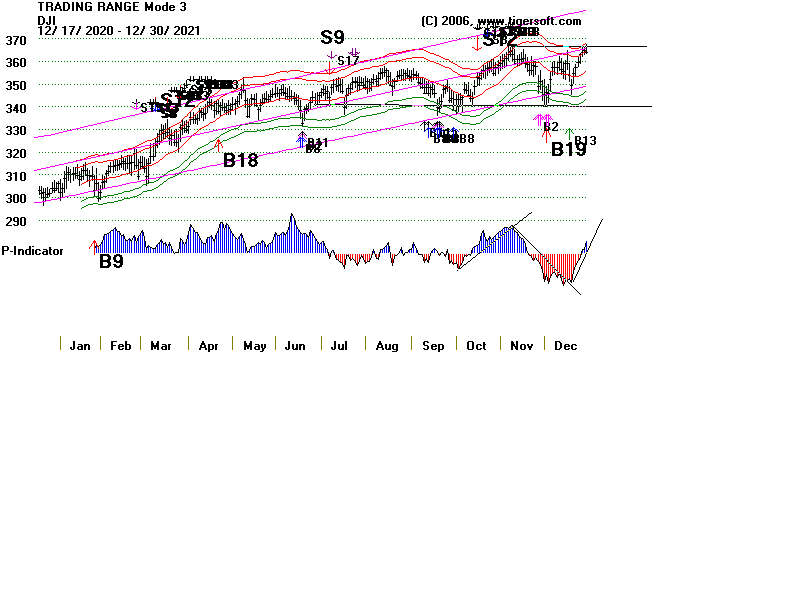
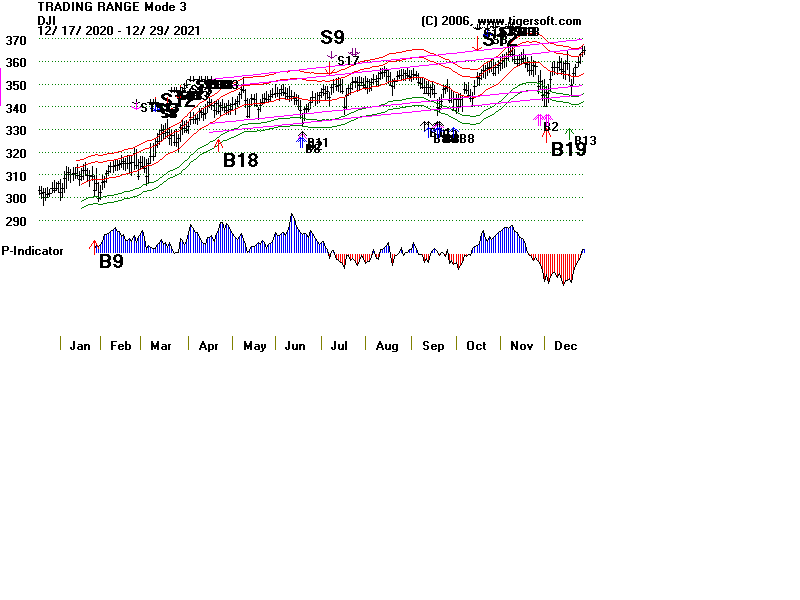
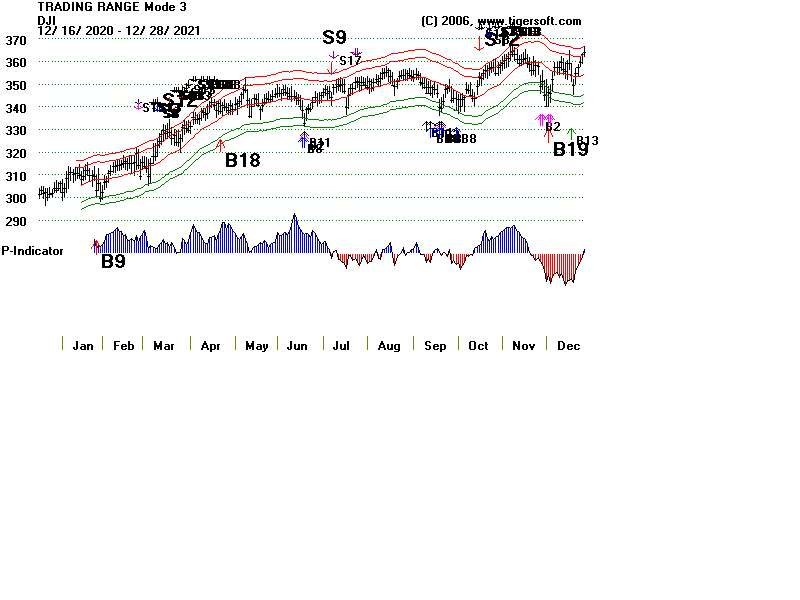
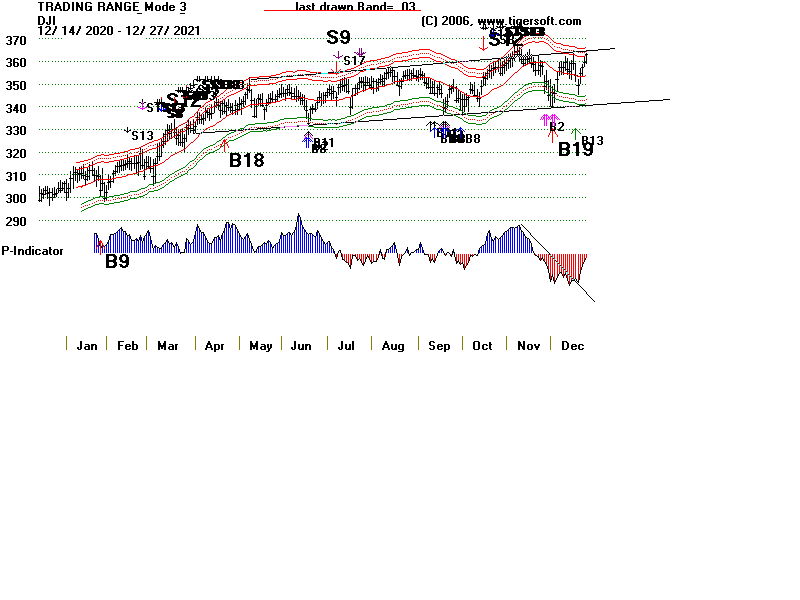
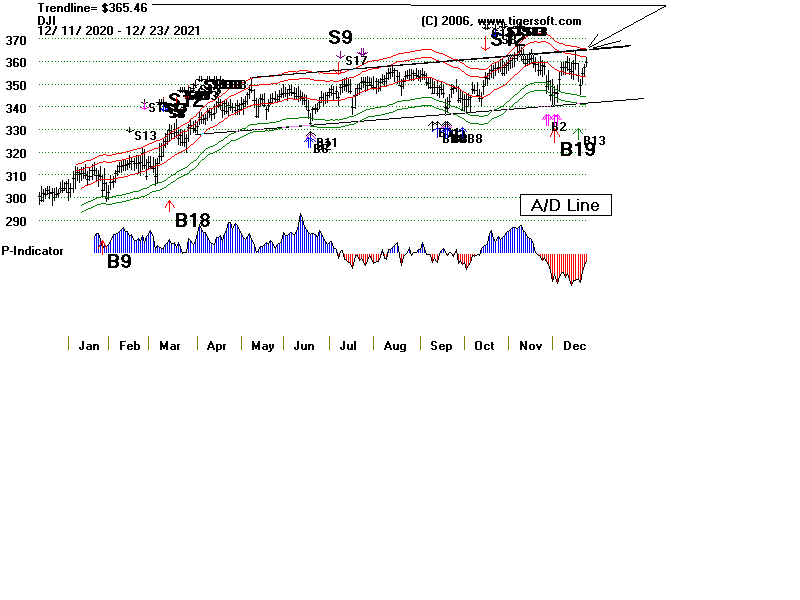
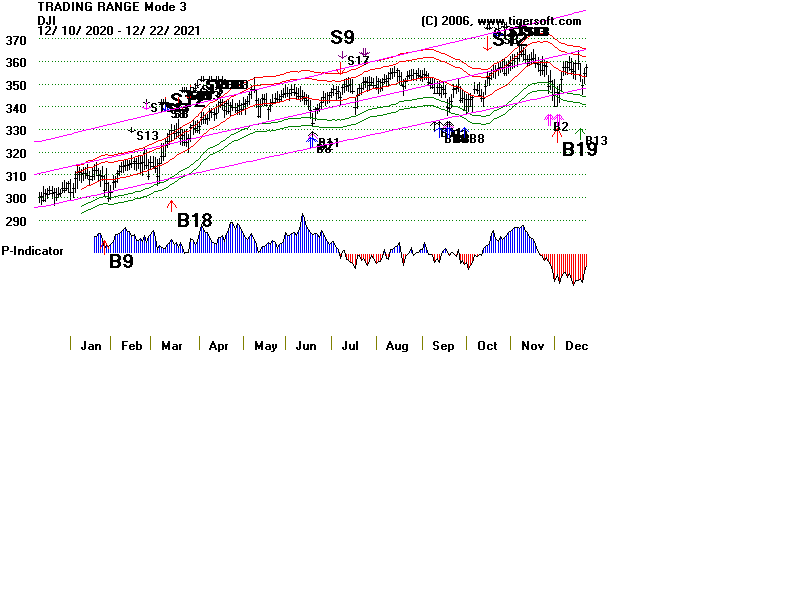
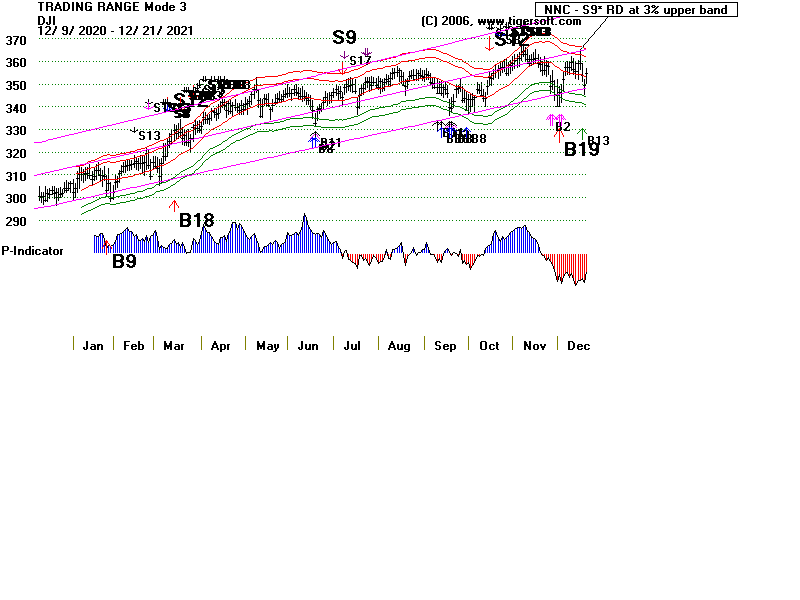
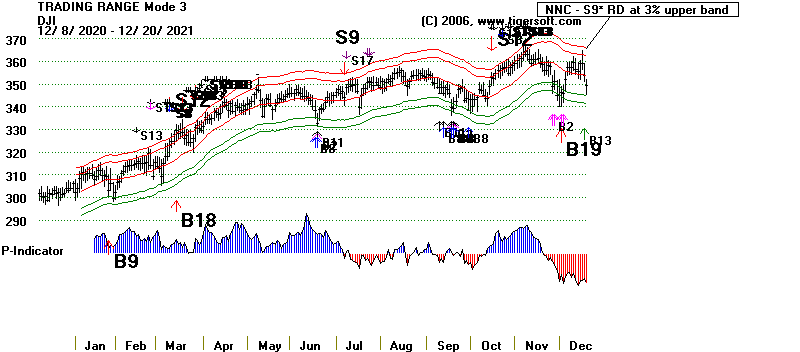
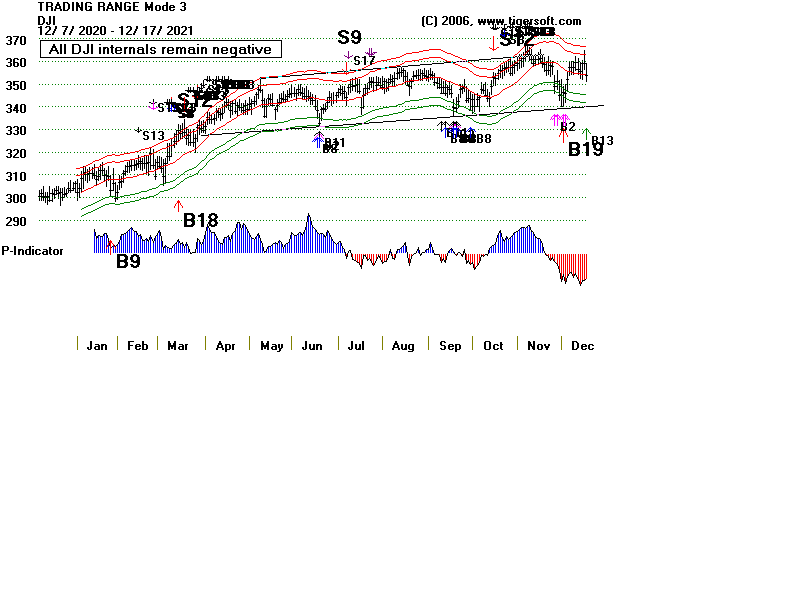
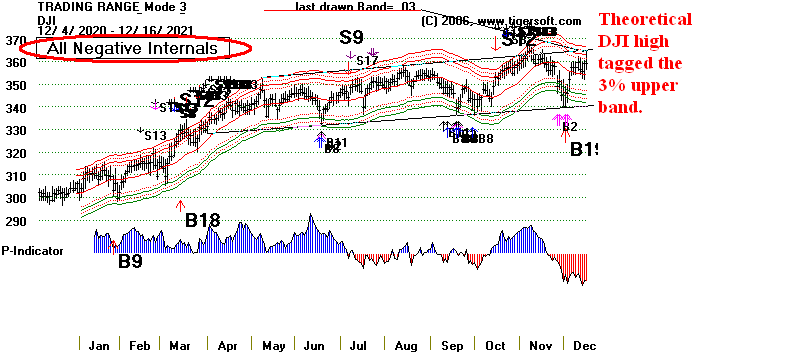
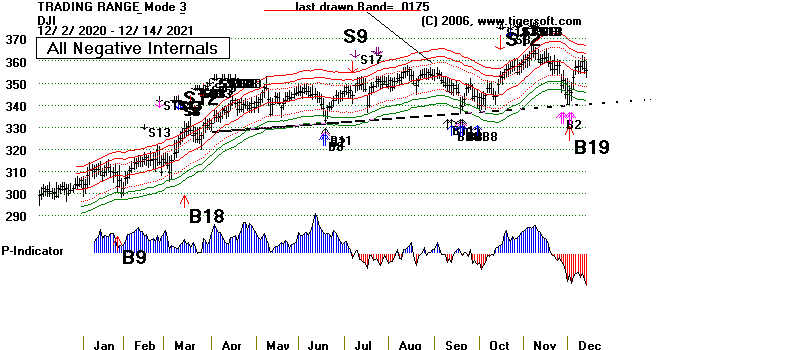
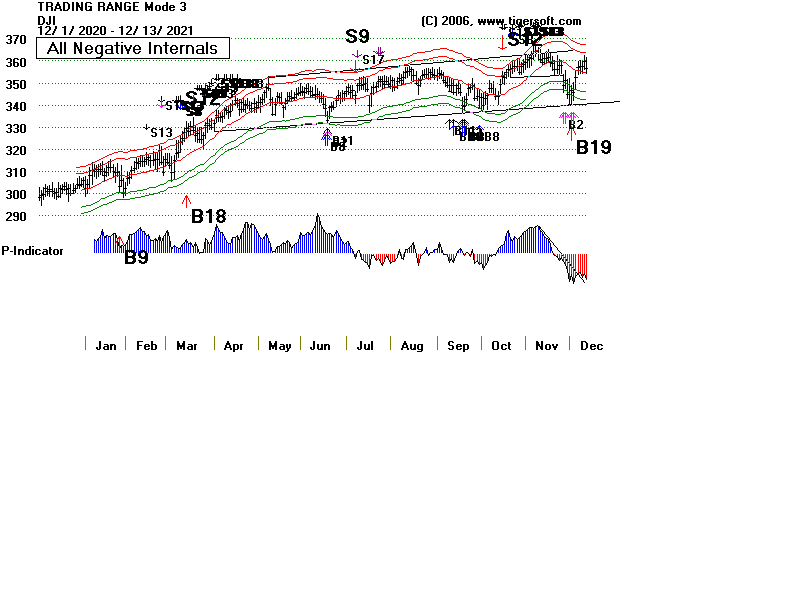
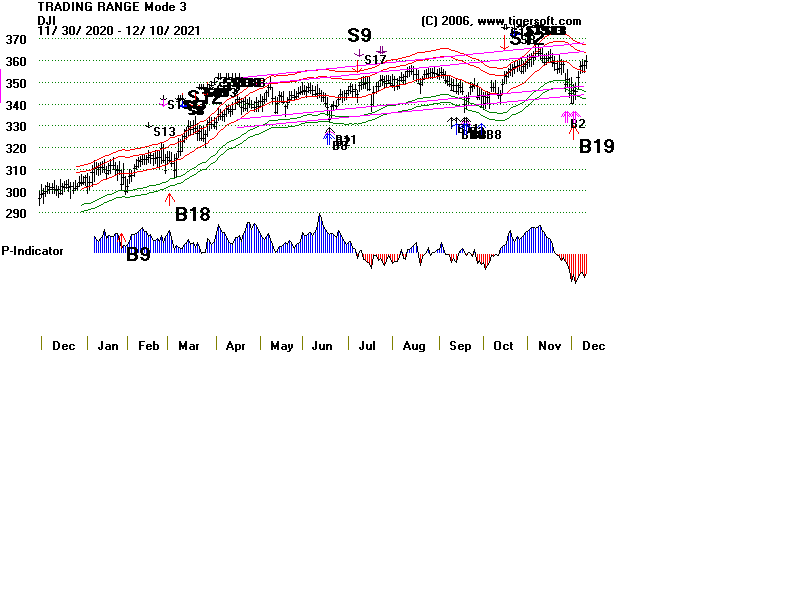
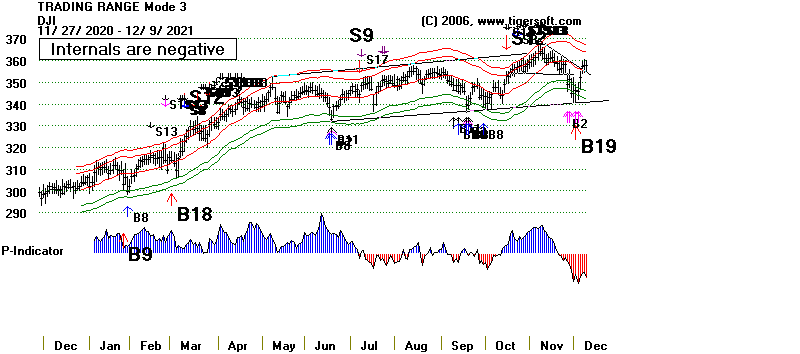
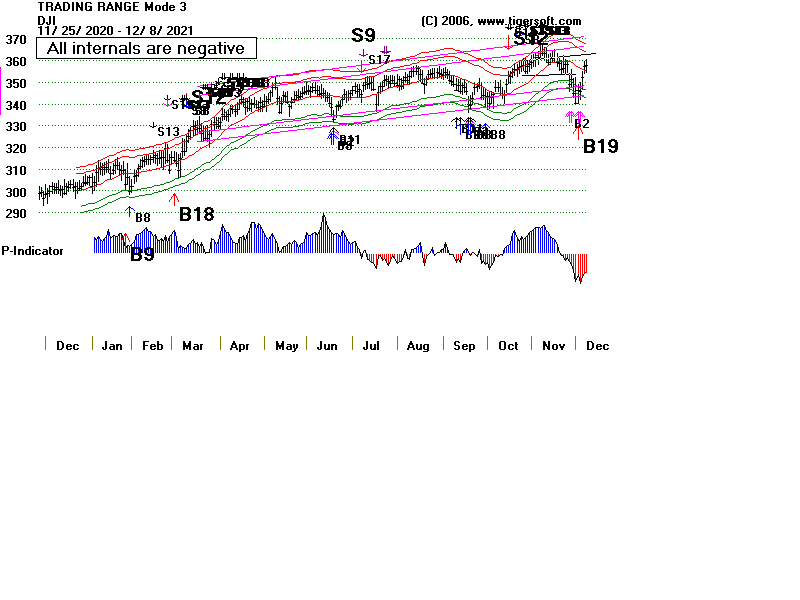
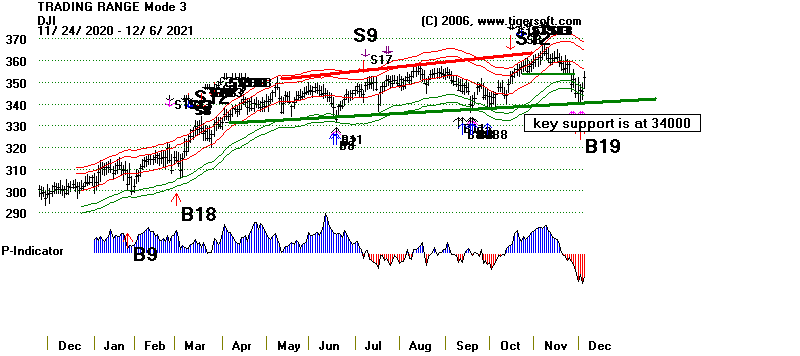
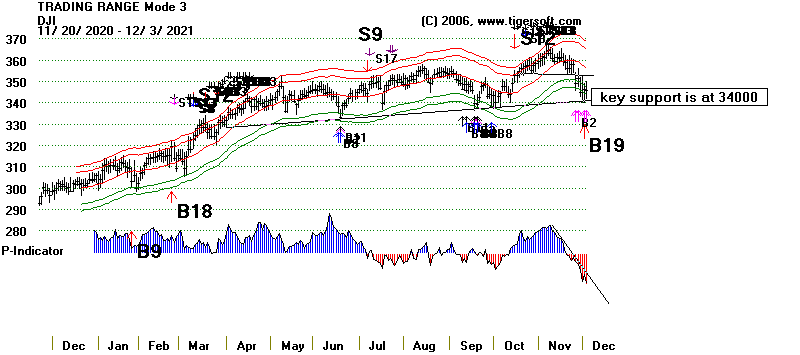
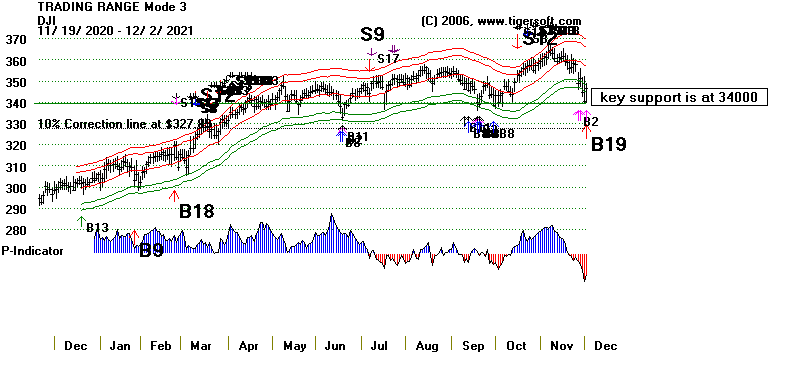
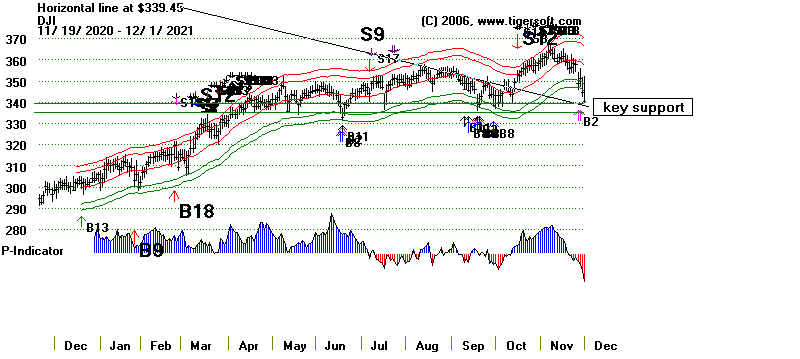
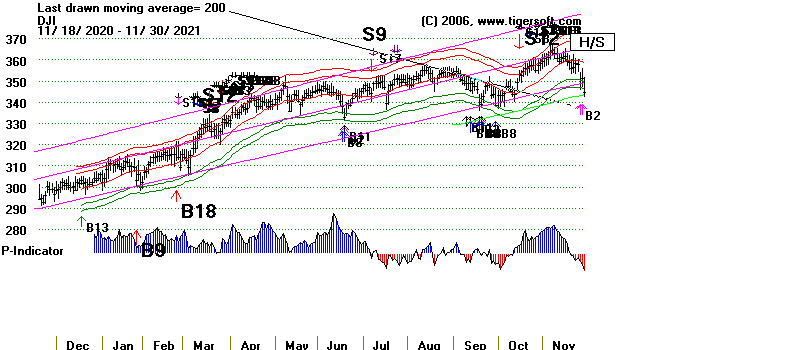
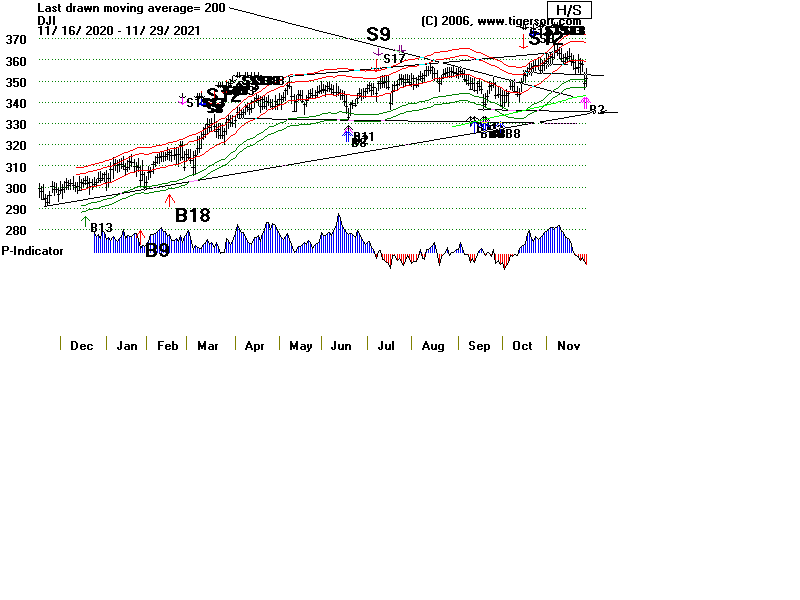
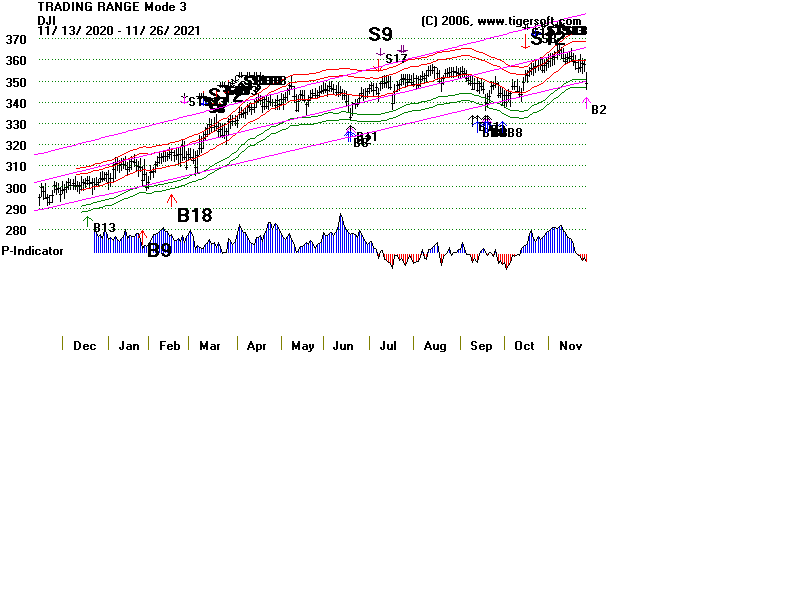
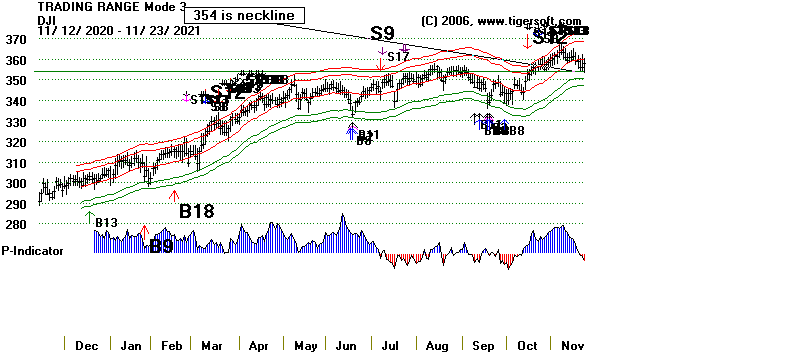
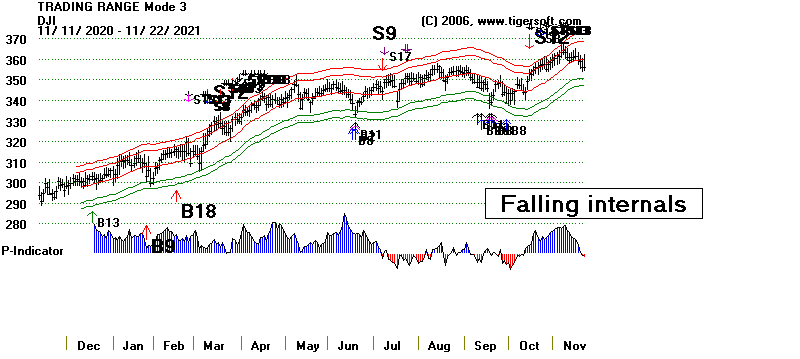
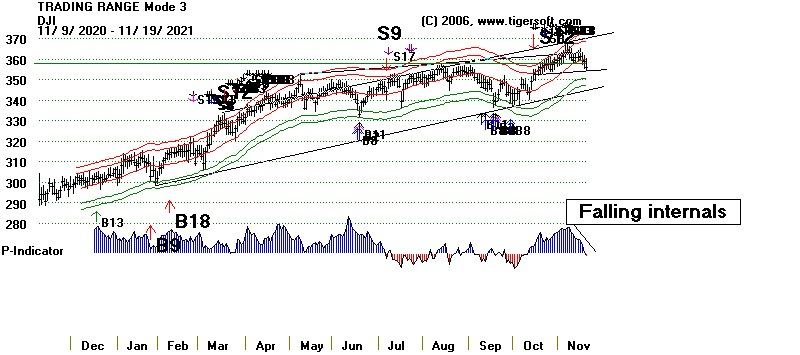