---TigerSoft HOTLINE --- 11/26/2021 - (C) 2021 William Schmidt, Ph.D. - All
rights reserved.
www.tigersoftware.com/1111H/INDEX.htm
====================================================================================
Always CLICK REFRESH. To refresh -
Point mouse at page and Hold down Control Key and hit F-5.
===> Please report any broken or
out-of-date links. william_schmidt@hotmail.com
====================================================================================
IMPORTANT - HOTLINE ADDRESS WILL CHANGE THIS WEEKEND.
Look for new address on Saturday.
Friday AM
11/26 - data 11/24 - DJI is
-822 and NASDAQ - 196 2:50 AM PCT
| |
I was hoping for a day-off to work
some more on my history of "What Really Moves The DJI: 1885-2021.", but no rest
tonight.
Bloomberg is busy searching for reasons why the DJI futures are down so much. They
chiefly blame the deadly new variations on Covid and Russia's hardliners in the tensions
with the Ukraine. I would prefer to blame the DJI's wicked-looking head/shulders
pattern and the fears that the next few inflation reports will be very scary and force the
FED to raise short-term and 10-year rates.
Inflation is also eating up the buying power of lots of people who have not been in a
position to buy stocks or have been scared away from them. Stocks like Visa are in
trouble already. And the number of stocks making new 12-month lows on the NYSE and
NASDAQ is twice as large as those making new highs. The DJI's job is to hold up the
appearance that all is well. But that will be difficult until the DJI successfully
tests its lower 3.5% band. Even the bullish seasonality is not strong enough to
prevent the completion of the DJI's (and DIA's) dangerous head and shoulders
patttern. See the second table below.
We have emphasized the DJI's (and DIA's) head and shoulders
pattern and now we see all our Peerless key Indicators for the DJI in negative territory.
Watch Professionals today. They will have a very hard time holding the market
up like they did in the light trading just before Thanksgiving. The Closing Powers
for DIA did break its up-trend on Wednesday, But this occurred on a light volume day
when manipulation is much easier. We need more proof of a bottom.
Normally the day after Thanksgiving is also one of very low volume. It will be very
interesting to see if the same Professionals who bought on Wednesday to boost the DJI to
prevent a completed hand and shoulders pattern there from being completed will do so again
today in the shorter hours of trading.
When a head and shoulder pattern suddenly appears and is quickly completed, we are in
dangerous times. Wall Street is quickly adapting to some very bad news. Be
careful now.
I recommend staying short the weakest Bearish MINCPS. Wait for Peerless to give a
Buy signal before buying any on the Bullish MAXCPs, except DBA which is an ETF shown below
that is a long play on agricultural commodites. Inflation, Global Warming and the
new Covid types are all lifting food prices globally. |
|
 |
 |
 |
 |
 |
DBA - Agricultural Commodites
 |
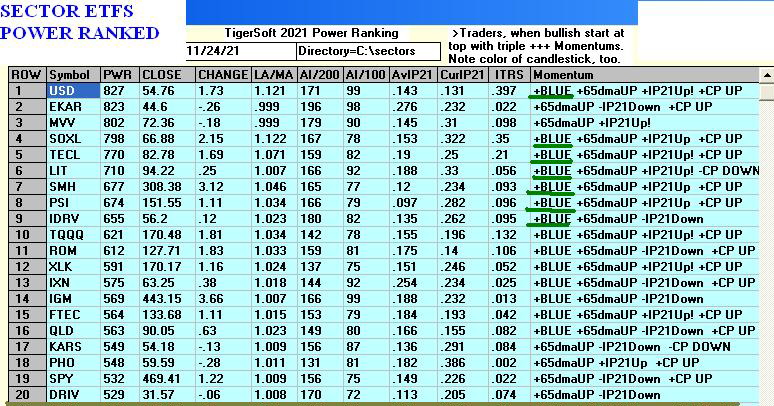 |
Table 1 QUICKSILVER on ETFS - 11/24/21
   Bullish = 4 -  RETL, SOXL (+.672), TECL, CORN
   Bearish = 1 -  OIH
ETF       CLOSE   CHANGE    PIVOT-PT    5-dma AROC   CL-PWR   CANDLE   IP21   ITRS   POWER INDEX
======================================================================================================
DIA       358.03   .01       359.35       -25.4%     Bearish  BLUE    .057    ----      -----
---------------------------------------------------------------------------------------------
SPY       469.44   1.25      469.73        13.9%     -------  BLUE    .153    .022     .175
---------------------------------------------------------------------------------------------
QQQ       398.76   1.28      401.75        14.1%     Bullish  BLUE    .137    .028     .165
---------------------------------------------------------------------------------------------
MDY       523.63  -.16       525.91       -27.9%     Bullish  BLUE    .078    .035     .113
---------------------------------------------------------------------------------------------
IWM       231.58   .25       234.86       -91.7%     Bearish  BLUE    .002    .017     .019
---------------------------------------------------------------------------------------------
FAS       143.43  -.7        137           167.9%    -------  BLUE   -.034    .179     .145
---------------------------------------------------------------------------------------------
RETL      48.73  -2.18       55.25        -335%      -------  BLUE    .207    .161     .368
---------------------------------------------------------------------------------------------
SOXL      66.88   2.14       67.98         178.1%    Bullish  BLUE    .322    .35      .672
                                                                                       =====
---------------------------------------------------------------------------------------------
TECL      82.78   1.69       82.53         156.7%    Bullish  BLUE    .25     .209     .459
---------------------------------------------------------------------------------------------
IBB       153.4   .39        153.68       -22.8%     Bearish  BLUE    .125   -.134    -.009
---------------------------------------------------------------------------------------------
GLD       167.12  -.16       173.94       -215.3%    -------  BLUE    .153   -.031     .122
---------------------------------------------------------------------------------------------
OIH       192.4   .09        194.14       -172%      -------  BLUE   -.234   -.039    -.273
---------------------------------------------------------------------------------------------
UUP       25.97   .1         25.62         54.3%     Bullish  ----    .017    .02      .037
---------------------------------------------------------------------------------------------
CORN      25.97   .1         21.77         938.2%    Bearish  ----    .078    .299     .377
---------------------------------------------------------------------------------------------
YINN      10.69   .09        11.01        -484%      Bearish  BLUE   -.035   -.096    -.131
---------------------------------------------------------------------------------------------
RSX       28.88  -.61        30.81        -402%      -------  ----   -.056   -.085    -.141
|
 Table 2    Count of Stocks in Key Directories
            20211124
-------------------------------
NEWHIGHS       138
NEWLOWS        263
MAXCP          39
MINCP          39
TTTNH          27
TTTNL          35
CPCROSSA       116
CPCROSSD       33
ACCUMVER       242
HIGHIP21       10
HIUPPCT        31
REDSELL        171
AUGSELS7       26
TRAPDOOR       7
|
 Table 3   RANKING OF KEY DIRECTORIES BASED PCT.OF STOCKS ABOVE 65-DMA
              11/24/21
---------------------------------------------------------------------------------------
Directory     Current       day-1         day-2         day-3         day-4         day-5
----------------------------------------------------------------------------------------
REGBANKS       .96           .96           .92           .92           .92           .96
               =====
HOMEBLDG       .882          .882          .882          .882          .882          .882
INSURANC       .8            .84           .68           .52           .64           .68
AUTO           .754          .754          .773          .735          .792          .773
SOLAR          .75           .75           .75           .875          .812          1
RETAIL         .744          .851          .829          .765          .851          .808
INDEXES        .695          .695          .679          .673          .679          .711
SEMI           .693          .683          .714          .765          .765          .795
FINANCE        .679          .728          .666          .654          .679          .74
REIT           .671          .633          .625          .648          .702          .717
RUS-1000       .669          .673          .638          .61           .653          .696
CHEM           .652          .717          .673          .652          .739          .804
TRANSP         .65           .65           .65           .6            .65           .75
SP500          .644          .648          .599          .595          .634          .687
               =====
BEVERAGE       .642          .714          .714          .5            .642          .714
NIFTY          .638          .659          .659          .68           .723          .765
INFRA          .636          .575          .575          .484          .515          .606
FOOD           .612          .673          .836          .755          .795          .795
INDMATER       .611          .666          .638          .597          .652          .694
NASD-100       .608          .597          .577          .577          .608          .649
HIGHPRIC       .603          .589          .589          .65           .676          .72
COMPUTER       .6            .55           .55           .6            .6            .7
GREEN          .6            .6            .65           .65           .7            .65
ELECTRON       .589          .582          .619          .686          .701          .731
SP-100         .588          .6            .511          .455          .522          .6
FIDSTKS        .568          .568          .508          .514          .568          .668
COMODITY       .55           .6            .775          .7            .675          .675
DJI-13         .538          .615          .461          .384          .461          .538
GUNS           .538          .615          .538          .615          .692          .692
OILGAS         .537          .528          .433          .433          .594          .622
GOLD           .521          .565          .804          .826          .847          .826
=========================================================================================
COPPER         .5            .5            .5            .5            .25           .25
DOWJONES       .5            .533          .433          .366          .433          .533
               ====
SOFTWARE       .5            .5            .517          .553          .589          .625
UTILITY        .473          .473          .5            .368          .315          .368
HACKERS        .444          .5            .5            .5            .5            .555
BIGBANKS       .428          .857          .428          .285          .285          .571
GAMING         .421          .315          .421          .421          .421          .631
CHINA          .352          .333          .352          .411          .313          .49
MILITARY       .346          .384          .307          .384          .461          .5
COAL           .333          .5            .333          .333          .333          .333
EDU            .333          .333          .333          .333          .333          .166
MARIJUAN       .333          .333          .333          .5            .333          .5
HOSPITAL       .312          .375          .312          .312          .437          .375
BIOTECH        .245          .243          .259          .29           .287          .323
ETFS           .232          .303          .285          .357          .446          .625
LOWPRICE       .196          .164          .176          .204          .242          .277
BONDFUND       .183          .183          .321          .321          .356          .333
JETS           .076          .076          .076          .076          .153          .307
--------------------
|
======================================================================================
Wednesday AM
======================================================================================
Written 11-24- 5:45 AM DJI -145 NASDAQ -63 Data through 11/23
| |
Happy Thanksgiving, everyone.
There will be no full Hotline Thursday night. The next one will be on Sunday. Look
for our email giving a new address on Saturday. If you need to renew, email william_schmidt@hotmail.com the CC, exp
date, Sec code & zio code
in four separate emails for security. This Hotline is still $400.00 for a year.
It will be $450 next year for a year.
-----------------------------------------------------------------------------------------------
Now let's catch up on the market.First,
the Closing Powers for the DJI (DIA), NASDAQ, SP-500 (SPY), SOXL (Semi-conductors) and
TECL are all in downtrends. This is bearish. I see no reason to fight the
Professionals right now. Possibly, the bearish pattern in DIA, the falling
Closing Powers and the shadow of the bear on so many stocks will be explained by a
forthcoming upside breakout by the short-term rates and by the 10-year bond rates breaking
out. If the CPI jumps to 7%, I think you can count on that. If this happens,
expect the DJIA and DIA to complete a new head and shoulders pattern. See their
charts below.
Second, the Peerless Sell S12 of two months ago was
recognized at the time as being premature. This has been happening a lot because of
QE-Infinity. We have adjusted to this situation by watching the Closing Powers of
the leading ETFs and stocks in the sectors we are trading.
We also stated the we would know that the continued advance might fail because of how
badly the DJI was lagging. And we would recognize the
likely final peak in the tech sectors by a big red candle stick forming. This is
exactly what happened on Monday.
Now we can see the failed breakout in the DJI and the NASDAQ and SOXL. Sell S12s do
have paper losses sometimes. Once a DJI breakout or NASDAQ breakout fails, there is
almost always a decline
to the lower band or 65-dma. That is the spot we are in now.
We should be able to spot the point where a pullback must stop. It is
the previous point of breakout. Recently, the DJI should not have
dropped below the 35800-36000 breakout point. Some of you don't like such a nuanced
Peerless because it relies on judgement. That's fine, but I see no need to suffer a
3% paper loss. I find this notation reasonable in an age of QE-Infinity and plan to
continue it. Email me if my explanations are not clear.
There were almost 700 NYSE and NASDAQ new lows. This means our short sales from the
2021 Power Ranked Bearish MINCP probably offer much more potential than do any of the
Bullish MAXCPs or ETFs,
including FAS, as long as their Closing Powers stay below their 21-dma. I can
understand not wanting to sell short. It seems un-patriotic. But if we get in
a long bear market, you will be very glad you have used our Bearish MINCPs that way.
Get the Short Selling Book I have written. It will do you a lot of good in a
serious market decline.
We should - based on history - see a rally this week, not a deline. If,
instead, the market falls, it could mean real trouble lies ahead.
|
|
======================================================================================================
=====================================================================================
Written 11-23- 6:00 AM DJI +28 NASDAQ -18 Data through 11/22
| |
Powell's renomination as FED
chairman had the expected upward push on bank stocks and FAS, but coincided with a last
minute sell-off on the DJI, as a whole. In addition, we see bearish inverted red
popsicles on most of the leading tech ETFS and tech stocks as well as the NASDAQ. I
suggested taking profits in them in this event and going short some of many bearish
MINCPs.
The number of new lows on the NYSE and NASDAQ has reached 683 on the NYSE and NASDAQ.
So a bear market has spread its shadow quite widely. But Powell has come
through time and again in holding up the market. And I would expect him to do so
again. Short-term rates fell back to 0.4% today. I suspect that the rest of
Thanksgiving week will see a small recovery of what was lost this afternoon.
But Professionals are not yet ready to buy aggressively. The many Closing Power
non-confirmations of new highs today in the tech sector followed by breaks in the steep CP
uptrends show that there are other problems for the market, such as the enormous
debt, rising Covid statistics, 6%+ inflation and limits on liquidity insertions by the
FED. Without a new Peerless Buy signal or breaks in the Closing Power downtrends of
the key ETFs, I would wait to buy again. Instead, study how well the Power Ranking
work with the MINCP stocks in the third Power Ranking shown below today. We
are going to make a lot of money when the market turns broadly down using the Power
Ranker.
|
|
Charts - 11/23/2021
2021 PEERLESS DJI, Signals,
Indicators Daily DJI Volume 10-DayUp/Down Vol Stoch-20
Inverted Traders Index
Graph of Pct of All Stocks above
65-dma Cum. Inverted
Traders Index
DJI-IPA DJI-OBV
NASDAQ S&P OEX NYSE COMPQX DJI-15 DJI-20 DJI-30
DIA QQQ SPY IWM TNA Short-Term Rates DOLLAR-UUP ALLSTOCKs
recent 2006 vers-Peerless signals
http://tigersoftware.com/NEWPEER/UPD71122.BMP
MDY - http://www.tigersoftware.com/CHARTZ/MDY.GIF
USO-CrudeOil DBO FAS GLD BBH IBB JETS JNUG KOL NUGT OIH PALL RSX RETL
SDS AGQ SLV SOXL TAN TECL TLT TMF TNA UGA (gasoline) USO (oil) and China: YINN CHAU
Commodities: CANE
CORN DBC JJC, NIB CORN, CUT (paper)
MOO, SOYB WEAT UUP (Dollar) LIT
(Lithium)
STOCKS:
MRNA DIS GE PYPL GME ZOM XLE NRGU
AAPL ADBE ALXN AMAT AMGN AMD AMZN AXP BA BABA BAC BIDU BLDP CAT CRM CVX
CMG DE ENPH FB GILD GOOG GS HD IBM INTU JPM LRCX M MRK MSFT NEM NFLX
NKE NVDA PG PYPL REGN REV SO SQ QCOM QDEL TSLA TXN XOM V VRTX WFC WMT ZM
Bullish MAXCPs http://tigersoftware.com/UPPER/11-22/BULLISH.htm
Bearish MAXCPs http://tigersoftware.com/DOWNER/11-22/BEARISH.htm
|
Approaching oversold.
 |
 |
 |
 |
 |
 |
 |
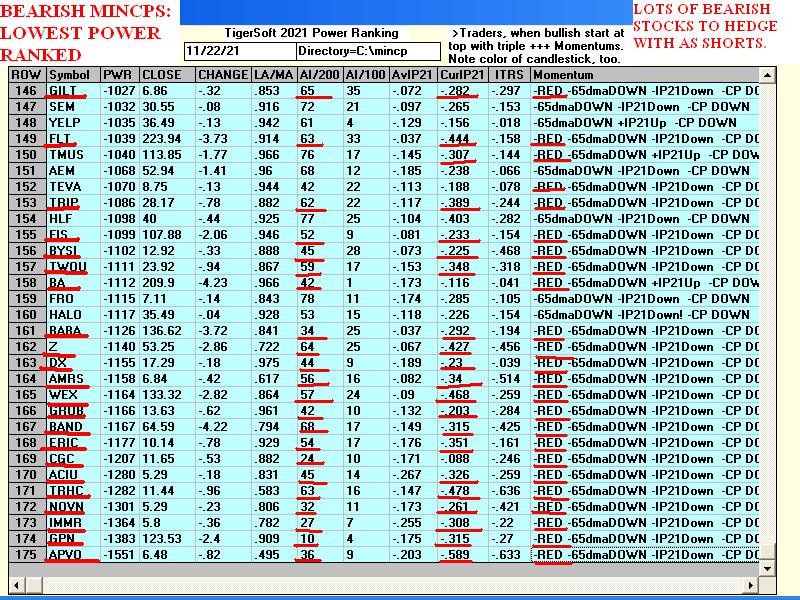 |
Table 1 QUICKSILVER on ETFS - 11/22/21
   Bullish = 4 -  RETL, SOXL (+.598), TECL, CORN
   Bearish = 1 -  OIH
ETF       CLOSE   CHANGE    PIVOT-PT    5-dma AROC   CL-PWR   CANDLE   IP21   ITRS   POWER INDEX
================================================================================================
DIA       356.2   .29        361.93       -70.1%     Bearish  RED    -.077    ----     -----
---------------------------------------------------------------------------------------------
SPY       467.57  -1.32      469.28        1.5%      -------  RED     .063    .027     .09
---------------------------------------------------------------------------------------------
QQQ       399.3  -4.69       397.42        58.8%     -------  RED     .066    .041     .107
---------------------------------------------------------------------------------------------
MDY       524.2   .62        531.03       -55.8%     -------  RED    -.002    .043     .041
---------------------------------------------------------------------------------------------
IWM       231.73  -.99       238.99       -144.4%    Bearish  RED    -.065    .02     -.045
---------------------------------------------------------------------------------------------
FAS       138.18   5.37      143.26       -193.4%    Bearish  BLUE   -.127    .127     0
---------------------------------------------------------------------------------------------
RETL      53.25   2.19       56.2         -99.4%     -------  BLUE    .151    .293     .444
---------------------------------------------------------------------------------------------
SOXL      65.43  -3.18       66.15         168.7%    Bullish  RED     .251    .347     .598
---------------------------------------------------------------------------------------------
TECL      81.66  -2.82       80.96         193%      Bullish  RED     .112    .226     .338
---------------------------------------------------------------------------------------------
IBB       153.68  -.88       154.06        16.2%     Bearish  RED     .027   -.117    -.09
---------------------------------------------------------------------------------------------
GLD       168.74  -3.87      172.92       -156.7%    -------  RED     .152   -.014     .138
---------------------------------------------------------------------------------------------
OIH       185.79   2.02      206.64       -471.2%    Bearish  BLUE   -.299   -.047    -.346
---------------------------------------------------------------------------------------------
UUP       25.88   .13        25.74         46.7%     Bullish  ----    .016    .021     .037
---------------------------------------------------------------------------------------------
CORN      25.88   .13        25.74         862.2%    Bearish  ----    .173    .301     .474
---------------------------------------------------------------------------------------------
YINN      10.74  -.42        12.16        -445%      Bearish  RED    -.084   -.165    -.249
---------------------------------------------------------------------------------------------
RSX       28.36  -1.56       31.03        -482.5%    Bearish  RED    -.121   -.088    -.209
|
 Table 2    Count of Stocks in Key Directories
            20211122
-------------------------------
NEWHIGHS       348
NEWLOWS        683  bearish.
MAXCP          10
MINCP          175  bearish
TTTNH          23
TTTNL          117
CPCROSSA       58
CPCROSSD       56
ACCUMVER       239
HIGHIP21       12
HIUPPCT        27
VHIP21         85
LOWACCUM       154
REDSELL        181
AUGSELS7       52
TRAPDOOR       10
|
 Tablle 3  RANKING OF KEY DIRECTORIES BASED PCT.OF STOCKS ABOVE 65-DMA
              11/22/21
 Bullish = 30
 Bearish = 16
---------------------------------------------------------------------------------------
Directory     Current       day-1         day-2         day-3         day-4         day-5
----------------------------------------------------------------------------------------
REGBANKS       .92           .92           .92           .96           .96           .96
HOMEBLDG       .882          .882          .882          .882          .882          .882
FOOD           .836          .755          .795          .795          .795          .755
RETAIL         .829          .765          .851          .808          .893          .936
GOLD           .804          .826          .847          .826          .869          .913
COMODITY       .775          .7            .675          .675          .7            .7
AUTO           .773          .735          .792          .773          .83           .83
SOLAR          .75           .875          .812          1             .937          .937
BEVERAGE       .714          .5            .642          .714          .714          .785
SEMI           .714          .765          .765          .795          .795          .795
               ^^^^^
INSURANC       .68           .52           .64           .68           .84           .84
INDEXES        .679          .673          .679          .701          .733          .771
CHEM           .673          .652          .739          .804          .826          .804
FINANCE        .666          .654          .679          .74           .765          .753
NIFTY          .659          .68           .744          .765          .787          .808
GREEN          .65           .65           .7            .65           .7            .8
TRANSP         .65           .6            .65           .75           .75           .9
INDMATER       .638          .597          .652          .694          .722          .763
RUS-1000       .638          .61           .653          .696          .727          .736
ELECTRON       .619          .686          .701          .731          .761          .738
REIT           .618          .641          .702          .717          .74           .801
SP500          .599          .595          .634          .687          .707          .719
               ^^^^^
HIGHPRIC       .59           .652          .677          .721          .75           .728
NASD-100       .577          .577          .608          .649          .69           .69
               ^^^^^
INFRA          .575          .484          .515          .606          .666          .727
COMPUTER       .55           .6            .6            .7            .75           .7
GUNS           .538          .615          .692          .692          .692          .692
SOFTWARE       .517          .553          .589          .625          .625          .589
SP-100         .511          .455          .522          .6            .633          .677
FIDSTKS        .508          .514          .568          .668          .692          .704
-----------------------------------------------------------------------------------------
COPPER         .5            .5            .25           .25           .5            .625
HACKERS        .5            .5            .5            .555          .555          .555
UTILITY        .5            .368          .315          .342          .394          .473
-----------------------------------------------------------------------------------------
DJI-13         .461          .384          .461          .538          .692          .692
DOWJONES       .433          .366          .433          .533          .6            .733
               ^^^^^
OILGAS         .433          .433          .594          .622          .735          .735
BIGBANKS       .428          .285          .285          .571          .714          .714
GAMING         .421          .421          .421          .631          .684          .684
CHINA          .352          .411          .313          .47           .509          .509
COAL           .333          .333          .333          .333          .5            .5
EDU            .333          .333          .333          .166          .333          .333
MARIJUAN       .333          .5            .333          .5            .5            .666
BONDFUND       .329          .329          .363          .329          .352          .34
HOSPITAL       .312          .312          .437          .375          .437          .437
MILITARY       .307          .384          .461          .5            .538          .653
ETFS           .285          .357          .446          .625          .696          .714
BIOTECH        .263          .293          .291          .326          .37           .37
LOWPRICE       .176          .204          .244          .277          .323          .358
JETS .076 .076 .153 .307 .307 .615
|
=====================================================================================
Written
11-22- 3:57 AM DJI +173 NASDAQ +63 Data
through 11/19
| |
Word may have leaked out that Biden
will re-appoint Wall Street's
friend and supporter, Jerome Powell, as Fed Chairman. That would explain the
strength this morning before the opening. If so, Professionals will likely buy
steadily all day. And we should, too. Afterall, the FAS ETF (representing
financials) has fallen back to good support at its 65-dma and there usually is a rally the
week of Thanksgiving. Historically, the DJI rises modestly two thirds of the time
over the next week, two weeks and month in the first year of a Presidential Election since
1965.
Since the Closing Powers have not yet turned up for DIA and FAS, I would rather be
long the much stronger tech ETFs: SOXL and TECL. QQQ stands right at the
top of its price channel. Watch it. A breakout move higher by QQQ would be
quite bullish for it and other tech stocks. More shorts there will be run in.
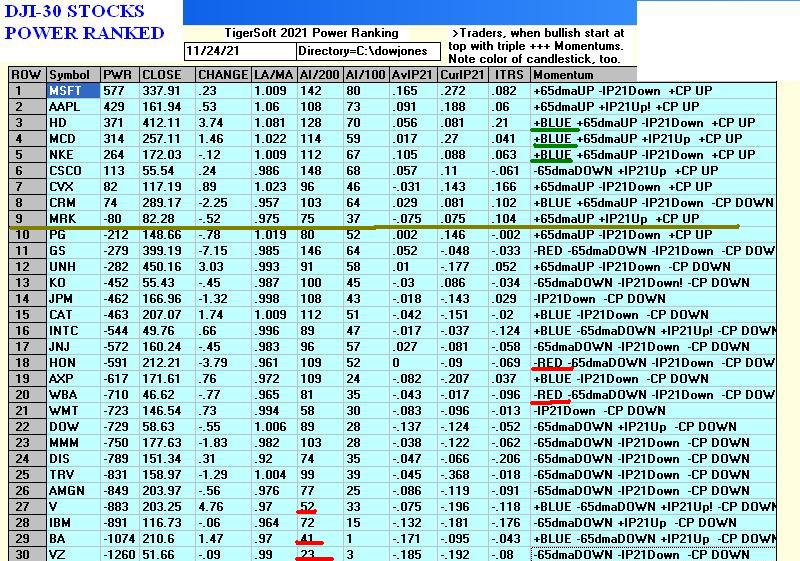
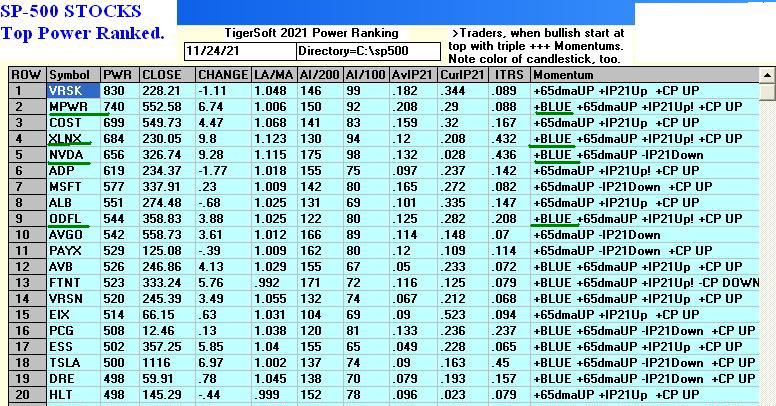
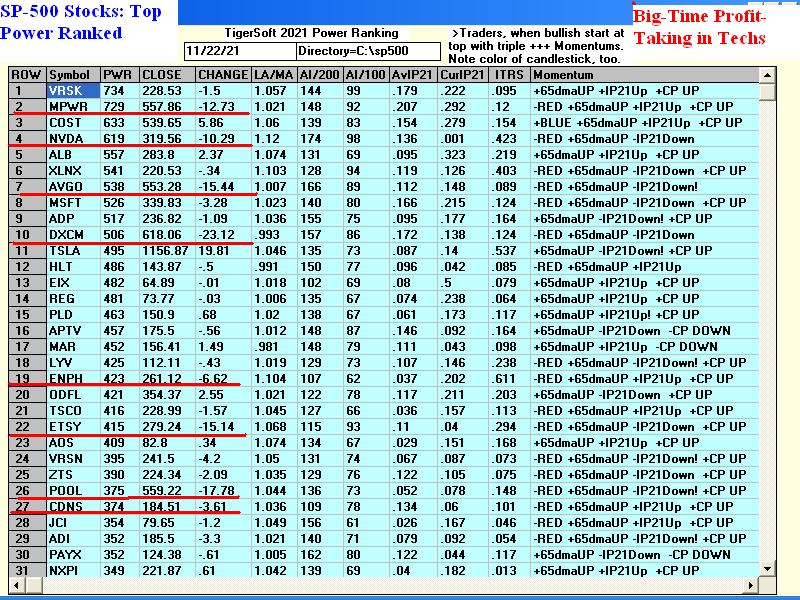
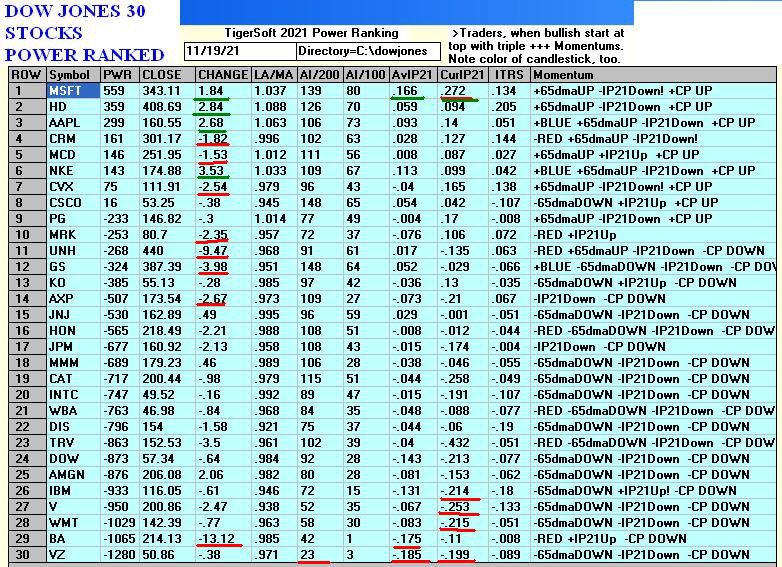
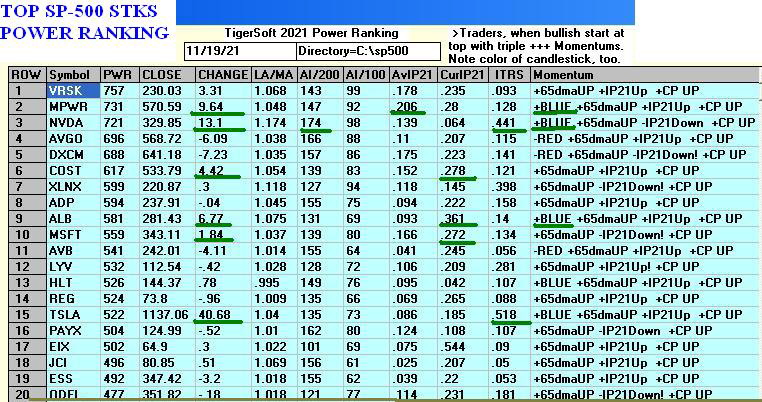
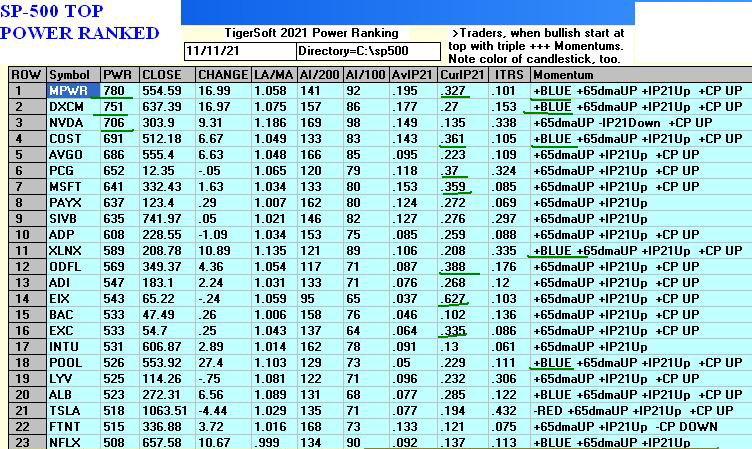
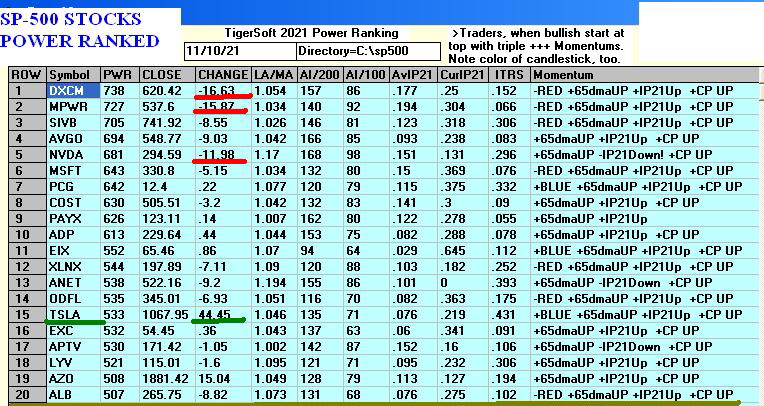
MSFT and NVDA made new highs on Friday.
This bodes well for QQQ. See their lofty position in our SP-500 Tiger power-
ranking. Note how the highest IP21 rankings. This correlates closely with big
daily gains at the top of the Power Ranking while the very lowest IP21 stocks
over-populate the stocks down the most frequently.
This is now a market where there are more new lows than new highs. Professional
money has a habit in this market environment of playing "musical chairs" and
still pushing up the best performing stocks at the end of the year and selling off quickly
those that break support. We can confirm breakdowns by looking for negative
Accumulation and falling Closing Power. Once the "dumping" starts, these
stocks often drop a long ways. Shorting them soon after they break support in this
manner, is a good way to hedge, as is shorting the very lowest Power Ranked MINCPs, which
can fall day after day until there is a selling climax.
Watch the Closing Powers for the leading tech stocks. It may be bearish
when Professionals become net sellers of them and their over-extended Closing Power
uptrends are violated. "Big red popsicles" in their candle-sticks will
cause traders to take profits in them at this point. If that
were happen today, the early rumors may be wrong and Biden may still be about to
pick a new Fed Chairman with all the risks for the market that that may bring. Biden
is probably delaying making an announcement because he using that as a bargaining chip
with some Senators over his big Public Works legislation.
|
|
Charts and Tables
Short-Term interest rates remain under 0.5% This should mean
support is good near the
DJI's 65-dma. The interest on 10-year Treasuries fell back on Friday. This
should help the
NASDAQ and tech stocks.
 |
 |
 |
 |
 |
 |
 |
 |
 |
 |
 |
 |
 |
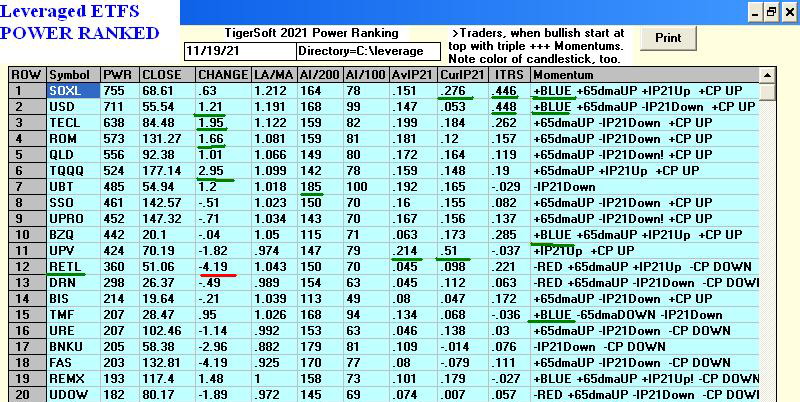 |
Table 1 QUICKSILVER on ETFS - 11/19/21
   Bullish = 4 -  RETL, SOXL (+.722), TECL, CORN
   Bearish = 1 -  OIH
ETF       CLOSE   CHANGE    PIVOT-PT    5-dma AROC   CL-PWR   CANDLE   IP21   ITRS   POWER INDEX
-------------------------------------------------------------------------------------------------
DIA       355.91  -3.44      361.24       -74.4%     Bearish  RED     .005     ---     ----
---------------------------------------------------------------------------------------------
SPY       468.89  -.84       467.43        17.3%     -------  RED     .132    .026     .158
---------------------------------------------------------------------------------------------
QQQ       403.99   2.24      394.61        116.9%    -------  BLUE    .133    .046     .179
---------------------------------------------------------------------------------------------
MDY       523.58  -2.33      530.09       -52.6%     Bullish  BLUE    .043    .042     .085
---------------------------------------------------------------------------------------------
IWM       232.72  -2.14      238.55       -142.7%    Bearish  RED    -.007    .024     .017
---------------------------------------------------------------------------------------------
FAS       132.81  -4.19      143.56       -383.7%    Bearish  RED    -.079    .111     .032
---------------------------------------------------------------------------------------------
RETL      51.06  -4.19       54.32        -242%      Bearish  RED     .098    .221     .319 +
---------------------------------------------------------------------------------------------
SOXL      68.61   .63        63.2          404.4%    Bullish  BLUE    .276    .446     .722 +
---------------------------------------------------------------------------------------------
TECL      84.48   1.95       78.52         356.6%    Bullish  BLUE    .184    .262     .446
---------------------------------------------------------------------------------------------
IBB       154.56   .88       153.18        18.2%     Bearish  BLUE    .053   -.134    -.081
---------------------------------------------------------------------------------------------
GLD       172.61  -1.33      174.18       -52.9%     -------  RED     .198    .006     .204
---------------------------------------------------------------------------------------------
OIH       183.77  -10.37     204.41       -559.4%    Bearish  RED    -.261   -.016    -.277
---------------------------------------------------------------------------------------------
UUP       25.75   .13        25.64         48.8%     Bullish  ----   -.034    .009    -.025
---------------------------------------------------------------------------------------------
CORN      25.75   .13        25.64         48.8%     Bearish  ----    .103    .288     .391
---------------------------------------------------------------------------------------------
YINN      11.16   .15        11.77        -353.6%    Bearish  ----   -.092   -.142    -.234
---------------------------------------------------------------------------------------------
RSX       29.92  -.89        31.34        -216.7%    Bearish  RED    -.093   -.023    -.116
|
 Table 2   Count of Stocks in Key Directories
           20211119
-------------------------------
NEWHIGHS       251
NEWLOWS        434
MAXCP          25
MINCP          179
TTTNH          13
TTTNL          98
CPCROSSA       59
CPCROSSD       61
ACCUMVER       235
HIGHIP21       13
HIUPPCT        30
VHIP21         85
LOWACCUM       148
REDSELL        186
AUGSELS7       42
TRAPDOOR       12
|
Table 3  RANKING OF KEY DIRECTORIES BASED PCT.OF STOCKS ABOVE 65-DMA
             11/19/21
Bullish = 27
Bearish = 17
---------------------------------------------------------------------------------------
Directory     Current       day-1         day-2         day-3         day-4         day-5
----------------------------------------------------------------------------------------
REGBANKS       .92           .92           .96           .96           .96           .96
HOMEBLDG       .882          .882          .882          .882          .882          .882
SOLAR          .875          .812          1             .937          .937          .937
GOLD           .826          .847          .826          .869          .913          .913
RETAIL         .765          .851          .808          .893          .936          .893
SEMI           .765          .765          .795          .795          .795          .806
FOOD           .755          .795          .795          .795          .755          .734
AUTO           .735          .792          .773          .83           .83           .811
COMODITY       .7            .675          .675          .7            .7            .7
ELECTRON       .686          .701          .731          .761          .738          .746
NIFTY          .68           .744          .765          .787          .787          .787
INDEXES        .668          .679          .701          .733          .766          .728
FINANCE        .654          .679          .74           .765          .753          .765
CHEM           .652          .739          .804          .826          .804          .891
HIGHPRIC       .652          .677          .721          .75           .728          .753
GREEN          .65           .7            .65           .7            .75           .75
REIT           .641          .694          .717          .74           .801          .778
GUNS           .615          .692          .692          .692          .692          .615
RUS-1000       .61           .653          .696          .727          .734          .739
COMPUTER       .6            .6            .7            .75           .7            .75
TRANSP         .6            .65           .75           .75           .9            .85
INDMATER       .597          .652          .694          .722          .763          .777
SP500          .595          .634          .687          .707          .719          .722
NASD-100       .577          .608          .649          .69           .68           .721
SOFTWARE       .553          .589          .625          .625          .571          .66
INSURANC       .52           .64           .68           .84           .84           .8
FIDSTKS        .514          .568          .668          .692          .704          .68
=========================================================================================
BEVERAGE       .5            .642          .714          .714          .785          .785
COPPER         .5            .25           .25           .5            .625          .625
HACKERS        .5            .5            .555          .555          .555          .611
MARIJUAN       .5            .333          .5            .5            .666          .833
=========================================================================================
INFRA          .484          .515          .606          .666          .727          .727
SP-100         .455          .522          .6            .633          .688          .688
OILGAS         .433          .594          .622          .735          .745          .773
GAMING         .421          .421          .631          .684          .684          .631
CHINA          .411          .313          .47           .509          .509          .588
DJI-13         .384          .461          .538          .692          .692          .615
MILITARY       .384          .461          .5            .538          .653          .653
UTILITY        .368          .315          .342          .394          .473          .368
DOWJONES       .366          .433          .533          .6            .733          .7
ETFS           .357          .446          .625          .696          .714          .732
COAL           .333          .333          .333          .5            .5            .666
EDU            .333          .333          .166          .333          .333          .333
BONDFUND       .329          .363          .329          .352          .329          .386
HOSPITAL       .312          .437          .375          .437          .437          .437
BIOTECH        .295          .293          .328          .372          .372          .419
BIGBANKS       .285          .285          .571          .714          .714          .714
LOWPRICE       .207          .242          .277          .323          .358          .366
JETS           .076          .153          .307          .307          .615          .538
|
====================================================================================
====================================================================================
Written 11-19- 5:55 AM DJI -196 NASDAQ +73 Data through 11/18
| |
That Wall Street's friend and
benefactor Jerome Powell might not be nominated is the big elephant in the room that the
DJI and dividend stocks are concerned most about right now. As a result, today we
saw more new lows than new highs on the NYSE and NASDAQ by almost 2:1. There's no
point in trying to call a bottom in the DJI until the Closing Power, representing market
professionals, turns up.
I have said for some time, that we will know a
market top is upon us because out Closing Powers for bank stocks and FAS will turn badly
down. Money, especially, at little cost is their mothers' milk. If it does
turn out, that Powell is not to be reappointed, it would explain a lot why FAS, GS,
JPM, AXP, V and the lot, all have become very weak, especially their Closing Powers.
The White House can not keep a secret any better than Wall Street.
Meanwhile, traders are hooked on the steady rise of
Semi-conductor stocks, which as a group, made another new high today. As long as the
Closing Powers of the NASDAQ (COMPQX), QQQ, TECL and SOXL remain in rising trends, stick
with them. But look how really ugly and even frightening the many Bearish
MINCPs appear. Short some.
It is highly unusual for the DJI to decline seriously and below the lower band in the last
two months of the first year after a Presidential Election.
It nearly always waits until soon after the new year starts, as in 1962, 1966, 1970, 1974,
1990, 1994, 2002, 2010, 2018.
So, we can hope that this seasonality will now act as a prop. But do
not count on it if Biden does not pick Powell. The first thing the market may do is
to shrug it off, but once his replacement takes office in January, the next thing it will
likely do is to test her by falling and crying out for help, very much like a spoiled
little child. |
|
====================================================================================
Written 11-18- 5:45 AM DJI +25 NASDAQ +83 Data through 11/17
| |
Fears that Jerome
Powell will NOT be re-nominated as Fed Chairman are working against the market now.
Powell's low interest rates
and QE-Infinity have made the FED very popular on Wall Street. Never has so much
money been distributed there with so few strings attached. Imagine borrowing at 1%
when inflation is 6%.
President Biden has announced that he will be soon make his choice
for the job of Chairman of the Federal Reserve known. Unlike Powell, Biden has
picked a relatively unknown Democratic economist named Lael Brainard as his alternative to
interview.
https://en.wikipedia.org/wiki/Lael_Brainard
It appears to me that he has staged her so that she will seem weak compared to the
experienced and well-known Powell and Biden will be seen as acting more wisely.
But we will soon see. Either way, Professionals have become heavy sellers of DIA and
most of the DJI-30 stocks including GS. Now even
FAS, which represents financials, shows a weak Closing Power. FAS is more closely
linked to the DJI's rises and falls than any sector ETF.
At the same time, there are now more new lows than new highs on the NYSE and NASDAQ and
more new lows among our Bearish MINCPs than our Bullish MAXCPs. At this point,
shorting some of the weakest Bearish MINCPs is probably called for if the DJI breaks below
35800. But stay long SOXL and QQQ. There is a lot of market history
showing the DJI topping out weeks and even months before QQQ and the NASDAQ do.
|
|
Table 1 QUICKSILVER on ETFS - 11/17/21
   Bullish = 5 -  RETL, SOXL (+.699), TECL, GLD and CORN
   Bearish = 0
ETF       CLOSE   CHANGE    PIVOT-PT    5-dma AROC   CL-PWR   CANDLE   IP21   ITRS   POWER INDEX
---------------------------------------------------------------------------------------------
DIA       359.85  -2.08      359.46       -16.9%     Bearish  RED     .06      0       -----
---------------------------------------------------------------------------------------------
SPY       468.14  -1.14      463.77        48.5%     -------  RED     .188    .012      .2
---------------------------------------------------------------------------------------------
QQQ       397.63   .21       390.59        103.2%    -------  RED     .119    .018      .137
---------------------------------------------------------------------------------------------
MDY       526.56  -4.47      527.23        20%       -------  RED     .095    .035      .13
---------------------------------------------------------------------------------------------
IWM       235.86  -3.13      239.26       -31.2%     -------  RED     .059    .027      .086
---------------------------------------------------------------------------------------------
FAS       138.79  -4.47      142.75       -97.2%     Bearish  RED    -.013    .145      .132
---------------------------------------------------------------------------------------------
RETL      52.25  -3.95       52.36         167.6%    -------  RED     .126    .227      .353
---------------------------------------------------------------------------------------------
SOXL      64.52  -1.63       61.64         526%      Bullish  RED     .29    .409       .699
---------------------------------------------------------------------------------------------
TECL      80.21  -.75        76.06         343.7%    Bullish  RED     .152    .148      .3
---------------------------------------------------------------------------------------------
IBB       154.1   .04        153.42        19.2%     Bearish  BLUE    .066   -.139     -.073
---------------------------------------------------------------------------------------------
GLD       174.5   1.58       174.12        38.8%     Bullish  BLUE    .279    .017      .296
---------------------------------------------------------------------------------------------
OIH       198.97  -7.67      209.34       -261.7%    Bearish  RED    -.158    .08      -.078
---------------------------------------------------------------------------------------------
UUP       25.69  -.05        25.53         43%       Bullish  ----   -.009    .006     -.003
---------------------------------------------------------------------------------------------
CORN      25.69  -.05        25.53         43%       Bearish  ----    .392    .285      .677
---------------------------------------------------------------------------------------------
YINN      11.76  -.4         11.95         439.4%    Bearish  RED    -.042   -.125     -.167
---------------------------------------------------------------------------------------------
|
Table 2    Count of Stocks in Key Directories
           20211117
-------------------------------
NEWHIGHS       222
NEWLOWS        324
MAXCP          29
MINCP          118
TTTNH          22
TTTNL          79
CPCROSSA       45
CPCROSSD       76
ACCUMVER       234
HIGHIP21       16
HIUPPCT        26
REDSELL        155
AUGSELS7       50
TRAPDOOR       10
|
Table 3       RANKING OF KEY DIRECTORIES BASED PCT.OF STOCKS ABOVE 65-DMA
               11/17/21
 Bullish = 37
 Bearish = 10
---------------------------------------------------------------------------------------
Directory     Current       day-1         day-2         day-3         day-4         day-5
----------------------------------------------------------------------------------------
SOLAR          1             .937          .937          .937          .937          .812
REGBANKS       .96           .96           .96           .96           .96           .96
HOMEBLDG       .882          .882          .882          .882          .882          .882
GOLD           .826          .869          .913          .913          .934          .847
RETAIL         .808          .893          .936          .893          .851          .851
CHEM           .804          .826          .804          .891          .891          .826
FOOD           .795          .795          .755          .734          .755          .755
SEMI           .795          .795          .795          .806          .785          .755
NIFTY          .765          .787          .808          .787          .744          .787
TRANSP         .75           .75           .9            .85           .9            .95
FINANCE        .74           .765          .753          .765          .777          .74
AUTO           .733          .8            .8            .777          .755          .711
ELECTRON       .731          .761          .738          .746          .708          .694
HIGHPRIC       .721          .75           .728          .753          .721          .728
BEVERAGE       .714          .714          .785          .785          .785          .714
REIT           .709          .732          .801          .778          .824          .824
INDEXES        .701          .733          .766          .722          .75           .804
COMPUTER       .7            .75           .7            .75           .75           .7
RUS-1000       .696          .727          .734          .739          .718          .705
INDMATER       .694          .722          .763          .777          .791          .75
GUNS           .692          .692          .692          .615          .615          .615
SP500          .687          .707          .719          .724          .703          .701
INSURANC       .68           .84           .84           .8            .84           .84
COMODITY       .675          .7            .7            .7            .675          .625
FIDSTKS        .668          .692          .704          .68           .674          .698
GREEN          .65           .7            .75           .75           .8            .8
NASD-100       .649          .69           .68           .721          .711          .69
GAMING         .631          .684          .684          .631          .578          .578
ETFS           .625          .696          .714          .75           .714          .571
SOFTWARE       .625          .625          .571          .66           .66           .642
OILGAS         .622          .735          .745          .773          .783          .745
INFRA          .606          .666          .727          .727          .787          .666
SP-100         .6            .633          .688          .7            .666          .666
BIGBANKS       .571          .714          .714          .714          .714          .571
HACKERS        .555          .555          .555          .611          .611          .611
DJI-13         .538          .692          .692          .615          .692          .615
DOWJONES       .533          .6            .733          .7            .7            .666
=========================================================================================
MARIJUAN       .5            .5            .666          .833          .5            .5
MILITARY       .5            .538          .653          .653          .615          .692
=========================================================================================
CHINA          .47           .509          .509          .588          .588          .352
HOSPITAL       .375          .437          .437          .437          .437          .437
UTILITY        .342          .394          .473          .368          .421          .342
COAL           .333          .5            .5            .666          .666          .5
BIOTECH        .331          .375          .375          .419          .397          .369
BONDFUND       .329          .352          .329          .375          .397          .352
JETS           .307          .307          .615          .538          .692          .692
LOWPRICE       .277          .32           .358          .366          .368          .338
COPPER         .25           .5            .625          .625          .625          .25
EDU            .166          .333          .333          .333          .333          .333
|
====================================================================================
====================================================================================
Written 11-17- 6:12 AM DJI -51 NASDAQ +8 Data through 11/16
| |
Though little changed
at the end of the day, the DJI lost 100 + point in its early gain today and closed again
at its lows. It only managed this because high priced Home Depot was up more than 21
points (thereby lifting the DJI more than 125 just by itself). Interest rates are
not going up much but President Biden says he will pick the next Fed Chairman at the end
of the week. I would expect him to be cautious about a different person, but we'll
see. This makes some blue chip and bond traders nervous.
The DJI might breakdown to a short-term new low and complete
a minor head/shoulders. But I doubt if that will be significanct. The
DIA's Closing Power's does suggest that many Professionals do not deem the DJI worthy of
being long at this time.
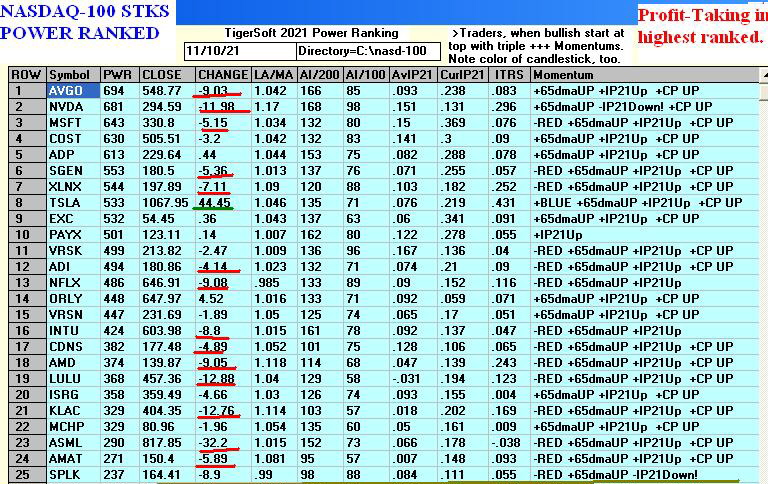
Of more importance is the fact that the volatile Semiconductors
(SOXL) roared ahead to a new high, Look at the Power Ranking below of our
Semi-conductors. Almost every top-ranked semi was up more than a point. They
are the stars of our Bullish MAXCPs, tonight. SOXL should be held. The
generation move into electric cars is playing a big role here. TSLA cannot be held
back and re-gained 50+ today. I would ignore the DJI at this time and be long some of the
plays in SOXL. They have become dominant among growth stocks. |
|
Charts - 11/16/2021
2021 PEERLESS DJI, Signals,
Indicators Daily DJI Volume 10-DayUp/Down Vol Stoch-20
Inverted Traders Index
Graph of Pct of All Stocks above
65-dma Cum. Inverted
Traders Index
DJI-IPA DJI-OBV
NASDAQ S&P OEX NYSE COMPQX DJI-15 DJI-20 DJI-30
DIA QQQ SPY IWM TNA Short-Term Rates DOLLAR-UUP ALLSTOCKs
recent 2006 vers-Peerless signals
http://tigersoftware.com/NEWPEER/UPD71115.BMP
MDY - http://www.tigersoftware.com/CHARTZ/MDY.GIF
USO-CrudeOil DBO FAS GLD BBH IBB JETS JNUG KOL NUGT OIH PALL RSX RETL
SDS AGQ SLV SOXL TAN TECL TLT TMF TNA UGA (gasoline) USO (oil) and China: YINN CHAU
Commodities: CANE
CORN DBC JJC, NIB CORN, CUT (paper)
MOO, SOYB WEAT UUP (Dollar) LIT
(Lithium)
STOCKS:
MRNA DIS GE PYPL GME ZOM XLE NRGU
AAPL ADBE ALXN AMAT AMGN AMD AMZN AXP BA BABA BAC BIDU BLDP CAT CRM CVX
CMG DE ENPH FB GILD GOOG GS HD IBM INTU JPM LRCX M MRK MSFT NEM NFLX
NKE NVDA PG PYPL REGN REV SO SQ QCOM QDEL TSLA TXN XOM V VRTX WFC WMT ZM
Bullish MAXCPs http://tigersoftware.com/UPPER/11-16/BULLISH.htm
Bearish MAXCPs http://tigersoftware.com/DOWNER/11-16/BEARISH.htm
|
 |
 |
 |
 |
 |
 |
 |
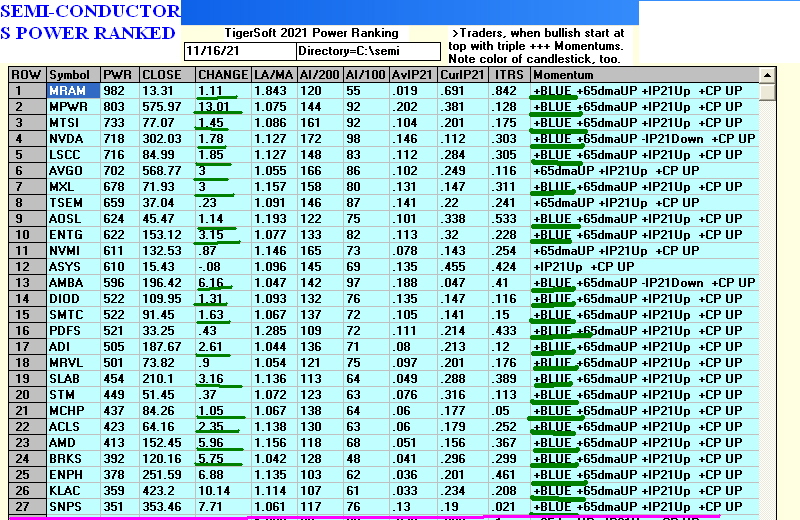 |
Table 1 QUICKSILVER on ETFS - 11/16/21
   Bullish = 6 - SPY, RETL, SOXL (+.726), TECL, GLD and CORN
   Bearish = 0
ETF       CLOSE   CHANGE    PIVOT-PT    5-dma AROC   CL-PWR   CANDLE   IP21   ITRS   POWER INDEX
==================================================================================================
DIA       361.93   .69       361.07       -18.7%     -------  BLUE    .128    0        .128
---------------------------------------------------------------------------------------------
SPY       469.28   1.85      463.62        20.4%     -------  BLUE    .238    .01      .248
---------------------------------------------------------------------------------------------
QQQ       397.42   2.81      389.51        26.7%     -------  BLUE    .168    .01      .178
---------------------------------------------------------------------------------------------
MDY       531.03   .94       524.45        17.6%     Bullish  BLUE    .106    .037     .143
---------------------------------------------------------------------------------------------
IWM       238.99   .44       237.35       -45.2%     -------  BLUE    .086    .026     .112
---------------------------------------------------------------------------------------------
FAS       143.26  -.3        141.57        9.1%      Bearish  RED     .065    .169     .234
---------------------------------------------------------------------------------------------
RETL      56.2   1.88        50.46         242%      Bullish  BLUE    .211    .273     .484
---------------------------------------------------------------------------------------------
SOXL      66.15   2.95       57.95         222.1%    Bullish  BLUE    .341    .385     .726
---------------------------------------------------------------------------------------------
TECL      80.96   2.44       74.86         133.7%    Bullish  BLUE    .235    .141     .376
---------------------------------------------------------------------------------------------
IBB       154.06   .88       153.51       -47.4%     Bearish  BLUE    .056   -.152    -.096
---------------------------------------------------------------------------------------------
GLD       172.92  -1.26      173.15        47%       -------  RED     .218    .001     .219
---------------------------------------------------------------------------------------------
OIH       206.64   2.23      209.82       -352.1%    Bearish  BLUE   -.093    .079    -.014
---------------------------------------------------------------------------------------------
UUP       25.74   .1         25.47         106%      Bullish  BLUE    .044    .006     .05
---------------------------------------------------------------------------------------------
CORN      25.74   .1         25.47         106%      Bearish  BLUE    .321    .284     .605
---------------------------------------------------------------------------------------------
YINN      12.16   .39        10.73         760.5%    -------  ----    .04   -.126     -.086
---------------------------------------------------------------------------------------------
RSX       31.03  -.31        31.72        -198.5%    Bearish  RED     .01    .007      .017
|
 Table 2   Count of Stocks in Key Directories
          20211116
-------------------------------
NEWHIGHS       470
NEWLOWS        260
MAXCP          40
MINCP          91
TTTNH          32
TTTNL          59
CPCROSSA       101
CPCROSSD       73
ACCUMVER       232
HIGHIP21       15
HIUPPCT        22
REDSELL        149
AUGSELS7       54
TRAPDOOR       8
|
Table 3  RANKING OF KEY DIRECTORIES BASED PCT.OF STOCKS ABOVE 65-DMA
              11/16/21
 Bullish = 39
 Bearish = 7
---------------------------------------------------------------------------------------
Directory     Current       day-1         day-2         day-3         day-4         day-5
----------------------------------------------------------------------------------------
REGBANKS       .96           .96           .96           .96           .96           .96
SOLAR          .937          .937          .937          .937          .812          .875
RETAIL         .893          .936          .893          .851          .829          .829
HOMEBLDG       .882          .882          .882          .882          .882          .882
GOLD           .869          .913          .913          .934          .847          .913
INSURANC       .84           .84           .8            .84           .84           .8
CHEM           .826          .804          .891          .891          .826          .826
AUTO           .8            .8            .777          .755          .711          .711
FOOD           .795          .755          .734          .755          .755          .755
SEMI           .795          .795          .806          .785          .755          .775
NIFTY          .787          .808          .787          .765          .723          .787
FINANCE        .765          .753          .765          .777          .74           .777
ELECTRON       .761          .738          .746          .708          .686          .738
COMPUTER       .75           .7            .75           .75           .7            .65
HIGHPRIC       .75           .728          .753          .721          .721          .768
TRANSP         .75           .9            .85           .9            .95           1
OILGAS         .735          .745          .773          .783          .735          .792
INDEXES        .733          .766          .722          .75           .798          .777
REIT           .73           .792          .776          .823          .823          .846
RUS-1000       .727          .734          .739          .718          .701          .727
INDMATER       .722          .763          .777          .791          .736          .791
BEVERAGE       .714          .785          .785          .785          .714          .642
BIGBANKS       .714          .714          .714          .714          .571          .714
SP500          .707          .719          .724          .703          .697          .711
COMODITY       .7            .7            .7            .675          .625          .7
GREEN          .7            .75           .75           .8            .8            .8
ETFS           .696          .714          .75           .714          .553          .66
DJI-13         .692          .692          .615          .692          .538          .615
FIDSTKS        .692          .704          .68           .674          .686          .704
GUNS           .692          .692          .615          .615          .615          .615
NASD-100       .69           .68           .721          .711          .69           .701
GAMING         .684          .684          .631          .578          .578          .684
INFRA          .666          .727          .727          .787          .666          .787
SP-100         .633          .688          .7            .666          .655          .677
SOFTWARE       .625          .571          .66           .66           .642          .696
DOWJONES       .6            .733          .7            .7            .633          .666
HACKERS        .555          .555          .611          .611          .611          .722
MILITARY       .538          .653          .653          .615          .653          .769
CHINA          .509          .509          .588          .588          .313          .431
=========================================================================================
COAL           .5            .5            .666          .666          .5            .666
COPPER         .5            .625          .625          .625          .25           .5
MARIJUAN       .5            .666          .833          .5            .5            .5
========================================================================================
HOSPITAL       .437          .437          .437          .437          .437          .437
UTILITY        .394          .473          .368          .421          .342          .368
BIOTECH        .376          .376          .419          .397          .373          .438
BONDFUND       .352          .329          .375          .397          .352          .522
EDU            .333          .333          .333          .333          .333          .333
LOWPRICE       .322          .355          .365          .367          .337          .425
JETS           .307          .615          .538          .692          .615          .923
|
=====================================================================================
=====================================================================================
Written 11-16- 6:00 AM DJI +45
NASDAQ -16 Data through 11/15
| |
After a positive
opening of more than 100 points, the DJI gradually weakened much of the day. This
dropped the DJI's Closing Power
below its 21-dma. DIA's Closing Power's shallow rise on Friday was more than matched
by its decline today. Professionals, apparently, do not deem the DJI worthy of being
long, rather than wanting to sell it aggressively. The DIA's Closing Power is quite
a bit weaker than the Closing Powers of the NASDAQ, SPY, QQQ, SOXL or TECL, all of which
show rising Closing Power moving averages and positive IP21-values.
The moves in the DJI are very small right now. If we focus on them too much we will
lose sight of the really big moves individual sectors and stocks are making. Let me
suggest we work with longs in SOXL and QQQ now. In particular, read up on how
electrical cars are going to take over the roads in a few years. For a year-end
rally, I would buy chip-makers that are enabling car-makers to abandon higher maintenance
gasoline powered engines and I would buy the leading battery-powered vehicles when each's
intermediate-term dips are over. See three such such stocks below: MRAM, MGA
and PLUG.
Tomorrow, we will talk about the electric car and battery ETFs.
See now https://www.yahoo.com/now/10-best-battery-etfs-buy-143257314.html
Peerless: S12 or
Judge B10
My advise is watch the Closing Powers.
Professionals will know first what the FED intends to
do.
From a Peerless point of view, we must also watch the DJI's 35800-35850 level to decide if
the breakout holds. The IP21 is positive, but falling back towards negative territory.
If the support of earlier point of breakout around 35850 fails, it will also mean a
miniature Head/Shoulders will have been completed in the DJIA and DIA.
Those of you who want an automatic signal always to be easily seen are probably
disappointed here. But that is just the nature of the market now given the
incredible power of the FED. We see the FED's power in supporting the market by the
rising Closing Powers. This was the case when the Sell S12 occurred. The
Professionals would not allow a sell-off.
But we also know that breakouts judged as Buy B10's will eventually run out of steam
if the Closing Power uptrends are broken for the key ETFs. The question here is,
will the markets sell off enough to void the earlier breakouts. We are about to find
out.
Helping the market hold up are (1) short-term interest rates well below
0.5%, (2) the Dollar making new highs and now (3) the way electrical autos and trucks will
bring an eventual decline in oil and inflation.
Why Fight the FED?
The powerful FED has many friends. Despite 6% CPI inflation. there is only limited
pressure in the public on the FED to raise rates. Few citizens have any real
knowledge of what the FED is, what makes it so powerful or who it usually benefits.
If you asked them how the big rise in Wall Street since March 2020 led to inflation, they
would give you a big blank look. Instead, Biden is now being blamed for trying to
bring some stimulus-money to the "little guy". As an example, of how vast
is the power- network of the FED is, Larry Summers this past weekend on CNN blamed fiscal
spending rather than the FED for the inflation. He was quick to make clear that the
FED must remain "independent". (No one on CNN suggested that
"independence" might allow the FED to continue to support the big banks and Wall
Street at the expense of most other Americans. )
So, my belief is that we would be making a mistake now to bet against the FED and the
continuation of the bull market. Never before have the FED and Wall Street been so
powerful. They're not going to be quick tinker with something that works so well
from their point of view.
|
|
=====================================================================================
=====================================================================================
Written 11-15- 5:25 AM DJI +130 NASDAQ +70
Data through 11/12
| |
The DJI turned back up
from the support of earlier point of breakout around 35850. Along with the now quite
positive IP21-Accumulation and the bullish seasonality ahead, it looks we should judge a
Buy B10 to be operating. Professionals have turned bullish. Notice the
turns-upward by the Closing Powers of the NASDAQ, QQQ, SPY, TECL and SOXL. A
challenge of the recent highs must be expected for the DJIA, too. At that point,
resistance from the upward sloping price channels is apt to blunt the rally unless FAS
(financials) come alive.
While Gold and Silver are above their 65-day moving averages and are
advancing on the news of the highest rate of inflation in thirty years, oil's rise will
not go much higher, given the predictions that new electric cars will for the first time
be cheaper to buy and operate than gasoline run vehicles. This, of course, will be a
world-wide phenomenon. Start looking to purchase some the many plays on electric
cars again. These include NKLA, PLUG, SOLO, BLNK, FUV, KNDI, BLDP and WKHS.
More on the group tomorrow. They have a lot of catching up to do with TESLA.
Inflation, otherwise is quite real. Who would be so stupid to loan out money for
under 2% when inflation is 6%? Answer - the Federal Reserve. But who's to stop
them? Not the major net works, Congress or Biden. Remember that it was the
Democrats that passed the law in 1913 that created the Federal Reserve. So, Powell
rules to roost, as it were, and interest rates could stay as low as they are now for six
more months. That would make stocks the inevitable haven for more FED
money used by Wall Street to get even richer. "Trickle-down" is flowering
like never before.
In these circumstances, there may be stocks to short, but the obvious technology plays,
especially the most bullish Leveraged ETFs should
do well as funds begin their year-end rush to show how smart they were
to own the technology leaders. Articificial intelligence, semi-conductor
and electrically driven car-stocks should all do well now. |
|
====================================================================================
====================================================================================
Written 11-12- 6:00 AM DJI +108 NASDAQ +44
Data through 11/11
| |
The DJI
continued to retreat back in the direction of its earlier
breakout point between 35800 and 35900. Classic technical analysis-
theory tells us the resistance broken above should become support
on the next pullback by prices. Support should come in here. If not
it will validate the judged Buy B10 rendered as the surpassed 36900
on the way up recently above 36200. A failure of the DJI, on the other
hand, to hold above 35800 would mean the recent rally was a misleading failure. It
will then probably bring a sell-off back to the lower band.
We watch the Closing Power to tell us what Professionals expect at
these juncture points. DIA's Closing Power (shown below) has been
falling falling now for four straight days and has even violated its 21-day
ma. Several months ago four straight falling Closing Powers
led to a DJI decline back to its lower band, about 4% lower. Professionals
will need to make the DJI continue to rise from what looks like will be a
plus hundred point opening.
QQQ's Closing Power has now fallen five straight days, but it has now
returned almost to the support of its rising 21-dma of Closing Power,
A hook back up by it now would be bullish. Traders should use that
to buy some QQQ at the close.
Watch also FAS and short-term rates which are locked in a narrow range.
We will need to see FAS move up sharply to get the DJI rising again
with some energy. The problem with that is Inflation. See that Gold and
Silver are back above their 65-day ma. Will they start to rise like Crude Oil
and other commodities have? Friday will be a important day technically
in terms of the DJI (DIA) and QQQ.
One other thing to notice is the greater number of bearish looking MINCPs
than bullish MAXCPs. Short-sellers are not so frightened now as to be hastening to
cover their best short sales. Hedging again should pay off.
|
Charts - 11/11/2021
2021 PEERLESS DJI, Signals,
Indicators Daily DJI Volume 10-DayUp/Down Vol Stoch-20
Inverted Traders Index
Graph of Pct of All Stocks above
65-dma Cum. Inverted
Traders Index
DJI-IPA DJI-OBV
NASDAQ S&P OEX NYSE COMPQX DJI-15 DJI-20 DJI-30
DIA QQQ SPY IWM TNA Short-Term Rates DOLLAR-UUP ALLSTOCKs
recent 2006 vers-Peerless signals
http://tigersoftware.com/NEWPEER/UPD71111.BMP
MDY - http://www.tigersoftware.com/CHARTZ/MDY.GIF
USO-CrudeOil DBO FAS GLD BBH IBB JETS JNUG KOL NUGT OIH PALL RSX RETL
SDS AGQ SLV SOXL TAN TECL TLT TMF TNA UGA (gasoline) USO (oil) and China: YINN CHAU
Commodities: CANE
CORN DBC JJC, NIB CORN, CUT (paper)
MOO, SOYB WEAT UUP (Dollar) LIT
(Lithium)
STOCKS:
MRNA DIS GE PYPL GME ZOM XLE NRGU
AAPL ADBE ALXN AMAT AMGN AMD AMZN AXP BA BABA BAC BIDU BLDP CAT CRM CVX
CMG DE ENPH FB GILD GOOG GS HD IBM INTU JPM LRCX M MRK MSFT NEM NFLX
NKE NVDA PG PYPL REGN REV SO SQ QCOM QDEL TSLA TXN XOM V VRTX WFC WMT ZM
Bullish MAXCPs http://tigersoftware.com/UPPER/11-11/BULLISH.htm
Bearish MAXCPs http://tigersoftware.com/DOWNER/11-11/BEARISH.htm
|
 |
 |
 |
 |
 |
| 
|
 |
 |
| 
|
 |
 |
 |
 |
 |
 |
Table 1 QUICKSILVER on ETFS - 11/11/21
   Bullish = 7 - DIA, FAS, RETL, SPY, QQQ, SOXL (+.689), TECL
   Bearish = 0
ETF       CLOSE   CHANGE    PIVOT-PT    5-dma AROC   CL-PWR   CANDLE   IP21   ITRS   POWER INDEX
---------------------------------------------------------------------------------------------
DIA       359.46  -1.61      363.3        -26.1%     -------  RED     .278    0         .278
---------------------------------------------------------------------------------------------
SPY       463.77   .15       468.53       -33.6%     -------  RED     .326    .01       .336
---------------------------------------------------------------------------------------------
QQQ       390.59   1.08      398.6        -96.4%     -------  RED     .225    .01       .235
---------------------------------------------------------------------------------------------
MDY       527.23   2.78      529.56        22.1%     Bullish  BLUE    .135    .03       .165
---------------------------------------------------------------------------------------------
IWM       239.26   1.91      241.81        14.8%     Bullish  BLUE    .071    .035      .106
---------------------------------------------------------------------------------------------
FAS       142.75   1.18      143.34       -15.4%     -------  BLUE    .14     .15       .29
---------------------------------------------------------------------------------------------
RETL      52.36   1.9        52.6          129.8%    Bullish  BLUE    .18     .116      .296
---------------------------------------------------------------------------------------------
SOXL      61.64   3.69       60.91         209.9%    Bullish  BLUE    .364    .324      .688
---------------------------------------------------------------------------------------------
TECL      76.06   1.2        78.46        -86%       -------  RED     .307    .094      .401
---------------------------------------------------------------------------------------------
IBB       153.42  -.09       156.94       -267.7%    Bearish  RED     .009   -.135     -.126
---------------------------------------------------------------------------------------------
GLD       174.12   .97       169.84        189.8%    Bullish  BLUE    .193    .009      .202
---------------------------------------------------------------------------------------------
OIH       209.34  -.48       216.33       -105.9%    Bearish  RED    -.088    .116      .028
---------------------------------------------------------------------------------------------
UUP       25.53   .06        25.28         45.5%     Bullish  BLUE   -.051    .011     -.04
---------------------------------------------------------------------------------------------
CORN      25.53   .06        25.28         45.5%     Bearish  BLUE   -.153    .286      .133
---------------------------------------------------------------------------------------------
YINN      11.95   1.22       10.38         484.5%    -------  BLUE    .059   -.093     -.034
---------------------------------------------------------------------------------------------
RSX       32.06   .34        31.93         48.4%     -------  RED     .047    .06       .107
|
Table 2    Count of Stocks in Key Directories
          20211111
-------------------------------
NEWHIGHS       241
NEWLOWS        203
MAXCP          23
MINCP          63
TTTNH          14
TTTNL          37
CPCROSSA       82
CPCROSSD       47
ACCUMVER       227
HIGHIP21       17
HIUPPCT        24
REDSELL        132
AUGSELS7       56
TRAPDOOR       8
|
Table 3 RANKING OF KEY DIRECTORIES BASED PCT.OF STOCKS ABOVE 65-DMA
 Bullish = 42
 Bearish = 6
              11/11/21
---------------------------------------------------------------------------------------
Directory     Current       day-1         day-2         day-3         day-4         day-5
----------------------------------------------------------------------------------------
REGBANKS       .96           .96           .96           .96           .96           .92
SOLAR          .937          .812          .875          .937          .875          .875
GOLD           .934          .847          .891          .826          .826          .652
TRANSP         .9            .95           1             1             .95           .7
CHEM           .891          .826          .826          .804          .804          .695
HOMEBLDG       .882          .882          .882          .882          .882          .764
RETAIL         .851          .829          .851          .829          .872          .851
INSURANC       .84           .84           .8            .88           .88           .76
REIT           .816          .816          .847          .87           .893          .748
GREEN          .8            .8            .8            .8            .85           .85
INDMATER       .791          .736          .777          .763          .708          .611
INFRA          .787          .666          .757          .787          .696          .575
BEVERAGE       .785          .714          .642          .571          .642          .642
OILGAS         .783          .735          .792          .801          .764          .735
SEMI           .783          .752          .773          .783          .783          .773
FINANCE        .777          .74           .777          .79           .777          .753
NIFTY          .765          .744          .787          .808          .765          .765
AUTO           .756          .729          .702          .756          .783          .756
FOOD           .755          .755          .755          .775          .755          .755
INDEXES        .751          .806          .773          .756          .762          .707
COMPUTER       .75           .7            .65           .7            .65           .7
HIGHPRIC       .72           .72           .767          .763          .72           .738
RUS-1000       .718          .701          .723          .733          .737          .667
BIGBANKS       .714          .571          .714          .714          .714          .714
ETFS           .714          .553          .66           .696          .607          .571
NASD-100       .711          .69           .69           .721          .711          .711
ELECTRON       .708          .686          .731          .746          .731          .731
SP500          .703          .697          .705          .709          .707          .658
DOWJONES       .7            .633          .666          .733          .7            .6
DJI-13         .692          .538          .615          .692          .692          .538
JETS           .692          .615          .923          1             .923          .307
COMODITY       .675          .625          .675          .7            .7            .65
FIDSTKS        .674          .686          .692          .721          .698          .627
COAL           .666          .5            .666          .666          .666          .666
SP-100         .666          .655          .666          .7            .688          .622
SOFTWARE       .66           .642          .696          .75           .696          .66
COPPER         .625          .25           .5            .625          .5            .25
GUNS           .615          .615          .615          .538          .615          .538
MILITARY       .615          .653          .769          .73           .73           .461
HACKERS        .611          .611          .722          .722          .722          .722
CHINA          .588          .313          .431          .411          .352          .392
GAMING         .578          .578          .684          .789          .736          .684
=========================================================================================
MARIJUAN       .5            .5            .5            .666          .333          .333
=========================================================================================
HOSPITAL       .47           .47           .47           .529          .47           .352
UTILITY        .421          .342          .368          .368          .526          .394
BIOTECH        .397          .373          .441          .468          .463          .479
BONDFUND       .397          .352          .511          .42           .306          .17
LOWPRICE       .367          .334          .42           .432          .397          .389
EDU            .333          .333          .333          .333          .333          .333
|
====================================================================================
====================================================================================
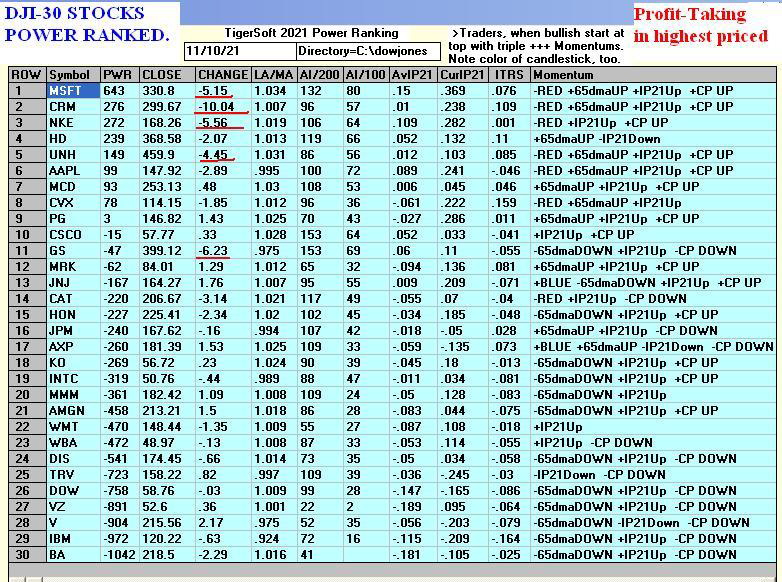
Written 11-11- 6:05 AM DJI +30 NASDAQ +75
Data through 11/10
| |
The DJI and most of
the other indexes have stalled out at the top of their price
channels. Seeing that, Professional traders have declded to lock in their
profits on the recent advance. Gold is now above its 65-dma and though the
Dollar is strong still, short-term and 10-year rates are rising somewhat. Watch
what happens to FAS. Without strength in FAS, GS and JPM, the next rally
will probably be limited.
Our steep Closing Power steep uptrends have been broken for the key
Index ETFs shown below. Will they turn back up? DIA's is at its rising
21-day ma. QQQ's Closing Power and SPY's Closing Power have dropped
a little below their still rising 10-day ma. A strong close above their openings
would be short-term re-buy.
Their IP21-Accumulation Indexes remain quite positive. This will help
prevent a bigger sell-off. But we should wait for these Closing Powers to
turn up back up. The Sell S12 seemed unstrustworthy with the DJI's
breakout over flat resistance. But the breaks in the Closng Power uptrends now put
us on alert that professionals are short-term bearish.
The likelihood is good that the Closing Powers for DIA, SPY, COMPQX (the NASDAQ), QQQ and
TECL will see their Closing Powers' turn back above
their 10-day moving averages.
|
Charts - 11/10/2021
2021 PEERLESS DJI, Signals,
Indicators Daily DJI Volume 10-DayUp/Down Vol Stoch-20
Inverted Traders Index
Graph of Pct of All Stocks above
65-dma Cum. Inverted
Traders Index
DJI-IPA DJI-OBV
NASDAQ S&P OEX NYSE COMPQX DJI-15 DJI-20 DJI-30
DIA QQQ SPY IWM TNA Short-Term Rates DOLLAR-UUP ALLSTOCKs
recent 2006 vers-Peerless signals
http://tigersoftware.com/NEWPEER/UPD71110.BMP
MDY - http://www.tigersoftware.com/CHARTZ/MDY.GIF
USO-CrudeOil DBO FAS GLD BBH IBB JETS JNUG KOL NUGT OIH PALL RSX RETL
SDS AGQ SLV SOXL TAN TECL TLT TMF TNA UGA (gasoline) USO (oil) and China: YINN CHAU
Commodities: CANE
CORN DBC JJC, NIB CORN, CUT (paper)
MOO, SOYB WEAT UUP (Dollar) LIT
(Lithium)
STOCKS:
MRNA DIS GE PYPL GME ZOM XLE NRGU
AAPL ADBE ALXN AMAT AMGN AMD AMZN AXP BA BABA BAC BIDU BLDP CAT CRM CVX
CMG DE ENPH FB GILD GOOG GS HD IBM INTU JPM LRCX M MRK MSFT NEM NFLX
NKE NVDA PG PYPL REGN REV SO SQ QCOM QDEL TSLA TXN XOM V VRTX WFC WMT ZM
Bullish MAXCPs
http://tigersoftware.com/UPPER/11-10/BULLISH.htm
Bearish MAXCPs
http://tigersoftware.com/DOWNER/11-10/BEARISH.htm |
 |
|
| 
|
 |
 |
 |
 |
 |
 |
 |
 |
 |
 |
 |
 |
 |
Table 1
Table 1 QUICKSILVER on ETFS - 11/10/21
   Bullish = 7 - DIA, FAS, RETL, SPY, QQQ, SOXL, TECL
   Bearish = 0
ETF       CLOSE   CHANGE    PIVOT-PT    5-dma AROC   CL-PWR   CANDLE   IP21   ITRS   POWER INDEX
---------------------------------------------------------------------------------------------
DIA       361.07  -2.21      361.35       -6.8%     -------   RED     .341    0        (.341)
---------------------------------------------------------------------------------------------
SPY       463.62  -3.76      466.91       -11.8%     -------  RED     .383    .007     .39
---------------------------------------------------------------------------------------------
QQQ       389.51  -5.81      398.22       -46.3%     -------  RED     .282    .005     .287
---------------------------------------------------------------------------------------------
MDY       524.45  -4.72      524.9        -20.5%     -------  RED     .153    .024     .177
---------------------------------------------------------------------------------------------
IWM       237.35  -3.8       238.55       -26.8%     -------  RED     .099    .03      .129
---------------------------------------------------------------------------------------------
FAS       141.57  -1.43      143.19       -257%      -------  RED     .156    .119     .275
---------------------------------------------------------------------------------------------
RETL      50.46  -3.18       51.01        -51.8%     Bullish  RED     .187    .093     .28
---------------------------------------------------------------------------------------------
SOXL      57.95  -5.45       59.08         356%      Bullish  RED     .323    .225     .548
---------------------------------------------------------------------------------------------
TECL      74.86  -4.03       77.4          56%       -------  RED     .329    .073     .402
---------------------------------------------------------------------------------------------
IBB       153.51  -2.01      161.83       -353.6%    Bearish  RED     .008   -.129    -.121
---------------------------------------------------------------------------------------------
GLD       173.15   1.86      167.65        218.3%    Bullish  RED     .227    0        .227
---------------------------------------------------------------------------------------------
OIH       209.82  -11.63     213.92       -110.5%    Bearish  RED    -.019    .109     .09
---------------------------------------------------------------------------------------------
UUP       25.47   .27        25.3          59.4%     Bullish  BLUE   -.124    .003    -.121
---------------------------------------------------------------------------------------------
CORN      25.47   .27        25.3          59.4%     Bearish  BLUE   -.186    .28      .094
---------------------------------------------------------------------------------------------
YINN      10.73   .3         10.92        -168.2%    Bearish  ----    .026   -.136    -.11
---------------------------------------------------------------------------------------------
RSX       31.72  -.57        31.75        -7.8%      Bearish  RED     .157    .063     .22
|
 Table 2  Count of Stocks in Key Directories
          20211110
-------------------------------
NEWHIGHS       143 + 124 = 267
NEWLOWS        38 + 130 = 168
MAXCP          14
MINCP          70
TTTNH          11
TTTNL          40
CPCROSSA       51
CPCROSSD       133
ACCUMVER       221
HIGHIP21       28
HIUPPCT        27
REDSELL        126
AUGSELS7       56
TRAPDOOR       14
|
Table 3    RANKING OF KEY DIRECTORIES BASED PCT.OF STOCKS ABOVE 65-DMA
              11/10/21
Bullish = 39
Bearish = 8
---------------------------------------------------------------------------------------
Directory     Current       day-1         day-2         day-3         day-4         day-5
----------------------------------------------------------------------------------------
REGBANKS       .96           .96           .96           .96           .92           .96
TRANSP         .95           1             1             .95           .75           .75
HOMEBLDG       .882          .882          .882          .882          .764          .764
GOLD           .847          .891          .826          .826          .652          .608
INSURANC       .84           .8            .88           .88           .76           .88
RETAIL         .829          .851          .829          .872          .851          .829
CHEM           .826          .826          .804          .804          .673          .782
REIT           .815          .838          .869          .892          .753          .846
SOLAR          .812          .875          .937          .875          .875          .875
INDEXES        .804          .766          .755          .76           .706          .766
GREEN          .8            .8            .8            .85           .85           .85
FOOD           .755          .755          .775          .755          .755          .612
SEMI           .752          .773          .783          .783          .773          .762
NIFTY          .744          .787          .808          .787          .744          .702
FINANCE        .74           .777          .79           .777          .753          .802
INDMATER       .736          .777          .763          .708          .611          .68
OILGAS         .735          .792          .801          .764          .735          .792
AUTO           .729          .702          .756          .783          .729          .756
HIGHPRIC       .72           .767          .763          .72           .738          .77
BEVERAGE       .714          .642          .571          .642          .642          .642
RUS-1000       .701          .723          .733          .737          .667          .704
COMPUTER       .7            .65           .7            .65           .65           .75
SP500          .697          .705          .709          .707          .658          .697
NASD-100       .69           .69           .721          .711          .701          .711
ELECTRON       .686          .731          .746          .731          .731          .708
FIDSTKS        .686          .692          .721          .698          .633          .68
INFRA          .666          .757          .787          .696          .575          .666
SP-100         .655          .666          .7            .688          .622          .677
MILITARY       .653          .769          .73           .73           .461          .615
SOFTWARE       .642          .696          .75           .696          .642          .625
DOWJONES       .633          .666          .733          .7            .6            .7
COMODITY       .625          .675          .7            .7            .65           .55
GUNS           .615          .615          .538          .615          .461          .615
JETS           .615          .923          1             .923          .384          .384
HACKERS        .611          .722          .722          .722          .722          .666
GAMING         .578          .684          .789          .736          .631          .736
BIGBANKS       .571          .714          .714          .714          .714          .857
ETFS           .553          .66           .696          .607          .571          .589
DJI-13         .538          .615          .692          .692          .538          .692
=========================================================================================
COAL           .5            .666          .666          .666          .666          .833
MARIJUAN       .5            .5            .666          .333          .333          .5
=========================================================================================
HOSPITAL       .47           .47           .529          .47           .352          .529
BIOTECH        .373          .441          .468          .463          .482          .525
BONDFUND       .352          .511          .42           .306          .17           .147
UTILITY        .342          .368          .368          .526          .394          .473
LOWPRICE       .337          .42           .433          .4            .382          .42
EDU            .333          .333          .333          .333          .333          .333
CHINA          .313          .431          .411          .352          .392          .392
COPPER         .25           .5            .625          .5            .25           .5
|
====================================================================================
====================================================================================
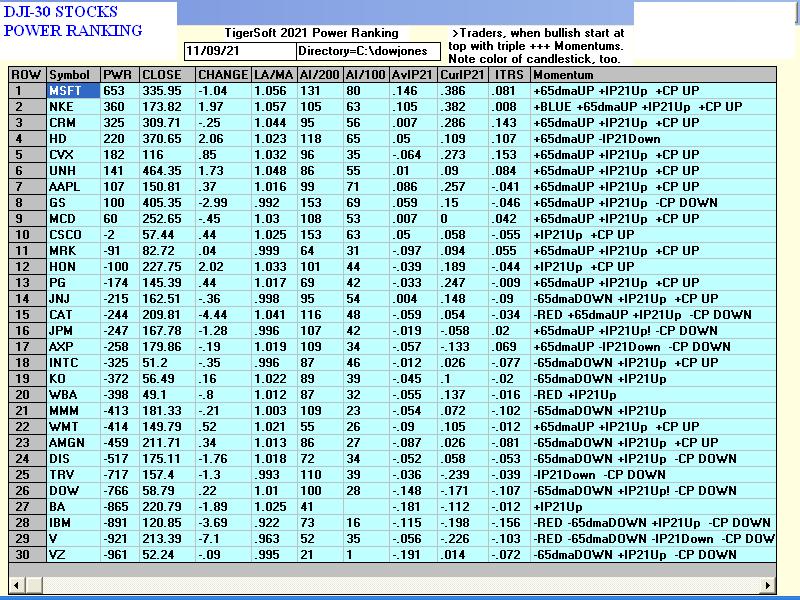
Written 11-10- 6:11 AM DJI
-57 NASDAQ -102 Data through 11/09
| |
The DJI, the NASDAQ,
OEX, SPY and QQQ could not get past the resistance of the top of their price chanels.
In varing degree, their blue candle sticks have previously turned to red and their
Closing Powers had already started drifting down, causing their Closing Powers to fall,
Today we saw bearish red popcicles from them. If there is no reversal at the
close today, the leading ETFs will be at or very close to sell-points. (Added late: TESLA ( TSLA ) fell 12% today. If that decline
continues, the tech stocks will under a lot more pressure.)
The trick now is to decide how far they will sell-off. The ones that are the
farthest up from their Closing Power 21-day moving averages (which will act as support)
would seem to have the most risk. Selling SOXL at the close today (11-9) was
recommended. We should evaluate other high Power ranked ETFs one by one, by the
size of their red "popsicles" today and whether they have broken their 10-day
Closing Power moving averages.
As background, we see that short-term and 10-year interest rates remain very low.
That should prop up the market, as should November's and December's general
bullishness as long as the various key ETFs do not drop back below their breakout points.
The Sell S12 seemed unstrustworthy with the DJI's breakout over flat resistance.
But the breaks in the Closng Power uptrends now put us on alert that professionals
are short-term bearish. That the Accumulation Index for the DIA and the DJIA have
become positive should keep these items from falling very fast.
The likelihood is good that the Closing Powers for DIA, SPY, COMPQX (the NASDAQ), QQQ and
TECL will retreat to their Closing Powers' 10-day ma and then turn up from there quite
swiftly. Be ready for
that contingency. |
|
Charts - 11/09/2021
2021 PEERLESS DJI, Signals,
Indicators Daily DJI Volume 10-DayUp/Down Vol Stoch-20
Inverted Traders Index
Graph of Pct of All Stocks above
65-dma Cum. Inverted
Traders Index
DJI-IPA DJI-OBV
NASDAQ S&P OEX NYSE COMPQX DJI-15 DJI-20 DJI-30
DIA QQQ SPY IWM TNA Short-Term Rates DOLLAR-UUP ALLSTOCKs
recent 2006 vers-Peerless signals
http://tigersoftware.com/NEWPEER/UPD71109.BMP
MDY - http://www.tigersoftware.com/CHARTZ/MDY.GIF
USO-CrudeOil DBO FAS GLD BBH IBB JETS JNUG KOL NUGT OIH PALL RSX RETL
SDS AGQ SLV SOXL TAN TECL TLT TMF TNA UGA (gasoline) USO (oil) and China: YINN CHAU
Commodities: CANE
CORN DBC JJC, NIB CORN, CUT (paper)
MOO, SOYB WEAT UUP (Dollar) LIT
(Lithium)
STOCKS:
MRNA DIS GE PYPL GME ZOM XLE NRGU
AAPL ADBE ALXN AMAT AMGN AMD AMZN AXP BA BABA BAC BIDU BLDP CAT CRM CVX
CMG DE ENPH FB GILD GOOG GS HD IBM INTU JPM LRCX M MRK MSFT NEM NFLX
NKE NVDA PG PYPL REGN REV SO SQ QCOM QDEL TSLA TXN XOM V VRTX WFC WMT ZM
Bullish MAXCPs
http://tigersoftware.com/UPPER/11-9/BULLISH.htm
Bearish MAXCPs
http://tigersoftware.com/DOWNER/11-9/BEARISH.htm |
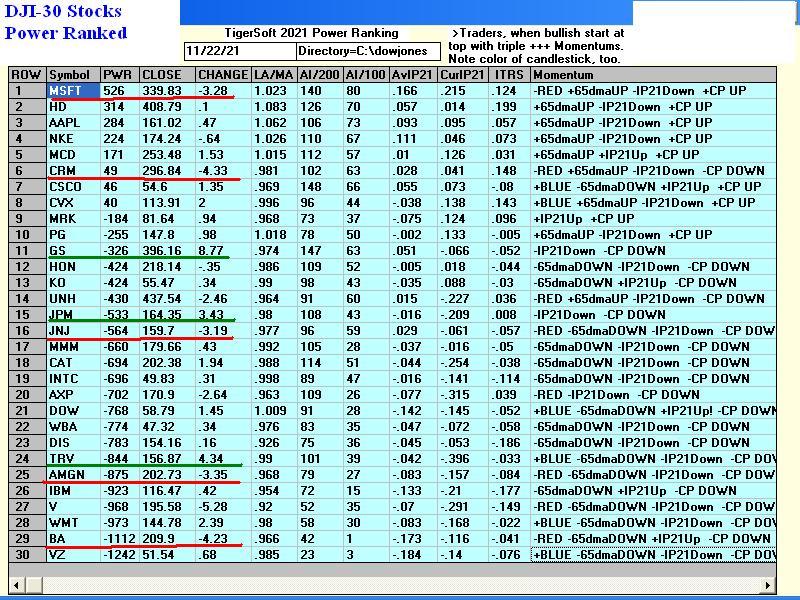
 |
 |
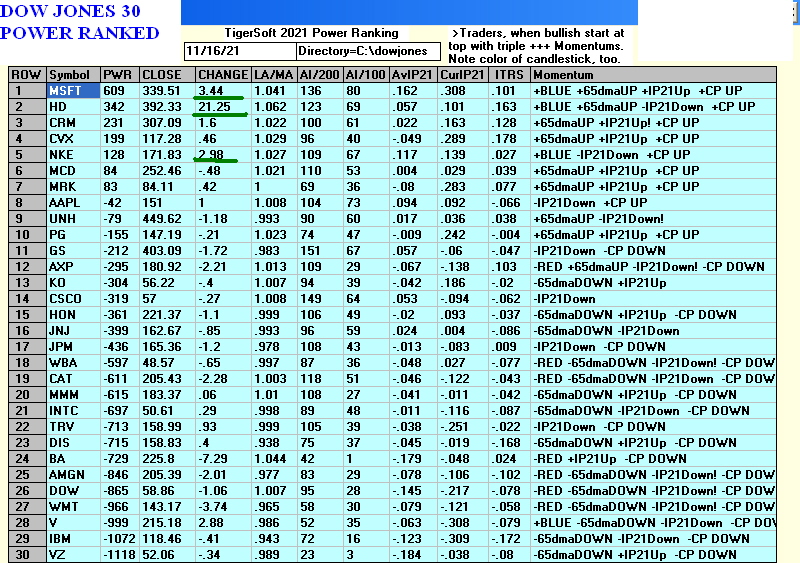
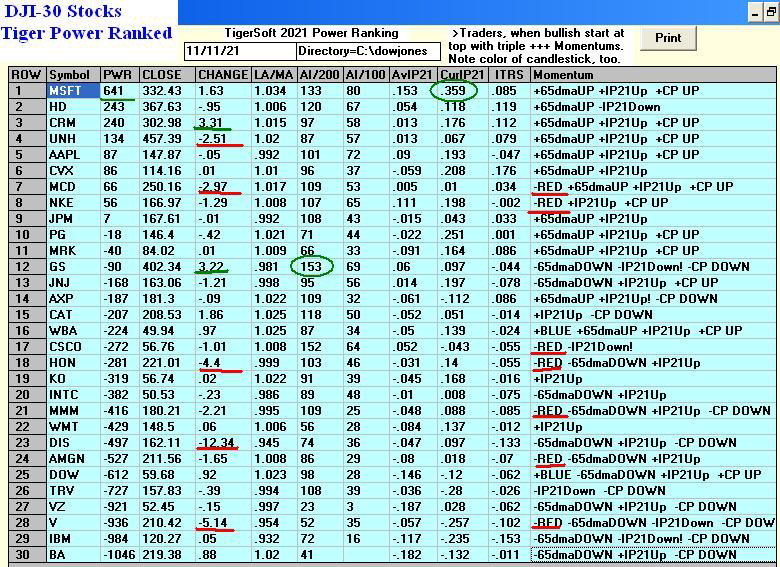
DJI - POWER RANKING
 |
 |
 |
SP-500 - TOP POWER RANKING
 |
 |
 |
 |
 |
 |
 |
 |
 |
Table 1 QUICKSILVER on ETFS - 11/09/21
   Bullish = 7 - DIA, RETL, SPY, QQQ, SOXL, TECL, RSX
   Bearish = 0
ETF       CLOSE   CHANGE    PIVOT-PT    5-dma AROC   CL-PWR   CANDLE   IP21   ITRS   POWER INDEX
---------------------------------------------------------------------------------------------
DIA       363.28  -1.04      361.56        37.4%     -------  RED     .32     0       ------
---------------------------------------------------------------------------------------------
SPY       467.38  -1.55      464.72        58.8%     -------  RED     .376    .008     .384
---------------------------------------------------------------------------------------------
QQQ       395.32  -2.74      393.18        79.3%     -------  RED     .288    .014     .302
---------------------------------------------------------------------------------------------
MDY       529.17  -.68       526.61        79.8%     Bullish  RED     .173    .025     .198
---------------------------------------------------------------------------------------------
IWM       241.15  -1.41      238.64        140%      Bullish  RED     .143    .044     .187
---------------------------------------------------------------------------------------------
FAS       143  -2.13         149.01       -130.6%    -------  BLUE    .141    .122     .263
---------------------------------------------------------------------------------------------
RETL      53.64   1.32       51            785.7%    Bullish  BLUE    .223    .143     .366
---------------------------------------------------------------------------------------------
SOXL      63.4  -.14         53.67         1001.7%   Bullish  RED     .321    .302     .623
---------------------------------------------------------------------------------------------
TECL      78.89  -.94        73.99         403.4%    -------  RED     .362    .109     .471
---------------------------------------------------------------------------------------------
IBB       155.52  -2.11      164.78       -222.4%    Bearish  RED     .061   -.122    -.061
---------------------------------------------------------------------------------------------
GLD       171.29   .84       165.77        122.8%    -------  BLUE    .237   -.015     .222
---------------------------------------------------------------------------------------------
OIH       221.45   1.4       214.62        137.9%    Bearish  BLUE    .024    .164     .188
---------------------------------------------------------------------------------------------
UUP       25.2  -.03         25.17        -5.9%      -------  ----   -.219   -.014    -.233
---------------------------------------------------------------------------------------------
CORN      25.2  -.03         25.17        -5.9%      Bearish  ----   -.304    .26     -.044
---------------------------------------------------------------------------------------------
YINN      10.43  -.26        11.09        -194.7%    Bearish  RED     .004   -.119    -.115
---------------------------------------------------------------------------------------------
RSX       32.29  -.07        31.77         37.5%     Bullish  RED     .193    .078     .271
|
 Table 2   Count of Stocks in Key Directories
           20211109
-------------------------------
NEWHIGHS       369
NEWLOWS        102
MAXCP          25
MINCP          48
TTTNH          17
TTTNL          32
CPCROSSA       64
CPCROSSD       75
ACCUMVER       220
HIGHIP21       34
HIUPPCT        26
REDSELL        125
AUGSELS7       56
TRAPDOOR       23
|
 Table 3      RANKING OF KEY DIRECTORIES BASED PCT.OF STOCKS ABOVE 65-DMA
              11/9/21
 Bullish = 41
 Bearish = 6
---------------------------------------------------------------------------------------
Directory     Current       day-1         day-2         day-3         day-4         day-5
----------------------------------------------------------------------------------------
TRANSP         1             1             .95           .75           .8            .65
REGBANKS       .96           .96           .96           .92           .96           .92
JETS           .923          1             .923          .384          .461          .23
GOLD           .891          .826          .826          .652          .586          .608
HOMEBLDG       .882          .882          .882          .764          .705          .47
SOLAR          .875          .937          .875          .875          .875          .875
RETAIL         .851          .829          .872          .851          .829          .617
REIT           .838          .861          .892          .753          .853          .753
CHEM           .826          .804          .804          .673          .782          .717
GREEN          .8            .8            .85           .85           .85           .85
INSURANC       .8            .88           .88           .76           .88           .92
OILGAS         .792          .801          .764          .735          .792          .783
NIFTY          .787          .808          .787          .765          .68           .659
INDMATER       .777          .763          .708          .611          .68           .625
FINANCE        .775          .787          .775          .75           .8            .787
SEMI           .773          .783          .783          .773          .762          .69
MILITARY       .769          .73           .73           .461          .576          .5
HIGHPRIC       .768          .764          .721          .739          .764          .717
INDEXES        .766          .755          .76           .706          .755          .684
INFRA          .757          .787          .696          .575          .666          .606
FOOD           .755          .775          .755          .755          .632          .755
ELECTRON       .731          .746          .731          .731          .708          .649
RUS-1000       .723          .733          .737          .667          .702          .641
HACKERS        .722          .722          .722          .722          .666          .722
BIGBANKS       .714          .714          .714          .714          .857          .857
SP500          .705          .709          .707          .658          .691          .63
AUTO           .702          .756          .783          .729          .756          .729
SOFTWARE       .696          .75           .696          .642          .625          .66
FIDSTKS        .692          .721          .698          .633          .668          .609
NASD-100       .69           .721          .711          .701          .711          .618
GAMING         .684          .789          .736          .631          .736          .684
COMODITY       .675          .7            .7            .65           .575          .7
COAL           .666          .666          .666          .666          .833          .833
DOWJONES       .666          .733          .7            .6            .666          .6
               -----
SP-100         .666          .7            .688          .622          .666          .644
ETFS           .66           .696          .607          .571          .589          .535
COMPUTER       .65           .7            .65           .65           .75           .75
BEVERAGE       .642          .571          .642          .642          .571          .571
DJI-13         .615          .692          .692          .538          .692          .615
GUNS           .615          .538          .615          .461          .615          .538
BONDFUND       .511          .42           .306          .17           .136          .102
----------------------------------------------------------------------------------------
COPPER         .5            .625          .5            .25           .5            .5
MARIJUAN       .5            .666          .333          .333          .5            .166
-----------------------------------------------------------------------------------------
HOSPITAL       .47           .529          .47           .352          .47           .176
BIOTECH        .441          .468          .463          .482          .52           .465
CHINA          .431          .411          .352          .392          .392          .372
LOWPRICE       .421          .429          .401          .381          .414          .396
UTILITY        .368          .368          .526          .394          .473          .447
EDU            .333          .333          .333          .333          .333          .333
|
=====================================================================================
=====================================================================================
Written 11-9- 5:58 AM DJI -69 NASDAQ + 25
| |
The DJI and the NASDAQ
are both trying to get past the resistance at
the top of their price channels. With short-term interest rates back down
to a mere 0.35% and the trend of the main ETFs Closing Powers still
up as measured by their 21-day ma and their 10-day ma, I think we should give
the leading and highest Power Ranked markets and ETFs more chance to rise
further.
Our DJI and DIA Accumulation-Indexes (IP21) are far above zero. That and the
good breadth and flat-top breakouts nullify the Sell S12.
SOXL's streak of rising Closing Power up-days is remarkable. SOXL
is quite volatile. We will have to take short term profits if it should produce a
big "red popsicle" on its Candle-Stick charts.
The steepest Closing Power trends could be broken tomorrow. This
would likely lead to the Closing Powers to drop back to their 10-day ma.
Unless you are very nimble, a two or three day decline is apt to make
you lose your long position prematurely. Other than with SOXL, stick with your long
positions. You may want to buy on successful Closing Power tests of the
Closing Power 10-day ma.
The FED wants the market to go still higher. They dare not
raise rates. |
|
Charts and Tables
11/08/2021
2021 PEERLESS DJI, Signals,
Indicators Daily DJI Volume 10-DayUp/Down Vol Stoch-20
Inverted Traders Index
Graph of Pct of All Stocks above
65-dma Cum. Inverted
Traders Index
DJI-IPA DJI-OBV
NASDAQ S&P OEX NYSE COMPQX DJI-15 DJI-20 DJI-30
DIA QQQ SPY IWM TNA Short-Term Rates DOLLAR-UUP ALLSTOCKs
recent 2006 vers-Peerless signals
http://tigersoftware.com/NEWPEER/UPD71108.BMP
MDY - http://www.tigersoftware.com/CHARTZ/MDY.GIF
USO-CrudeOil DBO FAS GLD BBH IBB JETS JNUG KOL NUGT OIH PALL RSX RETL
SDS AGQ SLV SOXL TAN TECL TLT TMF TNA UGA (gasoline) USO (oil) and China: YINN CHAU
Commodities: CANE
CORN DBC JJC, NIB CORN, CUT (paper)
MOO, SOYB WEAT UUP (Dollar) LIT
(Lithium)
STOCKS:
MRNA DIS GE PYPL GME ZOM XLE NRGU
AAPL ADBE ALXN AMAT AMGN AMD AMZN AXP BA BABA BAC BIDU BLDP CAT CRM CVX
CMG DE ENPH FB GILD GOOG GS HD IBM INTU JPM LRCX M MRK MSFT NEM NFLX
NKE NVDA PG PYPL REGN REV SO SQ QCOM QDEL TSLA TXN XOM V VRTX WFC WMT ZM
Bullish MAXCPs
http://tigersoftware.com/UPPER/11-8/BULLISH.htm
Bearish MAXCPs
http://tigersoftware.com/DOWNER/11--8/BEARISH.htm
 |
 |
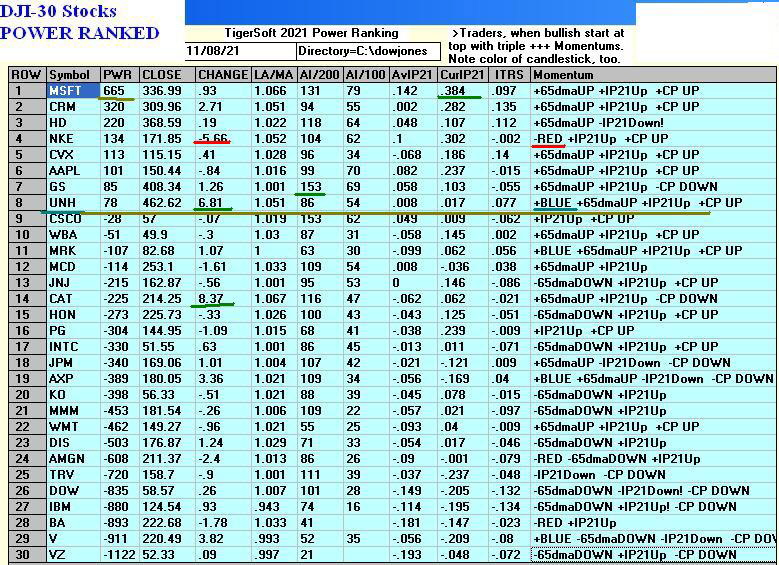 |
 |
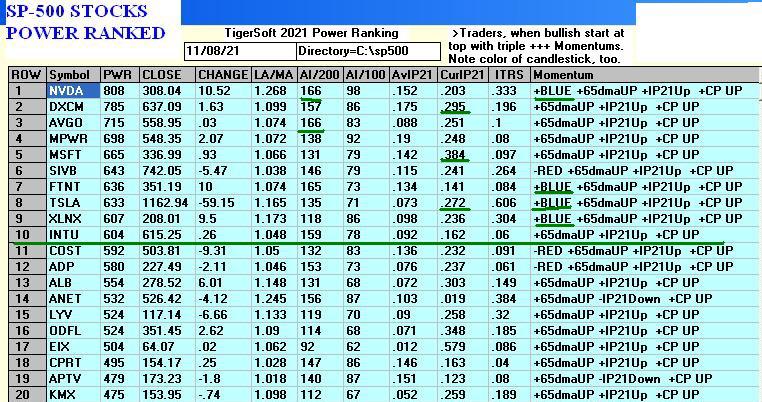 |
 |
 |
 |
 |
Table 1 QUICKSILVER on ETFS - 11/08/21
   Bullish = 6 - DIA, SPY, QQQ, SOXL, TECL, RSX
   Bearish = 0
ETF       CLOSE   CHANGE    PIVOT-PT    5-dma AROC   CL-PWR   CANDLE   IP21   ITRS   POWER INDEX
---------------------------------------------------------------------------------------------
DIA       364.32   1.02      360.57        71.8%     -------  RED     .254    0        .254
---------------------------------------------------------------------------------------------
SPY       468.93   .4        461.9         95.7%     Bullish  RED     .325    .014     .339
---------------------------------------------------------------------------------------------
QQQ       398.06  -.54       389.05        135.1%    Bullish  RED     .282    .031     .313
---------------------------------------------------------------------------------------------
MDY       529.85   .29       520.77        96%       Bullish  RED     .136    .022     .158
---------------------------------------------------------------------------------------------
IWM       242.56   .75       234.45        181.1%    Bullish  RED     .112    .044     .156
---------------------------------------------------------------------------------------------
FAS       145.13   1.79      146.8         8.9%      Bearish  RED     .056    .097     .153
---------------------------------------------------------------------------------------------
RETL      52.32  -.28        45.7          758.6%    Bullish  RED     .126    .12      .246
---------------------------------------------------------------------------------------------
SOXL      63.54   2.63       51.82         1232.6%   Bullish  BLUE    .299    .316     .615
---------------------------------------------------------------------------------------------
TECL      79.83   1.37       72.72         588.9%    Bullish  BLUE    .334    .159     .493
---------------------------------------------------------------------------------------------
IBB       157.63   .69       162.67       -123.8%    Bearish  BLUE    .093   -.11     -.017
---------------------------------------------------------------------------------------------
GLD       170.45   .61       167.16        87.4%     Bullish  ----    .171   -.026     .145
---------------------------------------------------------------------------------------------
OIH       220.05   3.72      215.49        75.2%     Bearish  BLUE   -.076    .123     .047
---------------------------------------------------------------------------------------------
UUP       25.23  -.05        25.23         11.9%     Bullish  ----   -.094   -.014    -.108
---------------------------------------------------------------------------------------------
CORN      25.23  -.05        25.23         11.9%     Bearish  ----   -.249    .26      .011
---------------------------------------------------------------------------------------------
YINN      10.69   .31        10.85        -504.2%     Bearish  BLUE   -.016  -.095    -.111
---------------------------------------------------------------------------------------------
RSX       32.36   .43        32.05         6.3%     Bullish  BLUE     .172    .084     .256
|
  Table 2   Count of Stocks in Key Directories
            20211108
-------------------------------
NEWHIGHS       601
NEWLOWS        76
MAXCP          33
MINCP          43
TTTNH          24
TTTNL          23
CPCROSSA       56
CPCROSSD       107
ACCUMVER       219
HIGHIP21       23
HIUPPCT        26
REDSELL        134
AUGSELS7       65
TRAPDOOR       22
|
Table 3 RANKING OF KEY DIRECTORIES BASED PCT.OF STOCKS ABOVE 65-DMA
11/8/21
Bullish = 43
Bearish = 6
---------------------------------------------------------------------------------------
Directory     Current       day-1         day-2         day-3         day-4         day-5
----------------------------------------------------------------------------------------
JETS           1             .923          .384          .461          .23           .153
TRANSP         1             .95           .75           .8            .65           .65
REGBANKS       .96           .96           .92           .96           .92           .96
SOLAR          .937          .875          .875          .875          .875          .937
HOMEBLDG       .882          .882          .764          .705          .47           .588
INSURANC       .88           .88           .76           .88           .92           .88
REIT           .861          .884          .746          .846          .746          .792
RETAIL         .829          .872          .851          .829          .617          .51
GOLD           .826          .826          .652          .586          .608          .717
NIFTY          .808          .787          .765          .702          .659          .659
CHEM           .804          .804          .673          .782          .717          .695
OILGAS         .801          .764          .735          .792          .783          .83
GREEN          .8            .85           .85           .85           .85           .85
FINANCE        .79           .777          .753          .802          .79           .79
GAMING         .789          .736          .631          .736          .684          .842
INFRA          .787          .696          .575          .666          .606          .727
SEMI           .783          .783          .773          .762          .69           .69
FOOD           .775          .755          .755          .632          .755          .775
HIGHPRIC       .764          .721          .739          .764          .721          .71
INDMATER       .763          .708          .611          .68           .625          .652
AUTO           .756          .783          .729          .756          .729          .756
INDEXES        .755          .76           .706          .755          .684          .706
SOFTWARE       .75           .696          .642          .625          .66           .678
ELECTRON       .746          .731          .731          .708          .649          .634
DOWJONES       .733          .7            .6            .666          .6            .533
RUS-1000       .733          .737          .667          .702          .641          .648
MILITARY       .73           .73           .461          .576          .5            .461
HACKERS        .722          .722          .722          .666          .722          .722
FIDSTKS        .721          .698          .633          .668          .609          .591
NASD-100       .721          .711          .701          .711          .618          .597
BIGBANKS       .714          .714          .714          .857          .857          .857
SP500          .709          .707          .658          .691          .632          .624
COMODITY       .7            .7            .65           .575          .7            .7
COMPUTER       .7            .65           .65           .75           .75           .65
SP-100         .7            .688          .622          .666          .644          .588
ETFS           .696          .607          .571          .589          .535          .642
DJI-13         .692          .692          .538          .692          .615          .615
COAL           .666          .666          .666          .833          .833          .833
MARIJUAN       .666          .333          .333          .5            .166          .333
COPPER         .625          .5            .25           .5            .5            .5
BEVERAGE       .571          .642          .642          .571          .571          .571
GUNS           .538          .615          .461          .615          .538          .461
HOSPITAL       .529          .47           .352          .47           .176          .4
=========================================================================================
BIOTECH        .468          .463          .482          .52           .463          .452
LOWPRICE       .434          .398          .383          .414          .401          .414
BONDFUND       .42           .306          .17           .136          .102          .113
CHINA          .411          .352          .392          .392          .372          .568
UTILITY        .368          .526          .394          .473          .447          .447
EDU            .333          .333          .333          .333          .333          .5
|
====================================================================================
---TigerSoft HOTLINE --- Written
11/8/2021
Preface: The Power of The Fed...
It has been a mistake since late March 2020 to underestimate the
power of
the Federal Reserve to not just support the markets, but to make
bonds, blue
chips and the biggest ETFs rise steadily. The FEDs' allies in this endeavor are the
Professionals who trade for the big banks using nearly free money from the FED.
Clearly, these traders get advance information from FED officials to tip them off
about the FED's intentions. Only this explains how aggressive their buy programs
have been. There is no point in fighting them or calling their advantages
"unfair"
or "illegal". Washington is to afraid of their inedpendence and power.
So, take advantage
of our special Peerless signals under QE-Infinity and use our TigerSoft Closing Power.
Very few scholars and writers have broached this subject. But for those who want
to read about the issue of the FED and Insider Trading, I suggest:
https://www.economicliberties.us/our-work/new-money-trust/#
I managed to wipe out the last few days of Hotlines a minute ago. There may not
be
a backup.
Sorry,
The basic idea today was the
same as on Friday morning, to let the major
ETFs run and breakout more as long as interest rates do not go up much
and the Closing Powers for DIA, NASDAQ, QQQ, SPY, TECL and SOXL
abide by their steep uptrends.
.
The FED dares not raise rates. A speculative bubble is emerging because
of the FED's policy of "trickle down" and lowering rates with the DJI at
new highs. Channel breakout and flat-top breakouts will become more
common as will more and more money going into smaller companies' stocks.
Note flat-top breakouts in IWM, MDY and TNA. FAS is lagging. It is more likely
to consolidate than reverse downward....
Charts and Tables
DJI trying to get past top of its price channel
 |
 |
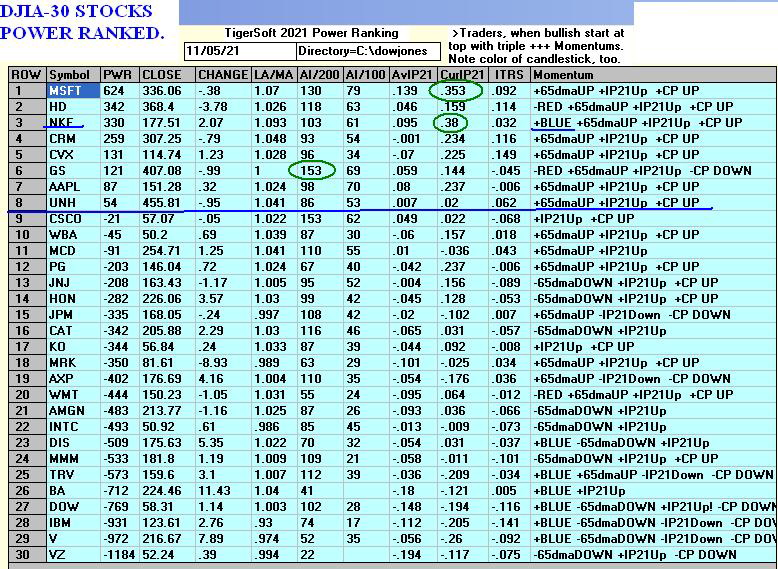 |
 |
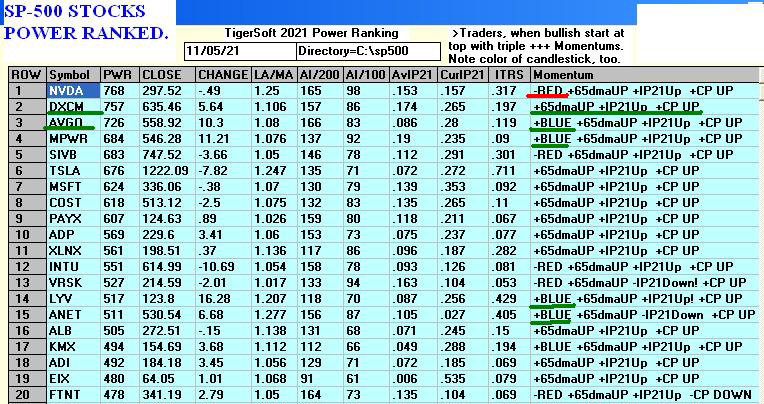 |
 |
 |
 |
 |
 |
 |
 |
 |
Table 2 QUICKSILVER on ETFS - 11/05/21
   Bullish = 7 - DIA, SPY, QQQ, RETL, SOXL, TECL, RSX
   Bearish = 0
ETF       CLOSE   CHANGE    PIVOT-PT    5-dma AROC   CL-PWR   CANDLE   IP21   ITRS   POWER INDEX
---------------------------------------------------------------------------------------------
DIA       363.3   1.95       359.13        70.4%     -------  BLUE    .259    0        .259
---------------------------------------------------------------------------------------------
SPY       468.53   1.62      460.04        100.3%    Bullish  RED     .302    .018     .32
---------------------------------------------------------------------------------------------
QQQ       398.6   .38        387.43        159.8%    Bullish  RED     .257    .039     .296
---------------------------------------------------------------------------------------------
MDY       529.56   4.66      519.78        196.3%    Bullish  BLUE    .124    .038     .162
---------------------------------------------------------------------------------------------
IWM       241.81   3.26      233.96        293.1%    Bullish  BLUE    .112    .067     .179
---------------------------------------------------------------------------------------------
FAS       143.34   .15       144.87       -47%       -------  RED     .105    .121     .226
---------------------------------------------------------------------------------------------
RETL      52.6   1.59        44.88         1122.9%   Bullish  ----    .115    .146     .261
---------------------------------------------------------------------------------------------
SOXL      60.91   1.83       49.96         1264.4%   Bullish  BLUE    .261    .332     .593
---------------------------------------------------------------------------------------------
TECL      78.46   1.06       71.03         505.2%    Bullish  RED     .299    .167     .466
---------------------------------------------------------------------------------------------
IBB       156.94  -4.89      161.63       -82%       Bearish  RED     .054   -.116    -.062
---------------------------------------------------------------------------------------------
GLD       169.84   2.19      167.52        95.5%     Bullish  BLUE    .103   -.019     .084
---------------------------------------------------------------------------------------------
OIH       216.33   2.41      216.81        142.1%    Bearish  RED    -.052    .161     .109
---------------------------------------------------------------------------------------------
UUP       25.28  -.02        25.17         5.9%      Bullish  ----   -.079   -.02     -.099
---------------------------------------------------------------------------------------------
CORN      25.28  -.02        25.17         5.9%      Bearish  ----   -.234    .259     .025
---------------------------------------------------------------------------------------------
YINN      10.38  -.54        11.8         -371.4%    Bearish  RED    -.023   -.105    -.128
---------------------------------------------------------------------------------------------
RSX       31.93   .18        32.32        -10.9%     Bullish  ----    .163    .087     .25
|
 Table 2   Count of Stocks in Key Directories
           20211105
-------------------------------
NEWHIGHS       735
NEWLOWS        112
MAXCP          62
MINCP          43
TTTNH          34
TTTNL          42
CPCROSSA       85
CPCROSSD       91
ACCUMVER       216
HIGHIP21       21
HIUPPCT        21
REDSELL        138
AUGSELS7       57
TRAPDOOR       22
|
Table 3      RANKING OF KEY DIRECTORIES BASED PCT.OF STOCKS ABOVE 65-DMA
              11/5/21
 Bullish = 41
 Bearish = 7
---------------------------------------------------------------------------------------
Directory     Current       day-1         day-2         day-3         day-4         day-5
----------------------------------------------------------------------------------------
REGBANKS       .96           .92           .96           .92           .96           .88
TRANSP         .95           .75           .8            .65           .65           .55
JETS           .923          .384          .461          .23           .153          .153
REIT           .884          .738          .846          .746          .815          .615
HOMEBLDG       .882          .764          .705          .47           .588          .529
INSURANC       .88           .76           .88           .92           .88           .8
SOLAR          .875          .875          .875          .875          .937          .875
RETAIL         .872          .851          .829          .617          .51           .468
GREEN          .85           .85           .85           .85           .85           .65
GOLD           .826          .652          .586          .608          .717          .63
CHEM           .804          .673          .782          .717          .695          .63
AUTO           .789          .736          .763          .736          .763          .657
NIFTY          .787          .765          .702          .659          .638          .659
SEMI           .783          .773          .762          .69           .69           .556
FINANCE        .777          .753          .802          .79           .802          .79
OILGAS         .764          .735          .792          .783          .83           .754
INDEXES        .76           .706          .755          .684          .706          .657
RUS-1000       .737          .667          .702          .641          .65           .572
                ^^^^
GAMING         .736          .631          .736          .684          .842          .631
FOOD           .734          .755          .632          .755          .775          .734
ELECTRON       .731          .731          .708          .649          .634          .5
MILITARY       .73           .461          .576          .5            .461          .423
HACKERS        .722          .722          .666          .722          .722          .722
HIGHPRIC       .721          .739          .764          .721          .717          .663
BIGBANKS       .714          .714          .857          .857          .857          .857
NASD-100       .711          .701          .711          .618          .597          .567
               ^^^^^
INDMATER       .708          .611          .68           .625          .652          .638
SP500          .707          .658          .691          .632          .622          .589
COMODITY       .7            .65           .575          .7            .7            .7
DOWJONES       .7            .6            .666          .6            .533          .566
               ^^^^^
FIDSTKS        .698          .633          .668          .609          .597          .573
INFRA          .696          .575          .666          .606          .727          .636
SOFTWARE       .696          .642          .625          .66           .678          .607
DJI-13         .692          .538          .692          .615          .615          .615
SP-100         .688          .622          .666          .644          .588          .611
               ^^^^
COAL           .666          .666          .833          .833          .833          .833
COMPUTER       .65           .65           .75           .75           .65           .65
BEVERAGE       .642          .642          .571          .571          .571          .5
GUNS           .615          .461          .615          .538          .461          .461
ETFS           .607          .571          .589          .535          .642          .482
UTILITY        .526          .394          .473          .447          .447          .394
-------------------------------------------------------------------------------------------
COPPER         .5            .25           .5            .5            .5            .5
-------------------------------------------------------------------------------------------
HOSPITAL       .47           .352          .47           .176          .411          .294
BIOTECH        .463          .482          .52           .463          .449          .354
LOWPRICE       .398          .378          .411          .398          .409          .351
CHINA          .352          .392          .392          .372          .568          .411
EDU            .333          .333          .333          .333          .5            .333
MARIJUAN       .333          .333          .5            .166          .333          .166
BONDFUND       .306          .17           .136          .102          .113          .09
|
| |
| |
| |
| |
====================================================================================
Earlier Hotlines:
www.tigersoftware.com/1247/INDEX.htm
www.tigersoftware.com/1247HL/OLDINDEX.htm
www.tigersoftware.com/1492THL/INDEX.htm
www.tigersoftware.com/212THEN/INDEX.htm
www.tigersoft.com/711THL/INDEX.htm
www.tigersoft.com/1919H/OLDINDEX.htm
2020
www.tigersoft.com/777BLM/INDEX.htm
www.tigersoft.com/20HLM/INDEX.htm
www.tigersoft.com/2020NIGHT/INDEX.htm
www.tigersoft.com/4ACES1/INDEX.htm
www.tigersoft.com/48HLA/INDEX.htm
www.tigersoft.com/QUICKER/INDEX.htm
www.tigersoft.com/QUICK/INDEX.htm
www.tigersoft.com/77HLZ/INDEX.htm
www.tigersoft.com/44THL/INDEX.htm
www.tigersoft.com/21PEY3/INDEX-2.htm
www.tigersoft.com/19HLK5/INDEX.htm
www.tigersoft.com/44UHL/INDEX.htm
www.tigersoft.com/NHLP/INDEX.htm
www.tigersoft.com/7LHL/INDEX.htm
www.tigersoft.com/NHL718/INDEX.htm
www.tigersoft.com/21MAY18/INDEX.htm
www.tigersoft.com/55HEP/INDEX.htm
www.tigersoft.com/44H4L/INDEX2.htm
==============================================================================
HELP
INDICATORS' DEFINITIONS and
EXPLANATIONS
A Guide
To Profitably Using The Tiger Nightly HOTLINE
Introduction to Tiger/Peerless Buys and
Sells.
Peerless Buy and
Sell Signals: 1928-2016
Individual Peerless signals explained:
http://tigersoftware.com/PeerlessStudies/Signals-Res/index.htm
http://www.tigersoft.com/PeerInst-2012-2013/
Explanation of each Peerless signal. http://www.tigersoft.com/PeerInst-2012-2013/
Different
Types of TigerSoft/Peerless CHARTS, Signals and Indicators
-----> More HELP
LINKS
Documentation for TigerSoft
Automatic and Optimized Signals.
How reliable support is the
DJI's rising 200-day ma?
SPY Charts since 1994:
Advisory Closing Power S7s, Accum. Index, 65-dma, Optimized Signals.
^^^^^^^^^^^^^^^^^^^^^^^^^^^^^^^^^^^^^^^^^^^^^^^^
1/19/2016 ---> Corrections,Deeper
Declines and Bear Markets since 1945.
1/21/2016 ---> High
Velocity Declines since 1929
2/12/2016 --->
Presidential
Elections Years and Bullish IP21 Positive Non-Confirmations at Lower Band.
2/12/2016
---> OBV
NNCs on DJI's Rally to 2.7% Upper Band when DJI's 65-dma is falling.
11/6/2016 --->
Killer Short Selling
Techniques:
TigerSoft
"Combination" Short-Selling... Easy as 1-2-3 Short Sales
Earlier Q-Answers
QuickSilver Documentation (1/11/2016)
Our Different Signals
Better understand the difference between
Peerless DJI-based signals,
the one-year optiized red Signals and the fixed signals based on technical developments.
Introduction to Tiger/Peerless Buys and Sells.
Different Types of
TigerSoft/Peerless CHARTS, Signals and Indicators
================================================================
10-29-2021
The operative Peerless Sell S12 is not holding the
DJI back much. Still,
the DJI has not broken out clearly above it recent highs, but its internals
have turned positive and the SPY and QQQ look stronger with their
Closing Powers and Accumulation Index both in rising trends. My suggestion
is to be short DIA only if one is long either some of the highest Accumulation
Bullish MAXCPs or one is also long QQQ or SPY. Seasonality becomes
very bullish in two weeks. The Bullish MAXCPs and Bearish MINCPS
are in two different worlds. One can make money long the first group
and/or money short the second group. Breadth - the A/D Line needs to
improve. But Professionals are happy being long SPY and QQQ. They
have gotten no advance word from the FED that rates are going back
up significantly. It does not appear that liberals in Congress have the power
to raise taxes on the super-wealthy or to get passed a big Public Works
program. This pleases Wall Street.
 |
 |
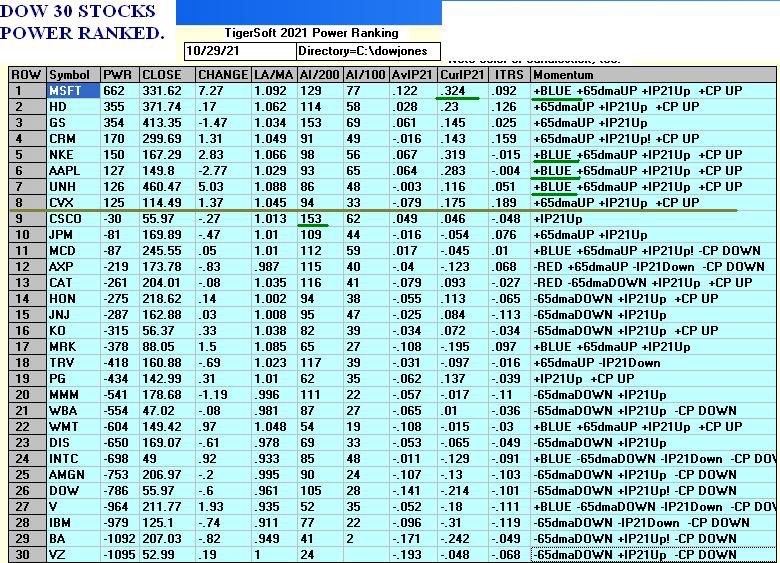 |
 |
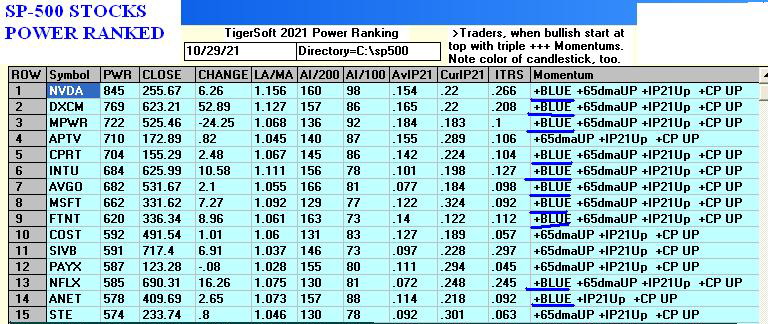 |
 |
 |
 |
 |
 |
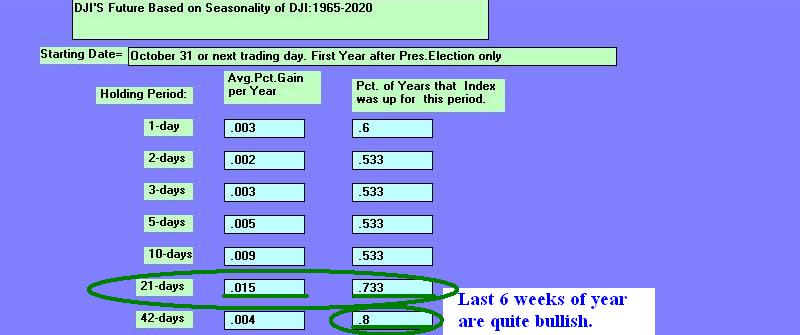 |
 |
 |
 |
Table 2 QUICKSILVER on ETFS - 10/29/22
  6  Bullish  FAS, SOXL, OIH, CORN, RSX, TECL
  0  Bearish
ETF       CLOSE   CHANGE    PIVOT-PT    5-dma AROC   CL-PWR   CANDLE   IP21   ITRS   POWER INDEX
===================================================================================================
---------------------------------------------------------------------------------------------
DIA       358.23   .93       357.55        20.9%     Bullish  BLUE    .201    0        =====
---------------------------------------------------------------------------------------------
SPY       459.25   .93       455.55        67.3%     Bullish  BLUE    .222    .019     .241
---------------------------------------------------------------------------------------------
QQQ       386.11   1.89      377.93        158.4%    Bullish  BLUE    .174    .036     .21
---------------------------------------------------------------------------------------------
MDY       509.14   .27       512.19       -3.6%      Bullish  BLUE    .079    .031     .11
---------------------------------------------------------------------------------------------
IWM       228.05  -.06       229.57        14.1%     Bullish  BLUE    .051    .051     .102
---------------------------------------------------------------------------------------------
FAS       144.71  -1.78      147.5        -88.3%     Bullish  RED     .128    .242     .37
---------------------------------------------------------------------------------------------
RETL      42.06   .92        44.48        -41.9%     Bearish  BLUE    .001    0        .001
---------------------------------------------------------------------------------------------
SOXL      47.65   .65        45.06         399.7%    Bullish  BLUE    .073    .177     .25
---------------------------------------------------------------------------------------------
TECL      71.06   .97        67.82         289.9%    Bullish  BLUE    .176    .117     .293
---------------------------------------------------------------------------------------------
IBB       159.6  -.59        160.24        36.4%     Bearish  RED    -.143   -.056    -.199
---------------------------------------------------------------------------------------------
GLD       166.65  -1.43      168.93       -33.3%     -------  BLUE    .113   -.025     .088
--------------------------------------------------------------------------------------------
OIH       210.24  -6.77      224.88       -262.7%    -------  RED    -.001    .229     .228
---------------------------------------------------------------------------------------------
CPER     26.84  -.26         27.7         -126.2%    Bearish  RED    -.232    .061    -.171
---------------------------------------------------------------------------------------------
UUP       25.25   .2         25.16         25.8%     Bullish  BLUE    .166   -.021     .145
---------------------------------------------------------------------------------------------
CORN      25.25   3.88       20.5          1162.3%   Bearish  BLUE    .279    .24      .519
---------------------------------------------------------------------------------------------
YINN      11.21  -.67        12.97        -664.8%    Bullish  RED     .098    .03      .128
---------------------------------------------------------------------------------------------
RSX       32  -.67           33.34        -101.9%    Bullish  ----    .212    .094     .306
|
 Table 3     Count of Stocks in Key Directories
             20211029
--------- ----------------------
NEWHIGHS       347
NEWLOWS        133
MAXCP          52
MINCP          95  Bearish
TTTNH          29
TTTNL          44
CPCROSSA       93
CPCROSSD       58
ACCUMVER       209
HIGHIP21       20
HIUPPCT        22
REDSELL        140
AUGSELS7       22
TRAPDOOR       10
|
 RANKING OF KEY DIRECTORIES BASED PCT.OF STOCKS ABOVE 65-DMA
              10/29/21
 Bullish = 33
 Bearish = 13
---------------------------------------------------------------------------------------
Directory     Current       day-1         day-2         day-3         day-4         day-5
----------------------------------------------------------------------------------------
REGBANKS       .88           .88           .76           .96           .96           .96
SOLAR          .875          .937          .812          .875          .875          .812
BIGBANKS       .857          .857          .857          .857          1             1
COAL           .833          .833          .833          .833          .833          .833
INSURANC       .8            .84           .72           .84           .84           .84
FINANCE        .79           .777          .79           .876          .913          .901
OILGAS         .764          .82           .792          .839          .849          .83
FOOD           .734          .775          .775          .795          .755          .734
HACKERS        .722          .611          .611          .666          .722          .666
COMODITY       .7            .7            .7            .725          .7            .675
HIGHPRIC       .663          .67           .626          .692          .695          .677
NIFTY          .659          .68           .617          .659          .659          .68
COMPUTER       .65           .65           .45           .45           .6            .55
GREEN          .65           .65           .55           .7            .75           .75
AUTO           .648          .675          .513          .594          .648          .648
INDEXES        .646          .679          .603          .695          .706          .69
INDMATER       .638          .652          .583          .68           .708          .611
INFRA          .636          .606          .454          .575          .575          .424
GAMING         .631          .631          .578          .684          .631          .526
CHEM           .63           .652          .543          .673          .652          .608
GOLD           .63           .782          .826          .847          .891          .782
DJI-13         .615          .615          .538          .461          .461          .461
SP-100         .611          .566          .577          .588          .588          .588
REIT           .61           .687          .687          .778          .809          .786
SOFTWARE       .607          .607          .571          .625          .66           .607
SP500          .595          .616          .561          .624          .636          .634
FIDSTKS        .579          .585          .55           .609          .591          .591
RUS-1000       .575          .598          .541          .622          .638          .633
NASD-100       .567          .536          .494          .515          .556          .556
DOWJONES       .566          .533          .5            .5            .5            .5
               +++++
TRANSP         .55           .65           .55           .7            .65           .65
SEMI           .546          .608          .432          .494          .546          .484
HOMEBLDG       .529          .529          .411          .529          .588          .47
=============================================================================================
BEVERAGE       .5            .5            .285          .285          .428          .357
COPPER         .5            .5            .5            .625          .625          .625
ETFS           .5            .678          .625          .678          .642          .66
=============================================================================================
ELECTRON       .492          .544          .41           .47           .522          .462
RETAIL         .468          .446          .404          .446          .51           .446
GUNS           .461          .384          .076          .538          .615          .461
CHINA          .431          .549          .49           .607          .686          .647
MILITARY       .423          .423          .346          .538          .576          .576
UTILITY        .421          .421          .342          .447          .394          .447
BIOTECH        .354          .346          .283          .335          .332          .321
LOWPRICE       .353          .381          .34           .393          .381          .33
EDU            .333          .333          .166          .5            .5            .333
HOSPITAL       .294          .352          .176          .117          .117          .235
MARIJUAN       .166          .166          .166          .333          .333          .333
JETS           .153          .23           .076          .307          .23           .307
BONDFUND       .09           .068          .079          .068          .068          .068
|
====================================================================
10-28-2021
Congress is stalemated.
Technicals and Professionals
are in control...
The operative Peerless signal is a Sell S12.
This has
brought a recommendation here to sell short DIA and
to sell long positions if their Closing Power uptrends are
violated. The FED is showing no inclination to raise or lower
short-term interest rates, so the market will probably subside
in here because the general economy is weakening compared
to earlier expectations and because Congress is not providing
new stimulae and might even consider biting the hand that feeds
and controls it. Wall Street much prefers no new wealth surtax
to help paying for badly needed infrastructure. In this
environment, technicals reign supreme and the short-term play
now should be to sell at horizontal resistance and cover at
horizontal support.
The weakness in Visa ( V ) is troubling. Note its completed head
and head and shoulders pattern. Without new Government
stimulus, it is vital that consumer spending hold up. The
average American consumer is tapped out at the same time
his rent, food and gasoline keeps rising. The little guy may
have to sell some of his stocks (his savings). Soon the FED
may have to drop short-term rates again, thus using up its
precious ammunition for holding the market up when there
is a much bigger decline.
Definitely, stay hedged. The bearish MINCP lists have
been
weak for some time. The Bearish stocks in these lists sag and sag.
On the upside, the best long plays would seem to be
(1) commodities, (thus showing that Inflation is here to stay,
and (2) FAS for short-term trades on each dip when Professionals
turn up the FAS Closing Power.
|
Table 2 ETFS
Table 2 QUICKSILVER on ETFS - 10/28/22
  4  Bullish  FAS, SOXL, OIH, CORN
  1  Bearish  IBB
ETF       CLOSE   CHANGE    PIVOT-PT    5-dma AROC   CL-PWR   CANDLE   IP21   ITRS   POWER INDEX
===================================================================================================
DIA       357.3   2.32       356.74        18.8%     -------  BLUE    .081    ----     ----
---------------------------------------------------------------------------------------------
SPY       458.32   4.38      453.12        52%       Bullish  BLUE    .095    .023     .118
---------------------------------------------------------------------------------------------
QQQ       384.22   4.22      374.1         92%       Bullish  BLUE    .083    .04      .123
---------------------------------------------------------------------------------------------
MDY       508.87   7.91      509.51        .7%       Bullish  BLUE    .009    .026     .035
---------------------------------------------------------------------------------------------
IWM       228.11   4.46      227.41        3.5%      Bearish  BLUE   -.021    .043     .022
---------------------------------------------------------------------------------------------
FAS       146.49   5.91      147.29        131.8%    Bullish  BLUE    .082    .23      .312
---------------------------------------------------------------------------------------------
RETL      41.14   2.11       42.41        -233.5%    Bearish  BLUE   -.212   -.018    -.23
---------------------------------------------------------------------------------------------
SOXL      47   2.91          44.05         157.5%    Bullish  BLUE   -.023    .195     .172
---------------------------------------------------------------------------------------------
TECL      70.09   2          67.1          168.8%    Bullish  BLUE    .092    .139     .231
---------------------------------------------------------------------------------------------
IBB       160.19   2.65      158.44        40.6%     Bearish  BLUE   -.235   -.069    -.304
---------------------------------------------------------------------------------------------
GLD       168.08  -.04       167.77        39.6%     -------  RED     .098   -.015     .083
---------------------------------------------------------------------------------------------
OIH       217.01   3.05      221.83       -99.1%     -------  BLUE    .04    .23       .27
---------------------------------------------------------------------------------------------
UUP       25.05  -.15        25.12        -23.8%     Bullish  RED     .145   -.02      .125
---------------------------------------------------------------------------------------------
CORN      25.05  -.15        20.5          1075.1%   Bearish  RED     .202    .235     .437
---------------------------------------------------------------------------------------------
YINN      11.88   .08        12.85        -375.3%    Bullish  BLUE    .094    .035     .129
---------------------------------------------------------------------------------------------
RSX       32.67   .13        32.67         30.5%     -------  BLUE    .148    .099     .247
|
| |
TABLE 2 - Count of Stocks in Various Categories
 Table 3   Count of Stocks in Key Directories
          20211028
-------------------------------
NEWHIGHS       290
NEWLOWS        146
MAXCP          29
MINCP          55
TTTNH          25
TTTNL          30
CPCROSSA       194
CPCROSSD       22
ACCUMVER       209
HIGHIP21       11
HIUPPCT        26
VHIP21         81
AUGSELS7       32
TRAPDOOR       11
|
TABLE 4 SECTORS' STOCKS OVER 65-DMA
Table 4  RANKING OF KEY DIRECTORIES BASED PCT.OF STOCKS ABOVE 65-DMA
             10/28/21
 BULLISH = 35
 BEARISH = 11
---------------------------------------------------------------------------------------
Directory     Current       day-1         day-2         day-3         day-4         day-5
----------------------------------------------------------------------------------------
SOLAR          .937          .812          .875          .875          .812          .875
BIGBANKS       .857          .857          .857          1             1             .714
REGBANKS       .846          .769          .961          .961          .961          .961
^^^^^^^^^
INSURANC       .84           .72           .84           .84           .84           .84
COAL           .833          .833          .833          .833          .833          .833
OILGAS         .82           .792          .839          .849          .83           .839
GOLD           .782          .826          .847          .891          .782          .717
FINANCE        .777          .79           .876          .913          .888          .864
FOOD           .775          .775          .795          .755          .734          .632
COMODITY       .7            .7            .725          .7            .675          .6
REIT           .687          .679          .778          .809          .786          .816
NIFTY          .68           .617          .659          .68           .659          .723
INDEXES        .679          .603          .695          .706          .701          .717
ETFS           .678          .625          .678          .642          .66           .642
AUTO           .675          .513          .594          .648          .648          .675
HIGHPRIC       .67           .626          .692          .695          .673          .688
CHEM           .652          .543          .673          .652          .63           .63
INDMATER       .652          .583          .68           .708          .611          .625
COMPUTER       .65           .45           .45           .6            .55           .5
GREEN          .65           .55           .7            .75           .75           .75
TRANSP         .65           .55           .7            .65           .65           .65
GAMING         .631          .578          .684          .631          .526          .578
SP500          .616          .561          .624          .636          .636          .609
DJI-13         .615          .538          .461          .461          .461          .538
HACKERS        .611          .611          .666          .722          .666          .777
SEMI           .608          .432          .494          .546          .484          .494
SOFTWARE       .607          .571          .625          .66           .625          .678
INFRA          .606          .454          .575          .575          .424          .424
RUS-1000       .598          .541          .622          .638          .632          .626
FIDSTKS        .585          .55           .609          .591          .591          .585
SP-100         .566          .577          .588          .588          .577          .588
CHINA          .549          .49           .607          .686          .647          .666
ELECTRON       .544          .41           .47           .522          .462          .477
NASD-100       .536          .494          .515          .556          .556          .577
DOWJONES       .533          .5            .5            .5            .466          .566
HOMEBLDG       .529          .411          .529          .588          .47           .588
===========================================================================================
BEVERAGE       .5            .285          .285          .428          .357          .357
COPPER         .5            .5            .625          .625          .625          .625
===========================================================================================
RETAIL         .446          .404          .446          .51           .446          .531
MILITARY       .423          .346          .538          .576          .576          .615
UTILITY        .421          .342          .447          .394          .447          .368
LOWPRICE       .385          .34           .395          .378          .333          .373
GUNS           .384          .076          .538          .615          .461          .538
HOSPITAL       .352          .176          .117          .117          .235          .235
BIOTECH        .346          .283          .335          .332          .318          .335
EDU            .333          .166          .5            .5            .333          .333
JETS           .23           .076          .307          .23           .307          .384
MARIJUAN       .166          .166          .333          .333          .333          .333
BONDFUND       .068          .079          .068          .068          .068          .068
^^^^^^^^
|
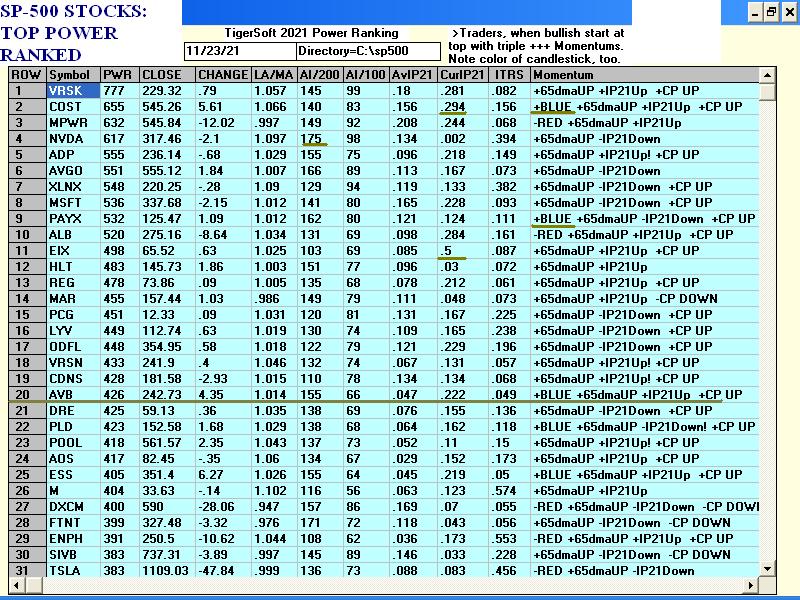
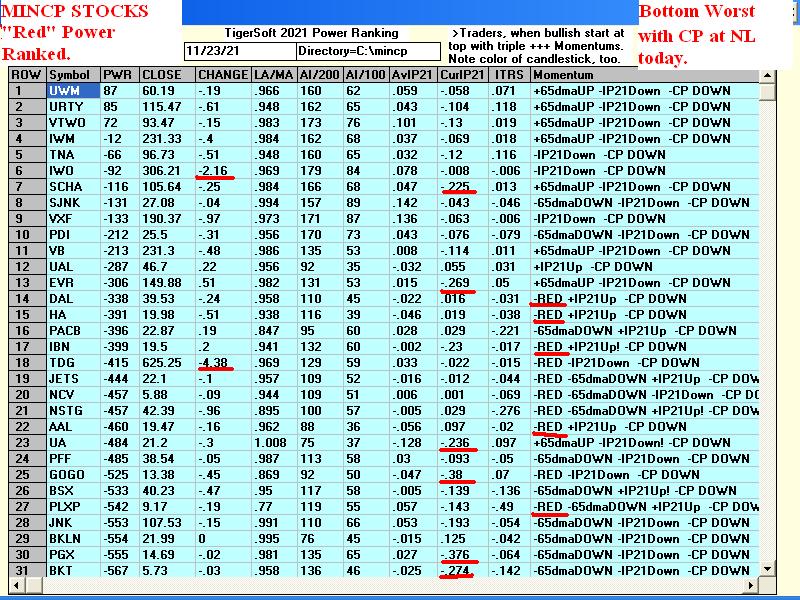


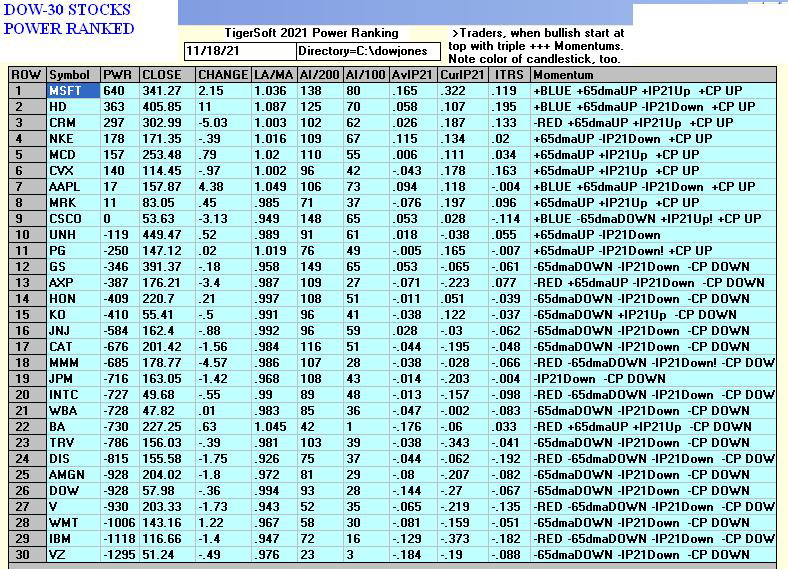

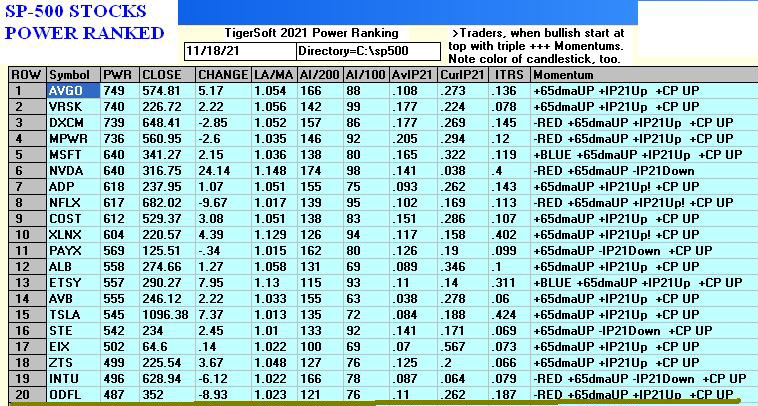


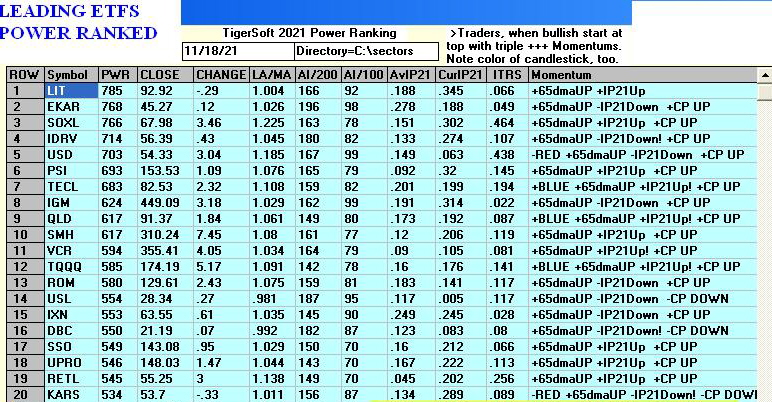


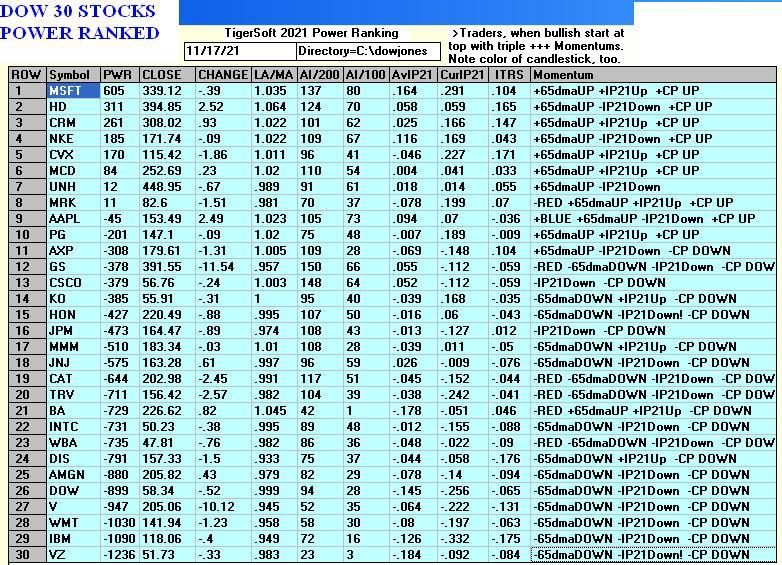


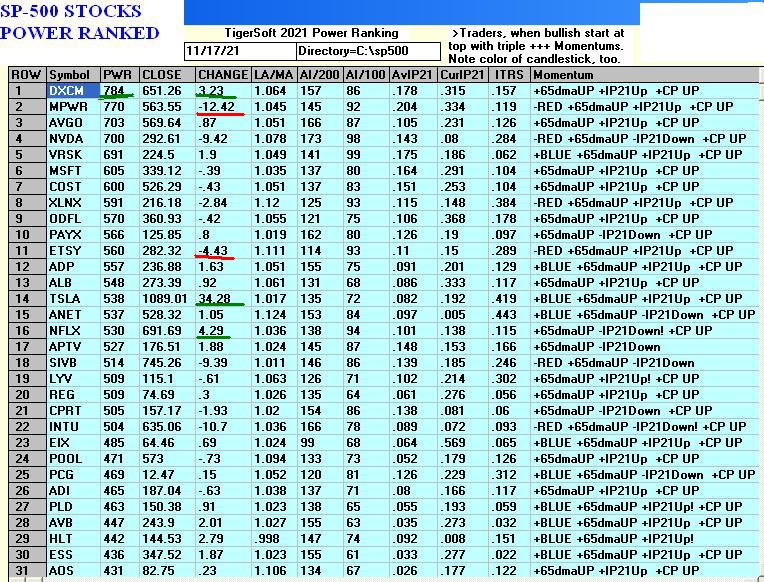


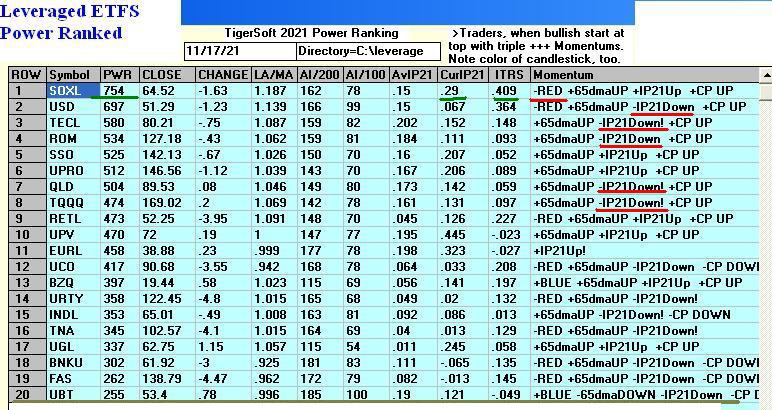


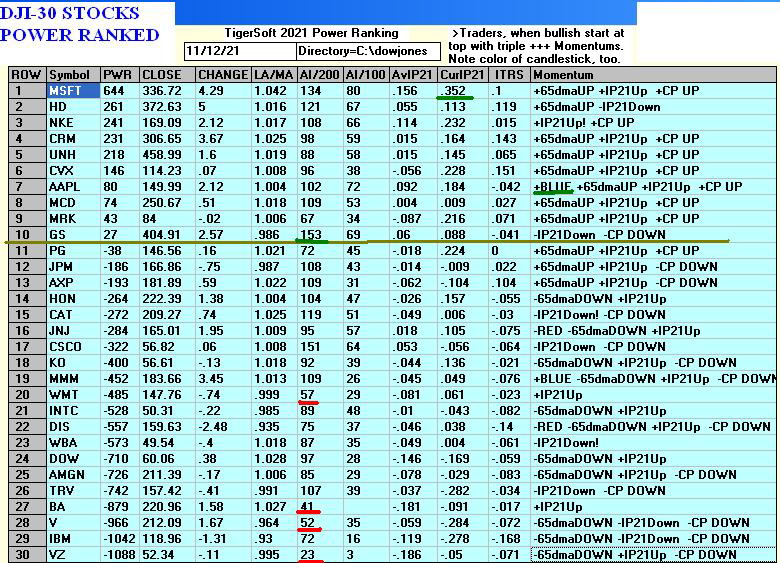

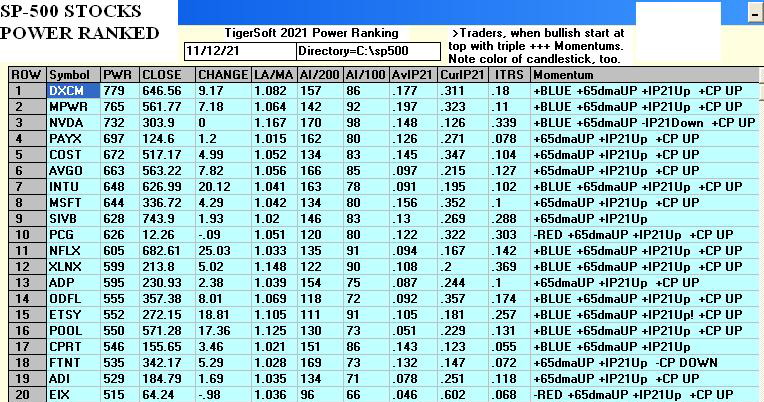


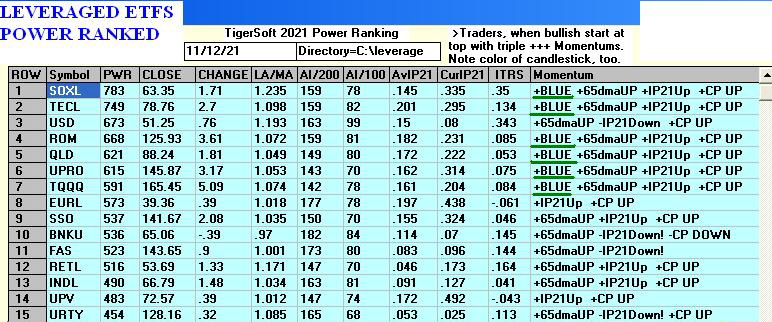


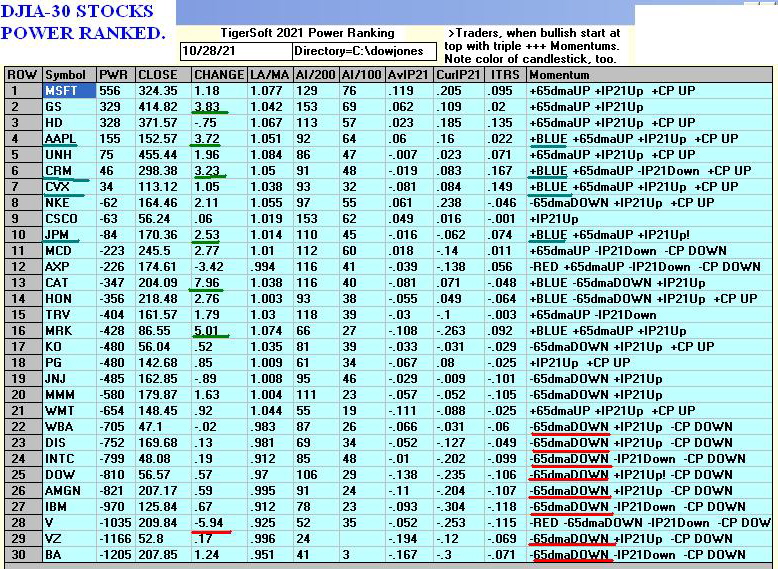
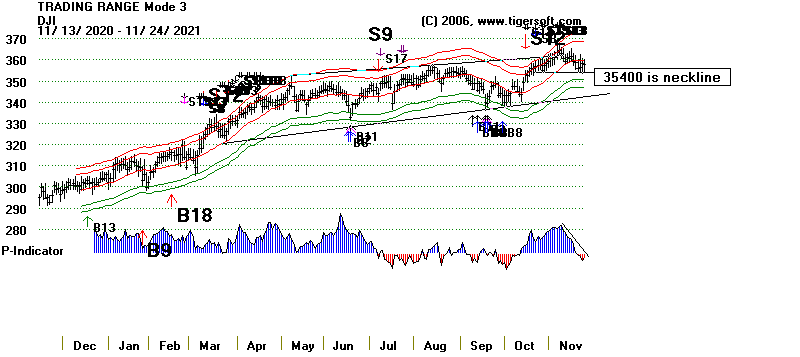
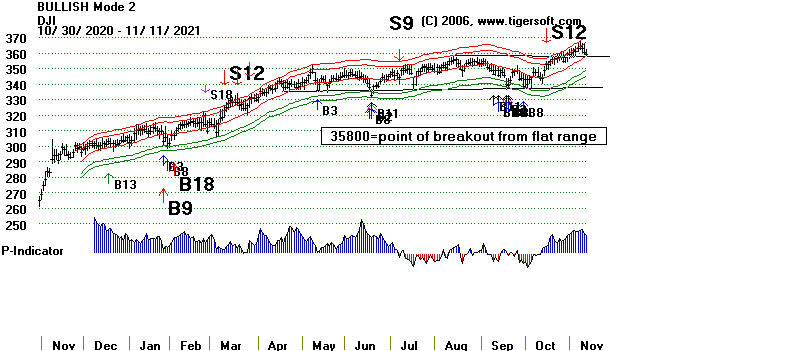
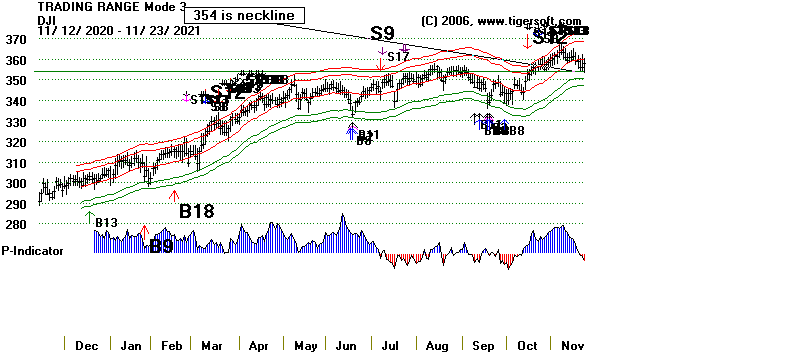
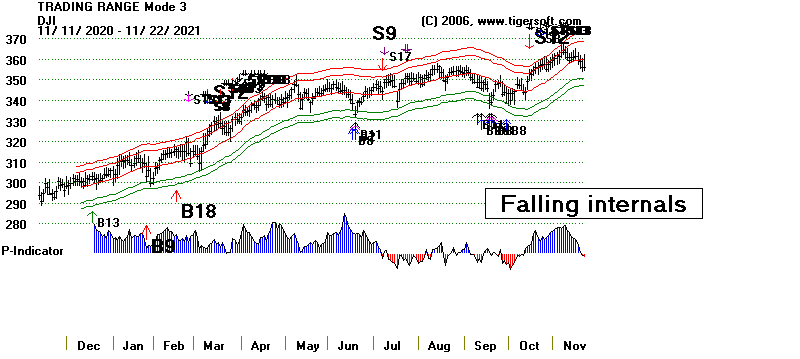
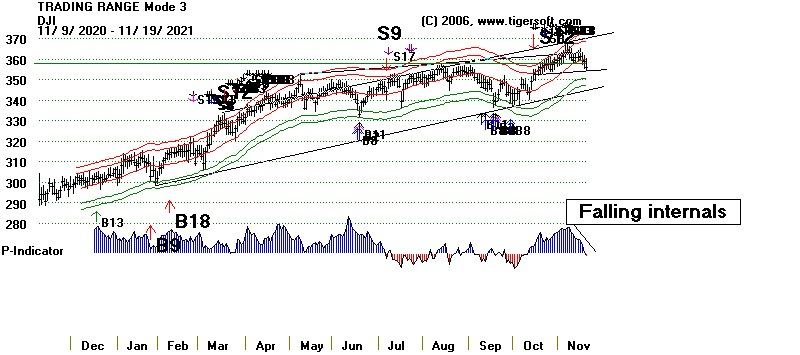
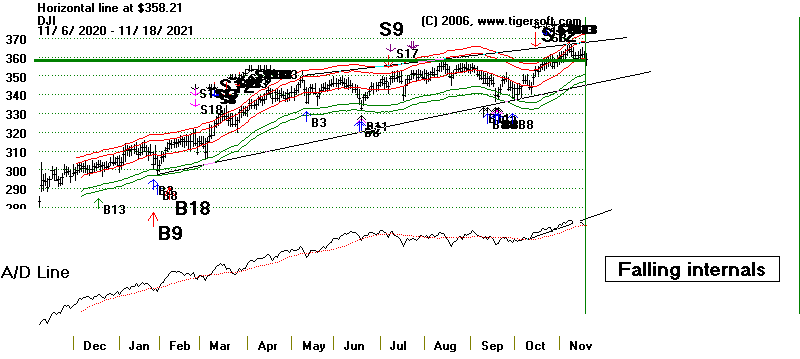
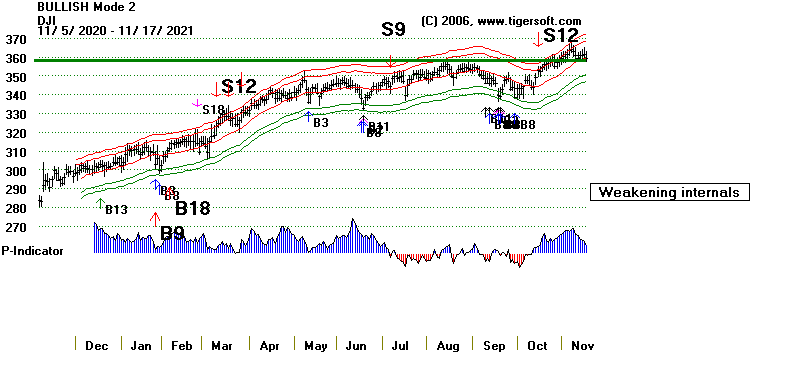
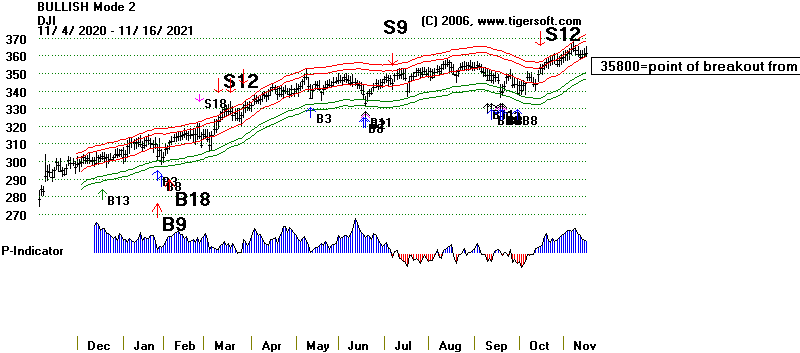
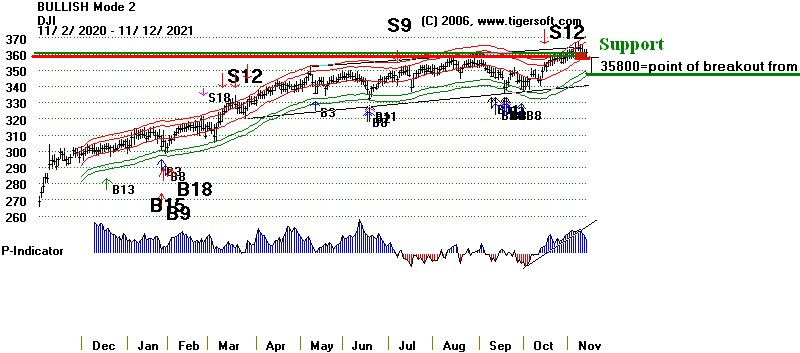
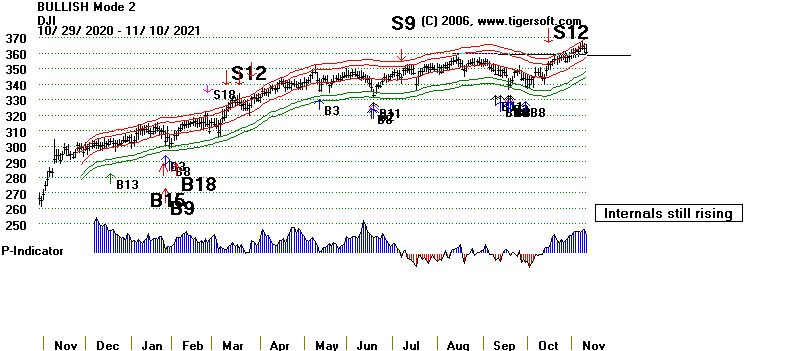
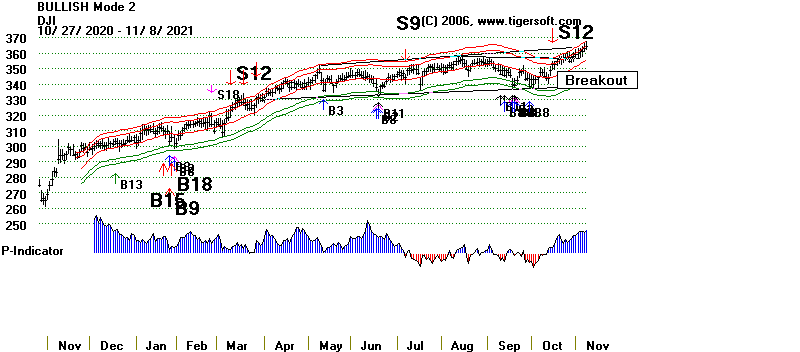
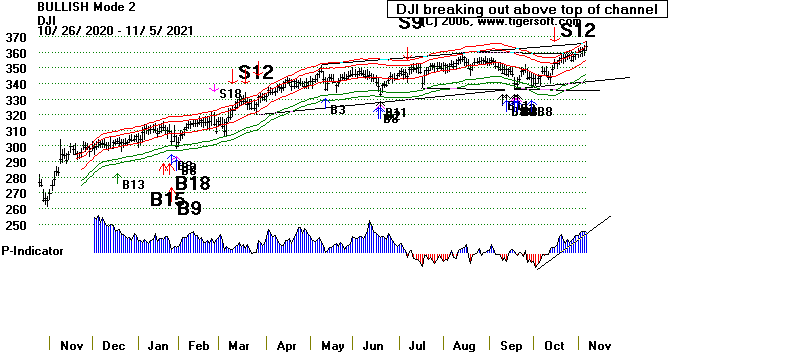
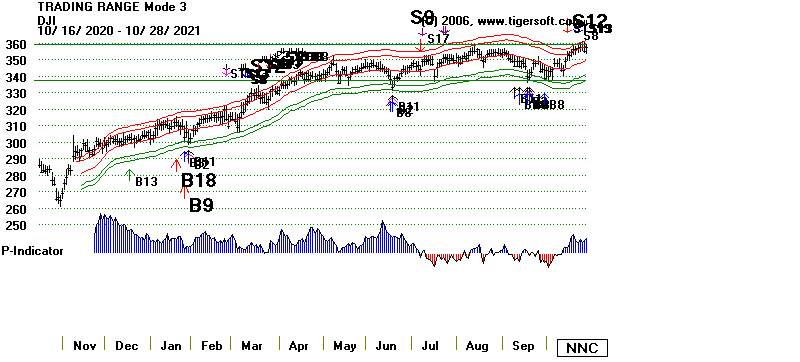