TigerSoft
News Service
10/12/2008
www.tigersoft.com
TigerSoft
News Service
10/12/2008
www.tigersoft.com The Causes of The Crash of 2008
How Close Are We To The Bottom? TigerSoft Predictions
Nouriel Roubini's Prescient Warnings and His Recommendations Now.
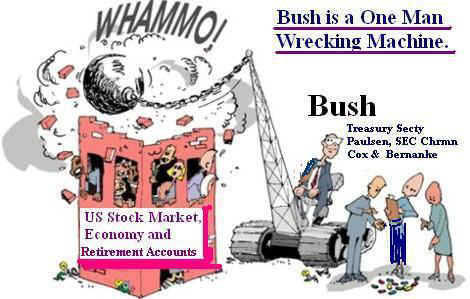
Bush Is A One-Man Wrecking Machine of Retirement Accounts
by William Schmidt, Ph.D.
 |
Tiger
Software
Research on Individual Stocks upon Request: Composite Seasonality Graph
|
| The Causes of The Crash of 2008 How Close Are We To The Bottom? Why Should Investors Trust Paulson? He Helped Make This Mess? He Long Denied There Was A Serious Problem. Nouriel Roubini's Prescient Warnings and His Recommendations Now. TigerSoft Predictions based on: Lowering of Interest Rates, "Partial Nationalization" Oversold Market, Bullish Seasonality. Technical Support. Soon The National Nightmare of Bush Will Be Over. by William Schmidt, Ph.D. Author of TigerSoft and Peerless Stock Market Timing: 1915-2008 and Nightly Hotline People work and save. And then it's taken away by unrepentant monsters like Bush and Cheney. Retirement accounts in the US are down $3 trillion dollars since Bush got Congress to give Wall Street bankers $700 Billion for their "toxic" (i.e. mostly worthless) mortgages. The US government is now building a system where profits are privatized and losses socialized. This is socialism for the rich. And the economic fix has not been found. A world-wide financial collapse and depression must be avoided. On Friday, Paulson changed his mind and now supports that cash infusion into distressed banks via a partial nationalization. The stress of the financial markets must be murderous for him to agree to this method of restoring confidence. Can backdoor socialism really be expected to curry favor on Wall Street? Will Paulson socialism stop the market collapse? 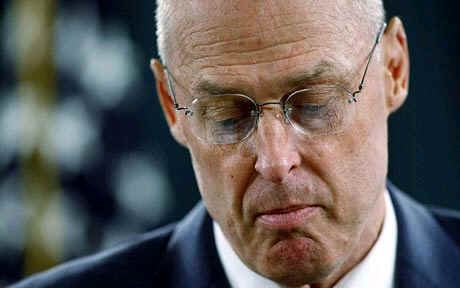 Treasury Secretary Hank Paulson is looking at buying shares directly in ailing banks and insurance companies. A month ago her resisted the idea of inserting such authority into his arsenal of weapons to stop the decline. Now he is interpreting the $700bn bailout law as giving him this authority. He is getting desperate. Even if he does this, banks would still be under no obligation to resume lending. Paulson is wants the same authority that the British government got this week. The US has already nationalized three of the biggest financial entities, AIG (insurance) and mortgage giants (Fannie Mae and Freddie Mac). Will a bank turn to the US Government if it might be nationalized? Will it choose to publicly admit that it needs a government injection of capital? That might cause a "run" on that bank. Or it might make investors relax, knowing that their company will not be seized by the FDIC. Why should the government not inject capital into, and partially nationalize General Motors or Ford, or any other company that is considered "too big to fail?". The complications, uncertainties and unknowns are not what the stock market wants? Once government takes a stake in a company, will it ever be the same? Will the government need to buy such a large stake that it will control the company? Why would investors want such an investment? However, might this not have to be the price to safeguard the rest of the capitalist system? Paulson seems ready to risk these uncertainties to save the entire system. Even if Paulson's partial nationalizations might be able to stem the selling of US equities, and it's not at all clear this approach will work, because banks are still not required to make loans, the financial problems overseas are getting much worse. Cassandra Noted NYU economist and economic Cassandra, Nouriel Roubini exactly predicted the present debacle two years ago. He now says there is the possibility of a global financial meltdown and depression cannot be ruled out. "There is now the beginning of a generalized run on the banking system of these economies, a collapse of the shadow banking system, i.e. those non-banks (broker dealers, non-bank mortgage lenders, SIV and conduits, hedge funds, money market funds, private equity firms." We have to respect this man. His predictions were very accurate. In September 2007, he predicted this disaster: a housing bust, an oil shock, vaporizing consumer confidence and buying power and a crippling world-wide financial collapse. "We have a subprime financial system, not a subprime mortgage market". The banks' very highly leveraged loans, he said, are extraordinarily dangerous. The crisis will inevitably shift to rising corporate defaults, possibly reaching 10%. Bailouts will be demanded by other industries. A number of hedge funds will fail. Margin calls will bring whole stock liquidation. We will enter a "vicious circle of losses, capital reduction, credit contraction, forced liquidation and fire sales of assets at below fundamental prices." This will lead to "a cascading and mounting cycle of losses and further credit contraction." Credit-deprived and illiquid, the stock market will price assets below underlying value. There will be a global financial meltdown. It will not produce a Great Depression, but it will be the longest and deepest recession since the 1930s. Source. And October 10, 2008 interview. "A vicious circle of de-leveraging, asset collapses, margin calls, cascading falls in asset prices well below falling fundamentals and panic is now underway." Source. What does this prescient economist want thew US Government to do? Mortgages must be reset so there will not be wholesale foreclosures. A massive public works program is needed. States and local governments must be given huge sums to rebuild the American infrastructure and provide jobs. Unemployment benefits must be raised dramatically. "It will take a significant change in leadership of economic policy and very radical, coordinated policy actions among all advanced and emerging market economies to avoid this economic and financial disaster. " His website posts these recommendations for the government
" - another rapid round of policy
rate cuts of the order of at least 150 basis
- a massive direct government fiscal stimulus packages that includes public works,
- a rapid resolution of the banking problems via triage, public re-capitalization of
- an agreement between lender and creditor countries running current account
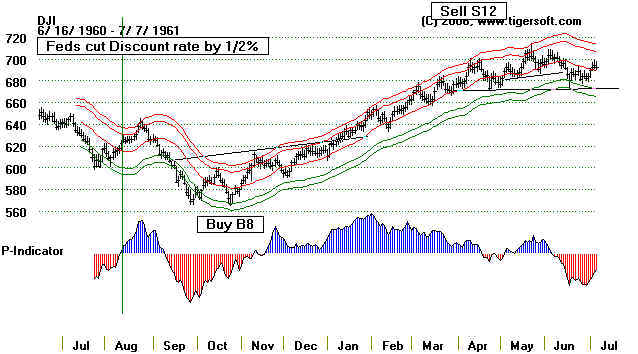
----------------------------------------- 1960 DJIA Chart
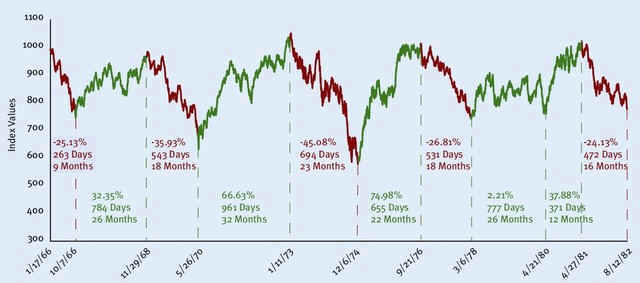
----------------------------------------------------  6. 7400 Is The Biggest Decline I Can Forsee If the 1929 crash is instructive and if we were to match that terrible period, then the free-fal now will still mercifully end soon and there will be a powerful stock market recovery. In 1929 the DJI fell 47.9% in its first free-fall, 381.20 to 198.70 (9/3/1929 to 11/13/1929). It then rallied back to 294.10 (4/17/1930). That was a rebound of 48.0%. The percentages were almost the same. If we take the DJI's high in July 2007 at 14165 as comparable to the 1929 peak, the DJI will find a bottom at 7383.50. Right now, as I write, the DJI is at 8028, down -550. There will be a big rally soon. Even if the DJI were to have to fall 47.9% to 7384, the 1929-1930 experience suggests a recovery up to to 10928, almost 3000 points above where we are now. By this reasoning, 8000 has to be very close to a bottom and is now a good buying opportunity, especially if we look out to when there will be a recovery, as a new President seeks to inspire confidence and not fear. Bush Is A One-Man Wrecking Machine However, until January 2009, the crooks and criminals are still in charge of the country. It would be a mistake to think that they cannot hurt the US and most Americans more. Look closely at the charts below. If we measure "oversold" by the how far down the DJI is from the 50-day ma, we see the DJI is not down as much as it was in 1929. Of course, we hope policy-makers are smarter than Hoover's "experts" were in 1929, when one of them predicted a "permanent plateau of prosperity". But Bush has an astonishing ability to go from new lows to deeper new lows of cronyism and corruption. The chart of the 1929 Crash has another worrisome element. When downside volatility becomes as great as it is now, reversal days are less reliable. Look at how many days when the DJI closed up off the day lows and then still fell much more. Today's "reversal day" is not enough by itself to safely signify a market bottom. If you like these comments, and you think they will help you, subscribe to out Hotline and get our Peerless Stock Market Timing. TigerSoft Hotline. Peerless Stock Market Timing. You will also want to use our TigerSoft program to see how misleading strong openings are in a bear market. It is much better to trust our Closing Power. Below is the NASDAQ-100 chart. The trends of TigerSoft's Closing Power will keep you out of the market when it is unsafe and in when it is safe. Buying and holding is a mistake, in my opinion. The period 1929-1943 shows this. See this chart at bottom of this page. The DJI did not surpass its 1929 peak until 1954. The war and inflation years, 1966-1982, saw the DJI repeatedly bounced down and up repeatedly between 1000 and as low as 580. Buying and holding in this period was also a mistake. More effort is required. With our software, you can not just survive. You can thrive. Go to www.tigersoft.com for more details. NASDAQ-100 BUYS and SELLs using TigerSoft 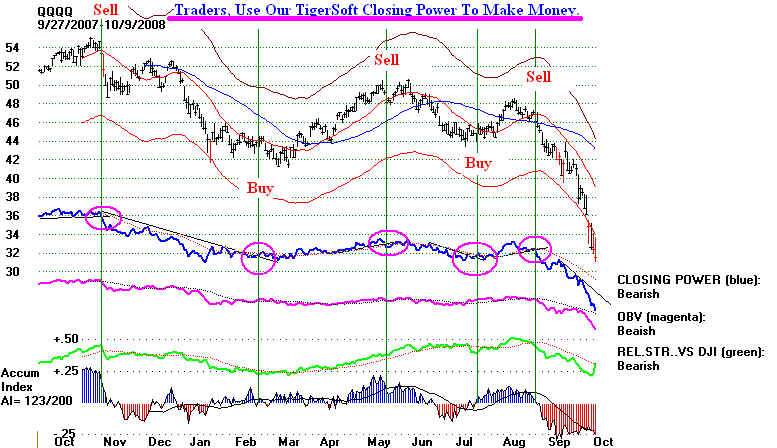 |
|
| DJIA 1926-1942 - Buying and holding in this period was a losing proposition. Note 50% recovery after October 1929 crash. Note the 50% recovery from 1932 to 1937 of what was lost between 1929 and 1932. 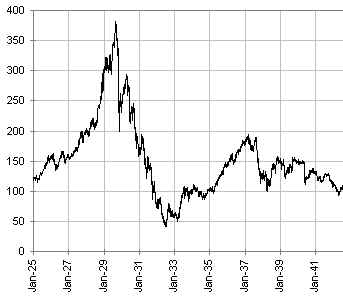
---------------------------------- DJI - 1966 to 1982 ---------------------------------------------------------------- Peaks Jan 1966
Dec 1968
Jan 1973
Dec
1976
Apr 1981 |
|
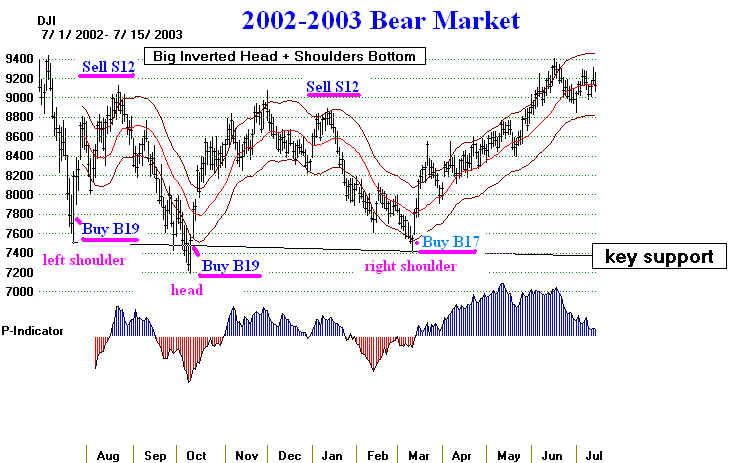
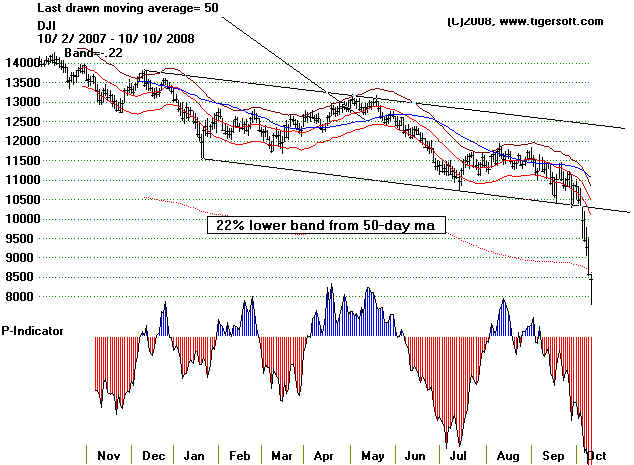
------------------------------ DJI 2008
---------------------------- |
|
| Why It's So Hard To Have Confidence in Wall Street. Sources - http://www.marketoracle.co.uk/Article6512.html “Golden parachutes are here to stay” “…those hoping for an end to golden parachutes - the large pay packages that top executives get when they leave a company - may end up disappointed.” "We're not abrogating contracts," said a Treasury official who briefed reporters Sunday.” “Another Treasury official said that even future golden parachutes could be paid…” CNNMoney.com, 9-28-2008
|