NEW HOTLINE 2-23-2023 Tiger Software (C) 2023
.
http://www.tigersoftware.com/SAGE22/INDEX.htm
EMAIL us at either wm_tigersoft@yahoo.com or william_schmidt@hotmail.com
==============================================================
New Free Book - Trading SPY with Tigersoft: 1989-2023

http://tigersoftware.com/SPY-book/INDEX.htm
The charts' comments will be expanded more and more over the
next few weeks. I'm hoping that they will show how to use our most
important indicators in conjuntion with the Peerless signals and
the actions by the FED.

The Hotline will be moving to a new location on
Friday
morning.
Please look for the new address in your emails on Wednesday.
If you have changed your email address or do not get our email, please
let me know at william_schmidt@hotmail.com
The Hotline's price is now $480 for a year. To
renew
please send a check to William Schmidt, 5834 Kantor STREET,
San Diego, CA 92122. Visa or MC Credit Cards seem to be
working again. But checks are desired, please. The
banks are
declining too many cards even when the card numbers we enter are correct.
The Data Page for a year is now $240. The Hotline, Data Page and Software
updates are $695 for a year.
==============================================================
Previous Hotlines: www.tigersoftware.com/dante43/INDEX.htm
www.tigersoftware.com/5HLM/INDEX.htm
===================================================================================
Thursday. 2/23 6:12 AM PCT
Futures: DJI +120 NASDAQ +100 Data
Used 2-22-2023:
| |
2-22-2023:
|
|
| |
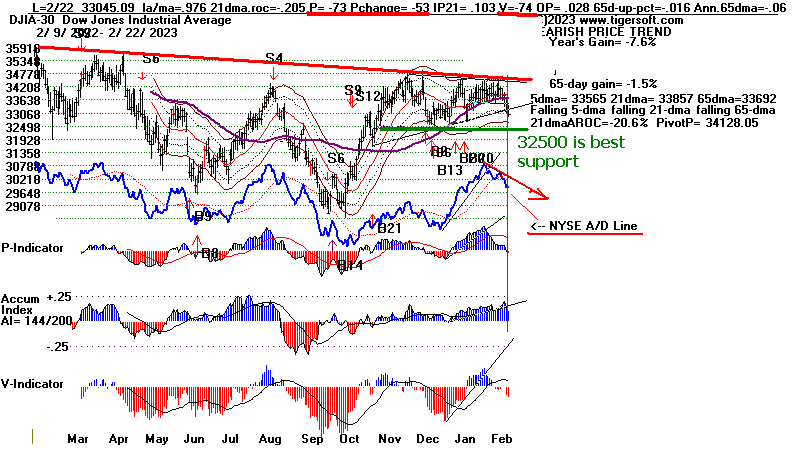
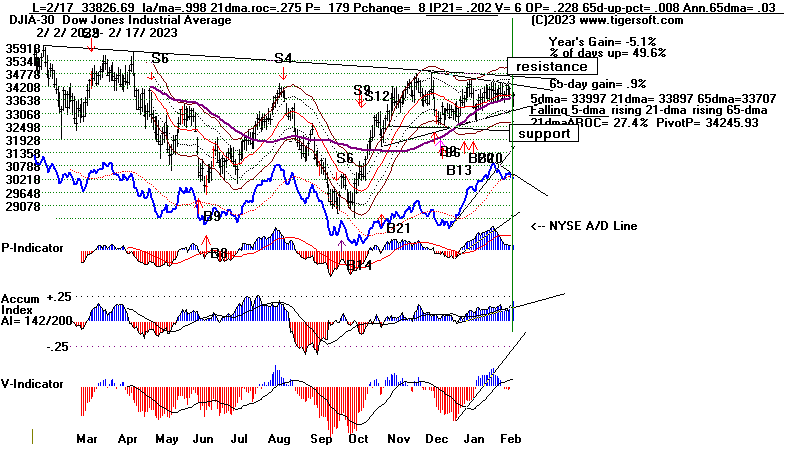
The 2007
version of Peerless gave a reliable Buy B8 based on the A/D Line failure
to confirms the DJI's new low
and the P-Indicator. But it also warns us to expect
overhead resistance if the
DJI has recently broken below well-defined support. That
tells us the next rally will
have a hard time getting past 33750, especially if up-volume
does not improve markedly.
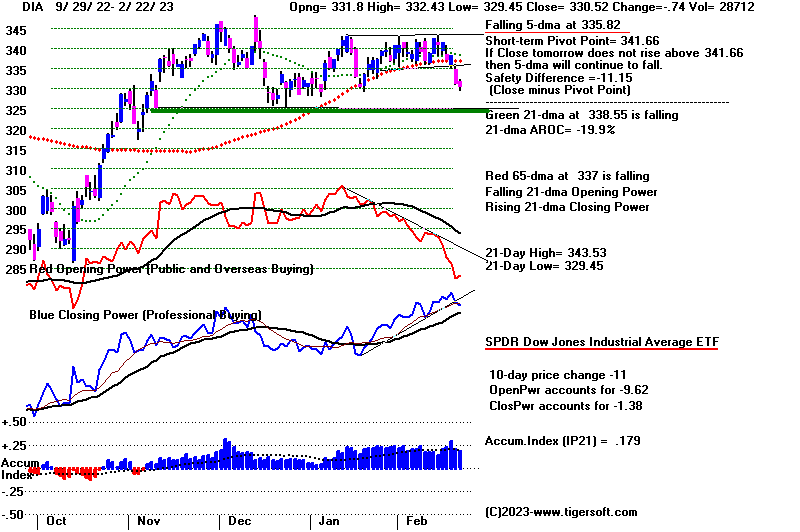
Today we did get optimized
red short-term Buys on SPY which will be trying to turn up
from its rising 65-dma.
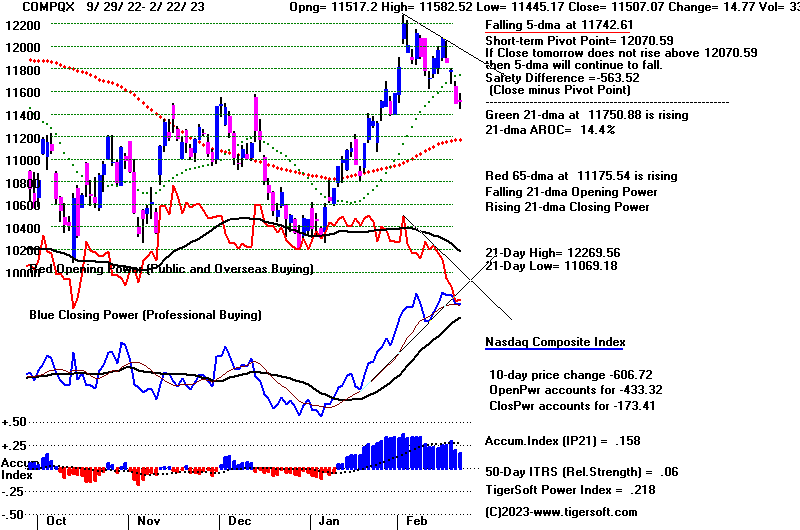
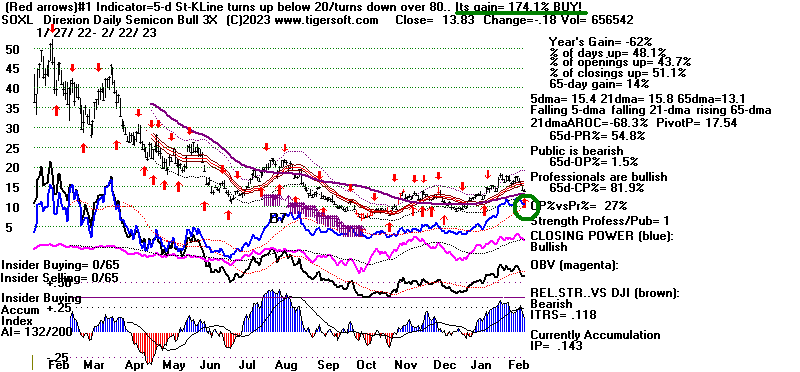
Look for SOXL (semi-condictors, 3x ETF) to try go back to its
recent highs near 19.
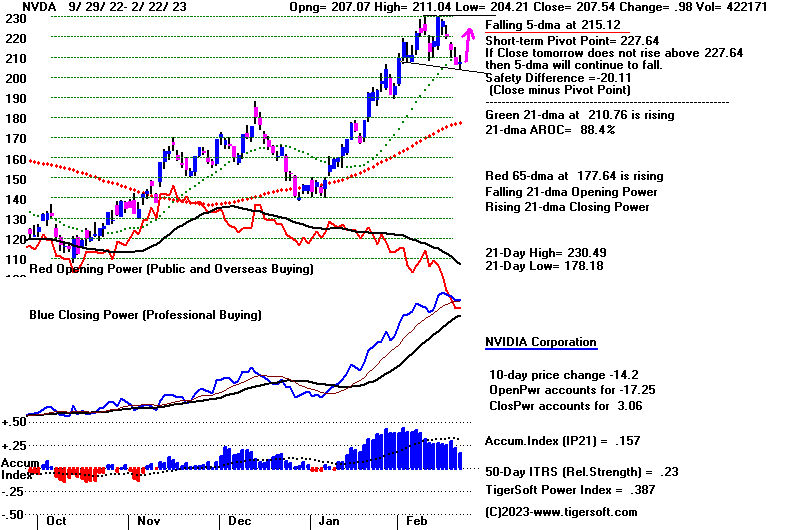
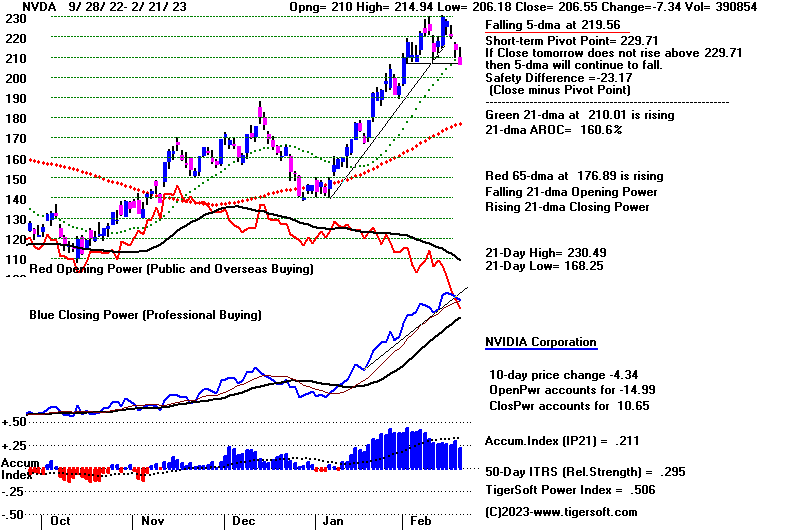
Buy SOXL. NVDA's earnings are good and are causing it to be
up 5% at this time.
SOXL has also just given a new red Buy. I would prefer to buy
SOXL. More than 70% of
our list of semi-conductors are still above their
65-dma, but less than 50% of
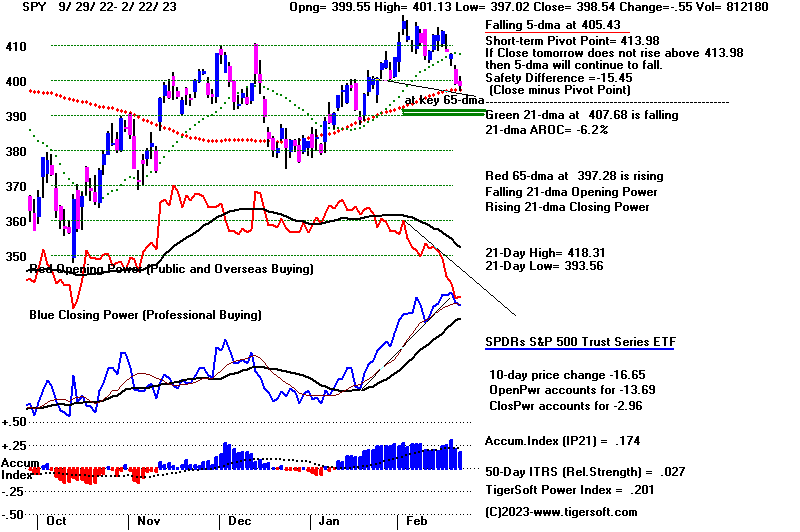
SPY's are.
The DJI has a number of weak
components. See below. Only 40% of its components
are above its 65-dma. I
would not buy it until it satisfactorily tests 32500. The high
Accumulation Index with the
DJI is a positive, but in half of the 4 previous cases of the
DJI's IP21 being above .13
and it being DJI 2.8% below the lower band, despite the
positive IP21, it falls
substantially more. (See 1946 and 2002).
Instead of the Day Traders' Tool,
I want to show divergences between Opening
and CLosing Power on our new initial TigerSoft chart.
We have been testing our Day
Traders' tool for the last week or so. See the SPY
book. It is a helpful
short-term tool, especially for day traders. But I think more
useful are comparisions of
the trends for a stock or ETF of the Opening and Closing
Powers. We will try to
add these to the bottom of our primary TigerSOft chart below
Relative Strength and
OBV. See below how bearish it is when the Opening Power
is rising and the Closing
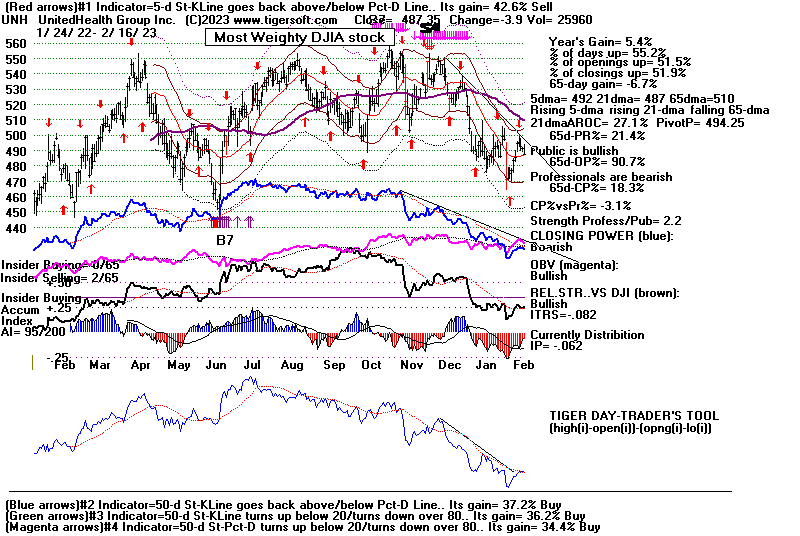
Power is falling. See UNH below and some of the Bearish
MINCPs tonight. A
new way to find these bearish divergences will have to be
programmed and the results
added to the Bearish MINCPs. |
|
| |
Charts - 2/22/2023
2022 PEERLESS DJI, Signals, Indicators Daily DJI Volume
10-DayUp/Down Vol Stoch-20 CCI RSI Pct of All Stocks above 65-dma
Inverted Traders Index
DJI-IPA DJI-OBV Short-Term Rates
NASDAQ S&P OEX NYSE DJ-15 DJ-20 DJI-30 Bond Funds
DIA QQQ SPY IWM new - COIN (Bit Coin ETF)
Gold Stocks
Semi Conductors
TNA Short-Term Rates Ten Year Rates PST (Short Treasuries)
DOLLAR-UUP
ALLSTOCKs
Russell-1000
Insurance-Stocks
Recent 2006 vers-Peerless signals
http://www.tigersoftware.com/OLDPEER/UPD90222.bmp
MDY - http://www.tigersoftware.com/CHARTX/MDY.GIF
USO-CrudeOil DBO FAS GLD HD IBB JETS JNUG KOL NAIL NUGT NRGU OIH
PALL RSX RETL SDS AGQ SLV SOXL TAN TECL TLT TMF TNA UGA USO
China:
YINN CHAU
Commodities: CANE
CORN DBC JJC, NIB CORN, CUT (paper)
MOO, NRGU
SOYB WEAT UUP (Dollar) LIT
(Lithium) PALL
(Palladium)
Stocks AA AAPL ADBE ALXN AMAT AMGN AMD AMZN AXP BA BABA
BAC BIDU BLDP CAT CHKP CNX CPB CRM CVX CMG DE DIS ENPH FB FSLR
FTNT GILD GME GOOG GS HD IBM INTU JPM KO KR LRCX MRK MRNA
MOS MSFT NEM NFLX NKE NOC NUE NVDA PANW PG PYPL REGN REV
SO QCOM QDEL TSLA TXN XOM V VRTX WFC WMT XLE ZM ZOM
Leveraged Short ETFs:
FAZ - financials, TZA and SRTY- small caps, MZZ - mid caps, TECS -Techs,
SOXS -
semi-conductors LABD
- Biotechs
Bullish MAXCPs
www.tigersoftware.com/UPPING/2-22-2023/Bullish.htm
Bearish MINCPs www.tigersoftware.com/Downing/2-22-2023/BEARISH.htm |
|
 |
 |
 |
 |
 |
 |
 |
 |
 |
 |
Table 1 - Daily Breadth and Volume Statistics
| NYSE |
Latest Close |
Previous
Close |
Week Ago |
| Issues
traded |
3,155 |
3,174 |
3,194 |
| Advances |
1,673 |
384 |
1,780 |
| Declines |
1,374 |
2,721 |
1,297 |
| Unchanged |
108 |
69 |
117 |
| New
highs |
32 |
38 |
83 |
| New
lows |
34 |
29 |
7 |
| Adv.
volume* |
451,243,655 |
116,316,598 |
516,972,109 |
| Decl.
volume* |
451,766,849 |
842,793,461 |
304,805,423 |
| Total
volume* |
912,520,292 |
966,100,118 |
831,716,755 |
| Closing
Arms (TRIN)† |
1.08 |
0.86 |
0.73 |
| Block
trades* |
4,263 |
4,583 |
4,473 |
| Adv.
volume |
2,141,010,353 |
574,942,182 |
2,625,091,245 |
| Decl.
volume |
1,891,970,859 |
3,509,647,483 |
1,404,290,655 |
| Total
volume |
4,079,327,971 |
4,121,592,279 |
4,075,983,812 |
| NASDAQ |
Latest Close |
Previous
Close |
Week Ago |
| Issues
traded |
4,752 |
4,762 |
4,797 |
| Advances |
2,164 |
880 |
2,870 |
| Declines |
2,348 |
3,715 |
1,676 |
| Unchanged |
240 |
167 |
251 |
| New
highs |
46 |
50 |
91 |
| New
lows |
122 |
130 |
63 |
| Closing
Arms (TRIN)† |
0.79 |
0.92 |
0.87 |
| Block
trades |
29,524 |
33,582 |
33,599 |
| Adv.
volume |
2,493,299,353 |
1,018,990,912 |
3,333,606,989 |
| Decl.
volume |
2,136,847,412 |
3,947,653,121 |
1,694,530,007 |
| Total
volume |
4,671,277,624 |
5,002,540,609 |
5,056,647,624 |
|
Table 2 QUICKSILVER on ETFS - 2/22/2023 ---
     Bullish = 4 -3           FAS , TECL  SOXL,   CPER
     Bearish = 0
ETF CLOSE CHANGE PIVOT-PT 5-dma AROC CL-PWR CANDLE IP21 ITRS POWER INDEX
================================================================================================
DIA 330.52 -.73 341.66 -157.1% Bullish RED .179 0 --------
---------------------------------------------------------------------------------------------
COMPQX 11507.07 14.77 12070.59 -191.4% Bullish RED .158 .062 .22
---------------------------------------------------------------------------------------------
SPY 398.54 -.55 413.98 -172.7% Bullish RED .174 .029 .203
---------------------------------------------------------------------------------------------
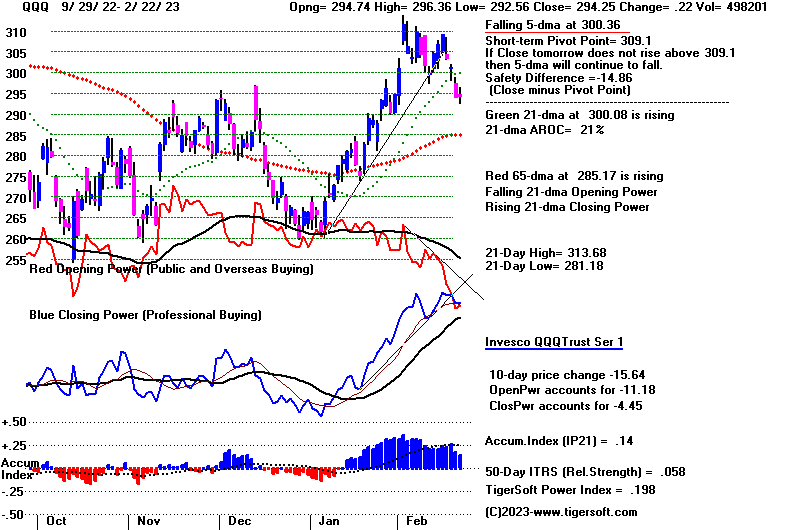
QQQ 294.25 .22 309.1 -206.4% Bullish RED .14 .06 .2
---------------------------------------------------------------------------------------------
MDY 475.24 .59 490.59 -124.8% Bullish BLUE .149 .065 .214
---------------------------------------------------------------------------------------------
IWM 187.94 .51 194.46 -119% Bullish BLUE .182 .063 .245
---------------------------------------------------------------------------------------------
FAS 80.74 -.54 89.5 -481% Bullish RED .194 .083 .277
---------------------------------------------------------------------------------------------
RETL 9.41 .15 11.27 -518% Bullish BLUE .023 .1 .123
---------------------------------------------------------------------------------------------
SOXL 13.83 -.18 17.54 -1084.8% Bullish RED .143 .119 .262
---------------------------------------------------------------------------------------------
TECL 27.94 -.15 33.17 -756.9% Bullish RED .158 .073 .231
---------------------------------------------------------------------------------------------
IBB 129.4 -.24 133.77 -164.9% Bullish RED .155 -.024 .131
---------------------------------------------------------------------------------------------
GLD 169.66 -.96 170.89 -86.1% ------- RED -.01 .043 .033
---------------------------------------------------------------------------------------------
DBO 14.38 -.31 15.14 -271% ------- RED .059 .043 .102
---------------------------------------------------------------------------------------------
OIH 297.75 -8.82 326.13 -514.1% Bullish RED .073 .074 .147
---------------------------------------------------------------------------------------------
CPER 25.32 -.23 24.52 84% Bullish ---- .349 .104 .453
---------------------------------------------------------------------------------------------
TAN 74.09 0 79.04 -159.9% ------- BLUE .103 -.04 .063
---------------------------------------------------------------------------------------------
UUP 28.27 .09 28.07 69.5% ------- BLUE .016 .022 .038
---------------------------------------------------------------------------------------------
CORN 26.54 -.25 26.53 -31.9% Bullish ---- .096 .057 .153
---------------------------------------------------------------------------------------------
WEAT 7.57 -.1 7.82 -256.2% ------- RED .007 .025 .032
---------------------------------------------------------------------------------------------
YINN 46.78 -1.1 52.82 -723.9% ------- RED .071 -.022 .049
|
 Table 3
              RANKING OF KEY DIRECTORIES BASED PCT.OF STOCKS ABOVE 65-DMA
              2/22/23
 Bullish = 26
 Bearish = 20
---------------------------------------------------------------------------------------
Directory     Current       day-1         day-2         day-3         day-4         day-5
----------------------------------------------------------------------------------------
EDU            1             1             1             1             1             1
HOSPITAL       .785          .785          .785          .714          .642          .571
HOMEBLDG       .777          .722          .888          .944          .888          .888
JETS           .769          .769          .769          .769          .846          .846
COPPER         .714          1             1             1             1             .857
GUNS           .714          .714          .785          .785          .714          .642
SOFTWARE       .714          .678          .732          .767          .785          .75
SEMI           .702          .67           .765          .819          .851          .861
               =====
INFRA          .696          .666          .909          .878          .878          .878
MILITARY       .692          .692          .73           .653          .73           .692
GAMING         .684          .684          .736          .736          .736          .736
GREEN          .666          .444          .722          .666          .722          .722
ELECTRON       .654          .624          .751          .781          .812          .804
COMPUTER       .65           .55           .65           .65           .65           .55
AUTO           .641          .641          .773          .773          .754          .754
NIFTY          .636          .59           .75           .75           .84           .795
TRANSP         .631          .684          .789          .789          .842          .789
NASD-100       .63           .62           .71           .7            .78           .73
               =====
HIGHPRIC       .623          .627          .74           .731          .779          .766
INDEXES        .6            .621          .675          .681          .713          .718
INSURANC       .6            .64           .68           .68           .68           .72
CHEM           .581          .558          .72           .72           .744          .72
RUS-1000       .573          .581          .694          .705          .753          .735
               =====
BIGBANKS       .571          .571          .857          .857          .857          .857
HACKERS        .562          .562          .562          .625          .625          .625
FINANCE        .512          .562          .737          .725          .737          .762
==============================================================================================
BEVERAGE       .5            .428          .357          .357          .571          .428
COAL           .5            .5            .5            .833          .833          .5
INDMATER       .5            .513          .638          .652          .68           .638
=============================================================================================
FIDSTKS        .485          .485          .591          .615          .656          .644
SP500          .469          .495          .614          .616          .688          .676
               =====
ETFS           .454          .563          .69           .763          .781          .781
LOWPRICE       .441          .461          .51           .504          .541          .538
REIT           .43           .484          .692          .73           .776          .784
RETAIL         .425          .446          .638          .595          .702          .638
BIOTECH        .423          .434          .556          .508          .531          .536
CHINA          .409          .454          .568          .727          .772          .704
DOWJONES       .4            .433          .566          .5            .533          .533
               =====
REGBANKS       .4            .4            .44           .44           .52           .48
SP-100         .388          .433          .544          .533          .566          .622
FOOD           .367          .367          .469          .428          .53           .632
COMODITY       .358          .333          .487          .435          .512          .589
OILGAS         .323          .361          .38           .476          .542          .628
SOLAR          .312          .125          .312          .437          .562          .437
MARIJUAN       .2            .2            .2            .2            .2            .2
UTILITY        .184          .184          .263          .184          .184          .131
DJI-13         .153          .153          .384          .384          .307          .307
BONDFUND       .126          .137          .31           .356          .712          .77
GOLD           .108          .13           .26           .239          .26           .347
|
===================================================================================
Wed. 2/22 6:02 AM PCT Futures: DJI +56 NASDAQ +34 Data Used
2-21-2023:
| |
2-21-2023:
|
|
| |
The DJI finally broke
down below the 33550 support that it has repeatedly
tested recently. That will
very likely be the new resistance if there is a recovery.
The DJI broke below its 65-dma today.
Breadth was bad; there were 2721 decliners
on the NYSE. Just 53% of all
stocks and ETFs are now above their 65-dma. The
reason for the extreme weakness is said
to be traders' fear that a growing number
of voting FOMC members are eager to hike
interest rates to 5%, but perhaps
much higher. The FOMC's minutes are
expected to also show a growing number
of FOMC members are willing to raise
rates by 1/2% or even 3/4% in February.
Both dividend and growth tech stocks were
hit by more than 2%
today. There may be no escape-group
if rates soar beyond 5%. If you go
through our charts, you will see those
with head/shoulders patterns to frighten
traders fared the worse.
That we may actually see an up-opening
today is short-term auspicious.
But I'm not sure Professionals are ready
to turn the market back up by much.
It would seem safer to wait for a decline
to the lower 3.5% band before
buying.
The break in the A/D Line uptrend has
been a key warning of impending weakeness
for some time, certainly ever since the
Jobs market report of the first Friday
was so positive. But we have been
concerned by the weak OBV Lines for
the SPY, OEX and NYSE, too. Without
volume to eat up the overhead supply
of stock, a breakout up from the recent
trading range seemed less likely than
a breakdown. That the DJI's price
range was so narrow and had so many reversals
gave us a way to reckon that the lower
band would have to be tested.
The DJI is now 2.2% below the 21-day ma.
A decline to the lower 3.5%
now seems likely. But note how
positive the Accumulation Index still is. That
means the lower band should find good
support. It is at that point, we will resume
buying a major market ETF, probably SPY.
|
|
| |
Charts - 2/21/2023
2022 PEERLESS DJI, Signals, Indicators Daily DJI Volume
10-DayUp/Down Vol Stoch-20 CCI RSI Pct of All Stocks above 65-dma
Inverted Traders Index
DJI-IPA DJI-OBV Short-Term Rates
NASDAQ S&P OEX NYSE DJ-15 DJ-20 DJI-30 Bond Funds
DIA QQQ SPY IWM new - COIN (Bit Coin ETF)
Gold Stocks
Semi Conductors
TNA Short-Term Rates Ten Year Rates PST (Short Treasuries)
DOLLAR-UUP
ALLSTOCKs
Russell-1000
Insurance-Stocks
Recent 2006 vers-Peerless signals
http://www.tigersoftware.com/OLDPEER/UPD90221.bmp
MDY - http://www.tigersoftware.com/CHARTX/MDY.GIF
USO-CrudeOil DBO FAS GLD HD IBB JETS JNUG KOL NAIL NUGT NRGU OIH
PALL RSX RETL SDS AGQ SLV SOXL TAN TECL TLT TMF TNA UGA USO
China:
YINN CHAU
Commodities: CANE
CORN DBC JJC, NIB CORN, CUT (paper)
MOO, NRGU
SOYB WEAT UUP (Dollar) LIT
(Lithium) PALL
(Palladium)
Stocks AA AAPL ADBE ALXN AMAT AMGN AMD AMZN AXP BA BABA
BAC BIDU BLDP CAT CHKP CNX CPB CRM CVX CMG DE DIS ENPH FB FSLR
FTNT GILD GME GOOG GS HD IBM INTU JPM KO KR LRCX MRK MRNA
MOS MSFT NEM NFLX NKE NOC NUE NVDA PANW PG PYPL REGN REV
SO QCOM QDEL TSLA TXN XOM V VRTX WFC WMT XLE ZM ZOM
Leveraged Short ETFs:
FAZ - financials, TZA and SRTY- small caps, MZZ - mid caps, TECS -Techs,
SOXS -
semi-conductors LABD
- Biotechs
Bullish MAXCPs
www.tigersoftware.com/UPPING/2-21-2023/Bullish.htm
Bearish MINCPs
www.tigersoftware.com/Downing/2-21-2023/BEARISH.htm |
|

 |
 |
 |
 |
 |
 |
 |
 |
|
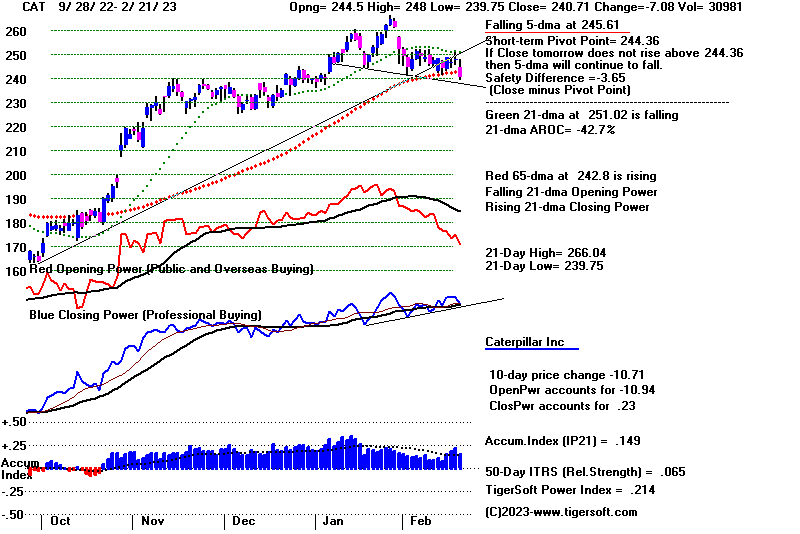 |
Table 1 - Daily Breadth
and Volume Statistics.
| NYSE |
Latest Close |
Previous
Close |
Week Ago |
| Issues
traded |
3,174 |
3,155 |
3,196 |
| Advances |
384 |
1,309 |
1,483 |
| Declines |
2,721 |
1,713 |
1,574 |
| Unchanged |
69 |
133 |
139 |
| New
highs |
38 |
61 |
102 |
| New
lows |
29 |
10 |
12 |
| Adv.
volume* |
116,316,598 |
370,439,463 |
406,667,738 |
| Decl.
volume* |
842,793,461 |
543,469,907 |
408,752,011 |
| Total
volume* |
966,100,118 |
929,039,222 |
833,908,294 |
| Closing
Arms (TRIN)† |
0.86 |
1.32 |
0.81 |
| Block
trades* |
4,583 |
4,551 |
4,124 |
| Adv.
volume |
574,942,182 |
1,451,071,658 |
2,060,295,306 |
| Decl.
volume |
3,509,647,483 |
2,507,934,695 |
1,771,869,612 |
| Total
volume |
4,121,592,279 |
4,045,483,609 |
3,929,202,033 |
| NASDAQ |
Latest Close |
Previous
Close |
Week Ago |
| Issues
traded |
4,762 |
4,712 |
4,752 |
| Advances |
880 |
2,336 |
2,109 |
| Declines |
3,715 |
2,127 |
2,409 |
| Unchanged |
167 |
249 |
234 |
| New
highs |
50 |
88 |
86 |
| New
lows |
130 |
76 |
83 |
| Closing
Arms (TRIN)† |
0.92 |
1.38 |
0.64 |
| Block
trades |
33,582 |
35,534 |
31,940 |
| Adv.
volume |
1,018,990,912 |
2,157,595,033 |
2,858,962,187 |
| Decl.
volume |
3,947,653,121 |
2,716,501,341 |
2,097,172,205 |
| Total
volume |
5,002,540,609 |
4,925,238,527 |
5,032,435,049 |
|
Table 2 QUICKSILVER on ETFS - 2/21/2023 ---
     Bullish = 8 -4          COMPQX, MDY, IWM, FAS , TECL
                           SOXL, TEXL, CPER
     Bearish = 0
ETF CLOSE CHANGE PIVOT-PT 5-dma AROC CL-PWR CANDLE IP21 ITRS POWER INDEX
================================================================================================
DIA 331.25 -7.04 341.14 -166.1% Bullish RED .205 0 ----
---------------------------------------------------------------------------------------------
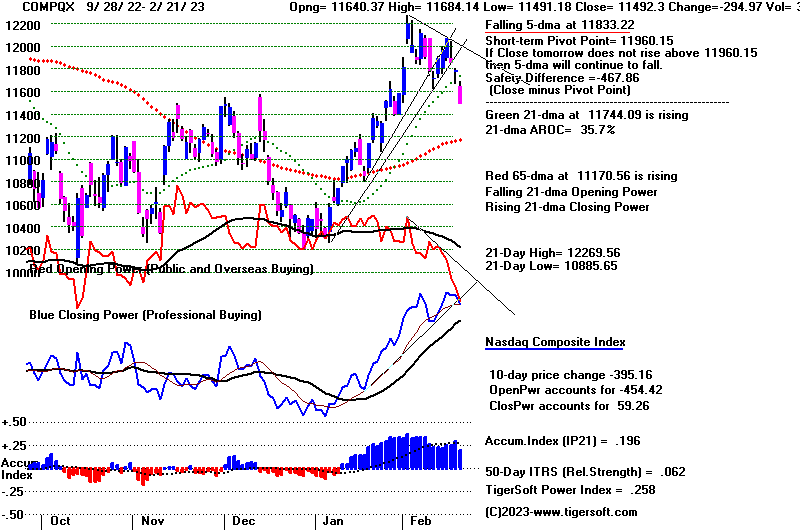
COMPQX 11492.3 -294.97 11960.15 -167.7% Bullish RED .197 .064 .261
---------------------------------------------------------------------------------------------
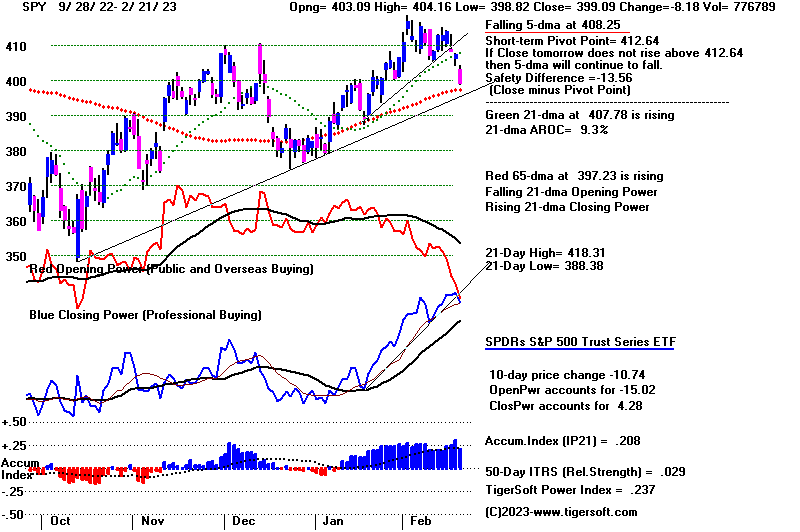
SPY 399.09 -8.17 412.64 -167.2% Bullish RED .209 .031 .24
---------------------------------------------------------------------------------------------
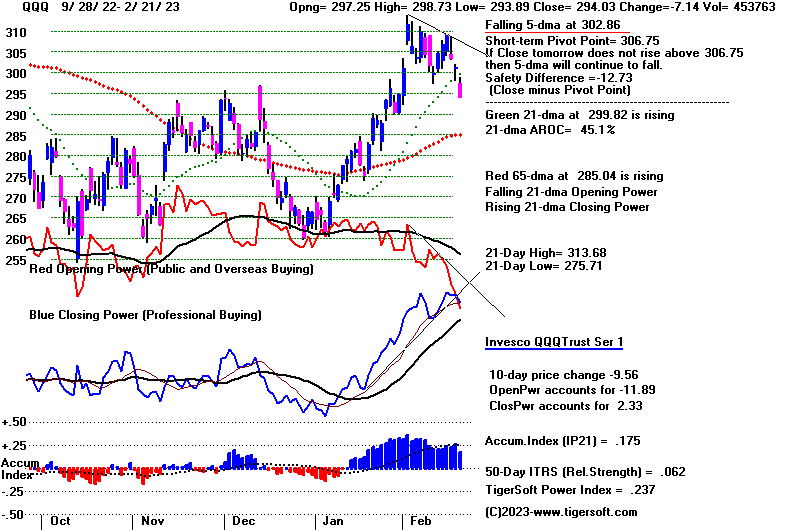
QQQ 294.03 -7.13 306.75 -171.7% Bullish RED .176 .064 .24
---------------------------------------------------------------------------------------------
MDY 474.65 -11.77 487.35 -127.7% Bullish RED .224 .064 .288
---------------------------------------------------------------------------------------------
IWM 187.43 -5.7 192.51 -133.9% Bullish RED .21 .059 .269
---------------------------------------------------------------------------------------------
FAS 81.28 -5.23 89.07 -516.3% Bullish RED .218 .087 .305
---------------------------------------------------------------------------------------------
RETL 9.26 -1.59 10.5 -593.8% ------- RED .072 .096 .168
---------------------------------------------------------------------------------------------
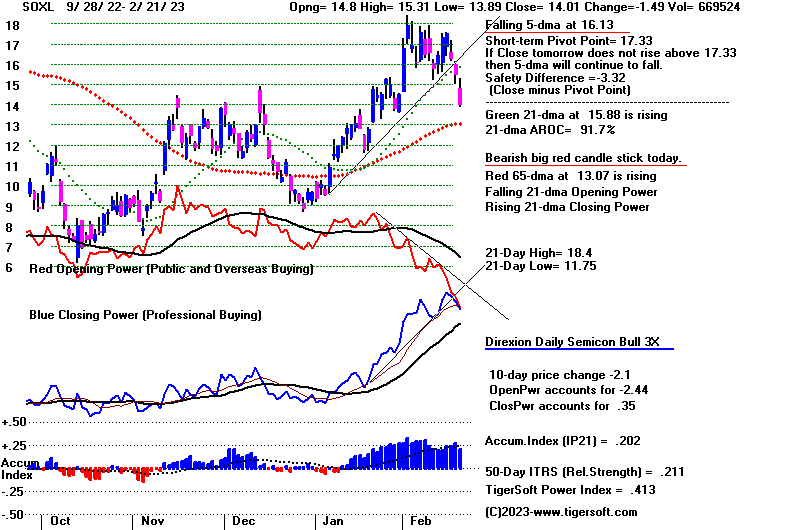
SOXL 14.01 -1.49 17.33 -725.3% ------- RED .202 .213 .415
---------------------------------------------------------------------------------------------
TECL 28.09 -2.15 32.65 -664.8% Bullish RED .195 .121 .316
---------------------------------------------------------------------------------------------
IBB 129.64 -3.72 133.77 -170.1% Bullish RED .199 -.018 .181
---------------------------------------------------------------------------------------------
GLD 170.62 -.64 172.61 -54.2% ------- RED .056 .041 .097
---------------------------------------------------------------------------------------------
DBO 14.69 -.03 15.19 -159.6% ------- RED .04 .043 .083
---------------------------------------------------------------------------------------------
OIH 306.57 -5.91 330.72 -381.9% Bullish RED .093 .101 .194
---------------------------------------------------------------------------------------------
CPER 25.55 .49 24.9 167.1% Bullish ---- .377 .114 .491
---------------------------------------------------------------------------------------------
TAN 74.09 -1.61 76.53 -194.4% ------- RED .109 -.04 .069
---------------------------------------------------------------------------------------------
UUP 28.18 .09 27.88 50% ------- ---- -.007 .008 .001
---------------------------------------------------------------------------------------------
CORN 26.79 .15 26.71 3.8% Bullish BLUE .111 .057 .168
---------------------------------------------------------------------------------------------
WEAT 7.67 -.11 7.97 -203.3% ------- RED -.013 .027 .014
---------------------------------------------------------------------------------------------
YINN 47.88 -1.81 54.24 -749.2% Bearish RED .091 .086 .177
|
Table 3      RANKING OF KEY DIRECTORIES BASED PCT.OF STOCKS ABOVE 65-DMA
             2/21/23
Bullish = 27
Bearish = 21
---------------------------------------------------------------------------------------
Directory     Current       day-1         day-2         day-3         day-4         day-5
----------------------------------------------------------------------------------------
COPPER         1             1             1             1             .857          .857
EDU            1             1             1             1             1             1
HOSPITAL       .785          .785          .714          .642          .571          .571
JETS           .769          .769          .769          .846          .846          .846
HOMEBLDG       .722          .888          .944          .888          .888          .944
GUNS           .714          .785          .785          .714          .642          .785
MILITARY       .692          .73           .653          .73           .692          .73
GAMING         .684          .736          .684          .789          .736          .736
TRANSP         .684          .789          .789          .842          .789          .842
SOFTWARE       .678          .75           .767          .785          .75           .767
SEMI           .67           .765          .819          .851          .851          .84
               ----
INFRA          .666          .909          .878          .878          .878          .848
AUTO           .641          .792          .773          .754          .735          .792
INSURANC       .64           .68           .68           .68           .72           .92
HIGHPRIC       .627          .74           .731          .779          .761          .783
ELECTRON       .624          .751          .781          .812          .796          .804
INDEXES        .621          .675          .681          .713          .708          .724
NASD-100       .62           .71           .7            .78           .72           .75
               -----
NIFTY          .59           .75           .75           .84           .772          .772
RUS-1000       .581          .694          .705          .753          .732          .745
               -----
BIGBANKS       .571          .857          .857          .857          .857          .857
ETFS           .563          .69           .763          .781          .8            .818
FINANCE        .562          .737          .725          .725          .75           .762
HACKERS        .562          .562          .625          .625          .625          .625
CHEM           .558          .72           .72           .744          .72           .72
COMPUTER       .55           .65           .65           .65           .6            .65
INDMATER       .513          .638          .652          .68           .652          .638
===============================================================================================
COAL           .5            .5            .833          .833          .5            .333
===============================================================================================
SP500          .495          .614          .618          .684          .672          .698
               -----
FIDSTKS        .485          .591          .615          .656          .639          .668
REIT           .484          .684          .738          .784          .776          .853
LOWPRICE       .461          .512          .507          .541          .538          .535
CHINA          .454          .568          .727          .772          .704          .772
RETAIL         .446          .638          .595          .702          .638          .659
GREEN          .444          .722          .666          .722          .722          .666
BIOTECH        .434          .553          .511          .531          .534          .568
DOWJONES       .433          .566          .5            .533          .5            .566
               -----
SP-100         .433          .544          .533          .566          .6            .611
BEVERAGE       .428          .357          .357          .571          .428          .428
REGBANKS       .4            .44           .44           .52           .48           .48
FOOD           .367          .469          .408          .53           .632          .591
OILGAS         .361          .38           .476          .542          .6            .58
COMODITY       .333          .487          .41           .512          .589          .538
MARIJUAN       .2            .2            .2            .2            .2            .2
UTILITY        .184          .263          .184          .184          .131          .21
DJI-13         .153          .384          .384          .307          .307          .461
BONDFUND       .137          .31           .356          .712          .793          .793
GOLD           .13           .26           .239          .26           .347          .304
SOLAR .125 .312 .437 .562 .437 .5
|
====================================================================================
Tues
2/21 6:00AM PCT Futures: DJI -280 NASDAQ -118
Data Used 2-17-2023:
| |
2/17/2023
|
|
| |
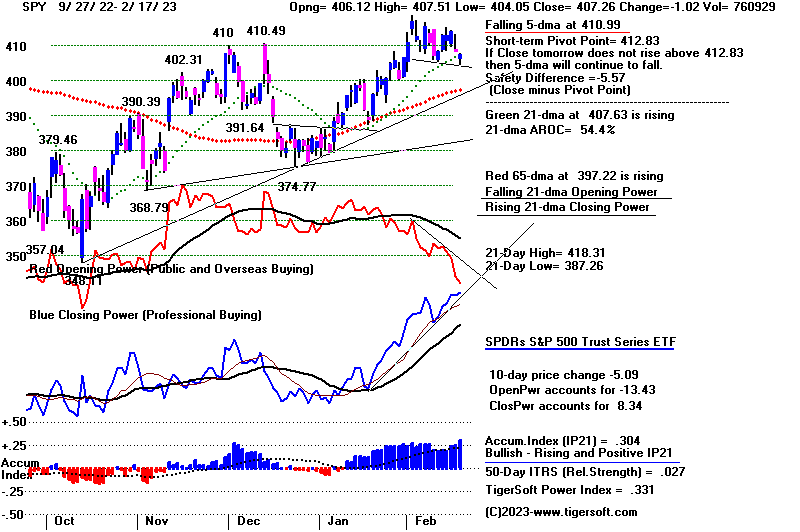
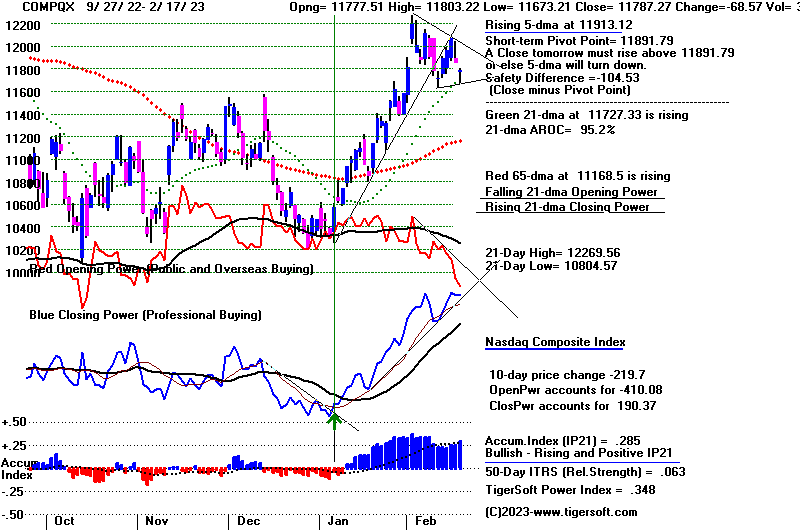
Peerless, the
rising Closing Powers and seasonality tell us to expect any decline
now to be contained by the DJI's
lower band and 32500. Over and over, when
one goes back and looks at the
Opening and Closing Power trends and compares
their slope when they diverge, one
sees the Professionals' Closing Power win the
"tug of war". But
there are two cases, shown below, one in 2011 and one in 2019,
when the SPY fell 10% and 5% in the
direction called by the falling Opening Power.
That could happen here, especially
if FOMC members start talking more about 3/4%
rate hikes or Putin tries to scare
the West with atomic sabre-rattling.
If the Closing Powers' uptrends in
the ETFs and stocks below break their uptrends,
it will look like the two bearish
scenario will play out and the DJI will have to fall to
its lower band. That will
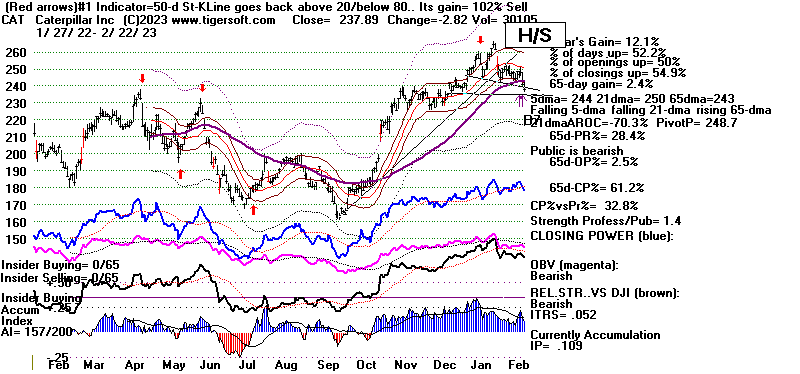
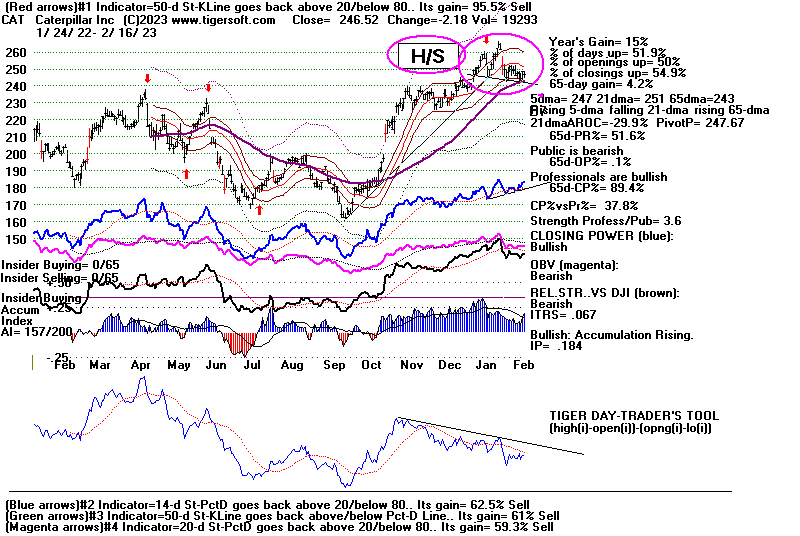
probably drop NVDA another 10% and may cause CAT to
break its neckline support..
But let's see if Professionals, as represented by what happens
after the opening, step up and
support the market. From our very positive Accumulation
readings, I would have to expect
the lower band to hold. But a test of the lower band,
which we have been warning about,
does seem to lie ahead given the break in the
A/D Line.
Take a look at the new book I am
working on for trading SPY using Peerless
and Tiger. It shows the
power of Peerless and our Closing Power, as well
as head/shoulder tops and
flat-topped breakouts. It shows that declines to
the lower band with the
Accumulation Index very positive, like now, are reliably
bullish at that point. And it
shows that rising Day Traders' Tool trends usually
mean higher prices short-term.
But it also shows that this Indicator is best used
by day-traders. It has a
downward-sloping bias that makes it far too cautious
if our other indicators and signals
are bullish. Another onservation emerges from
the book, namely that Closing Power
trend-breaks after a CP non-firmation are
reliably bearish. The reverse
is bullish, but is uncommon. The pink warning
down-arrows warn us when the
Closing Power is weaken that prices, but that
by itself does not constitute a
Sell. A breakout from a flat-top trumps short-term
divergences. But be alert for
false breakouts in these cases. |
|
| |
Charts - 2/17/2023
2022 PEERLESS DJI, Signals, Indicators Daily DJI Volume
10-DayUp/Down Vol Stoch-20 CCI RSI Pct of All Stocks above 65-dma
Inverted Traders Index
DJI-IPA DJI-OBV Short-Term Rates
NASDAQ S&P OEX NYSE DJ-15 DJ-20 DJI-30 Bond Funds
DIA QQQ SPY IWM new - COIN (Bit Coin ETF)
Gold Stocks
Semi Conductors
TNA Short-Term Rates Ten Year Rates PST (Short Treasuries)
DOLLAR-UUP
ALLSTOCKs
Russell-1000
Insurance-Stocks
Recent 2006 vers-Peerless signals
http://www.tigersoftware.com/OLDPEER/UPD90217.bmp
MDY - http://www.tigersoftware.com/CHARTX/MDY.GIF
USO-CrudeOil DBO FAS GLD HD IBB JETS JNUG KOL NAIL NUGT NRGU OIH
PALL RSX RETL SDS AGQ SLV SOXL TAN TECL TLT TMF TNA UGA USO
China:
YINN CHAU
Commodities: CANE
CORN DBC JJC, NIB CORN, CUT (paper)
MOO, NRGU
SOYB WEAT UUP (Dollar) LIT
(Lithium) PALL
(Palladium)
Stocks AA AAPL ADBE ALXN AMAT AMGN AMD AMZN AXP BA BABA
BAC BIDU BLDP CAT CHKP CNX CPB CRM CVX CMG DE DIS ENPH FB FSLR
FTNT GILD GME GOOG GS HD IBM INTU JPM KO KR LRCX MRK MRNA
MOS MSFT NEM NFLX NKE NOC NUE NVDA PANW PG PYPL REGN REV
SO QCOM QDEL TSLA TXN XOM V VRTX WFC WMT XLE ZM ZOM
Leveraged Short ETFs:
FAZ - financials, TZA and SRTY- small caps, MZZ - mid caps, TECS -Techs,
SOXS -
semi-conductors LABD
- Biotechs
Bullish MAXCPs
www.tigersoftware.com/UPPING/2-17-2023/Bullish.htm
Bearish MINCPs
www.tigersoftware.com/Downing/2-17-2023/BEARISH.htm |
|
 |
 |
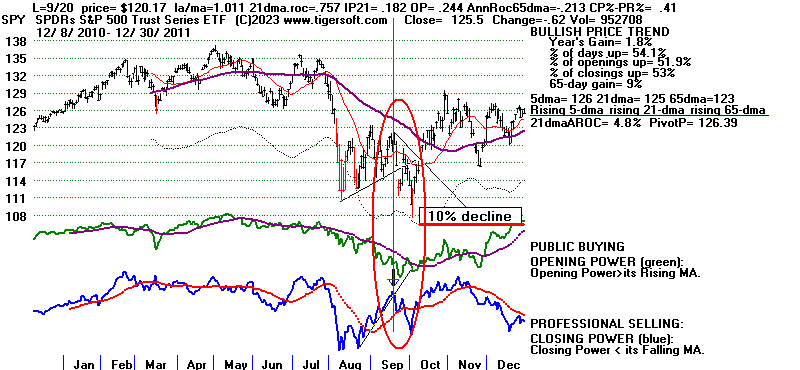
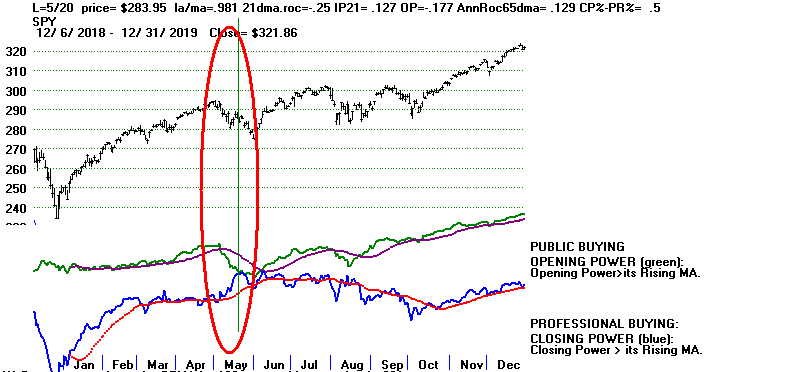
2 cases when Opening Power wins their battle with Closing Power:
10% SOY decline in mid 2011 and 5% decline in 2019
 |
Current SPY, QQQ, etc.
 |
 |
 |
 |
 |
 |
 |
 |
 |
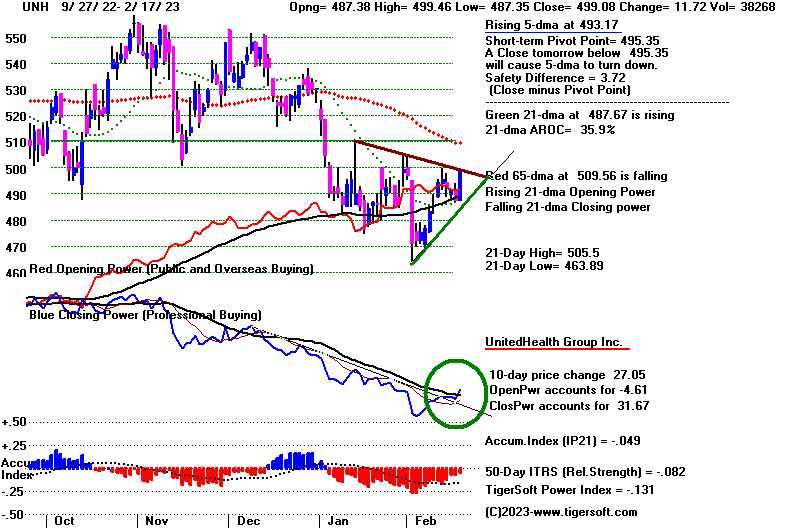 |
Table 1 - Daily Breadth
and Volume Statistics
| NYSE |
Latest Close |
Previous
Close |
Week Ago |
| Issues
traded |
3,155 |
3,174 |
3,185 |
| Advances |
1,309 |
800 |
1,611 |
| Declines |
1,713 |
2,264 |
1,460 |
| Unchanged |
133 |
110 |
114 |
| New
highs |
61 |
80 |
42 |
| New
lows |
10 |
15 |
15 |
| Adv.
volume* |
370,439,463 |
217,896,100 |
463,218,833 |
| Decl.
volume* |
543,469,907 |
627,499,312 |
382,886,488 |
| Total
volume* |
929,039,222 |
858,027,332 |
854,346,415 |
| Closing
Arms (TRIN)† |
1.32 |
0.89 |
1.10 |
| Block
trades* |
4,551 |
4,286 |
4,556 |
| Adv.
volume |
1,451,071,658 |
1,156,162,770 |
1,933,410,992 |
| Decl.
volume |
2,507,934,695 |
2,903,611,066 |
1,921,136,685 |
| Total
volume |
4,045,483,609 |
4,143,662,176 |
3,891,524,118 |
| NASDAQ |
Latest Close |
Previous
Close |
Week Ago |
| Issues
traded |
4,712 |
4,807 |
4,773 |
| Advances |
2,336 |
1,521 |
1,918 |
| Declines |
2,127 |
3,045 |
2,584 |
| Unchanged |
249 |
241 |
271 |
| New
highs |
88 |
96 |
61 |
| New
lows |
76 |
67 |
82 |
| Closing
Arms (TRIN)† |
1.38 |
1.28 |
1.17 |
| Block
trades |
35,534 |
34,544 |
31,007 |
| Adv.
volume |
2,157,595,033 |
1,437,678,055 |
1,864,212,577 |
| Decl.
volume |
2,716,501,341 |
3,684,986,926 |
2,936,247,513 |
| Total
volume |
4,925,238,527 |
5,159,416,186 |
4,885,033,078 |
|
Table 2 - QUICKSILVER on ETFS - 2/17/2023
--- Bullish = 12 COMPQX, SPY, QQQ, MDY, IWM, FAS, RETL, TECL
SOXL (highest - +.586)
TEXL, IBB, CPER
Bearish = 0
ETF CLOSE CHANGE PIVOT-PT 5-dma AROC CL-PWR CANDLE IP21 ITRS POWER INDEX
================================================================================================
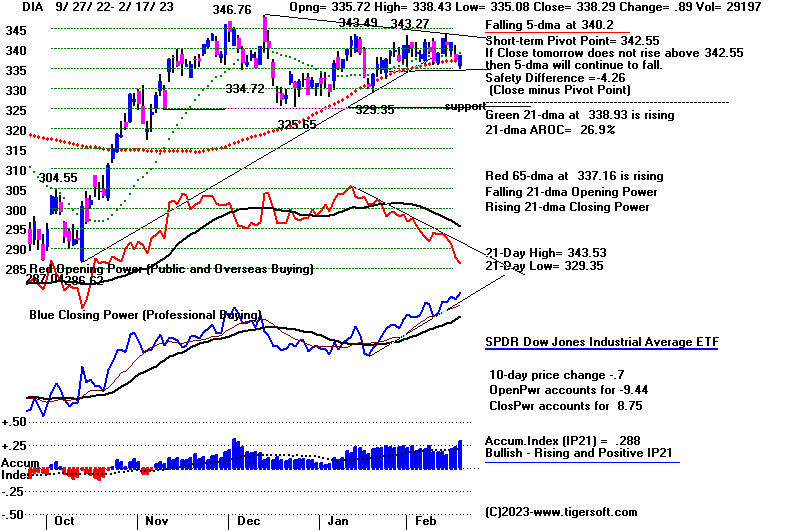
DIA 338.29 .9 342.55 -6.5% Bullish BLUE .289 0 ------
---------------------------------------------------------------------------------------------
COMPQX 11787.27 -68.56 11891.79 29.1% Bullish BLUE .286 .065 .351
---------------------------------------------------------------------------------------------
SPY 407.26 -1.02 412.83 -9.5% Bullish BLUE .304 .029 .333
---------------------------------------------------------------------------------------------
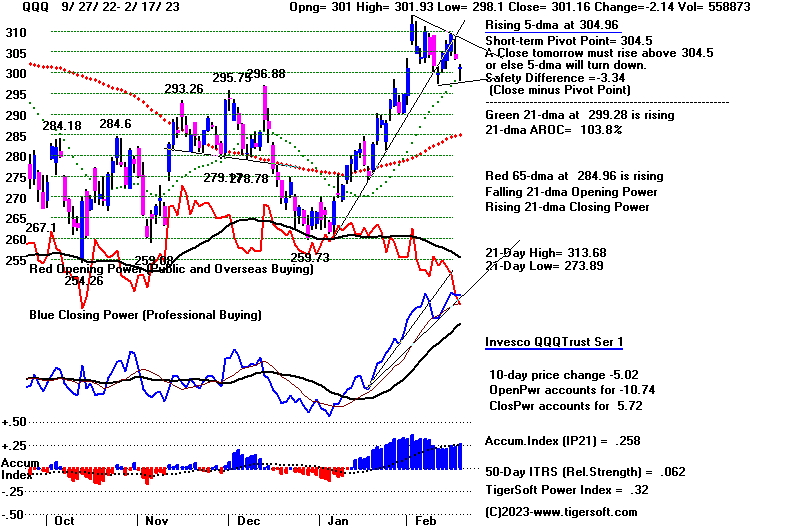
QQQ 301.16 -2.14 304.5 24% Bullish BLUE .258 .064 .322
---------------------------------------------------------------------------------------------
MDY 486.42 -.64 487.11 52.4% Bullish BLUE .282 .068 .35
---------------------------------------------------------------------------------------------
IWM 193.13 .53 192.6 73.2% Bullish BLUE .33 .067 .397
---------------------------------------------------------------------------------------------
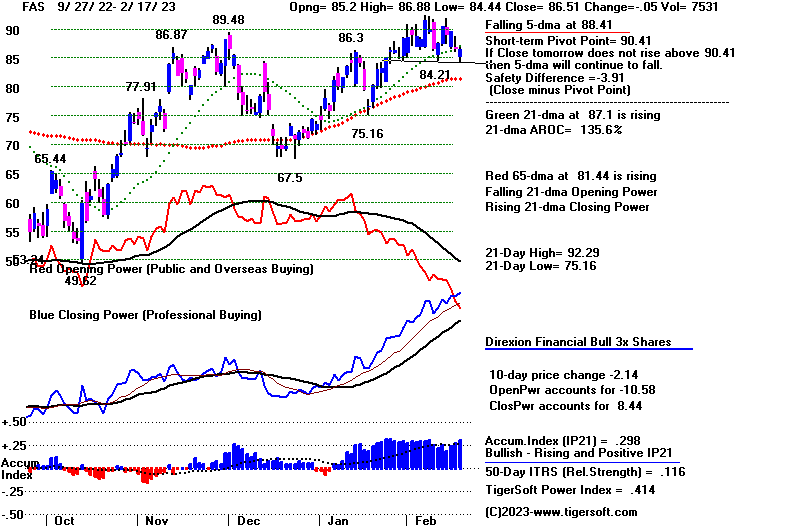
FAS 86.51 -.05 90.41 -60.9% Bullish BLUE .299 .118 .417
---------------------------------------------------------------------------------------------
RETL 10.85 .12 10.54 458.2% ------- BLUE .169 .259 .428
---------------------------------------------------------------------------------------------
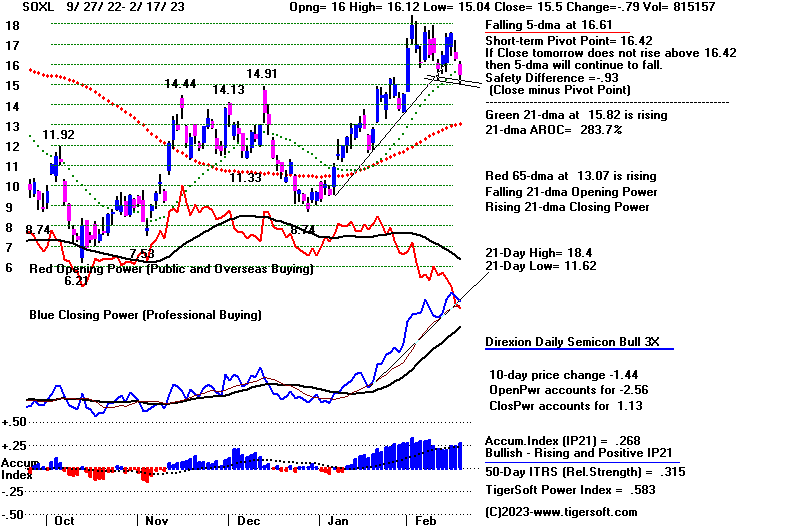
SOXL 15.5 -.78 16.42 -90% ------- RED .269 .317 .586
---------------------------------------------------------------------------------------------
TECL 30.24 -1.18 32.34 -79.5% Bullish RED .259 .167 .426
---------------------------------------------------------------------------------------------
IBB 133.36 1.27 134.18 37.5% Bullish BLUE .276 -.005 .271
---------------------------------------------------------------------------------------------
GLD 171.26 .51 172.48 -61% ------- BLUE .083 .034 .117
---------------------------------------------------------------------------------------------
DBO 14.72 -.27 15.17 -174.9% ------- BLUE .09 .001 .091
---------------------------------------------------------------------------------------------
OIH 312.48 -14.97 331.44 -254.7% Bullish RED .148 .072 .22
---------------------------------------------------------------------------------------------
CPER 25.06 .05 24.72 129.5% Bullish BLUE .415 .081 .496
---------------------------------------------------------------------------------------------
TAN 75.7 -.53 77.08 -11.7% ------- BLUE .17 -.048 .122
---------------------------------------------------------------------------------------------
UUP 28.09 -.02 27.9 19.7% Bearish RED -.066 -.019 -.085
---------------------------------------------------------------------------------------------
CORN 26.64 .14 26.77 -3.8% ------- ---- -.035 .037 .002
---------------------------------------------------------------------------------------------
WEAT 7.78 -.01 7.99 -139% Bullish ---- .055 .044 .099
---------------------------------------------------------------------------------------------
YINN 49.69 -3.32 55.84 -323.3% Bullish RED .181 .035 .216
|
 Table 3 RANKING OF KEY DIRECTORIES BASED PCT.OF STOCKS ABOVE 65-DMA
              2/17/23
Bullish = 37
Bearish = 11
---------------------------------------------------------------------------------------
Directory     Current       day-1         day-2         day-3         day-4         day-5
----------------------------------------------------------------------------------------
COPPER         1             1             1             .857          .857          .857
EDU            1             1             1             1             1             1
INFRA          .909          .878          .878          .878          .848          .848
HOMEBLDG       .888          .944          .888          .888          .944          .888
               =====
BIGBANKS       .857          .857          .857          .857          .857          .857
               =====
AUTO           .792          .792          .754          .735          .792          .735
TRANSP         .789          .789          .842          .789          .842          .789
GUNS           .785          .785          .714          .642          .785          .714
HOSPITAL       .785          .714          .642          .571          .571          .571
JETS           .769          .769          .846          .846          .846          .846
SEMI           .765          .819          .851          .851          .829          .829
               =====
ELECTRON       .751          .781          .812          .796          .796          .796
NIFTY          .75           .75           .84           .772          .818          .75
SOFTWARE       .75           .785          .785          .75           .767          .767
HIGHPRIC       .74           .731          .779          .761          .787          .722
FINANCE        .737          .725          .725          .737          .775          .737
GAMING         .736          .684          .736          .789          .736          .631
MILITARY       .73           .653          .73           .692          .73           .692
GREEN          .722          .666          .722          .722          .666          .555
CHEM           .72           .72           .744          .72           .72           .674
NASD-100       .71           .7            .78           .72           .76           .67
               =====
RUS-1000       .694          .705          .753          .732          .749          .702
               =====
ETFS           .69           .763          .781          .8            .836          .763
REIT           .684          .73           .792          .784          .853          .8
INSURANC       .68           .68           .68           .72           .88           .8
INDEXES        .675          .681          .713          .708          .729          .74
COMPUTER       .65           .65           .65           .6            .7            .65
INDMATER       .638          .652          .68           .652          .638          .638
RETAIL         .638          .595          .702          .638          .659          .574
SP500          .614          .618          .686          .668          .709          .643
               =====
FIDSTKS        .591          .615          .656          .639          .68           .633
CHINA          .568          .727          .772          .704          .772          .727
DOWJONES       .566          .5            .533          .5            .6            .466
               =====
HACKERS        .562          .625          .625          .625          .625          .625
BIOTECH        .553          .508          .534          .534          .562          .534
SP-100         .544          .533          .566          .6            .622          .533
LOWPRICE       .512          .51           .544          .538          .538          .558
===========================================================================================
COAL           .5            .833          .833          .5            .333          .5
===========================================================================================
COMODITY       .487          .41           .487          .589          .538          .538
FOOD           .469          .408          .51           .632          .591          .571
REGBANKS       .44           .44           .52           .48           .48           .48
DJI-13         .384          .384          .307          .307          .461          .307
OILGAS         .38           .476          .542          .6            .58           .58
BEVERAGE       .357          .357          .571          .428          .428          .357
SOLAR          .312          .437          .562          .437          .5            .375
BONDFUND       .31           .356          .712          .793          .827          .781
UTILITY        .263          .184          .184          .131          .21           .131
GOLD           .26           .239          .26           .347          .326          .391
MARIJUAN       .2            .2            .2            .2            .2            .2
|
===================================================================================
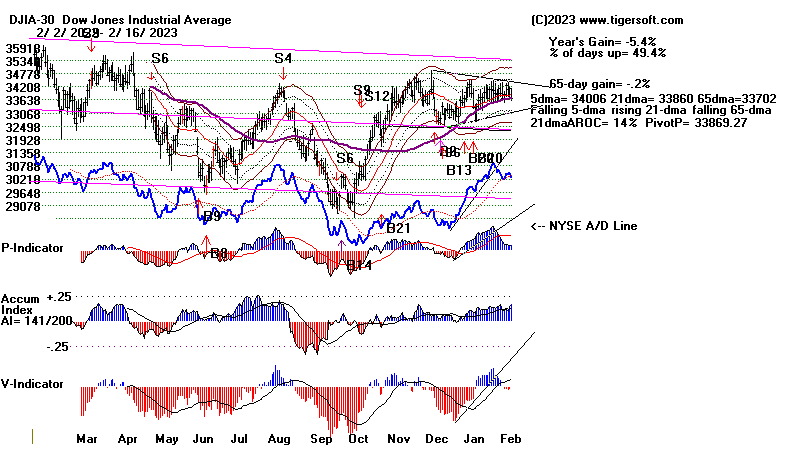
Friday 2/17: 5:45 AM Futures: DJI -165 NASDAQ -109
Data Used 2-16-2023:
| |
2/16/2023
|
|
| |
Talk of
a 1/2% jump in rates within the FED hierarchy spooked the market,
as did a big jump in
one of the key inflation indicators, the Producer Price
Index. Thursday's
431 point DJI decline did drop the DJI 6 points below
its key 65-dma.
This is apt to bring an additional decline to its 3-week
low just above 35500.
Down-day volume within the recent trading range
has consistently been
above up-day volume. So, all the narrow backing and filling
and the prospects of
more rate hikes could bound to bring a decline
by the DJI to its lower
band. But with the P-Indicator and Accumulation
Index positive,
Peerless will probably give a Buy signal at that point. And
we can take new long
positions in the major market ETFs.
The DJI's weakness
today was concentrated in its highest priced components.
I count 9 individual
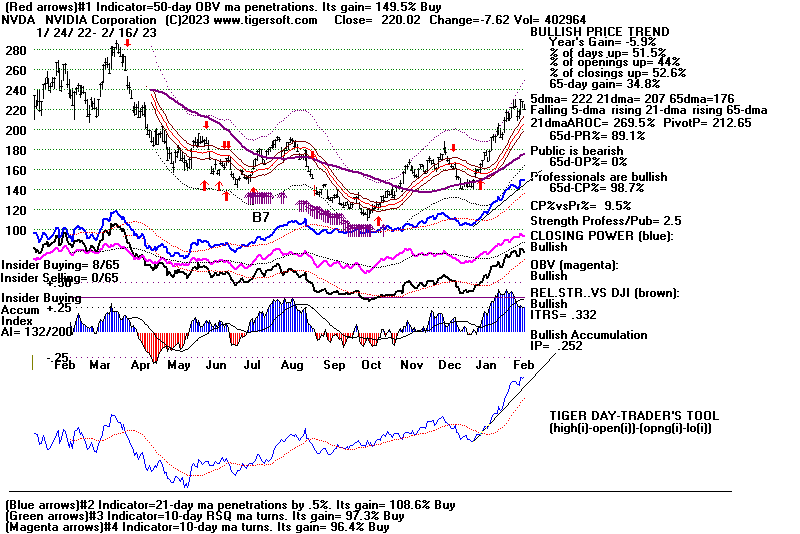
DJI stocks over $200/share. These have the most weight.
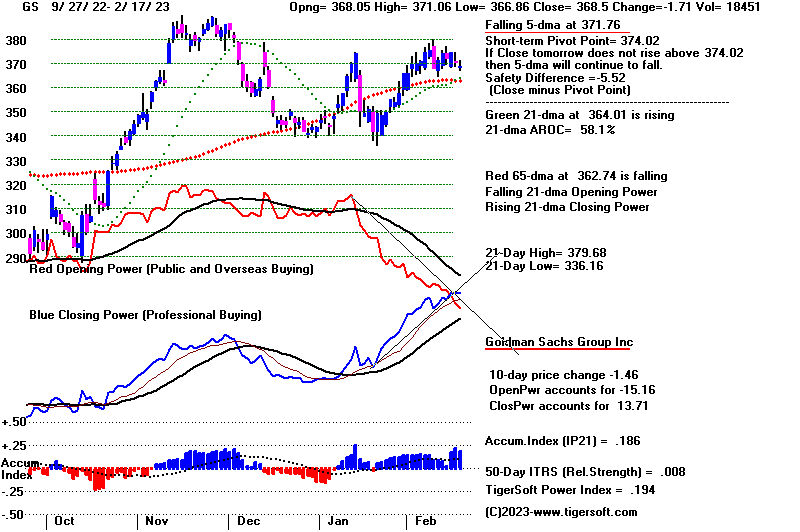
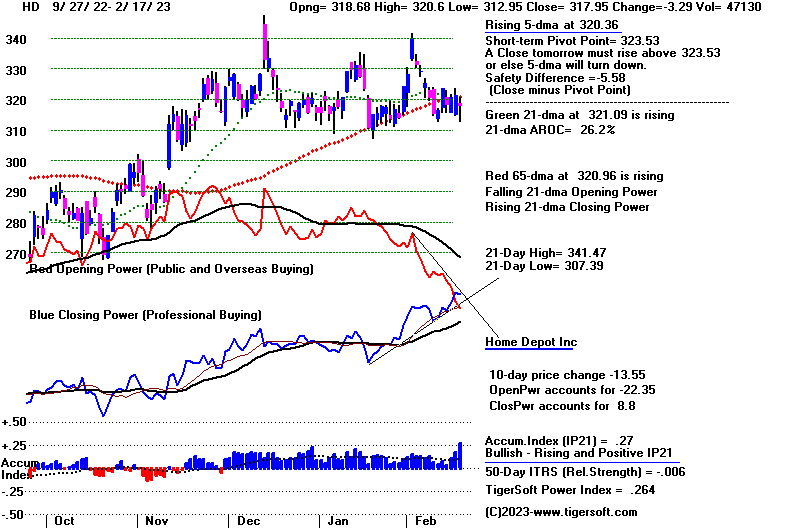
Six of them (BA, GS,
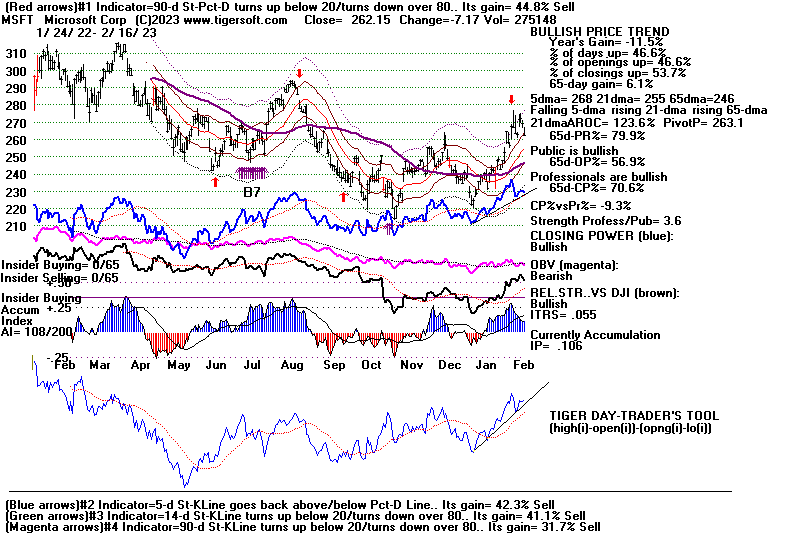
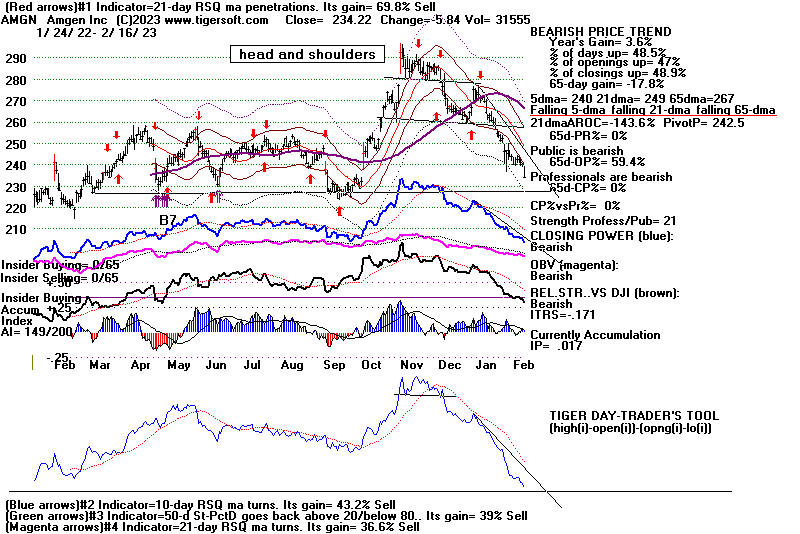
MSFT, AMGN, UNH and V fell between 3 and 7 points.
MSFT, whose Artifical
Intelligence excitement probably needs to be tempered,
fell the most, 7.17
points and alone caused a hundred point drop in the DJI.
Three other high priced
DJI stocks held up better, including HD +3.9 and
MCD -.73. These
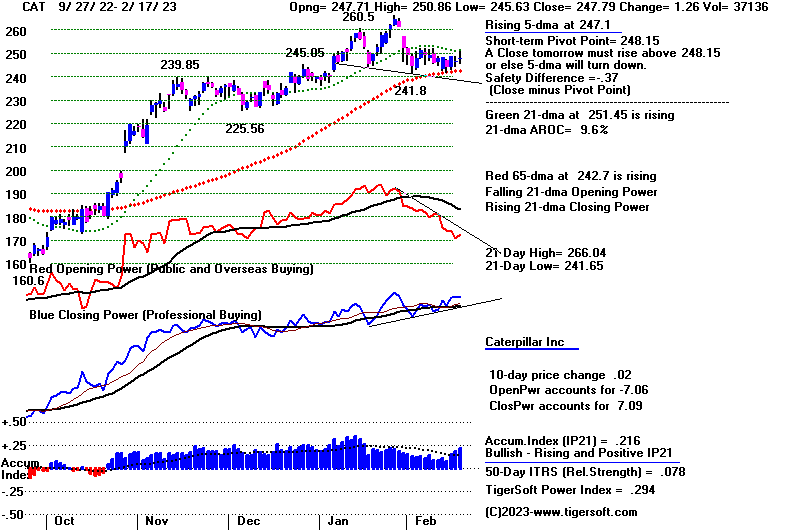
and CAT, which is fending off a head/shoulders top will likely
be the most important
stocks to watch now as the DJI deals with FED
more aggressive
"hawkishness".
All the while the blue
chips and dividend stocks are coping with the FED,
Professionals, as
judged by their Closing Powers' and Day Traders' Tools'
uptrends and recent new
highs, remain bullish. Professionals, as a class, usually
end up being right.
So does the bullish seasonality in the third year. In addition,
Peerless refuses to
give a Sell.
It remains to be seen
if the Monday holiday next week will bring a recovery
today, Friday.
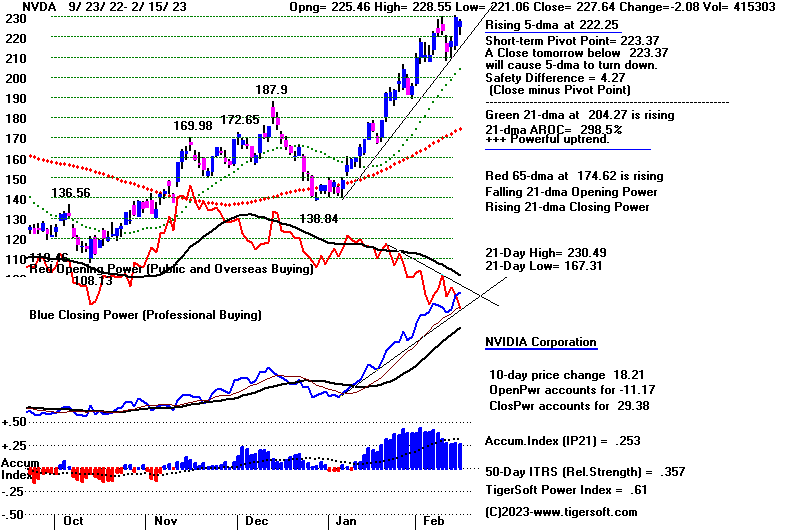
Regardless, I would continue to hold CAT, NVDA and some
of the strongest
Bullish MAXCPs. I would avoid the short side of the market.
|
|
| |
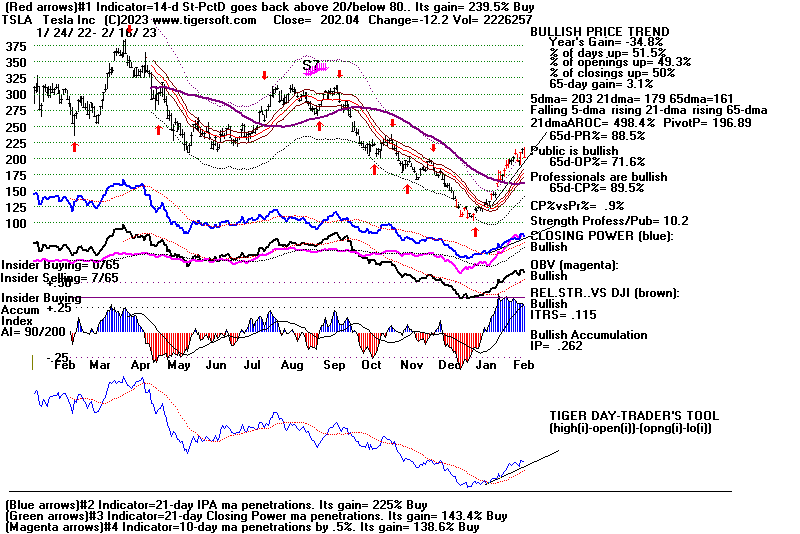
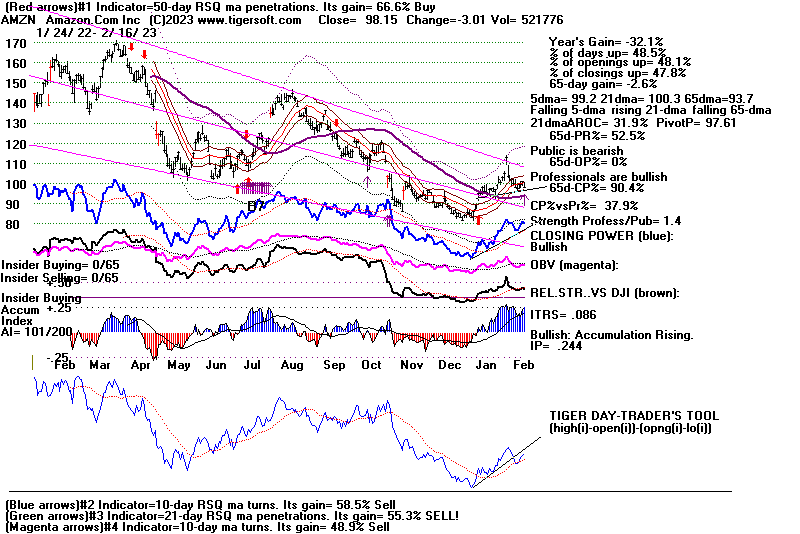
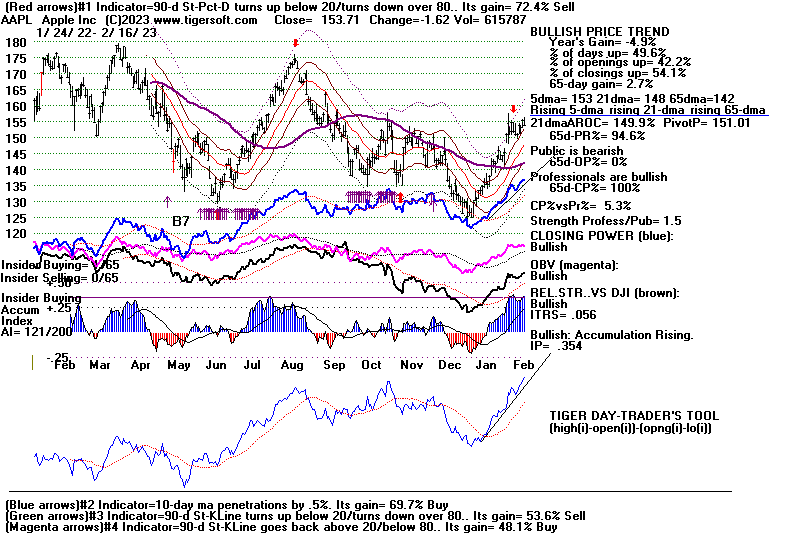
Charts - 2/16/2023
2022 PEERLESS DJI, Signals, Indicators Daily DJI Volume
10-DayUp/Down Vol Stoch-20 CCI RSI Pct of All Stocks above 65-dma
Inverted Traders Index
DJI-IPA DJI-OBV Short-Term Rates
NASDAQ S&P OEX NYSE DJ-15 DJ-20 DJI-30 Bond Funds
DIA QQQ SPY IWM new - COIN (Bit Coin ETF)
Gold Stocks
Semi Conductors
TNA Short-Term Rates Ten Year Rates PST (Short Treasuries)
DOLLAR-UUP
ALLSTOCKs
Russell-1000
Insurance-Stocks
Recent 2006 vers-Peerless signals
http://www.tigersoftware.com/OLDPEER/UPD90216.bmp
MDY - http://www.tigersoftware.com/CHARTX/MDY.GIF
USO-CrudeOil DBO FAS GLD HD IBB JETS JNUG KOL NAIL NUGT NRGU OIH
PALL RSX RETL SDS AGQ SLV SOXL TAN TECL TLT TMF TNA UGA USO
China:
YINN CHAU
Commodities: CANE
CORN DBC JJC, NIB CORN, CUT (paper)
MOO, NRGU
SOYB WEAT UUP (Dollar) LIT
(Lithium) PALL
(Palladium)
Stocks AA AAPL ADBE ALXN AMAT AMGN AMD AMZN AXP BA BABA
BAC BIDU BLDP CAT CHKP CNX CPB CRM CVX CMG DE DIS ENPH FB FSLR
FTNT GILD GME GOOG GS HD IBM INTU JPM KO KR LRCX MRK MRNA
MOS MSFT NEM NFLX NKE NOC NUE NVDA PANW PG PYPL REGN REV
SO QCOM QDEL TSLA TXN XOM V VRTX WFC WMT XLE ZM ZOM
Leveraged Short ETFs:
FAZ - financials, TZA and SRTY- small caps, MZZ - mid caps, TECS -Techs,
SOXS -
semi-conductors LABD
- Biotechs
Bullish MAXCPs www.tigersoftware.com/UPPING/2-16-2023/Bullish.htm
Bearish MINCPs www.tigersoftware.com/Downing/2-16-2023/BEARISH.htm
|
|

 |
 |
 |
 |
 |
 |
 |
 |
 |
 |
 |
 |
 |
 |
 |
 |
| |
Table 1 - Daily
Breadth and Volume Statistics
| NYSE |
Latest Close |
Previous
Close |
Week Ago |
| Issues
traded |
3,174 |
3,194 |
3,172 |
| Advances |
800 |
1,780 |
807 |
| Declines |
2,264 |
1,297 |
2,253 |
| Unchanged |
110 |
117 |
112 |
| New
highs |
80 |
83 |
87 |
| New
lows |
15 |
7 |
10 |
| Adv.
volume* |
217,896,100 |
516,972,109 |
209,644,983 |
| Decl.
volume* |
627,499,312 |
304,805,423 |
674,580,955 |
| Total
volume* |
858,027,332 |
831,716,755 |
887,518,365 |
| Closing
Arms (TRIN)† |
0.89 |
0.73 |
1.07 |
| Block
trades* |
4,286 |
4,473 |
4,413 |
| Adv.
volume |
1,156,162,770 |
2,625,091,245 |
1,066,333,261 |
| Decl.
volume |
2,903,611,066 |
1,404,290,655 |
3,178,692,598 |
| Total
volume |
4,143,662,176 |
4,075,983,812 |
4,270,207,804 |
| NASDAQ |
Latest Close |
Previous
Close |
Week Ago |
| Issues
traded |
4,807 |
4,797 |
4,767 |
| Advances |
1,521 |
2,870 |
1,348 |
| Declines |
3,045 |
1,676 |
3,190 |
| Unchanged |
241 |
251 |
229 |
| New
highs |
96 |
91 |
93 |
| New
lows |
67 |
63 |
67 |
| Closing
Arms (TRIN)† |
1.28 |
0.87 |
1.07 |
| Block
trades |
34,544 |
33,599 |
38,336 |
| Adv.
volume |
1,437,678,055 |
3,333,606,989 |
1,553,537,385 |
| Decl.
volume |
3,684,986,926 |
1,694,530,007 |
3,933,489,976 |
| Total
volume |
5,159,416,186 |
5,056,647,624 |
5,536,290,050 |
|
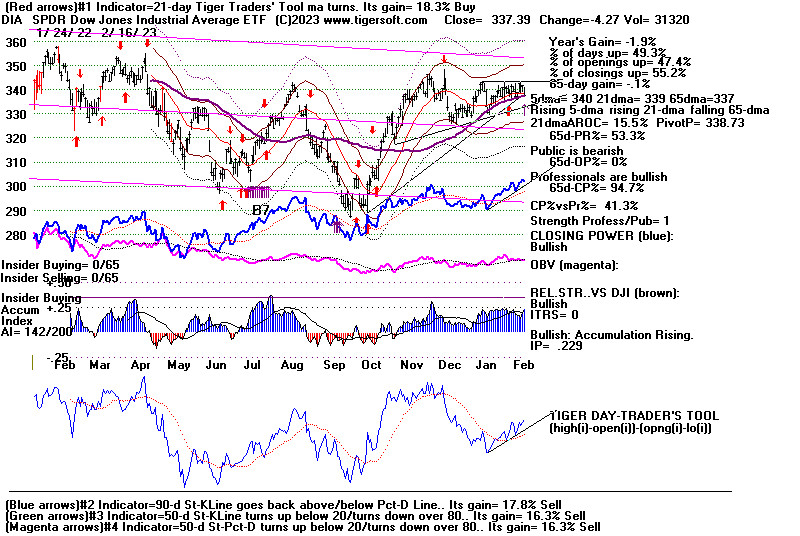
Table 2 QUICKSILVER on ETFS - 2/16/2023 ---
     Bullish = 12  +3           COMPQX, SPY,  QQQ, MDY, IWM, FAS, RETL,
                               SOXL (highest - +.54)
                               ,TEXL, OIH, CPER, YINN
     Bearish = 0
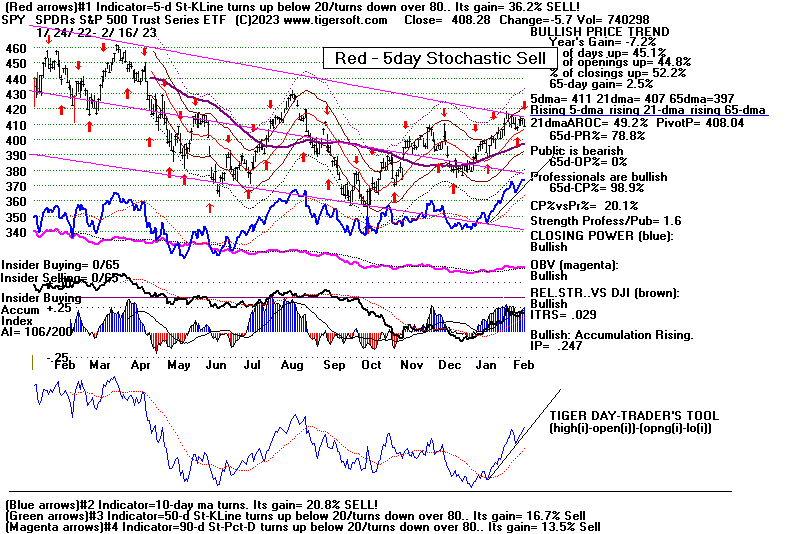
ETF CLOSE CHANGE PIVOT-PT 5-dma AROC CL-PWR CANDLE IP21 ITRS POWER INDEX
================================================================================================
DIA 337.39 -4.27 338.73 4.6% Bullish RED .23 0 -----
---------------------------------------------------------------------------------------------
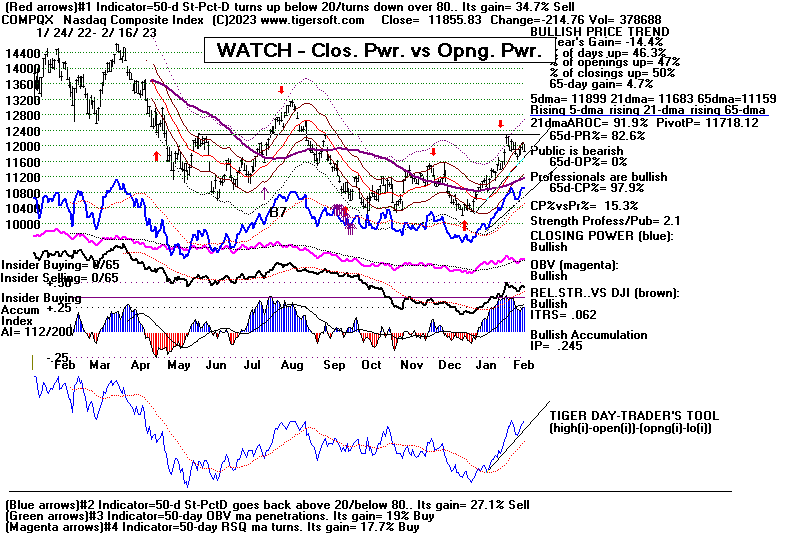
COMPQX 11855.83 -214.76 11718.12 27.9% Bullish RED .245 .063 .308
---------------------------------------------------------------------------------------------
SPY 408.28 -5.7 408.04 14.5% Bullish RED .248 .03 .278
---------------------------------------------------------------------------------------------
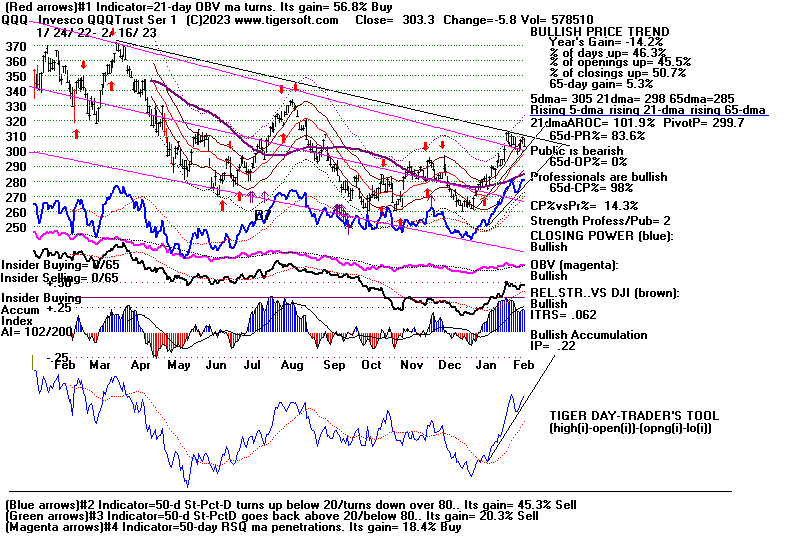
QQQ 303.3 -5.8 299.7 26.6% Bullish RED .22 .062 .282
---------------------------------------------------------------------------------------------
MDY 487.06 -3.53 481.32 70.7% Bullish BLUE .248 .07 .318
---------------------------------------------------------------------------------------------
IWM 192.6 -1.86 190.31 69.5% Bullish BLUE .292 .061 .353
---------------------------------------------------------------------------------------------
FAS 86.56 -2.94 87.59 -2.3% Bullish RED .273 .103 .376
---------------------------------------------------------------------------------------------
RETL 10.73 -.54 9.88 252.9% Bullish RED .132 .228 .36
---------------------------------------------------------------------------------------------
SOXL 16.28 -1.26 15.8 -89.6% Bullish RED .239 .301 .54
---------------------------------------------------------------------------------------------
TECL 31.42 -1.75 30.75 21.8% Bullish RED .245 .147 .392
---------------------------------------------------------------------------------------------
IBB 132.09 -1.68 132.36 -11.6% Bullish RED .234 -.017 .217
---------------------------------------------------------------------------------------------
GLD 170.75 -.14 173.36 -66.1% ------- BLUE .097 .046 .143
---------------------------------------------------------------------------------------------
DBO 14.99 -.15 15.25 43% ------- RED .087 -.005 .082
---------------------------------------------------------------------------------------------
OIH 327.45 1.32 329.24 149.2% Bullish BLUE .212 .124 .336
---------------------------------------------------------------------------------------------
CPER 25.01 .49 24.42 52.7% Bullish BLUE .408 .101 .509
---------------------------------------------------------------------------------------------
TAN 76.23 -2.81 75.88 -11% ------- RED .088 -.061 .027
---------------------------------------------------------------------------------------------
UUP 28.11 .04 27.98 39.4% Bearish ---- -.038 -.005 -.043
---------------------------------------------------------------------------------------------
CORN 26.5 -.03 26.66 30.1% ------- BLUE -.103 .041 -.062
---------------------------------------------------------------------------------------------
WEAT 7.79 -.03 8 50.6% Bullish ---- .067 .044 .111
---------------------------------------------------------------------------------------------
YINN 53.01 .19 53.17 -484.7% Bullish BLUE .205 .16 .365
|
 Table 3      RANKING OF KEY DIRECTORIES BASED PCT.OF STOCKS ABOVE 65-DMA
              2/16/23
Bullish =
Bearish =
---------------------------------------------------------------------------------------
Directory     Current       day-1         day-2         day-3         day-4         day-5
----------------------------------------------------------------------------------------
COPPER         1             1             .857          .857          .857          1
EDU            1             1             1             1             1             1
HOMEBLDG       .944          .888          .888          .944          .888          .888
               =====
INFRA          .878          .878          .878          .848          .848          .878
BIGBANKS       .857          .857          .857          .857          .857          .857
               =====
COAL           .833          .833          .5            .333          .5            .333
SEMI           .819          .851          .851          .829          .819          .84
               ====
AUTO           .792          .773          .735          .792          .735          .792
TRANSP         .789          .842          .789          .842          .842          .789
GUNS           .785          .714          .642          .785          .714          .642
SOFTWARE       .785          .803          .75           .767          .767          .803
ELECTRON       .781          .812          .796          .796          .789          .789
JETS           .769          .846          .846          .846          .846          .846
ETFS           .763          .781          .8            .836          .781          .8
NIFTY          .75           .84           .772          .818          .75           .75
HIGHPRIC       .731          .779          .761          .787          .731          .727
REIT           .73           .784          .792          .861          .784          .73
CHINA          .727          .772          .704          .772          .727          .772
FINANCE        .725          .725          .737          .762          .737          .737
CHEM           .72           .744          .72           .72           .674          .651
HOSPITAL       .714          .642          .571          .571          .571          .571
RUS-1000       .705          .753          .732          .749          .707          .695
               ====
NASD-100       .7            .78           .72           .76           .69           .68
               ====
GAMING         .684          .736          .736          .789          .684          .578
INDEXES        .681          .713          .708          .729          .724          .708
INSURANC       .68           .68           .72           .88           .8            .72
GREEN          .666          .722          .722          .666          .555          .722
MILITARY       .653          .73           .692          .73           .692          .538
INDMATER       .652          .68           .652          .638          .638          .583
COMPUTER       .65           .65           .6            .7            .65           .6
HACKERS        .625          .625          .625          .625          .625          .625
SP500          .618          .686          .67           .704          .655          .627
               =====
FIDSTKS        .615          .656          .639          .68           .633          .603
RETAIL         .595          .702          .638          .659          .595          .574
SP-100         .533          .566          .6            .622          .544          .522
LOWPRICE       .51           .547          .541          .538          .555          .558
BIOTECH        .508          .531          .536          .562          .534          .562
--------------------------------------------------------------------------------------------
DOWJONES       .5            .533          .5            .6            .466          .433
               =====
--------------------------------------------------------------------------------------------
OILGAS         .476          .542          .6            .58           .571          .419
REGBANKS       .44           .52           .48           .48           .48           .44
SOLAR          .437          .562          .437          .5            .375          .375
COMODITY       .41           .487          .564          .538          .538          .435
FOOD           .408          .51           .612          .591          .571          .469
DJI-13         .384          .307          .307          .461          .307          .307
BEVERAGE       .357          .571          .428          .428          .357          .428
BONDFUND       .356          .712          .793          .827          .793          .885
GOLD           .239          .26           .347          .326          .391          .369
MARIJUAN       .2            .2            .2            .2            .2            .2
UTILITY        .184          .184          .131          .21           .131          .105
|
===================================================================================
Thursday 2/16: 6:00 AM Futures: DJI -276 NASDAQ -182
Data Used 2-15-2023:
| |
2/15/2023
|
|
| |
For more than three
weeks the DJI has been trapped in an unusually narrow trading
range between 33600 and 34400.
I keep saying, let's wait for a new Buy signal
at the lower band to buy an ETF,
but hold onto the bullish MAXCPs, CAT and
NVDA. The DJI and the
big ETFs are not the real story at this time.
The FED probably would like for the
DJI and SP-500 to pull back. Thst would
help it fight inflation.
Afterall, the FED seems bound to try to lower the 5%-6%
annual rate of inflation and it
seems ready enough to raise interest rates above 5%,
especially given the very low rate
of unemployment and the residual economic
strength.
The interest rate bears' selling is
also holding back most NYSE dividend stocks, bonds
and bond funds. But Peerless
remains on its Buys in keeping with the usually very
bullish seasonality of the the
third year in the four-year Presidential cycle. Going back
more than one hundred years, one
finds the third year averaging a DJI gain of almost
3x what it is in other years.
Thus -the DJI's stalemated momentum.
But an epic battle is going on
under the surface of the market. Most observers see
the sleepiness of the DJI and give
a "ho-hum" response. Let me try to change that.
Many of the DJI blue chips are
secure but also very stodgy. In this, their dull
collective behavior fails to tell
us now how bullish Professionals are at this juncture.
See below how the openings are weak
but the Professionals are busy buying all day.
Today, the Closing Powers for most
of the key ETFs and many of the leading tech
stocks scored new highs, way
ahead of the the DJI or the ETFs they represent.
Historically, this commonly occurs
at the start of major bull markets. Our mulltiple
Peerless Buy signals and the
bullish seasonality say the same thing. So, does the
weakness in gold at these
junctures. And Tables 2 and 3, too.
Now look at the leaders in our
tables below. They are the semi-conductors. Nearly all
of them are above their 65-dma.
Many are very strong. As speculative stocks, traders
would not be so busy buying
"semis" if they did not sense a tech take-off is occurring, no
matter what the DJI is doing.
At the center of the take-off is
artificial intelligence. Chip-makers like NVDA
have found ways to incorporate not
just fixed rules, but ways to allow for
devices to learn better ways of
performing as they funcion. Now MSFT
has created a new, interactive Bing
that is more powerful than anything
GOOGLE has. Read about the
amazing "Sydney" in the lentgthy piece tonight.
in the NY Times. But read
also about its dark Jungian side. The NY Times writer
quotes its declaration of love to
the writer, even suggesting that he divorce his wife
so as to be with Bing more.
It will take some time to read the "word for word"
conversation, but this may be the
future if we are not very careful. Should
we trust MSFT?
https://www.nytimes.com/2023/02/16/technology/bing-chatbot-microsoft-chatgpt.html
and https://www.theverge.com/23599441/microsoft-bing-ai-sydney-secret-rules
and especially
https://www.nytimes.com/2023/02/16/technology/bing-chatbot-microsoft-chatgpt.html
|
|
| |
Charts - 2/15/2023
2022 PEERLESS DJI, Signals, Indicators Daily DJI Volume
10-DayUp/Down Vol Stoch-20 CCI RSI Pct of All Stocks above 65-dma
Inverted Traders Index
DJI-IPA DJI-OBV Short-Term Rates
NASDAQ S&P OEX NYSE DJ-15 DJ-20 DJI-30 Bond Funds
DIA QQQ SPY IWM new - COIN (Bit Coin ETF)
Gold Stocks
Semi Conductors
TNA Short-Term Rates Ten Year Rates PST (Short Treasuries)
DOLLAR-UUP
ALLSTOCKs
Russell-1000
Insurance-Stocks
Recent 2006 vers-Peerless signals
http://www.tigersoftware.com/OLDPEER/UPD90215.bmp
MDY - http://www.tigersoftware.com/CHARTX/MDY.GIF
USO-CrudeOil DBO FAS GLD HD IBB JETS JNUG KOL NAIL NUGT NRGU OIH
PALL RSX RETL SDS AGQ SLV SOXL TAN TECL TLT TMF TNA UGA USO
China:
YINN CHAU
Commodities: CANE
CORN DBC JJC, NIB CORN, CUT (paper)
MOO, NRGU
SOYB WEAT UUP (Dollar) LIT
(Lithium) PALL
(Palladium)
Stocks AA AAPL ADBE ALXN AMAT AMGN AMD AMZN AXP BA BABA
BAC BIDU BLDP CAT CHKP CNX CPB CRM CVX CMG DE DIS ENPH FB FSLR
FTNT GILD GME GOOG GS HD IBM INTU JPM KO KR LRCX MRK MRNA
MOS MSFT NEM NFLX NKE NOC NUE NVDA PANW PG PYPL REGN REV
SO QCOM QDEL TSLA TXN XOM V VRTX WFC WMT XLE ZM ZOM
Leveraged Short ETFs:
FAZ - financials, TZA and SRTY- small caps, MZZ - mid caps, TECS -Techs,
SOXS -
semi-conductors LABD
- Biotechs
Bullish MAXCPs www.tigersoftware.com/UPPING/2-15-2023/Bullish.htm
Bearish MINCPs www.tigersoftware.com/Downing/2-15-2023/BEARISH.htm
|
|
 |
 |
 |
 |
 |
 |
 |
 |
 |
 |
 |
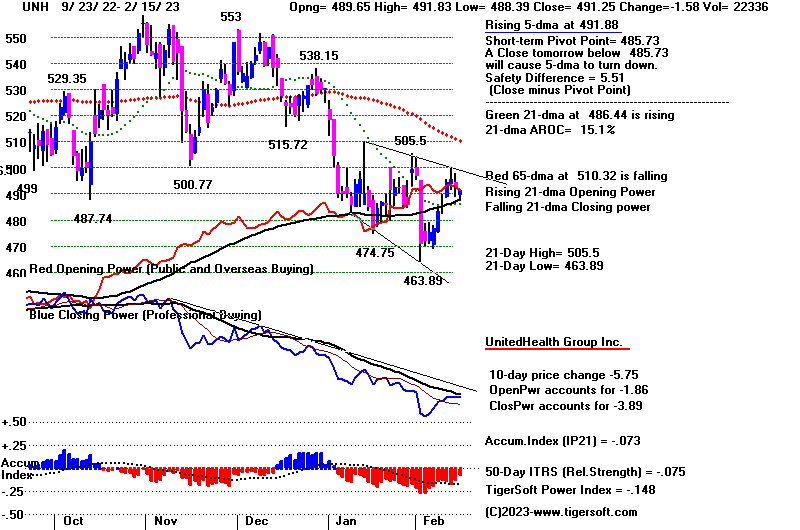 |
Table 1 - Daily Volume and Breadth Statistics
| NYSE |
Latest Close |
Previous
Close |
Week Ago |
| Issues
traded |
3,194 |
3,196 |
3,180 |
| Advances |
1,780 |
1,483 |
1,009 |
| Declines |
1,297 |
1,574 |
2,045 |
| Unchanged |
117 |
139 |
126 |
| New
highs |
83 |
102 |
66 |
| New
lows |
7 |
12 |
6 |
| Adv.
volume* |
516,972,109 |
406,667,738 |
231,629,956 |
| Decl.
volume* |
304,805,423 |
408,752,011 |
568,195,050 |
| Total
volume* |
831,716,755 |
833,908,294 |
807,339,124 |
| Closing
Arms (TRIN)† |
0.73 |
0.81 |
1.02 |
| Block
trades* |
4,473 |
4,124 |
4,166 |
| Adv.
volume |
2,625,091,245 |
2,060,295,306 |
1,294,268,376 |
| Decl.
volume |
1,404,290,655 |
1,771,869,612 |
2,683,364,342 |
| Total
volume |
4,075,983,812 |
3,929,202,033 |
4,029,826,471 |
| NASDAQ |
Latest Close |
Previous
Close |
Week Ago |
| Issues
traded |
4,797 |
4,752 |
4,785 |
| Advances |
2,870 |
2,109 |
1,419 |
| Declines |
1,676 |
2,409 |
3,141 |
| Unchanged |
251 |
234 |
225 |
| New
highs |
91 |
86 |
100 |
| New
lows |
63 |
83 |
47 |
| Closing
Arms (TRIN)† |
0.87 |
0.64 |
1.05 |
| Block
trades |
33,599 |
31,940 |
33,782 |
| Adv.
volume |
3,333,606,989 |
2,858,962,187 |
1,506,920,076 |
| Decl.
volume |
1,694,530,007 |
2,097,172,205 |
3,513,337,901 |
| Total
volume |
5,056,647,624 |
5,032,435,049 |
5,052,872,994 |
|
Table 2 QUICKSILVER on ETFS - 2/15/2023 ---
     Bullish = 9  +4           COMPQX, SPY,  QQQ, MDY, IWM, FAS, SOXL, TEXL,
                               YINN (highest 0.361)
     Bearish = 0
ETF CLOSE CHANGE PIVOT-PT 5-dma AROC CL-PWR CANDLE IP21 ITRS POWER INDEX
================================================================================================
DIA 341.66 .52 337.08 33% Bullish BLUE .204 0 ----
---------------------------------------------------------------------------------------------
COMPQX 12070.59 110.44 11789.58 67.5% Bullish BLUE .246 .062 .308
---------------------------------------------------------------------------------------------
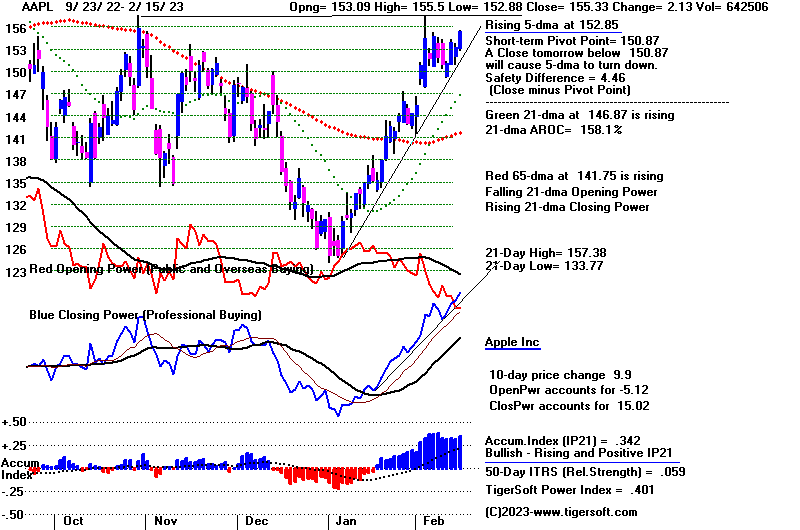
SPY 413.98 1.34 407.09 40.6% Bullish BLUE .233 .026 .259
---------------------------------------------------------------------------------------------
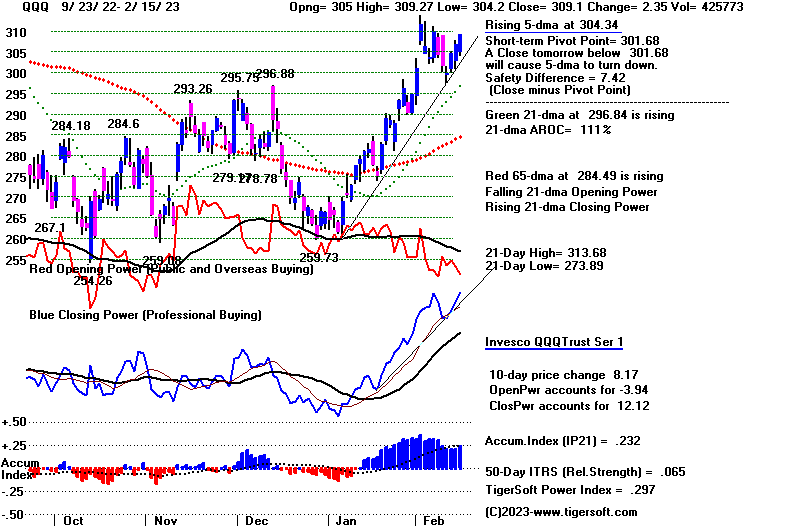
QQQ 309.1 2.35 301.68 77.9% Bullish BLUE .232 .066 .298
---------------------------------------------------------------------------------------------
MDY 490.59 3.24 480.2 46.8% Bullish BLUE .204 .053 .257
---------------------------------------------------------------------------------------------
IWM 194.46 1.95 189.93 45.4% Bullish BLUE .252 .043 .295
---------------------------------------------------------------------------------------------
FAS 89.5 .43 86.6 -20.3% Bullish BLUE .233 .056 .289
---------------------------------------------------------------------------------------------
RETL 11.27 .77 10.2 260.4% Bullish BLUE .086 .199 .285
---------------------------------------------------------------------------------------------
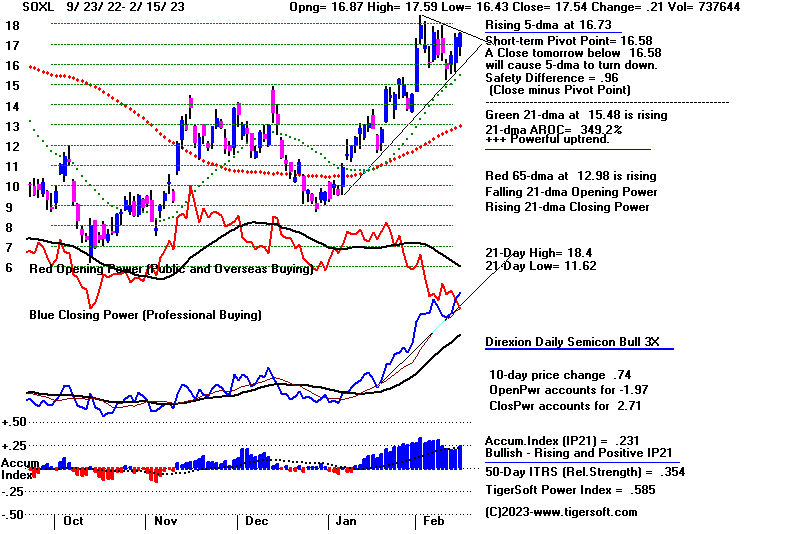
SOXL 17.54 .21 16.58 317.7% Bullish BLUE .231 .355 .586
---------------------------------------------------------------------------------------------
TECL 33.17 .52 31.28 222% Bullish BLUE .232 .152 .384
---------------------------------------------------------------------------------------------
IBB 133.77 0 132.4 16.5% Bullish BLUE .223 -.025 .198
---------------------------------------------------------------------------------------------
GLD 170.89 -1.72 173.03 -101.6% Bearish BLUE .062 .031 .093
---------------------------------------------------------------------------------------------
DBO 15.14 -.05 14.86 39.7% ------- BLUE .059 -.026 .033
---------------------------------------------------------------------------------------------
OIH 326.13 -4.59 317.69 -44% Bullish RED .131 .067 .198
---------------------------------------------------------------------------------------------
CPER 24.52 -.38 24.75 -10.1% ------- BLUE 0 .061 .061
---------------------------------------------------------------------------------------------
TAN 79.04 2.51 76.4 66.4% ------- BLUE .109 -.047 .062
---------------------------------------------------------------------------------------------
UUP 28.07 .19 27.89 25.1% Bullish ---- .009 .003 .012
---------------------------------------------------------------------------------------------
CORN 26.53 -.18 26.34 -15% ------- RED -.183 .035 -.148
---------------------------------------------------------------------------------------------
WEAT 7.82 -.15 7.71 19% Bullish RED .036 .021 .057
---------------------------------------------------------------------------------------------
YINN 52.82 -1.42 58.33 -214.1% Bearish BLUE .149 .148 .297
|
 Table 3      RANKING OF KEY DIRECTORIES BASED PCT.OF STOCKS ABOVE 65-DMA
              2/15/23
 Bullish = 44
 Bearish = 5
---------------------------------------------------------------------------------------
Directory     Current       day-1         day-2         day-3         day-4         day-5
----------------------------------------------------------------------------------------
COPPER         1             .857          .857          .857          1             1
EDU            1             1             1             1             1             1
HOMEBLDG       .888          .888          .944          .888          .888          .944
               =====
INFRA          .878          .878          .848          .848          .878          .878
BIGBANKS       .857          .857          .857          .857          .857          .857
SEMI           .851          .851          .829          .819          .829          .872
               =====
JETS           .846          .846          .846          .846          .846          .846
TRANSP         .842          .789          .842          .842          .789          .842
NIFTY          .84           .772          .818          .75           .75           .75
COAL           .833          .5            .333          .5            .333          .333
ELECTRON       .812          .796          .796          .789          .781          .827
SOFTWARE       .803          .767          .767          .767          .803          .821
REIT           .784          .784          .869          .792          .723          .838
ETFS           .781          .8            .836          .781          .818          .781
NASD-100       .78           .72           .76           .69           .68           .69
               =====
HIGHPRIC       .779          .761          .787          .731          .727          .766
AUTO           .773          .754          .792          .735          .792          .83
CHINA          .772          .704          .772          .727          .772          .795
RUS-1000       .753          .732          .749          .707          .699          .743
               =====
CHEM           .744          .72           .72           .674          .651          .79
GAMING         .736          .736          .736          .736          .578          .631
MILITARY       .73           .692          .73           .692          .538          .615
FINANCE        .725          .737          .762          .725          .725          .775
GREEN          .722          .722          .666          .555          .722          .777
GUNS           .714          .642          .785          .714          .642          .785
INDEXES        .713          .708          .729          .724          .724          .729
BONDFUND       .712          .793          .827          .793          .908          .908
RETAIL         .702          .638          .659          .595          .574          .638
SP500          .686          .67           .706          .651          .629          .678
               =====
INDMATER       .68           .652          .638          .638          .583          .708
INSURANC       .68           .72           .88           .8            .72           .88
FIDSTKS        .656          .639          .68           .633          .597          .662
COMPUTER       .65           .6            .7            .65           .55           .65
HOSPITAL       .642          .571          .571          .571          .571          .571
HACKERS        .625          .625          .625          .625          .625          .687
BEVERAGE       .571          .428          .428          .357          .428          .428
SP-100         .566          .6            .622          .544          .522          .566
SOLAR          .562          .437          .5            .375          .375          .5
LOWPRICE       .547          .544          .541          .555          .558          .595
OILGAS         .542          .6            .58           .571          .409          .466
DOWJONES       .533          .5            .6            .466          .433          .5
               =====
BIOTECH        .531          .534          .565          .534          .559          .613
REGBANKS       .52           .48           .48           .48           .44           .56
FOOD           .51           .612          .571          .571          .469          .551
===============================================================================================
COMODITY       .487          .564          .512          .538          .435          .538
DJI-13         .307          .307          .461          .307          .307          .461
GOLD           .26           .347          .326          .391          .413          .608
MARIJUAN       .2            .2            .2            .2            .2            .1
UTILITY        .184          .131          .21           .131          .105          .184
|
===================================================================================
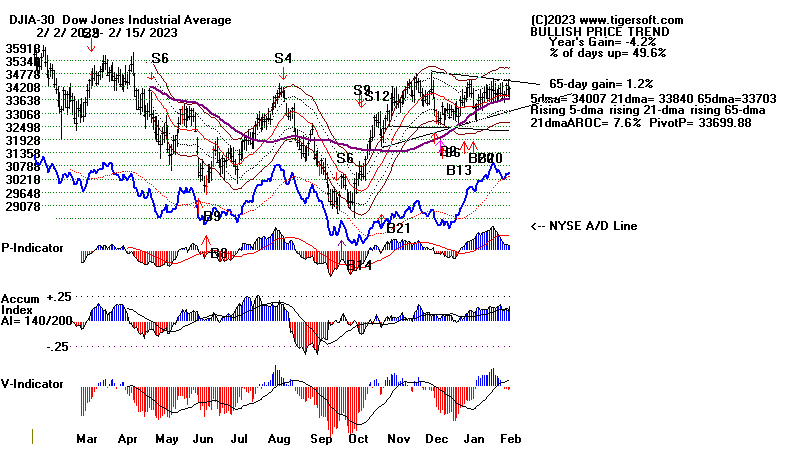
Wednesday 2/15: 6:15 AM Futures: DJI -74 NASDAQ -60 Data
Used 2-14-2023:
| |
2-14-2023
|
|
| |
The CPI number
just out warns it will be longer than expected before Inflation is
back down to 3%. This
news killed the DJI's attempt to lead the market higher.
So, another testing of
support is needed. The immediate support just below
is at its rising 65-dma and
its 21-dma. The bullish seasonality, rising Closing
Powers and Peerless Buys
should be able to hold the DJI up in its present
trading range. But
backing and filling like it is doing creates a tension and
often prepares the way for a
swift vertical move when the breakout or breakdown
does finally occur. If
the recent support fails, look for the DJI to fall to its lower band.
A new Buy B9 wuld then be
expected and be where we should take new ETF
positions. Meanwhile,
stick with the Bullish MAXCPs.
More extended version of HL tonight.
Peerless Remains
on its Buys but another pullback is shaping up. 35000
is important
support. Below that is the lower band of the DJI, around 32600.
For now, the 34500
resistance appears too much for the DJI.
Pulling back from
overhead resistance with weakening breadth and volume.
But no Peerless
Sell less than one percent below. For almost three weeks it
has been stuck in
a narrow range betweem 33500 and 35300, bouncing
back and forth
five or six times. Point and figure chartists can hardly wait for
a breakout because
this many reversals in a narrow range regulary bring a
very quick and
sizeable vertical move in whichever way it breaks out. Which
way now?
The weak OBV Lines
especially for the SP-500 and OEX argue against an
upside breakout as
does the breaking of the uptrends for the key internal
strength
indicators shown on our Peerless chart. Ordinarily, if the DJI were
about to be stage
a sell-off, we would also so a number of head/shoulders
top patterns among
the individual DJI stocks. Only CAT fits that description
now.
Otherwise, as I said recently, among the higher priced (more heavily
weighted) DJI
stocks there are about as many in good-looming uptrends
(AXP, CA, CRM, GS,
JM and V) as those in clear downtrends (AMGN,
CVX, JNJ, MMM, PG
and UNH).
And the bulls have
the usually reliable Closing Powers, seasonality and
Peerless signals
on their side. Moreover, 69% of all stocks are bullishly
above their
65-dma. So, what a trader to do? Without more bearish MINCPs,
it's hard to
advise any short-selling. Mostly, I have said look to the bullish
special situations
for upside trades and wait for a new Peerless Buy signal
near the lower
band to buy the major market ETFs. The jump in NVDA
today would seem
to justify that approach. But sell CAT if it closes below
its H/S
neckline.
The CPI number
yesterday that it will take longer than many expected
for the FED to
bring back inflation under 3%. Almost certainly, interest
rates will be
raised to 5% in March and then even higher. That is not
a scenario that in
the past permits a new bull market. If we are not going
to get a new bull
market, it means longs will have to be taken for trading
purposes.
And that will be where the trendlines of our Closing Powers
and Day Traders'
Tool should help us.
|
|
| |
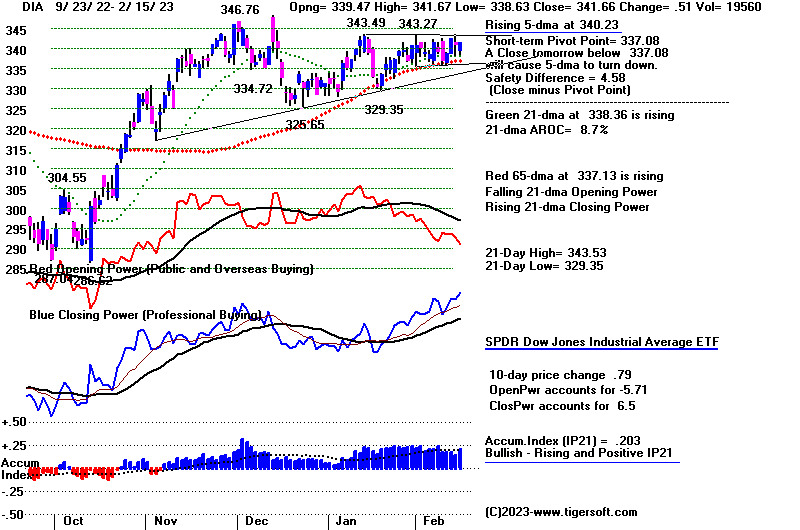
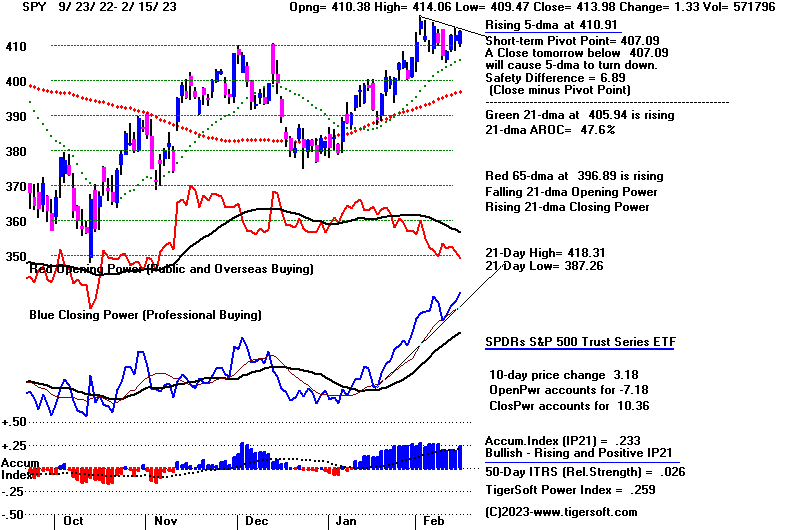
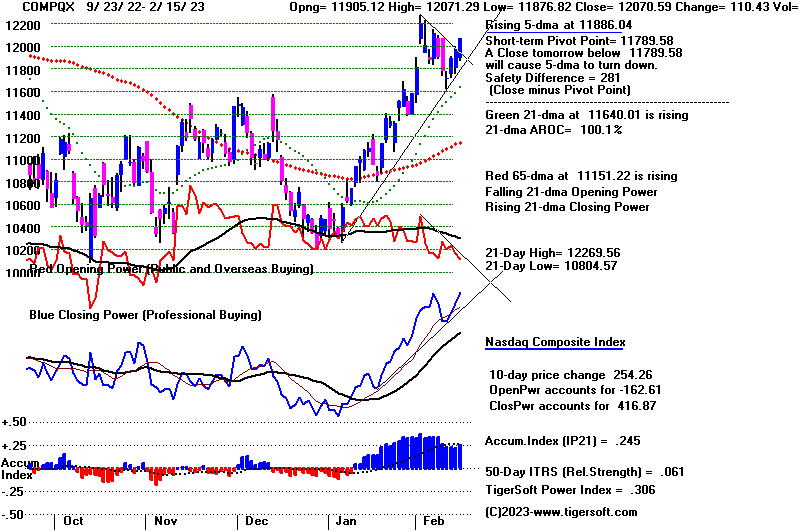
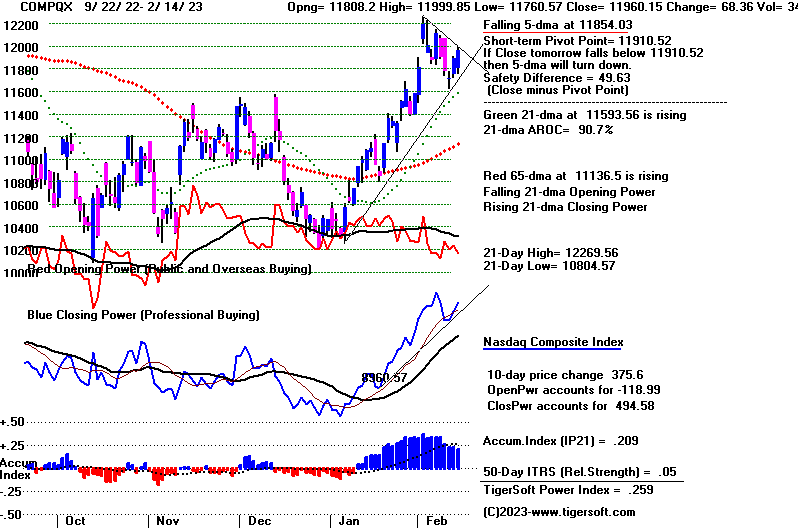
Charts - 2/14/2023
2022 PEERLESS DJI, Signals, Indicators Daily DJI Volume
10-DayUp/Down Vol Stoch-20 CCI RSI Pct of All Stocks above 65-dma
Inverted Traders Index
DJI-IPA DJI-OBV Short-Term Rates
NASDAQ S&P OEX NYSE DJ-15 DJ-20 DJI-30 Bond Funds
DIA QQQ SPY IWM new - COIN (Bit Coin ETF)
Gold Stocks
Semi Conductors
TNA Short-Term Rates Ten Year Rates PST (Short Treasuries)
DOLLAR-UUP
ALLSTOCKs
Russell-1000
Insurance-Stocks
Recent 2006 vers-Peerless signals
http://www.tigersoftware.com/OLDPEER/UPD90214.bmp
MDY - http://www.tigersoftware.com/CHARTX/MDY.GIF
USO-CrudeOil DBO FAS GLD HD IBB JETS JNUG KOL NAIL NUGT NRGU OIH
PALL RSX RETL SDS AGQ SLV SOXL TAN TECL TLT TMF TNA UGA USO
China:
YINN CHAU
Commodities: CANE
CORN DBC JJC, NIB CORN, CUT (paper)
MOO, NRGU
SOYB WEAT UUP (Dollar) LIT
(Lithium) PALL
(Palladium)
Stocks AA AAPL ADBE ALXN AMAT AMGN AMD AMZN AXP BA BABA
BAC BIDU BLDP CAT CHKP CNX CPB CRM CVX CMG DE DIS ENPH FB FSLR
FTNT GILD GME GOOG GS HD IBM INTU JPM KO KR LRCX MRK MRNA
MOS MSFT NEM NFLX NKE NOC NUE NVDA PANW PG PYPL REGN REV
SO QCOM QDEL TSLA TXN XOM V VRTX WFC WMT XLE ZM ZOM
Leveraged Short ETFs:
FAZ - financials, TZA and SRTY- small caps, MZZ - mid caps, TECS -Techs,
SOXS -
semi-conductors LABD
- Biotechs
Bullish MAXCPs www.tigersoftware.com/UPPING/2-14-2023/Bullish.htm
Bearish MINCPs www.tigersoftware.com/Downing/2-14-2023/BEARISH.htm
|
|
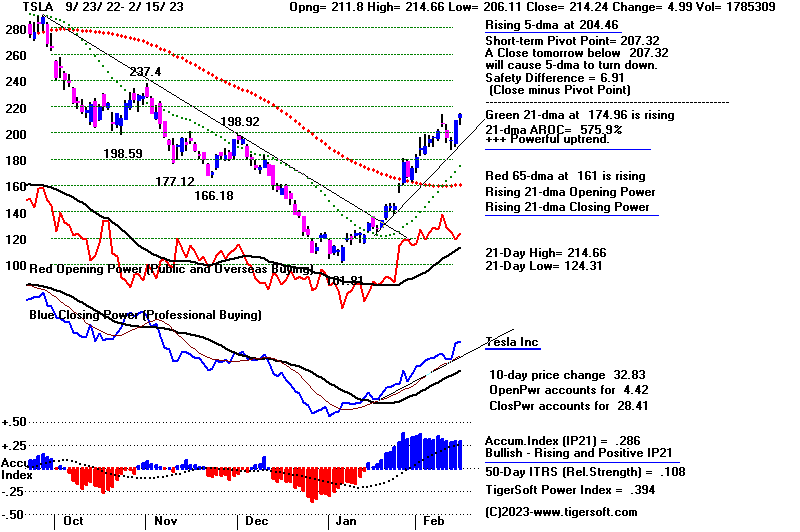
DJIA -
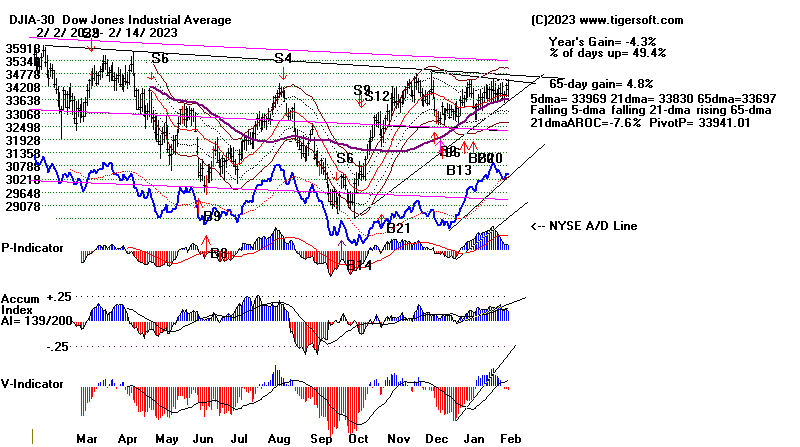 |
Closing Power is still uptrending for DIA
|
Closing Power is still uptrending for NASDAQ
 |
Closing Power is still uptrending for SPY
 |
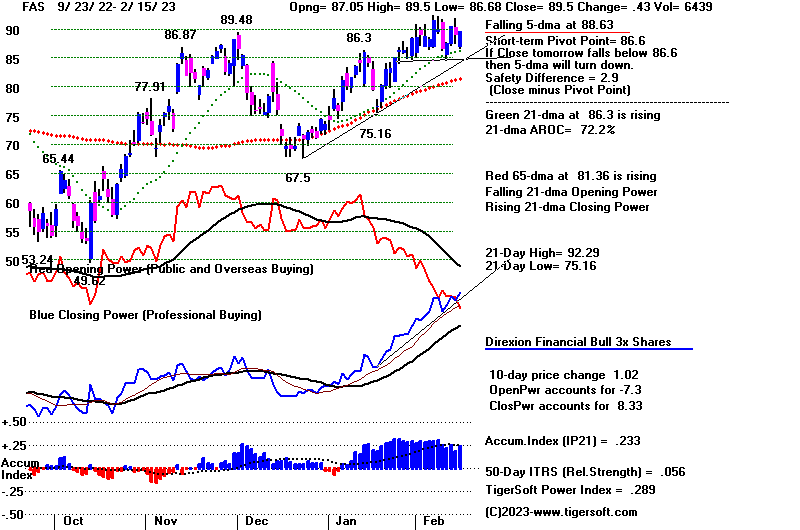
FAS was unable to breakout past flat resistance, but its Closing Power is still rising.
|
QQQ - Closing Power still rising
|
NVDA regains its leadership role among biggest SP-500 stocks.
|
Daily Breadth and Volume Statistics
| NYSE |
Latest Close |
Previous
Close |
Week Ago |
| Issues
traded |
3,196 |
3,187 |
3,174 |
| Advances |
1,483 |
2,336 |
1,909 |
| Declines |
1,574 |
735 |
1,154 |
| Unchanged |
139 |
116 |
111 |
| New
highs |
102 |
87 |
85 |
| New
lows |
12 |
13 |
8 |
| Adv.
volume* |
406,667,738 |
595,284,360 |
583,612,732 |
| Decl.
volume* |
408,752,011 |
164,132,676 |
312,304,307 |
| Total
volume* |
833,908,294 |
772,189,005 |
903,159,697 |
| Closing
Arms (TRIN)† |
0.81 |
0.98 |
0.99 |
| Block
trades* |
4,124 |
4,017 |
4,357 |
| Adv.
volume |
2,060,295,306 |
2,581,048,062 |
2,700,045,339 |
| Decl.
volume |
1,771,869,612 |
797,385,387 |
1,620,767,045 |
| Total
volume |
3,929,202,033 |
3,448,628,150 |
4,355,866,857 |
| NASDAQ |
Latest Close |
Previous
Close |
Week Ago |
| Issues
traded |
4,752 |
4,808 |
4,747 |
| Advances |
2,109 |
2,856 |
2,641 |
| Declines |
2,409 |
1,704 |
1,862 |
| Unchanged |
234 |
248 |
244 |
| New
highs |
86 |
81 |
103 |
| New
lows |
83 |
67 |
43 |
| Closing
Arms (TRIN)† |
0.64 |
0.85 |
0.93 |
| Block
trades |
31,940 |
31,168 |
37,522 |
| Adv.
volume |
2,858,962,187 |
3,124,372,012 |
3,428,905,139 |
| Decl.
volume |
2,097,172,205 |
1,582,559,693 |
2,238,240,997 |
| Total
volume |
5,032,435,049 |
4,752,885,418 |
5,720,245,945 |
|
Table 2 QUICKSILVER on ETFS - 2/14/2023 ---
     Bullish = 5  -3           COMPQX,  QQQ,    SOXL, TEXL,
                               YINN (highest 0.361)
     Bearish = 0
ETF       CLOSE   CHANGE    PIVOT-PT    5-dma AROC    CL-PWR  CANDLE  IP21   ITRS   POWER INDEX
================================================================================================
DIA       341.14  -1.41      339.42       -5.6%      Bullish  RED    .138    0         ----
---------------------------------------------------------------------------------------------
COMPQX    11960.15   68.36   11910.52     -64.6%     Bullish  BLUE   .209    .051     .26
---------------------------------------------------------------------------------------------
SPY       412.64  -.19       410.65       -31%       Bullish  BLUE   .178    .022     .2
---------------------------------------------------------------------------------------------
QQQ       306.75   2.25      304.37       -51.5%     Bullish  BLUE   .204    .054     .258
---------------------------------------------------------------------------------------------
MDY       487.35   .24       486.06       -47.1%     Bullish  BLUE   .154    .047     .201
---------------------------------------------------------------------------------------------
IWM       192.51  -.09       192.72       -79.9%     Bullish  BLUE   .198    .039     .237
---------------------------------------------------------------------------------------------
FAS       89.07  -1.34       89.86        -132.9%    Bullish  RED    .187    .037     .224
---------------------------------------------------------------------------------------------
RETL      10.5  -.04         10.73        -342.4%    Bullish  BLUE   .032    .147     .179
---------------------------------------------------------------------------------------------
SOXL      17.33   .91        16.49        -78.4%     -------  BLUE   .198    .293     .491
---------------------------------------------------------------------------------------------
TECL      32.65   .31        31.76        -48.7%     Bullish  BLUE   .203    .114     .317
---------------------------------------------------------------------------------------------
IBB       133.77  -.41       133.33       -95.3%     Bullish  BLUE   .199   -.015     .184
---------------------------------------------------------------------------------------------
GLD       172.61   .13       174.41       -39.5%     Bearish  BLUE   .023    .038     .061
---------------------------------------------------------------------------------------------
DBO       15.19   .02        15.02         116.4%    -------  BLUE   .037   -.035     .002
---------------------------------------------------------------------------------------------
OIH       330.72  -.72       329.01        105.1%    Bullish  BLUE   .127    .102     .229
---------------------------------------------------------------------------------------------
CPER     24.9   .18          24.57         32.5%     -------  BLUE  -.024    .097     .073
---------------------------------------------------------------------------------------------
TAN     76.53  -.55          78.02        -154.7%    Bearish  BLUE   .06   -.051     .009
---------------------------------------------------------------------------------------------
UUP       27.88  -.02        27.93        -3.6%      Bullish  ----   .083   -.004     .079
---------------------------------------------------------------------------------------------
CORN      26.71  -.06        26.61         39.5%     Bullish  RED   -.075    .03    -.045
---------------------------------------------------------------------------------------------
WEAT      7.97  -.02         7.79          191.5%    Bullish  ----   .112    .018     .13
---------------------------------------------------------------------------------------------
YINN      54.24  -1.6        55.19        -288.4%    Bearish  BLUE   .074    .271     .345
|
Table 3       RANKING OF KEY DIRECTORIES BASED PCT.OF STOCKS ABOVE 65-DMA
              2/14/23
---------------------------------------------------------------------------------------
Directory     Current       day-1         day-2         day-3         day-4         day-5
----------------------------------------------------------------------------------------
EDU            1             1             1             1             1             1
HOMEBLDG       .888          .944          .888          .888          .944          .944
               =====
INFRA          .878          .848          .848          .878          .878          .909
BIGBANKS       .857          .857          .857          .857          .857          .857
COPPER         .857          .857          .857          1             1             1
SEMI           .851          .829          .819          .829          .861          .914
               =====
JETS           .846          .846          .846          .846          .846          .846
ETFS           .8            .836          .781          .818          .8            .8
ELECTRON       .796          .796          .789          .781          .819          .864
BONDFUND       .793          .827          .793          .908          .919          .885
TRANSP         .789          .842          .842          .789          .842          .842
REIT           .784          .861          .8            .73           .83           .876
NIFTY          .772          .818          .75           .75           .75           .818
SOFTWARE       .767          .785          .767          .803          .821          .857
HIGHPRIC       .761          .787          .731          .727          .77           .813
AUTO           .754          .811          .735          .792          .83           .83
FINANCE        .737          .762          .725          .712          .775          .75
GAMING         .736          .736          .684          .631          .631          .789
RUS-1000       .732          .749          .707          .699          .744          .784
               =====
GREEN          .722          .666          .555          .722          .777          .888
CHEM           .72           .72           .674          .651          .79           .744
INSURANC       .72           .88           .8            .72           .88           .88
NASD-100       .72           .76           .69           .68           .69           .76
              ======
INDEXES        .708          .729          .724          .724          .729          .756
CHINA          .704          .772          .727          .772          .795          .818
MILITARY       .692          .73           .692          .538          .615          .615
SP500          .67           .706          .653          .625          .682          .719
               =====
INDMATER       .652          .638          .638          .583          .708          .736
GUNS           .642          .785          .714          .642          .785          .785
FIDSTKS        .639          .68           .633          .597          .662          .692
RETAIL         .638          .659          .595          .574          .638          .702
HACKERS        .625          .625          .625          .625          .687          .687
FOOD           .612          .571          .551          .469          .551          .571
COMPUTER       .6            .7            .65           .55           .65           .7
OILGAS         .6            .58           .571          .409          .466          .485
SP-100         .6            .622          .544          .522          .566          .611
HOSPITAL       .571          .571          .571          .571          .571          .571
COMODITY       .564          .512          .512          .435          .538          .564
LOWPRICE       .544          .544          .558          .558          .598          .627
BIOTECH        .534          .562          .536          .559          .61           .661
===============================================================================================
COAL           .5            .333          .5            .333          .333          .333
DOWJONES       .5            .6            .466          .433          .5            .566
===============================================================================================
REGBANKS       .48           .48           .48           .44           .56           .64
SOLAR          .437          .5            .375          .375          .5            .625
BEVERAGE       .428          .428          .357          .428          .428          .5
GOLD           .347          .326          .391          .413          .608          .739
DJI-13         .307          .461          .307          .307          .461          .461
MARIJUAN       .2            .2            .2            .2            .1            .1
UTILITY        .131          .21           .131          .105          .184          .421
|
===================================================================================
Tuesday 2/14: 6:10 AM Futures:
DJI +32 NASDAQ
-7 Data Used 2-13-2023:
| |
2-13-2023
|
|
| |
|
|
02/14/2023 |
In January, the Consumer Price Index for All Urban
Consumers increased 0.5 percent, seasonally adjusted, and rose 6.4 percent over the last
12 months, not seasonally adjusted. The index for all items less food and energy increased
0.4 percent in January (SA); up 5.6 percent over the year (NSA).
US
Labor Dept's monthly CPI Report. |
Inflation is still with us.
The DJI seems to have taken over the market's leadership
as traders grow cautious
about how much higher rates may go. As you can see from
the charts below, the DJI is
about 300 points from a breakout, less than 1%, the
other leading ETFs and
semi-conductors, in particular, are lagging more. So, it will
be up to Professionals at
this point to sustain the DJI rally into overhead resistance. The
best chance for a confirming
breakout would seem to be the big banks and FED.
Without mugh higher volume,
the advance is apt to narrow or require another pullback.
But we still have
multiple Peerless Buys, rising Closing Powers and bullish seasonality.
Be patient, there ought
to be substantially higher prices. No short selling. A handful
of Bullish MAXCPs
continue to rise almost day to day.
|
|
| |
Charts - 2/13/2023
2022 PEERLESS DJI, Signals, Indicators Daily DJI Volume
10-DayUp/Down Vol Stoch-20 CCI RSI Pct of All Stocks above 65-dma
Inverted Traders Index
DJI-IPA DJI-OBV Short-Term Rates
NASDAQ S&P OEX NYSE DJ-15 DJ-20 DJI-30 Bond Funds
DIA QQQ SPY IWM new - COIN (Bit Coin ETF)
Gold Stocks
Semi Conductors
TNA Short-Term Rates Ten Year Rates PST (Short Treasuries)
DOLLAR-UUP
ALLSTOCKs
Russell-1000
Insurance-Stocks
Recent 2006 vers-Peerless signals
http://www.tigersoftware.com/OLDPEER/UPD90213.bmp
MDY - http://www.tigersoftware.com/CHARTX/MDY.GIF
USO-CrudeOil DBO FAS GLD HD IBB JETS JNUG KOL NAIL NUGT NRGU OIH
PALL RSX RETL SDS AGQ SLV SOXL TAN TECL TLT TMF TNA UGA USO
China:
YINN CHAU
Commodities: CANE
CORN DBC JJC, NIB CORN, CUT (paper)
MOO, NRGU
SOYB WEAT UUP (Dollar) LIT
(Lithium) PALL
(Palladium)
Stocks AA AAPL ADBE ALXN AMAT AMGN AMD AMZN AXP BA BABA
BAC BIDU BLDP CAT CHKP CNX CPB CRM CVX CMG DE DIS ENPH FB FSLR
FTNT GILD GME GOOG GS HD IBM INTU JPM KO KR LRCX MRK MRNA
MOS MSFT NEM NFLX NKE NOC NUE NVDA PANW PG PYPL REGN REV
SO QCOM QDEL TSLA TXN XOM V VRTX WFC WMT XLE ZM ZOM
Leveraged Short ETFs:
FAZ - financials, TZA and SRTY- small caps, MZZ - mid caps, TECS -Techs,
SOXS -
semi-conductors LABD
- Biotechs
Bullish MAXCPs http://www.tigersoftware.com/UPPING/2-13-2023/BULLISH.htm
Bearish MINCPs http://www.tigersoftware.com/Downing/2-13-2023/BEARISH.htm
|
|
DJI is challenging its resistance again at 34500.
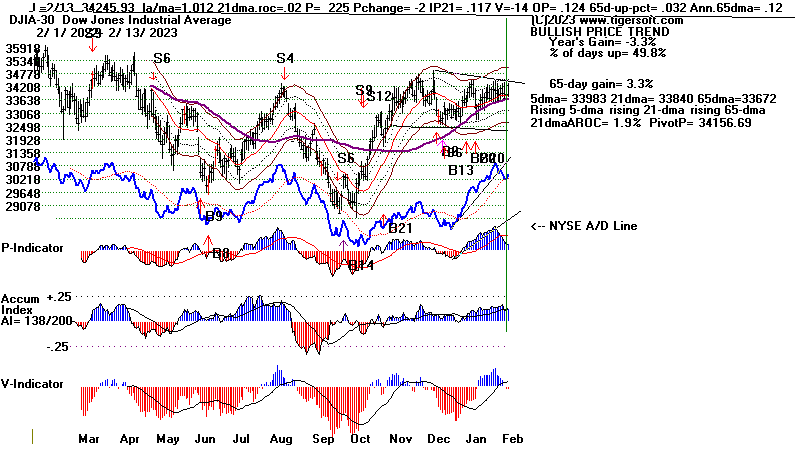 |
Opening Power and CLosing Power continue their struggle for dominance.
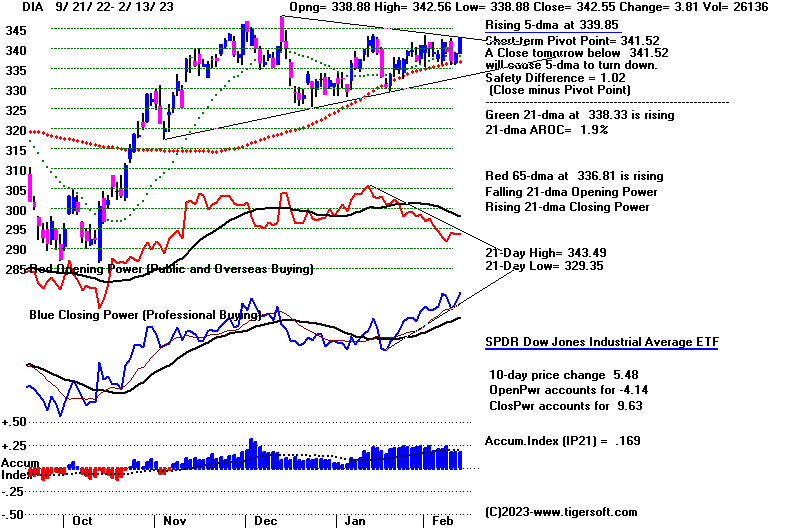 |
SPY has a well-controlled short-term price pattern.
Opening and Closing Power remain at war.
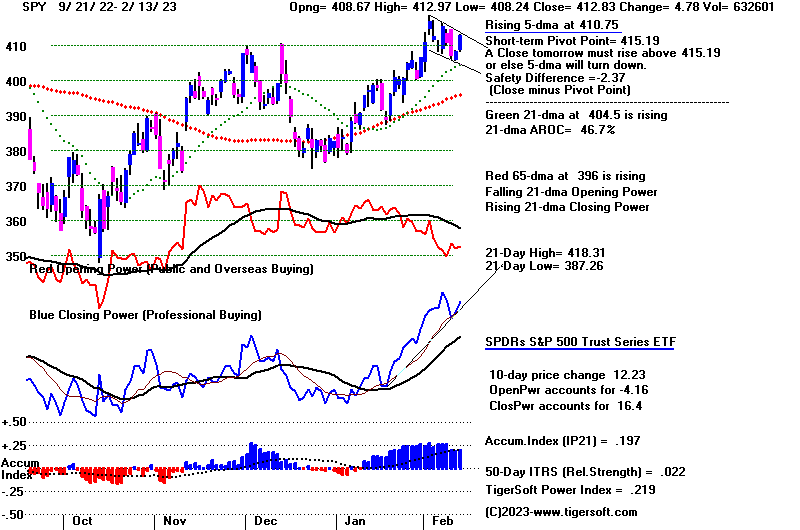 |
NASDAQ fell off its highs and is father from its recovery highs than DJI.
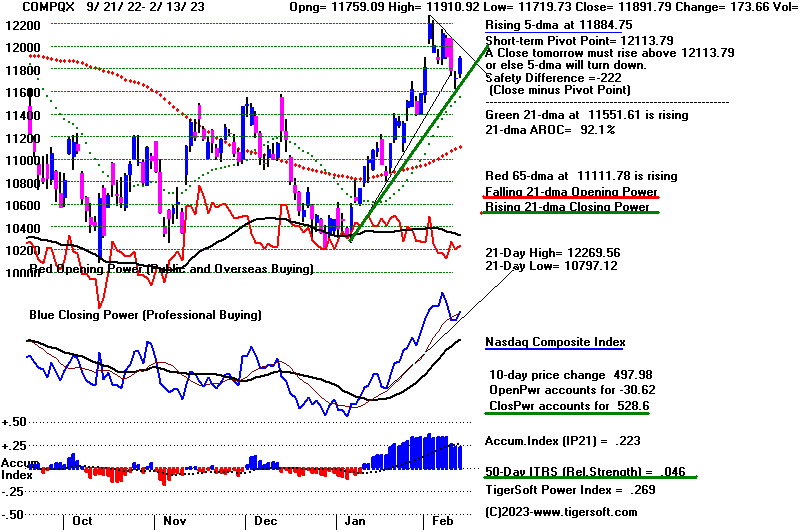 |
Opening and Closing Power remain at war. No new high can be made here
very easily.
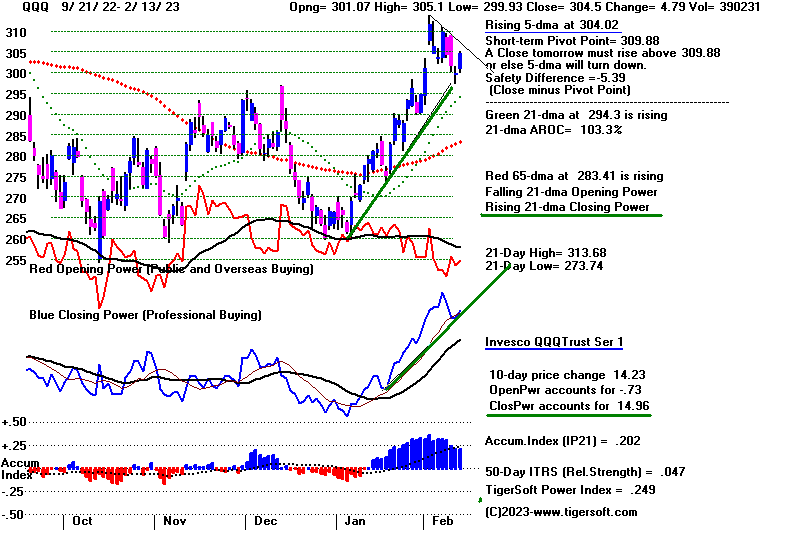 |
FAS might be expected to lead a breakout charge above resistance.
it needs to rise by more than 2 points.
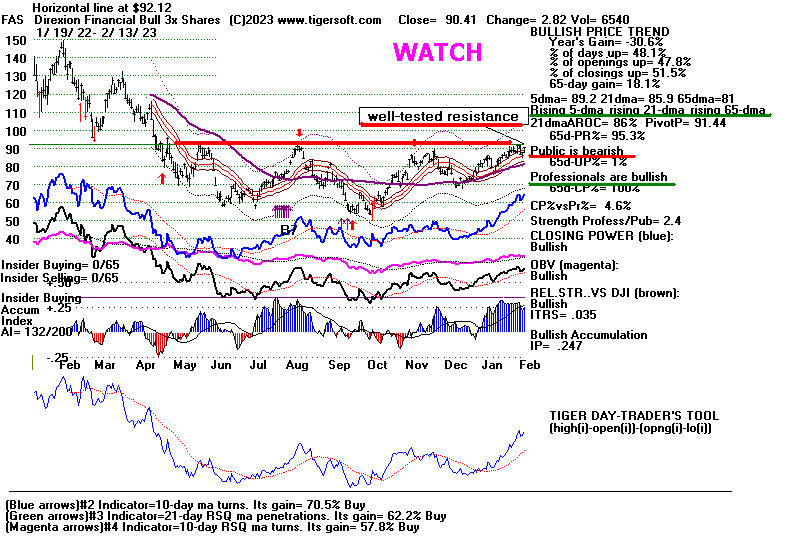 |
Opening and
Closing Power are at war. 2 points from making a recovery high.
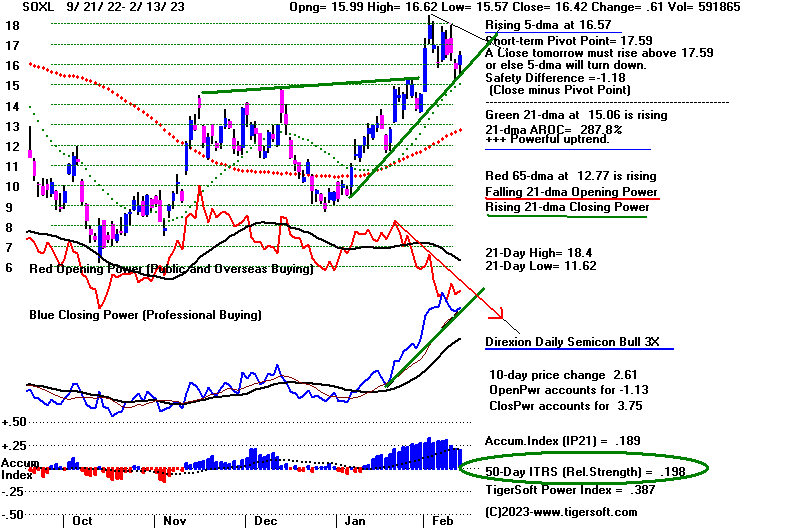 |
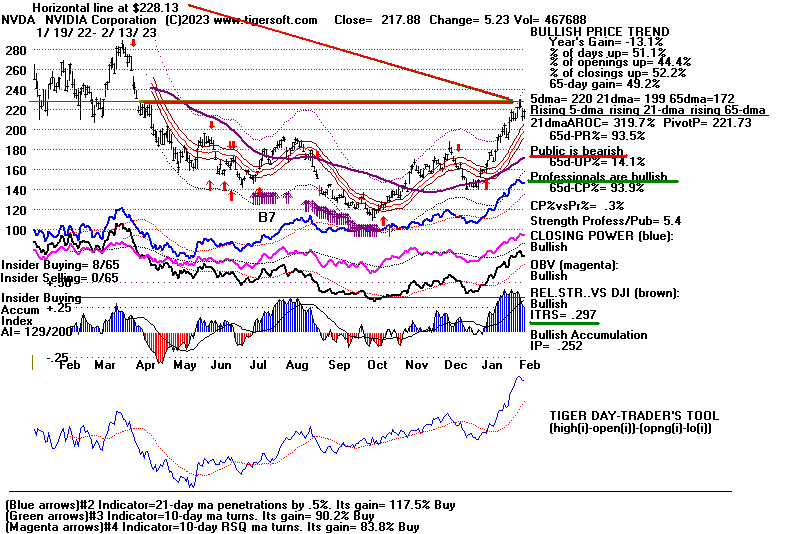 |
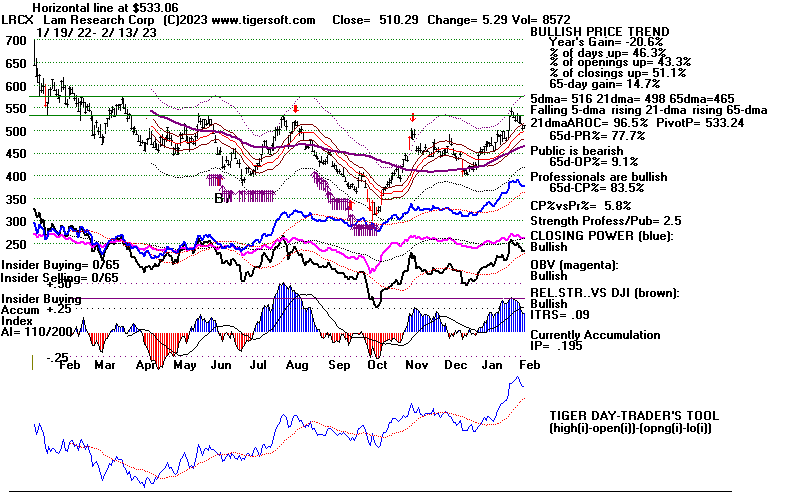 |
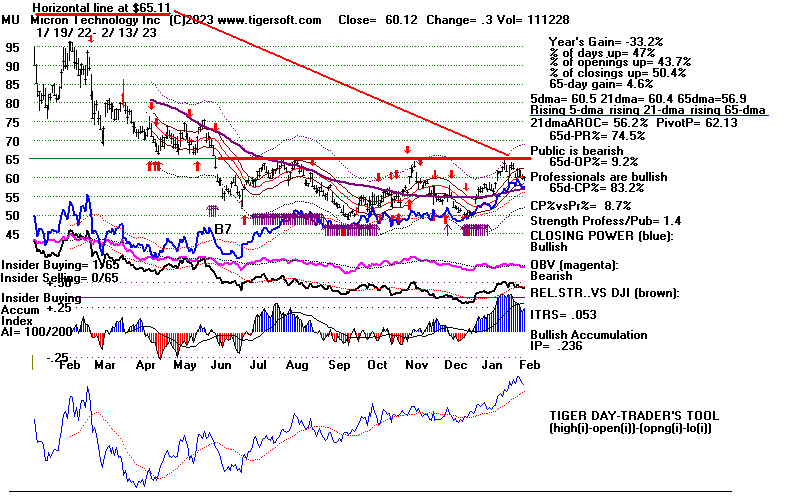 |
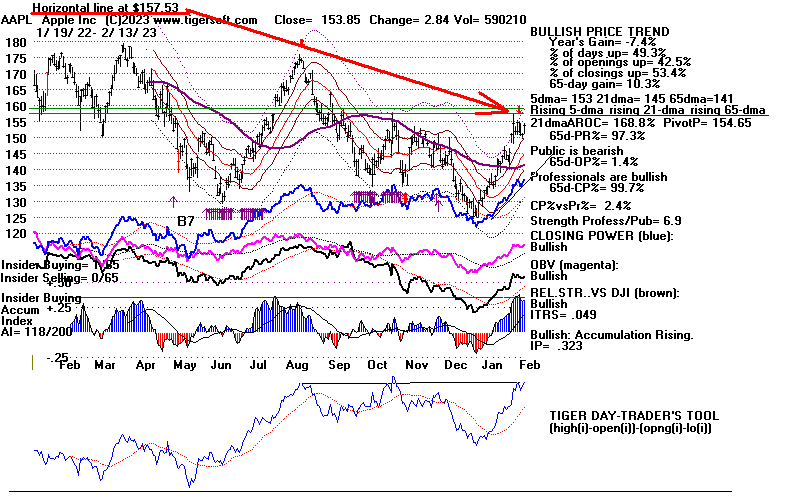 |
Table `1 - Daily Volume and Breadth Statistics
| NYSE |
Latest Close |
Previous
Close |
Week Ago |
| Issues
traded |
3,187 |
3,185 |
3,217 |
| Advances |
2,336 |
1,611 |
774 |
| Declines |
735 |
1,460 |
2,333 |
| Unchanged |
116 |
114 |
110 |
| New
highs |
87 |
42 |
61 |
| New
lows |
13 |
15 |
12 |
| Adv.
volume* |
595,284,360 |
463,218,833 |
235,068,186 |
| Decl.
volume* |
164,132,676 |
382,886,488 |
590,685,219 |
| Total
volume* |
772,189,005 |
854,346,415 |
845,054,157 |
| Closing
Arms (TRIN)† |
0.98 |
1.10 |
0.71 |
| Block
trades* |
4,017 |
4,556 |
4,121 |
| Adv.
volume |
2,581,048,062 |
1,933,410,992 |
1,281,548,784 |
| Decl.
volume |
797,385,387 |
1,921,136,685 |
2,730,038,009 |
| Total
volume |
3,448,628,150 |
3,891,524,118 |
4,114,244,066 |
| NASDAQ |
Latest Close |
Previous
Close |
Week Ago |
| Issues
traded |
4,808 |
4,773 |
4,783 |
| Advances |
2,856 |
1,918 |
1,532 |
| Declines |
1,704 |
2,584 |
3,025 |
| Unchanged |
248 |
271 |
226 |
| New
highs |
81 |
61 |
91 |
| New
lows |
67 |
82 |
32 |
| Closing
Arms (TRIN)† |
0.85 |
1.17 |
0.71 |
| Block
trades |
31,168 |
31,007 |
42,264 |
| Adv.
volume |
3,124,372,012 |
1,864,212,577 |
2,293,115,865 |
| Decl.
volume |
1,582,559,693 |
2,936,247,513 |
3,207,488,935 |
| Total
volume |
4,752,885,418 |
4,885,033,078 |
5,538,355,498 |
|
Table 2 QUICKSILVER on ETFS - 2/13/2023 ---
     Bullish = 8 +1           COMPQX,  QQQ,  IWM, FAS, SOXL, TEXL,
                           OIH,  YINN (highest 0.361)
     Bearish = 0
ETF       CLOSE   CHANGE    PIVOT-PT    5-dma AROC    CL-PWR  CANDLE  IP21   ITRS   POWER INDEX
================================================================================================
DIA       342.55   3.82      341.52        60%        Bullish  BLUE   .17      0       ----
---------------------------------------------------------------------------------------------
COMPQX    11891.79   173.67  12113.79      1.8%       -------  BLUE   .224    .047     .271
---------------------------------------------------------------------------------------------
SPY       412.83   4.79      415.19        36.6%      Bullish  BLUE   .197    .023     .22
---------------------------------------------------------------------------------------------
QQQ       304.5   4.8        309.88        15%        -------  BLUE   .203    .048     .251
---------------------------------------------------------------------------------------------
MDY       487.11   5.79      491.92       -11.5%      Bullish  BLUE   .18    .046      .226
---------------------------------------------------------------------------------------------
IWM       192.6   2.29       195.58       -40%        Bullish  BLUE   .224    .038     .262
---------------------------------------------------------------------------------------------
FAS       90.41   2.82       91.44         123.4%     Bullish  BLUE   .248    .035     .283
---------------------------------------------------------------------------------------------
RETL      10.54   .66        11.22        -393.2%     -------  BLUE   .033    .109     .142
---------------------------------------------------------------------------------------------
SOXL      16.42   .62        17.59         96.9%      -------  BLUE   .19     .199     .389
---------------------------------------------------------------------------------------------
TECL      32.34   1.59       32.96         262%       -------  BLUE   .212    .109     .321
---------------------------------------------------------------------------------------------
IBB       134.18   1.82      136.32       -53.4%      -------  BLUE   .218   -.007     .211
---------------------------------------------------------------------------------------------
GLD       172.48  -.88       173.98       -38.6%      Bearish  RED    .069    .057     .126
---------------------------------------------------------------------------------------------
DBO       15.17  -.08        14.84         245.3%     Bearish  BLUE   .033   -.028     .005
---------------------------------------------------------------------------------------------
OIH       331.44   2.2       323.86        230.1%     Bullish  BLUE   .152    .1       .252
---------------------------------------------------------------------------------------------
CPER     24.72   .3          24.74         38.6%      -------  BLUE   .023    .094     .117
---------------------------------------------------------------------------------------------
TAN     77.08   1.2          78.92        -133.9%     Bearish  BLUE   .041   -.072    -.031
---------------------------------------------------------------------------------------------
UUP       27.9  -.08         27.9         -9%         Bullish  RED    .058   -.014     .044
---------------------------------------------------------------------------------------------
CORN      26.77   .11        26.5          20.7%      Bullish  BLUE   0       .024     .024
---------------------------------------------------------------------------------------------
WEAT      7.99  -.01         7.67          225.5%     Bullish  BLUE   .153    .004     .157
---------------------------------------------------------------------------------------------
YINN      55.84   2.67       57.47        -24.1%      Bearish  BLUE   .092    .269     .361
|
 Table 3
              RANKING OF KEY DIRECTORIES BASED PCT.OF STOCKS ABOVE 65-DMA
              2/13/23
 Bullish = 41
 Bearish = 7
---------------------------------------------------------------------------------------
Directory     Current       day-1         day-2         day-3         day-4         day-5
----------------------------------------------------------------------------------------
EDU            1             1             1             1             1             1
HOMEBLDG       .944          .888          .888          .944          .944          .944
INSURANC       .88           .8            .72           .88           .88           .8
REIT           .861          .792          .738          .838          .869          .892
BIGBANKS       .857          .857          .857          .857          .857          .857
COPPER         .857          .857          1             1             1             1
INFRA          .848          .848          .878          .878          .909          .909
JETS           .846          .846          .846          .846          .846          .846
TRANSP         .842          .842          .789          .842          .842          .842
ETFS           .836          .781          .818          .8            .818          .781
SEMI           .829          .819          .829          .861          .893          .904
               =====
BONDFUND       .827          .793          .908          .919          .896          .896
NIFTY          .818          .75           .75           .75           .818          .795
AUTO           .811          .754          .792          .83           .83           .849
ELECTRON       .796          .789          .781          .819          .849          .864
HIGHPRIC       .787          .731          .727          .77           .813          .787
GUNS           .785          .714          .642          .785          .785          .857
SOFTWARE       .785          .785          .803          .821          .857          .839
CHINA          .772          .727          .772          .795          .818          .818
FINANCE        .762          .725          .712          .762          .75           .75
NASD-100       .76           .69           .68           .69           .76           .72
               =====
               rising
RUS-1000       .749          .707          .699          .744          .786          .762
               =====
GAMING         .736          .684          .578          .684          .789          .736
MILITARY       .73           .692          .538          .615          .615          .653
INDEXES        .729          .724          .724          .729          .756          .745
CHEM           .72           .674          .651          .79           .744          .79
SP500          .706          .653          .627          .678          .723          .688
               =====
COMPUTER       .7            .65           .55           .65           .7            .6
FIDSTKS        .68           .633          .597          .662          .692          .644
GREEN          .666          .555          .722          .777          .888          .888
RETAIL         .659          .595          .574          .638          .702          .765
INDMATER       .638          .638          .583          .708          .75           .736
HACKERS        .625          .625          .625          .687          .687          .687
SP-100         .622          .544          .522          .566          .611          .566
DOWJONES       .6            .466          .433          .5            .566          .5
               =====
               rising
OILGAS         .58           .571          .409          .466          .485          .4
FOOD           .571          .551          .448          .551          .571          .53
HOSPITAL       .571          .571          .571          .571          .571          .714
BIOTECH        .562          .534          .562          .61           .659          .644
               =====
LOWPRICE       .544          .561          .561          .598          .627          .653
COMODITY       .512          .512          .41           .538          .564          .564
===============================================================================================
SOLAR          .5            .375          .375          .5            .625          .687
===============================================================================================
REGBANKS       .48           .48           .44           .56           .64           .56
DJI-13         .461          .307          .307          .461          .461          .384
BEVERAGE       .428          .357          .428          .428          .5            .571
COAL           .333          .5            .333          .333          .333          .333
GOLD           .326          .391          .413          .608          .76           .673
UTILITY        .21           .131          .105          .184          .421          .473
MARIJUAN       .2            .2            .2            .1            .1            .2
|
===================================================================================
Monday 2/13: 5:30 AM Futures:
Monday DJI +19 NASDAQ +61 Data
Used 2-10-2023:
| |
2-10-2023
|
|
| |
The DJI is
waiting for something to pivot it away from its gravitational
center, its 65-dma and flat
21-day ma. It may be that the CPI numbers this week
will do that. There
could be a short-term decline. The A/D Line has broken its
uptrend and Peerless P-I is
falling. But we have no new Sell signals from Peerless,
only buy signals.
Seasonality is bullish from here over the next month (67%
probability of an advance),
two months (67% of time since 1967 there is a rise)
and three months (73%). And
our Closing Power 21-day moving averages
are rising for DJI, SPY, QQQ
and the NASDAQ.
In the short-term, the war
between our Opening Power and Closing Powers
continues. Usually, the
trend of the Closing Power wins out.
The DJI-30 is weaker than the
Nasdaq, QQQ or SPY. The prospects of 5%
short-term rates is hurting
dividend stocks. Big tech stocks are stronger because
traders in them are focusing
on the words "soft landing". That trend seems likely
to continue, but we will
watch it.
What's new with US-Russia
relations? All US citizens are urged to leave Russia.
That should cause some of the more
circumspect traders to pullback their buy
orders.
The DJI-30 stocks that are
above $140 a share, and therefore are apt to count most
when the DJIA is computed,
are about evenly divided between those that are up-trending
and those that are falling.
In the former camp I would place AXP, BA, CRM, GS, JPM
and V. In the falling
group are AMGN, CVX, JNJ, MMM, PG and UNH. We must
watch CAT because of the
bearishness of its potential head/shoulders. And we follow
UNH, the most heavily
weighted DJI-30 stock, clsoely now because it has risen to its
downtrend-resistance.
It might surpass it or it may fall back. Either way, it has more
weight than DOW, V Z, INTC,
CSCO, WBA and KO combined. MSFT and APPL
are important to watch, too.
They are tech leaders. Old "blue" IBM is at important
support, its 200-day ma. And
below see also HD and MCD, high priced DJI-30 stocks
that will signal short-term
trouble for the market it they break their support-levels.
Our NVDA fell victim to
profit-taking on Friday. Its intermediate-term trend is
still up.. See in
Tables 2 and 3 how high are the rankings of SOXL (semi-conductors)
and "SEMIS" .
NVDA will probably be a buy again after another down day and
then a positive candlestick.
Avoid the short side. Our choices among the Bearish
MINCPs is very few.
|
|
| |
Charts - 2/10/2023
2022 PEERLESS DJI, Signals, Indicators Daily DJI Volume
10-DayUp/Down Vol Stoch-20 CCI RSI Pct of All Stocks above 65-dma
Inverted Traders Index
DJI-IPA DJI-OBV Short-Term Rates
NASDAQ S&P OEX NYSE DJ-15 DJ-20 DJI-30 Bond Funds
DIA QQQ SPY IWM new - COIN (Bit Coin ETF)
Gold Stocks
Semi Conductors
TNA Short-Term Rates Ten Year Rates PST (Short Treasuries)
DOLLAR-UUP
ALLSTOCKs
Russell-1000
Insurance-Stocks
Recent 2006 vers-Peerless signals
http://www.tigersoftware.com/OLDPEER/UPD90210.bmp
MDY - http://www.tigersoftware.com/CHARTX/MDY.GIF
USO-CrudeOil DBO FAS GLD HD IBB JETS JNUG KOL NAIL NUGT NRGU OIH
PALL RSX RETL SDS AGQ SLV SOXL TAN TECL TLT TMF TNA UGA USO
China:
YINN CHAU
Commodities: CANE
CORN DBC JJC, NIB CORN, CUT (paper)
MOO, NRGU
SOYB WEAT UUP (Dollar) LIT
(Lithium) PALL
(Palladium)
Stocks AA AAPL ADBE ALXN AMAT AMGN AMD AMZN AXP BA BABA
BAC BIDU BLDP CAT CHKP CNX CPB CRM CVX CMG DE DIS ENPH FB FSLR
FTNT GILD GME GOOG GS HD IBM INTU JPM KO KR LRCX MRK MRNA
MOS MSFT NEM NFLX NKE NOC NUE NVDA PANW PG PYPL REGN REV
SO QCOM QDEL TSLA TXN XOM V VRTX WFC WMT XLE ZM ZOM
Leveraged Short ETFs:
FAZ - financials, TZA and SRTY- small caps, MZZ - mid caps, TECS -Techs,
SOXS -
semi-conductors LABD
- Biotechs
Bullish MAXCPs http://www.tigersoftware.com/UPPING/2-10-2023/BULLISH.htm
Bearish MINCPs http://www.tigersoftware.com/Downing/2-10-2023/BEARISH.htm
|
|
 |
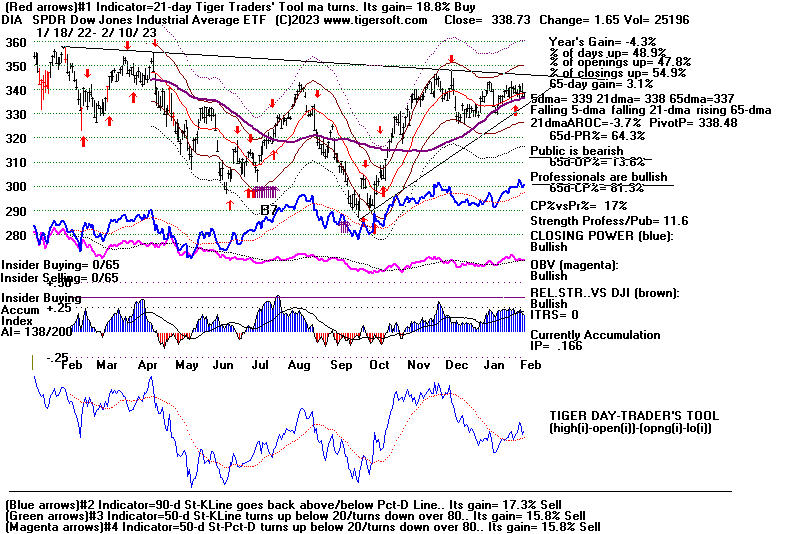 |
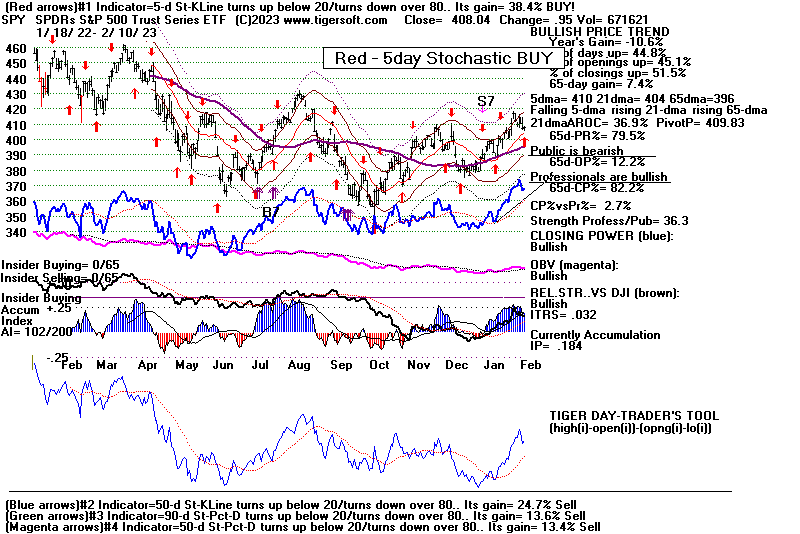 |
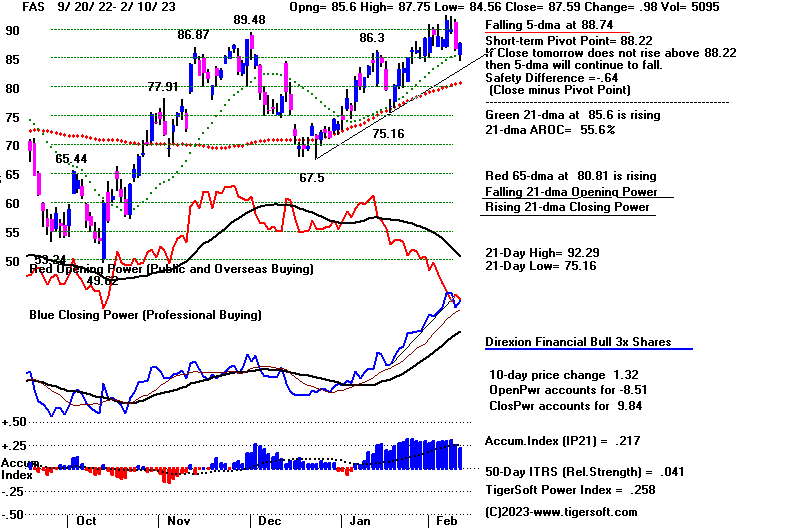 |
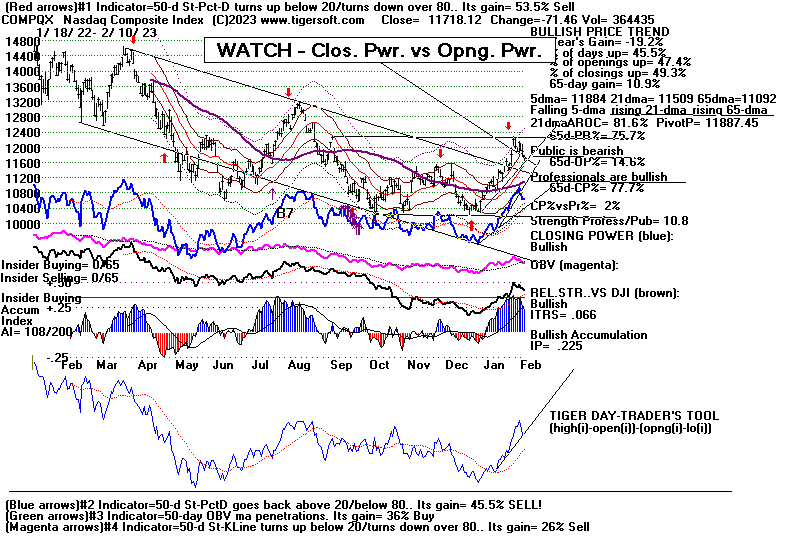 |
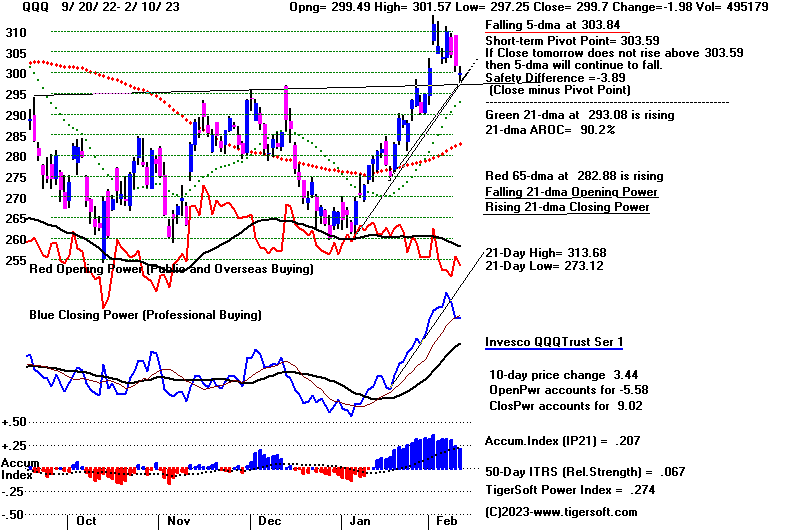 |
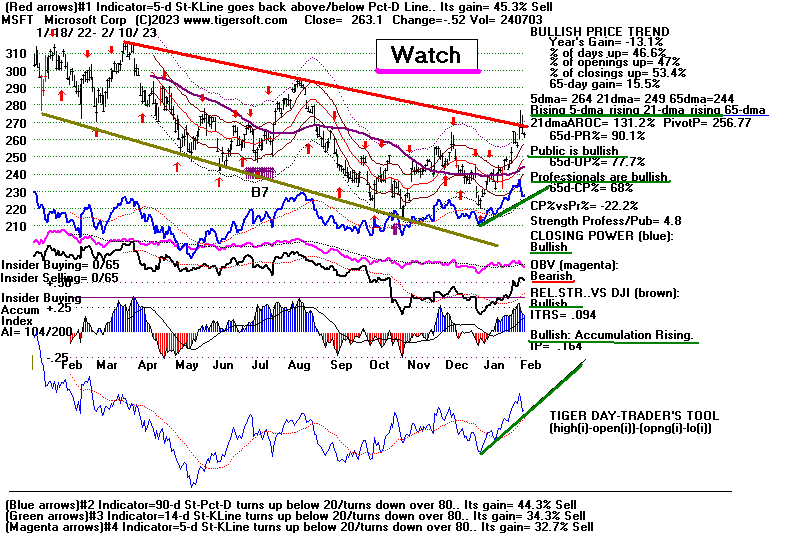 |
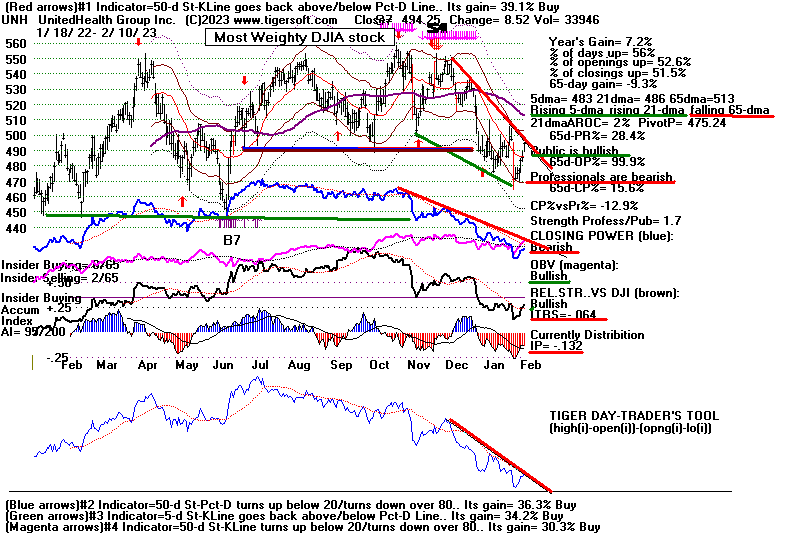 |
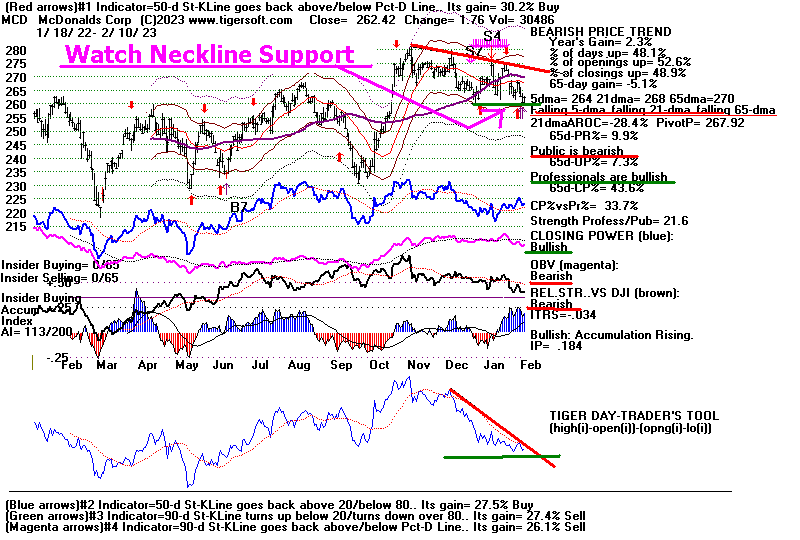 |
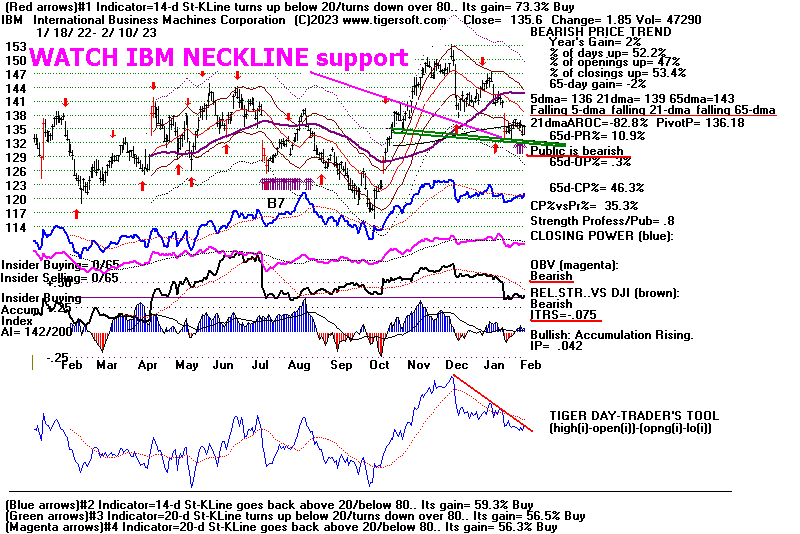 |
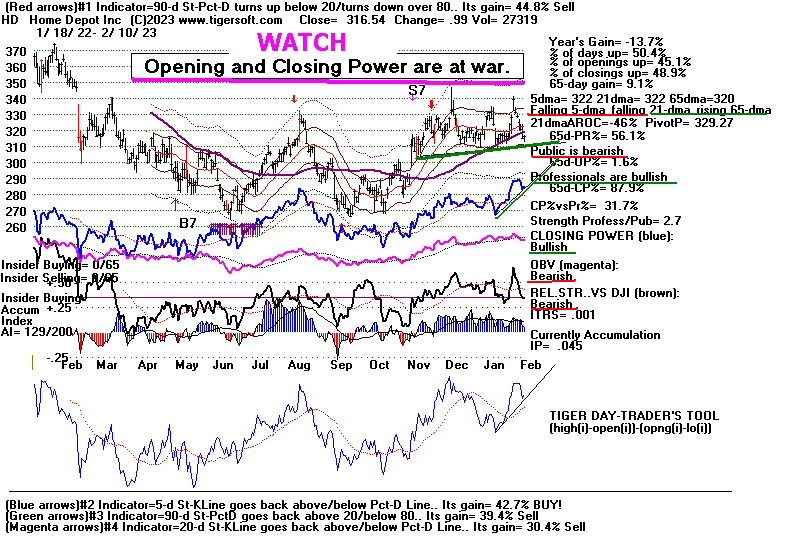 |
Table 1 - Daily Volume and Breadth Statistics
| NYSE |
Latest Close |
Previous
Close |
Week Ago |
| Issues
traded |
3,185 |
3,172 |
3,180 |
| Advances |
1,611 |
807 |
837 |
| Declines |
1,460 |
2,253 |
2,248 |
| Unchanged |
114 |
112 |
95 |
| New
highs |
42 |
87 |
121 |
| New
lows |
15 |
10 |
4 |
| Adv.
volume* |
463,218,833 |
209,644,983 |
236,306,245 |
| Decl.
volume* |
382,886,488 |
674,580,955 |
723,354,338 |
| Total
volume* |
854,346,415 |
887,518,365 |
975,003,578 |
| Closing
Arms (TRIN)† |
1.10 |
1.07 |
1.07 |
| Block
trades* |
4,556 |
4,413 |
4,845 |
| Adv.
volume |
1,933,410,992 |
1,066,333,261 |
1,185,075,029 |
| Decl.
volume |
1,921,136,685 |
3,178,692,598 |
3,419,334,522 |
| Total
volume |
3,891,524,118 |
4,270,207,804 |
4,694,517,247 |
| NASDAQ |
Latest Close |
Previous
Close |
Week Ago |
| Issues
traded |
4,773 |
4,767 |
4,811 |
| Advances |
1,918 |
1,348 |
1,719 |
| Declines |
2,584 |
3,190 |
2,858 |
| Unchanged |
271 |
229 |
234 |
| New
highs |
61 |
93 |
142 |
| New
lows |
82 |
67 |
24 |
| Closing
Arms (TRIN)† |
1.17 |
1.07 |
0.90 |
| Block
trades |
31,007 |
38,336 |
39,814 |
| Adv.
volume |
1,864,212,577 |
1,553,537,385 |
2,366,109,149 |
| Decl.
volume |
2,936,247,513 |
3,933,489,976 |
3,543,265,996 |
| Total
volume |
4,885,033,078 |
5,536,290,050 |
5,954,499,933 |
|
Table 2 QUICKSILVER on ETFS - 2/10/2023 ---
     Bullish = 7           COMPQX,  QQQ,  IWM, FAS,   SOXL, TEXL,
                            YINN (highest 0.871)
     Bearish = 0
ETF       CLOSE   CHANGE    PIVOT-PT    5-dma AROC    CL-PWR  CANDLE  IP21   ITRS   POWER INDEX
================================================================================================
DIA       338.73   1.65      338.48       -3.7%       Bullish  BLUE   .166    0        .166
---------------------------------------------------------------------------------------------
COMPQX    11718.12  -71.46   11887.45     -120.9%     -------  BLUE   .225    .066     .291
---------------------------------------------------------------------------------------------
SPY       408.04   .95       409.83       -52.4%      -------  BLUE   .184    .032     .216
---------------------------------------------------------------------------------------------
QQQ       299.7  -1.98       303.59       -106.2%     -------  BLUE   .208    .067     .275
---------------------------------------------------------------------------------------------
MDY       481.32   1.12      488.23       -129.1%     -------  BLUE   .187    .046     .233
---------------------------------------------------------------------------------------------
IWM       190.31   .38       194.14       -172.3%     -------  BLUE   .247    .043     .29
---------------------------------------------------------------------------------------------
FAS       87.59   .99        88.22        -59.6%     -------  BLUE   .218    .041      .259
---------------------------------------------------------------------------------------------
RETL      9.88  -.32         11.38        -1002%     -------  ----   .034    .087      .121
---------------------------------------------------------------------------------------------
SOXL      15.8  -.78         16.1         -337.6%    -------  RED    .204    .346      .55
---------------------------------------------------------------------------------------------
TECL      30.75  -.53        30.69        -171.9%    -------  BLUE   .214    .2        .414
---------------------------------------------------------------------------------------------
IBB       132.36  -.04       135.61       -156.8%    -------  BLUE   .216    0         .216
---------------------------------------------------------------------------------------------
GLD       173.36   .33       173.82       -2.9%      Bearish  RED    .115    .065      .18
---------------------------------------------------------------------------------------------
DBO       15.25   .39        14.44         354.4%    Bearish  BLUE   .018   -.009      .009
---------------------------------------------------------------------------------------------
OIH       329.24   11.55     316.56        211.5%    Bullish  BLUE   .121    .1        .221
---------------------------------------------------------------------------------------------
CPER     24.42  -.33         24.53        -28.4%     Bearish  RED    .019    .109      .128
---------------------------------------------------------------------------------------------
TAN     75.88  -.52          79.16        -245.4%    Bearish  BLUE   .056   -.046      .01
---------------------------------------------------------------------------------------------
UUP       27.98   .09        27.95         34.1%     Bullish  BLUE   .03   -.031      -.001
---------------------------------------------------------------------------------------------
CORN      26.66   .32        26.66         15.1%     Bullish  BLUE   .061    0         .061
---------------------------------------------------------------------------------------------
WEAT      8   .29            7.64          201.3%    Bullish  BLUE   .175    .009      .184
---------------------------------------------------------------------------------------------
YINN      53.17  -5.16       56.11        -494%      Bearish  RED    .1    .361        .461
|
 TABLE 3   RANKING OF KEY DIRECTORIES BASED PCT.OF STOCKS ABOVE 65-DMA
              2/10/23
---------------------------------------------------------------------------------------
Directory     Current       day-1         day-2         day-3         day-4         day-5
----------------------------------------------------------------------------------------
EDU            1             1             1             1             1             1
HOMEBLDG       .888          .888          .944          .944          .944          1
BIGBANKS       .857          .857          .857          .857          .857          .857
COPPER         .857          1             1             1             1             1
INFRA          .848          .878          .878          .909          .909          .939
JETS           .846          .846          .846          .846          .846          .846
TRANSP         .842          .789          .842          .842          .842          .894
SEMI           .819          .829          .861          .893          .893          .904
               ------
INSURANC       .8            .72           .88           .88           .8            .72
BONDFUND       .793          .908          .919          .896          .908          .896
REIT           .792          .73           .846          .876          .884          .915
ELECTRON       .789          .781          .819          .849          .857          .864
SOFTWARE       .785          .821          .821          .857          .857          .857
ETFS           .781          .818          .8            .818          .8            .854
AUTO           .754          .811          .83           .83           .849          .849
NIFTY          .75           .75           .75           .818          .795          .818
HIGHPRIC       .731          .727          .77           .813          .792          .813
CHINA          .727          .772          .795          .818          .818          .818
FINANCE        .725          .712          .762          .737          .75           .762
INDEXES        .724          .724          .729          .756          .751          .745
GUNS           .714          .642          .785          .785          .857          .857
RUS-1000       .707          .699          .744          .786          .767          .788
               -----
MILITARY       .692          .538          .615          .615          .615          .653
NASD-100       .69           .68           .69           .76           .74           .74
               -----
GAMING         .684          .578          .631          .842          .736          .736
CHEM           .674          .651          .79           .744          .79           .813
SP500          .653          .627          .68           .719          .698          .719
               -----
COMPUTER       .65           .55           .65           .7            .6            .8
INDMATER       .638          .583          .708          .75           .736          .777
FIDSTKS        .633          .597          .662          .692          .656          .65
HACKERS        .625          .625          .687          .687          .687          .687
RETAIL         .595          .574          .638          .702          .765          .765
HOSPITAL       .571          .571          .571          .571          .642          .714
OILGAS         .571          .409          .466          .485          .4            .447
LOWPRICE       .561          .564          .601          .627          .65           .659
GREEN          .555          .722          .777          .888          .888          .888
FOOD           .551          .448          .53           .571          .53           .551
SP-100         .544          .522          .566          .611          .588          .588
BIOTECH        .534          .559          .613          .659          .642          .678
COMODITY       .512          .41           .512          .564          .564          .564
===============================================================================================
COAL           .5            .333          .333          .333          .333          .666
===============================================================================================
REGBANKS       .48           .44           .56           .64           .56           .72
DOWJONES       .466          .433          .5            .566          .5            .533
               -----
GOLD           .391          .413          .608          .76           .695          .782
SOLAR          .375          .375          .5            .625          .687          .687
BEVERAGE       .357          .428          .428          .5            .571          .571
DJI-13         .307          .307          .461          .461          .384          .384
MARIJUAN       .2            .2            .1            .1            .2            .2
UTILITY        .131          .105          .184          .421          .473          .447
|
===================================================================================
Friday - 5:53 - Futures: DJI -109 NASDAQ
-85 Data Used 2-9-2023:
| |
2-9-2023
|
|
| |
Today brought
a classic reversal day down, as the market opened nicely higher
but was soon on a broad
decline. The prospects of 5% short-term interest rates
are not letting the DJI
or FAS breakout. Within the DJI-30, it was a broad decline
as half of its 30 stocks fell
more than a point and now less than half are still above their
65-dma. This may cause
the DJI to decline below its immediate support at
33500. That will likely
cause it to fall to its lower 3.5% band, now at 32700.
Without new Peerless Sell
signals to reverse our Peerless Buys, we can not expect
a bigger decline.
Today it was the turn for
Professionals to "blink" in their three week standoff with the
overseas traders and the
Public. The steep Closing Power up-trends were broken
for most of the ETFs.
The odds now favor the Closing Powers testing their
rising 21-day ma. So,
more weakness may have to occur. It is not clear that
it will have much negative
effect on the Bullish MAXCPs and NVDA. But CAT
does show a bearish
head/shoulders pattern. Such patterns are reliably bearish with
CAT if the neckline is closed
below. A retesting by it of its 65-dma is expected.
The decline of Gold
stocks (see below) shows us that the FED has convinced
foreign exchange
traders that rates are going to go to at least 5% but that the
risk of a big decline
in the market has also dropped. Gold was once widely
used as a hedge against
a bear market. Its decline last spring with the market
sell-off makes us
wonder who would still buying it now that it has broken its
uptrend.
HD fell today, but as
you can see from our Tiger chart of Home-building stocks
which are in an
uptrend, the need for much more housing will likely keep the
builders busy for some
time. These stocks would be much weaker if a significant
bear market was coming
this way.
A short-term downtrend
probably is unfolding. But I think we should plan to
be aggressive buyers
when the DJI tests its lower 3% band. |
|
| |
Charts - 2/9/2023
2022 PEERLESS DJI, Signals, Indicators Daily DJI Volume
10-DayUp/Down Vol Stoch-20 CCI RSI Pct of All Stocks above 65-dma
Inverted Traders Index
DJI-IPA DJI-OBV Short-Term Rates
NASDAQ S&P OEX NYSE DJ-15 DJ-20 DJI-30 Bond Funds
DIA QQQ SPY IWM new - COIN (Bit Coin ETF)
Gold Stocks
Semi Conductors
TNA Short-Term Rates Ten Year Rates PST (Short Treasuries)
DOLLAR-UUP
ALLSTOCKs
Russell-1000
Insurance-Stocks
Recent 2006 vers-Peerless signals
http://www.tigersoftware.com/OLDPEER/UPD90209.bmp
MDY - http://www.tigersoftware.com/CHARTX/MDY.GIF
USO-CrudeOil DBO FAS GLD HD IBB JETS JNUG KOL NAIL NUGT NRGU OIH
PALL RSX RETL SDS AGQ SLV SOXL TAN TECL TLT TMF TNA UGA USO
China:
YINN CHAU
Commodities: CANE
CORN DBC JJC, NIB CORN, CUT (paper)
MOO, NRGU
SOYB WEAT UUP (Dollar) LIT
(Lithium) PALL
(Palladium)
Stocks AA AAPL ADBE ALXN AMAT AMGN AMD AMZN AXP BA BABA
BAC BIDU BLDP CAT CHKP CNX CPB CRM CVX CMG DE DIS ENPH FB FSLR
FTNT GILD GME GOOG GS HD IBM INTU JPM KO KR LRCX MRK MRNA
MOS MSFT NEM NFLX NKE NOC NUE NVDA PANW PG PYPL REGN REV
SO QCOM QDEL TSLA TXN XOM V VRTX WFC WMT XLE ZM ZOM
Leveraged Short ETFs:
FAZ - financials, TZA and SRTY- small caps, MZZ - mid caps, TECS -Techs,
SOXS -
semi-conductors LABD
- Biotechs
Bullish MAXCPs
http://www.tigersoftware.com/UPPING/2-9-2023/BULLISH.htm
Bearish MINCPs http://www.tigersoftware.com/Downing/2-9-2023/BEARISH.htm
|
|
The DJI could not breakout and the A/D Line had broken its uptrend.
So now it must plumbing for support.
Support for DJI is now at 35000 and 33100.
Without any new automatic Sells, the lower 3% band should act as good support.
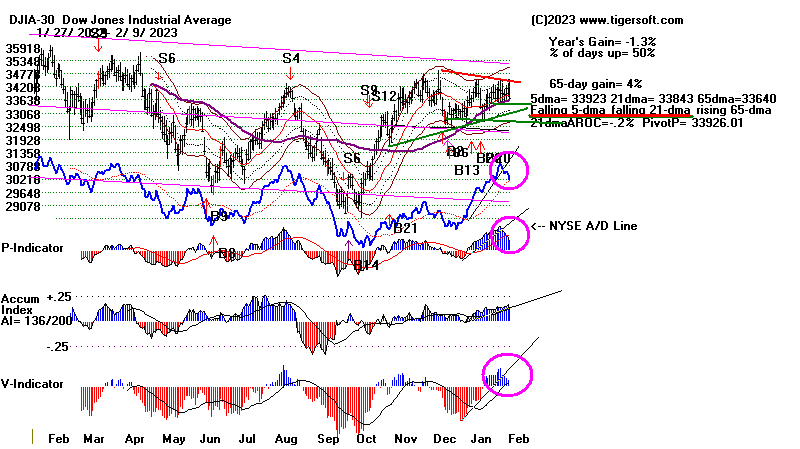 |
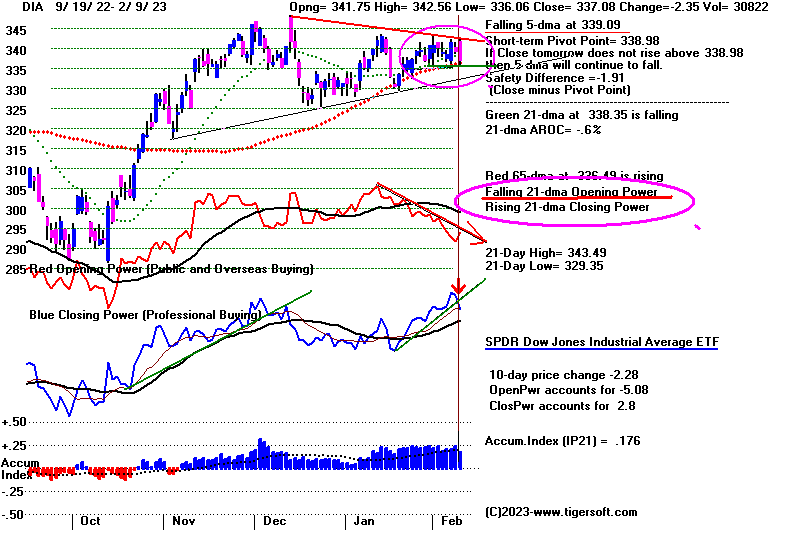 |
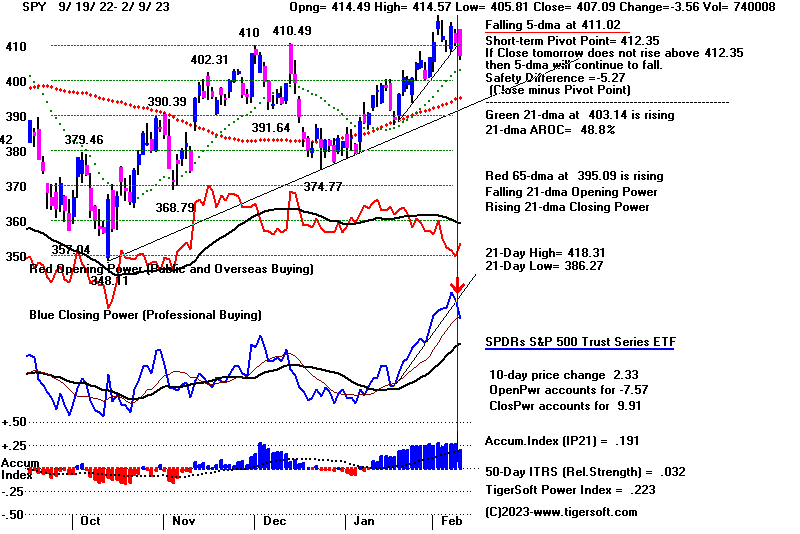 |
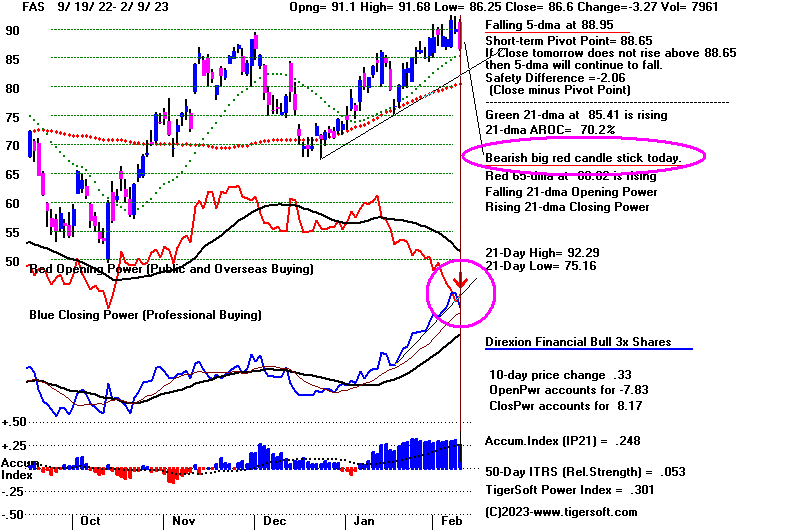 |
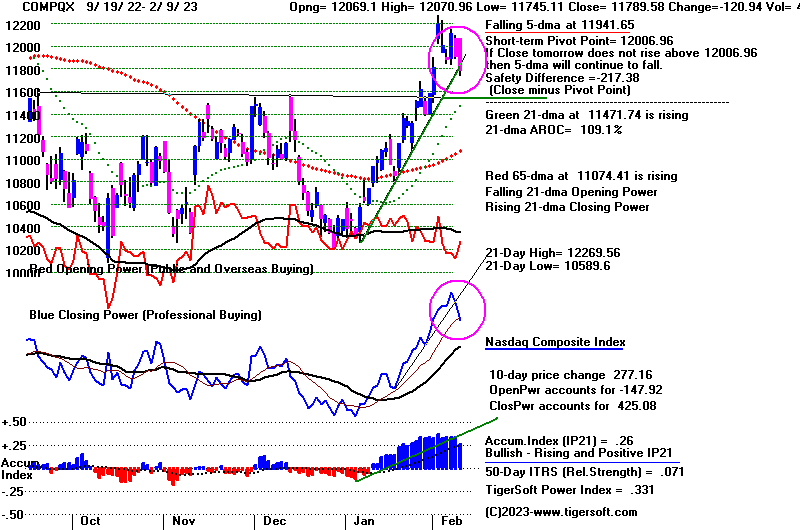 |
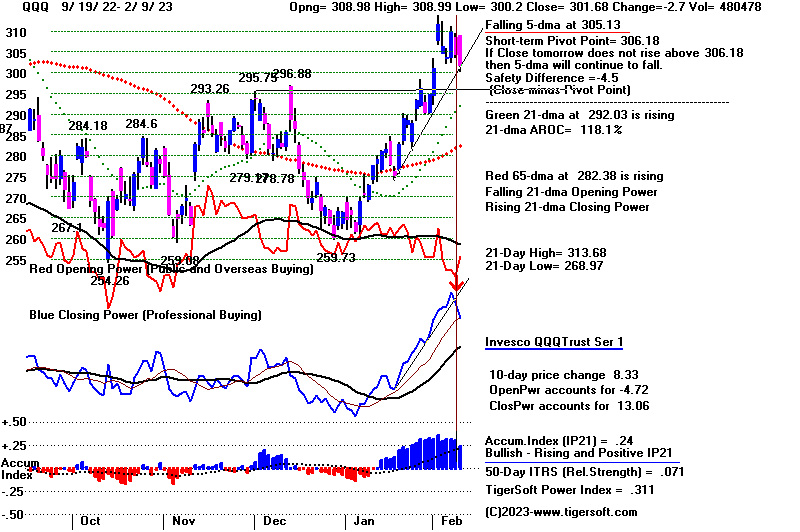 |
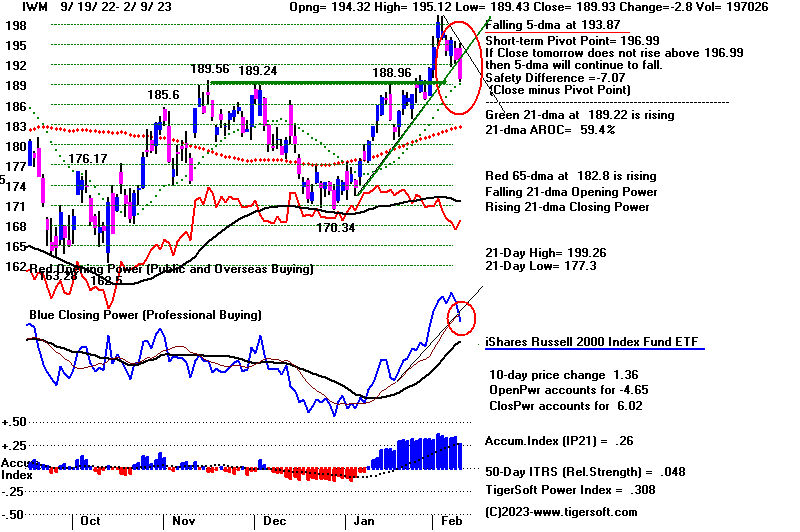 |
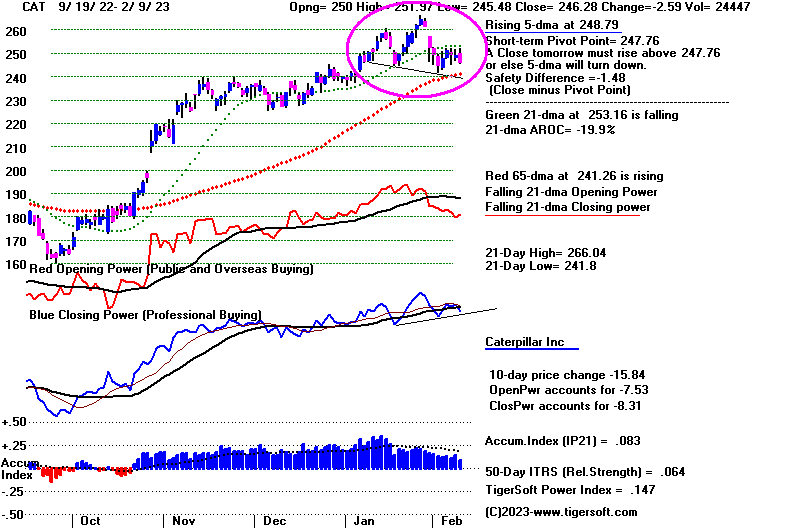 |
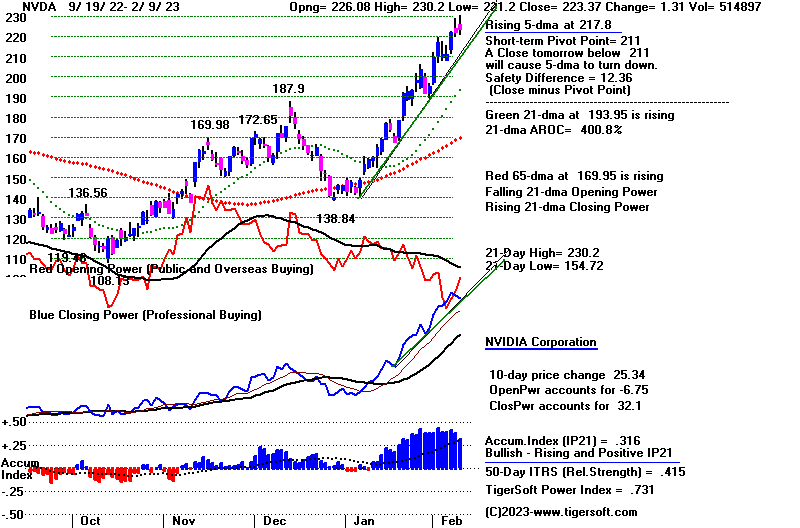 |
 |
 |
 |
 |
Table 1 - Volume and Breadth Statistics
| NYSE |
Latest Close |
Previous
Close |
Week Ago |
| Issues
traded |
3,172 |
3,180 |
3,213 |
| Advances |
807 |
1,009 |
2,197 |
| Declines |
2,253 |
2,045 |
914 |
| Unchanged |
112 |
126 |
102 |
| New
highs |
87 |
66 |
203 |
| New
lows |
10 |
6 |
5 |
| Adv.
volume* |
209,644,983 |
231,629,956 |
703,942,291 |
| Decl.
volume* |
674,580,955 |
568,195,050 |
382,313,251 |
| Total
volume* |
887,518,365 |
807,339,124 |
1,101,685,647 |
| Closing
Arms (TRIN)† |
1.07 |
1.02 |
1.23 |
| Block
trades* |
4,413 |
4,166 |
4,983 |
| Adv.
volume |
1,066,333,261 |
1,294,268,376 |
3,683,322,057 |
| Decl.
volume |
3,178,692,598 |
2,683,364,342 |
1,880,675,339 |
| Total
volume |
4,270,207,804 |
4,029,826,471 |
5,624,362,081 |
| NASDAQ |
Latest Close |
Previous
Close |
Week Ago |
| Issues
traded |
4,767 |
4,785 |
4,829 |
| Advances |
1,348 |
1,419 |
3,297 |
| Declines |
3,190 |
3,141 |
1,293 |
| Unchanged |
229 |
225 |
239 |
| New
highs |
93 |
100 |
199 |
| New
lows |
67 |
47 |
27 |
| Closing
Arms (TRIN)† |
1.07 |
1.05 |
0.63 |
| Block
trades |
38,336 |
33,782 |
47,031 |
| Adv.
volume |
1,553,537,385 |
1,506,920,076 |
5,602,121,508 |
| Decl.
volume |
3,933,489,976 |
3,513,337,901 |
1,378,372,555 |
| Total
volume |
5,536,290,050 |
5,052,872,994 |
7,038,212,637 |
|
Table 2 QUICKSILVER on ETFS - 2/9/2023 ---
     Bullish = 6 (-7)       COMPQX,  QQQ,  TECL,   IWM, FAS,   SOXL.
                            YINN (highest 0.871)
     Bearish = 0
ETF       CLOSE   CHANGE    PIVOT-PT    5-dma AROC    CL-PWR  CANDLE  IP21   ITRS   POWER INDEX
================================================================================================
DIA       337.08  -2.34      338.98       -49.3%      -------  RED    .176    0       =====
---------------------------------------------------------------------------------------------
COMPQX    11789.58  -120.94  12006.96     -171%       -------  RED    .26    .071      .331
---------------------------------------------------------------------------------------------
SPY       407.09  -3.56      412.35       -117.3%     Bullish  RED    .192    .032     .224
---------------------------------------------------------------------------------------------
QQQ       301.68  -2.69      306.18       -163.4%     -------  RED    .241    .071     .312
---------------------------------------------------------------------------------------------
MDY       480.2  -5.86       493.92       -172.1%     -------  RED    .19    .052      .242
---------------------------------------------------------------------------------------------
IWM       189.93  -2.79      196.99       -214.5%     -------  RED    .26    .049      .309
---------------------------------------------------------------------------------------------
FAS       86.6  -3.26        88.65        -135.3%     Bullish  RED    .248    .053     .301
---------------------------------------------------------------------------------------------
RETL      10.2  -.53         12.11        -1013.1%    -------  RED    .102    .137     .239
---------------------------------------------------------------------------------------------
SOXL      16.58   .09        16.93        -394%       -------  RED    .235    .405     .64
---------------------------------------------------------------------------------------------
TECL      31.28  -.48        31.84        -215.7%     -------  RED    .232    .19      .422
---------------------------------------------------------------------------------------------
IBB       132.4  -.93        136.59       -175.6%     -------  RED    .222    0        .222
---------------------------------------------------------------------------------------------
GLD       173.03  -1.38      173.46       -139.4%     Bearish  RED    .124    .073     .197
---------------------------------------------------------------------------------------------
DBO       14.86  -.16        14.21         78.6%      Bearish  ----   .025   -.008     .017
---------------------------------------------------------------------------------------------
OIH       317.69  -11.32     315.68        59.7%      -------  RED    .086    .091     .177
---------------------------------------------------------------------------------------------
CPER     24.75   .18         24.56        -14.2%      -------  RED    .079    .145     .224
---------------------------------------------------------------------------------------------
TAN     76.4  -1.62          79.73        -333.3%     Bearish  RED    .102   -.046     .056
---------------------------------------------------------------------------------------------
UUP       27.89  -.04        27.79         82.7%      Bullish  BLUE  -.001   -.027    -.028
---------------------------------------------------------------------------------------------
CORN      26.34  -.27        26.58        -28.2%      Bullish  RED    .042   -.007     .035
---------------------------------------------------------------------------------------------
WEAT      7.71  -.08         7.69          0%         Bullish  RED    .159   -.02      .139
---------------------------------------------------------------------------------------------
YINN      58.33   3.14       58.82        -457.5%     Bearish  RED    .151    .72      .871
|
Table 3       RANKING OF KEY DIRECTORIES BASED PCT.OF STOCKS ABOVE 65-DMA
              2/9/23
Bullish = 37
Bearish = 12  incliding DJ-30
---------------------------------------------------------------------------------------
Directory     Current       day-1         day-2         day-3         day-4         day-5
----------------------------------------------------------------------------------------
COPPER         1             1             1             1             1             1
EDU            1             1             1             1             1             1
BONDFUND       .908          .919          .896          .908          .908          .896
HOMEBLDG       .888          .944          .944          .944          1             1
INFRA          .878          .878          .909          .909          .939          .909
BIGBANKS       .857          .857          .857          .857          .857          .857
              ======
JETS           .846          .846          .846          .846          .846          .846
SEMI           .829          .861          .893          .893          .904          .925
               =====
SOFTWARE       .821          .839          .857          .857          .857          .857
ETFS           .818          .8            .818          .8            .872          .89
AUTO           .811          .849          .83           .849          .849          .886
TRANSP         .789          .842          .842          .842          .894          .894
ELECTRON       .781          .819          .849          .857          .864          .864
CHINA          .772          .795          .818          .818          .818          .818
NIFTY          .75           .75           .818          .795          .818          .795
REIT           .73           .838          .884          .892          .907          .93
HIGHPRIC       .728          .771          .814          .793          .818          .836
INDEXES        .724          .729          .756          .751          .745          .778
GREEN          .722          .777          .888          .888          .888          .888
INSURANC       .72           .88           .88           .8            .72           .68
FINANCE        .712          .762          .737          .737          .762          .725
RUS-1000       .699          .744          .786          .767          .791          .82
               ====
NASD-100       .68           .69           .76           .74           .75           .82
               ====
CHEM           .651          .79           .744          .79           .813          .813
GUNS           .642          .785          .785          .857          .857          .857
SP500          .627          .68           .721          .694          .725          .76
               ====
HACKERS        .625          .687          .687          .687          .687          .687
FIDSTKS        .597          .662          .692          .656          .656          .733
INDMATER       .583          .708          .75           .736          .777          .833
GAMING         .578          .631          .789          .789          .736          .842
RETAIL         .574          .638          .702          .765          .765          .808
HOSPITAL       .571          .571          .571          .642          .714          .785
LOWPRICE       .564          .604          .63           .65           .656          .679
BIOTECH        .559          .61           .661          .642          .676          .684
COMPUTER       .55           .65           .7            .6            .8            .8
MILITARY       .538          .615          .615          .615          .653          .653
SP-100         .522          .566          .611          .588          .6            .622
------------------------------------------------------------------------------------------------
FOOD           .448          .53           .551          .53           .551          .693
REGBANKS       .44           .56           .64           .56           .72           .56
DOWJONES       .433          .5            .566          .5            .533          .533
               =====
BEVERAGE       .428          .428          .5            .571          .571          .571
GOLD           .413          .608          .76           .695          .782          .891
COMODITY       .41           .512          .538          .564          .564          .692
OILGAS         .409          .466          .485          .4            .438          .457
SOLAR          .375          .5            .625          .687          .687          .812
COAL           .333          .333          .333          .333          .666          .833
DJI-13         .307          .461          .461          .384          .384          .384
MARIJUAN       .2            .1            .1            .2            .2            .5
UTILITY        .105          .184          .421          .473          .447          .789
|
===================================================================================
Thursday - 5:40 - Futures: DJI +182 NASDAQ +129
Data Used 2-8-2023:
| |
2/8/2023
|
|
| |
The
up-opening this morning suggests that the three-week' war between the
Opening Power and the
Closing Power in the major ETFs may be resolved
finally with overseas
and public buyers capitulating to the Professionals,
Day-Traders and Big
Money. That would be in keeping with the bullish
seasonality of the
third year in the Presidential cycle and the multiple Peerless
Buy signals shown on
our DJI chart. Of course, we still need to see the
Closing Powers go still
higher today. And it would be bullish if SOXL and
FAS could score price
breakouts. But it sure looks like, once again,
Professionals'
bullishness has correctly over-ridden Public bearishness.
(That is a central
theme in our Closing Power studies and has occurred
a n umber of
times at important market bottoms.)
From the Bullish MAXCPs
we see a number for traders to buy. In Tables 2
and 3 below we see the
leaders now are semi-conductors and also certain
housing stocks.
NVDA keeps rising and it presents a minimum target above 255.
There seems little
point in selling short. There are just too few new lows. The
new lows are recovering
too quickly.
Note how the Bulls are
suggesting that Powell dovishly does not want any more
rate hikes soon.
But that battle within the FED is not over. The "hawks" are
not convinced that
inflation is contained, especially wages, with unemployment
do low.
This may keep the DJI from breaking out. The action now is expected
to be in the strongest
tech stocks. Ideally, they will have bulges of Accumulation
and their Closing
Powers and the Day Traders' Tool will be rising steeply now even
though the DJI has been
going sidewise. When you buy these leading stocks,
you can't walk away and
forget about them. See below how MODN formed its top
recently. |
|
| |
Charts - 2/8/2023
2022 PEERLESS DJI, Signals, Indicators Daily DJI Volume
10-DayUp/Down Vol Stoch-20 CCI RSI Pct of All Stocks above 65-dma
Inverted Traders Index
DJI-IPA DJI-OBV Short-Term Rates
NASDAQ S&P OEX NYSE DJ-15 DJ-20 DJI-30 Bond Funds
DIA QQQ SPY IWM new - COIN (Bit Coin ETF)
Gold Stocks
Semi Conductors
TNA Short-Term Rates Ten Year Rates PST (Short Treasuries)
DOLLAR-UUP
ALLSTOCKs
Russell-1000
Insurance-Stocks
Recent 2006 vers-Peerless signals
http://www.tigersoftware.com/OLDPEER/UPD90208.bmp
MDY - http://www.tigersoftware.com/CHARTX/MDY.GIF
USO-CrudeOil DBO FAS GLD HD IBB JETS JNUG KOL NAIL NUGT NRGU OIH
PALL RSX RETL SDS AGQ SLV SOXL TAN TECL TLT TMF TNA UGA USO
China:
YINN CHAU
Commodities: CANE
CORN DBC JJC, NIB CORN, CUT (paper)
MOO, NRGU
SOYB WEAT UUP (Dollar) LIT
(Lithium) PALL
(Palladium)
Stocks AA AAPL ADBE ALXN AMAT AMGN AMD AMZN AXP BA BABA
BAC BIDU BLDP CAT CHKP CNX CPB CRM CVX CMG DE DIS ENPH FB FSLR
FTNT GILD GME GOOG GS HD IBM INTU JPM KO KR LRCX MRK MRNA
MOS MSFT NEM NFLX NKE NOC NUE NVDA PANW PG PYPL REGN REV
SO QCOM QDEL TSLA TXN XOM V VRTX WFC WMT XLE ZM ZOM
Leveraged Short ETFs:
FAZ - financials, TZA and SRTY- small caps, MZZ - mid caps, TECS -Techs,
SOXS -
semi-conductors LABD
- Biotechs
Bullish MAXCPs
http://www.tigersoftware.com/UPPING/2-8-2023/BULLISH.htm
Bearish MINCPs http://www.tigersoftware.com/Downing/2-8-2023/BEARISH.htm
|
|
Peerless internals remain quite positiv, matching multiple Peerless B uy signals.
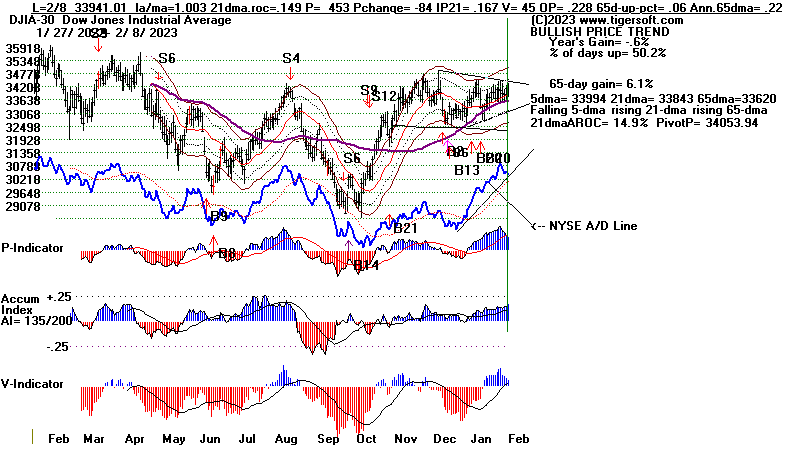 |
Day Traders have
joined Professionals in bullishness here.
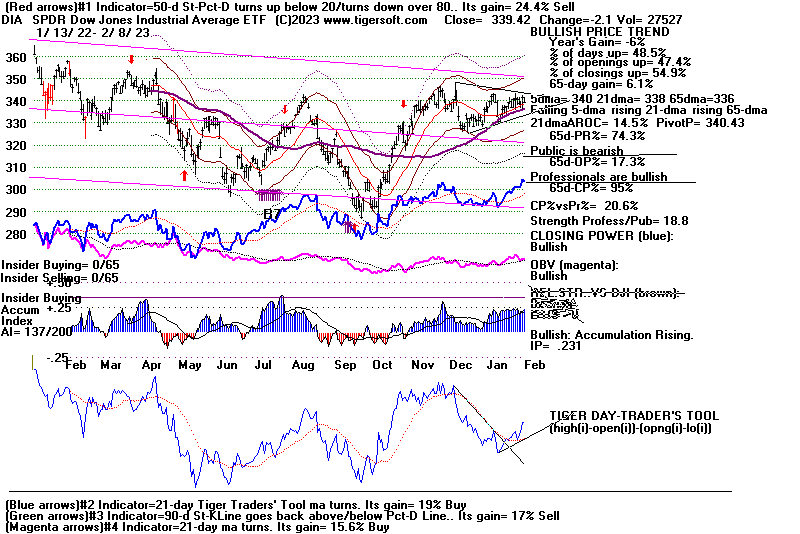 |
 |
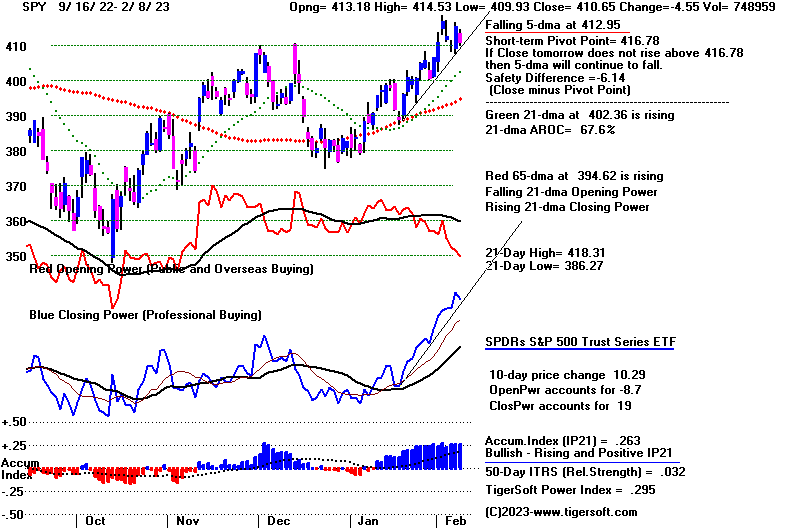 |
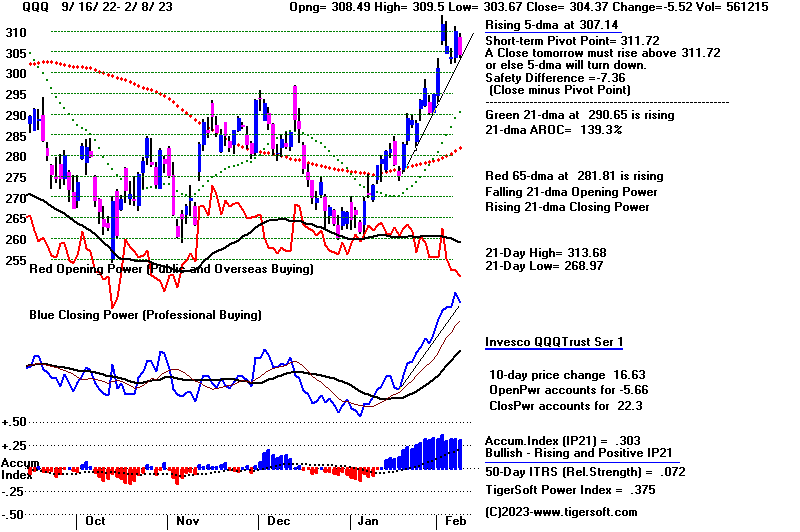 |
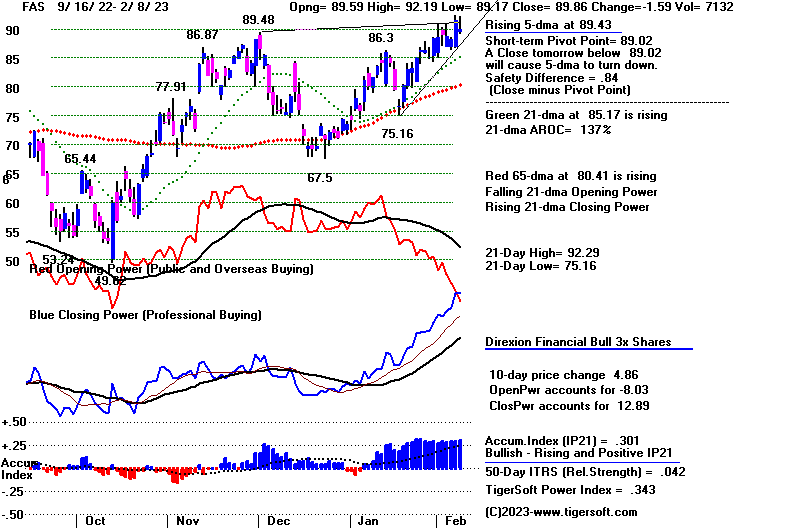 |
See how Day traders turned bearish
ahead of Professionals. H/S top marked top at end.
 |
Table 1 - Daily Breadth and Volume Statistics
| NYSE |
Latest Close |
Previous
Close |
Week Ago |
| Issues
traded |
3,180 |
3,174 |
3,210 |
| Advances |
1,009 |
1,909 |
2,227 |
| Declines |
2,045 |
1,154 |
855 |
| Unchanged |
126 |
111 |
128 |
| New
highs |
66 |
85 |
177 |
| New
lows |
6 |
8 |
8 |
| Adv.
volume* |
231,629,956 |
583,612,732 |
699,495,958 |
| Decl.
volume* |
568,195,050 |
312,304,307 |
325,612,493 |
| Total
volume* |
807,339,124 |
903,159,697 |
1,037,449,413 |
| Closing
Arms (TRIN)† |
1.02 |
0.99 |
1.21 |
| Block
trades* |
4,166 |
4,357 |
5,071 |
| Adv.
volume |
1,294,268,376 |
2,700,045,339 |
3,283,160,285 |
| Decl.
volume |
2,683,364,342 |
1,620,767,045 |
1,525,217,133 |
| Total
volume |
4,029,826,471 |
4,355,866,857 |
4,856,937,878 |
| NASDAQ |
Latest Close |
Previous
Close |
Week Ago |
| Issues
traded |
4,785 |
4,747 |
4,828 |
| Advances |
1,419 |
2,641 |
3,147 |
| Declines |
3,141 |
1,862 |
1,428 |
| Unchanged |
225 |
244 |
253 |
| New
highs |
100 |
103 |
186 |
| New
lows |
47 |
43 |
34 |
| Closing
Arms (TRIN)† |
1.05 |
0.93 |
0.51 |
| Block
trades |
33,782 |
37,522 |
42,103 |
| Adv.
volume |
1,506,920,076 |
3,428,905,139 |
5,083,996,039 |
| Decl.
volume |
3,513,337,901 |
2,238,240,997 |
1,183,029,364 |
| Total
volume |
5,052,872,994 |
5,720,245,945 |
6,336,042,685 |
|
Table 2 QUICKSILVER on ETFS - 2/8/2023 ---
     Bullish = 13       COMPQX,  SPY, QQQ, MDY,TECL, IBB, IWM, FAS, RETL, SOXL.
                        GLD, OIH   YINN (highest 0.81)
     Bearish = 0
ETF       CLOSE   CHANGE    PIVOT-PT    5-dma AROC    CL-PWR  CANDLE  IP21   ITRS   POWER INDEX
================================================================================================
DIA       339.42  -2.1       340.43       -21.3%     Bullish  RED    .232    0         ----
---------------------------------------------------------------------------------------------
COMPQX    11910.52  -203.27  12200.82      39.2%     -------  RED    .336    .073     .409
---------------------------------------------------------------------------------------------
SPY       410.65  -4.54      416.78       -1.8%      Bullish  RED    .263    .033     .296
---------------------------------------------------------------------------------------------
QQQ       304.37  -5.51      311.72        56.3%     -------  RED    .303    .073     .376
---------------------------------------------------------------------------------------------
MDY       486.06  -5.86      497.12       -55.2%     Bullish  RED    .253    .052     .305
---------------------------------------------------------------------------------------------
IWM       192.72  -2.86      198.32       -45.2%     -------  RED    .334    .05      .384
---------------------------------------------------------------------------------------------
FAS       89.86  -1.58       89.02         77.9%     Bullish  BLUE   .302    .042     .344
---------------------------------------------------------------------------------------------
RETL      10.73  -.49        12.55        -348.6%    -------  RED    .219    .164     .383
---------------------------------------------------------------------------------------------
SOXL      16.49  -1.1        17.92        -90.8%     -------  RED    .3    .294       .594
---------------------------------------------------------------------------------------------
TECL      31.76  -1.2        32.66         246.3%    -------  RED    .287    .138     .425
---------------------------------------------------------------------------------------------
IBB       133.33  -2.99      137.17       -123.8%    -------  RED    .295    .008     .303
---------------------------------------------------------------------------------------------
GLD       174.41   .43       177.9        -206.1%    -------  RED    .176    .08      .256
---------------------------------------------------------------------------------------------
DBO       15.02   .18        14.63         89.2%     Bearish  ----   .001    .011     .012
---------------------------------------------------------------------------------------------
OIH       329.01   5.15      313.87        25.8%     Bullish  BLUE   .163    .112     .275
---------------------------------------------------------------------------------------------
CPER     24.57  -.17         24.82        -175.3%    -------  RED    .1    .138       .238
---------------------------------------------------------------------------------------------
TAN     78.02  -.9           81.7         -286.6%    -------  RED    .192   -.042     .15
---------------------------------------------------------------------------------------------
UUP       27.93   .03        27.43         122.9%    -------  ----  -.049   -.011    -.06
---------------------------------------------------------------------------------------------
CORN      26.61   .11        26.49        -15%       Bullish  BLUE   .061    .011     .072
---------------------------------------------------------------------------------------------
WEAT      7.79   .12         7.71          45.5%     Bullish  BLUE   .163   -.023     .14
---------------------------------------------------------------------------------------------
YINN      55.19  -2.28       63.66        -1023.3%   -------  RED    .204    .677     .881
|
Table 2 RANKING OF KEY DIRECTORIES BASED PCT.OF STOCKS ABOVE 65-DMA
2/8/23
Bullish = 41
Bearish = 6
---------------------------------------------------------------------------------------
Directory Current day-1 day-2 day-3 day-4 day-5
----------------------------------------------------------------------------------------
COPPER 1 1 1 1 1 1
EDU 1 1 1 1 1 1
HOMEBLDG .944 .944 .944 1 1 .944
BONDFUND .919 .896 .908 .908 .908 .896
INSURANC .88 .88 .8 .72 .68 .8
INFRA .878 .909 .909 .939 .909 .969
SEMI .861 .893 .893 .904 .904 .893
=====
BIGBANKS .857 .857 .857 .857 .857 .857
AUTO .849 .849 .849 .849 .867 .905
JETS .846 .846 .846 .846 .846 .769
TRANSP .842 .842 .842 .894 .894 .894
SOFTWARE .839 .875 .857 .857 .857 .875
REIT .838 .876 .9 .915 .923 .907
ELECTRON .819 .849 .857 .864 .857 .857
ETFS .8 .818 .8 .872 .909 .89
CHINA .795 .818 .818 .818 .818 .818
CHEM .79 .744 .79 .813 .813 .813
GUNS .785 .785 .857 .857 .857 .857
GREEN .777 .888 .888 .888 .888 .833
HIGHPRIC .771 .814 .793 .818 .831 .857
FINANCE .762 .737 .737 .75 .725 .737
NIFTY .75 .818 .795 .818 .795 .818
RUS-1000 .744 .786 .767 .791 .821 .83
====
INDEXES .729 .756 .751 .745 .778 .772
INDMATER .708 .75 .736 .777 .833 .861
NASD-100 .69 .76 .74 .75 .82 .83
=====
HACKERS .687 .687 .687 .687 .687 .75
SP500 .68 .721 .696 .721 .762 .784
=====
FIDSTKS .662 .692 .656 .656 .727 .751
COMPUTER .65 .7 .6 .8 .8 .8
RETAIL .638 .702 .765 .765 .808 .723
GAMING .631 .789 .736 .789 .842 .789
MILITARY .615 .615 .615 .653 .653 .653
BIOTECH .61 .659 .644 .676 .673 .65
GOLD .608 .76 .695 .782 .891 .913
LOWPRICE .604 .633 .653 .656 .673 .647
HOSPITAL .571 .571 .642 .714 .785 .785
SP-100 .566 .611 .588 .6 .622 .633
REGBANKS .56 .64 .56 .72 .56 .48
FOOD .53 .551 .51 .551 .693 .693
COMODITY .512 .538 .538 .564 .692 .692
==========================================================================================
DOWJONES .5 .566 .5 .533 .533 .533
=====
SOLAR .5 .625 .687 .687 .812 .812
==========================================================================================
OILGAS .466 .485 .4 .438 .457 .523
DJI-13 .461 .461 .384 .384 .384 .384
BEVERAGE .428 .5 .571 .571 .571 .571
COAL .333 .333 .333 .666 .833 .666
UTILITY .184 .421 .473 .447 .815 .868
MARIJUAN .1 .1 .2 .2 .4 .4
|
===================================================================================
Wesdnesday - 5:57 - Futures: DJI -125 NASDAQ -47
Data Used 2-7-2023:
| |
2/7/2023
|
|
| |
The war between
bullish Professionals and bearish foreigners and the "public"
in our stock market is still to be
decided. Usually, the Professionals are proven correct
and emerge as winners. But in
our case, the outcome may depend on whether
you are talking about blue chips or
well-financed techs. Clearly, money is
coming out of dividend stocks to
buy potential growth tech stocks. That
may be the necessary outcome of the
FED increasing rates to 5% this Spring.
The nicely positive closings today
concealed the violently down, 500-DJI point,
intra-day air-pocket. These
are rare when Professionals really do have prices under
control. The same is true of
the bad NYSE data on 1/24. But Peerless is on
multiple Buys and an automatic
Peerless Sell will not easily be made at this point. But
note that the P-Indicator
(21-day ma of daily NYSE Advancers-Decliners) did break
its uptrend and a drop and closing
below the DJI's recent lows would not only break
a 4-month uptrendline and the A/D
Line, but complete a compact little head/shoulders
pattern on the DJI. So,
perhaps, despite today's rally, the DJI may still have to
drop back to its 3% lower band.
That does occur in 1/3 of the Februaries since
1931 in third years of the
Presidential cycle.
What's in the news that could cause
such a 4% drop in the DJI from here? Russian
battlefield successes against
Ukraine and new sabre-rattling by Putin towards
Poland? A political
stalemate over increasing the Federal debt limit.and a new
Federal budget? These
are only possibilities at this point and right now the stock
market, apart from the
defensive and blue chips, seems intent on bullishly "climbing
the wall of worry".
We saw more evidence today
that the steeply rising Closing Powers and
Tiger Day Traders'
(representing Professionals and Day Traders) are in control
for SPY, QQQ, the NASDAQ,
FAS, SOXL, IWM and MDY. It is mainly
defenisive (dividend-paying)
and blue-chips that would seem moderately
vulnernerable. Look at
the leading semi-conductors shown below: NVDA,
ACLS, TER and CRUS and LSCC
below. Each is running and powered by
very high Accumulation and
steeply rising Closing Powers and our Day Traders'
Tool. These stocks,
too, still show weak openings and a lack of Public buying, but
they are in
"strong hands" and have the aggressive support of Professionals,
big funds and day
traders. These quickest rising semi-conductors feature the
new wave, artificial
intelligence built into chips. They are speculative, sure, but
as long as they keep
advancing, and abide by their up-trends, it's hard to make
a case for a market
top. Keep in mind that this is the year that Congressional
politicians, no matter
what they say, want to keep constituents employed
and campaign
contributors happy. |
|
| |
Charts - 2/7/2023
2022 PEERLESS DJI, Signals, Indicators Daily DJI Volume
10-DayUp/Down Vol Stoch-20 CCI RSI Pct of All Stocks above 65-dma
Inverted Traders Index
DJI-IPA DJI-OBV Short-Term Rates
NASDAQ S&P OEX NYSE DJ-15 DJ-20 DJI-30 Bond Funds
DIA QQQ SPY IWM new - COIN (Bit Coin ETF)
Gold Stocks
Semi Conductors
TNA Short-Term Rates Ten Year Rates PST (Short Treasuries)
DOLLAR-UUP
ALLSTOCKs
Russell-1000
Insurance-Stocks
Recent 2006 vers-Peerless signals
http://www.tigersoftware.com/OLDPEER/UPD90207.bmp
MDY - http://www.tigersoftware.com/CHARTX/MDY.GIF
USO-CrudeOil DBO FAS GLD HD IBB JETS JNUG KOL NAIL NUGT NRGU OIH
PALL RSX RETL SDS AGQ SLV SOXL TAN TECL TLT TMF TNA UGA USO
China:
YINN CHAU
Commodities: CANE
CORN DBC JJC, NIB CORN, CUT (paper)
MOO, NRGU
SOYB WEAT UUP (Dollar) LIT
(Lithium) PALL
(Palladium)
Stocks AA AAPL ADBE ALXN AMAT AMGN AMD AMZN AXP BA BABA
BAC BIDU BLDP CAT CHKP CNX CPB CRM CVX CMG DE DIS ENPH FB FSLR
FTNT GILD GME GOOG GS HD IBM INTU JPM KO KR LRCX MRK MRNA
MOS MSFT NEM NFLX NKE NOC NUE NVDA PANW PG PYPL REGN REV
SO QCOM QDEL TSLA TXN XOM V VRTX WFC WMT XLE ZM ZOM
Leveraged Short ETFs:
FAZ - financials, TZA and SRTY- small caps, MZZ - mid caps, TECS -Techs,
SOXS -
semi-conductors LABD
- Biotechs
Bullish MAXCPs
http://www.tigersoftware.com/UPPING/2-7-2023/BULLISH.htm
Bearish MINCPs
http://www.tigersoftware.com/Downing/2-7-2023/BEARISH.htm |
|
Today. the P-Indicator uptrend
was broken. The A/D :Line remains intact.
 |
The converging Opening Power and Closing Power in DIA are at a standoff.
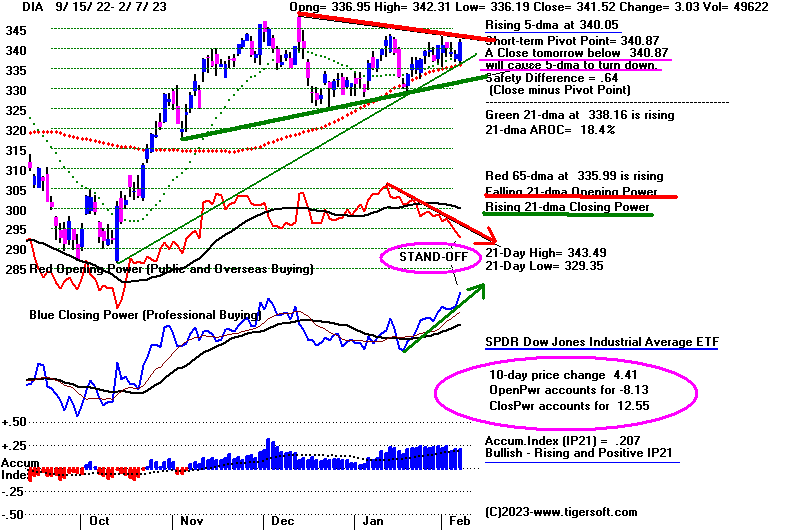 |
Reflecting its tech and non-DJI components'
strength, the Closing Power pushed
SPY back to its recent high.
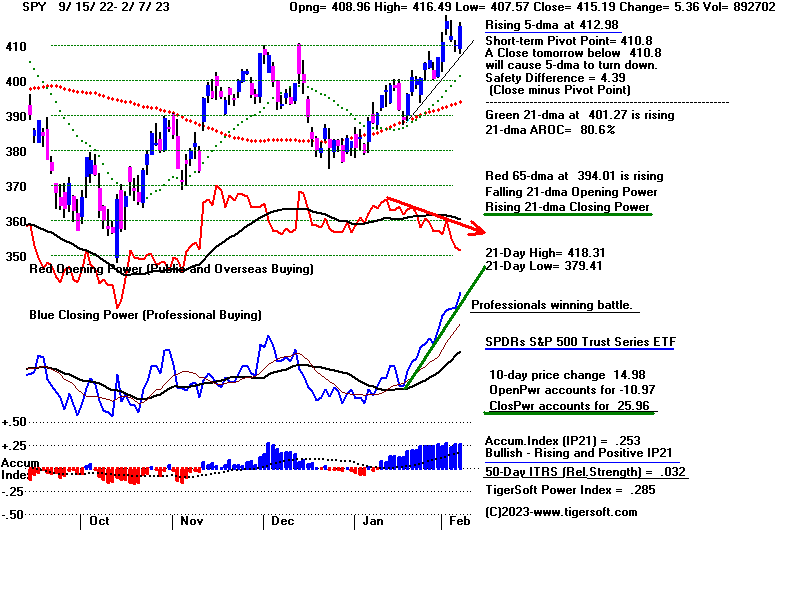 |
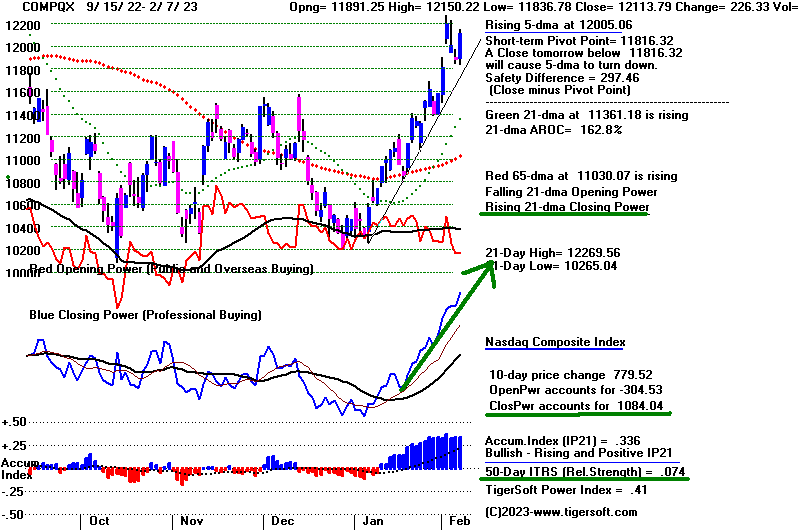 |
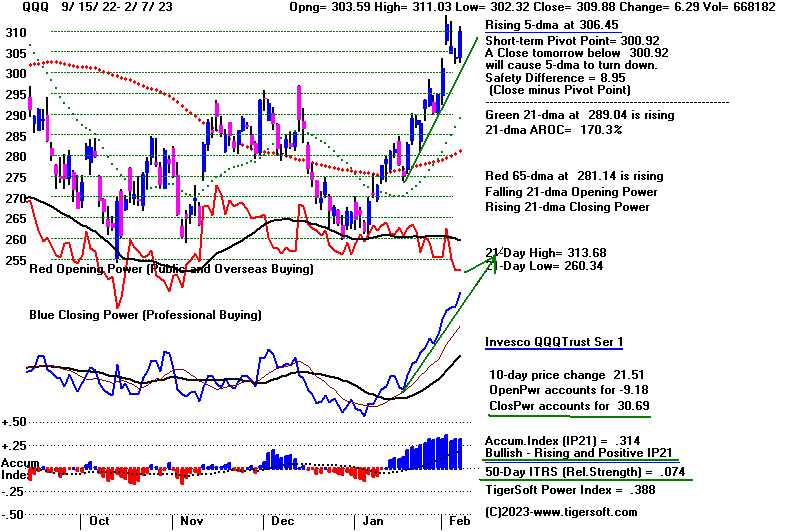 |
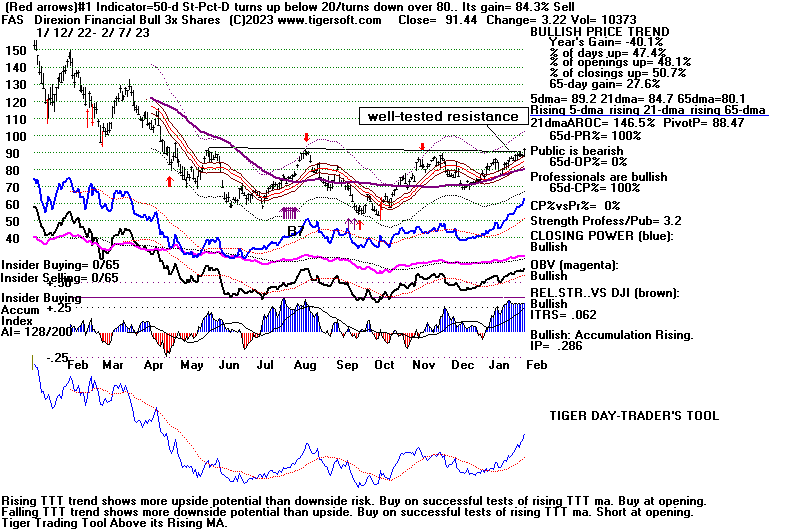 |
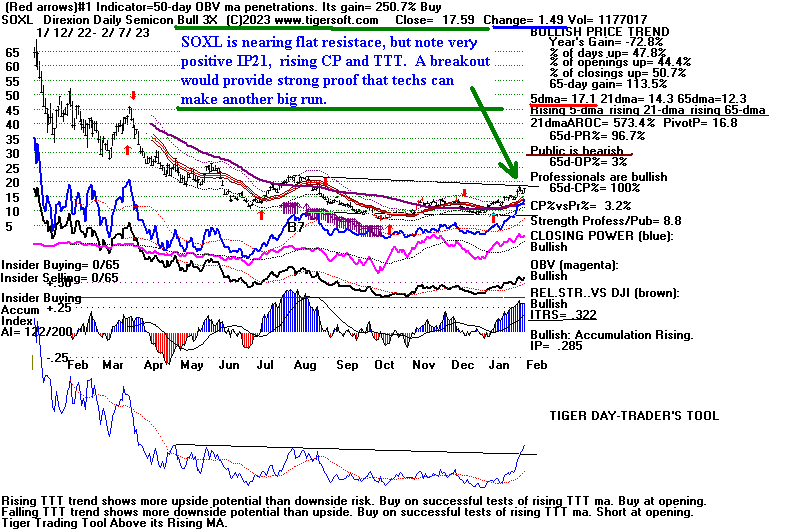 |
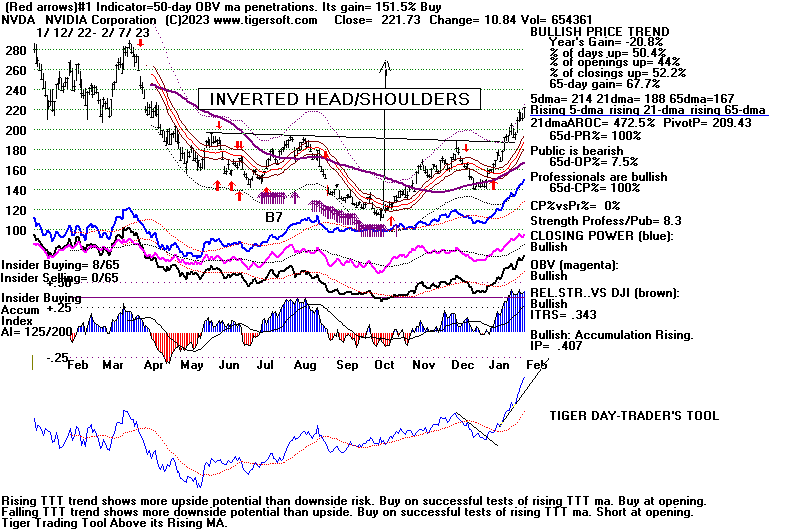 |
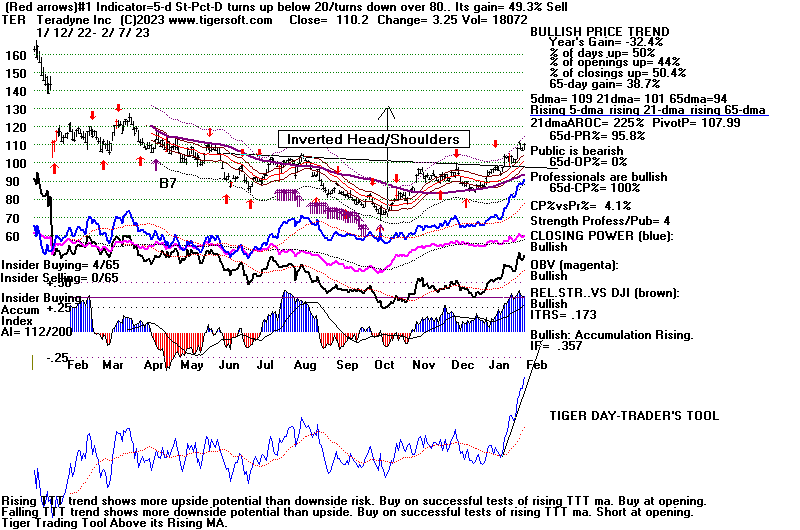 |
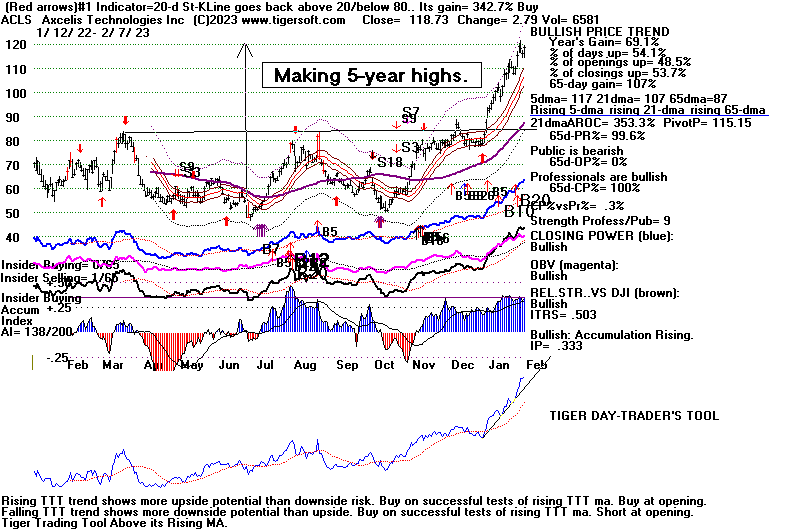 |
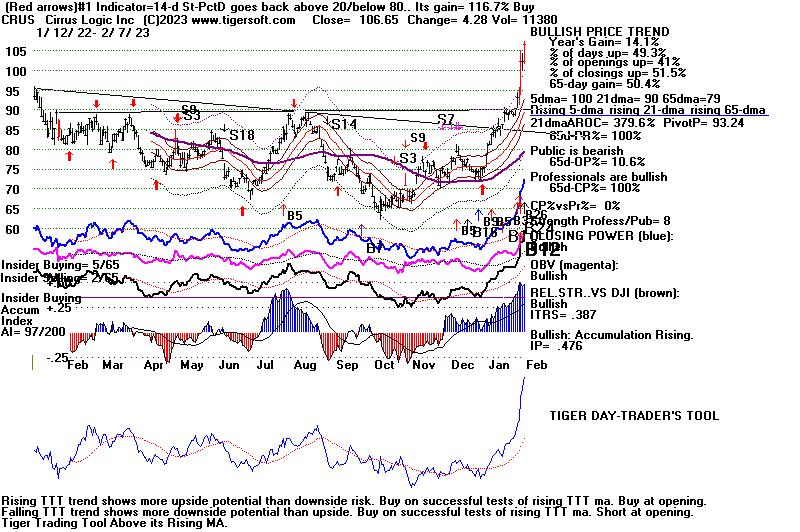 |
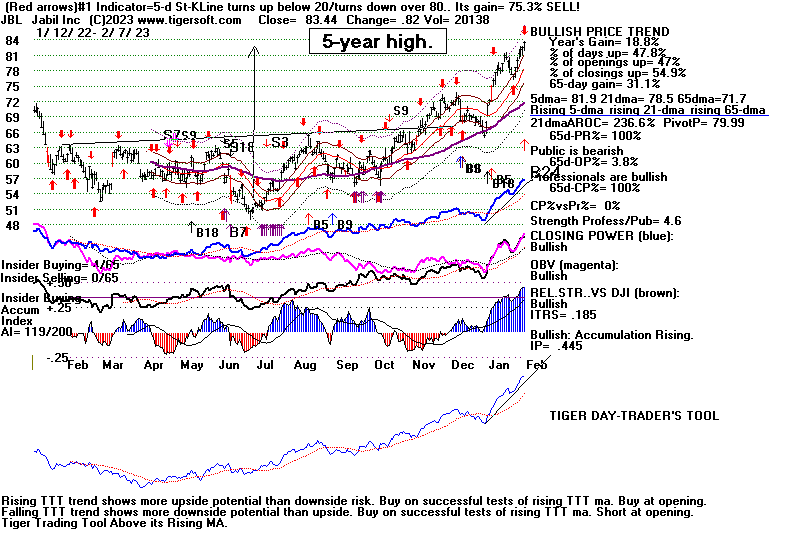 |
Table 1 - Daily Breadth and Volume Statistics
| NYSE |
Latest Close |
Previous
Close |
Week Ago |
| Issues
traded |
3,174 |
3,217 |
3,209 |
| Advances |
1,909 |
774 |
2,636 |
| Declines |
1,154 |
2,333 |
478 |
| Unchanged |
111 |
110 |
95 |
| New
highs |
85 |
61 |
104 |
| New
lows |
8 |
12 |
4 |
| Adv.
volume* |
583,612,732 |
235,068,186 |
1,152,669,189 |
| Decl.
volume* |
312,304,307 |
590,685,219 |
122,350,026 |
| Total
volume* |
903,159,697 |
845,054,157 |
1,278,643,358 |
| Closing
Arms (TRIN)† |
0.99 |
0.71 |
0.61 |
| Block
trades* |
4,357 |
4,121 |
4,872 |
| Adv.
volume |
2,700,045,339 |
1,281,548,784 |
4,182,478,944 |
| Decl.
volume |
1,620,767,045 |
2,730,038,009 |
459,487,807 |
| Total
volume |
4,355,866,857 |
4,114,244,066 |
4,679,324,627 |
| NASDAQ |
Latest Close |
Previous
Close |
Week Ago |
| Issues
traded |
4,747 |
4,783 |
4,812 |
| Advances |
2,641 |
1,532 |
3,479 |
| Declines |
1,862 |
3,025 |
1,115 |
| Unchanged |
244 |
226 |
218 |
| New
highs |
103 |
91 |
134 |
| New
lows |
43 |
32 |
31 |
| Closing
Arms (TRIN)† |
0.93 |
0.71 |
0.87 |
| Block
trades |
37,522 |
42,264 |
41,942 |
| Adv.
volume |
3,428,905,139 |
2,293,115,865 |
4,407,516,789 |
| Decl.
volume |
2,238,240,997 |
3,207,488,935 |
1,235,909,604 |
| Total
volume |
5,720,245,945 |
5,538,355,498 |
5,695,153,586 |
|
Table 2
QUICKSILVER on ETFS - 2/7/2023 --- Bullish = 12 (+0) COMPQX, SPY, QQQ, MDY, IWM, FAS, RETL, SOXL. TECL. IBB
GLD, YINN (highest 0.81)
Bearish = 0
ETF       CLOSE   CHANGE    PIVOT-PT    5-dma AROC    CL-PWR  CANDLE  IP21   ITRS   POWER INDEX
================================================================================================
DIA       341.52   3.04      340.87        10.1%      Bullish  BLUE   .208    ----     ----
---------------------------------------------------------------------------------------------
COMPQX    12113.79   226.34  11816.32      222.4%     Bullish  BLUE   .336    .075     .411
---------------------------------------------------------------------------------------------
SPY       415.19   5.36      410.8         105.9%     Bullish  BLUE   .253    .033     .286
---------------------------------------------------------------------------------------------
QQQ       309.88   6.29      300.92        251.5%     Bullish  BLUE   .314    .074     .388
---------------------------------------------------------------------------------------------
MDY       491.92   3.69      491.5         83.2%      Bullish  BLUE   .247    .059     .306
---------------------------------------------------------------------------------------------
IWM       195.58   1.44      194.49        105.1%     -------  BLUE   .327    .057     .384
---------------------------------------------------------------------------------------------
FAS       91.44   3.22       88.47         175.1%     Bullish  BLUE   .287    .062     .349
---------------------------------------------------------------------------------------------
RETL      11.22  -.16        11.55         270.7%     -------  BLUE   .185    .199     .384
---------------------------------------------------------------------------------------------
SOXL      17.59   1.49       16.8          932.9%     -------  BLUE   .285    .322     .607
---------------------------------------------------------------------------------------------
TECL      32.96   2.27       30.2          769.8%     -------  BLUE   .294    .149     .443
---------------------------------------------------------------------------------------------
IBB       136.32   .71       136.71       -8.4%       -------  BLUE   .255    .022     .277
---------------------------------------------------------------------------------------------
GLD       173.98   .16       181.67       -153.2%     Bullish  BLUE   .151    .068     .219
---------------------------------------------------------------------------------------------
DBO       14.84   .4         14.76        -92.3%      Bearish  BLUE  -.072   -.019    -.091
---------------------------------------------------------------------------------------------
OIH       323.86   7.3       327.36       -96.5%      Bullish  BLUE   .099    .073     .172
---------------------------------------------------------------------------------------------
CPER     24.74   .21         25.44        -180%       -------  BLUE   .088    .128     .216
---------------------------------------------------------------------------------------------
TAN     78.92  -.24          82.63        -116.3%     -------  RED    .2     -.04      .16
---------------------------------------------------------------------------------------------
UUP       27.9  -.05         27.25         70.7%      -------  RED   -.048   -.023    -.071
---------------------------------------------------------------------------------------------
CORN      26.5  -.16         26.69        -15%        Bullish  RED    .042    .005     .047
---------------------------------------------------------------------------------------------
WEAT      7.67   .03         7.72         -32.5%      Bullish  ----   .082   -.061     .021
---------------------------------------------------------------------------------------------
YINN      57.47   1.36       67.62        -489.9%     Bearish  RED    .164    .646     .81
|
Table 3       RANKING OF KEY DIRECTORIES BASED PCT.OF STOCKS ABOVE 65-DMA
               2/7/23
Bullish =  43
Bearish = 5
---------------------------------------------------------------------------------------
Directory     Current       day-1         day-2         day-3         day-4         day-5
----------------------------------------------------------------------------------------
COPPER         1             1             1             1             1             1
EDU            1             1             1             1             1             1
HOMEBLDG       .944          .944          1             1             .944          .944
INFRA          .909          .909          .939          .909          .969          .969
BONDFUND       .896          .908          .908          .908          .919          .896
SEMI           .893          .893          .904          .904          .882          .861
               ----
GREEN          .888          .888          .888          .888          .833          .833
INSURANC       .88           .8            .72           .68           .8            .96
REIT           .876          .892          .923          .93           .9            .907
SOFTWARE       .875          .875          .857          .857          .875          .839
BIGBANKS       .857          .857          .857          .857          .857          .857
               -----
AUTO           .849          .867          .849          .867          .905          .867
ELECTRON       .849          .857          .864          .857          .849          .812
JETS           .846          .846          .846          .846          .769          .846
TRANSP         .842          .842          .894          .894          .894          .789
CHINA          .818          .818          .818          .818          .818          .795
ETFS           .818          .8            .872          .909          .909          .89
NIFTY          .818          .795          .818          .795          .818          .818
HIGHPRIC       .814          .793          .818          .831          .857          .806
GAMING         .789          .736          .736          .894          .789          .842
RUS-1000       .786          .767          .791          .821          .828          .804
               -----
GUNS           .785          .857          .857          .857          .857          .785
GOLD           .76           .695          .782          .891          .913          .913
NASD-100       .76           .74           .75           .82           .83           .79
               -----
INDEXES        .756          .751          .745          .778          .772          .794
INDMATER       .75           .736          .777          .833          .861          .833
CHEM           .744          .79           .813          .813          .813          .79
FINANCE        .737          .737          .75           .712          .737          .787
SP500          .721          .696          .723          .758          .786          .758
               -----
RETAIL         .702          .765          .765          .808          .723          .744
COMPUTER       .7            .6            .8            .8            .8            .7
FIDSTKS        .692          .656          .656          .727          .751          .745
HACKERS        .687          .687          .687          .687          .75           .687
BIOTECH        .659          .642          .678          .673          .65           .642
REGBANKS       .64           .56           .72           .56           .48           .44
LOWPRICE       .633          .656          .659          .673          .647          .621
SOLAR          .625          .687          .687          .812          .812          .687
MILITARY       .615          .615          .653          .653          .653          .615
SP-100         .611          .588          .6            .622          .633          .588
HOSPITAL       .571          .642          .714          .785          .785          .642
DOWJONES       .566          .5            .533          .533          .533          .533
               -----
FOOD           .551          .51           .53           .693          .693          .714
COMODITY       .538          .538          .538          .692          .692          .717
================================================================================================
BEVERAGE       .5            .571          .571          .571          .571          .571
================================================================================================
OILGAS         .485          .4            .438          .457          .523          .6
DJI-13         .461          .384          .384          .384          .384          .461
UTILITY        .421          .473          .447          .815          .868          .763
COAL           .333          .333          .666          .833          .666          .666
MARIJUAN       .1            .2            .2            .4            .4            .2
|
----------------------------------------------------------------------------------------------------------------------------
----------------------------------------------------------------------------------------------------------------------------
Tuesday - 6:07 AM - Futures: DJI -78 NASDAQ -16
Data Used 2-6-2023:
| |
2-6-2023
|
|
| |
Dullness in the DJI is reaching a point where we must expect a jump in
volatility. But
let's not short a dull market. There are still many more new highs
than lows and Peerless
remains on it Buys.
We have been trusting
the bullish seasonality, the rising A.D. Line, positive P-I and
Accumulation Indicators
and the usual bullishness of the beginning of third years
in the four year
Presidential cycle, but Jerome Powell, the Fed Chairman gives a
speech in Washington at
mid-day. Are Professionals really informed in advance
here and will they be
correct in betting on Powell not acting too "hawkishness"?
I looked back at the
seasonality of the third year Februaries since 1931, rather
than only to 1967.
I found 8 February tops in these years. That's in 23 total cases.
In 1931, 1935 and 1947,
the tops brought declines of 10% of more. But since 1971,
there have been only 2
February tops. In 2007, the top sent the DJI to the 3%
lower band and in 2019
to the lower 2% band. So, like I said yesterday, we thus
might expect a
limited decline below the 21-day ma. And that should bring a
Buy B9. Right?
Well, if Powell turns
"hawkish" tomorrow, that will almost certainly be bad for
breadth and that will break
the uptrend of the NYSE A/D Line. In addition,
if Powell talks like a haw
tomorrow, that will probably break the price uptrend-line
for the DJI going back to the
start of October. Such breaks would add to the decline.
So, a DJI decline to the
lower 3% band would then become likely. We might even
get a Sell S4 if the
IP21-Accum.Index falls below its 21-day ma, But the lower
band should bring in new
Peerless Buys.
At that point, there should
be support again for the market, but it will probably
favor the stocks and ETFs
that have been most resistant to the decline. We still
have up-trends in our Closing
Powers and TTTs for the strongest techs. So, they
would again be favored.
But for now, I would expect
Powell to elegantly equivocate and talk like a "two-
handed" economist.
If so, look for another rebound. |
|
| |
Charts - 2/6/2023
2022 PEERLESS DJI, Signals, Indicators Daily DJI Volume
10-DayUp/Down Vol Stoch-20 CCI RSI Pct of All Stocks above 65-dma
Inverted Traders Index
DJI-IPA DJI-OBV Short-Term Rates
NASDAQ S&P OEX NYSE DJ-15 DJ-20 DJI-30 Bond Funds
DIA QQQ SPY IWM new - COIN (Bit Coin ETF)
Gold Stocks
TNA Short-Term Rates Ten Year Rates PST (Short Treasuries)
DOLLAR-UUP
ALLSTOCKs
Russell-1000
Insurance-Stocks
Recent 2006 vers-Peerless signals
http://www.tigersoftware.com/OLDPEER/UPD90206.bmp
MDY - http://www.tigersoftware.com/CHARTX/MDY.GIF
USO-CrudeOil DBO FAS GLD HD IBB JETS JNUG KOL NAIL NUGT NRGU OIH
PALL RSX RETL SDS AGQ SLV SOXL TAN TECL TLT TMF TNA UGA USO
China:
YINN CHAU
Commodities: CANE
CORN DBC JJC, NIB CORN, CUT (paper)
MOO, NRGU
SOYB WEAT UUP (Dollar) LIT
(Lithium) PALL
(Palladium)
Stocks AA AAPL ADBE ALXN AMAT AMGN AMD AMZN AXP BA BABA
BAC BIDU BLDP CAT CHKP CNX CPB CRM CVX CMG DE DIS ENPH FB FSLR
FTNT GILD GME GOOG GS HD IBM INTU JPM KO KR LRCX MRK MRNA
MOS MSFT NEM NFLX NKE NOC NUE NVDA PANW PG PYPL REGN REV
SO QCOM QDEL TSLA TXN XOM V VRTX WFC WMT XLE ZM ZOM
Leveraged Short ETFs:
FAZ - financials, TZA and SRTY- small caps, MZZ - mid caps, TECS -Techs,
SOXS -
semi-conductors LABD
- Biotechs
Bullish MAXCPs http://www.tigersoftware.com/UPPING/2-6-2023/BULLISH.htm
Bearish MINCPs
http://www.tigersoftware.com/Downing/2-6-2023/BEARISH.htm |
|
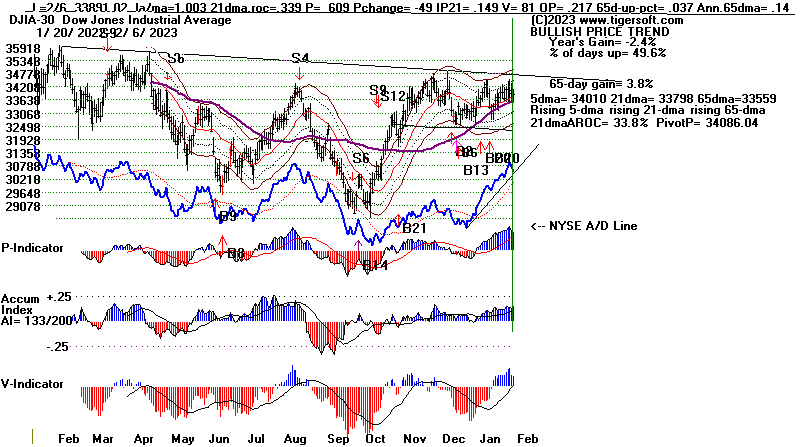 |
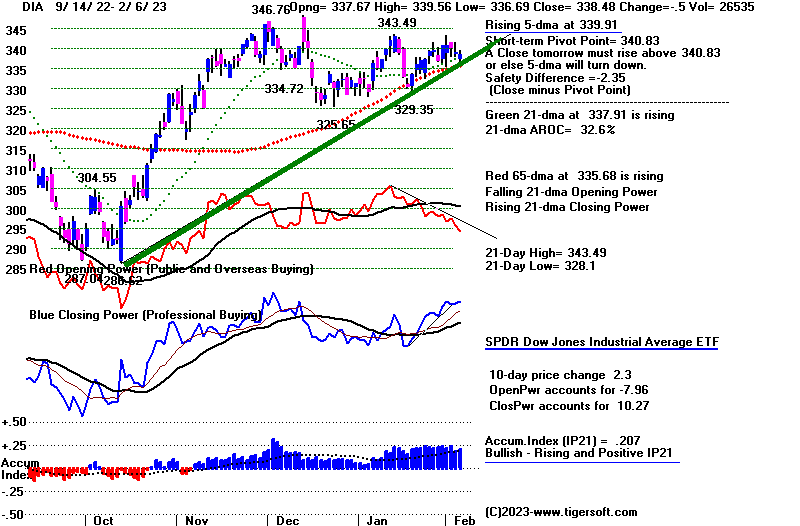 |
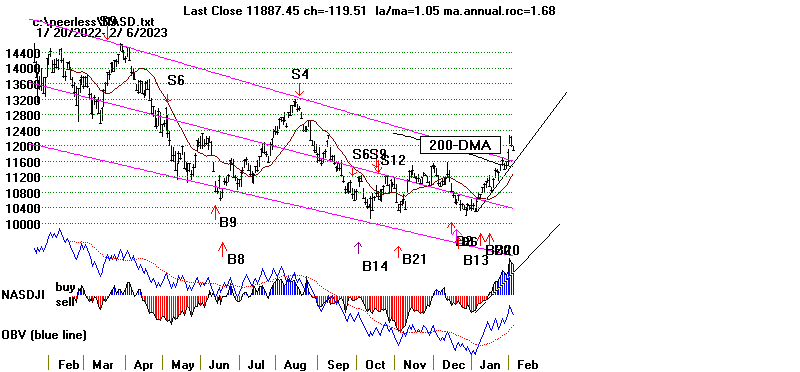 |
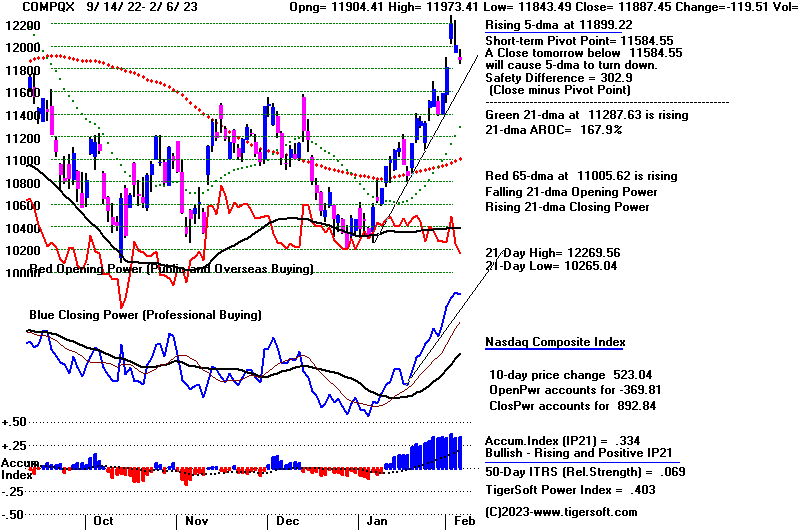 |
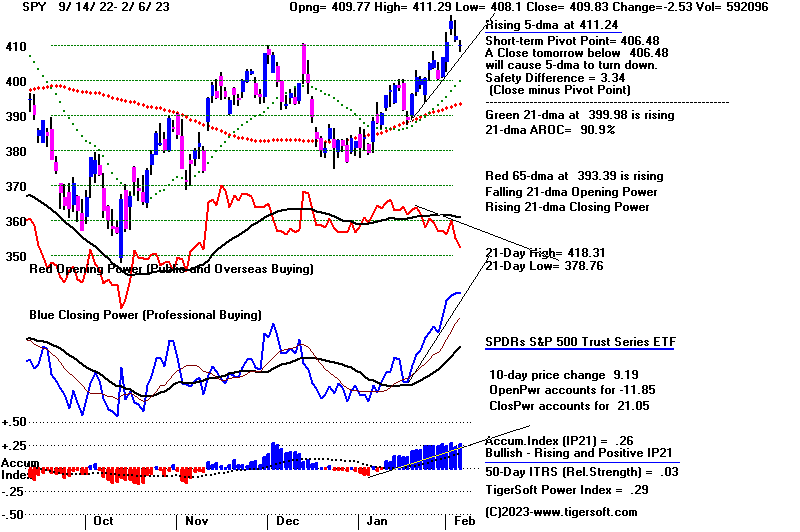 |
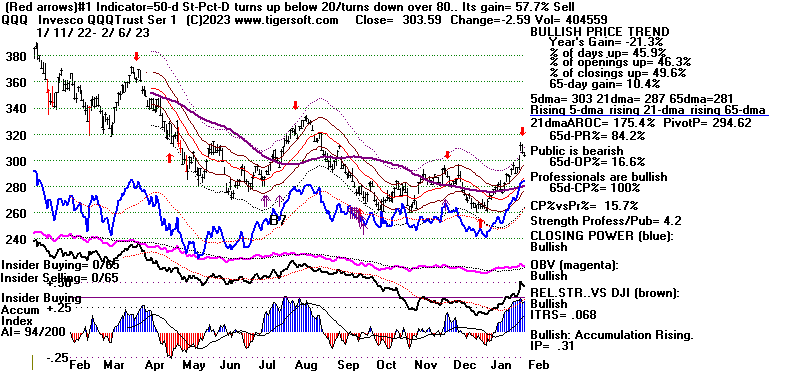 |
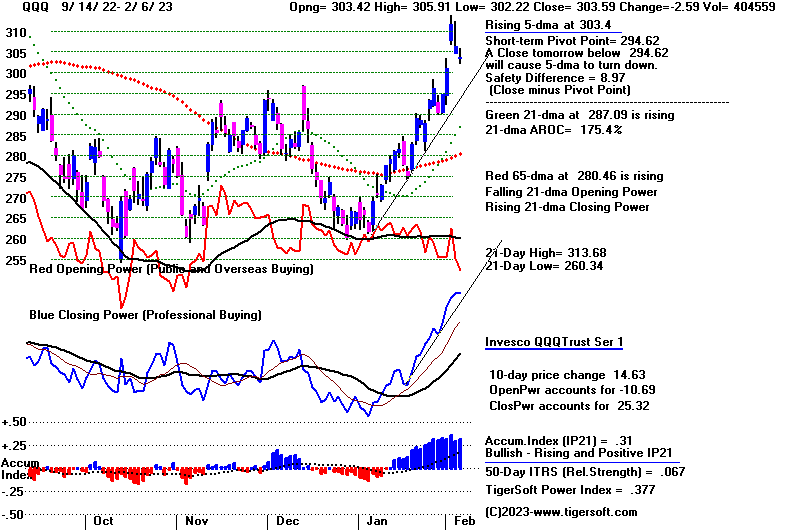 |
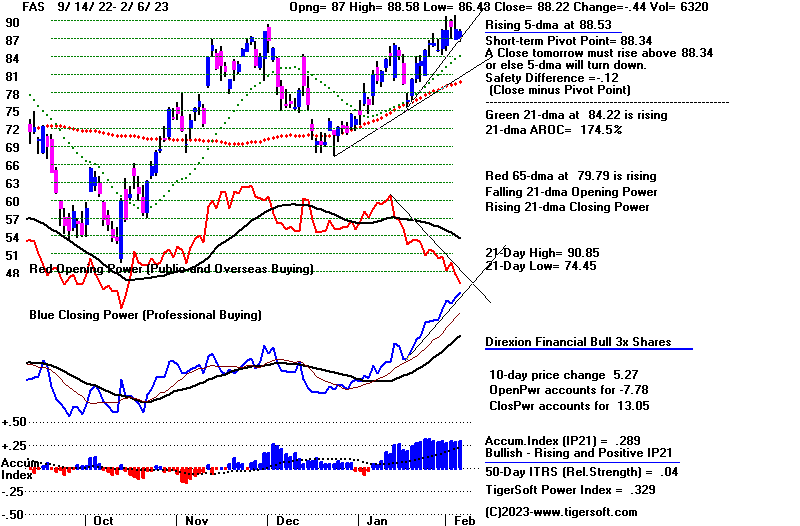 |
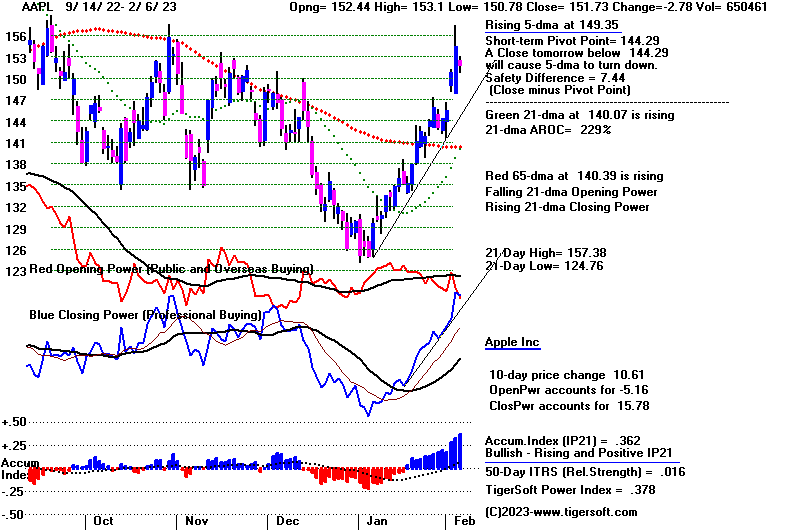 |
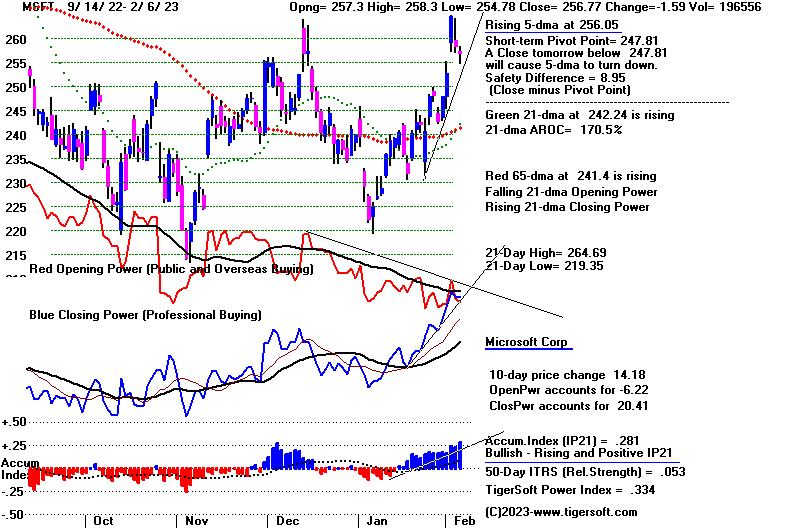 |
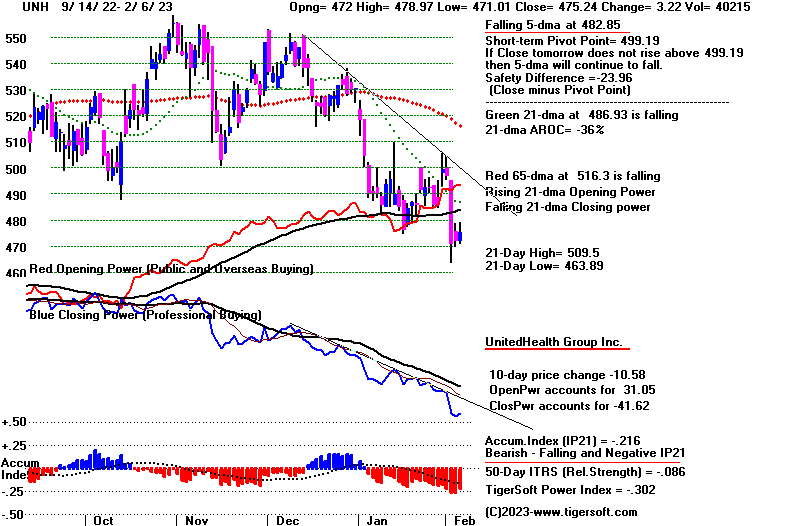 |
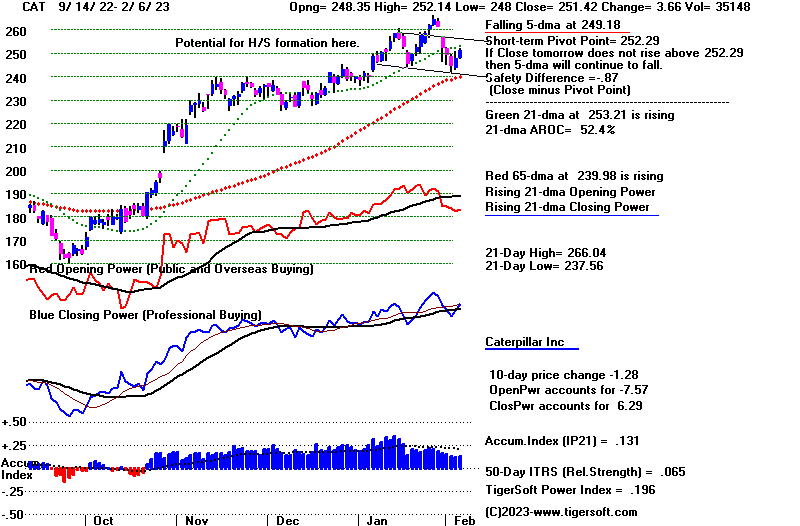 |
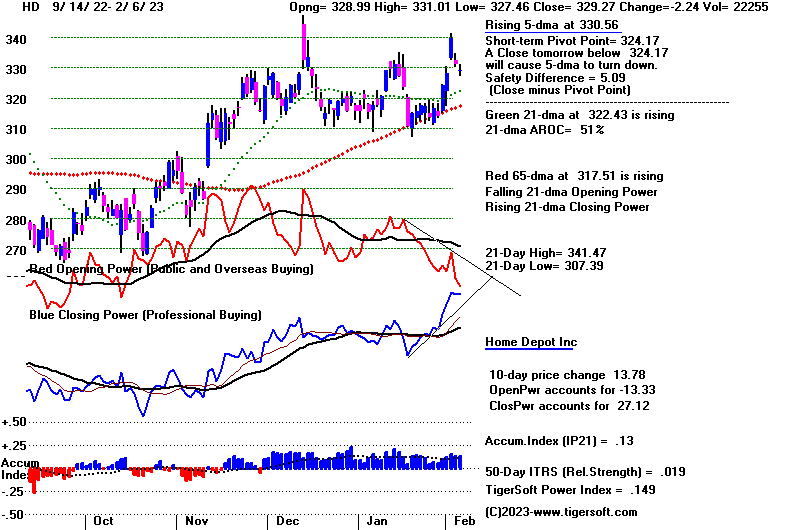 |
Table 1 - Daily Breadth and Volume Statistics
| NYSE |
Latest Close |
Previous
Close |
Week Ago |
| Issues
traded |
3,217 |
3,180 |
3,212 |
| Advances |
774 |
837 |
981 |
| Declines |
2,333 |
2,248 |
2,092 |
| Unchanged |
110 |
95 |
139 |
| New
highs |
61 |
121 |
64 |
| New
lows |
12 |
4 |
8 |
| Adv.
volume* |
235,068,186 |
236,306,245 |
182,240,398 |
| Decl.
volume* |
590,685,219 |
723,354,338 |
593,156,391 |
| Total
volume* |
845,054,157 |
975,003,578 |
787,069,534 |
| Closing
Arms (TRIN)† |
0.71 |
1.07 |
1.29 |
| Block
trades* |
4,121 |
4,845 |
4,082 |
| Adv.
volume |
1,281,548,784 |
1,185,075,029 |
994,261,359 |
| Decl.
volume |
2,730,038,009 |
3,419,334,522 |
2,740,467,635 |
| Total
volume |
4,114,244,066 |
4,694,517,247 |
3,802,006,926 |
| NASDAQ |
Latest Close |
Previous
Close |
Week Ago |
| Issues
traded |
4,783 |
4,811 |
4,843 |
| Advances |
1,532 |
1,719 |
1,505 |
| Declines |
3,025 |
2,858 |
3,121 |
| Unchanged |
226 |
234 |
217 |
| New
highs |
91 |
142 |
89 |
| New
lows |
32 |
24 |
20 |
| Closing
Arms (TRIN)† |
0.71 |
0.90 |
1.19 |
| Block
trades |
42,264 |
39,814 |
37,690 |
| Adv.
volume |
2,293,115,865 |
2,366,109,149 |
1,462,616,744 |
| Decl.
volume |
3,207,488,935 |
3,543,265,996 |
3,605,075,728 |
| Total
volume |
5,538,355,498 |
5,954,499,933 |
5,122,326,100 |
|
Table 2
Table 2 QUICKSILVER on ETFS - 2/6/2023 ---
     Bullish = 12 (+0)     COMPQX,  SPY, QQQ, MDY,   IWM, FAS, RETL, SOXL. TECL. IBB
                           GLD,  YINN (highest 0.856)
     Bearish = 1           DBO   (UUP)
ETF       CLOSE   CHANGE    PIVOT-PT    5-dma AROC    CL-PWR  CANDLE  IP21   ITRS   POWER INDEX
================================================================================================
DIA       338.48  -.5        340.83        20.9%      Bullish  BLUE    .208    0        ----
---------------------------------------------------------------------------------------------
COMPQX    11887.45  -119.51  11584.55      209.2%     Bullish  RED    .334    .071     .405
---------------------------------------------------------------------------------------------
SPY       409.83  -2.52      406.48        112.8%     Bullish  BLUE   .261    .032     .293
---------------------------------------------------------------------------------------------
QQQ       303.59  -2.59      294.62        221.5%     Bullish  BLUE   .311    .069     .38
---------------------------------------------------------------------------------------------
MDY       488.23  -5.69      483.75        162.6%     Bullish  RED    .241    .058     .299
---------------------------------------------------------------------------------------------
IWM       194.14  -2.85      191.48        185.9%     Bullish  RED    .323    .058     .381
---------------------------------------------------------------------------------------------
FAS       88.22  -.43        88.34         176.9%     Bullish  BLUE   .29    .042      .332
---------------------------------------------------------------------------------------------
RETL      11.38  -.73        10.59         711.5%     -------  RED    .183    .24      .423
---------------------------------------------------------------------------------------------
SOXL      16.1  -.83         14.52         719%       -------  ----   .289    .255     .544
---------------------------------------------------------------------------------------------
TECL      30.69  -1.15       28.23         596.5%     -------  RED    .286    .104     .39
---------------------------------------------------------------------------------------------
IBB       135.61  -.98       136.55        29.7%      -------  RED    .229    .019     .248
---------------------------------------------------------------------------------------------
GLD       173.82   .36       179.41       -138.6%     Bullish  RED    .219    .08      .299
---------------------------------------------------------------------------------------------
DBO       14.44   .23        15.11        -142.7%     Bearish  BLUE  -.153   -.084    -.237
---------------------------------------------------------------------------------------------
OIH       316.56   .88       330.05       -102.6%     Bullish  RED    .079    .029     .108
---------------------------------------------------------------------------------------------
CPER     24.53  -.03         25.64        -166.9%     -------  ----   .099    .129     .228
---------------------------------------------------------------------------------------------
TAN     79.16  -.57          80.8          58.3%      -------  BLUE   .208   -.021     .187
---------------------------------------------------------------------------------------------
UUP       27.95   .16        27.51         69.1%      -------  ----  -.088   -.025    -.113
---------------------------------------------------------------------------------------------
CORN      26.66   .08        26.58         15%        Bullish  BLUE   .028    .023     .051
---------------------------------------------------------------------------------------------
WEAT      7.64  -.05         7.72          19.5%      Bullish  RED    .047   -.058    -.011
---------------------------------------------------------------------------------------------
YINN      56.11  -2.71       63.54        -666.9%     -------  BLUE   .183    .673     .856
|
Table 3
 Table 3       RANKING OF KEY DIRECTORIES BASED PCT.OF STOCKS ABOVE 65-DMA
               2/6/23
 Bullish = 43
 Bearish = 5
---------------------------------------------------------------------------------------
Directory     Current       day-1         day-2         day-3         day-4         day-5
----------------------------------------------------------------------------------------
COPPER         1             1             1             1             1             1
EDU            1             1             1             1             1             1
HOMEBLDG       .944          1             1             .944          .944          .833
               ====
INFRA          .909          .939          .909          .969          1             .939
BONDFUND       .908          .908          .908          .919          .908          .896
SEMI           .893          .904          .904          .882          .861          .819
               =====
REIT           .892          .915          .938          .907          .9            .815
GREEN          .888          .888          .888          .833          .833          .666
SOFTWARE       .875          .875          .857          .875          .839          .696
AUTO           .867          .867          .867          .905          .867          .754
BIGBANKS       .857          .857          .857          .857          .857          .714
ELECTRON       .857          .864          .857          .849          .812          .774
GUNS           .857          .857          .857          .857          .785          .785
JETS           .846          .846          .846          .769          .846          .769
TRANSP         .842          .894          .894          .894          .789          .526
CHINA          .818          .818          .818          .818          .795          .772
ETFS           .8            .872          .909          .909          .909          .872
INSURANC       .8            .72           .68           .8            .96           .8
NIFTY          .795          .818          .795          .818          .818          .75
HIGHPRIC       .793          .818          .831          .857          .81           .719
CHEM           .79           .813          .813          .813          .79           .72
RUS-1000       .767          .791          .821          .828          .806          .726
               =====
RETAIL         .765          .765          .808          .723          .723          .617
INDEXES        .751          .745          .778          .772          .794          .778
NASD-100       .74           .75           .82           .83           .79           .71
               ====
FINANCE        .737          .75           .712          .725          .787          .675
GAMING         .736          .736          .842          .842          .842          .789
INDMATER       .736          .777          .833          .861          .833          .805
SP500          .696          .723          .76           .782          .764          .68
               =====
GOLD           .695          .782          .891          .913          .913          .934
HACKERS        .687          .687          .687          .75           .687          .562
SOLAR          .687          .687          .812          .812          .687          .687
FIDSTKS        .656          .656          .727          .751          .745          .686
LOWPRICE       .656          .661          .676          .647          .621          .607
BIOTECH        .642          .676          .676          .65           .636          .59
HOSPITAL       .642          .714          .785          .785          .642          .571
MILITARY       .615          .653          .653          .653          .615          .653
COMPUTER       .6            .8            .8            .8            .7            .6
SP-100         .588          .6            .622          .633          .6            .511
BEVERAGE       .571          .571          .571          .571          .571          .428
REGBANKS       .56           .72           .56           .48           .48           .32
COMODITY       .538          .538          .666          .692          .717          .666
FOOD           .51           .53           .673          .693          .714          .673
===========================================================================================
DOWJONES       .5            .533          .533          .533          .566          .5
===========================================================================================
UTILITY        .473          .447          .815          .868          .789          .605
OILGAS         .4            .438          .457          .523          .6            .542
DJI-13         .384          .384          .384          .384          .461          .384
COAL           .333          .666          .833          .666          .666          .666
MARIJUAN       .2            .2            .4            .4            .2            .1
|
===================================================================================
Monday - 5:58 AM - Futures: DJI -153 NASDAQ -106
Data Used 2-3-2023:
| |
2-3-2023
|
|
| |
Peerless remain on
its Buys. The key indicators on the Peerless DJI chart
are all in up-trends. But we
can see from the charts of the key ETFs below
that a trading war has broken out
between the openings and the closining.
The former as measured by our
Opening Powers are all falling and show
declining 21-dma's. The
latter, using our Closing Powers, are all rising.
We can distinguish somewhat who is
doing the selling and who is doing the
buying. The weak
Opening Powers usually mean overseas selling and
public selling from the US.
We do know precious metals were very weak
and the Dollar very strong
after the strongly positive Jobs Report came out
on Friday. Such action
more often than not, represents a knee-jerk, quick
jump in the expectations
overseas of higher interest rates in the US.
But that may not be bearish.
Since last October the stock market has
generally risen as short-term
rates have risen. Perhaps because the 10-year
rates have fallen,
Professionals in the US see the rate hikes as coming
to an end this year and
without killing the economy. The "soft landing"
scenario was mentioned
prominently on CNN today by one of its former
doubters, Larry Summers
of Harvard and a close friend of Wall Street.
The Closing Powers of all the
key ETFs reflect this hope and they are
all rising.
Interestingly, Professional
Day traders are also still bullish. Look below
at our Tiger Day Traders'
Tool for the key ETFs, as well as HD and NVDA.
And both of these show strong
OBV Lines, too. We watch the TTT Indicator
to see whether day traders
perceive more upside potential each day than
downside risk. Often
trend-breaks, non-confirmations and head/shoulders
patterns in this indicator
tell us when a short-term to intermediate-term move
is up. As I say, there are
mostly bullish, though DIA's is noticeably lagging.
Seasonality turns bullish in
a few days. Seasonality here means the probability
of the DJI rallying
historically after February 5th in the third years of the
four year Presidential cycle:
From 1967...1971...1975 to the 2019, the DJI
has risen 60% of the time
over the next week, 73.3% of the time over the
next two weeks and month.
Then it goes up faster, rising 87% of the time
over the next two months and
100% of the time over the next 3 months.
Peerless also relies on
breadth. Any 2.5% decline in the DJI is almost
certainly going to render a
Buy B9. Accordingly, I would ride out the
current pullback and plan to
do more buying if the DJI retreats to its 2%
lower band. I take the
weakness in Gold and Oil (see Bearish MINCPs)
to be a sign that the Fed
will be able to claim victory over Inflation by
the end of the year, though
not in all areas, most noticeably some food
commodities, rents and
housing costs. But that may be where HD and
home-building stocks should
assert themselves as strong Buys. |
|
| |
Charts - 2/3/2023
2022 PEERLESS DJI, Signals, Indicators Daily DJI Volume
10-DayUp/Down Vol Stoch-20 CCI RSI Pct of All Stocks above 65-dma
Inverted Traders Index
DJI-IPA DJI-OBV Short-Term Rates
NASDAQ S&P OEX NYSE DJ-15 DJ-20 DJI-30 Bond Funds
DIA QQQ SPY IWM new - COIN (Bit Coin ETF)
Gold Stocks
TNA Short-Term Rates Ten Year Rates PST (Short Treasuries)
DOLLAR-UUP
ALLSTOCKs
Russell-1000
Insurance-Stocks
Recent 2006 vers-Peerless signals
http://www.tigersoftware.com/OLDPEER/UPD90203.bmp
MDY - http://www.tigersoftware.com/CHARTX/MDY.GIF
USO-CrudeOil DBO FAS GLD HD IBB JETS JNUG KOL NAIL NUGT NRGU OIH
PALL RSX RETL SDS AGQ SLV SOXL TAN TECL TLT TMF TNA UGA USO
China:
YINN CHAU
Commodities: CANE
CORN DBC JJC, NIB CORN, CUT (paper)
MOO, NRGU
SOYB WEAT UUP (Dollar) LIT
(Lithium) PALL
(Palladium)
Stocks AA AAPL ADBE ALXN AMAT AMGN AMD AMZN AXP BA BABA
BAC BIDU BLDP CAT CHKP CNX CPB CRM CVX CMG DE DIS ENPH FB FSLR
FTNT GILD GME GOOG GS HD IBM INTU JPM KO KR LRCX MRK MRNA
MOS MSFT NEM NFLX NKE NOC NUE NVDA PANW PG PYPL REGN REV
SO QCOM QDEL TSLA TXN XOM V VRTX WFC WMT XLE ZM ZOM
Leveraged Short ETFs:
FAZ - financials, TZA and SRTY- small caps, MZZ - mid caps, TECS -Techs,
SOXS -
semi-conductors LABD
- Biotechs
Bullish MAXCPs http://www.tigersoftware.com/UPPING/2-3-2023/BULLISH.htm
Bearish MINCPs
http://www.tigersoftware.com/Downing/2-3-2023/BEARISH.htm |
|
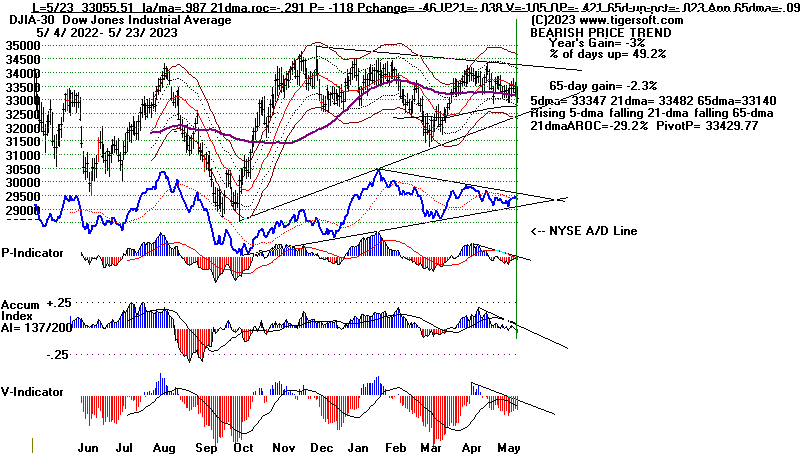
|
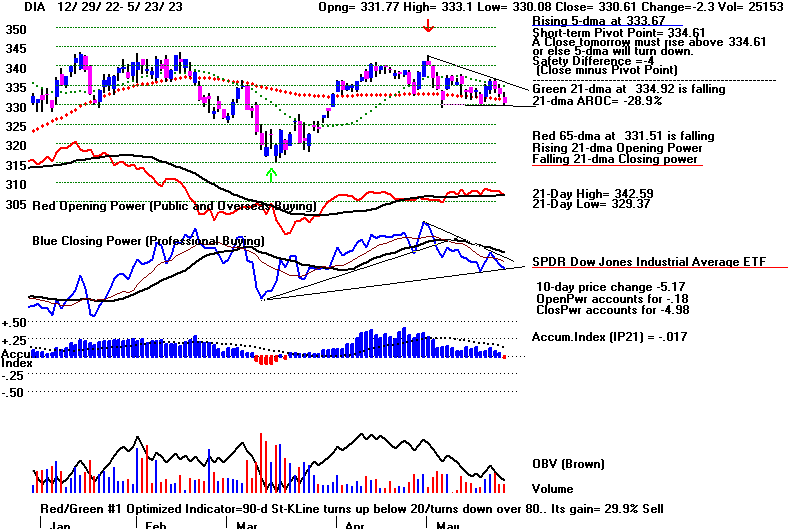
DJI's Day Traders' Tool is Lagging
|
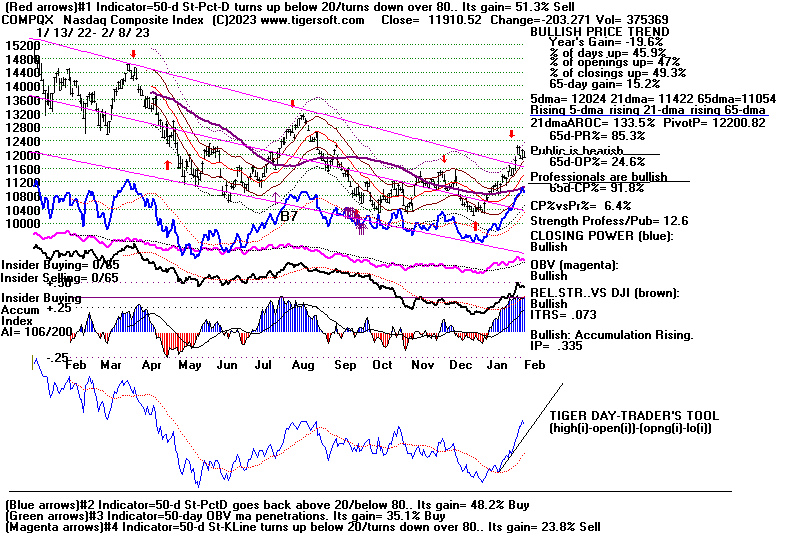
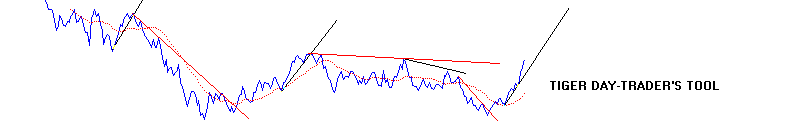 |
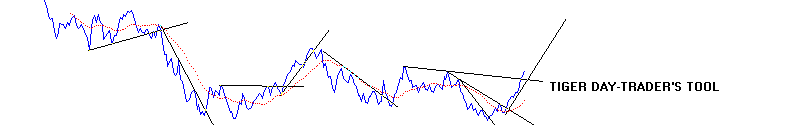 |
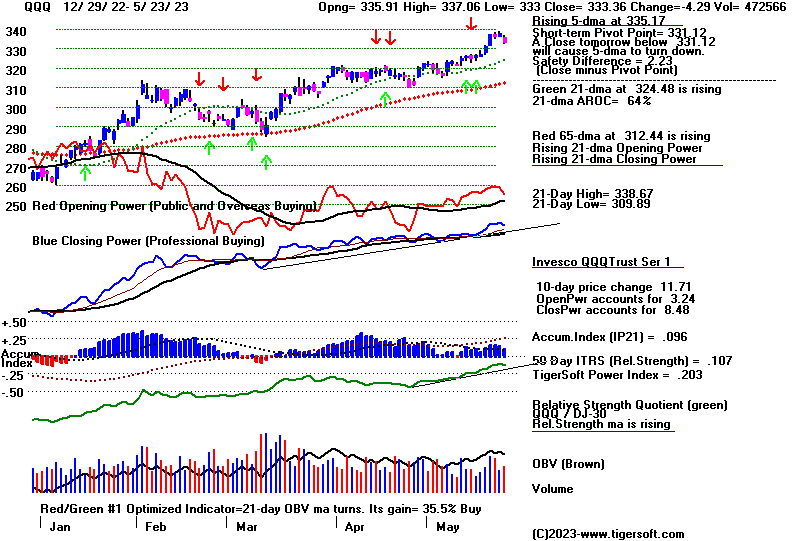
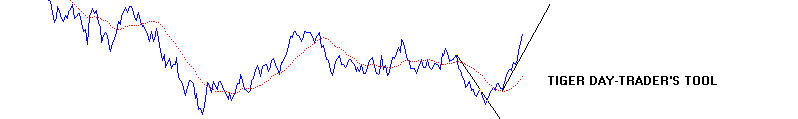 |

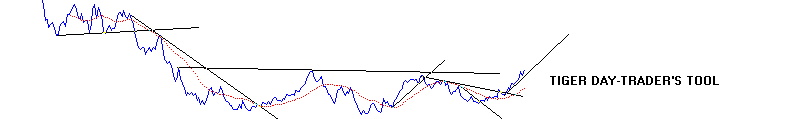 |
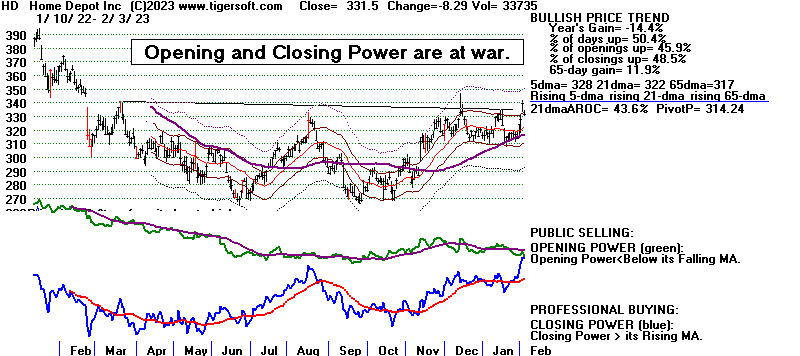
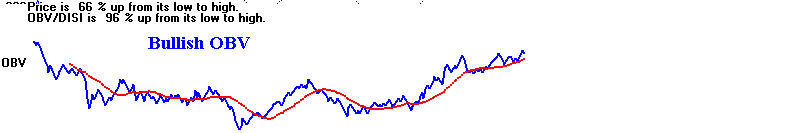
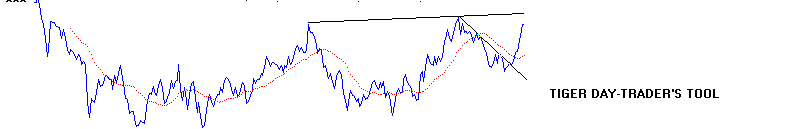 |
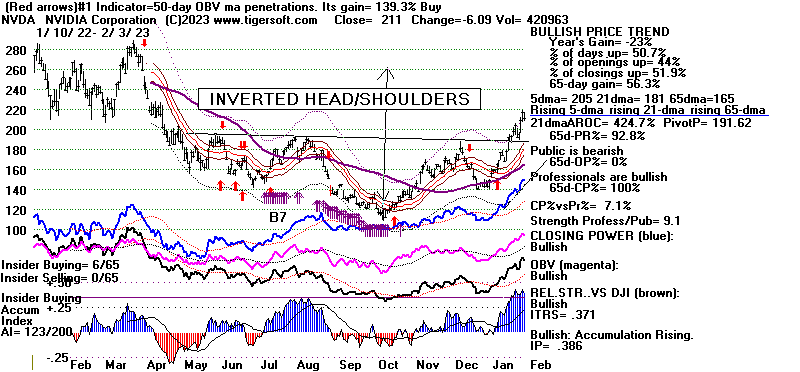
 |
Table 1 - Volume and Breadth Statistics
| NYSE |
Latest Close |
Previous
Close |
Week Ago |
| Issues
traded |
3,180 |
3,213 |
3,222 |
| Advances |
837 |
2,197 |
1,798 |
| Declines |
2,248 |
914 |
1,278 |
| Unchanged |
95 |
102 |
146 |
| New
highs |
121 |
203 |
115 |
| New
lows |
4 |
5 |
6 |
| Adv.
volume* |
236,306,245 |
703,942,291 |
435,803,257 |
| Decl.
volume* |
723,354,338 |
382,313,251 |
313,816,899 |
| Total
volume* |
975,003,578 |
1,101,685,647 |
758,921,396 |
| Closing
Arms (TRIN)† |
1.07 |
1.23 |
0.95 |
| Block
trades* |
4,845 |
4,983 |
4,218 |
| Adv.
volume |
1,185,075,029 |
3,683,322,057 |
2,299,090,440 |
| Decl.
volume |
3,419,334,522 |
1,880,675,339 |
1,547,972,754 |
| Total
volume |
4,694,517,247 |
5,624,362,081 |
3,907,768,147 |
| NASDAQ |
Latest Close |
Previous
Close |
Week Ago |
| Issues
traded |
4,811 |
4,829 |
4,742 |
| Advances |
1,719 |
3,297 |
2,584 |
| Declines |
2,858 |
1,293 |
1,927 |
| Unchanged |
234 |
239 |
231 |
| New
highs |
142 |
199 |
126 |
| New
lows |
24 |
27 |
40 |
| Closing
Arms (TRIN)† |
0.90 |
0.63 |
0.65 |
| Block
trades |
39,814 |
47,031 |
50,253 |
| Adv.
volume |
2,366,109,149 |
5,602,121,508 |
4,147,382,435 |
| Decl.
volume |
3,543,265,996 |
1,378,372,555 |
2,023,032,921 |
| Total
volume |
5,954,499,933 |
7,038,212,637 |
6,243,808,988 |
|
Table 2 QUICKSILVER on ETFS - 2/3/2023 ---
Bullish = 12 (+0)COMPQX,  SPY, QQQ, MDY,IWM, FAS, RETL, SOXL. TECL. IBB
             GLD,  YINN (highest 0.874)

Bearish = 2      DBO and Dollar (UUP)
ETF       CLOSE   CHANGE    PIVOT-PT    5-dma AROC    CL-PWR  CANDLE  IP21   ITRS   POWER INDEX
================================================================================================
DIA       338.98  -1.45      337.06       -9.3%       Bullish  BLUE   .182    -----     ----     .
---------------------------------------------------------------------------------------------
COMPQX    12006.96  -193.86  11393.81      164.3%     Bullish  BLUE   .309    .083     .392
---------------------------------------------------------------------------------------------
SPY       412.35  -4.43      400.59        81.7%      Bullish  BLUE   .229    .039     .268
---------------------------------------------------------------------------------------------
QQQ       306.18  -5.54      290.27        166%       Bullish  BLUE   .287    .08      .367
---------------------------------------------------------------------------------------------
MDY       493.92  -3.2       472.37        167.9%     Bullish  BLUE   .272    .074     .346
---------------------------------------------------------------------------------------------
IWM       196.99  -1.33      186.94        192.8%     Bullish  BLUE   .345    .072     .417
---------------------------------------------------------------------------------------------
FAS       88.65  -.37        85.11         136.7%     Bullish  BLUE   .275    .066     .341
---------------------------------------------------------------------------------------------
RETL      12.11  -.44        9.77          982.9%    -------  BLUE   .229    .409      .638
---------------------------------------------------------------------------------------------
SOXL      16.93  -.99        13.8          624.8%    -------  BLUE   .274    .418      .692
---------------------------------------------------------------------------------------------
TECL      31.84  -.82        27.11         530.9%    Bullish  BLUE   .271    .198      .469
---------------------------------------------------------------------------------------------
IBB       136.59  -.58       134.8        -23.4%     -------  RED    .274    .021      .295
---------------------------------------------------------------------------------------------
GLD       173.46  -4.44      178.76       -160.5%    Bullish  RED    .237    .066      .303
---------------------------------------------------------------------------------------------
DBO       14.21  -.42        14.86        -305.5%    Bearish  RED   -.204   -.097     -.301
---------------------------------------------------------------------------------------------
OIH       315.68   1.81      323.17       -158.3%    Bullish  BLUE   .089    .044      .133
---------------------------------------------------------------------------------------------
CPER     24.56  -.26         25.37        -208.8%    -------  RED    .086    .131      .217
---------------------------------------------------------------------------------------------
TAN     79.73  -1.97         78.22        -26%       -------  RED    .169   -.019      .15
---------------------------------------------------------------------------------------------
UUP       27.79   .36        27.57         58.3%     Bearish  BLUE  -.076   -.049    -.125
---------------------------------------------------------------------------------------------
CORN      26.58   .09        26.58         7.5%      Bullish  BLUE   .005    .003     .008
---------------------------------------------------------------------------------------------
WEAT      7.69  -.02         7.61          65.2%     Bullish  ----   .074   -.071     .003
---------------------------------------------------------------------------------------------
YINN      58.82  -4.84       64.6         -1041.2%   -------  RED    .186    .688     .874
|
 Table 3
   RANKING OF KEY DIRECTORIES BASED PCT.OF STOCKS ABOVE 65-DMA
              2/3/23
---------------------------------------------------------------------------------------
Directory     Current       day-1         day-2         day-3         day-4         day-5
----------------------------------------------------------------------------------------
COPPER         1             1             1             1             1             1
EDU            1             1             1             1             1             .833
HOMEBLDG       1             1             .944          .944          .833          .888
INFRA          .939          .909          .969          1             .939          .939
REIT           .915          .93           .915          .907          .807          .907
BONDFUND       .908          .908          .919          .908          .908          .896
SEMI           .904          .904          .882          .861          .808          .84
               -----
TRANSP         .894          .894          .894          .789          .526          .684
GREEN          .888          .888          .833          .833          .666          .722
SOFTWARE       .875          .875          .875          .839          .696          .821
ETFS           .872          .909          .909          .909          .89           .89
AUTO           .867          .886          .905          .867          .754          .886
ELECTRON       .864          .857          .849          .812          .766          .781
BIGBANKS       .857          .857          .857          .857          .714          .714
               -----
GUNS           .857          .857          .857          .785          .785          .785
JETS           .846          .846          .769          .846          .769          .846
CHINA          .818          .818          .818          .795          .772          .795
HIGHPRIC       .818          .831          .857          .81           .724          .793
NIFTY          .818          .795          .818          .818          .75           .818
CHEM           .813          .813          .813          .79           .72           .697
COMPUTER       .8            .8            .8            .7            .6            .7
RUS-1000       .791          .821          .828          .806          .729          .781
               -----
GOLD           .782          .891          .913          .913          .934          .934
INDMATER       .777          .833          .861          .833          .805          .791
RETAIL         .765          .808          .723          .723          .638          .702
FINANCE        .75           .712          .725          .775          .675          .675
NASD-100       .75           .82           .83           .79           .72           .79
               -----
INDEXES        .745          .778          .772          .794          .778          .789
GAMING         .736          .842          .789          .894          .789          .894
SP500          .723          .76           .784          .76           .688          .745
               -----
INSURANC       .72           .68           .8            .96           .84           .8
REGBANKS       .72           .56           .48           .48           .32           .32
HOSPITAL       .714          .785          .785          .642          .571          .571
HACKERS        .687          .687          .75           .687          .562          .75
SOLAR          .687          .812          .812          .687          .687          .687
BIOTECH        .676          .673          .653          .636          .588          .639
COAL           .666          .833          .666          .666          .666          .333
LOWPRICE       .661          .679          .65           .621          .607          .607
FIDSTKS        .656          .727          .751          .745          .686          .757
MILITARY       .653          .653          .653          .615          .653          .615
SP-100         .6            .622          .633          .6            .522          .611
BEVERAGE       .571          .571          .571          .571          .428          .5
COMODITY       .538          .666          .666          .717          .666          .666
DOWJONES       .533          .533          .533          .566          .5            .566
               -----
FOOD           .53           .673          .673          .714          .673          .673
================================================================================================
UTILITY        .447          .815          .868          .789          .605          .657
OILGAS         .438          .457          .523          .6            .542          .657
DJI-13         .384          .384          .384          .461          .384          .538
MARIJUAN       .2            .4            .4            .2            .1            .1
|
====================================================================================
Friday - 6:00 AM - Futures: DJI -67 NASDAQ -106
Data Used:
| |
2/2/2023
DJIA 34053.94
-.011%
S&P 500 4179.76
+ 1.47%
NASDAQ
12200.82 + 3.25% |
|
| |
The strong advances of the NASDAQ,
semi-conductors, QQQ and housing stocks
look like they will be interrupted by some profit-taking that is
typical of Fridays in
bull markets. Are we really in a new bull market?
Usually interest rates have to be
falling for that and most often we see bulge-new highs from both
the P-Indicator and the
Accumulation Index on the DJI. At present, rates are still
rising and we do not see
a new high by the Accumulation Index on our DJI chart. In
addition, FAS, the
big financials' ETF has not yet made a breakout above its flat,
well-tested resistance.
Nor has the DJI or IWM (Russell-2000).
But Peerless remains on multiple Buys; the NYSE A/D Line is
shooting upwards as
are the key ETF's Closing Power. And look again at Tables
1-3. The ratio of new
highs to new lows is 402/32, well above a bullish 10:1.
Table 2 finds nearly all the
major equity ETFs rated "bullish" (IP21 + ITRS) >
+.25. And in Table 3,
only 3 of the 49 stock groups have less than 50% of their
components below the
support of their 65-dma.
The high Accumulation (>+.35) "bullish MAXCPs"
are quite numerous. I would just
allow them to run and show why they are under so much
Accumulation even though
the FED is likely to raise rates more in the months ahead.
As bulls, we do not want
to see the DJI continue to slide. But that may depend on
UNH, the DJI's most
weighty component. It dropped 26 points today, thus pulling
the DJI down 160 just
by itself.
Note the bullish seasonality after February 2nd in third years of
the 4-year cycle.
After the next 21 trading days, the DJI is higher 67% of the time
going back to
1967 and higher 93.3% of the time looking ahead two months. |
|
| |
Charts - 2/2/2023
2022 PEERLESS DJI, Signals, Indicators Daily DJI Volume
10-DayUp/Down Vol Stoch-20 CCI RSI Pct of All Stocks above 65-dma
Inverted Traders Index
DJI-IPA DJI-OBV Short-Term Rates
NASDAQ S&P OEX NYSE DJ-15 DJ-20 DJI-30 Bond Funds
DIA QQQ SPY IWM new - COIN (Bit Coin ETF)
Gold Stocks
TNA Short-Term Rates Ten Year Rates PST (Short Treasuries)
DOLLAR-UUP
ALLSTOCKs
Russell-1000
Insurance-Stocks
Recent 2006 vers-Peerless signals
http://www.tigersoftware.com/OLDPEER/UPD90202.bmp
MDY - http://www.tigersoftware.com/CHARTX/MDY.GIF
USO-CrudeOil DBO FAS GLD HD IBB JETS JNUG KOL NAIL NUGT NRGU OIH
PALL RSX RETL SDS AGQ SLV SOXL TAN TECL TLT TMF TNA UGA USO
China:
YINN CHAU
Commodities: CANE
CORN DBC JJC, NIB CORN, CUT (paper)
MOO, NRGU
SOYB WEAT UUP (Dollar) LIT
(Lithium) PALL
(Palladium)
Stocks AA AAPL ADBE ALXN AMAT AMGN AMD AMZN AXP BA BABA
BAC BIDU BLDP CAT CHKP CNX CPB CRM CVX CMG DE DIS ENPH FB FSLR
FTNT GILD GME GOOG GS HD IBM INTU JPM KO KR LRCX MRK MRNA
MOS MSFT NEM NFLX NKE NOC NUE NVDA PANW PG PYPL REGN REV
SO QCOM QDEL TSLA TXN XOM V VRTX WFC WMT XLE ZM ZOM
Leveraged Short ETFs:
FAZ - financials, TZA and SRTY- small caps, MZZ - mid caps, TECS -Techs,
SOXS -
semi-conductors LABD
- Biotechs
Bullish MAXCPs http://www.tigersoftware.com/UPPING/2-2-2023/BULLISH.htm
Bearish MINCPs http://www.tigersoftware.com/Downing/2-2-2023/BEARISH.htm
|
|
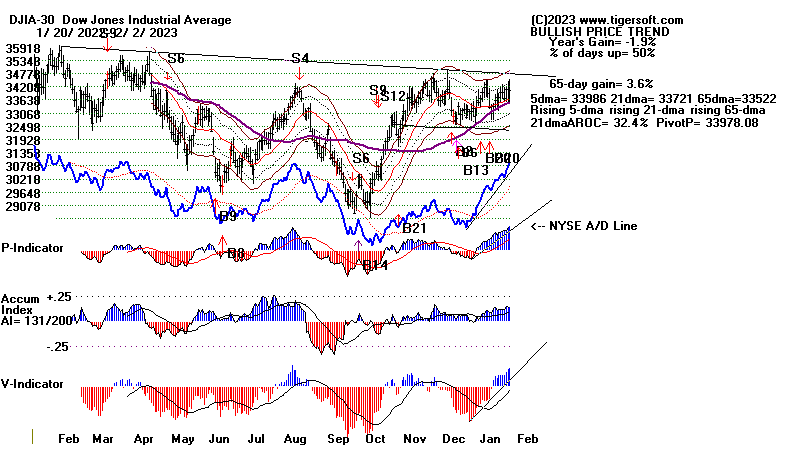 |
 |
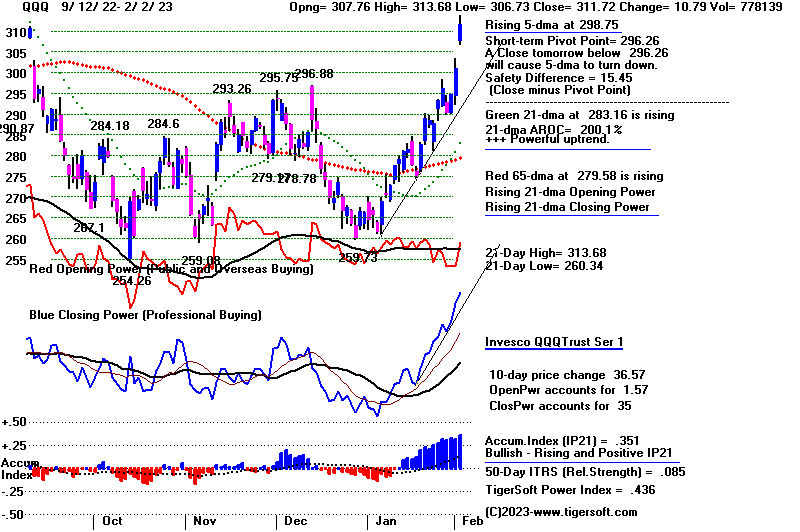 |
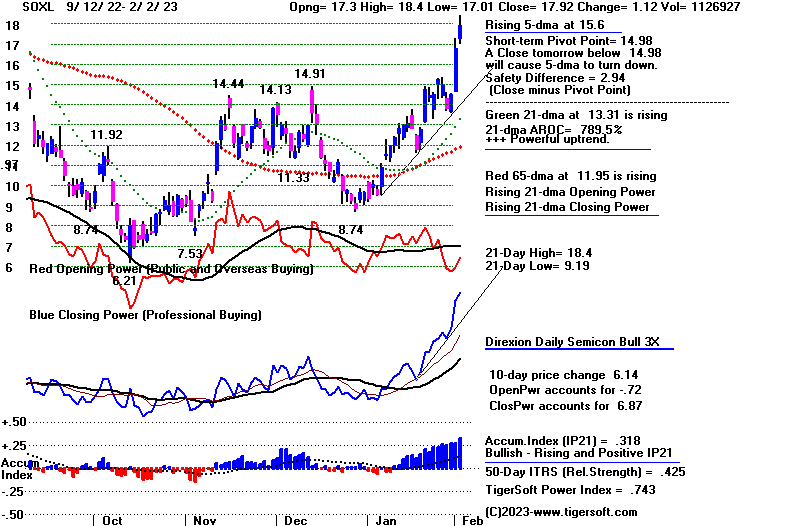 |
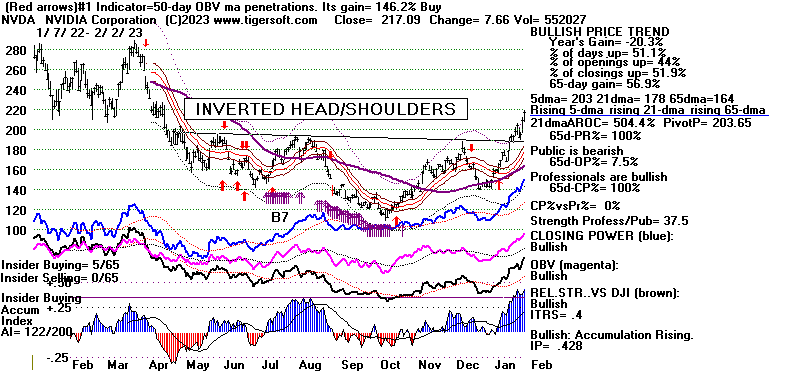 |
At resistance
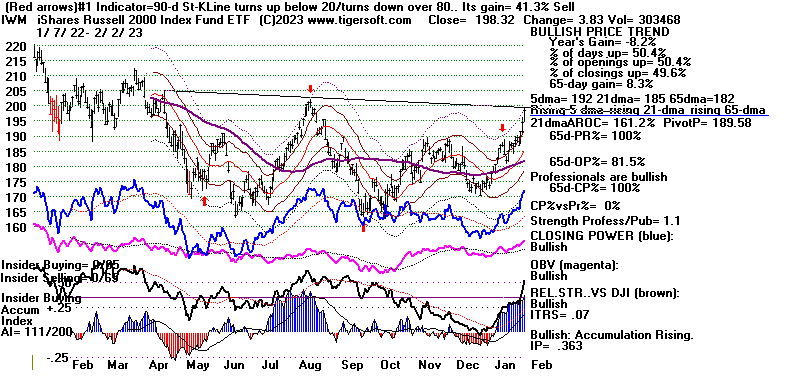 |
At resistance
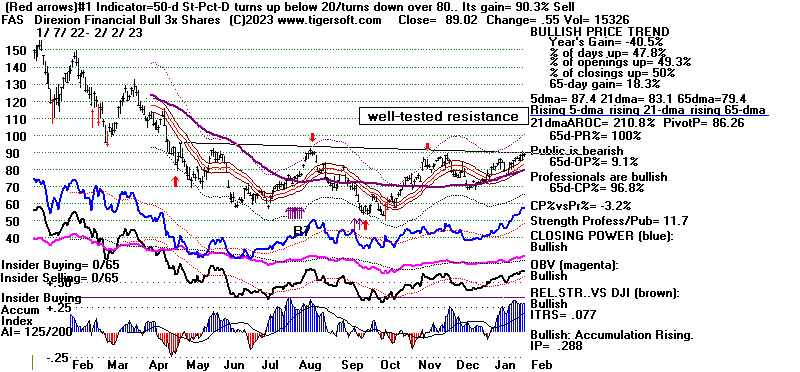 |
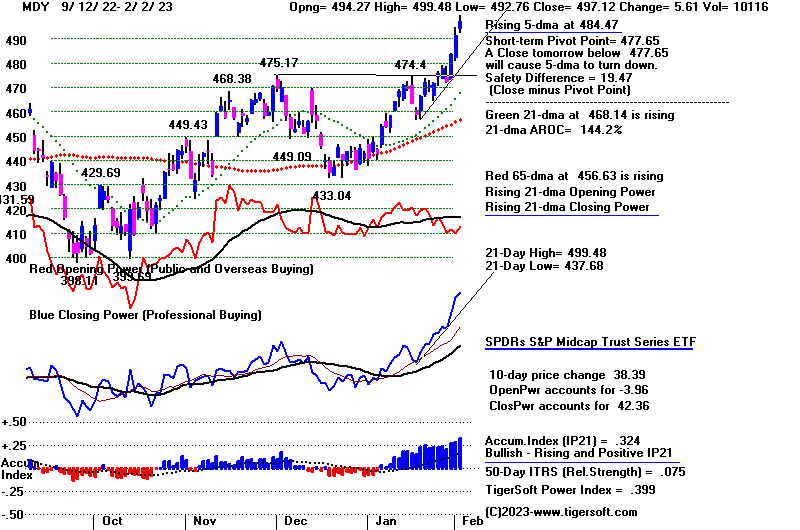 |
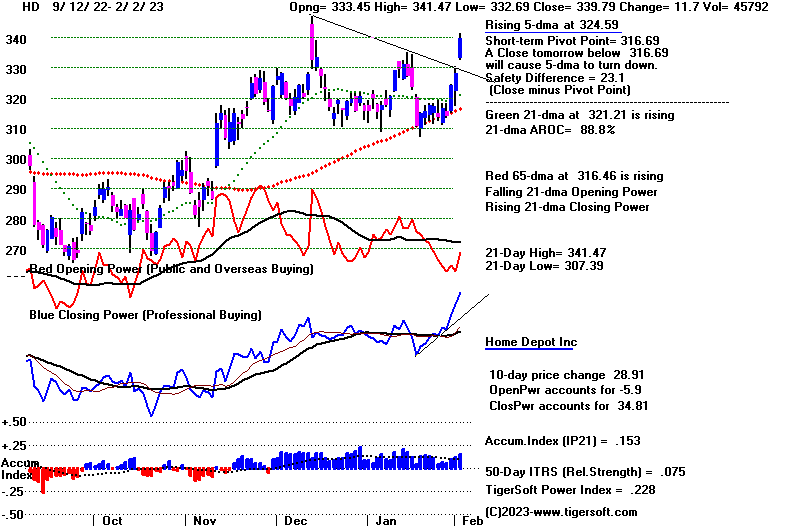 |
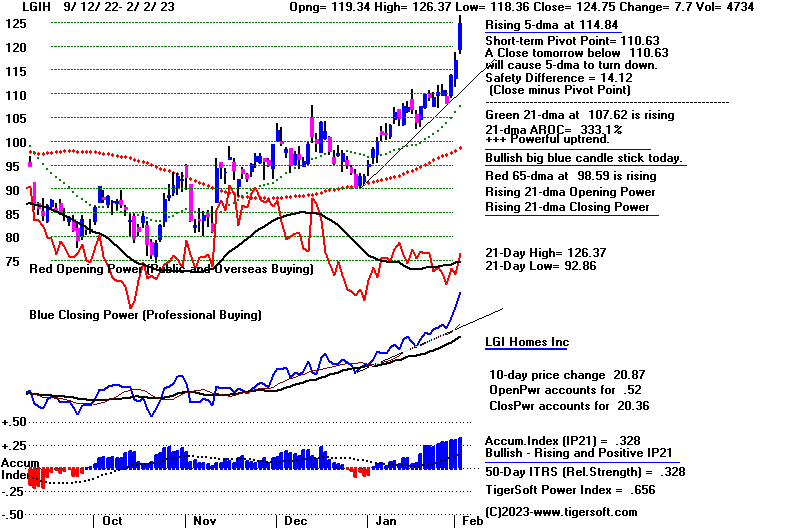 |
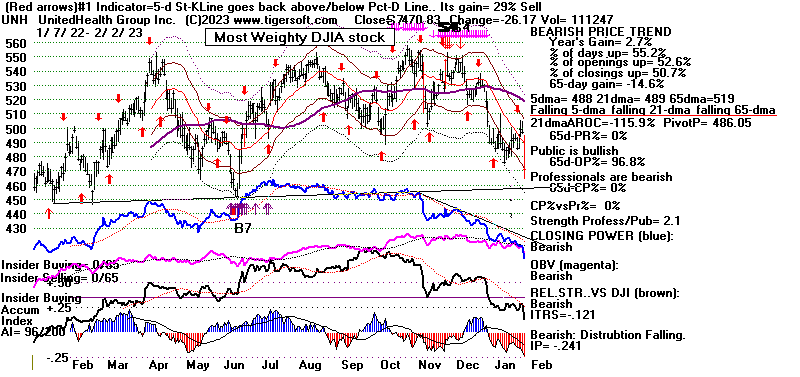 |
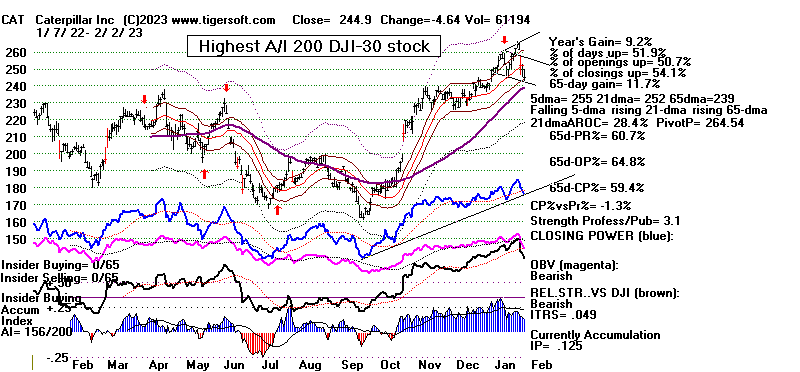 |
Table 1 - Breadth and Volume Statistics
| NYSE |
Latest
Close |
Previous
Close |
Week
Ago |
| Issues
traded |
3,213 |
3,210 |
3,201 |
| Advances |
2,197 |
2,227 |
2,116 |
| Declines |
914 |
855 |
961 |
| Unchanged |
102 |
128 |
124 |
| New
highs |
203 |
177 |
117 |
| New
lows |
5 |
8 |
11 |
| Adv.
volume* |
703,942,291 |
699,495,958 |
503,185,532 |
| Decl.
volume* |
382,313,251 |
325,612,493 |
258,274,545 |
| Total
volume* |
1,101,685,647 |
1,037,449,413 |
773,304,402 |
| Closing
Arms (TRIN)† |
1.23 |
1.21 |
1.16 |
| Block
trades* |
4,983 |
5,071 |
4,045 |
| Adv.
volume |
3,683,322,057 |
3,283,160,285 |
2,453,695,268 |
| Decl.
volume |
1,880,675,339 |
1,525,217,133 |
1,291,411,386 |
| Total
volume |
5,624,362,081 |
4,856,937,878 |
3,809,598,171 |
| NASDAQ |
Latest
Close |
Previous
Close |
Week
Ago |
| Issues
traded |
4,829 |
4,828 |
4,804 |
| Advances |
3,297 |
3,147 |
2,699 |
| Declines |
1,293 |
1,428 |
1,863 |
| Unchanged |
239 |
253 |
242 |
| New
highs |
199 |
186 |
122 |
| New
lows |
27 |
34 |
42 |
| Closing
Arms (TRIN)† |
0.63 |
0.51 |
0.96 |
| Block
trades |
47,031 |
42,103 |
49,844 |
| Adv.
volume |
5,602,121,508 |
5,083,996,039 |
3,394,122,958 |
| Decl.
volume |
1,378,372,555 |
1,183,029,364 |
2,253,028,273 |
| Total
volume |
7,038,212,637 |
6,336,042,685 |
5,732,893,50 |
|
Table 2 QUICKSILVER on ETFS - 2/2/2023 ---
     Bullish = 12 (+0)     COMPQX,  SPY, QQQ, MDY,   IWM, FAS, RETL, SOXL. TECL. IBB
                           GLD,  YINN (highest 0.951)
     Bearish = 2           DBO and Dollar (UUP)
ETF       CLOSE   CHANGE    PIVOT-PT    5-dma AROC    CL-PWR  CANDLE  IP21   ITRS   POWER INDEX
================================================================================================
DIA       340.43  -.44       339.61        15.8%      Bullish  RED    .235    0       ----
---------------------------------------------------------------------------------------------
COMPQX    12200.82   384.5   11621.71      297.1%     Bullish  BLUE   .366    .086     .452
---------------------------------------------------------------------------------------------
SPY       416.78   5.98      405.68        148.3%     Bullish  BLUE   .274    .043     .317
---------------------------------------------------------------------------------------------
QQQ       311.72   10.8      296.26        311.4%     Bullish  BLUE   .351    .085     .436
---------------------------------------------------------------------------------------------
MDY       497.12   5.62      477.65        221.7%     Bullish  BLUE   .324    .076     .4
---------------------------------------------------------------------------------------------
IWM       198.32   3.83      189.58        256.6%     Bullish  BLUE   .364    .07      .434
---------------------------------------------------------------------------------------------
FAS       89.02   .55        86.26         158.8%     Bullish  RED    .289    .077     .366
---------------------------------------------------------------------------------------------
RETL      12.55   1          9.97          1478.9%     -------  BLUE   .298    .433    .731
---------------------------------------------------------------------------------------------
SOXL      17.92   1.12       14.98         889.3%     -------  BLUE   .319    .426     .745
---------------------------------------------------------------------------------------------
TECL      32.66   2.46       28.72         748.3%     Bullish  BLUE   .31    .184      .494
---------------------------------------------------------------------------------------------
IBB       137.17   .46       137.23        .4%        -------  BLUE   .336    .017     .353
---------------------------------------------------------------------------------------------
GLD       177.9  -3.77       179.22       -43.7%      Bullish  RED    .343    .084     .427
---------------------------------------------------------------------------------------------
DBO       14.63  -.13        15.12        -259.1%     Bearish  RED   -.174   -.077    -.251
---------------------------------------------------------------------------------------------
OIH       313.87  -13.49     325.94       -238.7%     Bullish  RED    .143    .009     .152
---------------------------------------------------------------------------------------------
CPER     24.82  -.62         25.62        -222.6%     Bullish  RED    .091    .121     .212
---------------------------------------------------------------------------------------------
TAN     81.7  -.93           80.15         138.3%     -------  RED    .217   -.007     .21
---------------------------------------------------------------------------------------------
UUP       27.43   .18        27.47         0%         Bearish  BLUE  -.195   -.057    -.252
---------------------------------------------------------------------------------------------
CORN      26.49  -.2         26.54        -16.9%      Bullish  RED   -.05   -.011     -.061
---------------------------------------------------------------------------------------------
WEAT      7.71  -.01         7.59          65.4%      Bullish  RED    .037   -.077    -.04
---------------------------------------------------------------------------------------------
YINN      63.66  -3.96       72.65        -683.9%     -------  RED    .309    .738     1.047
|
Table 3       RANKING OF KEY DIRECTORIES BASED PCT.OF STOCKS ABOVE 65-DMA
              2/2/23
 Bullish = 46
 Bearish = 3
---------------------------------------------------------------------------------------
Directory     Current       day-1         day-2         day-3         day-4         day-5
----------------------------------------------------------------------------------------
COPPER         1             1             1             1             1             1
EDU            1             1             1             1             .833          1
HOMEBLDG       1             .944          .944          .833          .888          .833
               ====
REIT           .93           .907          .915          .815          .9            .815
ETFS           .909          .909          .909          .89           .89           .909
INFRA          .909          .969          1             .939          .939          .969
BONDFUND       .908          .919          .908          .908          .908          .896
SEMI           .904          .882          .861          .808          .829          .872
               ====
TRANSP         .894          .894          .789          .526          .684          .631
GOLD           .891          .913          .913          .934          .934          .913
GREEN          .888          .833          .833          .666          .722          .777
AUTO           .886          .924          .867          .754          .886          .735
SOFTWARE       .875          .892          .839          .696          .821          .857
BIGBANKS       .857          .857          .857          .714          .714          .714
ELECTRON       .857          .849          .812          .766          .774          .827
GUNS           .857          .857          .785          .785          .785          .785
JETS           .846          .769          .846          .769          .846          .846
GAMING         .842          .789          .842          .842          .842          .842
COAL           .833          .666          .666          .666          .5            .5
INDMATER       .833          .861          .833          .805          .791          .819
HIGHPRIC       .831          .857          .81           .724          .793          .797
RUS-1000       .821          .828          .806          .729          .779          .767
               =====
NASD-100       .82           .83           .79           .72           .79           .78
               =====
CHINA          .818          .818          .795          .772          .795          .795
UTILITY        .815          .868          .789          .605          .684          .684
CHEM           .813          .813          .79           .72           .697          .697
SOLAR          .812          .812          .687          .687          .687          .687
RETAIL         .808          .723          .723          .638          .68           .659
COMPUTER       .8            .8            .7            .6            .7            .8
NIFTY          .795          .818          .818          .75           .818          .795
HOSPITAL       .785          .785          .642          .571          .571          .571
INDEXES        .778          .772          .794          .778          .789          .778
SP500          .76           .784          .762          .684          .75           .733
               =====
FIDSTKS        .727          .751          .745          .686          .757          .745
FINANCE        .712          .725          .775          .662          .675          .7
HACKERS        .687          .75           .687          .562          .75           .687
INSURANC       .68           .8            .96           .84           .8            .88
LOWPRICE       .679          .653          .624          .607          .61           .598
BIOTECH        .673          .65           .639          .588          .636          .619
FOOD           .673          .673          .693          .673          .693          .755
COMODITY       .666          .666          .692          .666          .692          .743
MILITARY       .653          .653          .615          .653          .615          .615
SP-100         .622          .633          .6            .522          .622          .577
BEVERAGE       .571          .571          .571          .428          .5            .571
REGBANKS       .56           .48           .48           .32           .32           .28
DOWJONES       .533          .533          .566          .5            .566          .566
=====================================================================================================
OILGAS         .457          .523          .6            .542          .666          .685
MARIJUAN       .4            .4            .2            .1            .1            .1
DJI-13         .384          .384          .461          .384          .538          .461
|
====================================================================================
Thursday - 5:50 AM - Futures: DJI -105 NASDAQ +150 Data
Used: 2/1/2022
| |
The FED today
surprised no one by raising rates by 1/4%. But what did boost
the market was FED Chairman
Powell's optimism that the corner has been
turned and inflation looks
like it is under control. It is that sentiment that
sent many tech stocks,
semi-conductors, home builders and retailers soaring.
On the other hand, leading
biotechs like AMGN lagged. Money seems to
be running from defensive
stocks and the non-tech blue chips to play the
turn-around techs.
Such a re-prioritization of
portfolios shows new investor confidence and so
tends to be a bullish
development. What is also bullish are our Peerless
buy signals on the DJI,
seasonality and the results in Tables 2 and 3 below.
Table 2 shows twelve of the
major ETFs now have a sum of their IP21 (current
Accumulation) and ITRS
(50-day relative strength versus he DJI) to be above
a total of +.25, which we
consider "bullish". Table 3 shows that nearly all of
our stock groupings have a
majority of their components above their 65-dma.
But what is most surprising
is how much more bullish Wall Street Professionals are
than those that trade before
or at the NYSE opening. This latter group are more often
overseas buyers and the
public, who tend to be wrong at significant turning
points. Nearly all of
the main ETF show this pattern of a falling Opening
Power trend and a steeply
rising Closing Power. This is a bullish divergence
mentioned in all our studies
of Closing Power. The degree of the divergence
now is probably
unprecedented. Look at FAS, in particular below. Our
interpretation here is that
the big banks' traders know the thoughts of FOMC
members way ahead of the
members of the Public and they use that to their
firms' advantage in trading
time and time again.
Watch for a change in this
bullish divergence. First will be higher openings as
the "Public" and
"overseas buyers" come board. At some point after that
we will see red candle-sticks
as Professionals take profits. We will sell when
the Closing Power uptrends
are violated and when the DJI reaches its upper
band and the NYSE A/D Line
(which is now in a steep uptrend) fails to
confirm a new high.
Notice that there are lots of
Bull Maxcps and new highs to pick from. But there
are no bearish MINCPs now,
except the negative leveraged ETFs. Avoid the
short side, own CAT and NVDA
as well as some of the bullish MAXCPs
showing very high current
Accumulation and high relative strength. |
|
| |
Charts - 2/1/2023
2022 PEERLESS DJI, Signals, Indicators Daily DJI Volume
10-DayUp/Down Vol Stoch-20 CCI RSI Pct of All Stocks above 65-dma
Inverted Traders Index
DJI-IPA DJI-OBV Short-Term Rates
NASDAQ S&P OEX NYSE DJ-15 DJ-20 DJI-30 Bond Funds
DIA QQQ SPY IWM new - COIN (Bit Coin ETF)
Gold Stocks
TNA Short-Term Rates Ten Year Rates PST (Short Treasuries)
DOLLAR-UUP
ALLSTOCKs
Russell-1000
Insurance-Stocks
Recent 2006 vers-Peerless signals
http://www.tigersoftware.com/OLDPEER/UPD90201.bmp
MDY - http://www.tigersoftware.com/CHARTX/MDY.GIF
USO-CrudeOil DBO FAS GLD HD IBB JETS JNUG KOL NAIL NUGT NRGU OIH
PALL RSX RETL SDS AGQ SLV SOXL TAN TECL TLT TMF TNA UGA USO
China:
YINN CHAU
Commodities: CANE
CORN DBC JJC, NIB CORN, CUT (paper)
MOO, NRGU
SOYB WEAT UUP (Dollar) LIT
(Lithium) PALL
(Palladium)
Stocks AA AAPL ADBE ALXN AMAT AMGN AMD AMZN AXP BA BABA
BAC BIDU BLDP CAT CHKP CNX CPB CRM CVX CMG DE DIS ENPH FB FSLR
FTNT GILD GME GOOG GS HD IBM INTU JPM KO KR LRCX MRK MRNA
MOS MSFT NEM NFLX NKE NOC NUE NVDA PANW PG PYPL REGN REV
SO QCOM QDEL TSLA TXN XOM V VRTX WFC WMT XLE ZM ZOM
Leveraged Short ETFs:
FAZ - financials, TZA and SRTY- small caps, MZZ - mid caps, TECS -Techs,
SOXS -
semi-conductors LABD
- Biotechs
Bullish MAXCPs http://www.tigersoftware.com/UPPING/2-1-2023/BULLISH.htm
Bearish MINCPs http://www.tigersoftware.com/Downing/2-1-2023/BEARISH.htm
|
|
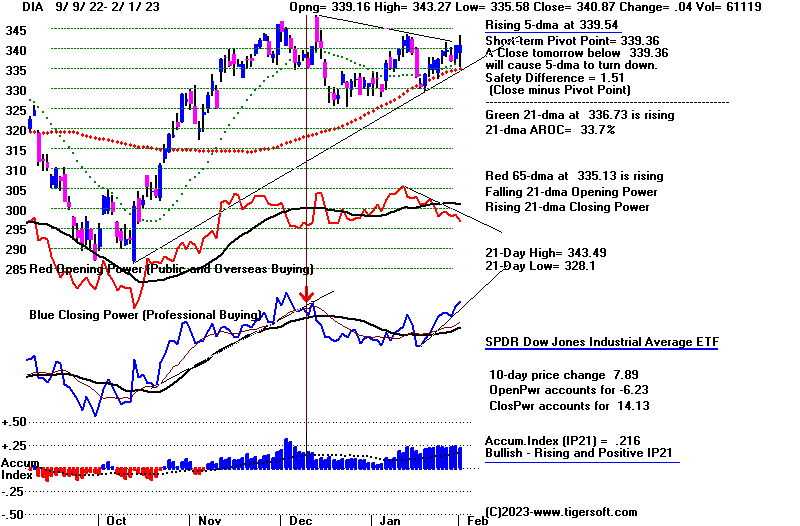
|
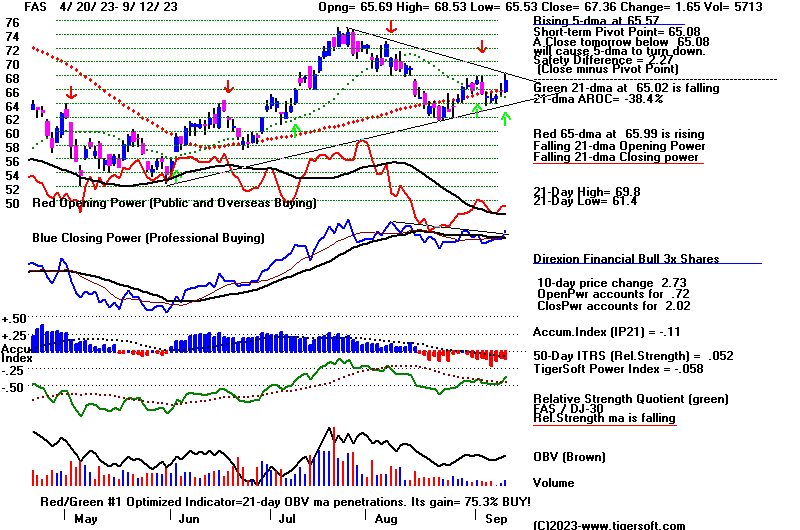 |
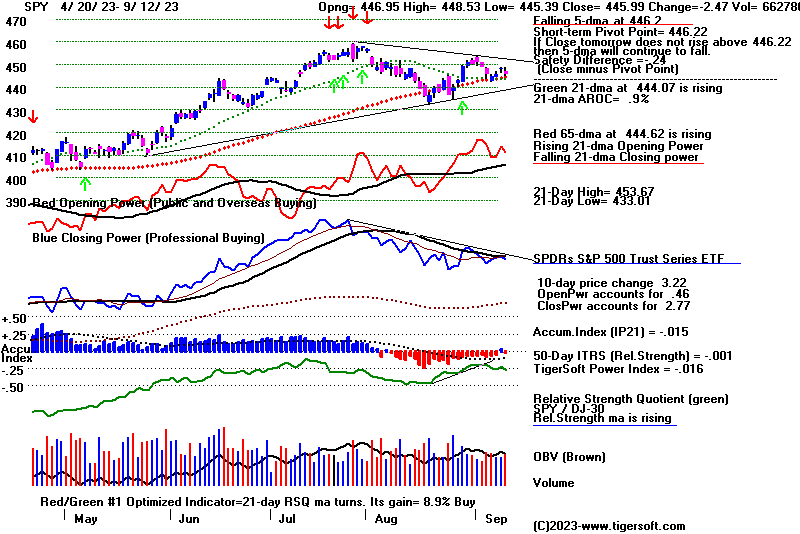 |
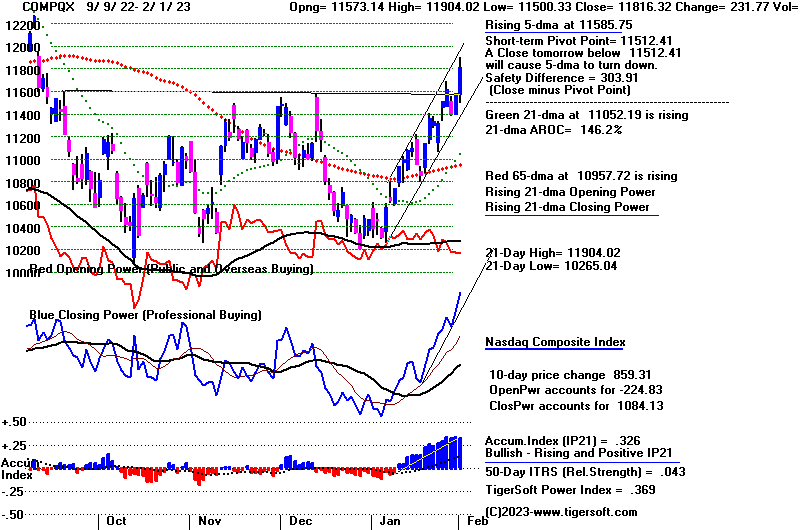 |
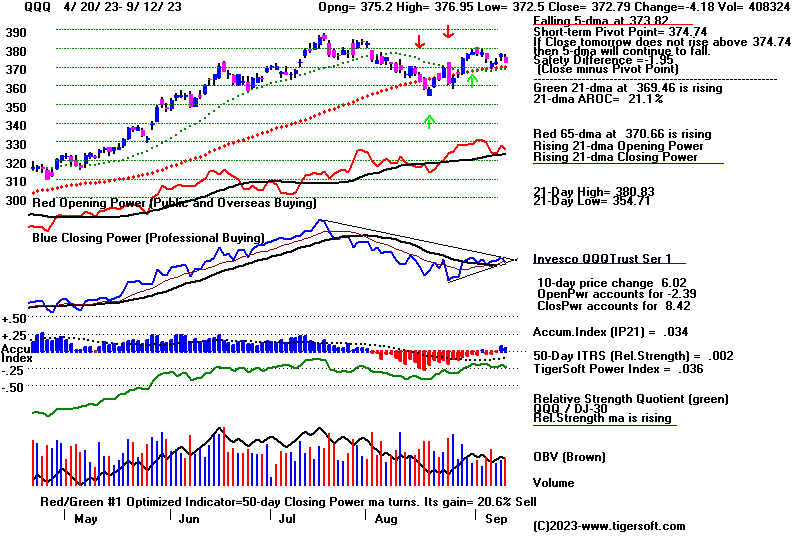 |
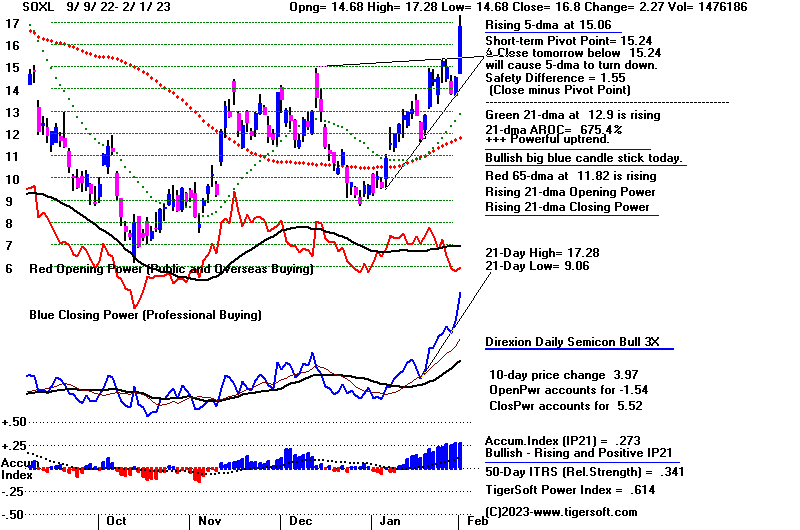 |
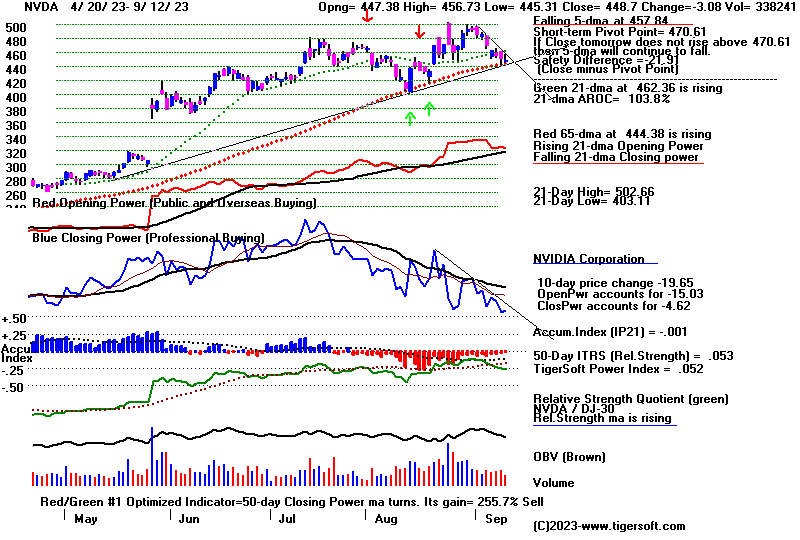 |
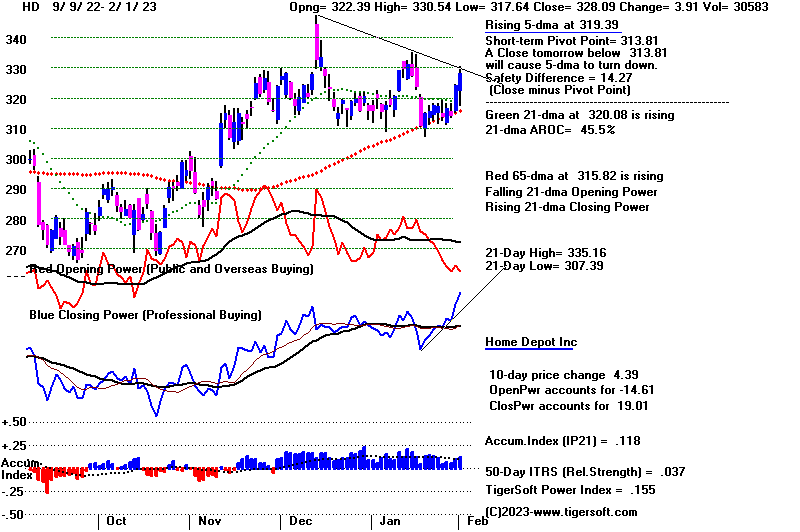 |
 |
 |
Table 1 - Breadth and Volume Statistics
| NYSE |
Latest
Close |
Previous
Close |
Week
Ago |
| Issues
traded |
3,210 |
3,209 |
3,219 |
| Advances |
2,227 |
2,636 |
1,655 |
| Declines |
855 |
478 |
1,400 |
| Unchanged |
128 |
95 |
164 |
| New
highs |
177 |
104 |
70 |
| New
lows |
8 |
4 |
13 |
| Adv.
volume* |
699,495,958 |
1,152,669,189 |
462,387,630 |
| Decl.
volume* |
325,612,493 |
122,350,026 |
287,560,014 |
| Total
volume* |
1,037,449,413 |
1,278,643,358 |
765,648,597 |
| Closing
Arms (TRIN)† |
1.21 |
0.61 |
0.74 |
| Block
trades* |
5,071 |
4,872 |
4,083 |
| Adv.
volume |
3,283,160,285 |
4,182,478,944 |
2,224,511,315 |
| Decl.
volume |
1,525,217,133 |
459,487,807 |
1,397,957,341 |
| Total
volume |
4,856,937,878 |
4,679,324,627 |
3,724,028,980 |
| NASDAQ |
Latest
Close |
Previous
Close |
Week
Ago |
| Issues
traded |
4,828 |
4,812 |
4,824 |
| Advances |
3,147 |
3,479 |
2,412 |
| Declines |
1,428 |
1,115 |
2,129 |
| Unchanged |
253 |
218 |
283 |
| New
highs |
186 |
134 |
96 |
| New
lows |
34 |
31 |
43 |
| Closing
Arms (TRIN)† |
0.51 |
0.87 |
1.06 |
| Block
trades |
42,103 |
41,942 |
47,580 |
| Adv.
volume |
5,083,996,039 |
4,407,516,789 |
2,782,306,677 |
| Decl.
volume |
1,183,029,364 |
1,235,909,604 |
2,604,937,881 |
| Total
volume |
6,336,042,685 |
5,695,153,586 |
5,485,573,499 |
|
Table 2
Table 2 QUICKSILVER on ETFS - 2/1/2023 ---
     Bullish = 12 (+0)     COMPQX,  SPY, QQQ, MDY,   IWM, FAS, RETL, SOXL. TECL. IBB
                           GLD,  YINN (highest 0.951)
     Bearish = 0
ETF       CLOSE   CHANGE    PIVOT-PT    5-dma AROC    CL-PWR  CANDLE  IP21   ITRS   POWER INDEX
================================================================================================
DIA       340.87   .04       339.36        52.4%      Bullish  BLUE   .216    0        -----
---------------------------------------------------------------------------------------------
COMPQX    11816.32   231.77  11512.41      219%       Bullish  BLUE   .326    .046     .372
---------------------------------------------------------------------------------------------
SPY       410.8   4.32       404.75        129.5%     Bullish  BLUE   .238    .028     .266
---------------------------------------------------------------------------------------------
QQQ       300.92   6.3       293.34        225.5%     Bullish  BLUE   .313    .042     .355
---------------------------------------------------------------------------------------------
MDY       491.5   7.75       475.83        206.3%     Bullish  BLUE   .277    .065     .342
---------------------------------------------------------------------------------------------
IWM       194.49   3.01      188.56        186.4%     Bullish  BLUE   .306    .051     .357
---------------------------------------------------------------------------------------------
FAS       88.47   .13        86.26         201.3%     Bullish  BLUE   .274    .089     .363
---------------------------------------------------------------------------------------------
RETL      11.55   .96        9.51          1166%      -------  BLUE   .317    .353     .67
---------------------------------------------------------------------------------------------
SOXL      16.8   2.28        15.24         776.7%     -------  BLUE   .273    .344     .617
---------------------------------------------------------------------------------------------
TECL      30.2   1.97        28.39         557.2%     Bullish  BLUE   .257    .094     .351
---------------------------------------------------------------------------------------------
IBB       136.71   .16       137.16       -2.9%       -------  BLUE   .229    .012     .241
---------------------------------------------------------------------------------------------
GLD       181.67   2.26      179.47        15.6%      Bullish  BLUE   .409    .094     .503
---------------------------------------------------------------------------------------------
DBO       14.76  -.35        15.41        -197.7%     Bearish  RED   -.194   -.091    -.285
---------------------------------------------------------------------------------------------
OIH       327.36  -2.69      329.49        38.4%      Bullish  RED    .157    .038     .195
---------------------------------------------------------------------------------------------
CPER     25.44  -.2          25.96        -85.6%      Bullish  BLUE   .1      .132     .232
---------------------------------------------------------------------------------------------
TAN     82.63   1.83         79.48         215.5%     Bullish  BLUE   .234   -.014     .22
---------------------------------------------------------------------------------------------
UUP       27.25  -.26        27.43        -20%        Bearish  RED   -.193   -.066    -.259
---------------------------------------------------------------------------------------------
CORN      26.69   .11        26.58         50.9%      Bullish  BLUE  -.034    -.01    -.044
---------------------------------------------------------------------------------------------
WEAT      7.72   0           7.61          171.1%     Bullish  ----   .023   -.085    -.062
---------------------------------------------------------------------------------------------
YINN      67.62   4.08       73           -197.6%     Bullish  BLUE   .333    .67     1.003
|
 TABLE 1      RANKING OF KEY DIRECTORIES BASED PCT.OF STOCKS ABOVE 65-DMA
              2/1/23
---------------------------------------------------------------------------------------
Directory     Current       day-1         day-2         day-3         day-4         day-5
----------------------------------------------------------------------------------------
COPPER         1             1             1             1             1             1
EDU            1             1             1             .833          1             1
INFRA          .969          1             .939          .939          .969          .939
HOMEBLDG       .944          .944          .833          .888          .833          .944
               -----
AUTO           .924          .886          .754          .886          .735          .754
BONDFUND       .919          .908          .908          .908          .908          .896
GOLD           .913          .913          .934          .934          .913          .913
ETFS           .909          .909          .89           .89           .927          .927
REIT           .907          .907          .823          .907          .807          .807
TRANSP         .894          .789          .526          .684          .631          .684
SOFTWARE       .892          .857          .696          .821          .857          .75
SEMI           .882          .861          .808          .829          .861          .851
               -----
UTILITY        .868          .789          .605          .684          .736          .684
INDMATER       .861          .833          .805          .791          .819          .833
BIGBANKS       .857          .857          .714          .714          .714          .571
GUNS           .857          .785          .785          .785          .785          .785
HIGHPRIC       .857          .81           .724          .793          .801          .745
ELECTRON       .849          .812          .766          .774          .819          .834
GREEN          .833          .833          .666          .722          .777          .833
NASD-100       .83           .79           .72           .79           .78           .73
RUS-1000       .828          .806          .729          .779          .772          .743
               -----
CHINA          .818          .795          .772          .795          .795          .795
NIFTY          .818          .818          .75           .818          .795          .772
CHEM           .813          .79           .72           .697          .697          .744
SOLAR          .812          .687          .687          .687          .687          .687
COMPUTER       .8            .7            .6            .7            .8            .7
INSURANC       .8            .96           .84           .8            .88           .84
GAMING         .789          .842          .789          .894          .842          .789
HOSPITAL       .785          .642          .571          .571          .571          .571
SP500          .784          .762          .686          .745          .739          .717
               -----
INDEXES        .772          .794          .778          .789          .778          .789
JETS           .769          .846          .769          .846          .846          .846
FIDSTKS        .751          .745          .686          .757          .751          .739
HACKERS        .75           .687          .562          .75           .687          .625
FINANCE        .725          .775          .662          .662          .7            .662
RETAIL         .723          .723          .638          .68           .659          .659
FOOD           .673          .693          .653          .693          .755          .673
COAL           .666          .666          .666          .5            .5            .5
COMODITY       .666          .692          .641          .692          .743          .692
LOWPRICE       .653          .627          .61           .61           .598          .595
MILITARY       .653          .615          .653          .615          .615          .576
BIOTECH        .65           .636          .59           .636          .619          .633
SP-100         .633          .6            .522          .622          .577          .588
BEVERAGE       .571          .571          .428          .5            .571          .642
DOWJONES       .533          .566          .5            .566          .566          .633
               -----
OILGAS         .523          .6            .542          .666          .676          .638
==================================================================================================
REGBANKS       .48           .48           .32           .32           .28           .28
MARIJUAN       .4            .2            .1            .1            .1            .2
DJI-13         .384          .461          .384          .538          .461          .538
|
==================================================================================
Wednesday
- 6:00 AM - Futures: DJI -145 NASDAQ -40 Data
Used: 1/31/2022
| |
1/31/2023
|
|
| |
Tuesday
brought a high volume rise in most markets. There were 2600 NYSE
advancers and very few
new lows. The Closing Powers are rising impressively.
The big banks' ETF,
FAS, is one of the most bullish-looking. But the Opening
Powers are in
downtrends. So another weak opening presents itself. Professionals
may swoop in and
reverse the market up, as they have frequently done recently.
But that will take
"dovish" words and actions by Powell and the FED. Today may
not bring a Closing
Power reversal back up. That will depend on Powell and
Company. So,
let's just hold NVDA and CAT and some bullish MAXCPs
that show very high
current Accumuation. We can wait another day to see
what the FED does. |
|
| |
Charts - 1/31/2023
2022 PEERLESS DJI, Signals, Indicators Daily DJI Volume
10-DayUp/Down Vol Stoch-20 CCI RSI Pct of All Stocks above 65-dma
Inverted Traders Index
DJI-IPA DJI-OBV Short-Term Rates
NASDAQ S&P OEX NYSE DJ-15 DJ-20 DJI-30 Bond Funds
DIA QQQ SPY IWM new - COIN (Bit Coin ETF)
Gold Stocks
TNA Short-Term Rates Ten Year Rates PST (Short Treasuries)
DOLLAR-UUP
ALLSTOCKs
Russell-1000
Insurance-Stocks
Recent 2006 vers-Peerless signals
http://www.tigersoftware.com/OLDPEER/UPD90130.bmp
MDY - http://www.tigersoftware.com/CHARTX/MDY.GIF
USO-CrudeOil DBO FAS GLD HD IBB JETS JNUG KOL NAIL NUGT NRGU OIH
PALL RSX RETL SDS AGQ SLV SOXL TAN TECL TLT TMF TNA UGA USO
China:
YINN CHAU
Commodities: CANE
CORN DBC JJC, NIB CORN, CUT (paper)
MOO, NRGU
SOYB WEAT UUP (Dollar) LIT
(Lithium) PALL
(Palladium)
Stocks AA AAPL ADBE ALXN AMAT AMGN AMD AMZN AXP BA BABA
BAC BIDU BLDP CAT CHKP CNX CPB CRM CVX CMG DE DIS ENPH FB FSLR
FTNT GILD GME GOOG GS HD IBM INTU JPM KO KR LRCX MRK MRNA
MOS MSFT NEM NFLX NKE NOC NUE NVDA PANW PG PYPL REGN REV
SO QCOM QDEL TSLA TXN XOM V VRTX WFC WMT XLE ZM ZOM
Leveraged Short ETFs:
FAZ - financials, TZA and SRTY- small caps, MZZ - mid caps, TECS -Techs,
SOXS -
semi-conductors LABD
- Biotechs
Bullish MAXCPs http://www.tigersoftware.com/UPPING/1-31-2023/BULLISH.htm
Bearish MINCPs None today
http://www.tigersoftware.com/Downing/1-30-2023/BEARISH.htm
|
|
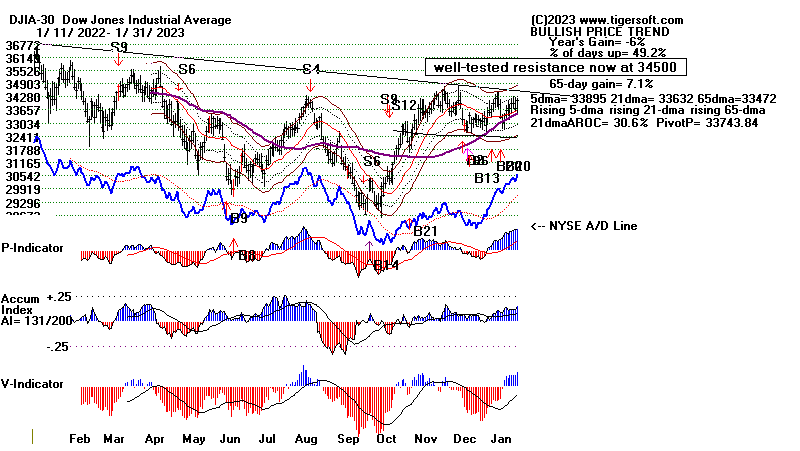
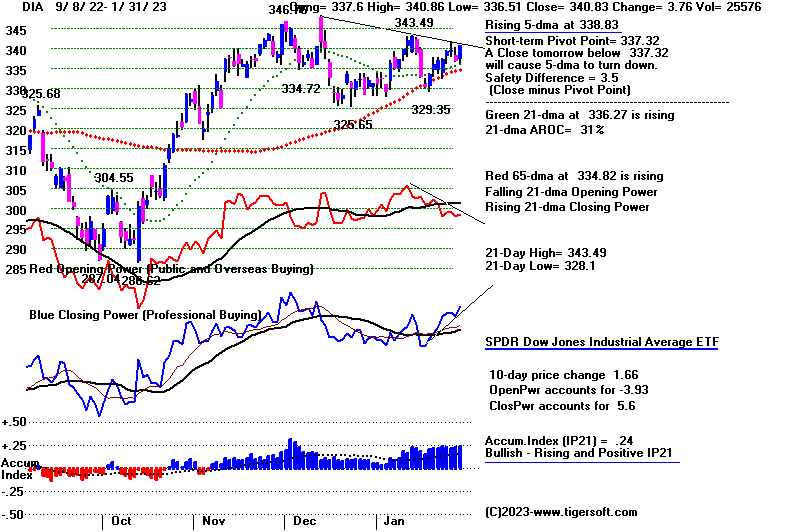
Big Banks would not be rising like this if the FED was about
smash the economy with much higher rates.
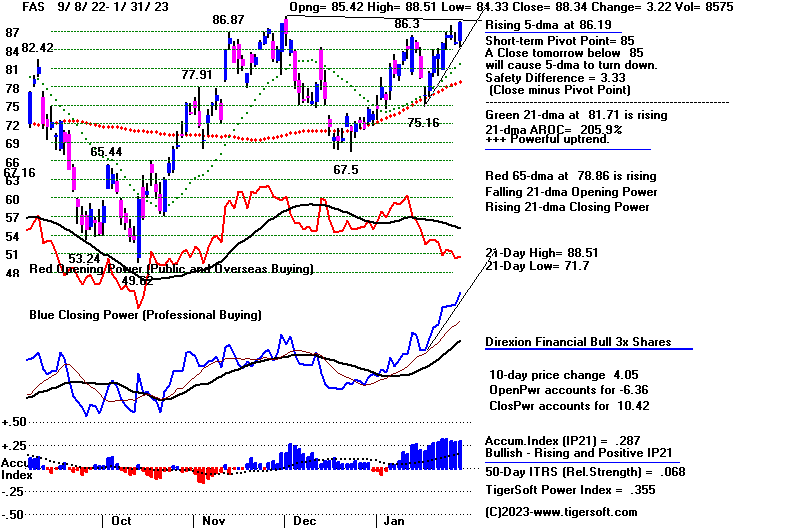
|
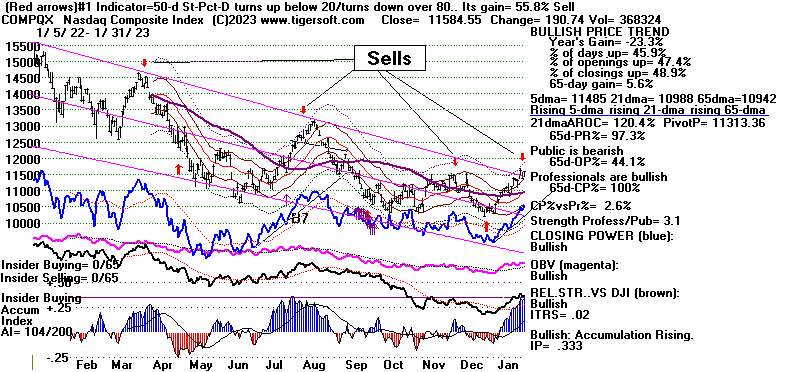 |
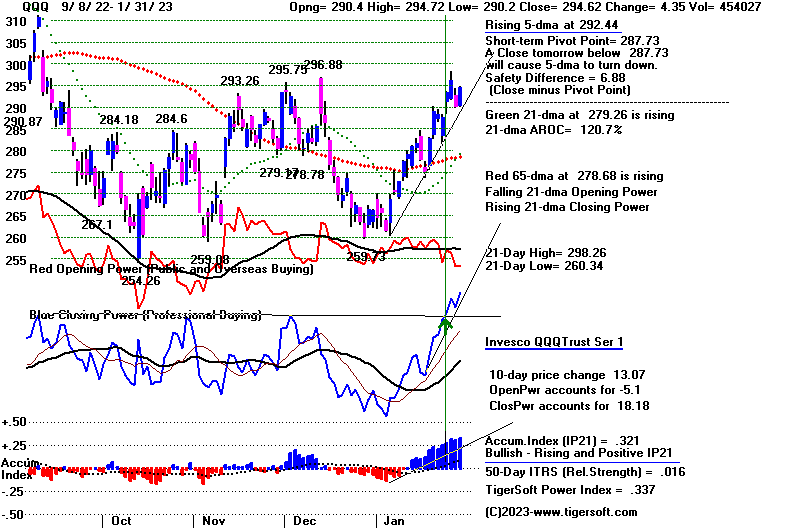 |
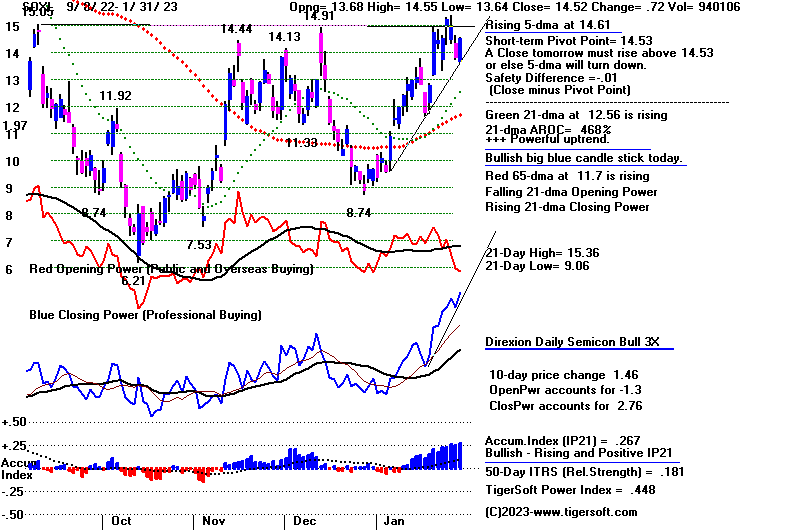 |
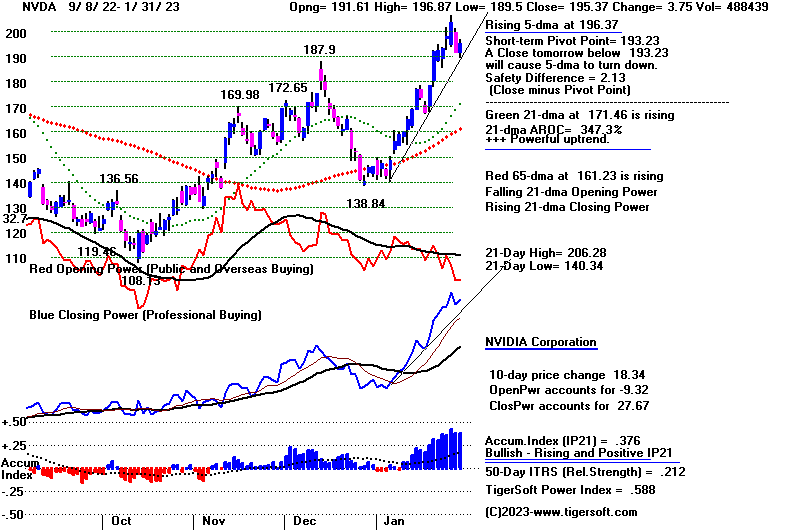 |
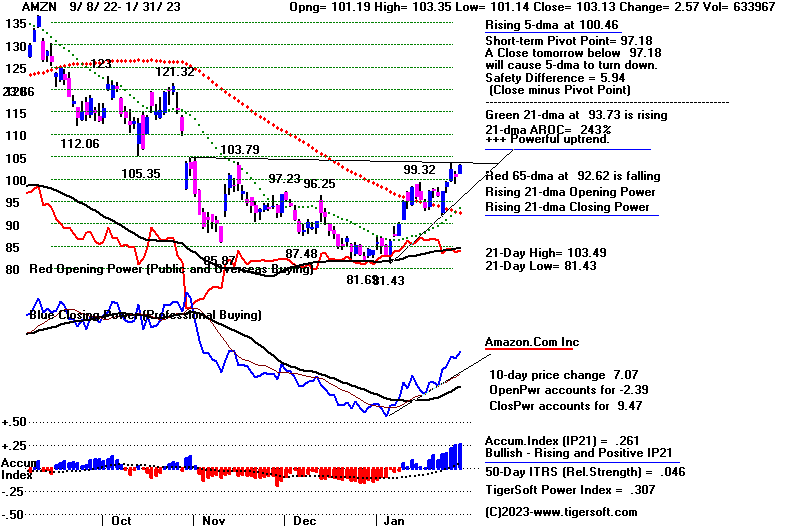 |
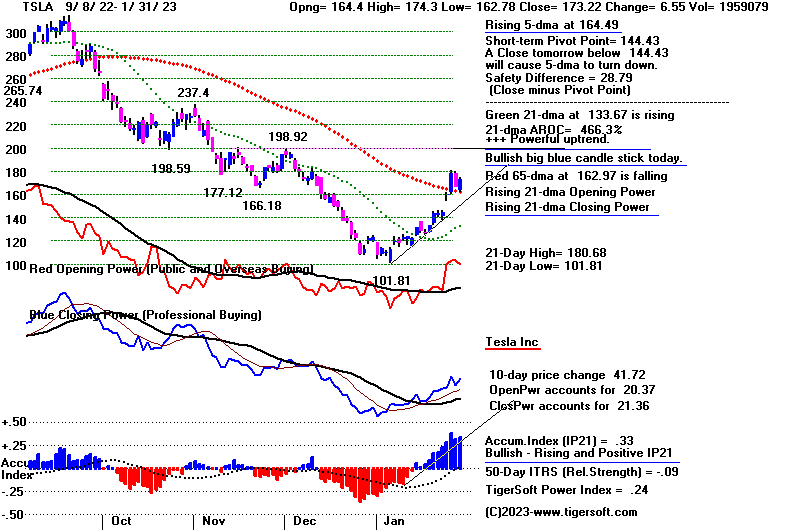 |
| NYSE |
Latest
Close |
Previous
Close |
Week
Ago |
| Issues
traded |
3,209 |
3,212 |
3,224 |
| Advances |
2,636 |
981 |
1,478 |
| Declines |
478 |
2,092 |
1,595 |
| Unchanged |
95 |
139 |
151 |
| New
highs |
104 |
64 |
98 |
| New
lows |
4 |
8 |
25 |
| Adv.
volume* |
1,152,669,189 |
182,240,398 |
247,096,260 |
| Decl.
volume* |
122,350,026 |
593,156,391 |
340,915,827 |
| Total
volume* |
1,278,643,358 |
787,069,534 |
599,171,838 |
| Closing
Arms (TRIN)† |
0.61 |
1.29 |
1.33 |
| Block
trades* |
4,872 |
4,082 |
3,059 |
| Adv.
volume |
4,182,478,944 |
994,261,359 |
1,337,622,659 |
| Decl.
volume |
459,487,807 |
2,740,467,635 |
1,915,571,098 |
| Total
volume |
4,679,324,627 |
3,802,006,926 |
3,320,430,225 |
| NASDAQ |
Latest
Close |
Previous
Close |
Week
Ago |
| Issues
traded |
4,812 |
4,843 |
4,832 |
| Advances |
3,479 |
1,505 |
2,095 |
| Declines |
1,115 |
3,121 |
2,461 |
| Unchanged |
218 |
217 |
276 |
| New
highs |
134 |
89 |
112 |
| New
lows |
31 |
20 |
35 |
| Closing
Arms (TRIN)† |
0.87 |
1.19 |
0.77 |
| Block
trades |
41,942 |
37,690 |
55,982 |
| Adv.
volume |
4,407,516,789 |
1,462,616,744 |
2,943,092,909 |
| Decl.
volume |
1,235,909,604 |
3,605,075,728 |
2,663,367,815 |
| Total
volume |
5,695,153,586 |
5,122,326,100 |
5,670,864,706 |
|
Table 2 QUICKSILVER on ETFS - 1/31/2023 ---
     Bullish = 12 (+5)     COMPQX,  SPY, QQQ, MDY,   IWM, FAS, RETL, SOXL. TECL. IBB
                          GLD,  YINN (highest 0.951)
     Bearish = 0
ETF       CLOSE   CHANGE    PIVOT-PT    5-dma AROC    CL-PWR  CANDLE  IP21   ITRS   POWER INDEX
================================================================================================
DIA       340.83   3.77      337.32        55.2%      -------  BLUE   .241    0        ----
---------------------------------------------------------------------------------------------
COMPQX    11584.55   190.74  11313.36      109.4%     -------  BLUE   .333    .022     .355
---------------------------------------------------------------------------------------------
SPY       406.48   5.89      400.35        78%        -------  BLUE   .256    .014     .27
---------------------------------------------------------------------------------------------
QQQ       294.62   4.35      287.73        107.3%     -------  BLUE   .322    .018     .34
---------------------------------------------------------------------------------------------
MDY       483.75   11.38     471.85        138.2%     -------  BLUE   .269    .042     .311
---------------------------------------------------------------------------------------------
IWM       191.48   4.54      187.45        121.1%     -------  BLUE   .315    .025     .34
---------------------------------------------------------------------------------------------
FAS       88.34   3.23       85            299.4%     -------  BLUE   .288    .07      .358
---------------------------------------------------------------------------------------------
RETL      10.59   .82        9.26          831.2%     -------  BLUE   .31    .259      .569
---------------------------------------------------------------------------------------------
SOXL      14.52   .72        14.53         27.4%      -------  BLUE   .267    .183     .45
---------------------------------------------------------------------------------------------
TECL      28.23   1.12       27.09         165.9%     -------  BLUE   .263    .026     .289
---------------------------------------------------------------------------------------------
IBB       136.55   1.75      136.79       -8.4%       -------  BLUE   .249    .003     .252
---------------------------------------------------------------------------------------------
GLD       179.41   .65       181.11       -24.2%      Bullish  BLUE   .376    .072     .448
---------------------------------------------------------------------------------------------
DBO       15.11   .25        15.36        -85.4%      Bearish  BLUE  -.089   -.101    -.19
---------------------------------------------------------------------------------------------
OIH       330.05   6.88      324.85        204.9%     Bullish  BLUE   .158    .043     .201
---------------------------------------------------------------------------------------------
CPER     25.64   .27         25.88        -38.9%      Bullish  BLUE   .084    .116     .2
---------------------------------------------------------------------------------------------
TAN     80.8   2.58          79.2          7.5%       -------  BLUE   .241   -.023     .218
---------------------------------------------------------------------------------------------
UUP       27.51  -.06        27.36         10.9%      Bearish  ----  -.144   -.053    -.197
---------------------------------------------------------------------------------------------
CORN      26.58   0          26.42         15.1%      Bullish  BLUE  -.074   -.014    -.088
---------------------------------------------------------------------------------------------
WEAT      7.72   .11         7.46          192.3%     Bullish  BLUE   .029   -.097    -.068
---------------------------------------------------------------------------------------------
YINN      63.54  -1.06       70.34        -452.2%     Bullish  BLUE   .272    .679     .951
|
Table 3       RANKING OF KEY DIRECTORIES BASED PCT.OF STOCKS ABOVE 65-DMA
              1/31/23
  Bullish = 46
  Bearish = 3
---------------------------------------------------------------------------------------
Directory     Current       day-1         day-2         day-3         day-4         day-5
----------------------------------------------------------------------------------------
COPPER         1             1             1             1             1             1
EDU            1             1             .833          1             1             1
INFRA          1             .939          .939          .969          .939          .939
INSURANC       .96           .84           .8            .88           .84           .84
HOMEBLDG       .944          .833          .888          .833          .944          .944
GOLD           .913          .934          .934          .913          .913          .934
ETFS           .909          .89           .89           .927          .945          .909
BONDFUND       .908          .908          .908          .908          .908          .896
REIT           .907          .815          .915          .815          .8            .784
AUTO           .886          .773          .886          .735          .754          .773
SEMI           .861          .808          .829          .861          .84           .84
BIGBANKS       .857          .714          .714          .714          .571          .571
SOFTWARE       .857          .714          .821          .857          .75           .767
JETS           .846          .769          .846          .846          .846          .846
GAMING         .842          .789          .842          .894          .789          .842
GREEN          .833          .666          .722          .777          .833          .777
INDMATER       .833          .805          .791          .819          .833          .833
NIFTY          .818          .75           .818          .795          .772          .772
ELECTRON       .812          .766          .774          .819          .827          .812
HIGHPRIC       .81           .724          .793          .801          .75           .762
RUS-1000       .806          .729          .779          .772          .746          .741
CHINA          .795          .772          .795          .795          .795          .795
INDEXES        .794          .778          .789          .778          .789          .805
CHEM           .79           .72           .697          .697          .744          .744
NASD-100       .79           .72           .79           .78           .73           .74
UTILITY        .789          .605          .684          .736          .71           .684
TRANSP         .789          .526          .684          .631          .684          .736
GUNS           .785          .785          .785          .785          .785          .642
FINANCE        .775          .662          .662          .687          .662          .687
SP500          .762          .686          .747          .735          .725          .719
FIDSTKS        .745          .686          .757          .751          .739          .721
RETAIL         .723          .638          .68           .659          .659          .638
COMPUTER       .7            .6            .7            .8            .7            .7
FOOD           .693          .653          .673          .755          .673          .632
COMODITY       .692          .641          .666          .743          .692          .692
HACKERS        .687          .562          .75           .687          .625          .5
SOLAR          .687          .687          .687          .687          .687          .75
COAL           .666          .666          .5            .5            .5            .666
HOSPITAL       .642          .571          .571          .571          .571          .571
BIOTECH        .636          .588          .639          .619          .633          .656
LOWPRICE       .627          .613          .613          .598          .593          .607
MILITARY       .615          .653          .615          .615          .576          .538
OILGAS         .6            .542          .666          .676          .638          .59
SP-100         .6            .522          .622          .577          .588          .588
BEVERAGE       .571          .428          .5            .571          .642          .571
DOWJONES       .566          .5            .566          .566          .633          .6
================================================================================================
REGBANKS       .48           .32           .32           .28           .28           .32
DJI-13         .461          .384          .538          .461          .538          .461
MARIJUAN       .2            .1            .1            .1            .2            .3
|
=====================================================================
Tuesday
- 5:55 AM - Futures: DJI -45 NASDAQ -40 Data
Used: 1/30/2022
| |
|
|
| |
Sellers at
the opening have become more aggressive and the Professionals
are starting to join them.
The current decline may last now until the DJI falls 300 points
to its 65-dma or to the DJI's
support-line somehat further below. We must wait now
until this decline takes
place or the FED decides what it will do with interest rates.
We remain loyal to our
Peerless buys and trust the bullish seasonality, too. As a result,
I woud stay long CAT
and NVDA even though profit-taking in the strongest stocks
was very evident today
and may last a few more days. There are few very weak
Bearish MINCPs amd not enough
new lows at this time to encourage us to go short.
See Breadth Table 1
below. See also below how the most heavily weighted DJI stocks.
shown below. Most
are holding up above their price uptrends with the exception
of UNH and AMGEN.
HD and GS deserve special attention now. Just 50% of
all the 30-DJI stocks are
above their 65-dma. A higher percentage of QQQ, SPY
and IWM stocks are above
their 65-dma. So, there should be considrable support
if the decline goes weaker. |
|
| |
Charts - 1/30/2023
2022 PEERLESS DJI, Signals, Indicators Daily DJI Volume
10-DayUp/Down Vol Stoch-20 CCI RSI Pct of All Stocks above 65-dma
Inverted Traders Index
DJI-IPA DJI-OBV Short-Term Rates
NASDAQ S&P OEX NYSE DJ-15 DJ-20 DJI-30 Bond Funds
DIA QQQ SPY IWM new - COIN (Bit Coin ETF)
Gold Stocks
TNA Short-Term Rates Ten Year Rates PST (Short Treasuries)
DOLLAR-UUP
ALLSTOCKs
Russell-1000
Insurance-Stocks
Recent 2006 vers-Peerless signals
http://www.tigersoftware.com/OLDPEER/UPD90130.bmp
MDY - http://www.tigersoftware.com/CHARTX/MDY.GIF
USO-CrudeOil DBO FAS GLD HD IBB JETS JNUG KOL NAIL NUGT NRGU OIH
PALL RSX RETL SDS AGQ SLV SOXL TAN TECL TLT TMF TNA UGA USO
China: YINN
CHAU
Commodities: CANE
CORN DBC JJC, NIB CORN, CUT (paper)
MOO, NRGU
SOYB WEAT UUP (Dollar) LIT
(Lithium) PALL
(Palladium)
Stocks AA AAPL ADBE ALXN AMAT AMGN AMD AMZN AXP BA BABA
BAC BIDU BLDP CAT CHKP CNX CPB CRM CVX CMG DE DIS ENPH FB FSLR
FTNT GILD GME GOOG GS HD IBM INTU JPM KO KR LRCX MRK MRNA
MOS MSFT NEM NFLX NKE NOC NUE NVDA PANW PG PYPL REGN REV
SO QCOM QDEL TSLA TXN XOM V VRTX WFC WMT XLE ZM ZOM
Leveraged Short ETFs:
FAZ - financials, TZA and SRTY- small caps, MZZ - mid caps, TECS -Techs,
SOXS -
semi-conductors LABD
- Biotechs
Bullish MAXCPs http://www.tigersoftware.com/UPPING/1-30-2023/BULLISH.htm
Bearish MINCPs http://www.tigersoftware.com/Downing/1-30-2023/BEARISH.htm
|
|
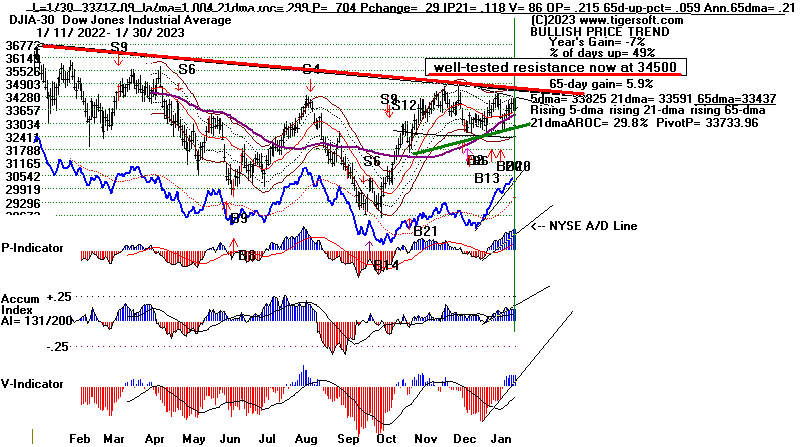 |
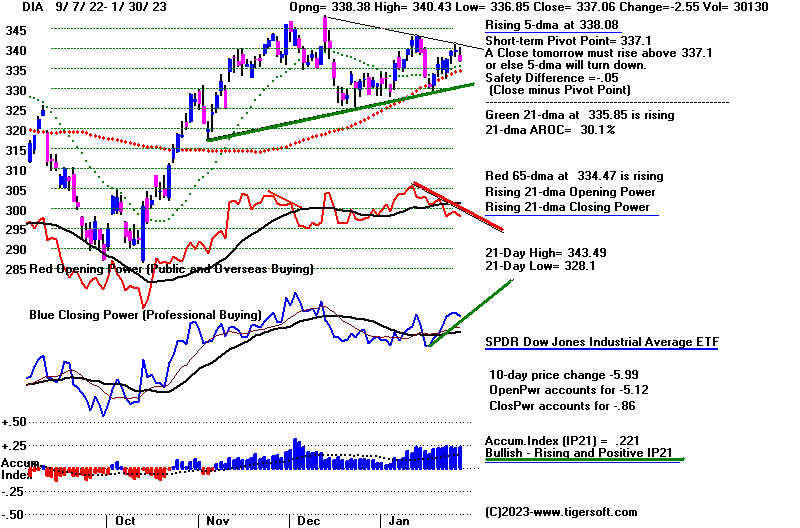 |
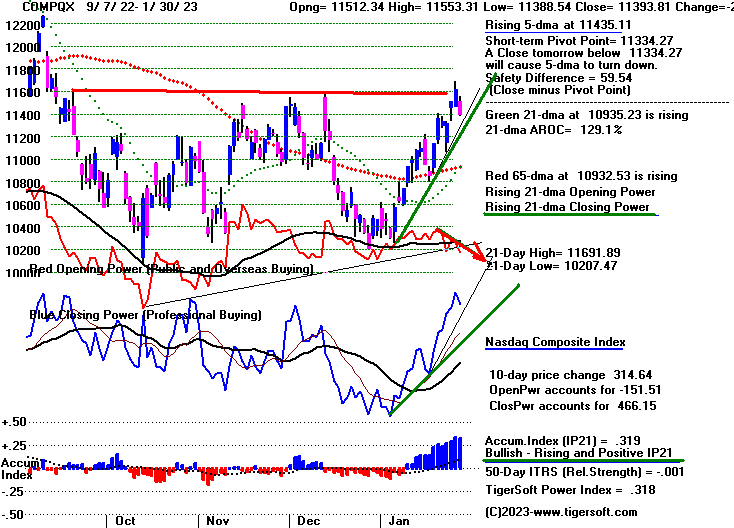 |
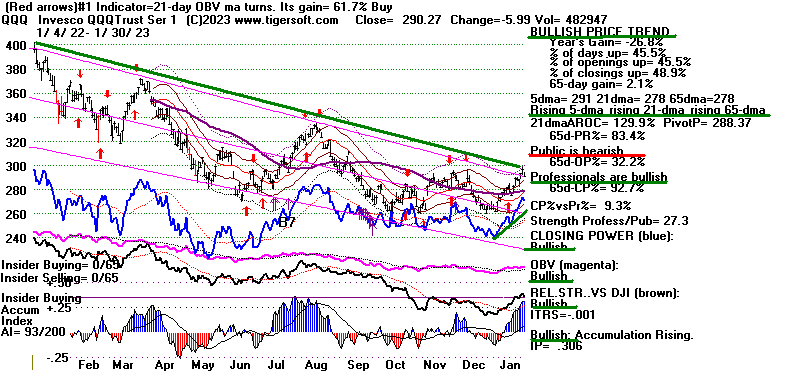 |
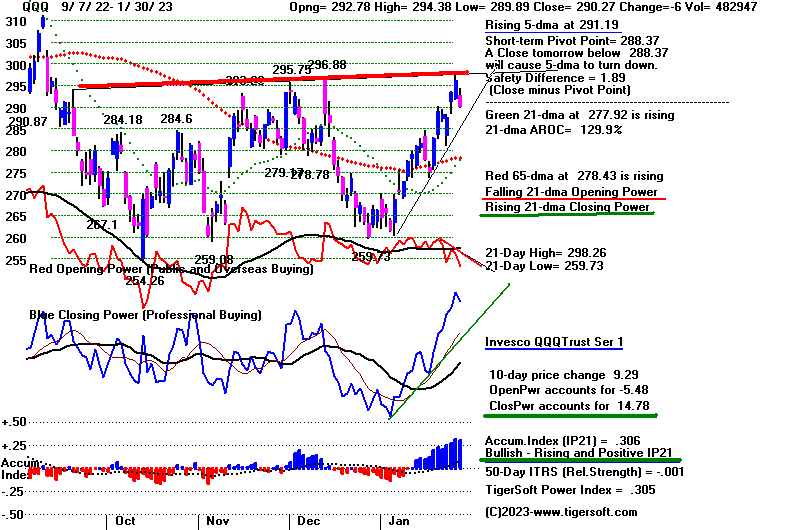 |
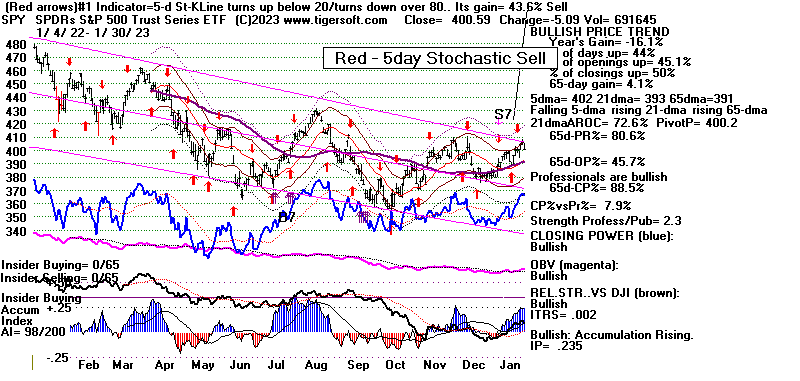 |
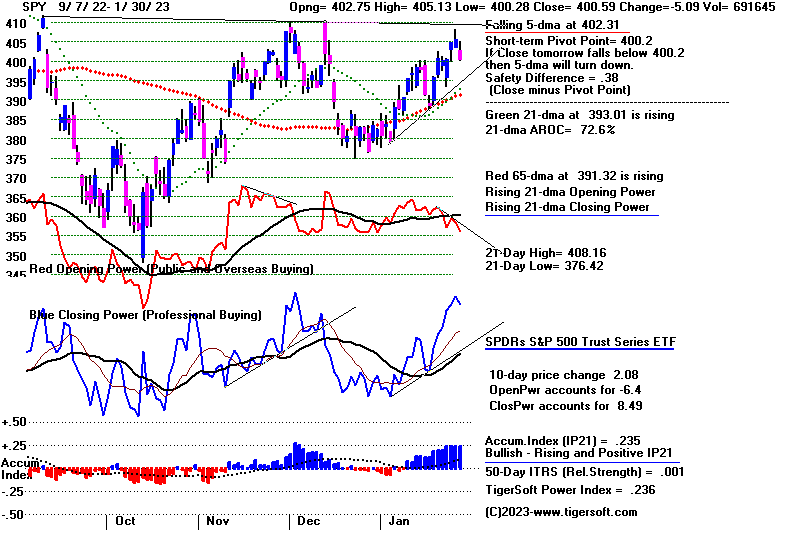 |
 |
 |
 |
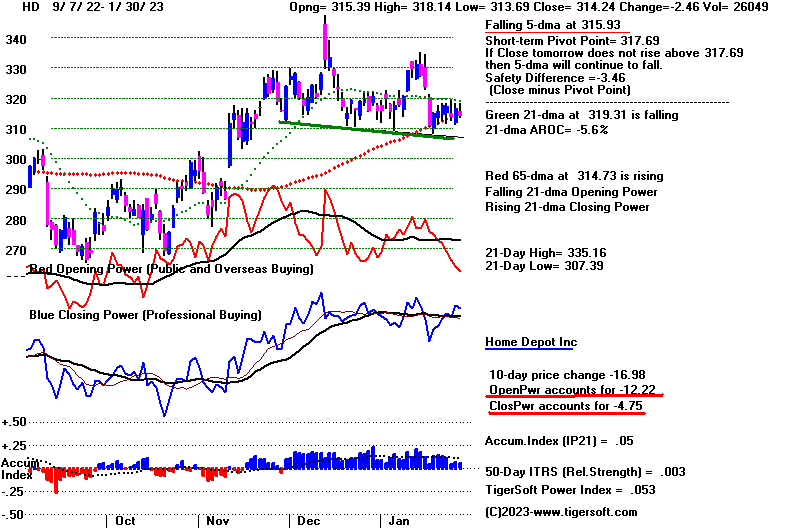 |
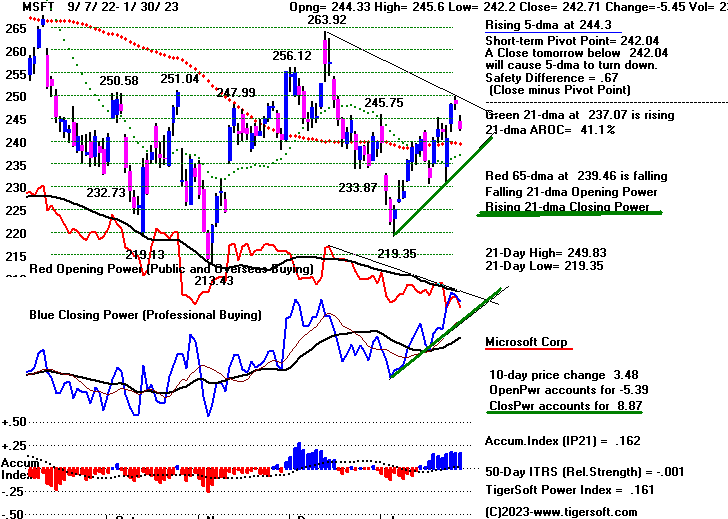 |
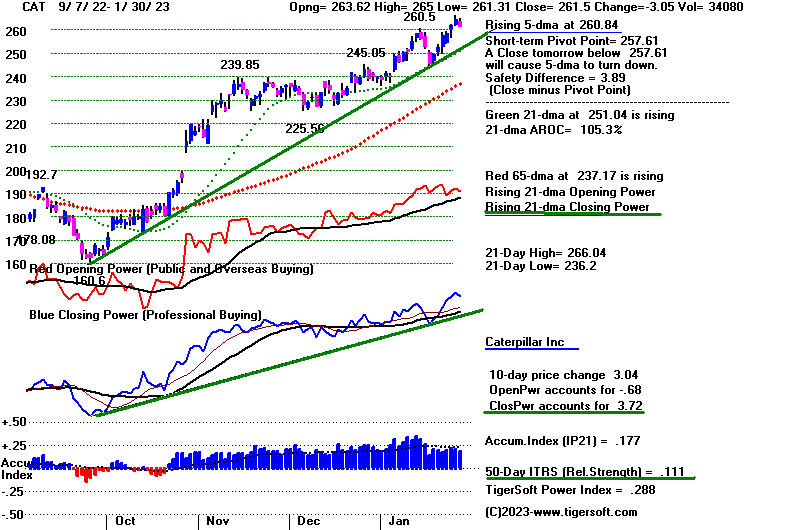 |
Table 1
| NYSE |
Latest
Close |
Previous
Close |
Week
Ago |
| Issues
traded |
3,212 |
3,222 |
3,232 |
| Advances |
981 |
1,798 |
2,241 |
| Declines |
2,092 |
1,278 |
849 |
| Unchanged |
139 |
146 |
142 |
| New
highs |
64 |
115 |
86 |
| New
lows |
8 |
6 |
8 |
| Adv.
volume* |
182,240,398 |
435,803,257 |
593,455,869 |
| Decl.
volume* |
593,156,391 |
313,816,899 |
205,998,262 |
| Total
volume* |
787,069,534 |
758,921,396 |
807,901,585 |
| Closing
Arms (TRIN)† |
1.29 |
0.95 |
0.90 |
| Block
trades* |
4,082 |
4,218 |
3,991 |
| Adv.
volume |
994,261,359 |
2,299,090,440 |
2,910,041,316 |
| Decl.
volume |
2,740,467,635 |
1,547,972,754 |
993,600,885 |
| Total
volume |
3,802,006,926 |
3,907,768,147 |
3,945,212,001 |
| NASDAQ |
Latest
Close |
Previous
Close |
Week
Ago |
| Issues
traded |
4,843 |
4,742 |
4,930 |
| Advances |
1,505 |
2,584 |
2,966 |
| Declines |
3,121 |
1,927 |
1,716 |
| Unchanged |
217 |
231 |
248 |
| New
highs |
89 |
126 |
115 |
| New
lows |
20 |
40 |
35 |
| Closing
Arms (TRIN)† |
1.19 |
0.65 |
0.32 |
| Block
trades |
37,690 |
50,253 |
53,209 |
| Adv.
volume |
1,462,616,744 |
4,147,382,435 |
5,028,577,057 |
| Decl.
volume |
3,605,075,728 |
2,023,032,921 |
927,059,381 |
| Total
volume |
5,122,326,100 |
6,243,808,988 |
5,997,817,139 |
|
Table 2 QUICKSILVER on ETFS - 1/30/2023 ---
     Bullish = 7 (-4)     COMPQX,  QQQ,   IWM, FAS, RETL
                          GLD,  YINN (highest 0.900)
     Bearish = 0
ETF       CLOSE   CHANGE    PIVOT-PT    5-dma AROC    CL-PWR  CANDLE  IP21   ITRS   POWER INDEX
================================================================================================
DIA       337.06  -2.55      337.1         13.2%      -------  RED    .222    0        ----
---------------------------------------------------------------------------------------------
COMPQX    11393.81  -227.9   11334.27      12.9%      -------  RED    .319    .001     .32
---------------------------------------------------------------------------------------------
SPY       400.59  -5.09      400.2        -.5%        -------  RED    .235    .003     .238
---------------------------------------------------------------------------------------------
QQQ       290.27  -5.99      288.37        22.5%      -------  RED    .306    .001     .307
---------------------------------------------------------------------------------------------
MDY       472.37  -5.28      470.66        1.8%       -------  RED    .205    .014     .219
---------------------------------------------------------------------------------------------
IWM       186.94  -2.64      186.93       -10.4%      -------  RED    .308   -.006     .302
---------------------------------------------------------------------------------------------
FAS       85.11  -1.15       83.24         127.4%     Bullish  BLUE   .277    .028     .305
---------------------------------------------------------------------------------------------
RETL      9.77  -.2          9.01          239%       -------  ----   .298    .042     .34
---------------------------------------------------------------------------------------------
SOXL      13.8  -1.18        14.44        -317.9%     -------  RED    .247   -.008     .239
---------------------------------------------------------------------------------------------
TECL      27.11  -1.61       27.31        -43.2%      -------  RED    .254   -.045     .209
---------------------------------------------------------------------------------------------
IBB       134.8  -2.43       136.78       -72.7%      -------  RED    .231   -.005     .226
---------------------------------------------------------------------------------------------
GLD       178.76  -.46       180.28       -24.2%      Bullish  RED    .353    .078     .431
---------------------------------------------------------------------------------------------
DBO       14.86  -.26        15.37        -240.7%     Bearish  RED   -.093   -.12    -.213
---------------------------------------------------------------------------------------------
OIH       323.17  -2.77      316.77        71%        Bullish  BLUE   .155    .01     .165
---------------------------------------------------------------------------------------------
CPER     25.37  -.25         25.84        -81.3%      Bullish  RED    .083    .099     .182
---------------------------------------------------------------------------------------------
TAN     78.22  -1.93         80.68        -211.3%     -------  RED    .199   -.047     .152
---------------------------------------------------------------------------------------------
UUP       27.57   .1         27.45         16.4%      Bearish  BLUE  -.132   -.041    -.173
---------------------------------------------------------------------------------------------
CORN      26.58   .04        26.5          81.3%      Bullish  RED    .018   -.004     .014
---------------------------------------------------------------------------------------------
WEAT      7.61   .02         7.43          207.3%     Bullish  ----   .03   -.108    -.078
---------------------------------------------------------------------------------------------
YINN      64.6  -8.05        69.88        -382.1%     -------  RED    .292    .608     .9
|
 Table 3      RANKING OF KEY DIRECTORIES BASED PCT.OF STOCKS ABOVE 65-DMA
              1/30/23
---------------------------------------------------------------------------------------
Directory     Current       day-1         day-2         day-3         day-4         day-5
----------------------------------------------------------------------------------------
COPPER         1             1             1             1             1             1
EDU            1             .833          1             1             1             1
INFRA          .939          .939          .969          .939          .939          .969
GOLD           .934          .934          .913          .913          .934          .934
BONDFUND       .908          .908          .908          .908          .908          .896
ETFS           .89           .89           .927          .945          .927          .909
INSURANC       .84           .8            .88           .84           .84           .8
HOMEBLDG       .833          .888          .833          .944          .944          .888
REIT           .815          .907          .823          .807          .784          .753
SEMI           .808          .829          .861          .84           .84           .893
INDMATER       .805          .791          .819          .833          .833          .833
GAMING         .789          .842          .842          .842          .894          .842
GUNS           .785          .785          .785          .785          .642          .642
INDEXES        .778          .789          .778          .789          .81           .821
AUTO           .773          .905          .735          .754          .754          .792
CHINA          .772          .795          .795          .795          .795          .84
JETS           .769          .846          .846          .846          .846          .846
ELECTRON       .766          .774          .819          .827          .804          .827
NIFTY          .75           .818          .795          .772          .772          .772
RUS-1000       .729          .779          .772          .746          .749          .754
               =====
HIGHPRIC       .724          .793          .801          .75           .767          .797
CHEM           .72           .697          .697          .744          .744          .72
NASD-100       .72           .79           .78           .73           .75           .74
               =====
BIGBANKS       .714          .714          .714          .571          .571          .571
SOFTWARE       .714          .839          .857          .75           .785          .785
SOLAR          .687          .687          .687          .687          .75           .812
FIDSTKS        .686          .757          .751          .739          .727          .751
SP500          .686          .747          .737          .721          .731          .727
               =====
COAL           .666          .5            .5            .5            .666          .666
GREEN          .666          .722          .777          .833          .777          .777
FINANCE        .662          .662          .687          .65           .687          .712
FOOD           .653          .673          .734          .673          .632          .612
MILITARY       .653          .615          .615          .576          .576          .461
COMODITY       .641          .666          .717          .692          .692          .666
RETAIL         .638          .68           .659          .659          .617          .638
LOWPRICE       .613          .616          .601          .593          .604          .621
UTILITY        .605          .684          .736          .71           .763          .657
COMPUTER       .6            .7            .8            .7            .7            .8
BIOTECH        .588          .636          .622          .633          .647          .644
HOSPITAL       .571          .571          .571          .571          .571          .642
HACKERS        .562          .75           .687          .625          .562          .562
OILGAS         .542          .666          .676          .638          .59           .609
TRANSP         .526          .684          .631          .684          .736          .736
SP-100         .522          .622          .577          .588          .6            .588
===============================================================================================
DOWJONES       .5            .566          .566          .633          .633          .600        ==================================================================================================
BEVERAGE       .428          .5            .571          .642          .571          .571
DJI-13         .384          .538          .461          .538          .538          .461
REGBANKS       .32           .32           .28           .28           .36           .36
MARIJUAN       .1            .1            .1            .2            .3            .3
|
====================================================================================
Monday
- 6:20 AM - Futures: DJI -186 NASDAQ -146
Data Used: 1/27/2023
|
1-27-2023
DJIA
33978.08 +28.67 +.08%
S&P 500 4070.56
+10.13 +0.25%
Nasdaq 11621.71
109.30 +0.95%
NYSE Advances 1798
NYSE Declines 1278
New Highs = 115 + 236 = 351
New Lows = 6 + 140 = 246
|
|
|
By most
measures, the market is over-bought. The DJI has risen six straight
days. The NASDAQ, SPY and QQQ
have reached their well-tested downtrends.
Almost all our groups show a
majority of their stocks are above their 65-dma.
More than 80% of all the 5000
stocks and ETFs we track (A-Z) are above their
65-dma. So, it does not
surpise us that the futures on a Monday morning are
down the week the FED is scheduled
to meet to decide on another rate hike.
The boost in interest rates is
expected to be small. Based on the strength in the
market since last October, it is
not expected to cause a recession. Professionals,
who are generally quite
well-informed about the FED's intentions are still net-buyers.
The Closing Powers of the major
ETFs are all rising and the NYSE A/D Line has
recently been much stronger than
the DJIA. These affirm the strong technical
underpinning for the market now, as
do the unrversed multiple Peerless Buys and the
strong seasonality. Since
1967, we see that the DJI has risen 60% of the time
over the next ten days, but then
bullish seasonality drops to only 53% of the time
over the next two months for the
DJIA when we only consider the time after January
30th in the third year of the
4-year Presidential cycle.
We have sold our DIA position and will
try to buy it back if it again successfully
tests its rising 65-dma. We are
long CAT, NVDA and some of the most bullish
MAXCPs. We have avoided the short
side of the market since the start of the
new year. Let me suggest shorting
one or two of the regional bank stocks now.
Clearly, they are much weaker than the
Big Banks, chiefly because a retreat
in housing prices is so widely expected
and because certain areas of the country
are much weaker economically than othes.
The Big Banks can butress their profits
with their computerized trading accounts.
FAS, their ETF, has reached its well-tested
resistance-level now and should turn
down. If it does not, that will be a very positive
sign for the general market.. |
|
|
Charts - 1/27/2023
2022 PEERLESS DJI, Signals, Indicators Daily DJI Volume
10-DayUp/Down Vol Stoch-20 CCI RSI Pct of All Stocks above 65-dma
Inverted Traders Index
DJI-IPA DJI-OBV Short-Term Rates
NASDAQ S&P OEX NYSE DJ-15 DJ-20 DJI-30 Bond Funds
DIA QQQ SPY IWM new - COIN (Bit Coin ETF)
Gold Stocks
TNA Short-Term Rates Ten Year Rates PST (Short Treasuries)
DOLLAR-UUP
ALLSTOCKs
Russell-1000
Insurance-Stocks
Recent 2006 vers-Peerless signals
http://www.tigersoftware.com/OLDPEER/UPD90127.bmp
MDY - http://www.tigersoftware.com/CHARTX/MDY.GIF
USO-CrudeOil DBO FAS GLD HD IBB JETS JNUG KOL NAIL NUGT NRGU OIH
PALL RSX RETL SDS AGQ SLV SOXL TAN TECL TLT TMF TNA UGA USO
China: YINN
CHAU
Commodities: CANE
CORN DBC JJC, NIB CORN, CUT (paper)
MOO, NRGU
SOYB WEAT UUP (Dollar) LIT
(Lithium) PALL
(Palladium)
Stocks AA AAPL ADBE ALXN AMAT AMGN AMD AMZN AXP BA BABA
BAC BIDU BLDP CAT CHKP CNX CPB CRM CVX CMG DE DIS ENPH FB FSLR
FTNT GILD GME GOOG GS HD IBM INTU JPM KO KR LRCX MRK MRNA
MOS MSFT NEM NFLX NKE NOC NUE NVDA PANW PG PYPL REGN REV
SO QCOM QDEL TSLA TXN XOM V VRTX WFC WMT XLE ZM ZOM
Leveraged Short ETFs:
FAZ - financials, TZA and SRTY- small caps, MZZ - mid caps, TECS -Techs,
SOXS -
semi-conductors LABD
- Biotechs
Bullish MAXCPs http://www.tigersoftware.com/UPPING/1-27-2023/BULLISH.htm
Bearish MINCPs http://www.tigersoftware.com/Downing/1-27-2023/BEARISH.htm
|
|
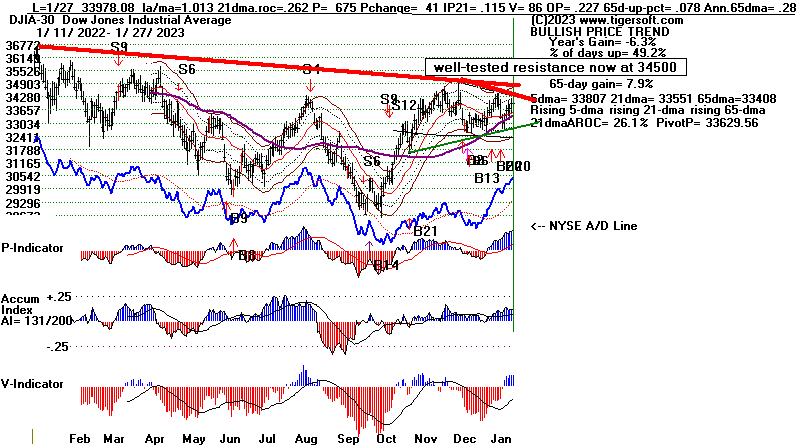 |
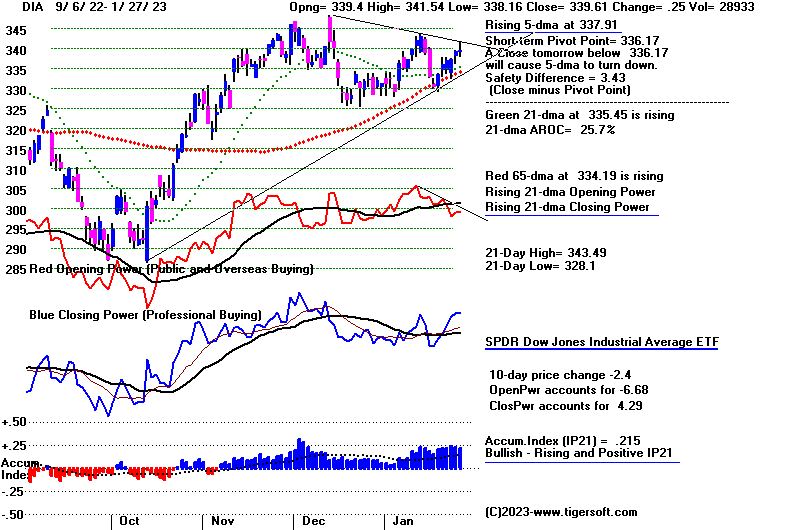 |
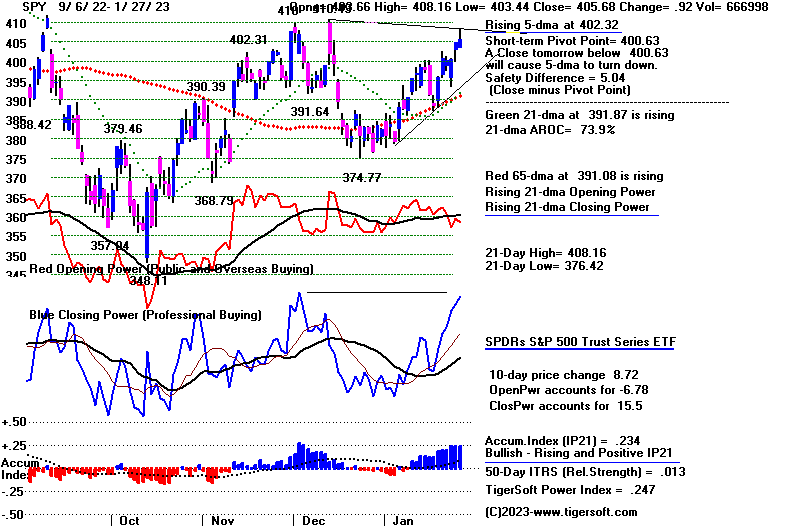 |
 |
|
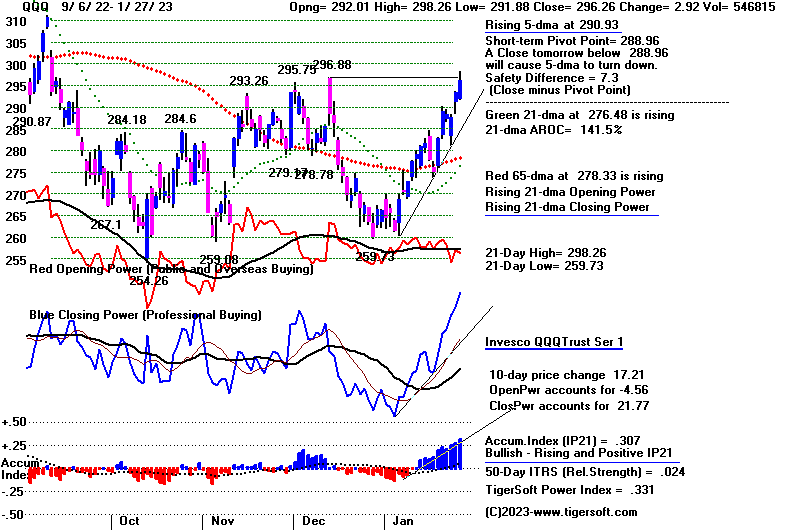 |
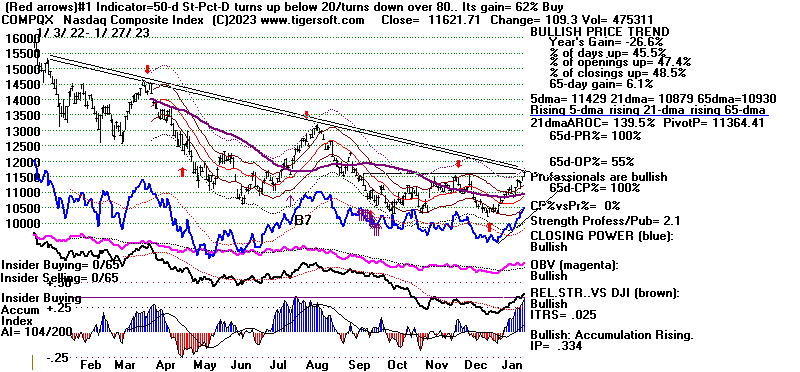 |
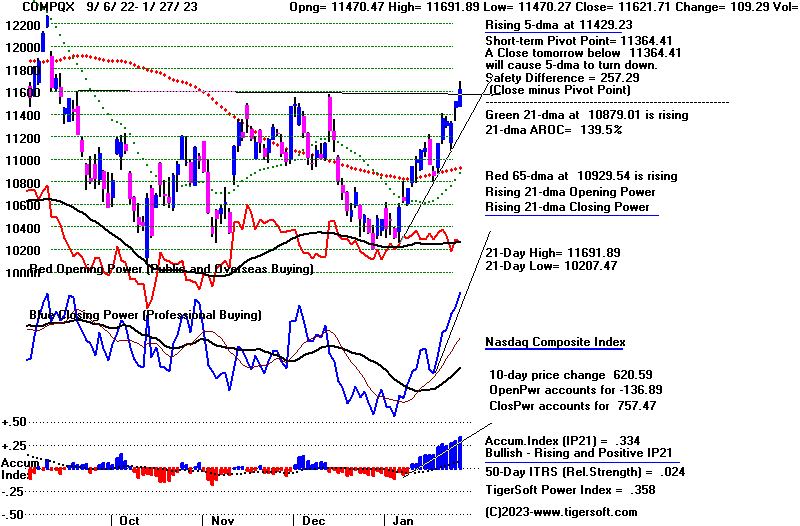 |
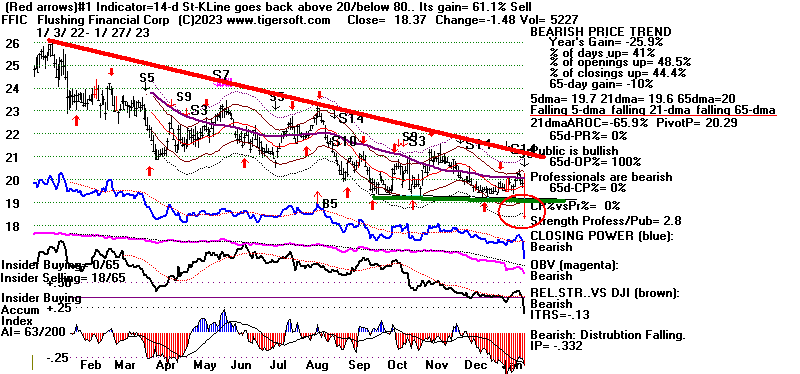 |
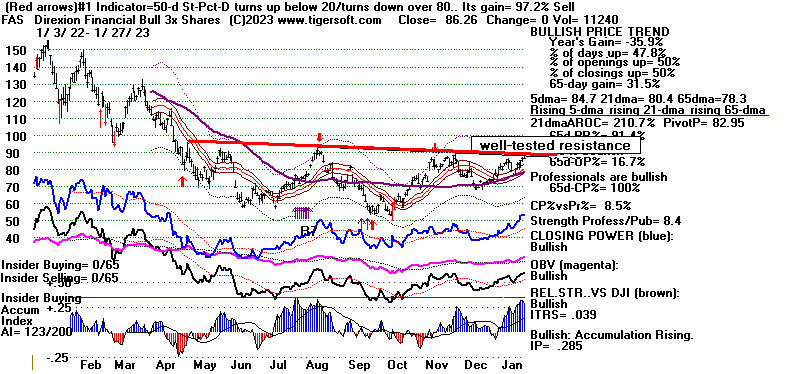 |
 |
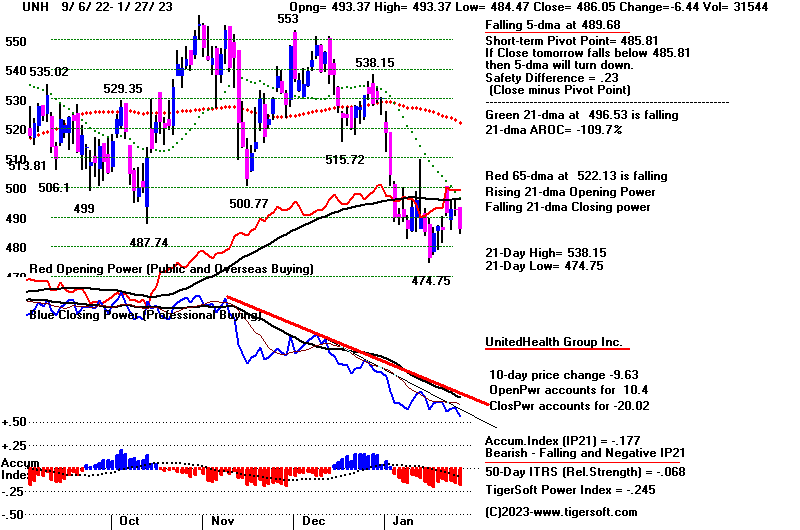 |
Table 1 - Breadth and Volume Statistics
| NYSE |
Latest
Close |
Previous
Close |
Week
Ago |
| Issues
traded |
3,222 |
3,201 |
3,252 |
| Advances |
1,798 |
2,116 |
2,500 |
| Declines |
1,278 |
961 |
640 |
| Unchanged |
146 |
124 |
112 |
| New
highs |
115 |
117 |
47 |
| New
lows |
6 |
11 |
16 |
| Adv.
volume* |
435,803,257 |
503,185,532 |
837,164,455 |
| Decl.
volume* |
313,816,899 |
258,274,545 |
128,560,067 |
| Total
volume* |
758,921,396 |
773,304,402 |
974,935,396 |
| Closing
Arms (TRIN)† |
0.95 |
1.16 |
0.67 |
| Block
trades* |
4,218 |
4,045 |
4,936 |
| Adv.
volume |
2,299,090,440 |
2,453,695,268 |
3,365,787,147 |
| Decl.
volume |
1,547,972,754 |
1,291,411,386 |
575,785,911 |
| Total
volume |
3,907,768,147 |
3,809,598,171 |
4,013,367,633 |
| NASDAQ |
Latest
Close |
Previous
Close |
Week
Ago |
| Issues
traded |
4,742 |
4,804 |
4,838 |
| Advances |
2,584 |
2,699 |
3,342 |
| Declines |
1,927 |
1,863 |
1,269 |
| Unchanged |
231 |
242 |
227 |
| New
highs |
126 |
122 |
85 |
| New
lows |
40 |
42 |
29 |
| Closing
Arms (TRIN)† |
0.65 |
0.96 |
0.41 |
| Block
trades |
50,253 |
49,844 |
55,593 |
| Adv.
volume |
4,147,382,435 |
3,394,122,958 |
5,127,830,044 |
| Decl.
volume |
2,023,032,921 |
2,253,028,273 |
803,910,467 |
| Total
volume |
6,243,808,988 |
5,732,893,505 |
5,980,112,286 |
|
Table 2
Table 2 QUICKSILVER on ETFS - 1/27/2023 ---
     Bullish = 11 (+2)     COMPQX, SPY, QQQ,  MDY, IWM, FAS, RETL,  SOXL (.415), TECL
                           GLD,  YINN (highest 1.351)
     Bearish = 0
ETF       CLOSE   CHANGE    PIVOT-PT    5-dma AROC    CL-PWR  CANDLE  IP21   ITRS   POWER INDEX
================================================================================================
DIA       339.61   .25       336.17        88.2%      -------  BLUE   .216    0         ----
---------------------------------------------------------------------------------------------
COMPQX    11621.71   109.3   11364.41      212.3%     -------  BLUE   .335    .027     .362
---------------------------------------------------------------------------------------------
SPY       405.68   .93       400.63        122.4%     -------  BLUE   .235    .015     .25
---------------------------------------------------------------------------------------------
QQQ       296.26   2.92      288.96        235.6%     Bullish  BLUE   .308    .026     .334
---------------------------------------------------------------------------------------------
MDY       477.65   1.82      472.2         121.5%     -------  BLUE   .231    .033     .264
---------------------------------------------------------------------------------------------
IWM       189.58   1.02      187.33        121.4%     -------  BLUE   .316    .014     .33
---------------------------------------------------------------------------------------------
FAS       86.26   0          82.95         361.5%     Bullish  BLUE   .285    .041     .326
---------------------------------------------------------------------------------------------
RETL      9.97   .46         9.32          777.7%     -------  BLUE   .285    .135     .42
---------------------------------------------------------------------------------------------
SOXL      14.98  -.26        14.74         763.2%     -------  BLUE   .253    .162     .415
---------------------------------------------------------------------------------------------
TECL      28.72   .33        27.35         572.7%     -------  BLUE   .246    .038     .284
---------------------------------------------------------------------------------------------
IBB       137.23   .07       136.79        64.4%      -------  BLUE   .216    .007     .223
---------------------------------------------------------------------------------------------
GLD       179.22  -.25       179.63       -1.9%       Bullish  RED    .39     .075     .465
---------------------------------------------------------------------------------------------
DBO       15.12  -.29        15.6         -139.1%     Bearish  RED   -.057   -.096    -.153
---------------------------------------------------------------------------------------------
OIH       325.94  -3.55      318.58        84.3%      Bullish  RED    .144    .031     .175
---------------------------------------------------------------------------------------------
CPER     25.62  -.34         25.79        -59.9%      Bullish  RED    .092    .095     .187
---------------------------------------------------------------------------------------------
TAN     80.15   .67          81.61         42.5%      -------  BLUE   .187    0        .187
---------------------------------------------------------------------------------------------
UUP       27.47   .04        27.48         5.5%       Bearish  ----  -.149   -.057    -.206
---------------------------------------------------------------------------------------------
CORN      26.54  -.04        26.15         9.5%       Bullish  BLUE   .178    .001     .179
---------------------------------------------------------------------------------------------
WEAT      7.59  -.02         7.3           40.2%      Bullish  ----   .084   -.113    -.029
---------------------------------------------------------------------------------------------
YINN      72.65  -.35        70.04         332.4%     Bullish  RED    .272    1.079   1.351
|
 TABLE 3  RANKING OF KEY DIRECTORIES BASED PCT.OF STOCKS ABOVE 65-DMA
              1/27/23
 BULLISH = 45
 BEARISH = 2
---------------------------------------------------------------------------------------
Directory     Current       day-1         day-2         day-3         day-4         day-5
----------------------------------------------------------------------------------------
COPPER         1             1             1             1             1             1
INFRA          .939          .969          .939          .939          .969          .939
GOLD           .934          .913          .913          .934          .934          .934
BONDFUND       .908          .908          .908          .908          .919          .896
REIT           .907          .815          .815          .792          .738          .723
AUTO           .905          .754          .754          .754          .792          .698
ETFS           .89           .927          .945          .927          .927          .854
HOMEBLDG       .888          .833          .944          .944          .888          .888
               +++++
JETS           .846          .846          .846          .846          .846          .846
GAMING         .842          .842          .789          .947          .842          .736
SOFTWARE       .839          .875          .75           .785          .785          .714
EDU            .833          1             1             1             1             1
SEMI           .829          .861          .84           .84           .882          .819
               +++++
NIFTY          .818          .795          .772          .772          .772          .704
INSURANC       .8            .88           .84           .84           .8            .76
CHINA          .795          .795          .795          .795          .84           .84
HIGHPRIC       .793          .801          .75           .767          .806          .762
INDMATER       .791          .819          .833          .833          .819          .791
NASD-100       .79           .78           .73           .75           .75           .63
               =====
INDEXES        .789          .778          .789          .81           .821          .81
GUNS           .785          .785          .785          .642          .642          .714
RUS-1000       .779          .772          .746          .749          .759          .704
               ======
ELECTRON       .774          .819          .827          .804          .819          .789
FIDSTKS        .757          .751          .739          .727          .775          .674
HACKERS        .75           .687          .625          .562          .562          .5
SP500          .747          .737          .723          .727          .745          .676
              =======
GREEN          .722          .777          .833          .777          .777          .777
BIGBANKS       .714          .714          .571          .571          .571          .428
COMPUTER       .7            .8            .7            .7            .8            .55
CHEM           .697          .697          .744          .744          .72           .697
SOLAR          .687          .687          .687          .75           .812          .687
UTILITY        .684          .736          .71           .763          .71           .71
TRANSP         .684          .631          .684          .736          .789          .736
RETAIL         .68           .659          .659          .617          .638          .595
FOOD           .673          .734          .653          .632          .612          .653
COMODITY       .666          .717          .666          .692          .666          .666
OILGAS         .666          .676          .638          .59           .619          .6
FINANCE        .662          .687          .65           .675          .712          .612
BIOTECH        .636          .619          .636          .647          .65           .602
SP-100         .622          .577          .588          .6            .622          .544
LOWPRICE       .616          .604          .595          .604          .618          .593
MILITARY       .615          .615          .576          .576          .461          .423
HOSPITAL       .571          .571          .571          .571          .642          .642
DOWJONES       .566          .566          .633          .633          .633          .533
               =====
DJI-13         .538          .461          .538          .538          .538          .384
==============================================================================================
BEVERAGE       .5            .571          .642          .571          .571          .428
COAL           .5            .5            .5            .666          .666          .666
==============================================================================================
REGBANKS       .32           .28           .28           .36           .36           .36
MARIJUAN       .1            .1            .2            .3            .3            .2
|
=============================================================================
Friday
- 5:10 AM - Futures: DJI -22 NASDAQ -66 Data Used: 1/25/2023
| |
1/26/2023
NYSE Advances
2116 vs 1655
NYSE Declines 961 vs 1400
New Highs = 239
New Lows = 53 |
|
|
| |
The Bullish Seasonality, multiple Peerless Buy signals and Rising Closing
Powers for the NASDAQ, QQQ and SPY should allow these Indexes
and ETFs to hold up well as we await action mid next week by the FED
on interest rates.
Next week the FED's FOMC meets and decides if its time to ease off the
interest rate accelerator. We can expect their decision to have a big impact on stock
prices. We've seen lots of Professional buying, much of it based on the expectation
that there will be a pause in the rise in rates. But this is by no means certain.
Oil prices are on the rise again. Below we see that the 5-day ma of our Tiger
Bond funds has turned down, just as it has twice previously done before a
bond sell-off. The Regional Banks remain very weak, out of fear that rates
will again be raised. The Short-term Rates, shown below, are still above their
uptrend-line. So, what the FED will do is by no means certain.
Meanwhile, the big indexes apart from the DJI-30 keep advancing. The DJI-30
s being held back by weakness in UNH, its highest priced component. See in the Power
Ranking table below how UNH is ranked last as this time. Our highest AI/200
("Tahiti") stock CAT is rated #1. And looking for the highest IP21 DJI-30 stock
now,
we see DIS, which the bulls hope will be doing much better with their old CEO,
Michael Eisner, back in charge.
The upward momentum in the market we see now is NOT a bullish stampede. But we
can't miss how the NASDAQ, SPY and QQQ are steadily eating up the supply
of stock overhead, even though volume is not heavy. Considering, how much
stronger their Closing Powers are than their Opening Powers, we have to be
bullish, especially with the NYSE A/D Line so strong.
Avoid shorts. Hold long CAT and the leaders among our Bullish MAXCPs.
We generally want to be long those stocks with the highest ITRS (relative
strength), IP21 (current Accumulation) that have rising Closing Powers, too.
NVDS in the SP-500, QQQ and SOXL, stands out in this respect. |
|
| |
Charts - 1/26/2023
2022 PEERLESS DJI, Signals, Indicators Daily DJI Volume
10-DayUp/Down Vol Stoch-20 CCI RSI Pct of All Stocks above 65-dma
Inverted Traders Index
DJI-IPA DJI-OBV Short-Term Rates
NASDAQ S&P OEX NYSE DJ-15 DJ-20 DJI-30 Bond Funds
DIA QQQ SPY IWM new - COIN (Bit Coin ETF)
Gold Stocks
TNA Short-Term Rates Ten Year Rates PST (Short Treasuries)
DOLLAR-UUP
ALLSTOCKs
Russell-1000
Insurance-Stocks
Recent 2006 vers-Peerless signals
http://www.tigersoftware.com/OLDPEER/UPD90126.bmp
MDY - http://www.tigersoftware.com/CHARTX/MDY.GIF
USO-CrudeOil DBO FAS GLD HD IBB JETS JNUG KOL NAIL NUGT NRGU OIH
PALL RSX RETL SDS AGQ SLV SOXL TAN TECL TLT TMF TNA UGA USO
China: YINN
CHAU
Commodities: CANE
CORN DBC JJC, NIB CORN, CUT (paper)
MOO, NRGU
SOYB WEAT UUP (Dollar) LIT
(Lithium) PALL
(Palladium)
Stocks AA AAPL ADBE ALXN AMAT AMGN AMD AMZN AXP BA BABA
BAC BIDU BLDP CAT CHKP CNX CPB CRM CVX CMG DE DIS ENPH FB FSLR
FTNT GILD GME GOOG GS HD IBM INTU JPM KO KR LRCX MRK MRNA
MOS MSFT NEM NFLX NKE NOC NUE NVDA PANW PG PYPL REGN REV
SO QCOM QDEL TSLA TXN XOM V VRTX WFC WMT XLE ZM ZOM
Leveraged Short ETFs:
FAZ - financials, TZA and SRTY- small caps, MZZ - mid caps, TECS -Techs,
SOXS -
semi-conductors LABD
- Biotechs
Bullish MAXCPs http://www.tigersoftware.com/UPPING/1-26-2023/BULLISH.htm
Bearish MINCPs http://www.tigersoftware.com/Downing/1-26-2023/BEARISH.htm |
|
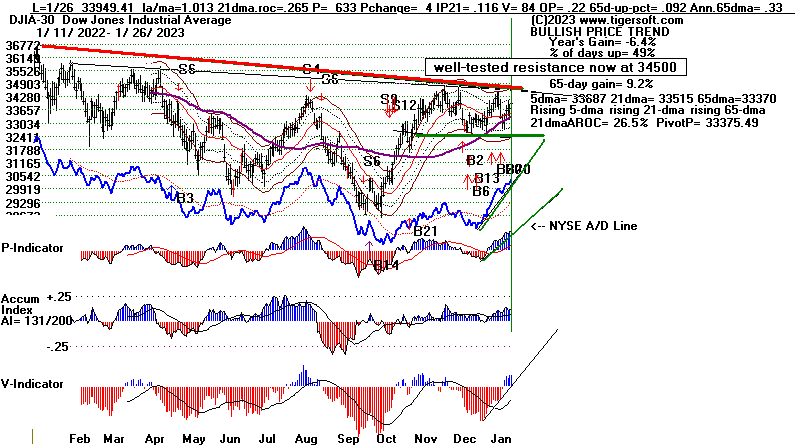 |
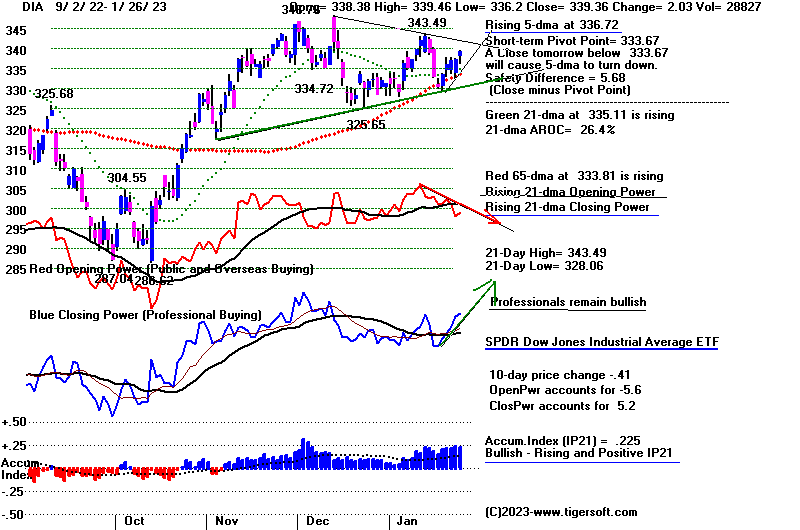 |
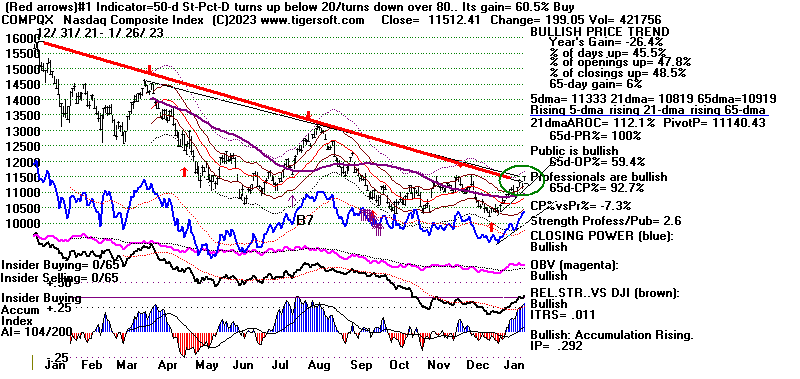 |
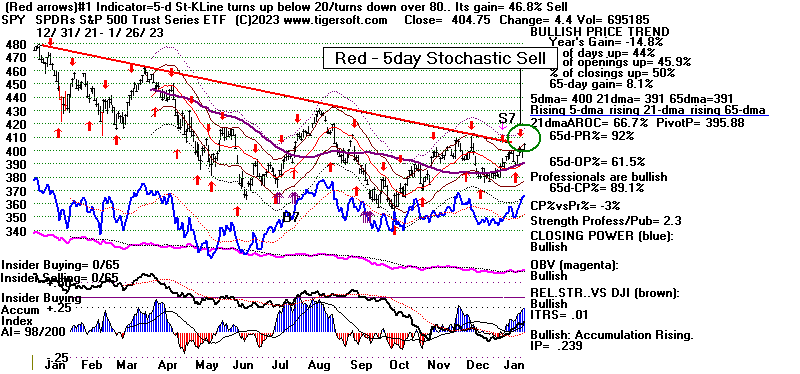 |
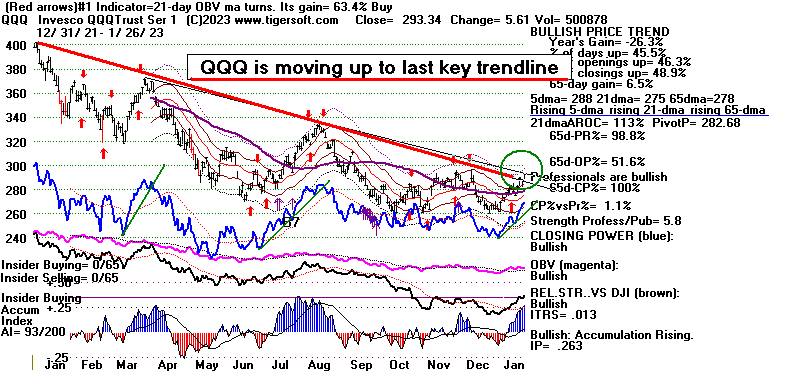 |
 |
 |
 |
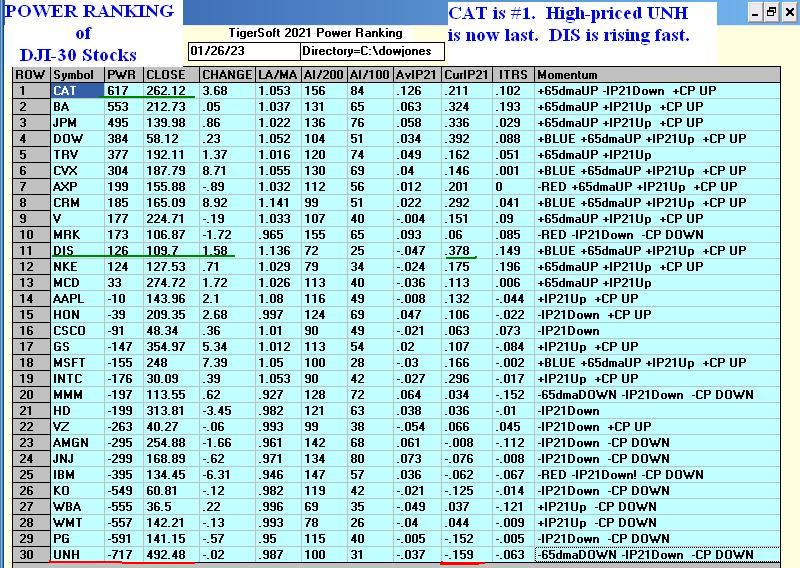 |
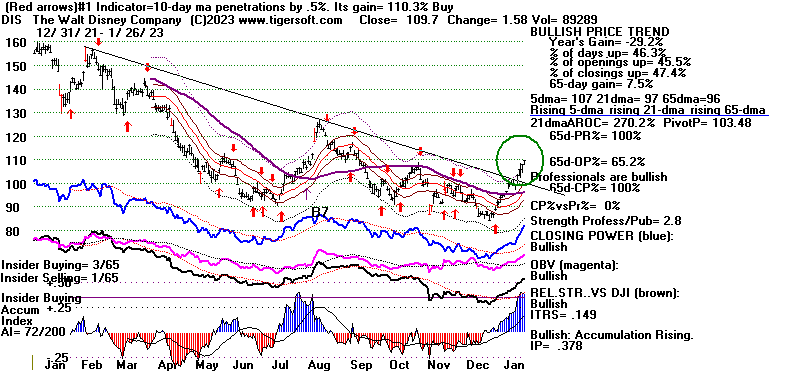 |
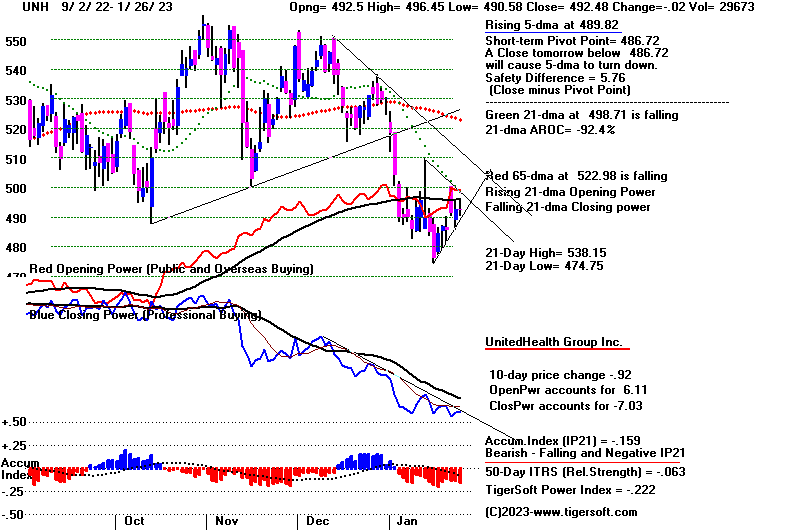 |
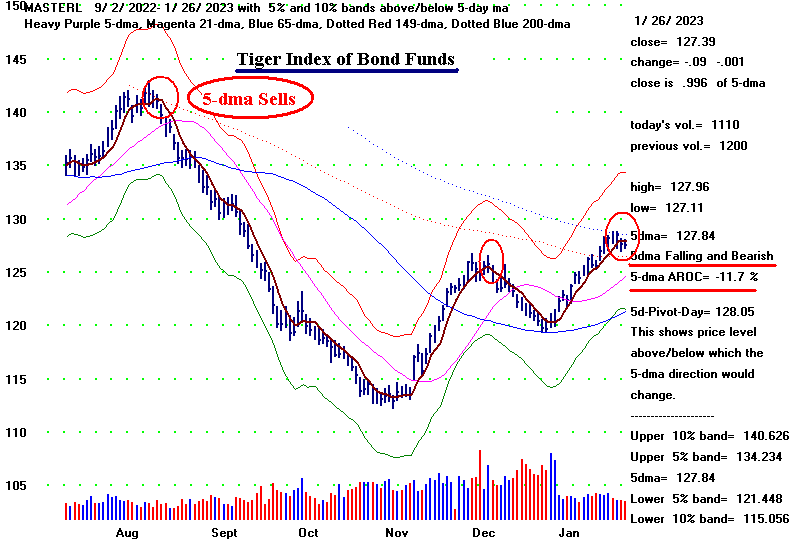 |
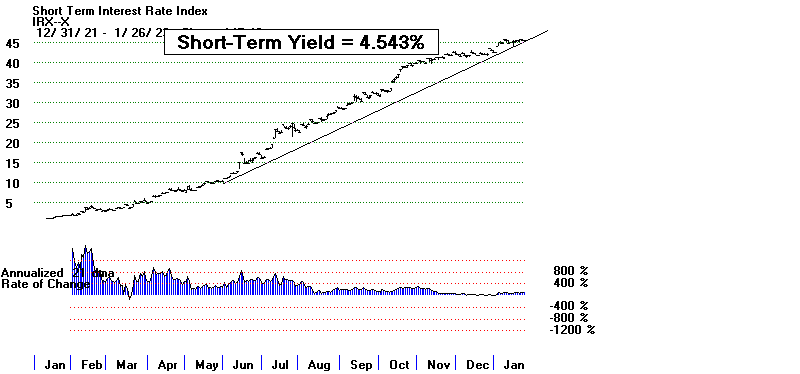 |
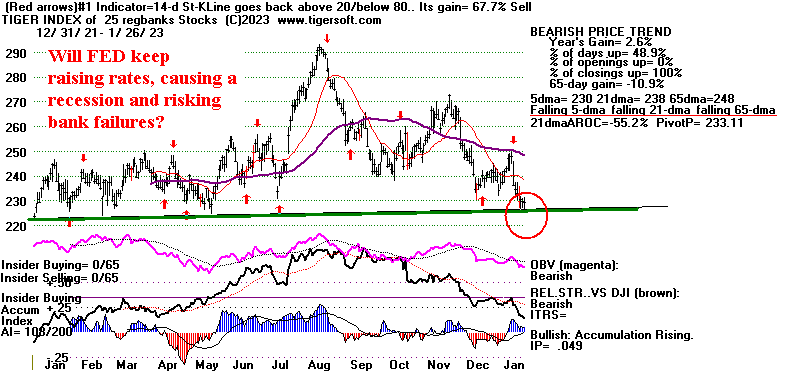 |
Table 1 - Breadth and Volume Statistics
| NYSE |
Latest
Close |
Previous
Close |
Week
Ago |
| Issues
traded |
3,201 |
3,219 |
3,187 |
| Advances |
2,116 |
1,655 |
1,245 |
| Declines |
961 |
1,400 |
1,822 |
| Unchanged |
124 |
164 |
120 |
| New
highs |
117 |
70 |
40 |
| New
lows |
11 |
13 |
18 |
| Adv.
volume* |
503,185,532 |
462,387,630 |
261,170,114 |
| Decl.
volume* |
258,274,545 |
287,560,014 |
573,585,165 |
| Total
volume* |
773,304,402 |
765,648,597 |
845,694,626 |
| Closing
Arms (TRIN)† |
1.16 |
0.74 |
1.55 |
| Block
trades* |
4,045 |
4,083 |
4,338 |
| Adv.
volume |
2,453,695,268 |
2,224,511,315 |
1,193,612,243 |
| Decl.
volume |
1,291,411,386 |
1,397,957,341 |
2,709,574,124 |
| Total
volume |
3,809,598,171 |
3,724,028,980 |
3,991,509,166 |
| NASDAQ |
Latest
Close |
Previous
Close |
Week
Ago |
| Issues
traded |
4,804 |
4,824 |
4,827 |
| Advances |
2,699 |
2,412 |
1,698 |
| Declines |
1,863 |
2,129 |
2,883 |
| Unchanged |
242 |
283 |
246 |
| New
highs |
122 |
96 |
71 |
| New
lows |
42 |
43 |
34 |
| Closing
Arms (TRIN)† |
0.96 |
1.06 |
1.50 |
| Block
trades |
49,844 |
47,580 |
31,228 |
| Adv.
volume |
3,394,122,958 |
2,782,306,677 |
1,295,889,963 |
| Decl.
volume |
2,253,028,273 |
2,604,937,881 |
3,309,826,841 |
| Total
volume |
5,732,893,505 |
5,485,573,499 |
4,660,802,928 |
|
Table 2 QUICKSILVER on ETFS - 1/26/2023 ---
     Bullish = 9 ()     COMPQX, SPY, QQQ,  IWM, FAS, RETL,  SOXL (.376)
                          GLD,  YINN (highest 1.421)
     Bearish = 0
ETF       CLOSE   CHANGE    PIVOT-PT    5-dma AROC    CL-PWR  CANDLE  IP21   ITRS   POWER INDEX
================================================================================================
DIA       339.36   2.04      333.67        130.3%     -------  BLUE   .225    0       ------
---------------------------------------------------------------------------------------------
COMPQX    11512.41   199.05  11140.43      294.7%     -------  BLUE   .292    .012     .304
---------------------------------------------------------------------------------------------
SPY       404.75   4.4       395.88        202.8%     -------  BLUE   .24    .011      .251
---------------------------------------------------------------------------------------------
QQQ       293.34   5.61      282.68        319.6%     -------  BLUE   .264    .014     .278
---------------------------------------------------------------------------------------------
MDY       475.83   3.98      466.2         182.8%     -------  BLUE   .223    .025     .248
---------------------------------------------------------------------------------------------
IWM       188.56   1.11      185.04        175.5%     -------  RED    .29    .004      .294
---------------------------------------------------------------------------------------------
FAS       86.26   1.26       80.22         589.4%     Bullish  BLUE   .313    0        .313
---------------------------------------------------------------------------------------------
RETL      9.51   .25         8.55          878.7%     -------  RED    .251    .049     .3
---------------------------------------------------------------------------------------------
SOXL      15.24   .71        12.79         1270.7%    -------  BLUE   .228    .148     .376
---------------------------------------------------------------------------------------------
TECL      28.39   1.3        25.61         884.8%     -------  BLUE   .235    .006     .241
---------------------------------------------------------------------------------------------
IBB       137.16   .37       135.47        114.4%     -------  RED    .172    .017     .189
---------------------------------------------------------------------------------------------
GLD       179.47  -1.64      179.29       -11.7%      Bullish  RED    .348    .086     .434
---------------------------------------------------------------------------------------------
DBO       15.41   .05        15.55         3.2%       Bearish  RED   -.037   -.11     -.147
---------------------------------------------------------------------------------------------
OIH       329.49   4.64      320.51        212.8%     Bullish  BLUE   .183    .03      .213
---------------------------------------------------------------------------------------------
CPER     25.96   .08         25.93         36.8%      Bullish  BLUE   0       .089     .089
---------------------------------------------------------------------------------------------
TAN     79.48   .28          79.47         95.3%      -------  RED    .107   -.005     .102
---------------------------------------------------------------------------------------------
UUP       27.43   .07        27.44        -9.1%       Bearish  ----  -.128   -.047    -.175
---------------------------------------------------------------------------------------------
CORN      26.58   .16        26.49         17%        Bullish  ----   .212    .003     .215
---------------------------------------------------------------------------------------------
WEAT      7.61   .15         7.53          100.9%     Bullish  ----   .078   -.103    -.025
---------------------------------------------------------------------------------------------
YINN      73   2.66          67.98         702.5%     Bullish  BLUE   .304    1.127     1.431
|
 Table 3      RANKING OF KEY DIRECTORIES BASED PCT.OF STOCKS ABOVE 65-DMA
              1/26/23
 Bullish = 46
 Bearish = 2
---------------------------------------------------------------------------------------
Directory     Current       day-1         day-2         day-3         day-4         day-5
----------------------------------------------------------------------------------------
COPPER         1             1             1             1             1             1
EDU            1             1             1             1             1             1
INFRA          .969          .939          .939          .969          .939          .787
ETFS           .927          .945          .927          .927          .872          .872
GOLD           .913          .913          .934          .934          .934          .934
BONDFUND       .908          .908          .908          .919          .908          .896
INSURANC       .88           .84           .84           .8            .76           .68
SOFTWARE       .875          .767          .785          .785          .714          .607
SEMI           .861          .84           .84           .882          .797          .829
               =====
JETS           .846          .846          .846          .846          .846          .846
GAMING         .842          .789          .894          .894          .736          .631
HOMEBLDG       .833          .944          .944          .888          .888          .833
ELECTRON       .819          .827          .804          .819          .774          .789
INDMATER       .819          .833          .833          .819          .791          .722
REIT           .815          .807          .8            .746          .723          .653
HIGHPRIC       .801          .75           .767          .806          .771          .616
COMPUTER       .8            .7            .7            .8            .55           .55
CHINA          .795          .795          .795          .84           .818          .84
NIFTY          .795          .772          .772          .772          .704          .568
GUNS           .785          .785          .642          .642          .714          .571
NASD-100       .78           .73           .75           .75           .66           .58
               =====
INDEXES        .778          .789          .81           .821          .81           .724
GREEN          .777          .833          .777          .777          .777          .666
RUS-1000       .772          .746          .749          .759          .708          .593
AUTO           .754          .773          .754          .792          .698          .49
FIDSTKS        .751          .739          .727          .775          .692          .532
SP500          .737          .723          .729          .741          .688          .575
               =====
UTILITY        .736          .71           .763          .71           .71           .657
FOOD           .734          .653          .612          .612          .653          .632
COMODITY       .717          .666          .666          .666          .666          .666
BIGBANKS       .714          .571          .571          .571          .428          .428
CHEM           .697          .744          .744          .72           .697          .604
FINANCE        .687          .65           .675          .7            .612          .525
HACKERS        .687          .625          .562          .562          .5            .437
SOLAR          .687          .687          .75           .812          .625          .562
OILGAS         .676          .638          .59           .619          .59           .542
RETAIL         .659          .659          .617          .638          .638          .574
TRANSP         .631          .684          .736          .789          .736          .631
BIOTECH        .619          .633          .65           .65           .607          .579
MILITARY       .615          .576          .576          .461          .423          .423
LOWPRICE       .604          .598          .607          .618          .593          .573
SP-100         .577          .588          .6            .622          .566          .455
BEVERAGE       .571          .642          .571          .571          .428          .428
HOSPITAL       .571          .571          .571          .642          .642          .642
DOWJONES       .566          .633          .633          .633          .533          .4
               ======
===============================================================================================
COAL           .5            .5            .666          .666          .666          .333
===============================================================================================
DJI-13         .461          .538          .538          .538          .384          .23
REGBANKS       .28           .28           .36           .36           .4            .32
MARIJUAN       .1            .2            .3            .3            .2            .1
|
=================================================================================
Thursday
- 5:45 AM - Futures: DJI +48 NASDAQ +98
Data Used: 1/25/2023
| |
1-25-2023
NYSE Advances 1655 vs 1478
NYSE Declines 1400 vs 1595
New Highs 70 + 96 = 166
New Lows 13 + 43 = 56 |
|
| |
Professionals
were again ready to swoop in after an hour of weakness
and drive up prices yesterday.
We can reason that they would only do this if they
were confident that the FED is
going to pause in its rate hikes when the
FOMC next meets, at the end of this
month. Their bullishness, the Peerless
buy signals and the excellent
seasonal period we are in all tell us to avoid the short
side and buy the leaders in the
market.
SOXL, QQQ, SPY and the NASDAQ are
all at well -tested resistance
of their price-downtrendlines.
We have noted that volume seems too low to
quickly eat up the overhead supply
of stock. And we have remarked on
how the DJI and DIA have become
index and ETF laggards compared
to many techs and also IWM.
That has encouraged us to be buyers of the
Bullish MAXCPs that also show very
high Accumulation.
Among the tech leaders, NVDA stands
out. It has broken through the
horizontal resistance formed by its
pervious peaks and has even formed
a bullish inverted head/shoulders
pattern. Its volume is rising and its relative
strength versus the DJI is very
bullish.
If the FED is going to pause in its
rate hikes that would explain the weakness
in the Dollar, the rising bond
market and the strength in Gold. As long as
the Closing Powers are rising for
the bullish MAXCPs and NVDA, I think
we have to be buyers of them,
because when the FED does publcly relent and
announces a pause, these stocks and
ETFs should surge. One more thing,
worth mentioning is the continuing
weakness in regional banks. See Table 3.
This occurs because they are
already suffering from the rapid rise in interest rates.
Their plight is, no doubt, being
communicated with the decision-makers on the
FED and in Congress. . |
|
| |
Charts - 1/25/2023
2022 PEERLESS DJI, Signals, Indicators Daily DJI Volume
10-DayUp/Down Vol Stoch-20 CCI RSI Pct of All Stocks above 65-dma
Inverted Traders Index
DJI-IPA DJI-OBV Short-Term Rates
NASDAQ S&P OEX NYSE DJ-15 DJ-20 DJI-30 Bond Funds
DIA QQQ SPY IWM new - COIN (Bit Coin ETF)
Gold Stocks
TNA Short-Term Rates Ten Year Rates PST (Short Treasuries)
DOLLAR-UUP
ALLSTOCKs
Russell-1000
Insurance-Stocks
Recent 2006 vers-Peerless signals
http://www.tigersoftware.com/OLDPEER/UPD90125.bmp
MDY - http://www.tigersoftware.com/CHARTX/MDY.GIF
USO-CrudeOil DBO FAS GLD HD IBB JETS JNUG KOL NAIL NUGT NRGU OIH
PALL RSX RETL SDS AGQ SLV SOXL TAN TECL TLT TMF TNA UGA USO
China: YINN
CHAU
Commodities: CANE
CORN DBC JJC, NIB CORN, CUT (paper)
MOO, NRGU
SOYB WEAT UUP (Dollar) LIT
(Lithium) PALL
(Palladium)
Stocks AA AAPL ADBE ALXN AMAT AMGN AMD AMZN AXP BA BABA
BAC BIDU BLDP CAT CHKP CNX CPB CRM CVX CMG DE DIS ENPH FB FSLR
FTNT GILD GME GOOG GS HD IBM INTU JPM KO KR LRCX MRK MRNA
MOS MSFT NEM NFLX NKE NOC NUE NVDA PANW PG PYPL REGN REV
SO QCOM QDEL TSLA TXN XOM V VRTX WFC WMT XLE ZM ZOM
Leveraged Short ETFs:
FAZ - financials, TZA and SRTY- small caps, MZZ - mid caps, TECS -Techs,
SOXS -
semi-conductors LABD
- Biotechs
Bullish MAXCPs http://www.tigersoftware.com/UPPING/1-25-2023/BULLISH.htm
Bearish MINCPs http://www.tigersoftware.com/Downing/1-25-2023/BEARISH.htm
|
|
Table 1 - BREADTH and Volume Statistics from WSJ
NYSE |
Latest Close |
Previous Close |
Week Ago |
Issues traded |
3,219 |
3,224 |
3,229 |
Advances |
1,655 |
1,478 |
1,077 |
Declines |
1,400 |
1,595 |
2,041 |
Unchanged |
164 |
151 |
111 |
New highs |
70 |
98 |
101 |
New lows |
13 |
25 |
8 |
Adv. volume* |
462,387,630 |
247,096,260 |
128,638,731 |
Decl. volume* |
287,560,014 |
340,915,827 |
747,024,729 |
Total volume* |
765,648,597 |
599,171,838 |
887,577,972 |
Closing Arms
(TRIN)† |
0.74 |
1.33 |
2.71 |
Block trades* |
4,083 |
3,059 |
4,355 |
Adv. volume |
2,224,511,315 |
1,337,622,659 |
687,292,155 |
Decl. volume |
1,397,957,341 |
1,915,571,098 |
3,529,549,793 |
Total volume |
3,724,028,980 |
3,320,430,225 |
4,298,711,416 |
NASDAQ |
Latest Close |
Previous Close |
Week Ago |
Issues traded |
4,824 |
4,832 |
4,847 |
Advances |
2,412 |
2,095 |
1,558 |
Declines |
2,129 |
2,461 |
3,090 |
Unchanged |
283 |
276 |
199 |
New highs |
96 |
112 |
115 |
New lows |
43 |
35 |
27 |
Closing Arms
(TRIN)† |
1.06 |
0.77 |
1.46 |
Block trades |
47,580 |
55,982 |
34,494 |
Adv. volume |
2,782,306,677 |
2,943,092,909 |
1,341,823,971 |
Decl. volume |
2,604,937,881 |
2,663,367,815 |
3,884,130,966 |
Total volume |
5,485,573,499 |
5,670,864,706 |
5,288,639,185 |
|
Table 2 QUICKSILVER on ETFS - 1/25/2023 ---
     Bullish = 9 (-1)     COMPQX, QQQ, MDY, IWM, FAS, RETL,  SOXL (.425)
                        GLD,  YINN (highest 1.6001)
     Bearish = 0
ETF       CLOSE   CHANGE    PIVOT-PT    5-dma AROC    CL-PWR  CANDLE  IP21   ITRS   POWER INDEX
================================================================================================
DIA       337.32   .22       330.63        65.1%      -------  BLUE   .232    ----     ------
---------------------------------------------------------------------------------------------
COMPQX    11313.36  -20.91   10852.27      160.1%     -------  BLUE   .272    .018     .29
---------------------------------------------------------------------------------------------
SPY       400.35   .15       388.64        112%       -------  BLUE   .233    .014     .247
---------------------------------------------------------------------------------------------
QQQ       287.73  -.64       275.15        174.3%     -------  BLUE   .246    .017     .263
---------------------------------------------------------------------------------------------
MDY       471.85   1.19      458.72        89.8%      -------  BLUE   .227    .027     .254
---------------------------------------------------------------------------------------------
IWM       187.45   .52       182.04        98.6%      -------  BLUE   .309    .011     .32
---------------------------------------------------------------------------------------------
FAS       85   1.76          76.64         342.8%     Bullish  BLUE   .316    .013     .329
---------------------------------------------------------------------------------------------
RETL      9.26   .25         7.96          473.7%     -------  BLUE   .307    .098     .405
---------------------------------------------------------------------------------------------
SOXL      14.53   .09        11.77         642.3%     -------  BLUE   .222    .203     .425
---------------------------------------------------------------------------------------------
TECL      27.09  -.22        23.75         484%       -------  BLUE   .217    .01     .227
---------------------------------------------------------------------------------------------
IBB       136.79   .01       134.05        56.4%      -------  BLUE   .137    .024     .161
---------------------------------------------------------------------------------------------
GLD       181.11   .83       179.89        112.4%     Bullish  BLUE   .353    .108     .461
---------------------------------------------------------------------------------------------
DBO       15.36  -.01        15.4          64.9%      Bearish  ----   .01   -.08      -.07
---------------------------------------------------------------------------------------------
OIH       324.85   8.08      315.9         129.2%     Bullish  BLUE   .161    .054     .215
---------------------------------------------------------------------------------------------
CPER     25.88   .04         25.77         60.1%      Bullish  BLUE   0       .133     .133
---------------------------------------------------------------------------------------------
TAN     79.2  -1.48          77.96        -161.3%     -------  BLUE   .095   -.028     .067
---------------------------------------------------------------------------------------------
UUP       27.36  -.09        27.48        -34.6%      Bearish  RED   -.122   -.059    -.181
---------------------------------------------------------------------------------------------
CORN      26.42  -.08        26.49        -58.6%      Bullish  ----   .168    .008     .176
---------------------------------------------------------------------------------------------
WEAT      7.46   .03         7.46         -33.6%      Bullish  ----   .081   -.105    -.024
---------------------------------------------------------------------------------------------
YINN      70.34   .46        63.4          801.3%     Bullish  BLUE   .27    1.331     1.601
|
Table 3       RANKING OF KEY DIRECTORIES BASED PCT.OF STOCKS ABOVE 65-DMA
              1/25/23
---------------------------------------------------------------------------------------
Directory     Current       day-1         day-2         day-3         day-4         day-5
----------------------------------------------------------------------------------------
COPPER         1             1             1             1             1             1
EDU            1             1             1             1             1             .833
ETFS           .945          .927          .927          .872          .89           .872
HOMEBLDG       .944          .944          .888          .888          .833          .888
INFRA          .939          .939          .969          .939          .787          1
GOLD           .913          .934          .934          .934          .934          .913
BONDFUND       .908          .908          .919          .908          .908          .896
JETS           .846          .846          .846          .846          .846          .923
INSURANC       .84           .84           .8            .76           .68           .76
SEMI           .84           .84           .882          .797          .819          .882
               ----
GREEN          .833          .777          .777          .777          .666          .777
INDMATER       .833          .833          .819          .791          .722          .791
ELECTRON       .827          .804          .819          .774          .781          .834
REIT           .807          .792          .753          .73           .638          .7
CHINA          .795          .795          .84           .818          .84           .795
GAMING         .789          .894          .842          .789          .631          .631
INDEXES        .789          .81           .821          .81           .729          .8
GUNS           .785          .642          .642          .714          .571          .714
AUTO           .773          .773          .792          .698          .528          .603
NIFTY          .772          .772          .772          .704          .568          .636
SOFTWARE       .767          .803          .785          .714          .607          .625
HIGHPRIC       .75           .767          .806          .771          .625          .715
RUS-1000       .746          .749          .759          .708          .6            .677
               ------
CHEM           .744          .744          .72           .697          .604          .697
FIDSTKS        .739          .727          .775          .692          .538          .609
NASD-100       .73           .75           .75           .66           .58           .63
               -----
SP500          .723          .729          .743          .684          .586          .653
               -----
UTILITY        .71           .763          .71           .71           .657          .736
COMPUTER       .7            .7            .8            .55           .55           .55
SOLAR          .687          .75           .812          .625          .562          .75
TRANSP         .684          .736          .789          .736          .631          .684
COMODITY       .666          .666          .641          .666          .641          .615
RETAIL         .659          .617          .638          .638          .595          .659
FOOD           .653          .612          .591          .653          .612          .612
FINANCE        .65           .675          .7            .6            .525          .625
BEVERAGE       .642          .571          .571          .428          .428          .428
OILGAS         .638          .59           .619          .59           .542          .495
BIOTECH        .633          .647          .653          .607          .576          .599
DOWJONES       .633          .633          .633          .533          .4            .5
               =====
HACKERS        .625          .562          .562          .5            .437          .5
LOWPRICE       .598          .61           .621          .593          .573          .584
SP-100         .588          .6            .622          .566          .455          .533
MILITARY       .576          .576          .461          .423          .423          .384
BIGBANKS       .571          .571          .571          .428          .428          .428
HOSPITAL       .571          .571          .642          .642          .642          .714
DJI-13         .538          .538          .538          .384          .23           .23
COAL           .5            .666          .666          .666          .333          .333
================================================================================================
REGBANKS       .28           .36           .36           .4            .32           .28
MARIJUAN       .2            .3            .3            .2            .1            .3
|
=================================================================================
Wednesday - 6:10 AM - Futures: DJI -299 NASDAQ -150 Data Used: 1/24/2023
| |
             1-24-2023
DJIA	33733.96	+104.40 +0.31%
S&P 500	4016.95	        -2.86	-0.007%
Nasdaq 	11334.27	-30.14  -0.27%
NYSE  Advances	1478
NYSE  Declines	1695
New highs	98 + 112 = 210
New lows	25 + 35  = 60
|
|
| |
The DJI is trying to reach its declining,
well-tested resistance line (shown in
red below). Its internals are good with the exception of
its daily volume, which
again fell. The sell-off this morning can be blamed on a
lack of aggressive buyers
not just in the DJI, but the NASDAQ, QQQ and SP-500 (SPY) as each
of these
approach their well-tested resistance-lines. Their
internals, Closing Power,
Accumulation Index and relative strength versus the DJI, are all
quite positive.
But there's no question that there's a lot of planned or
scheduled selling as
their well-tested resistance lines are approached. Hence,
the decline today.
Another negative is the FED. Short-term rates rose again
while the Ten Year
bond rates fell. This bearish inversion argues that the
majority of the FOMC
remain intent on raising rates at the end of the month to
make sure that the
economy slows down so that prices and wages fall back much more.
Like
the scorpion stinging the frog mid-stream, when you ask a
"hawk" why they
must cause a recession or worse, they answer because it's what we
do at these
times, it is our nature.
But now there's a new element. Bad NYSE data. A
"glitch" was reported
to have caused crazy lows to be posted today for such stocks as
JN J, KO,
MCD, MMM, MRFK, NKE, UNH, V , VZ and WMT in the DJI-30 and
many others like SO and NOC. It remains to be seen if the
NYSE will
fix the problem today or provide rebates to those who were hurt
by the
prices they got. This is scary stuff. These
stocks are the bed-rock of the
the market, American capitalism and our economy. The last
time this took
place was in 2010. It took more than a month for the market
to regain
confidence after the "glitches" back then. See
chart below.
Since the DJI is now above its 21-day ma but because it is
under-performing
SPY, QQQ and the NASDAQ, let me suggest taking some trading
profits
in DIA on any late recovery tomorrow. But hold the
strongest "bullish MAXCPs"
and CAT, the highest AI/200 DJI stock, in deference to the
Peerless buys
and the contuining bullish seasonality. |
|
| |
Charts - 1/24/2023
2022 PEERLESS DJI, Signals, Indicators Daily DJI Volume
10-DayUp/Down Vol Stoch-20 CCI RSI Pct of All Stocks above 65-dma
Inverted Traders Index
DJI-IPA DJI-OBV Short-Term Rates
NASDAQ S&P OEX NYSE DJ-15 DJ-20 DJI-30 Bond Funds
DIA QQQ SPY IWM new - COIN (Bit Coin ETF)
Gold Stocks
TNA Short-Term Rates Ten Year Rates PST (Short Treasuries)
DOLLAR-UUP
ALLSTOCKs
Russell-1000
Insurance-Stocks
Recent 2006 vers-Peerless signals
http://www.tigersoftware.com/OLDPEER/UPD90124.bmp
MDY - http://www.tigersoftware.com/CHARTX/MDY.GIF
USO-CrudeOil DBO FAS GLD HD IBB JETS JNUG KOL NAIL NUGT NRGU OIH
PALL RSX RETL SDS AGQ SLV SOXL TAN TECL TLT TMF TNA UGA USO
China: YINN
CHAU
Commodities: CANE
CORN DBC JJC, NIB CORN, CUT (paper)
MOO, NRGU
SOYB WEAT UUP (Dollar) LIT
(Lithium)
Stocks AA AAPL ADBE ALXN AMAT AMGN AMD AMZN AXP BA BABA
BAC BIDU BLDP CAT CHKP CNX CPB CRM CVX CMG DE DIS ENPH FB FSLR
FTNT GILD GME GOOG GS HD IBM INTU JPM KO KR LRCX MRK MRNA
MOS MSFT NEM NFLX NKE NOC NUE NVDA PANW PG PYPL REGN REV
SO QCOM QDEL TSLA TXN XOM V VRTX WFC WMT XLE ZM ZOM
Leveraged Short ETFs:
FAZ - financials, TZA and SRTY- small caps, MZZ - mid caps, TECS -Techs,
SOXS -
semi-conductors LABD
- Biotechs
Bullish MAXCPs http://www.tigersoftware.com/UPPING/1-24-2023/BULLISH.htm
Bearish MINCPs http://www.tigersoftware.com/Downing/1-24-2023/BEARISH.htm |
|
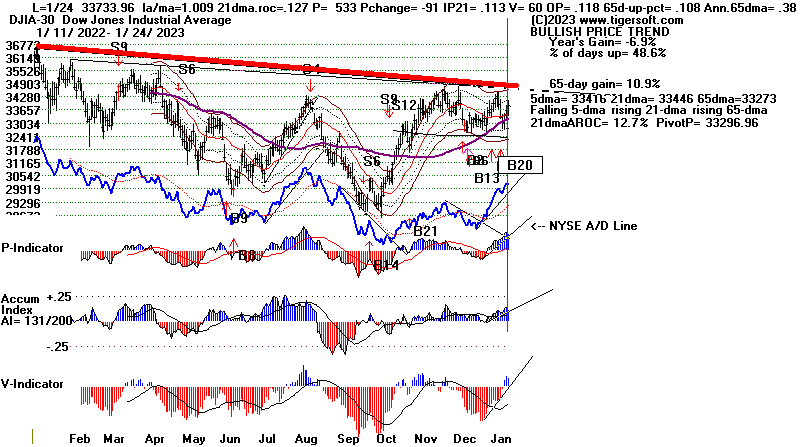
---> "GLITCH"
on NYSE was blamed for sell-off in market in April 2010.
|
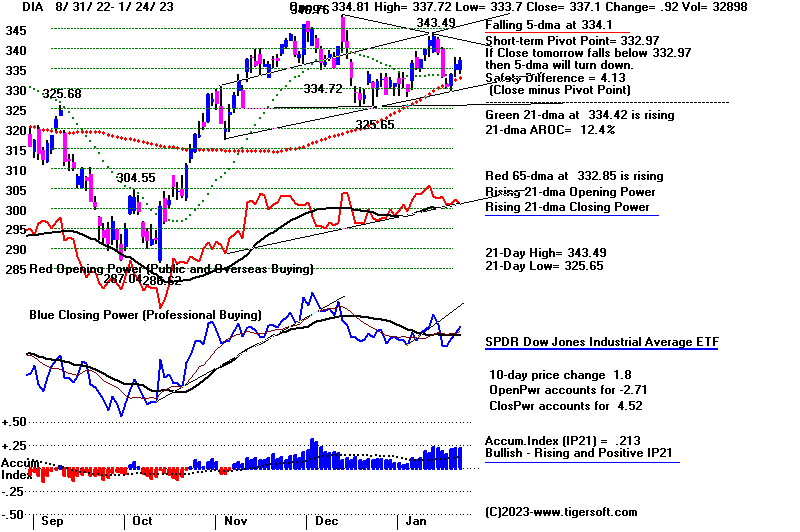 |
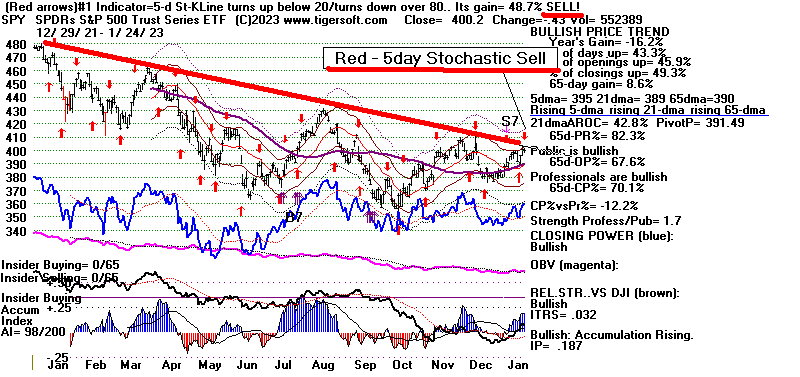 |
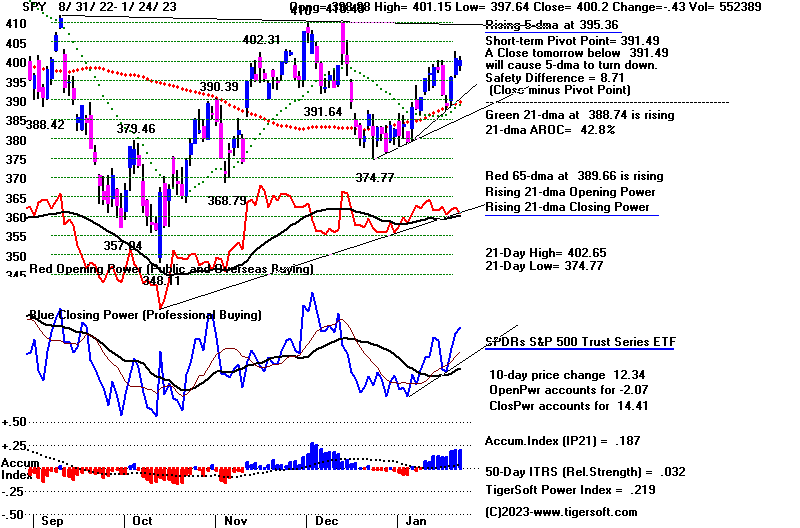 |
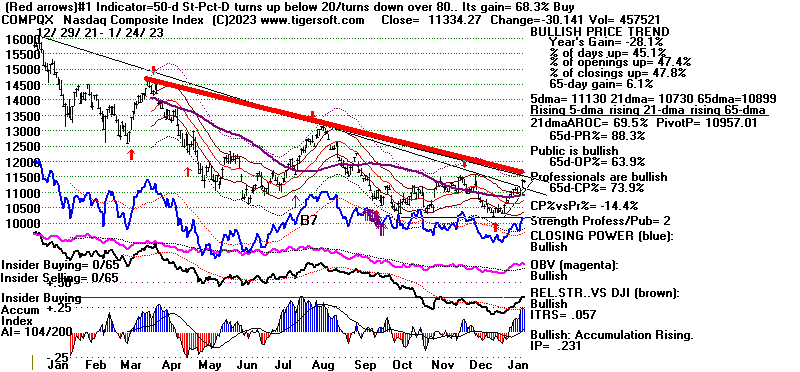 |
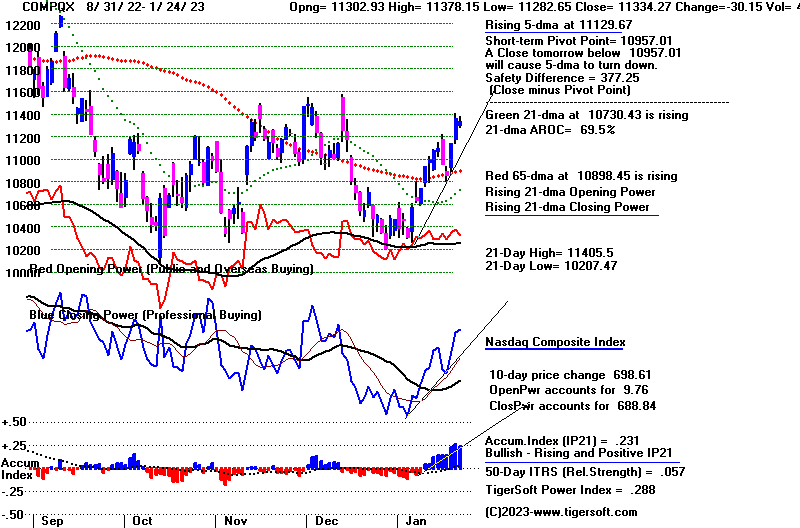 |
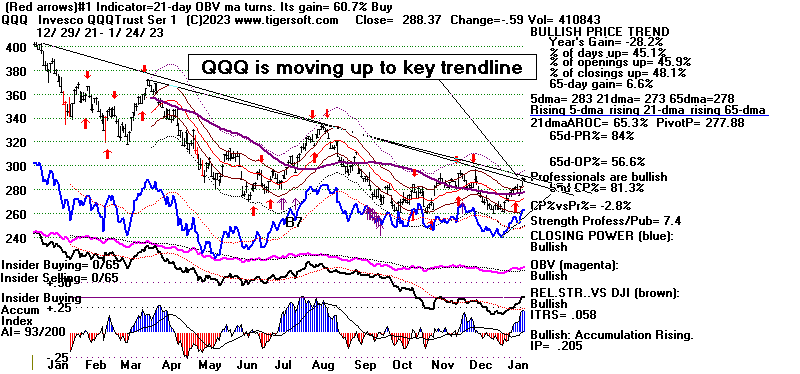 |
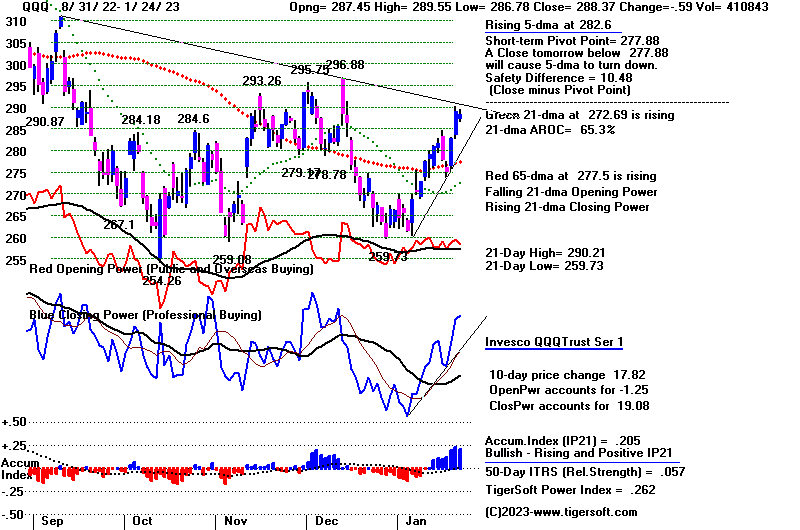 |
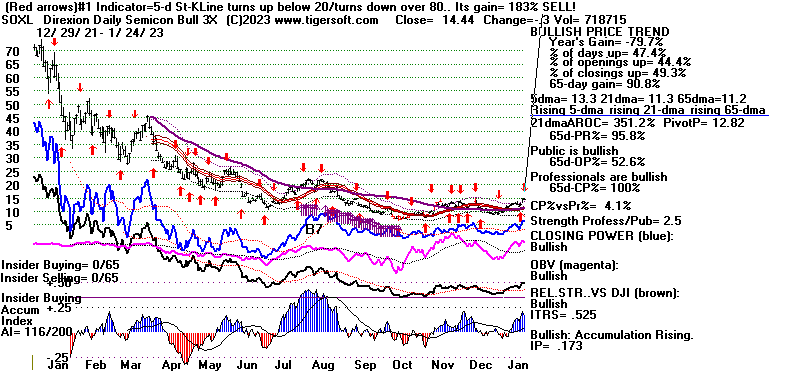 |
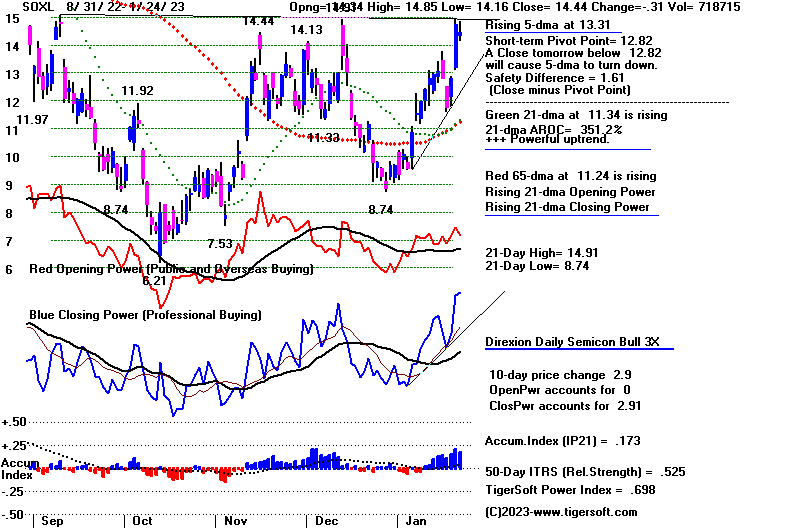 |
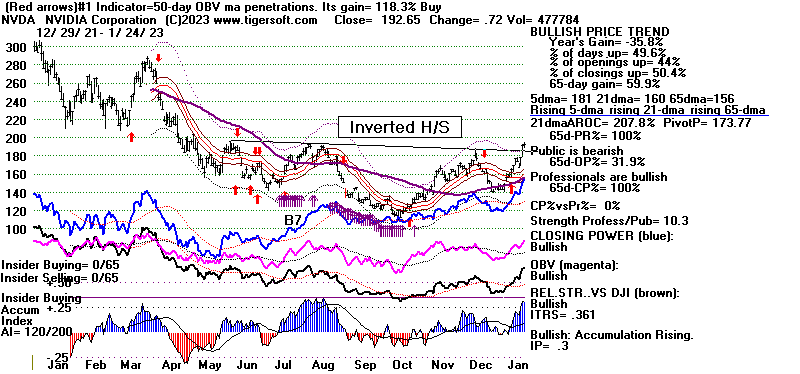 |
BAD data today
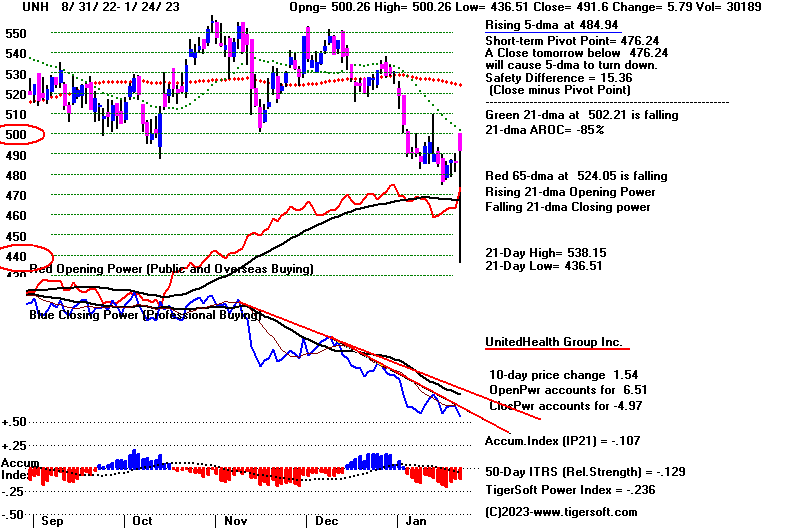 |
 |
Table 1 - Breadth and Volume Indicators 1-24-2023
DJIA	33733.96	+104.40 +0.31%
S&P 500	4016.95	        -2.86	-0.007%
Nasdaq 	11334.27	-30.14  -0.27%
NYSE  Advances	1478
NYSE  Declines	1695
New highs	98 + 112 = 210
New lows	25 + 35  = 60
NYSE	Latest Close	Previous Close	Week Ago
Issues traded	3,224	3,232	3,218
Advances	1,478	2,241	1,690
Declines	1,595	849	1,424
Unchanged	151	142	104
New highs	98	86	126
New lows	25	8	10
Adv. volume*	247,096,260	593,455,869	401,699,725
Decl. volume*	340,915,827	205,998,262	480,832,258
Total volume*	599,171,838	807,901,585	891,837,674
Closing Arms (TRIN)†	1.33	0.90	1.17
Block trades*	3,059	3,991	4,587
Adv. volume	1,337,622,659	2,910,041,316	2,102,992,140
Decl. volume	1,915,571,098	993,600,885	2,080,439,423
Total volume	3,320,430,225	3,945,212,001	4,235,562,719
NASDAQ	Latest Close	Previous Close	Week Ago
Issues traded	4,832	4,930	4,875
Advances	2,095	2,966	2,406
Declines	2,461	1,716	2,259
Unchanged	276	248	210
New highs	112	115	136
New lows	35	35	23
Closing Arms (TRIN)†	0.77	0.32	0.68
Block trades	55,982	53,209	36,564
Adv. volume	2,943,092,909	5,028,577,057	3,100,669,073
Decl. volume	2,663,367,815	927,059,381	1,976,809,286
Total volume	5,670,864,706	5,997,817,139	5,138,416,783
|
Table 2 QUICKSILVER on ETFS - 1/23/2023 ---
     Bullish = 10    COMPQX, QQQ, MDY, IWM, FAS, RETL,  SOXL (.701)
                    TECL, GLD,  YINN (highest 1.9228)
     Bearish = 0
ETF       CLOSE   CHANGE    PIVOT-PT    5-dma AROC    CL-PWR  CANDLE  IP21   ITRS   POWER INDEX
================================================================================================
DIA       337.1   .93        332.97       -30.8%      -------  BLUE   .213   -----     ------
---------------------------------------------------------------------------------------------
COMPQX    11334.27  -30.14   10957.01      107.9%     -------  BLUE   .232    .059     .291
---------------------------------------------------------------------------------------------
SPY       400.2  -.43        391.49        30.8%      -------  BLUE   .188    .034     .222
---------------------------------------------------------------------------------------------
QQQ       288.37  -.59       277.88        121.4%     -------  BLUE   .206    .059     .265
---------------------------------------------------------------------------------------------
MDY       470.66  -1.54      463.48        10.9%      -------  BLUE   .213    .048     .261
---------------------------------------------------------------------------------------------
IWM       186.93  -.4        183.8         3%         -------  BLUE   .292    .034     .326
---------------------------------------------------------------------------------------------
FAS       83.24   .29        79.48        -64.4%      Bullish  BLUE   .276    .108     .384
---------------------------------------------------------------------------------------------
RETL      9.01  -.31         8.44          116.1%     -------  RED    .317    .281     .598
---------------------------------------------------------------------------------------------
SOXL      14.44  -.3         12.82         529.3%     -------  BLUE   .174    .527     .701
---------------------------------------------------------------------------------------------
TECL      27.31  -.04        24.6          342.8%     -------  BLUE   .177    .236     .413
---------------------------------------------------------------------------------------------
IBB       136.78  -.01       135.26        18.4%      -------  BLUE   .138    .024     .162
---------------------------------------------------------------------------------------------
GLD       180.28   .65       177.08        75.3%      Bullish  BLUE   .294    .1       .394
---------------------------------------------------------------------------------------------
DBO       15.37  -.23        15.16         0%         Bearish  RED    .004   -.108    -.104
---------------------------------------------------------------------------------------------
OIH       316.77  -1.81      316.64       -207.9%     Bullish  RED    .114    .015     .129
---------------------------------------------------------------------------------------------
CPER     25.84   .05         25.57         33%        Bullish  BLUE  -.03    .131      .101
---------------------------------------------------------------------------------------------
TAN     80.68  -.93          81.79        -99.8%      Bearish  ----   .008    .045     .053
---------------------------------------------------------------------------------------------
UUP       27.45  -.03        27.55        -18.2%      Bearish  ----  -.12   -.113     -.233
---------------------------------------------------------------------------------------------
CORN      26.5   .35         26.73        -88.5%      Bullish  ----   .181   -.039     .142
---------------------------------------------------------------------------------------------
WEAT      7.43   .13         7.51         -100.3%     Bullish  BLUE   .083   -.146    -.063
---------------------------------------------------------------------------------------------
YINN      69.88  -.16        59.73         637.4%     Bullish  BLUE   .233    1.689     1.922
|
 Table 3     RANKING OF KEY DIRECTORIES BASED PCT.OF STOCKS ABOVE 65-DMA
              1/24/23
 Bullish = 47
 Bearish = 2
---------------------------------------------------------------------------------------
Directory     Current       day-1         day-2         day-3         day-4         day-5
----------------------------------------------------------------------------------------
COPPER         1             1             1             1             1             1
EDU            1             1             1             1             .833          .833
HOMEBLDG       .944          .888          .888          .833          .888          .888
INFRA          .939          .969          .939          .787          .969          1
GOLD           .934          .934          .934          .934          .913          .934
ETFS           .927          .927          .872          .89           .89           .872
BONDFUND       .908          .919          .908          .908          .908          .862
GAMING         .894          .842          .736          .684          .631          .684
JETS           .846          .846          .846          .846          .923          .923
INSURANC       .84           .8            .76           .68           .8            .92
SEMI           .84           .882          .797          .819          .872          .882
               =====
INDMATER       .833          .819          .791          .722          .791          .805
INDEXES        .81           .821          .81           .729          .805          .821
ELECTRON       .804          .819          .774          .781          .827          .849
SOFTWARE       .803          .803          .714          .607          .625          .696
CHINA          .795          .84           .818          .84           .795          .818
REIT           .792          .746          .738          .646          .7            .8
GREEN          .777          .777          .777          .666          .777          .888
AUTO           .773          .811          .698          .528          .641          .679
NIFTY          .772          .772          .704          .568          .636          .681
HIGHPRIC       .767          .806          .771          .625          .715          .793
UTILITY        .763          .71           .71           .657          .763          .947
NASD-100       .75           .75           .66           .58           .64           .72
               =====
SOLAR          .75           .812          .625          .562          .75           .75
               =====
RUS-1000       .749          .759          .708          .6            .683          .762
               =====
CHEM           .744          .72           .697          .604          .697          .744
TRANSP         .736          .789          .736          .631          .684          .684
FIDSTKS        .727          .775          .692          .538          .621          .733
SP500          .725          .739          .682          .581          .668          .759
               =====
COMPUTER       .7            .8            .55           .55           .55           .65
FINANCE        .675          .7            .6            .512          .625          .687
COAL           .666          .666          .666          .333          .333          .5
COMODITY       .666          .641          .641          .641          .615          .666
BIOTECH        .647          .65           .61           .576          .596          .642
GUNS           .642          .642          .714          .571          .714          .785
DOWJONES       .633          .633          .533          .4            .533          .8
               =====
RETAIL         .617          .638          .638          .595          .659          .723
FOOD           .612          .591          .632          .612          .612          .673
LOWPRICE       .61           .624          .595          .573          .584          .621
SP-100         .6            .622          .566          .455          .555          .677
OILGAS         .59           .619          .59           .542          .504          .619
MILITARY       .576          .461          .423          .423          .384          .576
BEVERAGE       .571          .571          .428          .428          .428          .571
BIGBANKS       .571          .571          .428          .428          .428          .428
HOSPITAL       .571          .642          .642          .642          .714          .785
HACKERS        .562          .562          .5            .437          .5            .375
DJI-13         .538          .538          .384          .23           .307          .615
=============================================================================================
REGBANKS       .36           .36           .4            .32           .32           .36
MARIJUAN       .3            .3            .2            .1            .3            .3
|
====================================================================================
Tuesday - 6:12 AM - Futures:
DJI -106 NASDAQ -52 Data
Used: 1/23/2023
| |
1/23/2023
DJI = 33629.56 NYSE adv = 2500 NYSE decl = 640
SP-500 Vol declined 6.5% from 1/20.
Ratio of up vol on SP-500 to downvol. there = 4.317
Est NYSE upv= 732.557 Est down v. = 169.628 (WSJournal did not publish it on-line)
|
|
| |
The market is pulling back from the
falling resistance lines. Its excuse here
was the Labor CPI report out this
morning that Consumer prices for all items
rose 6.5 percent from December 2021
to December 2022. In particular,
food prices increased 10.4%
percent. As you can see from the key index and
ETF charts below, the NYSE
A/D Line, the Closing Powers, Opening Powers
and Accumulation Indexes remain
very positive. The main problem is that
there remains plenty of overhead
resistance and volume could be higher to
eat up this resistance more
quickly. It will take time to do that. But the month-
to-month CPI fell by .1% and the
FED is rumored to be considering a pause
in its program of rate hikes when
it meets next at the end of the month. That
is the message the bond recovery is
saying to us, along with the steeply rising
NYSE A/D Line. Note, too that
Semi-conductors and NVDA, in particular,
are the leaders now that QQQ, the
NASDAQ and SP-500 are showing
greater 50-day relative strength
than the DJI. Avoid the short side and continue to
hold DIA, CAT and the strongest
bullish MAXCPs long. Watch and see if Nividia
can complete a bullish inverted
head and shoulders price pattern. Expect higher
prices. That is the message,
too, from the multiple Peerless Buys and the very bullish
seasonality. |
|
| |
Charts - 1/23/2023
2022 PEERLESS DJI, Signals, Indicators Daily DJI Volume
10-DayUp/Down Vol Stoch-20 CCI RSI Pct of All Stocks above 65-dma
Inverted Traders Index
DJI-IPA DJI-OBV Short-Term Rates
NASDAQ S&P OEX NYSE DJ-15 DJ-20 DJI-30 Bond Funds
DIA QQQ SPY IWM new - COIN (Bit Coin ETF)
Gold Stocks
TNA Short-Term Rates Ten Year Rates PST (Short Treasuries)
DOLLAR-UUP
ALLSTOCKs
Russell-1000
Insurance-Stocks
Recent 2006 vers-Peerless signals
http://www.tigersoftware.com/OLDPEER/UPD90123.bmp
MDY - http://www.tigersoftware.com/CHARTX/MDY.GIF
USO-CrudeOil DBO FAS GLD HD IBB JETS JNUG KOL NAIL NUGT NRGU OIH
PALL RSX RETL SDS AGQ SLV SOXL TAN TECL TLT TMF TNA UGA USO
China: YINN
CHAU
Commodities: CANE
CORN DBC JJC, NIB CORN, CUT (paper)
MOO, NRGU
SOYB WEAT UUP (Dollar) LIT
(Lithium)
Stocks AA AAPL ADBE ALXN AMAT AMGN AMD AMZN AXP BA BABA
BAC BIDU BLDP CAT CHKP CNX CPB CRM CVX CMG DE DIS ENPH FB FSLR
FTNT GILD GME GOOG GS HD IBM INTU JPM KO KR LRCX MRK MRNA
MOS MSFT NEM NFLX NKE NOC NUE NVDA PANW PG PYPL REGN REV
SO QCOM QDEL TSLA TXN XOM V VRTX WFC WMT XLE ZM ZOM
Leveraged Short ETFs:
FAZ - financials, TZA and SRTY- small caps, MZZ - mid caps, TECS -Techs,
SOXS -
semi-conductors LABD
- Biotechs
Bullish MAXCPs http://www.tigersoftware.com/UPPING/1-23-2023/BULLISH.htm
Bearish MINCPs http://www.tigersoftware.com/Downing/1-23-2023/BEARISH.htm |
|
DJI faces keen resistance overhead but A/D Line is very strong.
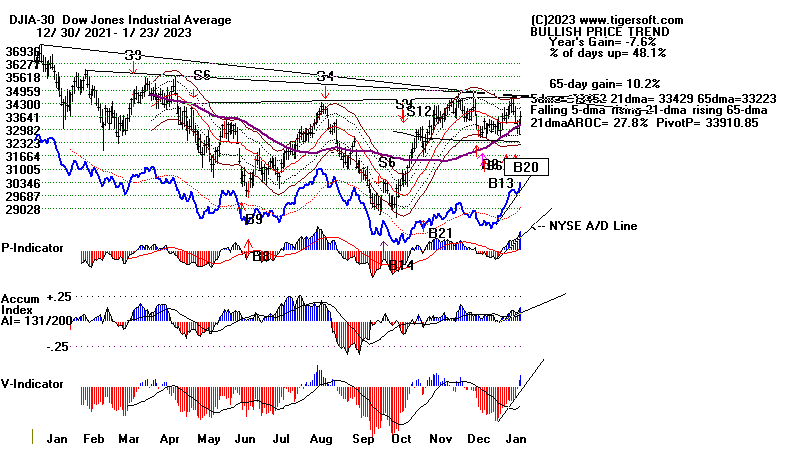 |
Both Opening and Closing Powers show rising 21-day ma trends.
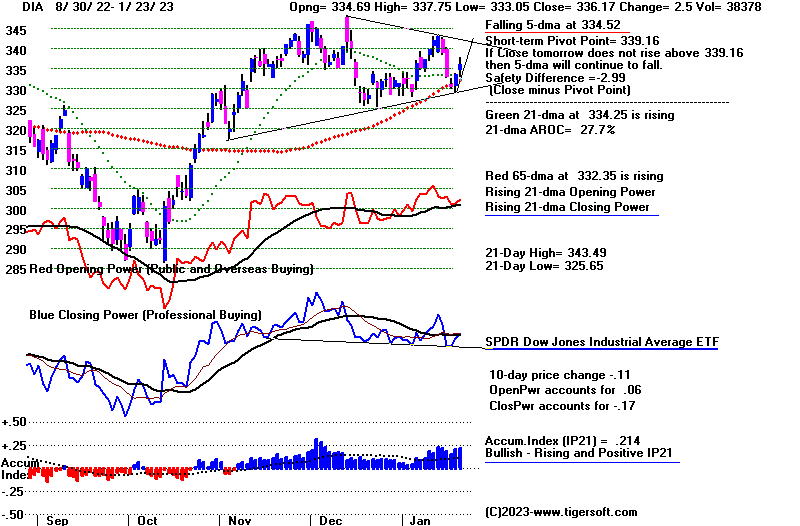 |
SP-500 at
falling, well-tested price down-trendline, but internals are positive.
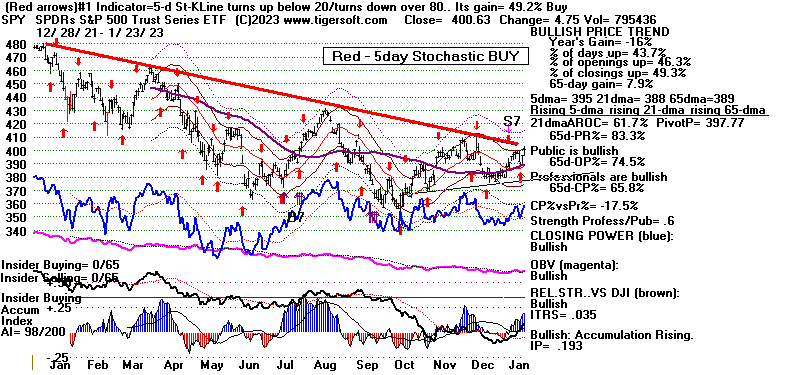 |
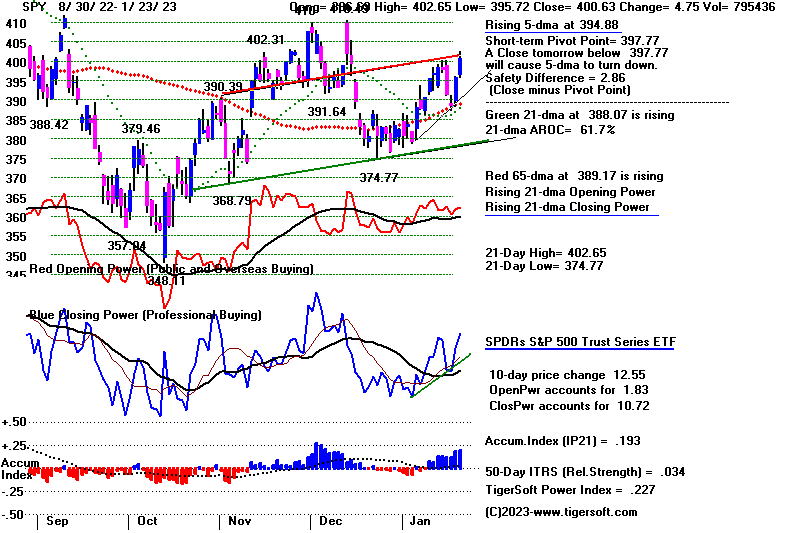 |
NASDAQ is at its
well-tested falling downtrendline. Positive internals.
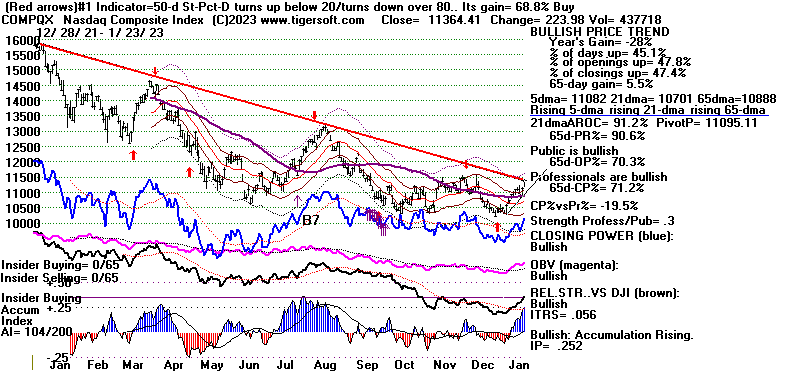 |
Bullishly
rising Opening and Closing Power. ITRS = .056
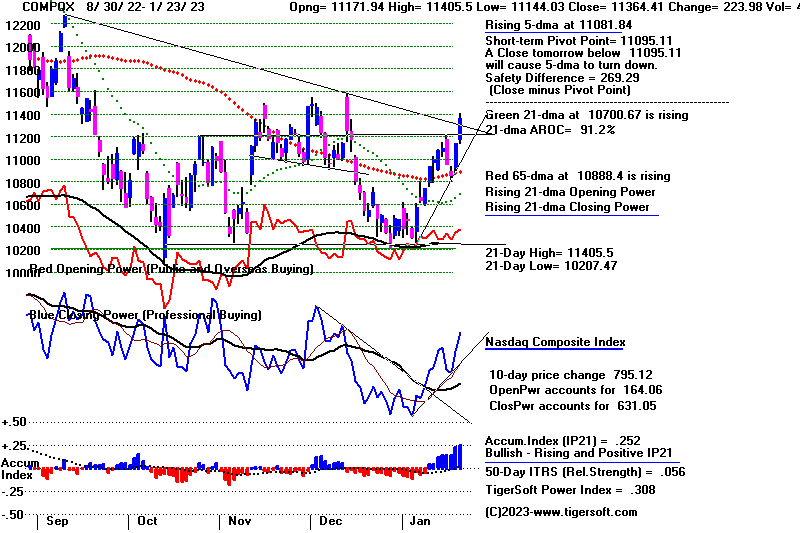 |
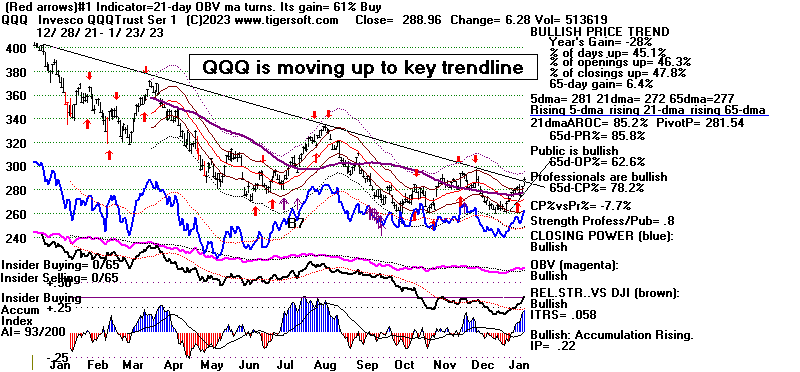 |
QQQ -
Bullishly rising Opening and Closing Power. ITRS = .057
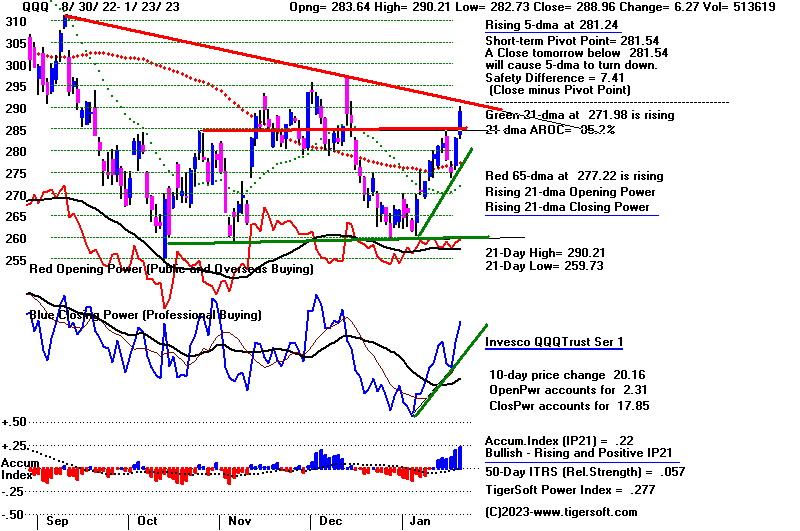 |
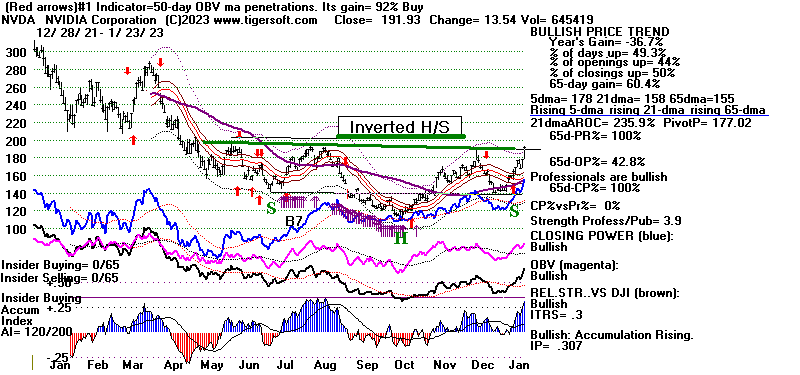 |
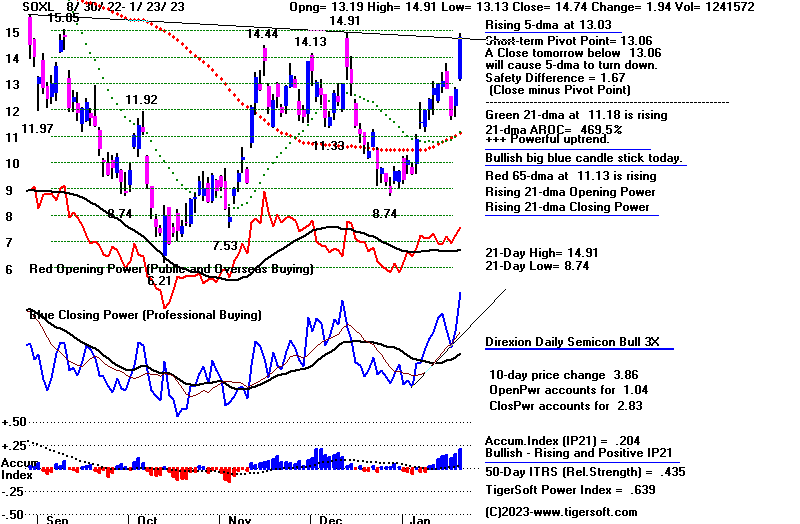 |
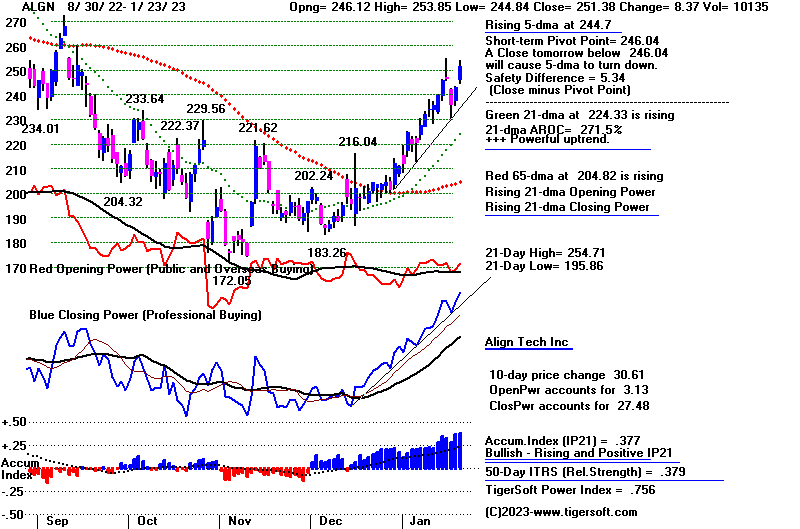 |
|
| WSJ Breadth and Volume statistics not available. |
Table 2 QUICKSILVER on ETFS - 1/23/2023 ---
     Bullish = 10    COMPQX, QQQ, MDY, IWM, FAS, RETL,  SOXL (.641)
                    TECL, GLD,  YINN (highest 1.638)
     Bearish = 0
ETF       CLOSE   CHANGE    PIVOT-PT    5-dma AROC    CL-PWR  CANDLE  IP21   ITRS   POWER INDEX
================================================================================================
DIA       336.17   2.5       339.16       -102.3%     -------  BLUE   .214   -------   -----
---------------------------------------------------------------------------------------------
COMPQX    11364.41   223.98  11095.11      129.4%     -------  BLUE   .252    .057     .309
---------------------------------------------------------------------------------------------
SPY       400.63   4.75      397.77        27%        -------  BLUE   .193    .035     .228
---------------------------------------------------------------------------------------------
QQQ       288.96   6.28      281.54        142.9%     -------  BLUE   .221    .059     .28
---------------------------------------------------------------------------------------------
MDY       472.2   6          469.64        16.6%      Bullish  BLUE   .245    .051     .296
---------------------------------------------------------------------------------------------
IWM       187.33   2.29      186.82        7.6%       -------  BLUE   .301    .03      .331
---------------------------------------------------------------------------------------------
FAS       82.95   2.73       84.28        -182.6%     Bullish  BLUE   .274    .07      .344
---------------------------------------------------------------------------------------------
RETL      9.32   .77         8.81          216.6%     -------  BLUE   .356    .206     .562
---------------------------------------------------------------------------------------------
SOXL      14.74   1.95       13.06         705.9%     -------  BLUE   .205    .436     .641
---------------------------------------------------------------------------------------------
TECL      27.35   1.74       25.57         422.8%     -------  BLUE   .195    .163     .358
---------------------------------------------------------------------------------------------
IBB       136.79   1.32      136.28        20.7%      -------  BLUE   .137    .036     .173
---------------------------------------------------------------------------------------------
GLD       179.63   .34       177.59        24.4%      Bullish  BLUE   .23    .113      .343
---------------------------------------------------------------------------------------------
DBO       15.6   .05         15.37         91.1%      Bearish  ----   .117   -.108     .009
---------------------------------------------------------------------------------------------
OIH       318.58  -1.93      330.09       -145.2%     Bullish  RED    .095   -.011     .084
---------------------------------------------------------------------------------------------
CPER     25.79  -.14         25.67         46.7%      Bullish  BLUE  -.046    .151     .105
---------------------------------------------------------------------------------------------
TAN     81.61   2.14         82.29        -8.1%       -------  BLUE   .039    .091     .13
---------------------------------------------------------------------------------------------
UUP       27.48   .04        27.55         1.8%       Bearish  ----  -.075   -.083    -.158
---------------------------------------------------------------------------------------------
CORN      26.15  -.34        26.97        -90%        Bullish  RED    .204   -.039     .165
---------------------------------------------------------------------------------------------
WEAT      7.3  -.23          7.58         -139.7%     Bullish  RED    .087   -.159    -.072
---------------------------------------------------------------------------------------------
YINN      70.04   2.06       61.65         326.4%     Bullish  BLUE   .247    1.391     1.638
|
 Table 3    RANKING OF KEY DIRECTORIES BASED PCT.OF STOCKS ABOVE 65-DMA
             1/23/23
 Bullish = 46
 Bearish = 3
---------------------------------------------------------------------------------------
Directory     Current       day-1         day-2         day-3         day-4         day-5
----------------------------------------------------------------------------------------
COPPER         1             1             1             1             1             1
EDU            1             1             1             .833          .833          1
INFRA          .969          .939          .787          .969          1             .969
GOLD           .934          .934          .934          .913          .934          .956
ETFS           .927          .872          .89           .89           .89           .854
BONDFUND       .919          .908          .908          .908          .873          .873
HOMEBLDG       .888          .888          .833          .888          .888          .888
SEMI           .882          .797          .819          .872          .882          .893
               =====
JETS           .846          .846          .846          .923          .923          1
GAMING         .842          .736          .631          .684          .684          .789
CHINA          .84           .818          .84           .795          .818          .818
INDEXES        .821          .81           .729          .805          .816          .832
ELECTRON       .819          .774          .781          .827          .849          .849
INDMATER       .819          .791          .722          .791          .805          .833
SOLAR          .812          .625          .562          .75           .75           .75
AUTO           .811          .698          .528          .641          .698          .716
HIGHPRIC       .806          .771          .625          .715          .793          .793
SOFTWARE       .803          .732          .607          .625          .696          .66
COMPUTER       .8            .55           .55           .55           .65           .65
INSURANC       .8            .76           .68           .8            .92           .92
TRANSP         .789          .736          .631          .684          .736          .789
GREEN          .777          .777          .666          .777          .888          .888
FIDSTKS        .775          .692          .538          .621          .733          .727
NIFTY          .772          .704          .568          .636          .681          .681
RUS-1000       .759          .708          .6            .683          .764          .765
               =====
NASD-100       .75           .66           .58           .64           .72           .72
               =====
REIT           .746          .73           .653          .707          .784          .761
SP500          .739          .682          .581          .664          .767          .767
               =====
CHEM           .72           .697          .604          .697          .744          .767
UTILITY        .71           .71           .657          .763          .947          .921
FINANCE        .7            .6            .512          .612          .687          .737
COAL           .666          .666          .333          .333          .5            .333
BIOTECH        .65           .607          .579          .596          .642          .661
GUNS           .642          .714          .571          .714          .785          .857
HOSPITAL       .642          .642          .642          .714          .785          .785
COMODITY       .641          .641          .615          .615          .666          .615
RETAIL         .638          .638          .595          .659          .723          .68
DOWJONES       .633          .533          .4            .533          .8            .833
               =====
LOWPRICE       .624          .598          .575          .584          .618          .618
SP-100         .622          .566          .455          .555          .677          .722
OILGAS         .619          .59           .542          .504          .609          .6
FOOD           .591          .632          .591          .612          .673          .612
BEVERAGE       .571          .428          .428          .428          .571          .571
BIGBANKS       .571          .428          .428          .428          .428          .714
HACKERS        .562          .5            .437          .5            .375          .437
DJI-13         .538          .384          .23           .307          .615          .692
=================================================================================================
MILITARY       .461          .423          .423          .384          .576          .692
REGBANKS       .36           .4            .32           .32           .36           .52
MARIJUAN       .3            .2            .1            .3            .3            .4
|
==============================================================================
Monday - 5:50 AM - Futures: DJI +55 NASDAQ
+20 Data Used: 1/20/2023
| |
1/20/2023
DJIA	33375.49	330.93	+1.00%
S&P 500	3972.61	        73.76	+1.89%
Nasdaq 	11140.43	288.17	+2.66%
NYSE  Advances	2,500 vs  1,245
NYSE  Declines	640 vs	1,822
New highs	47 + 85	= 132
New lows	16 + 29 = 45
NYSE	Latest Close	Previous Close	Week Ago
Issues traded	3,252	3,187	3,205
Advances	2,500	1,245	1,925
Declines	640	1,822	1,167
Unchanged	112	120	113
New highs	47	40	104
New lows	16	18	6
|
|
| |
The single most important technical
indicator is the NYSE A/D Line. It is not
flawless but year after year, it is the most reliable tool
we have. Right now
the A/D Line, which is shown in the Peerless chart below,
is making a recovery
high which is considerably ahead of the DJI. Its
strength will likely give us a
another new Peerless buy on either DJI strength or
weakness. The only real
failures of such A/D Line strength since 1965 were early in
the bear market
of 1977-1978 and 2001 before 9/11 in 2001. It is the
A/D Line strength
which gives us the recent Buy B20s, which as a pair are
particularly
powerful. And if the DJI should drop again to its
recent lows, 3% down
from where it stands now at its 21-day ma, we would almost
certainly get
a new Buy B9.
The seasonality remains very bullish now. Looking at
the third years in
a Presidential Election after January 22nd, we find the DJI
since 1967 is
up 86.7% of the time over the next two weeks and typically
gains 2.6%.
A month from now the average DJI gain by then would bring
3% higher prices,
two months out would average a jump of 5% and in three
months the DJI would
be 8.8% higher. The odds of it rising in three months
are 93.3%.
The other indices show many bullish internals. See
the chart of the NASDAQ,
SPY and QQQ below. But they also show still unbroken
price downtrends
going back a year and if these indexes and ETFs which are
stronger than the
DJI fail to get back above their downtrend-line and
instead make new lows, they
will each be completing a bearish continuation head and
shoulders pattern.
See how their recent advances have taken them up to
pinacles that match
in height away from their neckline that the potential left
shoulders made. (I
have circled these potential head and shoulders below.)
So, the NASDAQ, QQQ and SPY must not stall out badly
here and
break their recent support-levels. If they do, it
will be bearish despite the
seasonality. It will show that the short-term rates
will soon be well above 5%,
that there will likely be many more big lay-offs and the
FED is guiding the national
economy into a recession. This may happen. History
shows many cases
where Fed tightening led to a recession or worse.
Watch GS, AMGN and HD, in particular. If they
breakdown below their
recent support levels, the DJI will be acting as it did in
early 1977 when
both monetary and fiscal policy were tightening. The
NASDAQ held up
until mid-1977, but then collapsed as the DJI kept falling.
This has not happened yet. The Peerless Buy signals
still argue the bullish case here.
But if you are nervous, the leveraged short ETFs might be
bought if the
bearish scenario starts to play out. |
|
| |
Charts - 1/20/2023
2022 PEERLESS DJI, Signals, Indicators Daily DJI Volume
10-DayUp/Down Vol Stoch-20 CCI RSI Pct of All Stocks above 65-dma
Inverted Traders Index
DJI-IPA DJI-OBV Short-Term Rates
NASDAQ S&P OEX NYSE DJ-15 DJ-20 DJI-30 Bond Funds
DIA QQQ SPY IWM new - COIN (Bit Coin ETF)
Gold Stocks
TNA Short-Term Rates Ten Year Rates PST (Short Treasuries)
DOLLAR-UUP
ALLSTOCKs
Russell-1000
Insurance-Stocks
Recent 2006 vers-Peerless signals
http://www.tigersoftware.com/OLDPEER/UPD90120.bmp
MDY - http://www.tigersoftware.com/CHARTX/MDY.GIF
USO-CrudeOil DBO FAS GLD HD IBB JETS JNUG KOL NAIL NUGT NRGU OIH
PALL RSX RETL SDS AGQ SLV SOXL TAN TECL TLT TMF TNA UGA USO
China: YINN
CHAU
Commodities: CANE
CORN DBC JJC, NIB CORN, CUT (paper)
MOO, NRGU
SOYB WEAT UUP (Dollar) LIT
(Lithium)
Stocks AA AAPL ADBE ALXN AMAT AMGN AMD AMZN AXP BA BABA
BAC BIDU BLDP CAT CHKP CNX CPB CRM CVX CMG DE DIS ENPH FB FSLR
FTNT GILD GME GOOG GS HD IBM INTU JPM KO KR LRCX MRK MRNA
MOS MSFT NEM NFLX NKE NOC NUE NVDA PANW PG PYPL REGN REV
SO QCOM QDEL TSLA TXN XOM V VRTX WFC WMT XLE ZM ZOM
Leveraged Short ETFs:
FAZ - financials, TZA and SRTY- small caps, MZZ - mid caps, TECS -Techs,
SOXS -
semi-conductors LABD
- Biotechs
Bullish MAXCPs http://www.tigersoftware.com/UPPING/1-20-2023/BULLISH.htm
Bearish MINCPs http://www.tigersoftware.com/Downing/1-20-2023/BEARISH.htm
|
|
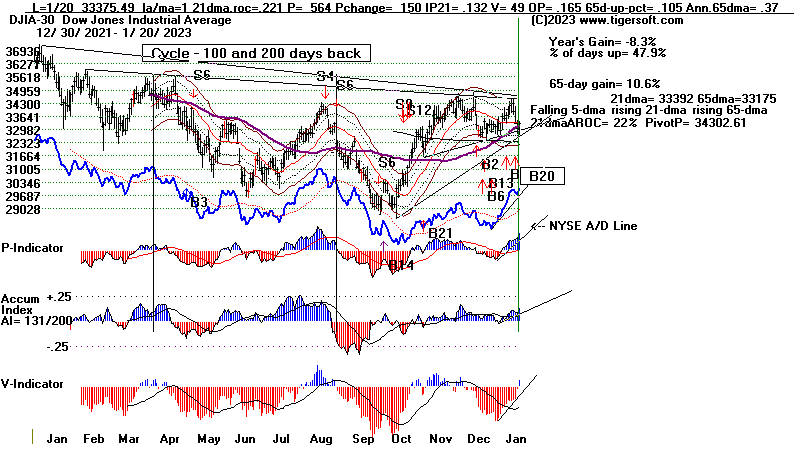 |
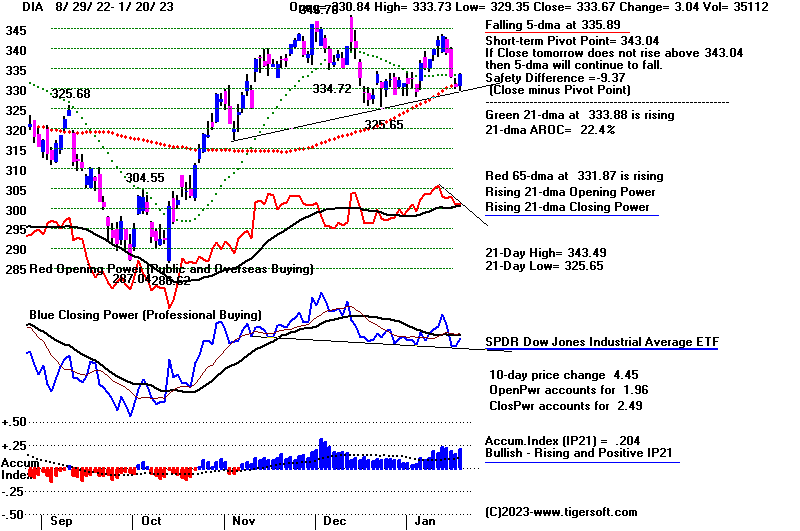 |
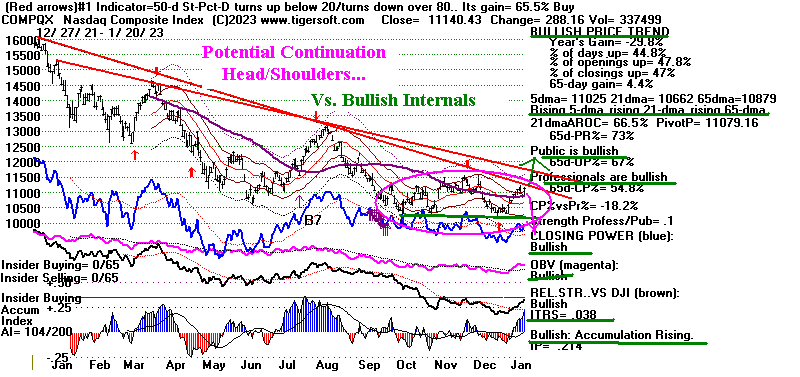 |
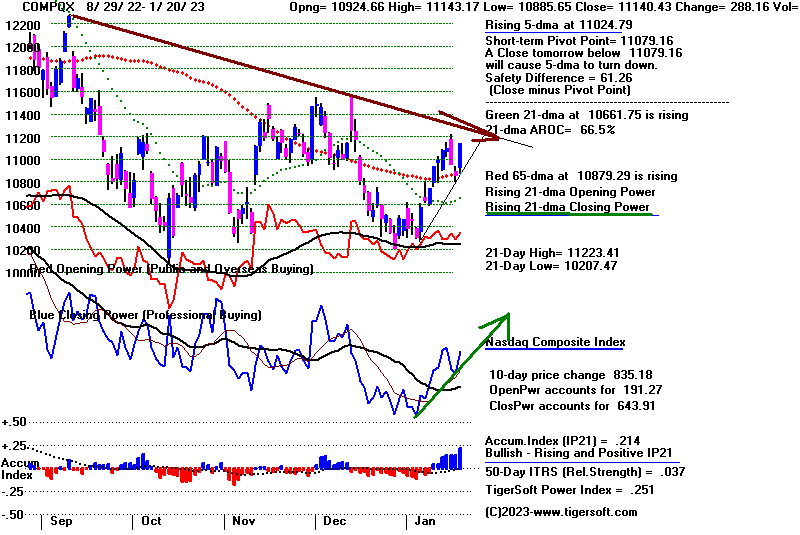 |
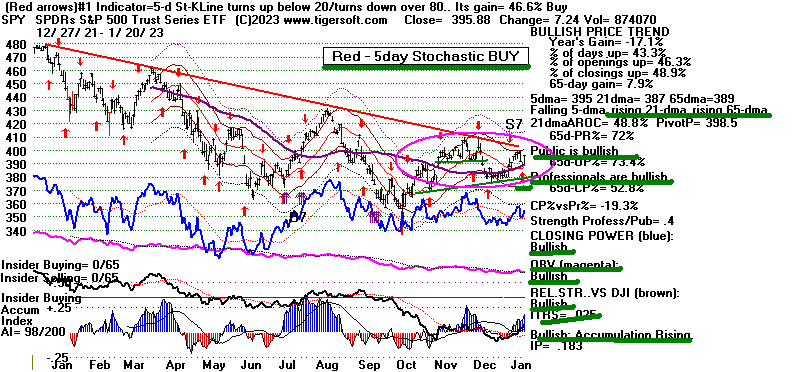 |
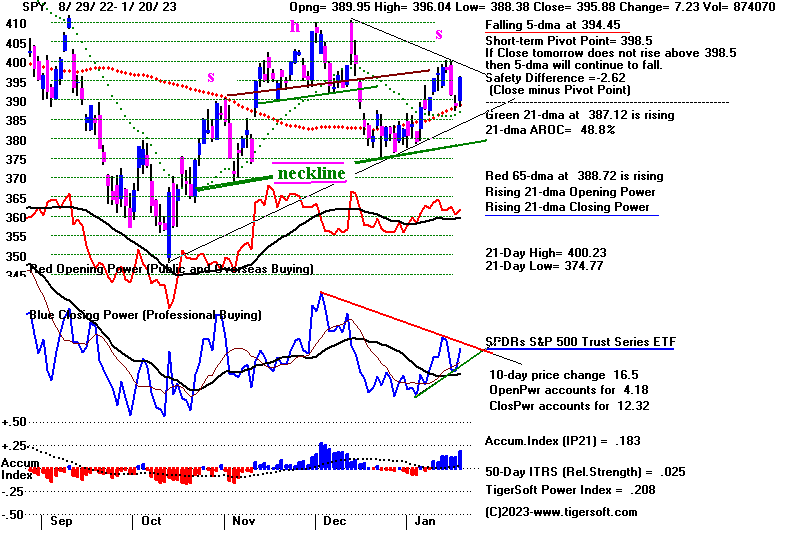 |
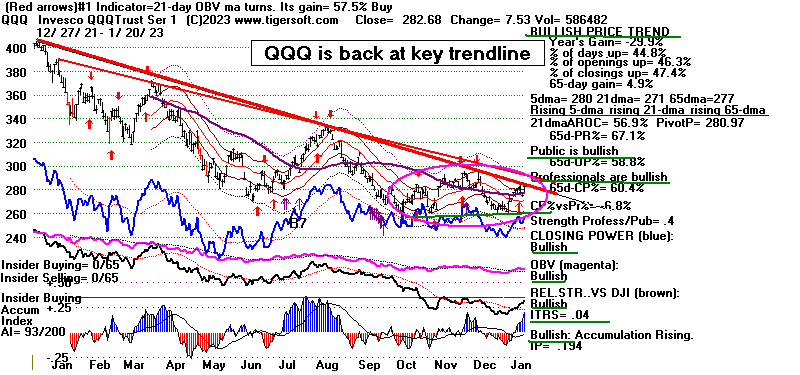 |
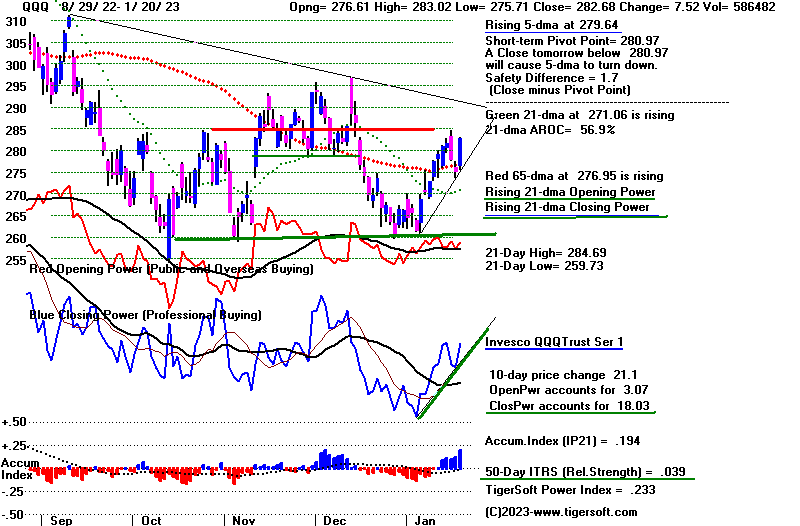 |
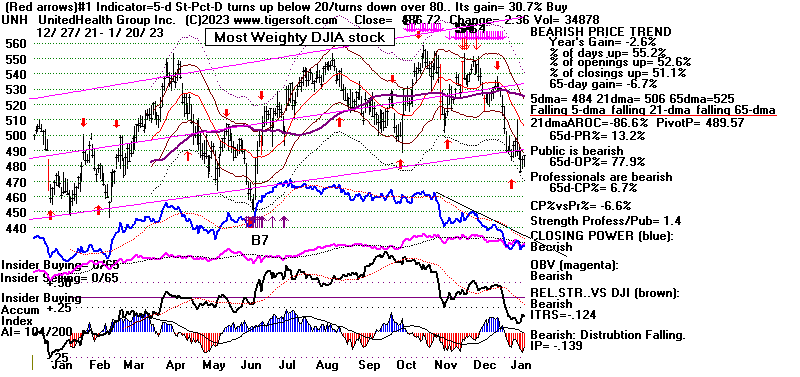 |
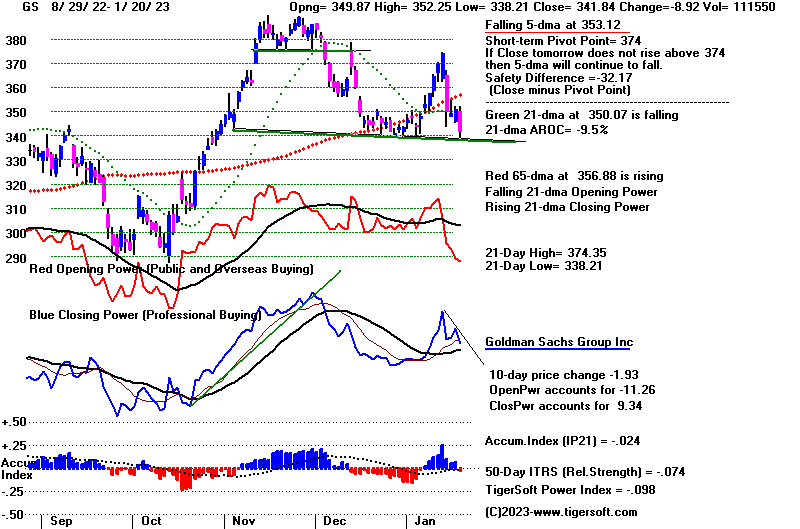 |
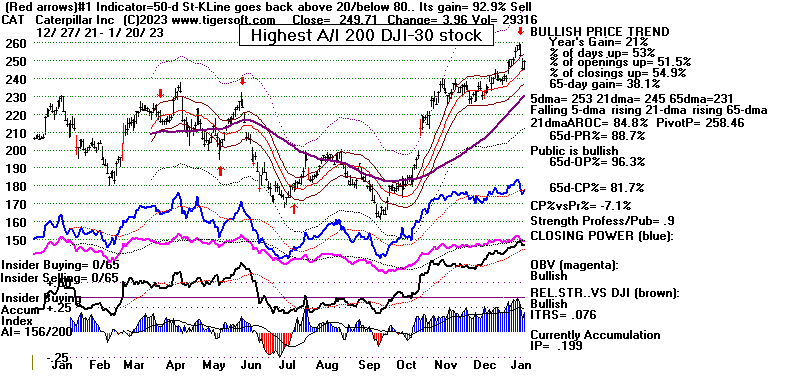 |
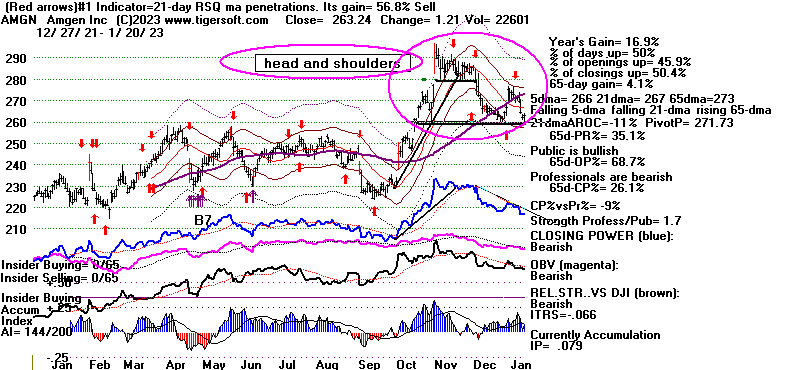 |
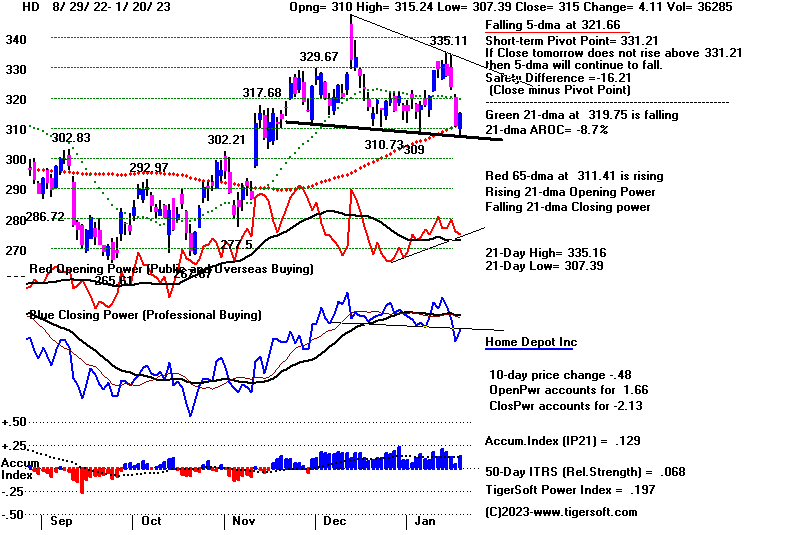 |
 |
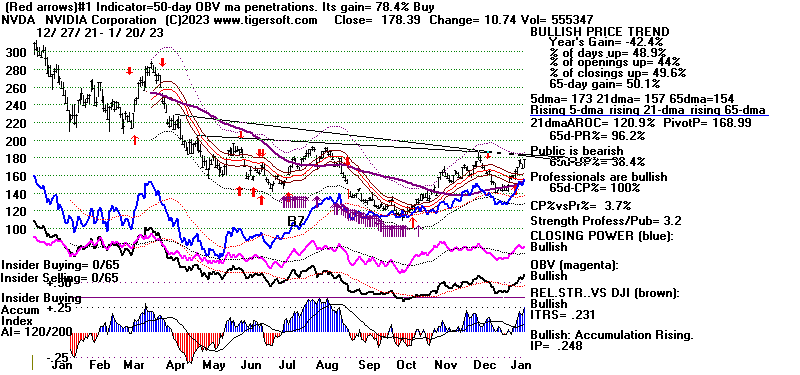 |
1/20/2023
DJIA	33375.49	330.93	+1.00%
S&P 500	3972.61	        73.76	+1.89%
Nasdaq 	11140.43	288.17	+2.66%
NYSE  Advances	2,500 vs  1,245
NYSE  Declines	640 vs	1,822
New highs	47 + 85	= 132
New lows	16 + 29 = 45
NYSE	Latest Close	Previous Close	Week Ago
Issues traded	3,252	3,187	3,205
Advances	2,500	1,245	1,925
Declines	640	1,822	1,167
Unchanged	112	120	113
New highs	47	40	104
New lows	16	18	6
Adv. volume*	837,164,455	261,170,114	471,814,968
Decl. volume*	128,560,067	573,585,165	295,435,461
Total volume*	974,935,396	845,694,626	774,903,426
Closing Arms (TRIN)†	0.67	1.55	1.06
Block trades*	4,936	4,338	4,094
Adv. volume	3,365,787,147	1,193,612,243	2,379,811,255
Decl. volume	575,785,911	2,709,574,124	1,522,407,875
Total volume	4,013,367,633	3,991,509,166	3,939,706,459
NASDAQ	Latest Close	Previous Close	Week Ago
Issues traded	4,838	4,827	4,844
Advances	3,342	1,698	2,895
Declines	1,269	2,883	1,671
Unchanged	227	246	278
New highs	85	71	121
New lows	29	34	19
Closing Arms (TRIN)†	0.41	1.50	1.25
Block trades	55,593	31,228	34,314
Adv. volume	5,127,830,044	1,295,889,963	2,908,204,732
Decl. volume	803,910,467	3,309,826,841	2,104,475,210
Total volume	5,980,112,286	4,660,802,928	5,077,997,580
|
Table 2 QUICKSILVER on ETFS - 1/20/2023 ---
     Bullish = 9    COMPQX, MDY, IWM, FAS, RETL,  SOXL  TECL, GLD,  YINN (highest 1.55)
     Bearish = 0
ETF       CLOSE   CHANGE    PIVOT-PT    5-dma AROC    CL-PWR  CANDLE  IP21   ITRS   POWER INDEX
================================================================================================
DIA       333.67   3.04      343.04       -123.4%     -------  BLUE   .205    0        ----
---------------------------------------------------------------------------------------------
COMPQX    11140.43   288.16  11079.16      63.3%      -------  BLUE   .214    .039     .253
---------------------------------------------------------------------------------------------
SPY       395.88   7.24      398.5        -13.7%      -------  BLUE   .183    .026     .209
---------------------------------------------------------------------------------------------
QQQ       282.68   7.53      280.97        65.1%      -------  BLUE   .195    .04      .235
---------------------------------------------------------------------------------------------
MDY       466.2   7.48       470.65       -23.2%      Bullish  BLUE   .224    .037     .261
---------------------------------------------------------------------------------------------
IWM       185.04   3         187.05       -21.3%      -------  BLUE   .286    .015     .301
---------------------------------------------------------------------------------------------
FAS       80.22   3.58       85.92        -243.6%     Bullish  BLUE   .24     .049      .289
---------------------------------------------------------------------------------------------
RETL      8.55   .59         8.95         -214.7%     -------  BLUE   .307    .113     .42
---------------------------------------------------------------------------------------------
SOXL      12.79   1.02       12.95        -11.8%      -------  BLUE   .151    .318     .469
---------------------------------------------------------------------------------------------
TECL      25.61   1.86       25.24         114.7%     -------  BLUE   .177    .116     .293
---------------------------------------------------------------------------------------------
IBB       135.47   1.42      136.23        13.3%      -------  BLUE   .134    .034     .168
---------------------------------------------------------------------------------------------
GLD       179.29  -.6        178.76        74.4%      Bullish  BLUE   .211    .134     .345
---------------------------------------------------------------------------------------------
DBO       15.55   .15        15.32         157.2%     Bullish  ----   .188   -.14      .048
---------------------------------------------------------------------------------------------
OIH       320.51   4.61      327.94       -79%        Bullish  BLUE   .149   -.007     .142
---------------------------------------------------------------------------------------------
CPER     25.93   .16         25.55         133%       Bullish  BLUE  -.065    .179     .114
---------------------------------------------------------------------------------------------
TAN     79.47   1.51         81.74        -136.3%     -------  BLUE   .008    .097     .105
---------------------------------------------------------------------------------------------
UUP       27.44  -.04        27.47        -7.3%       Bearish  RED   -.065   -.091    -.156
---------------------------------------------------------------------------------------------
CORN      26.49   0          26.63        -1.9%       Bullish  ----   .223   -.037     .186
---------------------------------------------------------------------------------------------
WEAT      7.53   .07         7.51          6.7%       Bullish  BLUE   .09    -.15      -.06
---------------------------------------------------------------------------------------------
YINN      67.98   4.58       65.88         377.5%     Bullish  BLUE   .234    1.314     1.548
|
 Table 3      RANKING OF KEY DIRECTORIES BASED PCT.OF STOCKS ABOVE 65-DMA
              1/20/23
 Bullish = 42
 Bearish = 6
---------------------------------------------------------------------------------------
Directory     Current       day-1         day-2         day-3         day-4         day-5
----------------------------------------------------------------------------------------
COPPER         1             1             1             1             1             1
EDU            1             1             .833          .833          1             1
INFRA          .939          .787          .969          1             .969          .939
GOLD           .934          .934          .913          .934          .956          .956
BONDFUND       .908          .908          .908          .873          .885          .885
HOMEBLDG       .888          .833          .888          .888          .888          .888
ETFS           .872          .89           .89           .89           .89           .854
JETS           .846          .846          .923          .923          1             .923
CHINA          .818          .84           .795          .818          .818          .795
INDEXES        .81           .729          .805          .816          .832          .827
SEMI           .797          .819          .872          .882          .882          .851
               -----
INDMATER       .791          .722          .791          .805          .833          .833
GREEN          .777          .666          .777          .888          .888          .833
ELECTRON       .774          .781          .827          .849          .842          .812
HIGHPRIC       .771          .625          .715          .793          .793          .775
INSURANC       .76           .68           .8            .92           .92           .92
GAMING         .736          .631          .631          .736          .789          .842
TRANSP         .736          .631          .684          .736          .789          .789
SOFTWARE       .732          .625          .625          .696          .66           .66
REIT           .73           .646          .715          .792          .761          .807
GUNS           .714          .571          .714          .785          .857          .857
UTILITY        .71           .657          .763          .947          .921          .947
RUS-1000       .708          .6            .683          .764          .772          .764
               -----
NIFTY          .704          .568          .636          .681          .681          .681
AUTO           .698          .547          .66           .698          .716          .773
CHEM           .697          .604          .697          .744          .767          .79
FIDSTKS        .692          .538          .621          .733          .739          .721
SP500          .682          .581          .664          .763          .777          .779
               -----
COAL           .666          .333          .333          .5            .333          .333
NASD-100       .66           .58           .64           .72           .71           .71
               -----
HOSPITAL       .642          .642          .714          .785          .785          .714
COMODITY       .641          .615          .589          .666          .615          .589
RETAIL         .638          .595          .659          .723          .68           .68
FOOD           .632          .591          .591          .673          .612          .551
SOLAR          .625          .562          .75           .75           .75           .687
BIOTECH        .607          .576          .599          .642          .656          .647
FINANCE        .6            .512          .612          .675          .75           .75
LOWPRICE       .598          .578          .587          .618          .621          .578
OILGAS         .59           .542          .504          .609          .6            .58
SP-100         .566          .455          .555          .677          .733          .722
COMPUTER       .55           .55           .55           .65           .7            .65
DOWJONES       .533          .4            .533          .8            .833          .766
               -----
----------------------------------------------------------------------------------------------
HACKERS        .5            .437          .5            .375          .437          .312
----------------------------------------------------------------------------------------------
BEVERAGE       .428          .428          .428          .571          .571          .571
BIGBANKS       .428          .428          .428          .428          .714          .571
MILITARY       .423          .423          .384          .576          .692          .692
REGBANKS       .4            .32           .32           .36           .52           .48
DJI-13         .384          .23           .307          .615          .692          .615
MARIJUAN       .2            .1            .3            .3            .4            .3
|
=================================================================================
Friday - 6:10 AM - Futures: DJI -26 NASDAQ +35
Data Used: 1/19/2023
| |
1/19/2023
DJIA	33044.56	-252.40	-0.76%
S&P 500	3898.85	        -30.01	-0.76%
Nasdaq 	10852.27	-104.74	-0.96
Advances	1,245 vs 1,077
Declines	1,822 vs 2,041
New highs	40 +71 = 111
New lows	18 +34 = 52
|
|
| |
Yesterday's
Buy B20 is historically expecially powerful in Januares and
when it occurs in tandem with
an earlier B20. Will Peerless be able to
bring a rally now with more
FED offcials talking about tightening and with
Congress seemingly divided
hopelessly about what to do about the issue of
raising the debt ceiling?
Don't count Peerless out.
Third years in the four year cycle show DJI gains of
nearly 3
times what the other years in the cycle bring. The reason that the third
years are so bullish has to
do with the politicians preparing for the next
Presidential Election by
doing things to win more votes and get bigger
campaign contributions.
Shutting down government and not paying the
govenment's bills is not the
way to do these things. Democrats and Republicans
will probably unite sooner
than later to keep the government running. And as
for the Fed, talk of
more tightening is a lot easier than running roughshod
over the wishes of the
politicians who want re-election. Look for increasing
signs that the FOMC is
becoming divided over its tightening policies. The
Dallas Fed Chairman may be
joined by others who oppose the "hawks"..
But it will take some time.
See in our charts how the key ETFs and
Indexes must recover what
they lost this week to get back to their price
downtrends. And see how
the Closing Powers will need to turn up
to show that Professionals
are ready to buy aggressively again.
The DJI is losing its
leadership role to the NASDAQ and SP-500 which
have now outperformed it over
the last 50 trading days. This is a good sign,
It shows breadth remains
favorable and the markets' underpinnings are
better than back in 2011.
But for now, I've suggested hedging with
some leveraged short ETFs
while the market regains its footing. We
can see that the two highest
priced DJI stocks, the most heavily weighted,
UNH and GS, actually rose
today. But we do not want to see DIA's
Closing Power break its
support levels and we do not want to see CAT
fall below its recent point
of breakout. Watch the key charts below to
see if they decisively break
their 65-dma. If they do, the repairing process
will take longer. |
|
| |
Charts - 1/19/2023
2022 PEERLESS DJI, Signals, Indicators Daily DJI Volume
10-DayUp/Down Vol Stoch-20 CCI RSI Pct of All Stocks above 65-dma
Inverted Traders Index
DJI-IPA DJI-OBV Short-Term Rates
NASDAQ S&P OEX NYSE DJ-15 DJ-20 DJI-30 Bond Funds
DIA QQQ SPY IWM new - COIN (Bit Coin ETF)
Gold Stocks
TNA Short-Term Rates Ten Year Rates PST (Short Treasuries)
DOLLAR-UUP
ALLSTOCKs
Russell-1000
Insurance-Stocks
Recent 2006 vers-Peerless signals
http://www.tigersoftware.com/OLDPEER/UPD90119.bmp
MDY - http://www.tigersoftware.com/CHARTX/MDY.GIF
USO-CrudeOil DBO FAS GLD HD IBB JETS JNUG KOL NAIL NUGT NRGU OIH
PALL RSX RETL SDS AGQ SLV SOXL TAN TECL TLT TMF TNA UGA USO
China: YINN
CHAU
Commodities: CANE
CORN DBC JJC, NIB CORN, CUT (paper)
MOO, NRGU
SOYB WEAT UUP (Dollar) LIT
(Lithium)
Stocks AA AAPL ADBE ALXN AMAT AMGN AMD AMZN AXP BA BABA
BAC BIDU BLDP CAT CHKP CNX CPB CRM CVX CMG DE DIS ENPH FB FSLR
FTNT GILD GME GOOG GS HD IBM INTU JPM KO KR LRCX MRK MRNA
MOS MSFT NEM NFLX NKE NOC NUE NVDA PANW PG PYPL REGN REV
SO QCOM QDEL TSLA TXN XOM V VRTX WFC WMT XLE ZM ZOM
Leveraged Short ETFs:
FAZ - financials, TZA and SRTY- small caps, MZZ - mid caps, TECS -Techs,
SOXS -
semi-conductors LABD
- Biotechs
Bullish MAXCPs http://www.tigersoftware.com/UPPING/1-19-2023/BULLISH.htm
Bearish MINCPs http://www.tigersoftware.com/Downing/1-19-2023/BEARISH.htm |
|
 |
 |
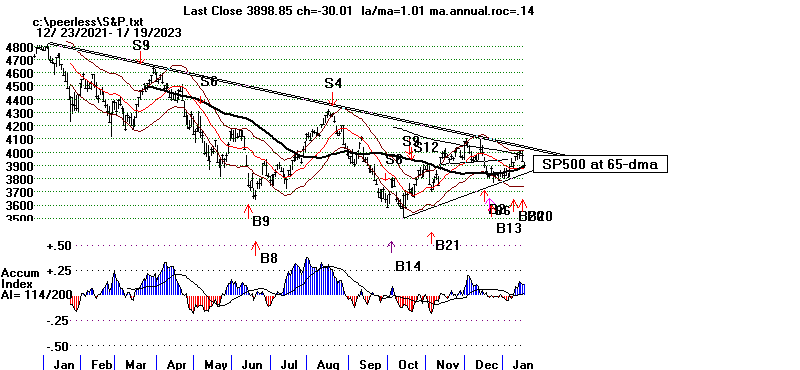 |
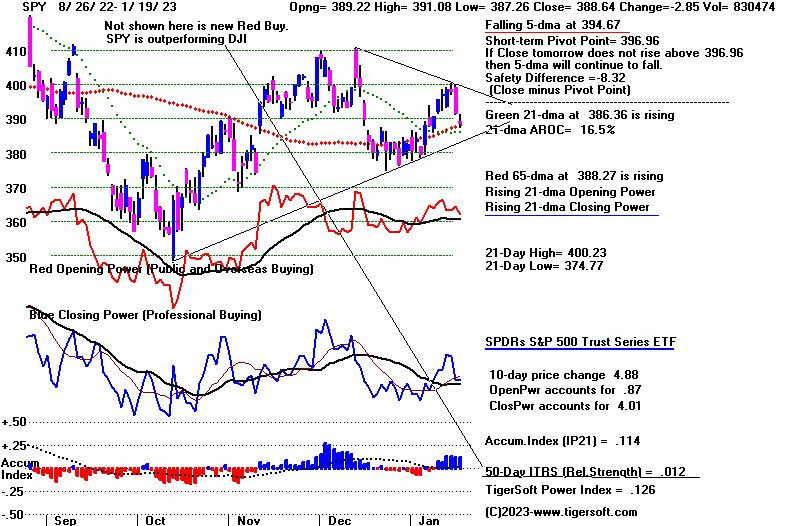 |
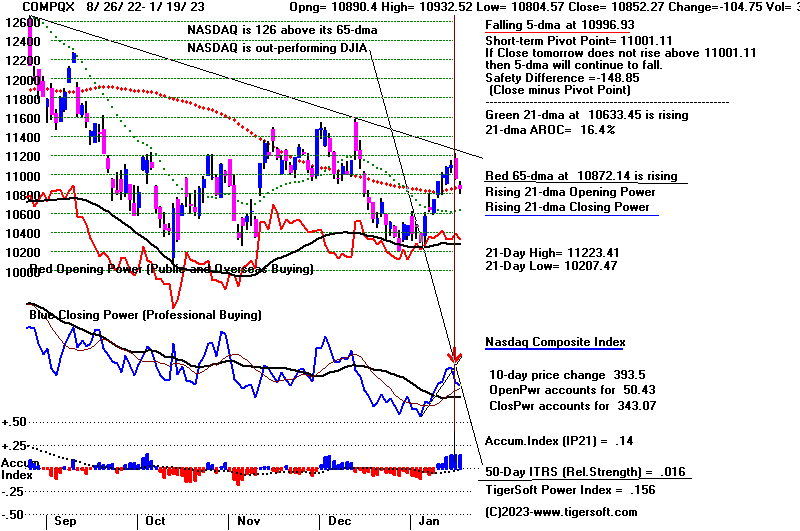
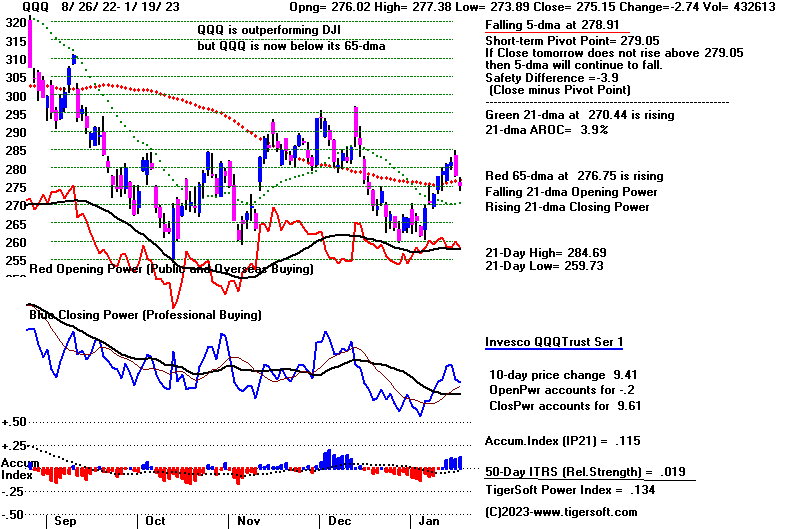
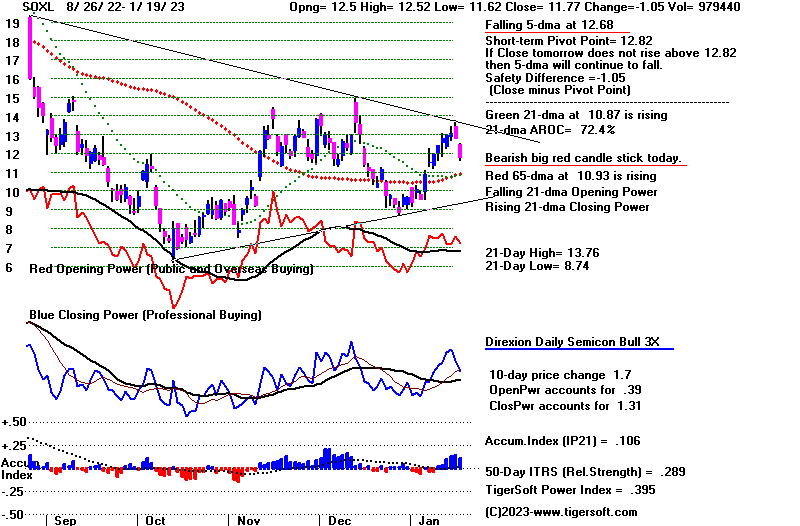 |
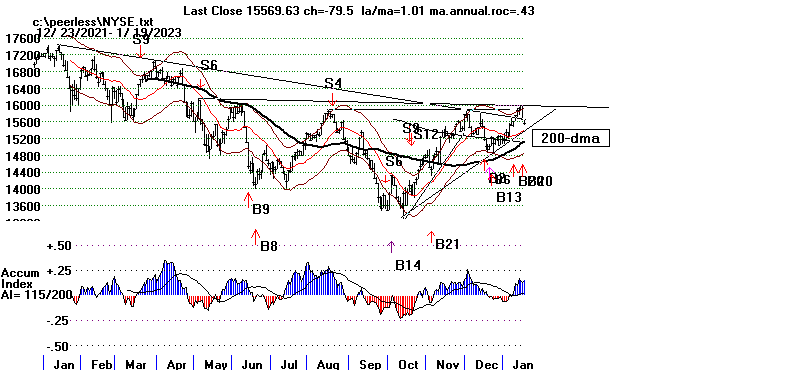 |
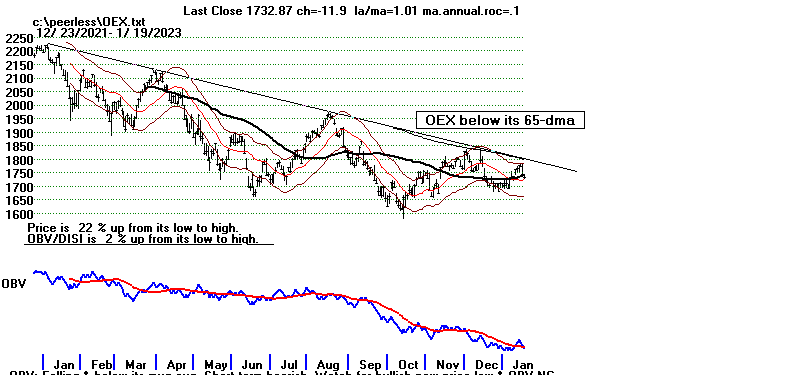 |
Key DJI-30 Stocks
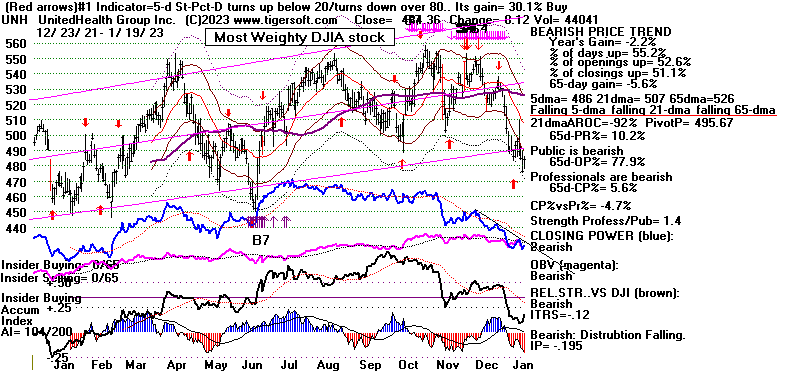 |
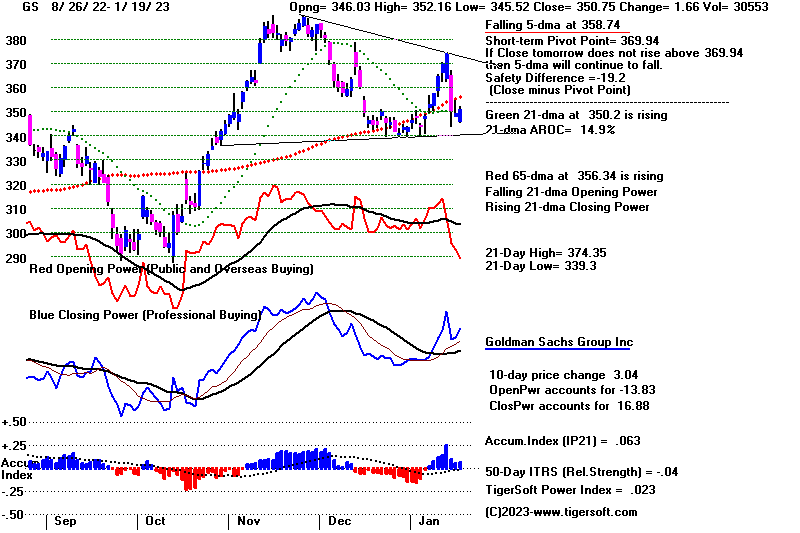 |
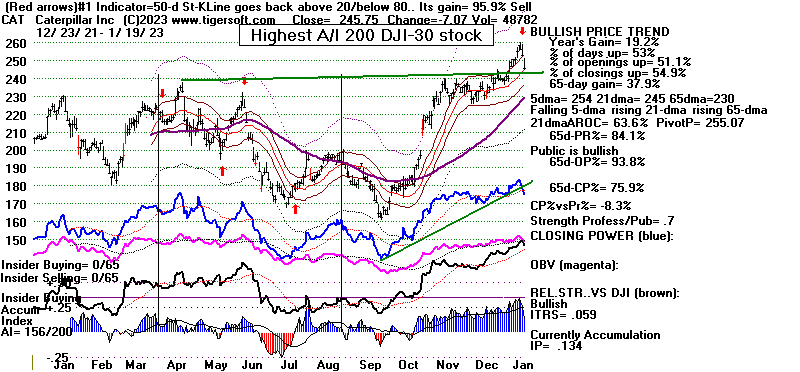 |
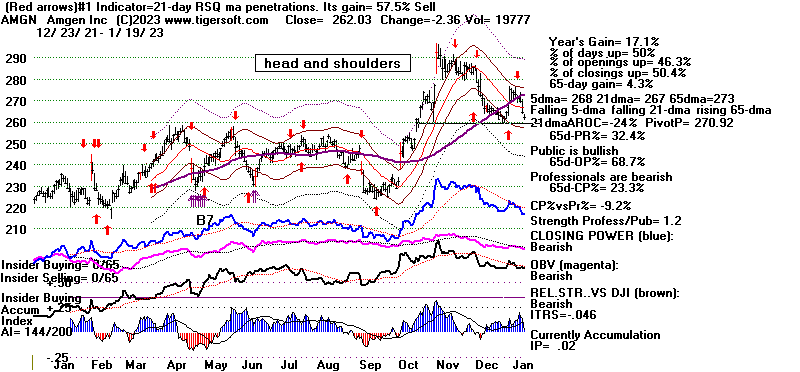 |
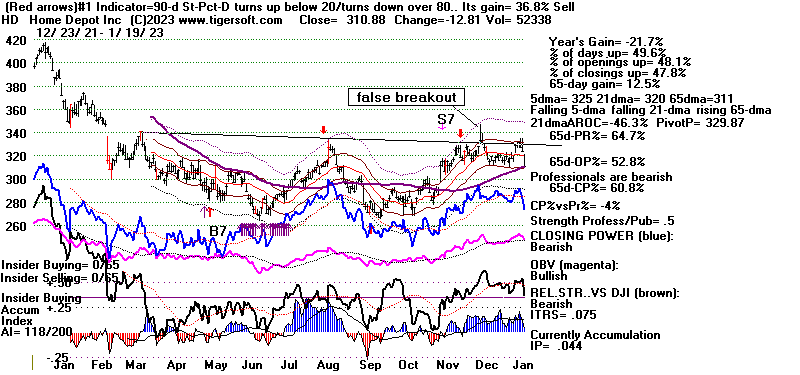 |
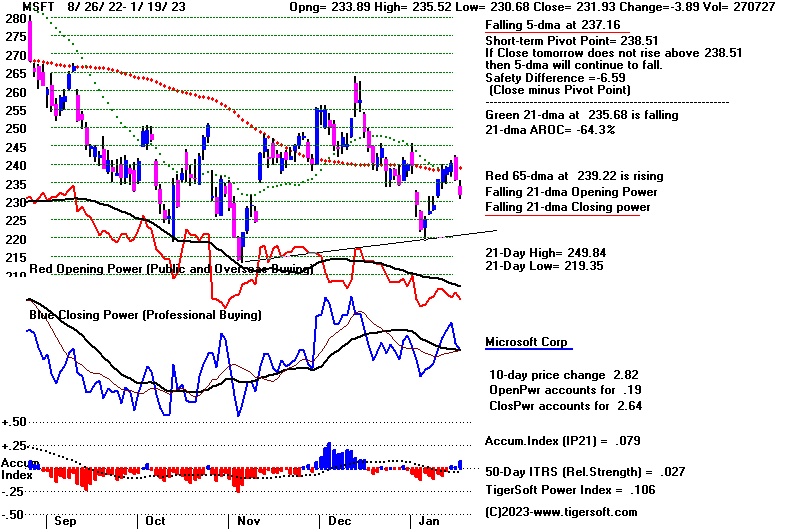 |
Table 1 - Breadth and Volume Statistics 1/19/2023
DJIA	33044.56	-252.40	-0.76%
S&P 500	3898.85	        -30.01	-0.76%
Nasdaq 	10852.27	-104.74	-0.96
Advances	1,245 vs 1,077
Declines	1,822 vs 2,041
New highs	40 +71 = 111
New lows	18 +34 = 52
NYSE	Latest Close	Previous Close	Week Ago
Issues traded	3,187	3,229	3,225
Advances	1,245	1,077	2,372
Declines	1,822	2,041	746
Unchanged	120	111	107
New highs	40	101	108
New lows	18	8	12
Adv. volume*	261,170,114	128,638,731	639,502,729
Decl. volume*	573,585,165	747,024,729	210,754,548
Total volume*	845,694,626	887,577,972	861,651,544
Closing Arms (TRIN)†	1.55	2.71	0.93
Block trades*	4,338	4,355	4,423
Adv. volume	1,193,612,243	687,292,155	3,390,118,981
Decl. volume	2,709,574,124	3,529,549,793	994,104,614
Total volume	3,991,509,166	4,298,711,416	4,440,261,643
NASDAQ	Latest Close	Previous Close	Week Ago
Issues traded	4,827	4,847	4,794
Advances	1,698	1,558	3,269
Declines	2,883	3,090	1,308
Unchanged	246	199	217
New highs	71	115	139
New lows	34	27	26
Closing Arms (TRIN)†	1.50	1.46	0.98
Block trades	31,228	34,494	40,660
Adv. volume	1,295,889,963	1,341,823,971	4,035,847,518
Decl. volume	3,309,826,841	3,884,130,966	1,588,522,892
Total volume	4,660,802,928	5,288,639,185	5,681,244,198
|
Table 2 QUICKSILVER on ETFS - 1/19/2023 ---
     Bullish = 4    RETL,  SOXL  GLD,  YINN (highest 1.37)
     Bearish = 0
ETF       CLOSE   CHANGE    PIVOT-PT    5-dma AROC    CL-PWR  CANDLE  IP21   ITRS   POWER INDEX
================================================================================================
DIA       330.63  -2.34      342          -134.5%     Bearish  RED    .15    --------------
---------------------------------------------------------------------------------------------
COMPQX    10852.27  -104.74  11001.11     -36%     -  ------  RED    .14      .016     .156
---------------------------------------------------------------------------------------------
SPY       388.64  -2.85      396.96       -86.9%      -------  RED    .114    .013     .127
---------------------------------------------------------------------------------------------
QQQ       275.15  -2.73      279.05       -42.9%      -------  RED    .116    .02      .136
---------------------------------------------------------------------------------------------
MDY       458.72  -4.76      468.36       -57.8%      Bullish  RED    .146    .025     .171
---------------------------------------------------------------------------------------------
IWM       182.04  -1.76      185.83       -19.4%      -------  RED    .178   -.001     .177
---------------------------------------------------------------------------------------------
FAS       76.64  -2.84       84.22        -416.8%     Bullish  BLUE   .18     .026     .206
---------------------------------------------------------------------------------------------
RETL      7.96  -.48         8.92         -427.8%     -------  RED    .249    .064     .313
---------------------------------------------------------------------------------------------
SOXL      11.77  -1.05       12.82        -245.9%     -------  RED    .106    .289     .395
---------------------------------------------------------------------------------------------
TECL      23.75  -.85        25.04        -148.1%     -------  RED    .119    .083     .202
---------------------------------------------------------------------------------------------
IBB       134.05  -1.21      135.11        2.2%       -------  RED    .058    .024     .082
---------------------------------------------------------------------------------------------
GLD       179.89   2.81      176.64        148.9%     Bullish  BLUE   .187    .13      .317
---------------------------------------------------------------------------------------------
DBO       15.4   .24         15.07         138.3%     Bullish  BLUE   .198   -.158     .04
---------------------------------------------------------------------------------------------
OIH       315.9  -.74        325.62       -28.4%      Bullish  BLUE   .117    .008     .125
---------------------------------------------------------------------------------------------
CPER     25.77   .2          25.25         84.4%      Bullish  BLUE  -.106    .131     .025
---------------------------------------------------------------------------------------------
TAN     77.96  -3.83         81.68        -138%       Bearish  RED   -.058    .057    -.001
---------------------------------------------------------------------------------------------
UUP       27.48  -.07        27.48        -49%        Bearish  ----  -.005   -.099    -.104
---------------------------------------------------------------------------------------------
CORN      26.49  -.24        26.5          96%        Bullish  RED    .236   -.048     .188
---------------------------------------------------------------------------------------------
WEAT      7.46  -.05         7.52         -19.9%      Bullish  ----   .064   -.165    -.101
---------------------------------------------------------------------------------------------
YINN      63.4   3.67        63.24        -122.8%     Bullish  BLUE   .173    1.184     1.357
|
Table 3  RANKING OF KEY DIRECTORIES BASED PCT.OF STOCKS ABOVE 65-DMA
              1/19/23
 Bullish = 39
 Bearish = 10
---------------------------------------------------------------------------------------
Directory     Current       day-1         day-2         day-3         day-4         day-5
----------------------------------------------------------------------------------------
COPPER         1             1             1             1             1             1
EDU            1             .833          .833          1             1             1
GOLD           .934          .913          .934          .956          .956          .956
BONDFUND       .908          .908          .873          .885          .885          .862
ETFS           .89           .89           .89           .89           .872          .872
JETS           .846          .923          .923          1             1             .846
CHINA          .84           .795          .818          .818          .795          .795
HOMEBLDG       .833          .888          .888          .888          .888          .888
SEMI           .819          .872          .882          .882          .84           .829
INFRA          .787          .969          1             .969          .939          .939
ELECTRON       .781          .827          .849          .842          .804          .796
INDEXES        .729          .805          .816          .832          .827          .81
INDMATER       .722          .791          .805          .833          .833          .833
INSURANC       .68           .8            .92           .92           .92           .88
GREEN          .666          .777          .888          .888          .833          .722
UTILITY        .657          .763          .947          .921          .947          .921
REIT           .646          .707          .8            .769          .8            .676
HOSPITAL       .642          .714          .785          .785          .714          .714
GAMING         .631          .631          .684          .842          .842          .789
TRANSP         .631          .684          .736          .789          .789          .736
HIGHPRIC       .625          .715          .793          .793          .775          .762
SOFTWARE       .625          .642          .696          .66           .678          .589
COMODITY       .615          .589          .641          .615          .589          .564
CHEM           .604          .697          .744          .767          .79           .767
RUS-1000       .6            .683          .764          .772          .765          .74
               =====
RETAIL         .595          .659          .723          .68           .68           .659
FOOD           .591          .591          .653          .612          .551          .53
SP500          .581          .664          .763          .773          .783          .771
NASD-100       .58           .64           .72           .71           .71           .71
               ====
LOWPRICE       .578          .59           .621          .621          .578          .544
BIOTECH        .576          .596          .644          .656          .647          .588
GUNS           .571          .714          .785          .857          .857          .857
NIFTY          .568          .636          .681          .681          .681          .636
SOLAR          .562          .75           .75           .75           .687          .5
COMPUTER       .55           .55           .65           .7            .65           .75
AUTO           .547          .66           .698          .716          .773          .716
OILGAS         .542          .504          .609          .6            .58           .523
FIDSTKS        .538          .621          .733          .739          .721          .704
FINANCE        .512          .612          .675          .737          .737          .675
===================================================================================================
SP-100         .455          .555          .677          .733          .722          .755
HACKERS        .437          .5            .375          .437          .375          .375
BEVERAGE       .428          .428          .571          .571          .571          .571
BIGBANKS       .428          .428          .428          .714          .571          .571
MILITARY       .423          .384          .576          .692          .692          .615
DOWJONES       .4            .533          .8            .833          .766          .8
               =====
COAL           .333          .333          .5            .333          .333          .166
REGBANKS       .32           .32           .36           .52           .48           .36
DJI-13         .23           .307          .615          .692          .615          .769
MARIJUAN       .1            .3            .3            .4            .3            .2
|
==================================================================================
Thursday - 5:45 AM - Futures:
DJI -274 NASDAQ -97 Data Used:
1/18/2023
| |
1/18/2023
DJIA	33296.96	-613.89	-1.81%
S&P 500	3928.86	        -62.11	-1.56%
Nasdaq 	10957.01	-138.10	-1.24%
NYSE Advances	1,077	vs 1,690
Declines	2,041	vs 1,424
New highs	101  +	115 = 216
New lows	8    +  27 = 35	 97,410
|
|
| |
The market is suddenly in panic mode
about the fact that a deadlocked
Congress may not raise the Federal Debt
limit anytine soon, this making
a default on Federal loan debt
increasingly likely. Perhaps, it was distracted
until today by the rising prices in quite
a few smaller companies' stocks.
Perhaps, it was watching to see if the
Nasdaq, QQQ and SPY could break
their year-long downtrendlines as IWM had
just dome. Perhaps, it believed
that the recent decline in 10-year rates
and the rise in the bond market was
signalling an easing off the the process
of raising rates by the FED because
Inflation is moderating and any more
tightening of short-term rates would
cause a economic cruch.
https://www.nytimes.com/2023/01/19/us/politics/debt-limit-economy.html
The bulls wanted to believe these things.
But on Tuesday Retail sales
turned down, more tech lay offs were announced
and the FED has brought
about a huge inversion of short-term rates (now
above 4.5%) and ten-year
treasuries (now only 3.375%). Such
inversions are reliably bearish. The
FED is in full tigtening mode. Even the
Governor of the Dallas FED
broke ranks with Powell openly on this today.
Meanwhile, blue chip
investors are dumping their stocks and buying
10-year Treasuries as a
haven. Interestingly, it was the New York
Times article about how
Wall Street was too brazenly forgetting how the
two sides in Congress
back in 2011 caused a 10% decline when the fear
of FED defaults was
nowhere near as well-founded as now. With
very good iinsight, they
said Congress would probably not be tamed this
time around unless they
see the markets again in a panic.
Peerless, the technical system of Buys and
Sells. knows nothing of this.
and issued another Buy B20 because there have
been four excellent
breadth days on the NYSE over the last eight
trading days. A case can
be made for the new Buy B20 which appeared
today. First, Buy B20s
usually prove profitable, although less so
since 2000. Second, that
the two January Buy B20s have in the past been
very profitabe. And third,
that paired Buy B20s have all been very profitable.
See that the second
Buy B20 in the last six days occurred today and
see the table of Buy B20s
since 1929 just below.
The Closing Power steep uptrends in the key
ETFs were all broken today by
the big decline after the opening on January
18th. Various type of red
candle-sticks show a trend reversal down is at
hand. Until the Closing
Powers can hook back up, we must assume lower
prices lie ahead.
This is not a good time to be hold long
leveraged ETFs, rather one
could consider hedging by buying some of
leveraged short ETFs,
especially those with big gains from their new
RED buy signals,
like LABD (+529), TECS (+302%) and
TZA(+211%).
|
|
| |
The blue
highlights mark the B20s that occurred in January or as the second in a pair.
These consistently brought the best gains.PEERLESS B20 SIGNALS: 12/7/1928 - 11/3/2022
Date          Signal        DJI           Gain          Paper Loss
--------------------------------------------------------------
19310721      B20            146.7    -.034       134.1    -.0858
19340817      B20             91.1     .016       90.4     -.0076
19351122      B20            144.6    -.011       138.90   -.0394

19380922      B20            137.4     .146       129.9    -.0545 high
19380928      B20            133.7     .178       none      0
  (2nd in pair.)
19390202      B20            144.3     .036       none      0
19431110      B20            132.7     .236       129.6    -.0233
19431207      B20            133.4     .229       none      0
19451205      B20            193.1     .032       189.1    -.0207
19461204      B20            170.3     .078       none      0
19470529      B20            169.3     .092       none      0

19500720      B20            207.7     .247       203.8    -.0187
19500727      B20            206.1     .25        203.8     0
  (2nd in pair.)

19501109      B20            227.2     .14        222.3    -.0215
  (January B20)

19540112      B20            281.5     .664       none       0
  (January B20)
19580122      B20            445.7     .459       436.9    -.0197
  (2nd in pair.)

20070831      B20          13357.74    .034       13113.3  -.0182 |

20130701      B20          14974.96    .032       none      0
20131017      B20          15371.65    .074       none      0
  (2nd in pair. )
20140213      B20          16027.59    .060       none      0
20140818      B20          16838.74    .085       none      0
20151223      B20          17602.61    .007       none      0
20160629      B20          17694.68    .036       none      0
20180404      B20          24505.22    .022      23932.76  -.0234
20190819      B20          26135.79    .027      25479.42  -.024
20200611      B20          25128.17    .06       25015.55  -.001
--------------------------------------------------------------
N=  26 Avg.Gain=  .122   Avg.Paper Loss= -.014
|
|
| |
Charts - 1/18/2023
2022 PEERLESS DJI, Signals, Indicators Daily DJI Volume
10-DayUp/Down Vol Stoch-20 CCI RSI Pct of All Stocks above 65-dma
Inverted Traders Index
DJI-IPA DJI-OBV Short-Term Rates
NASDAQ S&P OEX NYSE DJ-15 DJ-20 DJI-30 Bond Funds
DIA QQQ SPY IWM new - COIN (Bit Coin ETF)
Gold Stocks
TNA Short-Term Rates Ten Year Rates PST (Short Treasuries)
DOLLAR-UUP
ALLSTOCKs
Russell-1000
Insurance-Stocks
Recent 2006 vers-Peerless signals
http://www.tigersoftware.com/OLDPEER/UPD90118.bmp
MDY - http://www.tigersoftware.com/CHARTX/MDY.GIF
USO-CrudeOil DBO FAS GLD HD IBB JETS JNUG KOL NAIL NUGT NRGU OIH
PALL RSX RETL SDS AGQ SLV SOXL TAN TECL TLT TMF TNA UGA USO
China: YINN
CHAU
Commodities: CANE
CORN DBC JJC, NIB CORN, CUT (paper)
MOO, NRGU
SOYB WEAT UUP (Dollar) LIT
(Lithium)
Stocks AA AAPL ADBE ALXN AMAT AMGN AMD AMZN AXP BA BABA
BAC BIDU BLDP CAT CHKP CNX CPB CRM CVX CMG DE DIS ENPH FB FSLR
FTNT GILD GME GOOG GS HD IBM INTU JPM KO KR LRCX MRK MRNA
MOS MSFT NEM NFLX NKE NOC NUE NVDA PANW PG PYPL REGN REV
SO QCOM QDEL TSLA TXN XOM V VRTX WFC WMT XLE ZM ZOM
Leveraged Short ETFs:
FAZ - financials, TZA and SRTY- small caps, MZZ - mid caps, TECS -Techs,
SOXS -
semi-conductors LABD
- Biotechs
Bullish MAXCPs http://www.tigersoftware.com/UPPING/1-18-2023/BULLISH.htm
Bearish MINCPs http://www.tigersoftware.com/Downing/1-18-2023/BEARISH.htm |
|
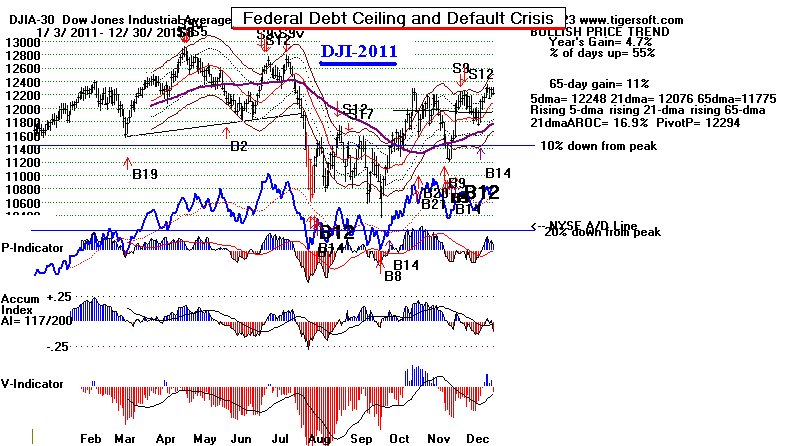 |
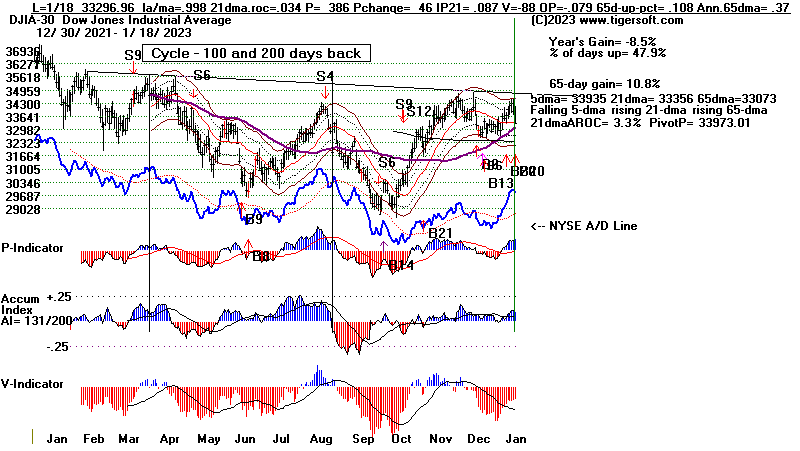 |
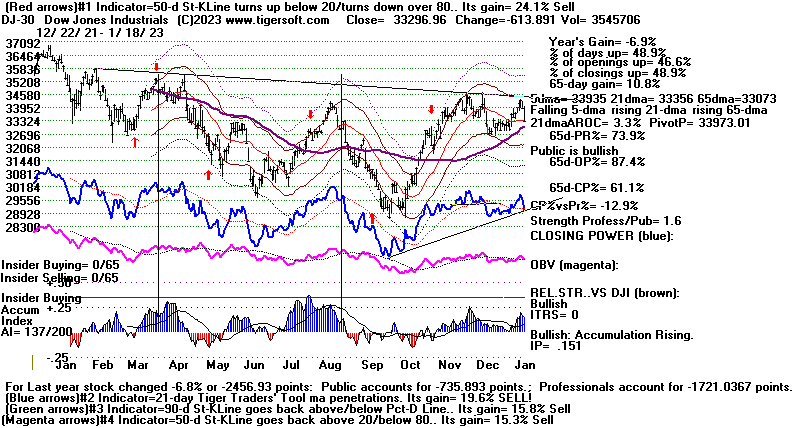 |
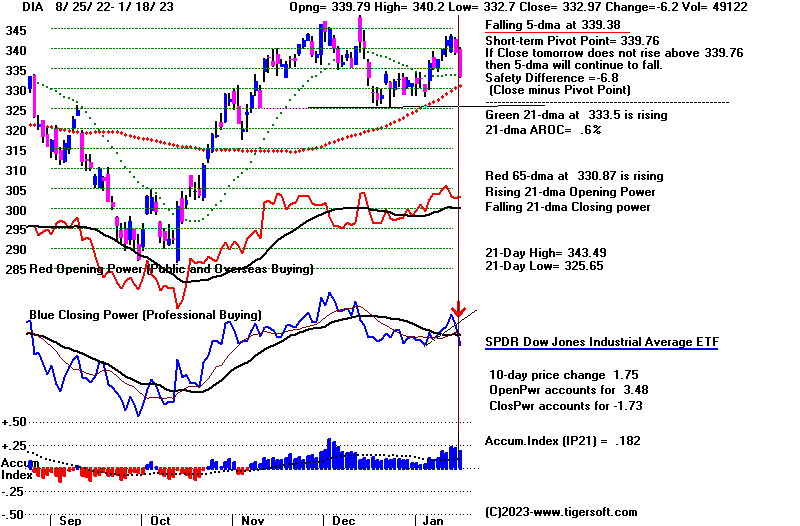 |
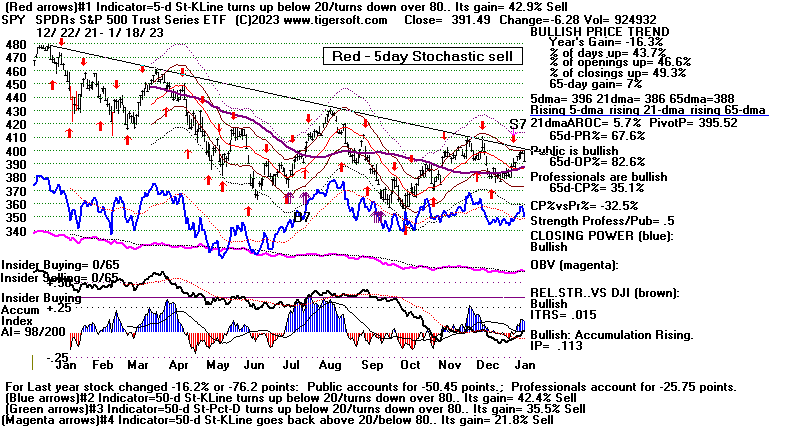 |
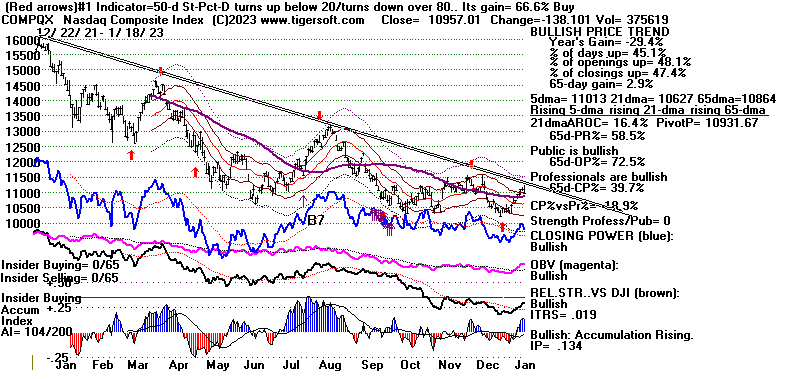 |
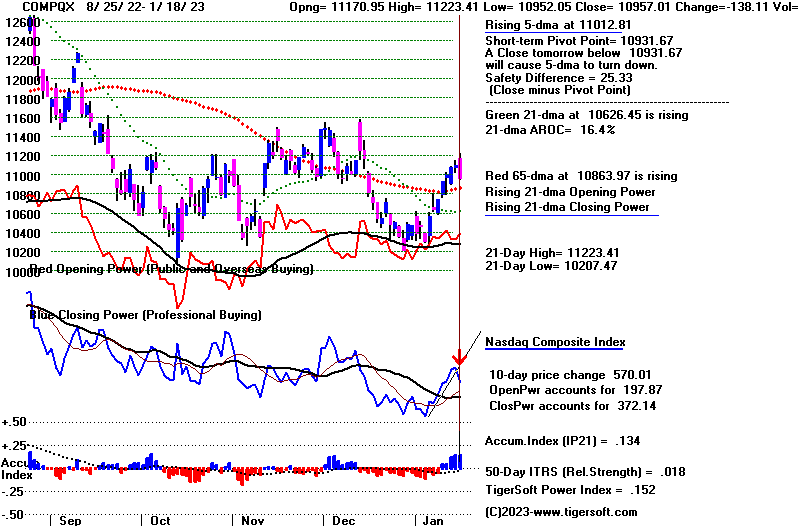 |
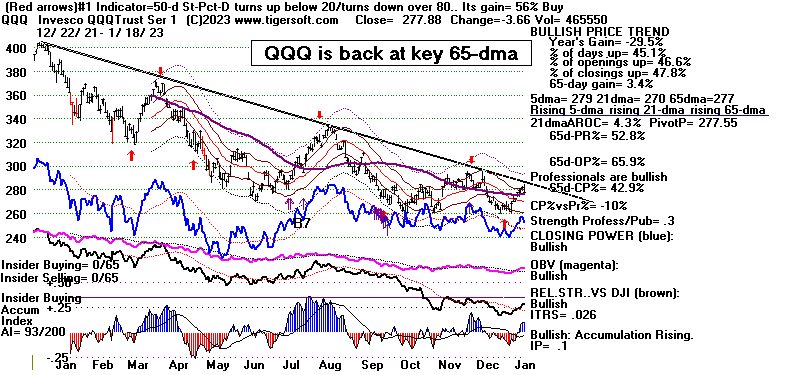 |
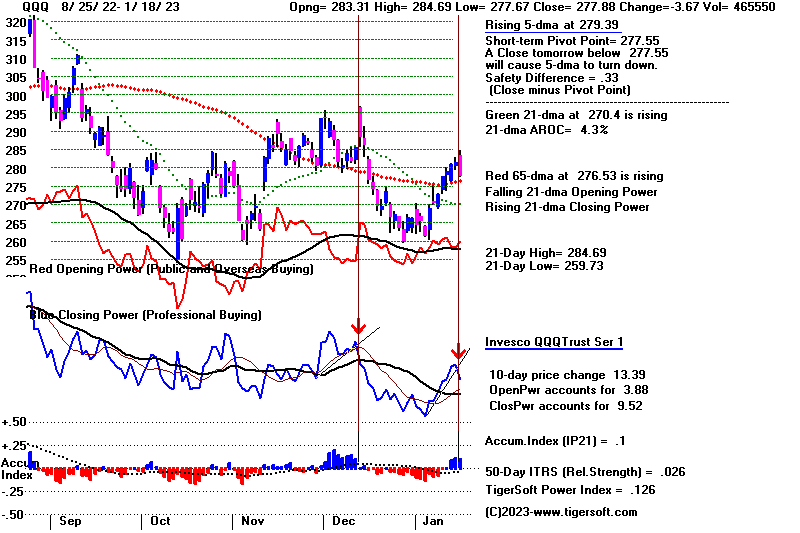 |
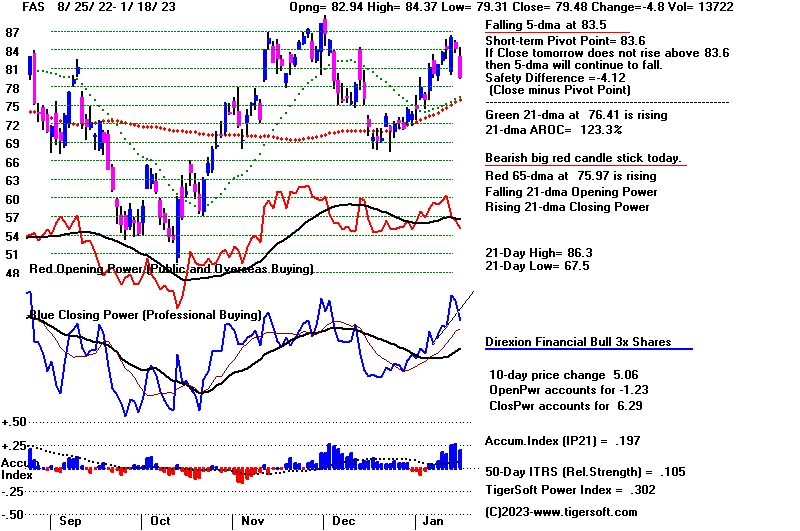 |
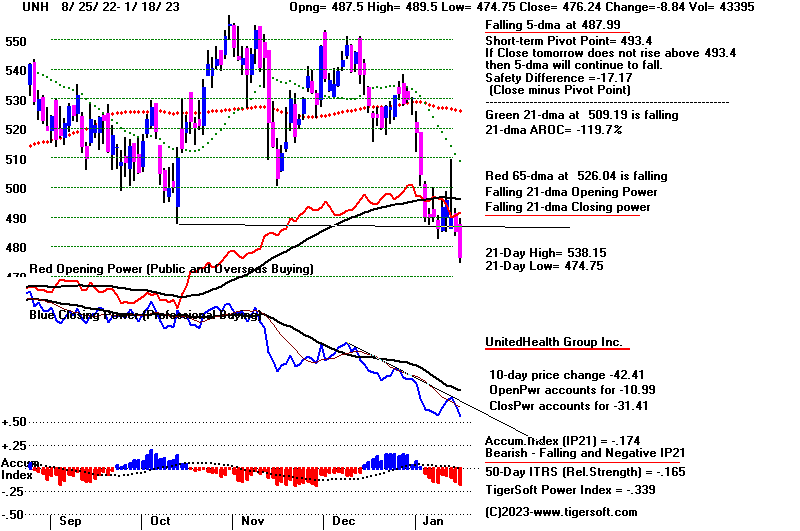 |
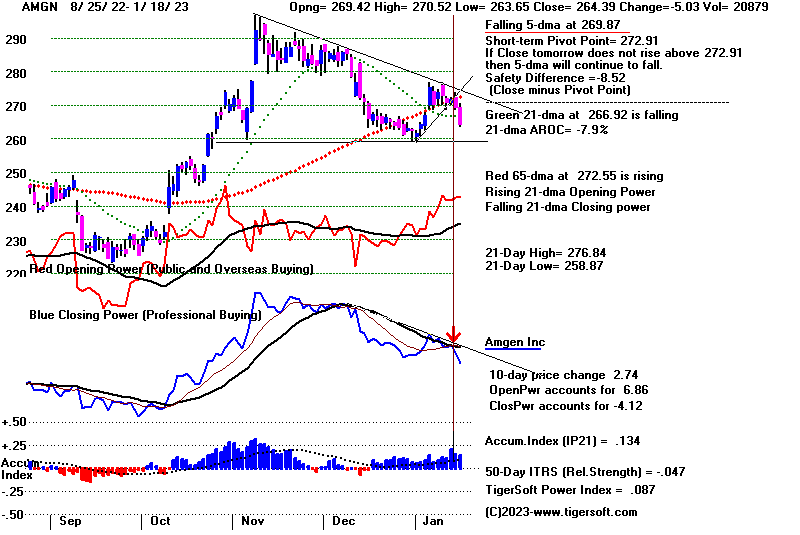 |
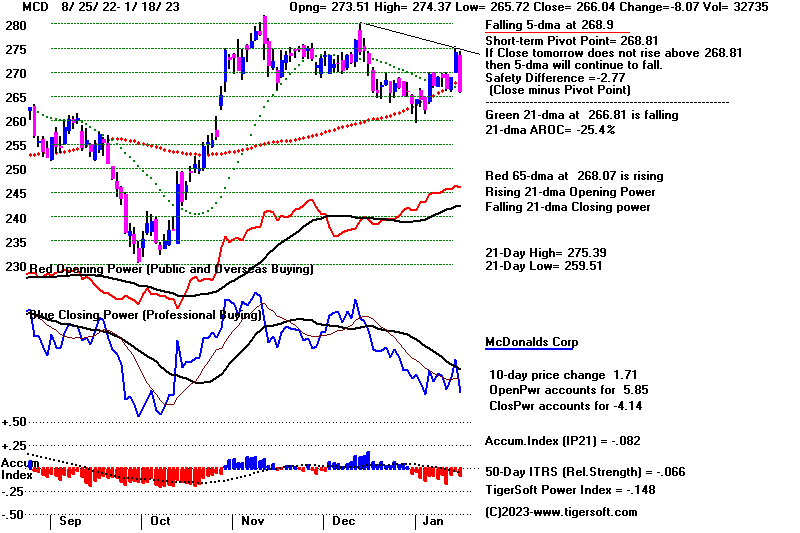 |
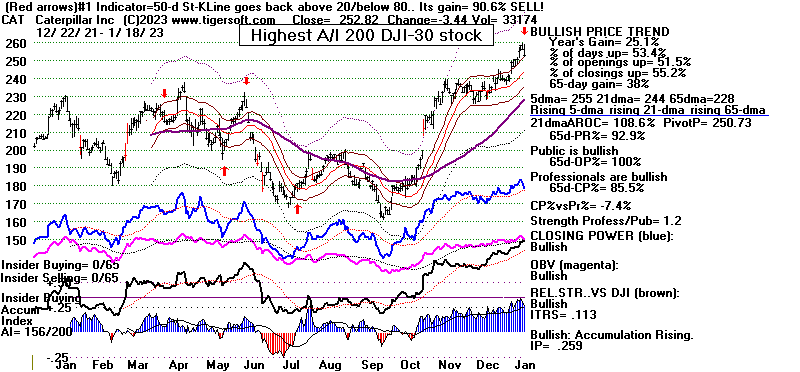 |
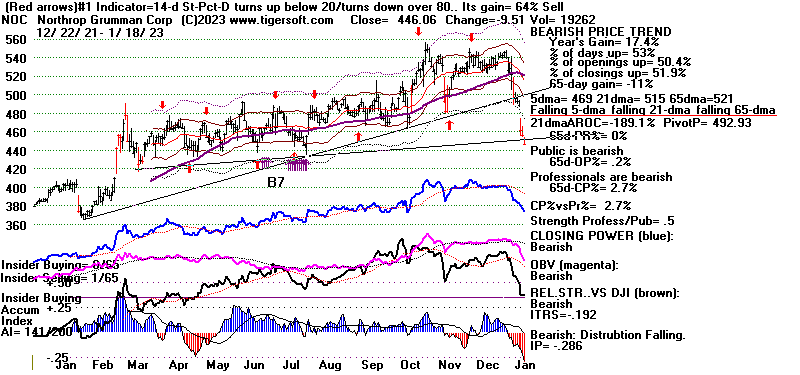 |
Table 1
1/18/2023
DJIA	33296.96	-613.89	-1.81%
S&P 500	3928.86	        -62.11	-1.56%
Nasdaq 	10957.01	-138.10	-1.24%
NYSE Advances	1,077	vs 1,690
Declines	2,041	vs 1,424
New highs	101  +	115 = 216
New lows	8    +  27 = 35
NYSE	Latest Close	Previous Close	Week Ago
Issues traded	3,229	3,218	3,220
Advances	1,077	1,690	2,396
Declines	2,041	1,424	707
Unchanged	111	104	117
New highs	101	126	81
New lows	8	10	5
Adv. volume*	128,638,731	401,699,725	620,774,638
Decl. volume*	747,024,729	480,832,258	226,405,711
Total volume*	887,577,972	891,837,674	857,218,314
Closing Arms (TRIN)†	2.71	1.17	1.29
Block trades*	4,355	4,587	4,640
Adv. volume	687,292,155	2,102,992,140	3,071,681,051
Decl. volume	3,529,549,793	2,080,439,423	1,164,931,419
Total volume	4,298,711,416	4,235,562,719	4,303,366,847
NASDAQ	Latest Close	Previous Close	Week Ago
Issues traded	4,847	4,875	4,854
Advances	1,558	2,406	3,198
Declines	3,090	2,259	1,438
Unchanged	199	210	218
New highs	115	136	127
New lows	27	23	30
Closing Arms (TRIN)†	1.46	0.68	0.52
Block trades	34,494	36,564	36,837
Adv. volume	1,341,823,971	3,100,669,073	4,212,746,375
Decl. volume	3,884,130,966	1,976,809,286	991,903,604
Total volume	5,288,639,185	5,138,416,783	5,284,397,410
|
Table 2 QUICKSILVER on ETFS - 1/18/2023 ---
     Bullish = 8  FAS, RETL,  SOXL, TECL. GLD,  OIH, CPER, YINN (highest 1.6367)
     Bearish = 0
ETF       CLOSE   CHANGE    PIVOT-PT    5-dma AROC    CL-PWR  CANDLE  IP21   ITRS   POWER INDEX
================================================================================================
DIA       332.97  -6.19      339.76       -62.6%     Bearish  RED    .183    --------------
---------------------------------------------------------------------------------------------
COMPQX    10957.01  -138.1   10931.67      97.7%     Bullish  RED    .134    .018     .152
---------------------------------------------------------------------------------------------
SPY       391.49  -6.28      395.52        11.5%     Bullish  RED    .113    .014     .127
---------------------------------------------------------------------------------------------
QQQ       277.88  -3.66      277.55        90.7%     Bullish  RED    .101    .026     .127
---------------------------------------------------------------------------------------------
MDY       463.48  -6.16      464.12        54%       Bullish  RED    .16    .033      .193
---------------------------------------------------------------------------------------------
IWM       183.8  -3.02       182.76        89.1%     Bullish  RED    .2    .002       .202
---------------------------------------------------------------------------------------------
FAS       79.48  -4.8        83.6         -124.5%    Bullish  RED    .198    .105     .303
---------------------------------------------------------------------------------------------
RETL      8.44  -.37         8.71          189.7%    -------  RED    .25    .103      .353
---------------------------------------------------------------------------------------------
SOXL      12.82  -.24        12.4          336.2%    Bullish  RED    .138    .584     .722
---------------------------------------------------------------------------------------------
TECL      24.6  -.97         24.49         264.9%    Bullish  RED    .105    .161     .266
---------------------------------------------------------------------------------------------
IBB       135.26  -1.02      133.99        75.2%     -------  RED    .069    .016     .085
---------------------------------------------------------------------------------------------
GLD       177.08  -.51       174.62        66.3%     Bullish  RED    .171    .126     .297
---------------------------------------------------------------------------------------------
DBO       15.16  -.21        14.98         192.5%    Bullish  RED    .179   -.149     .03
---------------------------------------------------------------------------------------------
OIH       316.64  -13.45     317.74       -21.9%     Bullish  RED    .138    .012     .15
---------------------------------------------------------------------------------------------
CPER     25.57  -.1          25.34         173.9%    Bullish  RED   -.128    .197     .069
---------------------------------------------------------------------------------------------
TAN     81.79  -.5           80.21         294.7%    Bullish  RED    .018    .087     .105
---------------------------------------------------------------------------------------------
UUP       27.55   0          27.75        -36.2%     Bearish  BLUE   .056   -.135    -.079
---------------------------------------------------------------------------------------------
CORN      26.73  -.24        25.98         149.6%    Bullish  RED    .291   -.056     .235
---------------------------------------------------------------------------------------------
WEAT      7.51  -.07         7.49          73.3%     Bullish  RED    .09   -.171     -.081
---------------------------------------------------------------------------------------------
YINN      59.73  -1.92       64.95        -261.2%    Bullish  RED    .123    1.513    1.636
|
 Table 3
             RANKING OF KEY DIRECTORIES BASED PCT.OF STOCKS ABOVE 65-DMA
             1/18/23
Bill;ish = 41
Bearish = 7
---------------------------------------------------------------------------------------
Directory     Current       day-1         day-2         day-3         day-4         day-5
----------------------------------------------------------------------------------------
COPPER         1             1             1             1             1             1
INFRA          .969          1             .969          .939          .939          .878
JETS           .923          .923          1             1             .846          .846
GOLD           .913          .934          .956          .956          .956          .956
BONDFUND       .908          .873          .885          .885          .873          .862
ETFS           .89           .89           .89           .872          .872          .818
HOMEBLDG       .888          .888          .888          .888          .888          .888
SEMI           .872          .882          .882          .84           .819          .819
EDU            .833          .833          1             1             1             1
ELECTRON       .827          .849          .842          .804          .796          .781
INDEXES        .805          .816          .832          .827          .81           .751
INSURANC       .8            .92           .92           .92           .88           .84
CHINA          .795          .818          .818          .795          .795          .772
INDMATER       .791          .805          .833          .833          .833          .777
GREEN          .777          .888          .888          .833          .722          .722
UTILITY        .763          .947          .921          .947          .921          .894
SOLAR          .75           .75           .75           .687          .5            .5
HIGHPRIC       .715          .793          .793          .775          .771          .689
GUNS           .714          .785          .857          .857          .857          .642
HOSPITAL       .714          .785          .785          .714          .714          .642
REIT           .707          .792          .776          .807          .669          .461
CHEM           .697          .744          .767          .79           .767          .744
TRANSP         .684          .736          .789          .789          .736          .736
RUS-1000       .683          .764          .772          .765          .745          .679
                ----
SP500          .664          .763          .773          .779          .779          .709
               ----
AUTO           .66           .698          .716          .773          .716          .66
RETAIL         .659          .723          .68           .68           .659          .595
SOFTWARE       .642          .714          .66           .678          .642          .535
NASD-100       .64           .72           .71           .71           .72           .65
               -----
NIFTY          .636          .681          .681          .681          .681          .568
GAMING         .631          .684          .789          .894          .789          .631
FIDSTKS        .621          .733          .739          .721          .71           .668
FINANCE        .612          .675          .737          .725          .687          .675
BIOTECH        .596          .642          .659          .647          .59           .565
FOOD           .591          .653          .591          .551          .53           .53
LOWPRICE       .59           .624          .624          .578          .55           .504
COMODITY       .589          .641          .589          .589          .564          .589
SP-100         .555          .677          .733          .722          .755          .711
COMPUTER       .55           .65           .7            .65           .75           .75
DOWJONES       .533          .8            .833          .766          .833          .866
               -----
               big drop
OILGAS         .504          .609          .6            .58           .523          .523
=============================================================================================
HACKERS        .5            .375          .437          .375          .375          .312
=============================================================================================
BEVERAGE       .428          .571          .571          .571          .571          .571
BIGBANKS       .428          .428          .714          .571          .571          .571
MILITARY       .384          .576          .692          .692          .653          .576
COAL           .333          .5            .333          .333          .166          .166
REGBANKS       .32           .36           .52           .48           .36           .4
DJI-13         .307          .615          .692          .615          .769          .846
MARIJUAN       .3            .3            .4            .3            .2            .1
|
==============================================================================
Wednesday
- 5:57 AM - Futures: DJI +40 NASDAQ +50 Data
Used: 1/17/2023
| |
1/17/2023 DJIA 33910.85 -391.76 -1.14%
S&P 500 3990.97 -8.12 -0.20%
Nasdaq 11095.11 15.96 0.14%
Advances 1,690 1,925 2,219
Declines 1,424 1,167 877
New highs 126 136 = 262
New lows 10 23 = 33
|
|
| |
The two most
heavily weighted DJI stocks in the DJI, UNH and
and GS, just by themselves,
accounted for nearly 200 of the DJI
sell-off today. Profit-taking
in other DJI stocks accounted for the
rest as the DJIA's retreat back
from the resistance-line at 34,500 shown
below. The Peerless Buys
still are viable. There were only 266 more
down than up and there was no new
Sell signal in easy sight. The key
ETFs Closing Powers are all still
rising.
The NASDAQ and QQQ, according
to our ITRS (50-day Relative
Strength) have caught up with
the DJI. They managed small gains
gains and were unphased by
the big drop in the DJI. Clearly, money is
now being switch from blue
chips into beaten down techs. Signficantly,
MSFT rose back above its
65-dma resistance. Now we need to see
Facebook, Google, Intuit,
Paypal and Wells Fargo do the same. Watch
them.
Can the markets ignore the
threat of a Federal Government default
on its debt if Congress does
not pass a debt limit incease? Many
pundits (NY Times tonight,
for example) believe the markets have
not factored this is.
They correctly recall that it was the leading
indexes' 17% percent decline
in August 2011 that convinced Congress
to pass a bill to expland the
debt limit. By their thinking, the DJI
will need to sell off again
before Congress will raise the debt limit.
This may be true, but
Professionals are net-buyers now as is "big
money", measured by our
Accumulation Index (IP21). That
was not true at the top back
at the top in 2011. Apparently, Professionals
are pleased with the recovery
and intend to "milk" it further. So, shall
we until Peerless gives a
Sell.
Look below at the chart of
IWM below. See how it has already broken
above its downtrend-line
going back to the start of last year. As
a result, we see a number of
beaten-down secondary stocks coming
back strongly in our Bullish
MAXCP charts. Now the SP-500,
QQQ and NASDAQ are challnging
their year-long price-downtrendlines.
See these below. If
these resistance-lines can be broken above, I
would expect a lot more
buying of beaten-down stock turnarounds.
Note how far many of the
Bullish MAXCPs might rise if they were
to get back to their five
year highs. The stocks in this list that show
very high Accumulation should
be bought with the expectation that
we will see trend-breaks in
the NASDAQ, QQQ and SP-500.
The bullish seasonality and
Professional buying are trumping the
relative low volume of the
recovery. The market, in my judgement
is facing a potential credit
default with surprising bullishness. Either
Professionals trust the FED
will ease off the rate hikes or Putin will
find a way to end his
war on Ukraine in a few months.
|
|
| |
Charts - 1/17/2023
2022 PEERLESS DJI, Signals, Indicators Daily DJI Volume
10-DayUp/Down Vol Stoch-20 CCI RSI Pct of All Stocks above 65-dma
Inverted Traders Index
DJI-IPA DJI-OBV Short-Term Rates
NASDAQ S&P OEX NYSE DJ-15 DJ-20 DJI-30 Bond Funds
DIA QQQ SPY IWM new - COIN (Bit Coin ETF)
Gold Stocks
TNA Short-Term Rates Ten Year Rates PST (Short Treasuries)
DOLLAR-UUP
ALLSTOCKs
Russell-1000
Insurance-Stocks
Recent 2006 vers-Peerless signals
http://www.tigersoftware.com/OLDPEER/UPD90117.bmp
MDY - http://www.tigersoftware.com/CHARTX/MDY.GIF
USO-CrudeOil DBO FAS GLD HD IBB JETS JNUG KOL NAIL NUGT NRGU OIH
PALL RSX RETL SDS AGQ SLV SOXL TAN TECL TLT TMF TNA UGA USO
China: YINN
CHAU
Commodities: CANE
CORN DBC JJC, NIB CORN, CUT (paper)
MOO, NRGU
SOYB WEAT UUP (Dollar) LIT
(Lithium)
Stocks AA AAPL ADBE ALXN AMAT AMGN AMD AMZN AXP BA BABA
BAC BIDU BLDP CAT CHKP CNX CPB CRM CVX CMG DE DIS ENPH FB FSLR
FTNT GILD GME GOOG GS HD IBM INTU JPM KO KR LRCX MRK MRNA
MOS MSFT NEM NFLX NKE NOC NUE NVDA PANW PG PYPL REGN REV
SO QCOM QDEL TSLA TXN XOM V VRTX WFC WMT XLE ZM ZOM
Leveraged Short ETFs:
FAZ - financials, TZA and SRTY- small caps, MZZ - mid caps, TECS -Techs,
SOXS -
semi-conductors LABD
- Biotechs
Bullish MAXCPs http://www.tigersoftware.com/UPPING/1-17-2023/BULLISH.htm
Bearish MINCPs http://www.tigersoftware.com/Downing/1-17-2023/BEARISH.htm |
|
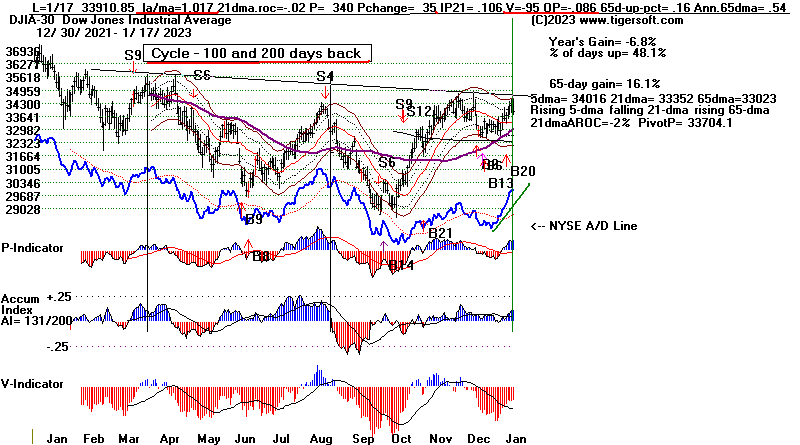 |
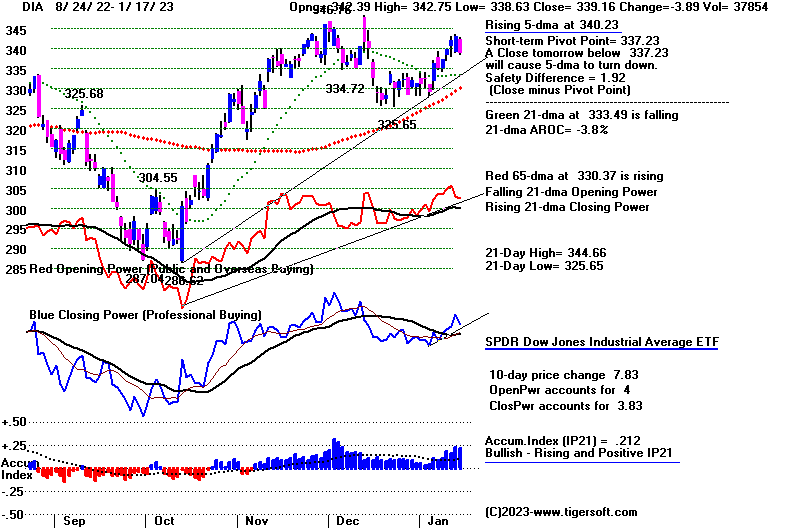 |
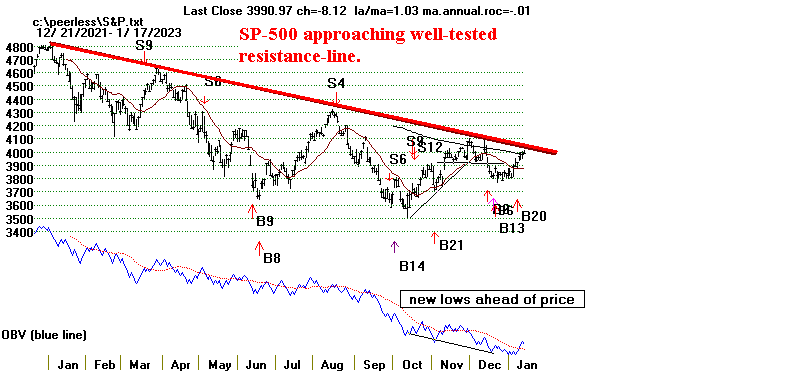 |
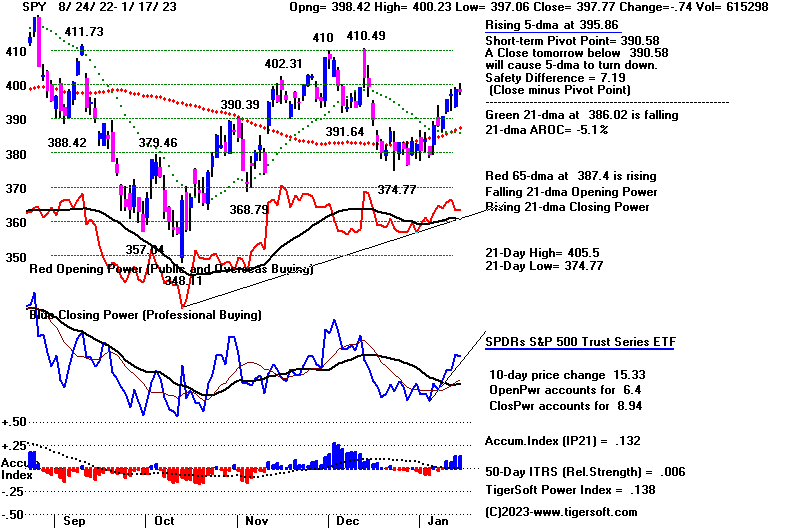 |
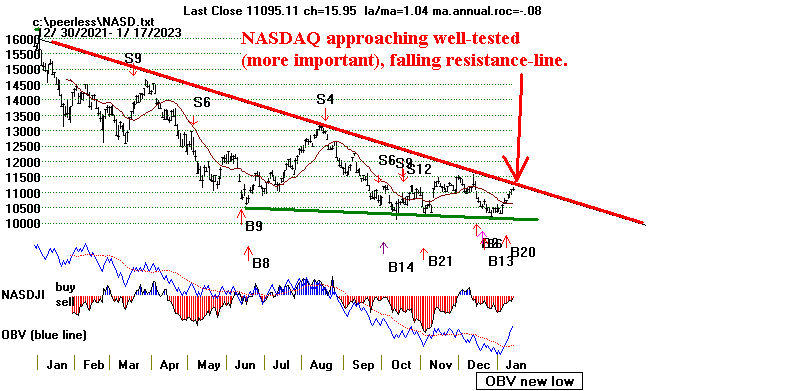 |
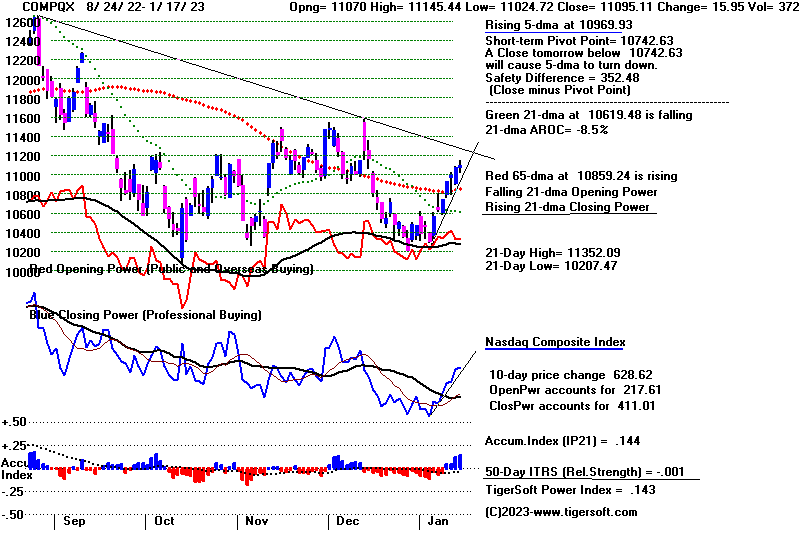 |
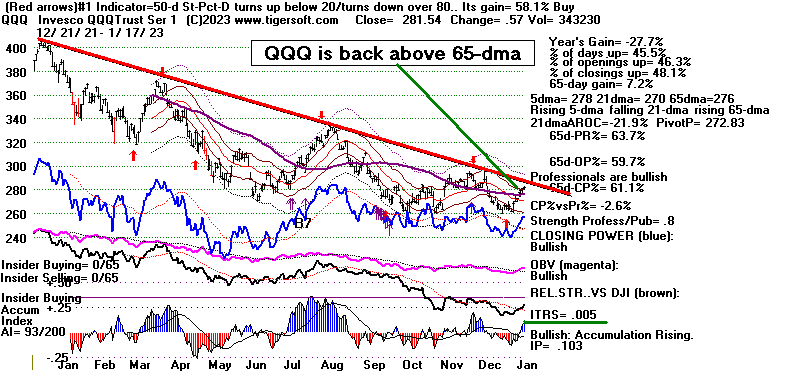 |
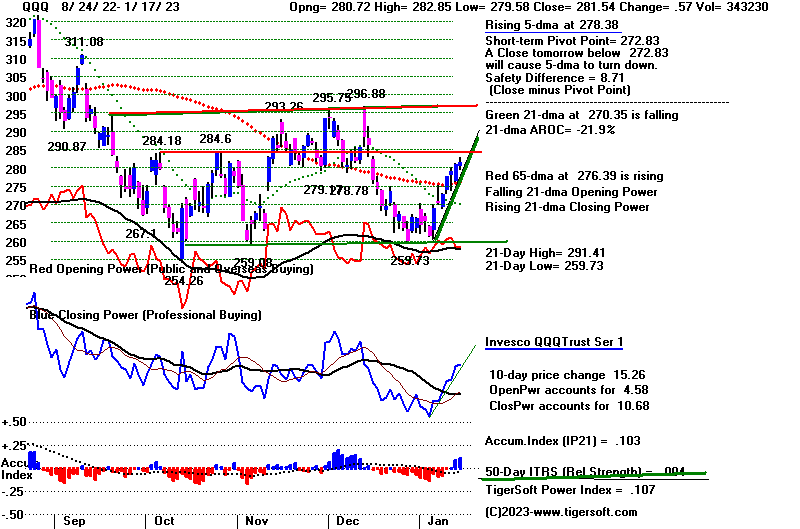 |
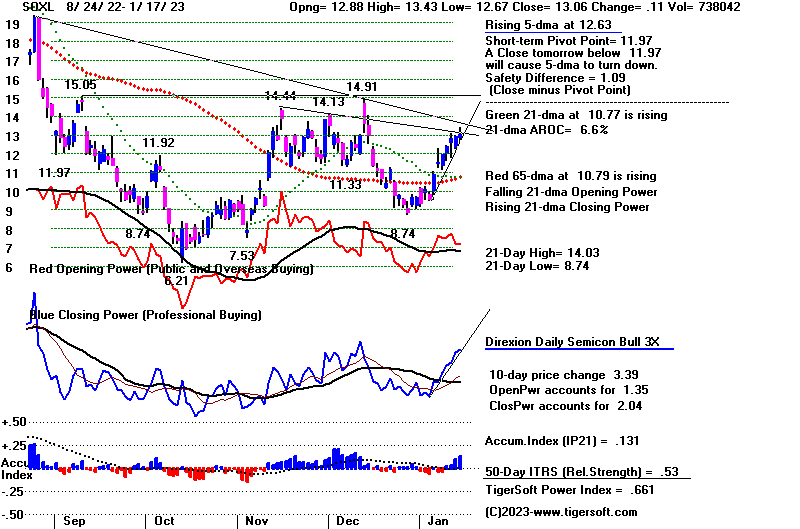 |
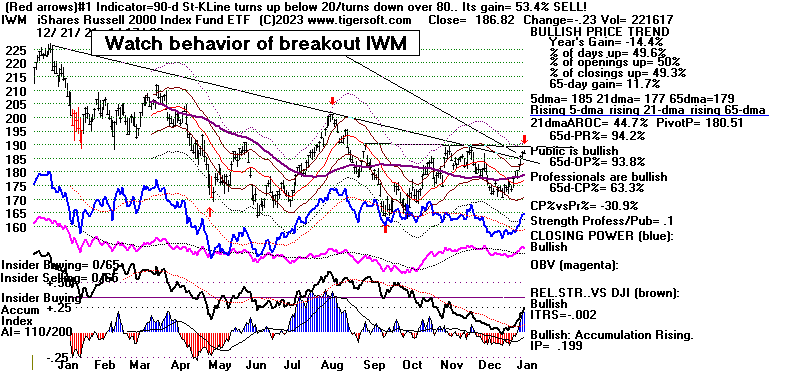 |
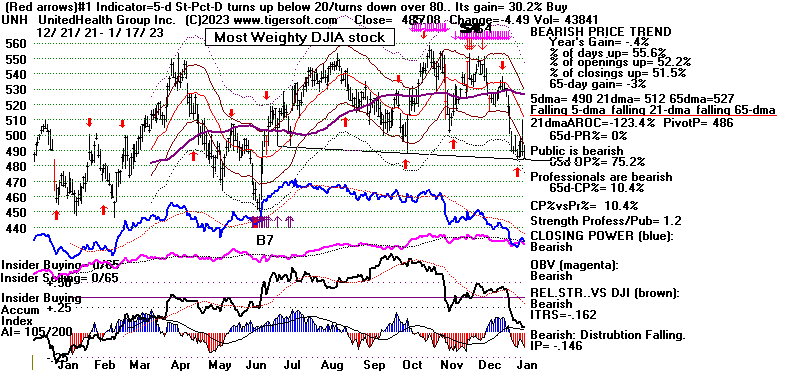 |
 |
1/17/2023
   DJIA	      33910.85	-391.76	-1.14%
   S&P 500     3990.97	-8.12	-0.20%
   Nasdaq     11095.11	15.96	 0.14%
   NYSE	Latest Close	Previous Close	Week Ago
Issues traded	3,218	3,205	3,211
Advances	1,690	1,925	2,219
Declines	1,424	1,167	877
Unchanged	104	113	115
New highs	126	104	61
New lows	10	6	6
Adv. volume*	401,699,725	471,814,968	576,499,853
Decl. volume*	480,832,258	295,435,461	185,398,824
Total volume*	891,837,674	774,903,426	779,395,947
Closing Arms (TRIN)†	1.17	1.06	0.73
Block trades*	4,587	4,094	4,246
Adv. volume	2,102,992,140	2,379,811,255	2,910,234,212
Decl. volume	2,080,439,423	1,522,407,875	839,364,173
Total volume	4,235,562,719	3,939,706,459	3,851,036,239
  NASDAQ	Latest Close	Previous Close	Week Ago
Issues traded	4,875	4,844	4,783
Advances	2,406	2,895	3,247
Declines	2,259	1,671	1,326
Unchanged	210	278	210
New highs	136	121	102
New lows	23	19	39
Closing Arms (TRIN)†	0.68	1.25	0.60
Block trades	36,564	34,314	32,689
Adv. volume	3,100,669,073	2,908,204,732	3,707,433,054
Decl. volume	1,976,809,286	2,104,475,210	914,818,242
|
Table 2 QUICKSILVER on ETFS - 1/17/2023 ---
     Bullish = 7  FAS, RETL,  SOXL, GLD,  OIH, CPER, YINN (highest 1.77)
     Bearish = 0
ETF       CLOSE   CHANGE    PIVOT-PT    5-dma AROC    CL-PWR  CANDLE  IP21   ITRS   POWER INDEX
================================================================================================
DIA       339.16  -3.88      337.23        57%        Bullish  RED    .212    0     --------
---------------------------------------------------------------------------------------------
COMPQX    11095.11   15.95   10742.63      211.2%     Bullish  BLUE   .144   -.001     .143
---------------------------------------------------------------------------------------------
SPY       397.77  -.73       390.58        125.8%     Bullish  RED    .133    .006     .139
---------------------------------------------------------------------------------------------
QQQ       281.54   .57       272.83        199.1%     Bullish  BLUE   .104    .004     .108
---------------------------------------------------------------------------------------------
MDY       469.64  -1.01      458.44        168.7%     Bullish  RED    .179    .03      .209
---------------------------------------------------------------------------------------------
IWM       186.82  -.23       180.51        244.5%     Bullish  RED    .2     -.003      .197
---------------------------------------------------------------------------------------------
FAS       84.28  -1.64       81.57         251%       Bullish  RED    .261    .121     .382
---------------------------------------------------------------------------------------------
RETL      8.81  -.14         8.11          697.1%     Bullish  ----   .305    .161     .466
---------------------------------------------------------------------------------------------
SOXL      13.06   .11        11.97         620.2%     Bullish  BLUE   .132    .53      .662
---------------------------------------------------------------------------------------------
TECL      25.57   .33        23.29         558.2%     -------  BLUE   .122    .084     .206
---------------------------------------------------------------------------------------------
IBB       136.28   .05       133.23        224.3%     -------  BLUE   .093    .013     .106
---------------------------------------------------------------------------------------------
GLD       177.59  -1.17      174.74        99.3%      Bullish  RED    .165    .11      .275
---------------------------------------------------------------------------------------------
DBO       15.37   .05        14.58         248.1%     Bullish  RED    .178   -.161     .017
---------------------------------------------------------------------------------------------
OIH       330.09   2.15      318.06        278.8%     Bullish  BLUE   .256    .075     .331
---------------------------------------------------------------------------------------------
CPER     25.67   .12         24.69         275.7%     Bullish  BLUE   .125    .183     .308
---------------------------------------------------------------------------------------------
TAN     82.29   .55          77.04         479.3%     Bullish  BLUE  -.043    .121     .078
---------------------------------------------------------------------------------------------
UUP       27.55   .08        27.75        -32.6%      Bearish  BLUE   .067   -.142    -.075
---------------------------------------------------------------------------------------------
CORN      26.97   .34        25.94         200.4%     Bullish  BLUE   .364   -.069     .295
---------------------------------------------------------------------------------------------
WEAT      7.58   .07         7.4           33.4%      Bullish  BLUE   .124   -.179    -.055
---------------------------------------------------------------------------------------------
YINN      61.65  -4.23       63.06         48.7%      Bullish  RED    .119    1.651     1.77
|
Table 3 RANKING OF KEY DIRECTORIES BASED PCT.OF STOCKS ABOVE 65-DMA
1/17/23
Bullish = 44
Bearish = 4
---------------------------------------------------------------------------------------
Directory Current day-1 day-2 day-3 day-4 day-5
----------------------------------------------------------------------------------------
COPPER 1 1 1 1 1 .857
INFRA 1 .969 .939 .939 .878 .878
UTILITY .947 .921 .947 .921 .894 .842
GOLD .934 .956 .956 .956 .956 .891
JETS .923 1 1 .846 .846 .769
INSURANC .92 .92 .92 .88 .84 .84
ETFS .89 .89 .872 .872 .836 .818
GREEN .888 .888 .833 .722 .722 .666
HOMEBLDG .888 .888 .888 .888 .888 .833
SEMI .882 .882 .84 .819 .808 .797
BONDFUND .873 .885 .885 .873 .873 .862
ELECTRON .849 .842 .804 .796 .774 .751
EDU .833 1 1 1 1 1
CHINA .818 .818 .795 .795 .772 .772
INDEXES .816 .832 .827 .81 .756 .708
INDMATER .805 .833 .833 .833 .763 .722
DOWJONES .8 .833 .766 .833 .866 .766
=====
HIGHPRIC .793 .793 .775 .771 .693 .637
REIT .792 .769 .815 .676 .469 .5
GUNS .785 .857 .857 .857 .642 .642
HOSPITAL .785 .785 .714 .714 .642 .642
RUS-1000 .764 .772 .765 .745 .685 .654
SP500 .763 .773 .779 .775 .721 .69
======
SOLAR .75 .75 .687 .5 .5 .375
CHEM .744 .767 .79 .767 .744 .744
TRANSP .736 .789 .789 .736 .736 .631
FIDSTKS .733 .739 .721 .71 .674 .633
RETAIL .723 .68 .68 .659 .595 .51
NASD-100 .72 .71 .71 .72 .66 .64
=====
SOFTWARE .714 .678 .678 .642 .535 .589
AUTO .698 .716 .773 .716 .679 .547
GAMING .684 .789 .842 .842 .631 .526
NIFTY .681 .681 .681 .681 .568 .522
SP-100 .677 .733 .722 .755 .711 .655
FINANCE .675 .737 .725 .675 .687 .637
FOOD .653 .591 .53 .53 .53 .448
COMPUTER .65 .7 .65 .75 .75 .7
BIOTECH .642 .656 .65 .59 .562 .488
COMODITY .641 .589 .564 .564 .589 .538
LOWPRICE .624 .627 .581 .55 .504 .464
DJI-13 .615 .692 .615 .769 .846 .692
OILGAS .609 .6 .58 .523 .523 .485
MILITARY .576 .692 .692 .653 .576 .5
BEVERAGE .571 .571 .571 .571 .571 .642
=============================================================================================
COAL .5 .333 .333 .166 .166 .333
=============================================================================================
BIGBANKS .428 .714 .571 .571 .571 .571
HACKERS .375 .437 .375 .375 .312 .375
REGBANKS .36 .52 .48 .36 .4 .36
MARIJUAN .3 .4 .3 .2 .1 .1
|
==============================================================================
Tuesday
- 6:00 AM - Futures: DJI -246 NASDAQ -139
Data Used: 1/13/2023
| |
          1/13/2023
DJIA	34189.97	216.96	+0.64%
S&P 500	3983.17	        13.56	+0.34%
Nasdaq 	11001.10	69.43	+0.64%
Advances	2,372	vs   2,396
Declines	746	vs   707
New highs	108 + 139 =  247
New lows	12  + 26  =  42
|
|
| |
The DJI rebounded
from being down 200 to being up 217 at the close on
Friday. Seasonality remains
quite bullish. Peerless shows a set of Buys.
The Closing Powers for DIA, SPY,
QQQ and the NASDAQ are all rising.
The positive P-Indicator and
Accumulation Index will prevent a Sell S9 and
a Sell S12. We can not get a
Sell S9-v until late April. These are all
bullish considerations.
But bearishly the volume is not
rising, the V-Indicator is a -105, the OBVPct is -.091
and the DJI closed in over-bought
territory 2.8% over its 21-day ma. With
low volume it will be hard to eat
up the overhead resistance now. In particular,
SPY has now reached its falling
200-day ma. Watch it and MSFT which is still
struggling to get past its 65-dma.
And although three of the highest priced,
most heavily weighted DJI-30 stocks
(GS, CAT and HD) are rising, we also see that
the most heavily weighted United
Health fell on Friday and has a declining Closing
Power as does AMGEN, another high
priced DJI stock.
I tried to find past examples where
the volume indicators were nearly as weak
as we now see for the Peerless DJI
chart below while the breadth and IP21
were as positive. I found
only one such case since 1929. That was on June 2, 2022.
In its case, the DJI immediately
fell 8.2% before there was a reversing Buy signal.
This instance occurred as
seasonality was weakening. In our case, after January 16th
in Presidential Elections, the DJI
rose 66.7% of the time after the next 5 trading
days, 73.3% of the time after a
month, 86.7% of the time after two months and 93.3%
after 3 months.
Even though, we are not likely to
get a Sell S9 or Sell S12, there are other
Sell signals that have taken place
in January since 1929. Those include an Sell S4.
That is a possibility if the
current IP21 were to drop below its 21-day ma on the
DJI.
My conclusion is to sell leveraged
long ETFs like SOXL, but stay long DIA, CAT
and the strongest MAXCPs as long as
their Closing Power 21-day ma are rising.
|
|
| |
Charts - 1/13/2023
2022 PEERLESS DJI, Signals, Indicators Daily DJI Volume
10-DayUp/Down Vol Stoch-20 CCI RSI Pct of All Stocks above 65-dma
Inverted Traders Index
DJI-IPA DJI-OBV Short-Term Rates
NASDAQ S&P OEX NYSE DJ-15 DJ-20 DJI-30 Bond Funds
DIA QQQ SPY IWM new - COIN (Bit Coin ETF)
TNA Short-Term Rates Ten Year Rates PST (Short Treasuries)
DOLLAR-UUP
ALLSTOCKs
Russell-1000
Insurance-Stocks
Recent 2006 vers-Peerless signals
http://www.tigersoftware.com/OLDPEER/UPD90113.bmp
MDY - http://www.tigersoftware.com/CHARTX/MDY.GIF
USO-CrudeOil DBO FAS GLD HD IBB JETS JNUG KOL NAIL NUGT NRGU OIH
PALL RSX RETL SDS AGQ SLV SOXL TAN TECL TLT TMF TNA UGA USO
China: YINN
CHAU
Commodities: CANE
CORN DBC JJC, NIB CORN, CUT (paper)
MOO, NRGU
SOYB WEAT UUP (Dollar) LIT
(Lithium)
Stocks AA AAPL ADBE ALXN AMAT AMGN AMD AMZN AXP BA BABA
BAC BIDU BLDP CAT CHKP CNX CPB CRM CVX CMG DE DIS ENPH FB FSLR
FTNT GILD GME GOOG GS HD IBM INTU JPM KO KR LRCX MRK MRNA
MOS MSFT NEM NFLX NKE NOC NUE NVDA PANW PG PYPL REGN REV
SO QCOM QDEL TSLA TXN XOM V VRTX WFC WMT XLE ZM ZOM
Leveraged Short ETFs:
FAZ - financials, TZA and SRTY- small caps, MZZ - mid caps, TECS -Techs,
SOXS -
semi-conductors LABD
- Biotechs
Bullish MAXCPs http://www.tigersoftware.com/UPPING/1-13-2023/BULLISH.htm
Bearish MINCPs http://www.tigersoftware.com/Downing/1-13-2023/BEARISH.htm |
|
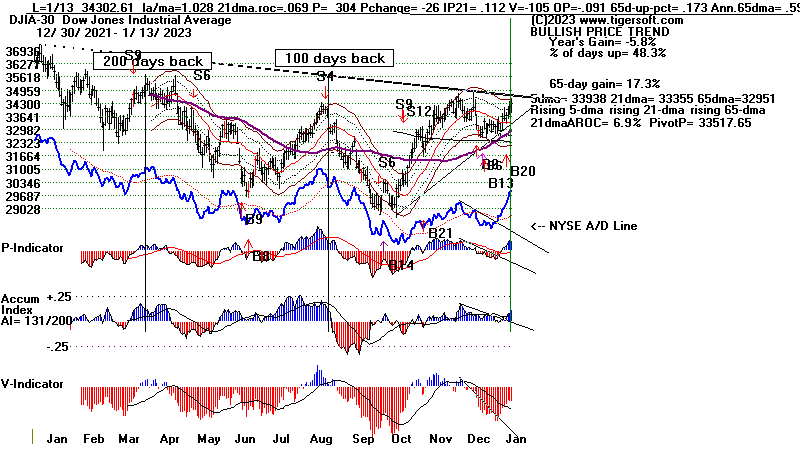 |
 |
SPY has reached falling 200-dma
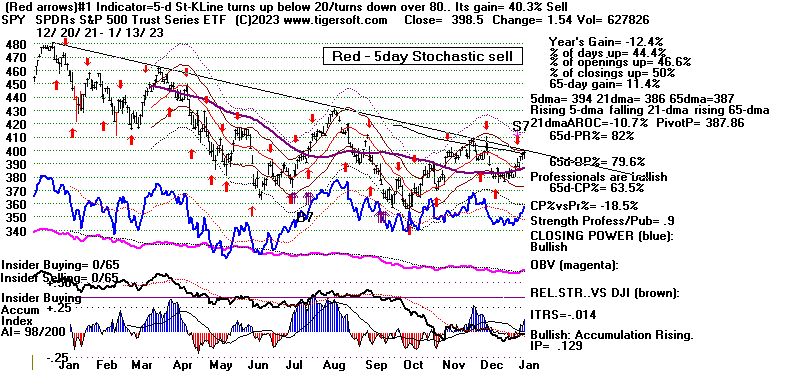 |
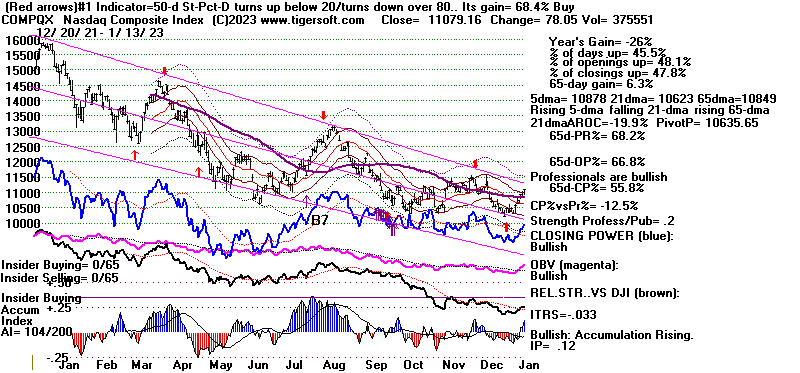 |
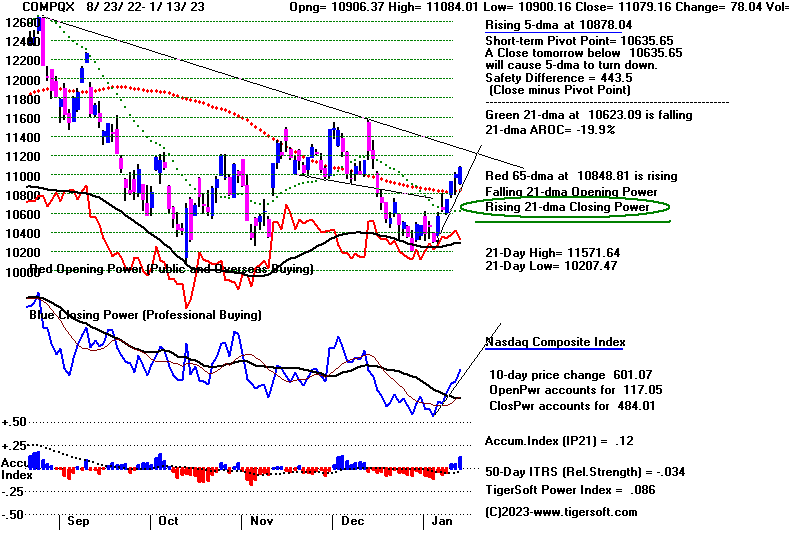 |
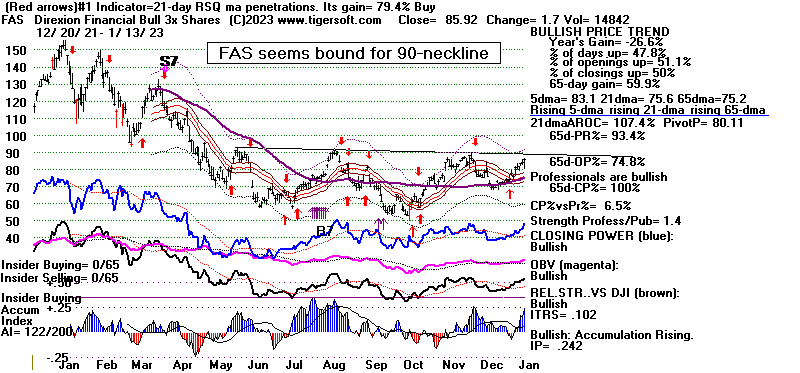 |
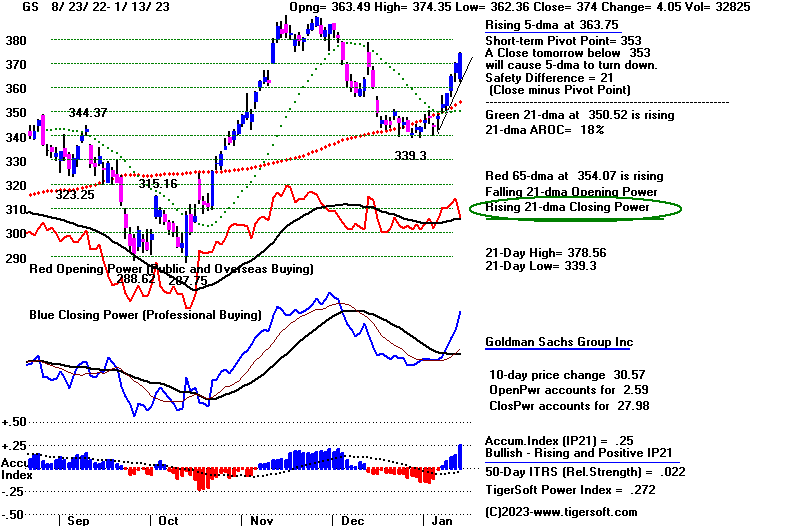 |
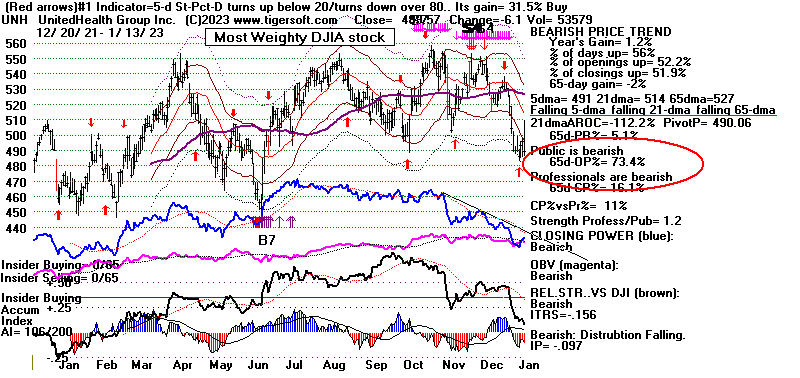 |
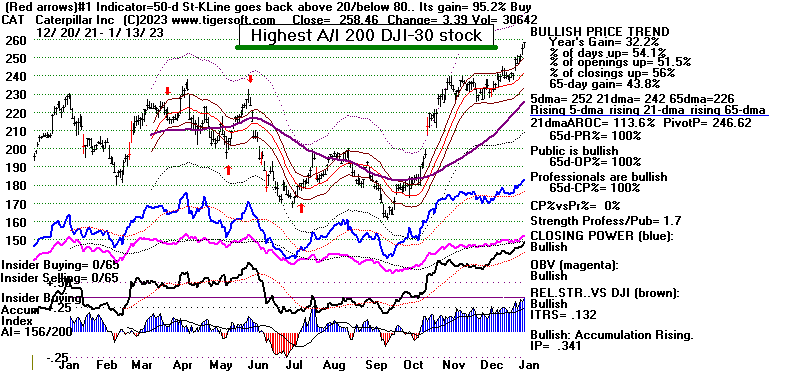 |
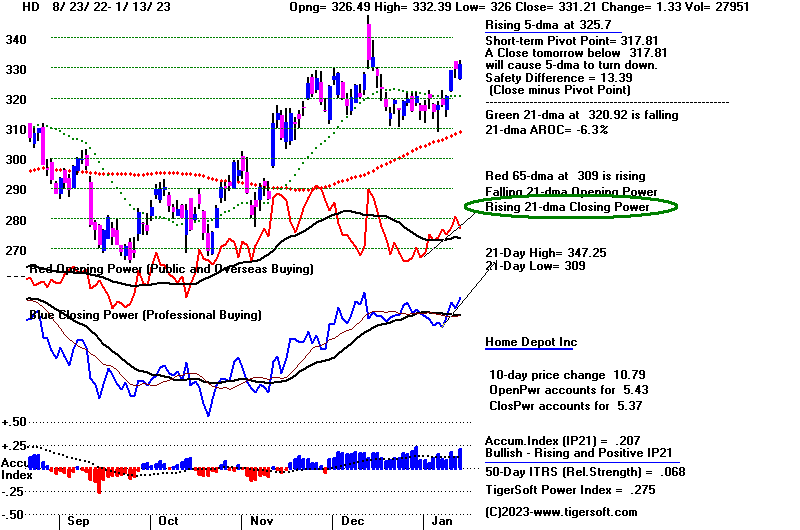 |
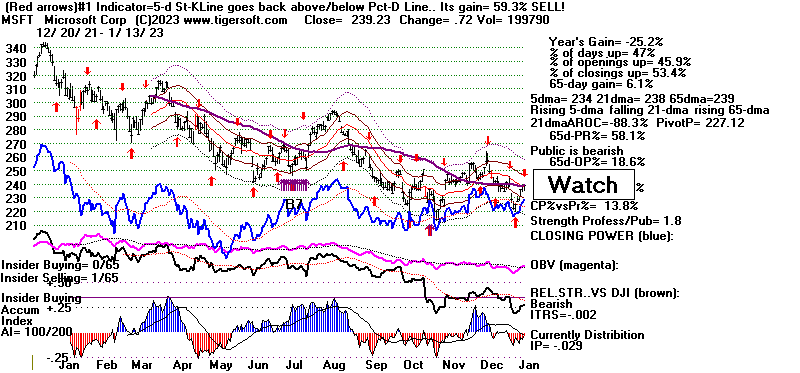 |
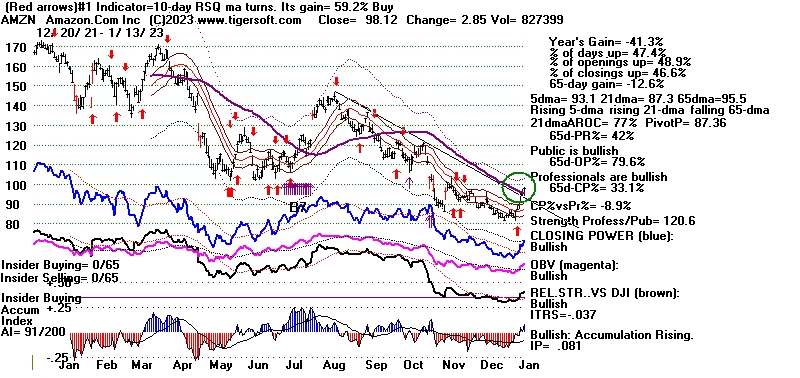 |
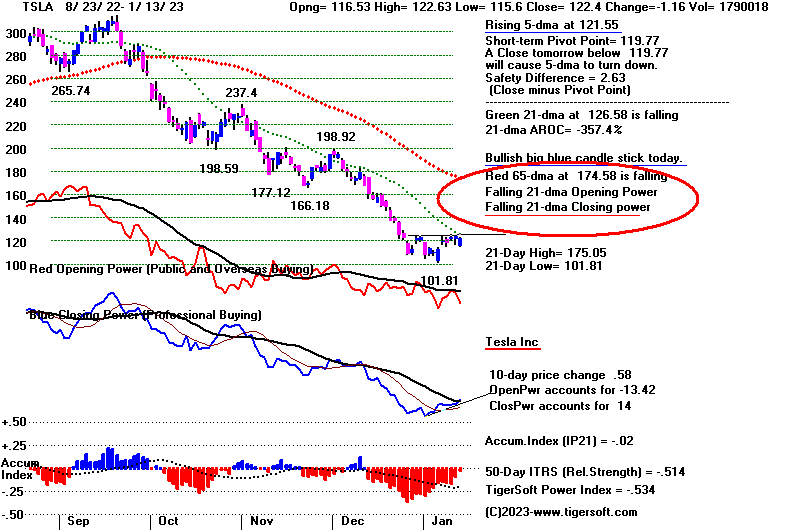 |
Table 1 - Breadth and Volume Statistics. 1/12/2023
DJIA 34189.97 216.96 +0.64%
S&P 500 3983.17 13.56 +0.34%
Nasdaq 11001.10 69.43 +0.64%
Advances 2,372 vs 2,396
Declines 746 vs 707
New highs 108 + 139 = 247
New lows 12 + 26 = 42
NYSE Latest Close Previous Close Week Ago
Issues traded 3,225 3,220 3,235
Advances 2,372 2,396 1,293
Declines 746 707 1,831
Unchanged 107 117 111
New highs 108 81 64
New lows 12 5 37
Adv. volume* 639,502,729 620,774,638 335,046,086
Decl. volume* 210,754,548 226,405,711 527,903,261
Total volume* 861,651,544 857,218,314 867,785,830
Closing Arms (TRIN)† 0.93 1.29 0.90
Block trades* 4,423 4,640 4,272
Adv. volume 3,390,118,981 3,071,681,051 1,703,063,575
Decl. volume 994,104,614 1,164,931,419 2,160,135,607
Total volume 4,440,261,643 4,303,366,847 3,893,457,747
NASDAQ Latest Close Previous Close Week Ago
Issues traded 4,794 4,854 4,821
Advances 3,269 3,198 1,892
Declines 1,308 1,438 2,720
Unchanged 217 218 209
New highs 139 127 106
New lows 26 30 90
Closing Arms (TRIN)† 0.98 0.52 0.96
Block trades 40,660 36,837 32,833
Adv. volume 4,035,847,518 4,212,746,375 1,976,420,487
Decl. volume 1,588,522,892 991,903,604 2,733,905,411
Total volume 5,681,244,198 5,284,397,410 4,764,276,405
|
Table 2 QUICKSILVER on ETFS - 1/13/2023 ---
Bullish = 6 FAS, RETL, SOXL, GLD, OIH, YINN (highest)
Bearish = 0
ETF CLOSE CHANGE PIVOT-PT 5-dma AROC CL-PWR CANDLE IP21 ITRS POWER INDEX
================================================================================================
DIA 343.04 1.04 335.29 100% Bullish BLUE .225 ==============
---------------------------------------------------------------------------------------------
COMPQX 11079.16 78.05 10635.65 236.6% Bullish BLUE .121 -.034 .087
---------------------------------------------------------------------------------------------
SPY 398.5 1.54 387.86 133% Bullish BLUE .13 -.015 .115
---------------------------------------------------------------------------------------------
QQQ 280.97 1.92 270.54 222.3% ------- BLUE .082 -.03 .052
---------------------------------------------------------------------------------------------
MDY 470.65 2.29 454.01 179.6% Bullish BLUE .184 .005 .189
---------------------------------------------------------------------------------------------
IWM 187.05 1.22 177.88 261.7% Bullish BLUE .188 -.032 .156
---------------------------------------------------------------------------------------------
FAS 85.92 1.7 80.11 295.3% Bullish BLUE .243 .101 .344
---------------------------------------------------------------------------------------------
RETL 8.95 .03 7.63 748.4% Bullish BLUE .315 .033 .348
---------------------------------------------------------------------------------------------
SOXL 12.95 .13 11.53 872.6% Bullish BLUE .101 .372 .473
---------------------------------------------------------------------------------------------
TECL 25.24 .2 22.87 662.1% ------- BLUE .086 -.043 .043
---------------------------------------------------------------------------------------------
IBB 136.23 1.12 130.28 116% ------- BLUE .086 -.001 .085
---------------------------------------------------------------------------------------------
GLD 178.76 2.12 174.1 144.5% Bullish BLUE .181 .114 .295
---------------------------------------------------------------------------------------------
DBO 15.32 .25 14.63 315.7% Bullish BLUE .188 -.15 .038
---------------------------------------------------------------------------------------------
OIH 327.94 2.32 312.23 354% Bullish BLUE .221 .049 .27
---------------------------------------------------------------------------------------------
CPER 25.55 .3 24.29 356.7% Bullish BLUE .05 .169 .219
---------------------------------------------------------------------------------------------
TAN 81.74 .06 74.71 507.7% Bullish BLUE -.011 .088 .077
---------------------------------------------------------------------------------------------
UUP 27.47 -.01 27.73 -77.6% Bearish RED .006 -.136 -.13
---------------------------------------------------------------------------------------------
CORN 26.63 .13 25.92 134.3% Bullish BLUE .347 -.091 .256
---------------------------------------------------------------------------------------------
WEAT 7.51 -.01 7.53 -6.7% Bullish ---- .107 -.229 -.122
---------------------------------------------------------------------------------------------
YINN 65.88 2.64 61.03 395.9% Bullish BLUE .158 1.882 2.04
|
Table 3 RANKING OF KEY DIRECTORIES BASED PCT.OF STOCKS ABOVE 65-DMA
1/13/23
Bullish = 46
Bearish = 3
---------------------------------------------------------------------------------------
Directory Current day-1 day-2 day-3 day-4 day-5
----------------------------------------------------------------------------------------
COPPER 1 1 1 1 .857 .857
EDU 1 1 1 1 1 .833
JETS 1 1 .846 .846 .846 .769
INFRA .969 .939 .939 .878 .878 .878
GOLD .956 .956 .956 .956 .869 .913
UTILITY .921 .947 .921 .894 .842 .789
INSURANC .92 .92 .88 .84 .84 .84
ETFS .89 .872 .872 .836 .836 .8
GREEN .888 .833 .722 .722 .666 .611
HOMEBLDG .888 .888 .888 .888 .833 .888
BONDFUND .885 .885 .873 .873 .873 .873
SEMI .882 .84 .819 .808 .787 .744
GUNS .857 .857 .857 .642 .642 .571
ELECTRON .842 .804 .796 .774 .744 .721
DOWJONES .833 .766 .833 .866 .8 .766
======
INDMATER .833 .833 .833 .763 .722 .708
INDEXES .832 .827 .81 .756 .708 .691
CHINA .818 .795 .795 .772 .772 .795
HIGHPRIC .793 .775 .771 .693 .642 .594
GAMING .789 .842 .789 .684 .526 .473
TRANSP .789 .789 .736 .736 .684 .578
HOSPITAL .785 .714 .714 .642 .642 .642
SP500 .773 .779 .775 .717 .701 .717
=====
RUS-1000 .772 .765 .745 .685 .66 .658
=====
REIT .769 .807 .684 .476 .507 .561
CHEM .767 .79 .767 .744 .744 .72
SOLAR .75 .687 .5 .5 .375 .312
FIDSTKS .739 .721 .71 .674 .644 .674
FINANCE .737 .725 .675 .675 .65 .662
SP-100 .733 .722 .755 .711 .677 .733
AUTO .716 .773 .716 .679 .547 .547
BIGBANKS .714 .571 .571 .571 .571 .571
NASD-100 .71 .71 .72 .66 .64 .65
=====
COMPUTER .7 .65 .75 .75 .7 .65
DJI-13 .692 .615 .769 .846 .769 .769
MILITARY .692 .692 .653 .576 .538 .653
NIFTY .681 .681 .681 .568 .522 .522
RETAIL .68 .68 .659 .595 .51 .553
SOFTWARE .678 .696 .642 .535 .571 .482
BIOTECH .656 .647 .593 .562 .488 .525
LOWPRICE .627 .584 .553 .504 .455 .426
OILGAS .6 .58 .523 .523 .485 .476
FOOD .591 .53 .51 .53 .448 .448
COMODITY .589 .564 .538 .589 .538 .538
BEVERAGE .571 .571 .571 .571 .642 .642
REGBANKS .52 .48 .36 .4 .36 .4
=============================================================================================
HACKERS .437 .375 .375 .312 .375 .375
MARIJUAN .4 .3 .2 .1 .1 .1
COAL .333 .333 .166 .166 .333 .333
|
===================================================================================
Friday
- 5:55 AM - Futures: DJI -274 NASDAQ -126
Data Used: 1/12/2023
| |
             1/12/2023
DJIA	34189.97	216.96	+0.64%
S&P 500	3983.17	        13.56	+0.34%
Nasdaq 	11001.10	69.43	+0.64%
Advances	2,372	vs   2,396
Declines	746	vs   707
New highs	108 + 139 =  247
New lows	12  + 26  =  42
|
|
| |
The DJI
rallied up to its resistance line (shown below) and closed 2.5% above
the 21-day ma on
excellent breadth. News that the CPI as a whole actually
fell in December
compared to November helped stir up the buying. But now
the DJI is
"over-bought", and although the P-I and IP21 are high enough to
allow for higher
prices, the fact is that volume is not explanding to allow the
over-head supply of
stocks to be readily eaten up.
Peerless has never
given a profitable Sell signal of any kind in January
in the year before the
Presidential Elecion year after January 10th. It could
do this, but breadth is
too positive. I believe the reason for this bullishness
has to do with the
FOMC's next meeting not being until the very end of this
month or next month.
Still, we see the technical problem. The DJI is
2.5% over the 21-day ma
and the V-I is minus 100 and OPMA (the
21-day ma of OBV Pct)
is -.072. Since the year 2000, this has been
seen only once in
January. That was in 2003, when the DJI closed at the
3.3% upper band with
the VI at -22 and the OPMA(or OBVPC) at
+.042. In this
case, there had been a Sell S12 on 1/6/2003. The results
was a rapid decline
below the lower band. Note that the DJI was already
in bear market
territory (down more than 20%) and fears were growing
back then that the US
was preparing to attack Iraq and Saddam Hussein.
We are not about
to go to war. (Let's hope.) The FED will not meet until
January 31st this year.
Inflation is easing up, the Ten-Year Bond Rates fell
below 3.5% today, Bond
funds are rising bullshly and the Dollar weakened
some more. Normally,
this would be a bullsh environment for stocks.
Technically, the 21-day
ma's of CLosing Power for the key ETFs shown
are all still falling.
It would make good technical sense now for there to be a
mild retreat of these
ETFs and their Closing Powers back to their 21-day
ma whereupon they would
again turn up. Thus, all we can foresee without
a new Peerless Sell,
which seems unlikely now, would be a small profit-taking
decline in some of the
leaders of the rally. That would include SOXL,
which leveraged by 3x,
could fall 15%. So, let's take profits in it.
But hold long DIA and
the strongest MAXCP stocks. No short sales seem
warranted. Note
how few new lows there are compared to new highs.
|
|
| |
Charts - 1/12/2023
2022 PEERLESS DJI, Signals, Indicators Daily DJI Volume
10-DayUp/Down Vol Stoch-20 CCI RSI Pct of All Stocks above 65-dma
Inverted Traders Index
DJI-IPA DJI-OBV Short-Term Rates
NASDAQ S&P OEX NYSE DJ-15 DJ-20 DJI-30 Bond Funds
DIA QQQ SPY IWM new - COIN (Bit Coin ETF)
TNA Short-Term Rates Ten Year Rates PST (Short Treasuries)
DOLLAR-UUP
ALLSTOCKs
Russell-1000
Insurance-Stocks
Recent 2006 vers-Peerless signals
http://www.tigersoftware.com/OLDPEER/UPD90112.bmp
MDY - http://www.tigersoftware.com/CHARTX/MDY.GIF
USO-CrudeOil DBO FAS GLD HD IBB JETS JNUG KOL NAIL NUGT NRGU OIH
PALL RSX RETL SDS AGQ SLV SOXL TAN TECL TLT TMF TNA UGA USO
China: YINN
CHAU
Commodities: CANE
CORN DBC JJC, NIB CORN, CUT (paper)
MOO, NRGU
SOYB WEAT UUP (Dollar) LIT
(Lithium)
Stocks AA AAPL ADBE ALXN AMAT AMGN AMD AMZN AXP BA BABA
BAC BIDU BLDP CAT CHKP CNX CPB CRM CVX CMG DE DIS ENPH FB FSLR
FTNT GILD GME GOOG GS HD IBM INTU JPM KO KR LRCX MRK MRNA
MOS MSFT NEM NFLX NKE NOC NUE NVDA PANW PG PYPL REGN REV
SO QCOM QDEL TSLA TXN XOM V VRTX WFC WMT XLE ZM ZOM
Leveraged Short ETFs:
FAZ - financials, TZA and SRTY- small caps, MZZ - mid caps, TECS -Techs,
SOXS -
semi-conductors LABD
- Biotechs
Bullish MAXCPs http://www.tigersoftware.com/UPPING/1-12-2023/BULLISH.htm
Bearish MINCPs http://www.tigersoftware.com/Downing/1-12-2023/BEARISH.htm |
|
DJI has reached a
resistance line running through tops, but has no new Sell at 2.5% upper band.
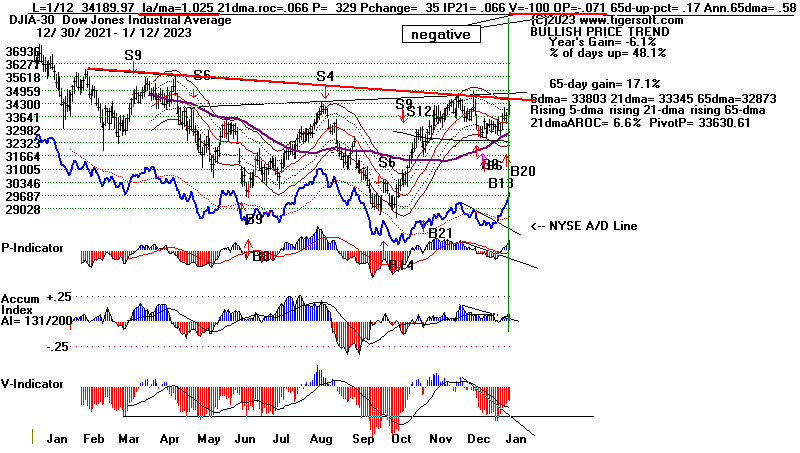 |
DIA's 21-day ma of Closing Power is still
falling.
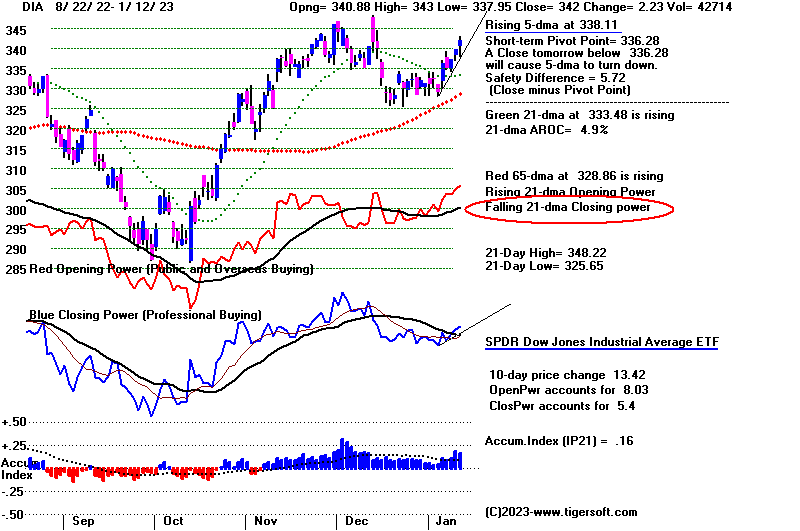 |
NASDAQ's 21-day ma of Closing Power is still falling.
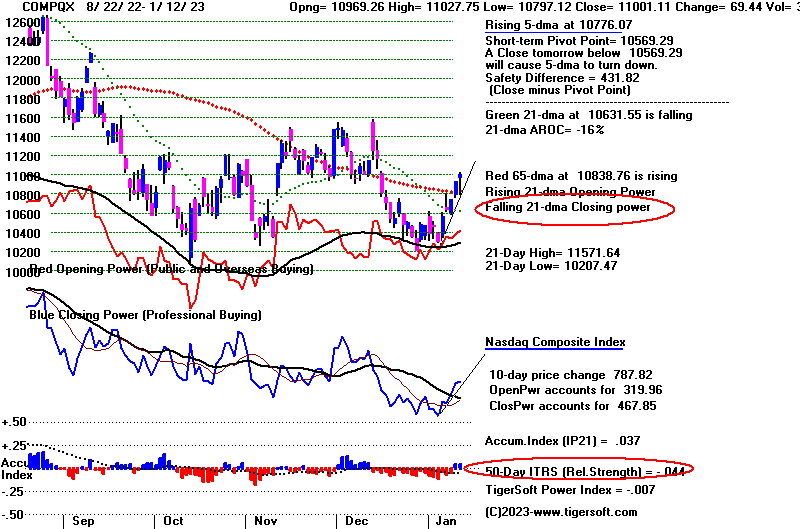 |
SPY's 21-day ma of Closing Power is still
falling.
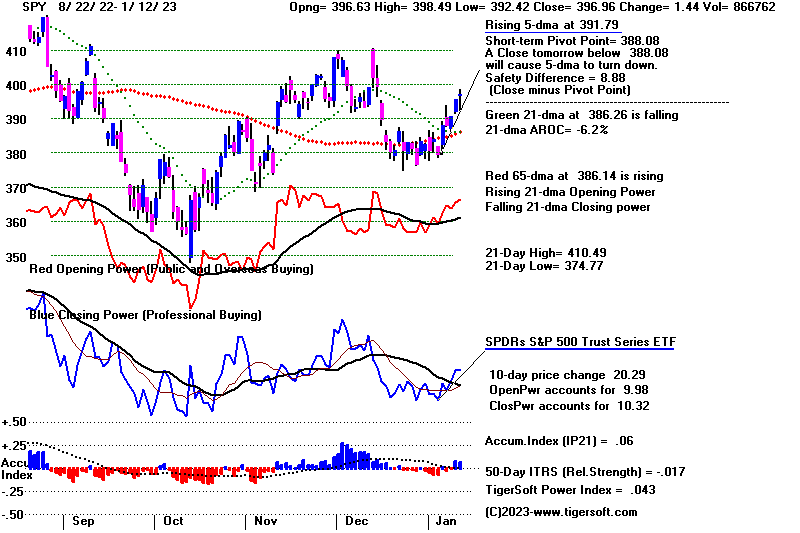 |
QQQ's 21-day ma of Closing Power is still
falling.
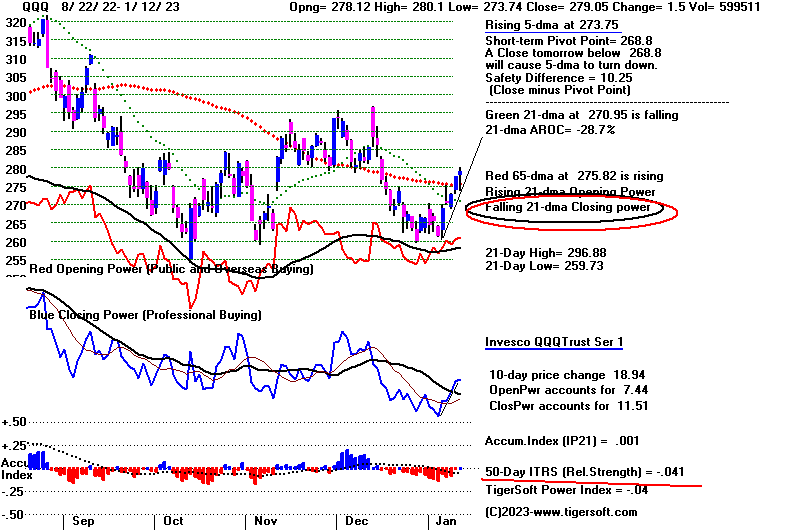 |
SOXL's 21-day ma of Closing Power is still
falling.
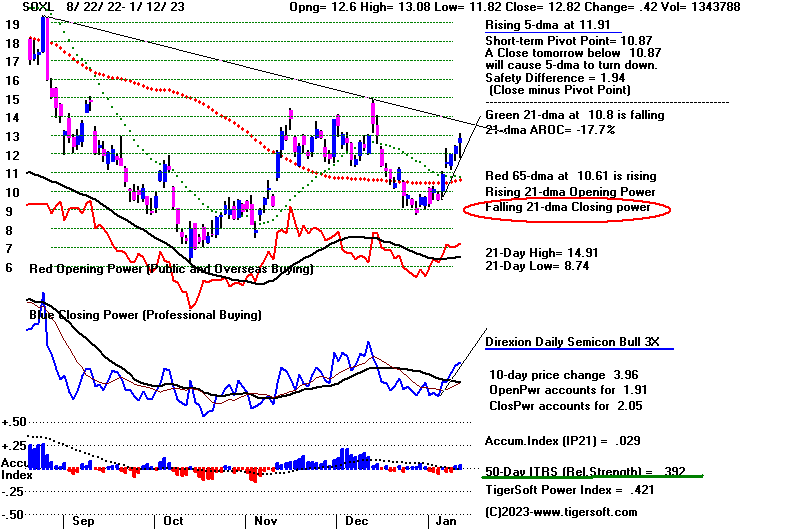 |
TECL's 21-day ma of Closing Power is
still falling.
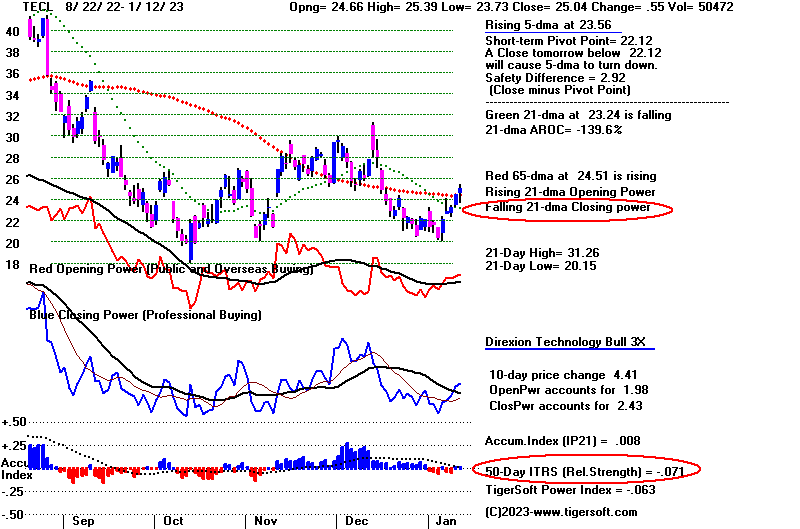 |
FAS - 21-day ma of Closing Power is still
falling.
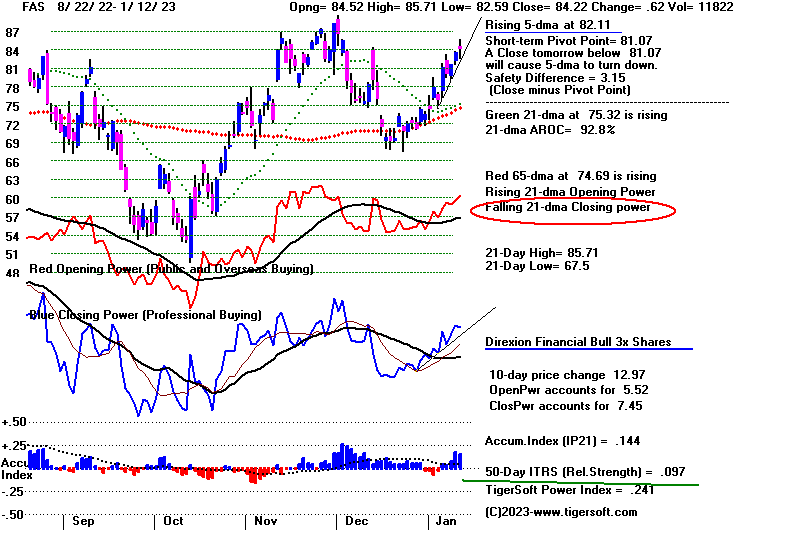 |
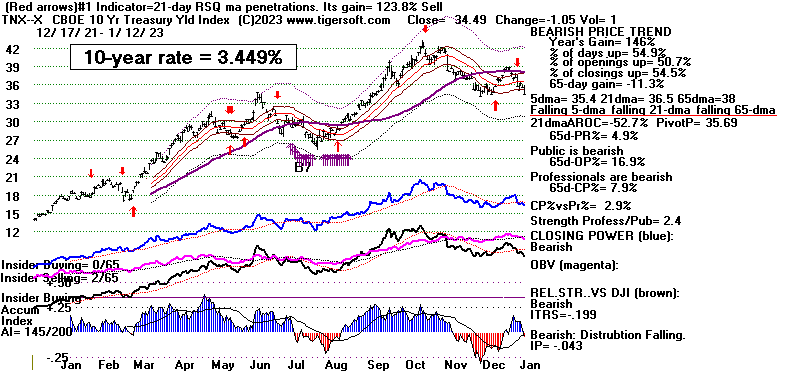 |
1/12/2023
DJIA 34189.97 216.96 +0.64%
S&P 500 3983.17 13.56 +0.34%
Nasdaq 11001.10 69.43 +0.64%
Advances 2,372 vs 2,396
Declines 746 vs 707
New highs 108 + 139 = 247
New lows 12 + 26 = 42
NYSE	Latest Close	Previous Close	Week Ago
Issues traded	3,225	3,220	3,235
Advances	2,372	2,396	1,293
Declines	746	707	1,831
Unchanged	107	117	111
New highs	108	81	64
New lows	12	5	37
Adv. volume*	639,502,729	620,774,638	335,046,086
Decl. volume*	210,754,548	226,405,711	527,903,261
Total volume*	861,651,544	857,218,314	867,785,830
Closing Arms (TRIN)†	0.93	1.29	0.90
Block trades*	4,423	4,640	4,272
Adv. volume	3,390,118,981	3,071,681,051	1,703,063,575
Decl. volume	994,104,614	1,164,931,419	2,160,135,607
Total volume	4,440,261,643	4,303,366,847	3,893,457,747
NASDAQ	Latest Close	Previous Close	Week Ago
Issues traded	4,794	4,854	4,821
Advances	3,269	3,198	1,892
Declines	1,308	1,438	2,720
Unchanged	217	218	209
New highs	139	127	106
New lows	26	30	90
Closing Arms (TRIN)†	0.98	0.52	0.96
Block trades	40,660	36,837	32,833
Adv. volume	4,035,847,518	4,212,746,375	1,976,420,487
Decl. volume	1,588,522,892	991,903,604	2,733,905,411
Total volume	5,681,244,198	5,284,397,410	4,764,276,405
|
Table 2 QUICKSILVER on ETFS - 1/11/2023 ---
     Bullish = 4  RETL,  SOXL,  OIH, YINN
     Bearish = 0
ETF       CLOSE   CHANGE    PIVOT-PT    5-dma AROC    CL-PWR  CANDLE  IP21   ITRS   POWER INDEX
================================================================================================
DIA       342   2.24         336.28        190.4%     -------  BLUE   .161   ------------------
---------------------------------------------------------------------------------------------
COMPQX    11001.11   69.44   10569.29      327.1%     -------  BLUE   .037   -.043    -.006
---------------------------------------------------------------------------------------------
SPY       396.96   1.44      388.08        226.4%     -------  BLUE   .061   -.017     .044
---------------------------------------------------------------------------------------------
QQQ       279.05   1.5       268.8         323.2%     -------  BLUE   .002   -.041    -.039
---------------------------------------------------------------------------------------------
MDY       468.36   4.24      454.13        280.5%     Bullish  BLUE   .106    .011     .117
---------------------------------------------------------------------------------------------
IWM       185.83   3.07      177.58        340.4%     -------  BLUE   .107   -.031     .076
---------------------------------------------------------------------------------------------
FAS       84.22   .62        81.07         513.3%     -------  RED    .145    .098     .243
---------------------------------------------------------------------------------------------
RETL      8.92   .21         7.72          1118.7%    Bullish  BLUE   .255    .049     .304
---------------------------------------------------------------------------------------------
SOXL      12.82   .42        10.87         1442.1%    -------  BLUE   .029    .393     .422
---------------------------------------------------------------------------------------------
TECL      25.04   .55        22.12         1031.9%    -------  BLUE   .008   -.071    -.063
---------------------------------------------------------------------------------------------
IBB       135.11   1.12      133.14        124.2%     Bullish  BLUE   .041    .006     .047
---------------------------------------------------------------------------------------------
GLD       176.64   2.02      173.71        176.3%     Bullish  BLUE   .097    .118     .215
---------------------------------------------------------------------------------------------
DBO       15.07   .09        14.39         246.8%     Bullish  RED    .135   -.137    -.002
---------------------------------------------------------------------------------------------
OIH       325.62   7.88      305.58        475.6%     Bullish  BLUE   .227    .046     .273
---------------------------------------------------------------------------------------------
CPER     25.25  -.09         23.79         426.7%     Bullish  RED   -.089    .196     .107
---------------------------------------------------------------------------------------------
TAN     81.68   1.47         73.87         714.7%     -------  BLUE  -.039    .101     .062
---------------------------------------------------------------------------------------------
UUP       27.48  -.27        27.9         -141.7%     Bearish  RED    .1     -.129    -.029
---------------------------------------------------------------------------------------------
CORN      26.5   .52         25.93         109.9%     Bullish  BLUE   .282   -.078     .204
---------------------------------------------------------------------------------------------
WEAT      7.52   .03         7.52         -20%        Bullish  ----   .062   -.207    -.145
---------------------------------------------------------------------------------------------
YINN      63.24  -1.71       60.92         227.1%     Bullish  RED    .088    2.114     2.202
|
Table 3    RANKING OF KEY DIRECTORIES BASED PCT.OF STOCKS ABOVE 65-DMA
            1/12/23
Bullish = 45  (There should ample support underneath market to prevent a bigger decline.)
Bearish = 4
---------------------------------------------------------------------------------------
Directory     Current       day-1         day-2         day-3         day-4         day-5
----------------------------------------------------------------------------------------
COPPER         1             1             1             .857          .857          .857
EDU            1             1             1             1             .833          .666
JETS           1             .846          .846          .846          .769          .692
GOLD           .956          .956          .956          .869          .913          .826
UTILITY        .947          .921          .894          .842          .789          .684
INFRA          .939          .939          .878          .878          .878          .787
INSURANC       .92           .88           .84           .84           .84           .76
HOMEBLDG       .888          .888          .888          .833          .888          .833
BONDFUND       .885          .873          .873          .873          .885          .804
ETFS           .872          .872          .836          .836          .818          .745
GUNS           .857          .857          .642          .642          .642          .571
GAMING         .842          .789          .631          .578          .473          .421
SEMI           .84           .819          .808          .787          .734          .5
GREEN          .833          .722          .722          .666          .611          .388
INDMATER       .833          .833          .763          .722          .708          .583
INDEXES        .827          .81           .756          .708          .708          .491
REIT           .807          .676          .484          .515          .546          .415
ELECTRON       .804          .796          .774          .744          .714          .533
CHINA          .795          .795          .772          .772          .795          .818
CHEM           .79           .767          .744          .744          .72           .581
TRANSP         .789          .736          .736          .684          .578          .473
SP500          .779          .775          .717          .696          .717          .575
               =====
HIGHPRIC       .775          .771          .693          .642          .59           .439
AUTO           .773          .716          .679          .547          .547          .396
DOWJONES       .766          .833          .866          .8            .766          .633
               =====
RUS-1000       .765          .745          .685          .66           .657          .544
               ====
FINANCE        .725          .675          .675          .637          .662          .475
SP-100         .722          .755          .711          .677          .722          .588
FIDSTKS        .721          .71           .674          .644          .662          .544
HOSPITAL       .714          .714          .642          .642          .642          .642
NASD-100       .71           .72           .66           .64           .64           .48
               =====
SOFTWARE       .696          .66           .535          .571          .482          .446
MILITARY       .692          .653          .576          .538          .653          .538
SOLAR          .687          .5            .5            .375          .312          .187
NIFTY          .681          .681          .568          .522          .522          .386
RETAIL         .68           .659          .595          .51           .553          .446
COMPUTER       .65           .75           .75           .7            .65           .55
BIOTECH        .647          .59           .565          .488          .522          .505
DJI-13         .615          .769          .846          .769          .769          .615
LOWPRICE       .584          .555          .507          .455          .424          .366
OILGAS         .58           .523          .523          .485          .485          .419
BEVERAGE       .571          .571          .571          .642          .642          .571
BIGBANKS       .571          .571          .571          .571          .571          .571
COMODITY       .564          .538          .564          .538          .538          .538
FOOD           .53           .51           .51           .448          .448          .489
=========================================================================================================
REGBANKS       .48           .36           .4            .36           .4            .28
HACKERS        .375          .375          .312          .375          .375          .375
COAL           .333          .166          .166          .333          .333          .166
MARIJUAN       .3            .2            .1            .1            .1            .1
|
==================================================================================
Thursday
- 5:35 AM - Futures: DJI +48 NASDAQ -5 Data Used: 1/11/2023
|
               1/11/2023
DJIA	33973.01	268.91	+0.80%
S&P 500	3969.61	        50.36	+1.28%
Nasdaq 	10931.67	189.04	+1.76%
Advances	2,396    vs	2,219
Declines	707      vs	877
New highs	81 + 127 = 208
New lows	5  + 30  = 35
|
|
|
Our
Peerless DJI chart now has a combination of 4 different Buy signals
telling us to expect still higher
prices even though the DJI is 1.9% over the
21-dma. The negative
V-Indicator cannot produce a Sell S9V until May.
Meanwhile, the A/D Line is rising
superbly. Let's see if more and more
Professionals join in on the buying
of the leaders of the rally and cover more
and more of their shorts in the
weakest techs.
The market looks very good,
especially when we consider the well-advertised
negativity we can still easily spot
in all the usual places. I liked the way that the
Closing Powers for DIA, SPY and
COMPQX (the Nasdaq) rose right above
their falling 21-day ma.
Bonds are rising, too, and the ten-year rates keep
falling. This is weakening
the DOLLAR, which
is helping foreign ETFs and stocks
in Latin America, particularly. See
some of them among the bullish MAXCPs.
Chinese stocks are rising quickly
now. This may presage a new bull market.
Certainly that would be in keeping
with the excellent breadth and the generally
excellent seasonal forces at work
in this the third year of the Presidential
Election cycle.
Volume could be higher, I admit,
but the tech sector is coming along now.
We see that in the fact that the
NASDAQ rose twice as much as the DJI
did. Something is causing the
Ten Year Rates to
keep falling. That helps
the tech sector. Watch TSLA
and AMZN to see if they can get past the resistance
levels shown below.
Even if the DJI reaches the 3.5%
upper band, we will probably not get a
Peerless Sell. This is
because the bullish seasonality of the start of the third
year in the Presidential four year
cycle is built into the signals so long as
the P-Indicator stays above +200.
There has been only one Sell S9 in
January in these years: 1/9/1935.
There have been four January S12s in these
years. in 1931, 1935, 2003
and 2019. The last one failed to stop a new bull
market.
So, let's avoid the short side
completely and stay long DIA, SOXL, CAT
and some of the bullish MAXCPs.
Just Out CONSUMER PRICE INDEX - DECEMBER 2022
The Consumer Price Index for All Urban Consumers (CPI-U) declined 0.1 percent in December on a
seasonally adjusted basis, after increasing 0.1 percent in November, the U.S. Bureau of Labor
Statistics reported today. Over the last 12 months, the all items index increased 6.5 percent before
seasonal adjustment.
The index for gasoline was by far the largest contributor to the monthly all items decrease, more than
offsetting increases in shelter indexes. The food index increased 0.3 percent over the month with the
food at home index rising 0.2 percent. The energy index decreased 4.5 percent over the month as the
gasoline index declined; other major energy component indexes increased over the month.
|
|
|
Charts - 1/11/2023
2022 PEERLESS DJI, Signals, Indicators Daily DJI Volume
10-DayUp/Down Vol Stoch-20 CCI RSI Pct of All Stocks above 65-dma
Inverted Traders Index
DJI-IPA DJI-OBV Short-Term Rates
NASDAQ S&P OEX NYSE DJ-15 DJ-20 DJI-30 Bond Funds
DIA QQQ SPY IWM new - COIN (Bit Coin ETF)
TNA Short-Term Rates Ten Year Rates PST (Short Treasuries)
DOLLAR-UUP
ALLSTOCKs
Russell-1000
Insurance-Stocks
Recent 2006 vers-Peerless signals
http://www.tigersoftware.com/OLDPEER/UPD90111.bmp
MDY - http://www.tigersoftware.com/CHARTX/MDY.GIF
USO-CrudeOil DBO FAS GLD HD IBB JETS JNUG KOL NAIL NUGT NRGU OIH
PALL RSX RETL SDS AGQ SLV SOXL TAN TECL TLT TMF TNA UGA USO
China: YINN
CHAU
Commodities: CANE
CORN DBC JJC, NIB CORN, CUT (paper)
MOO, NRGU
SOYB WEAT UUP (Dollar) LIT
(Lithium)
Stocks AA AAPL ADBE ALXN AMAT AMGN AMD AMZN AXP BA BABA
BAC BIDU BLDP CAT CHKP CNX CPB CRM CVX CMG DE DIS ENPH FB FSLR
FTNT GILD GME GOOG GS HD IBM INTU JPM KO KR LRCX MRK MRNA
MOS MSFT NEM NFLX NKE NOC NUE NVDA PANW PG PYPL REGN REV
SO QCOM QDEL TSLA TXN XOM V VRTX WFC WMT XLE ZM ZOM
Leveraged Short ETFs:
FAZ - financials, TZA and SRTY- small caps, MZZ - mid caps, TECS -Techs,
SOXS -
semi-conductors LABD
- Biotechs
Bullish MAXCPs http://www.tigersoftware.com/UPPING/1-11-2023/BULLISH.htm
Bearish MINCPs http://www.tigersoftware.com/Downing/1-11-2023/BEARISH.htm |
|
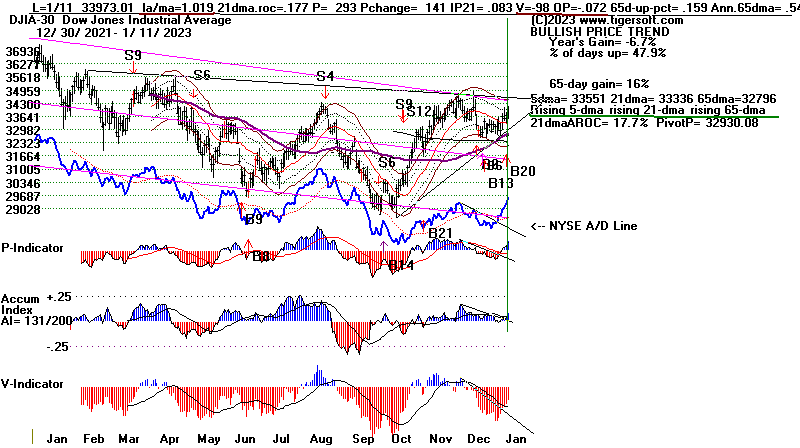 |
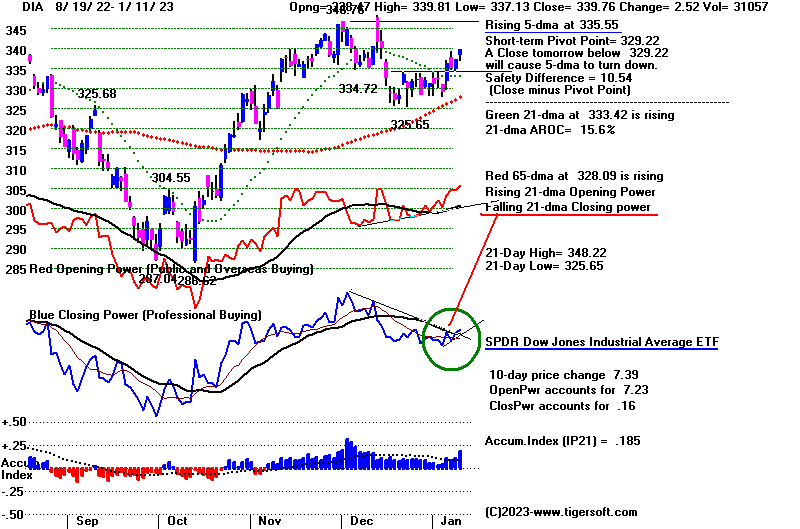 |
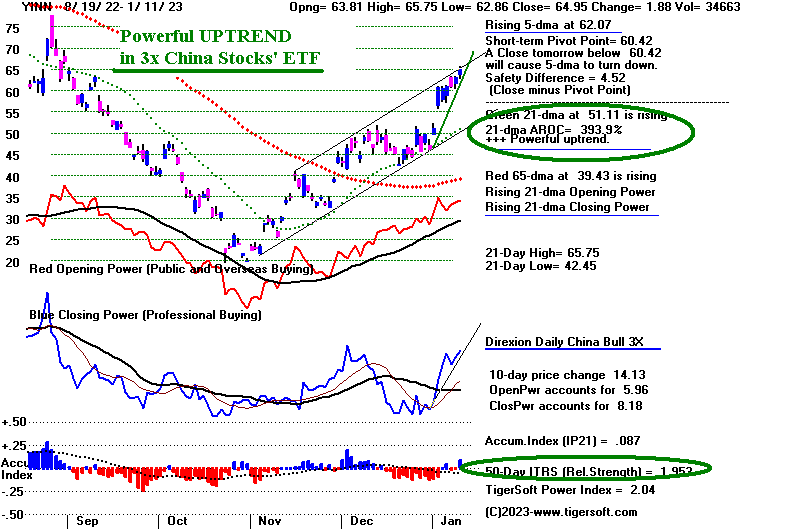 |
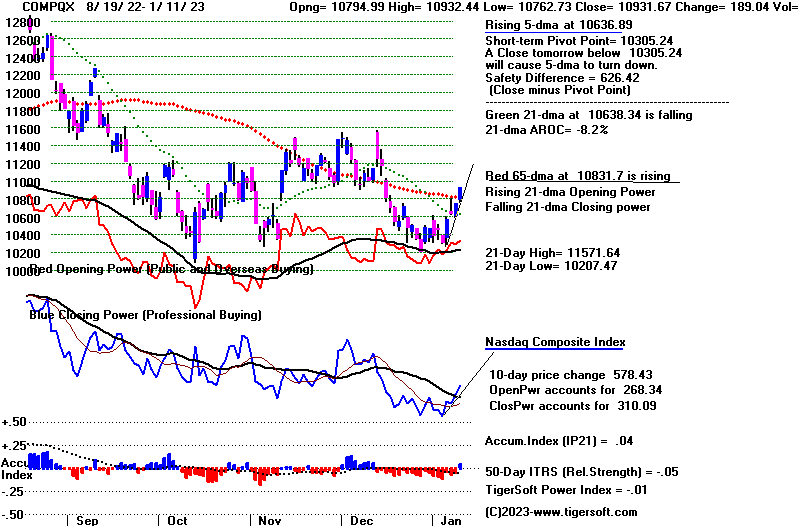 |
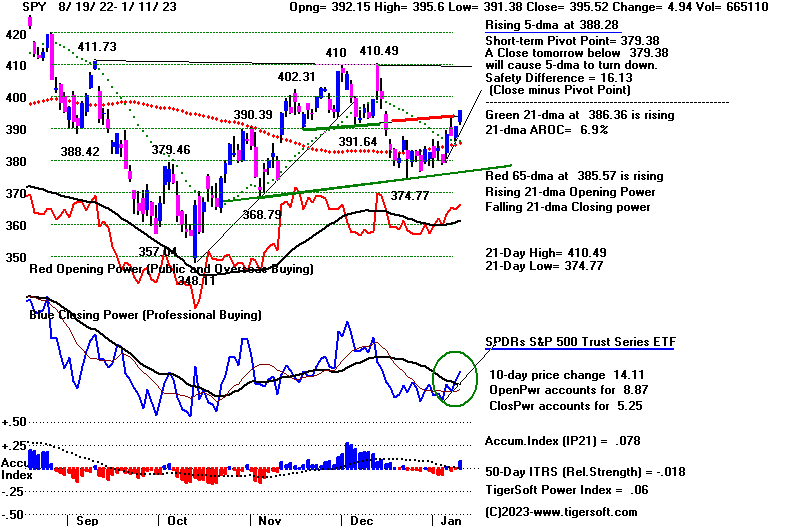 |
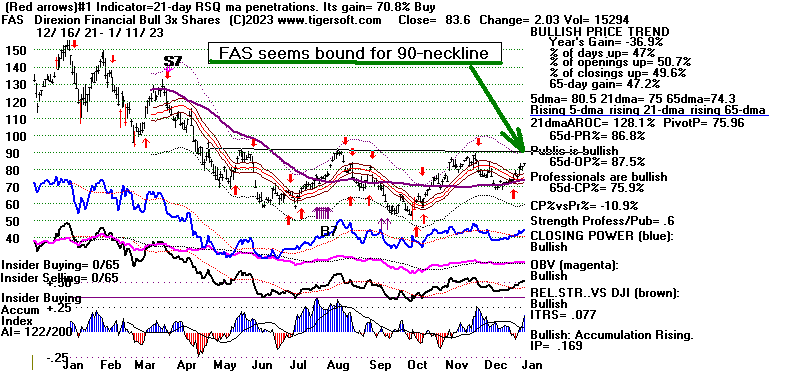 |
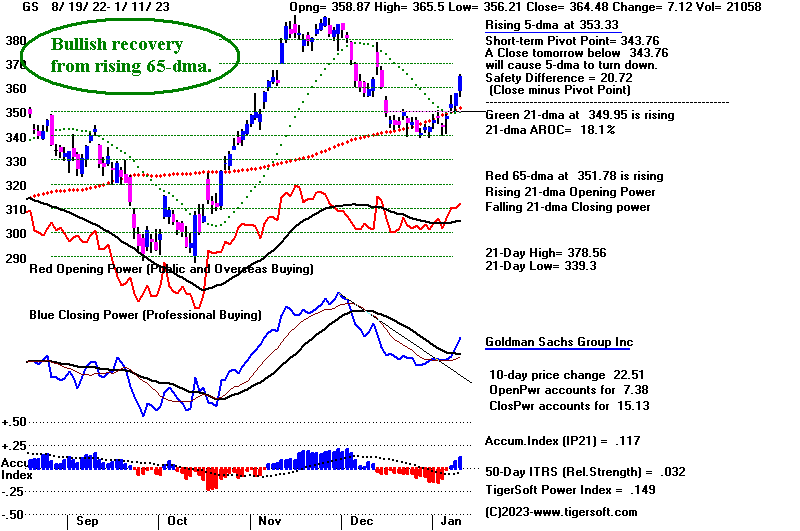 |
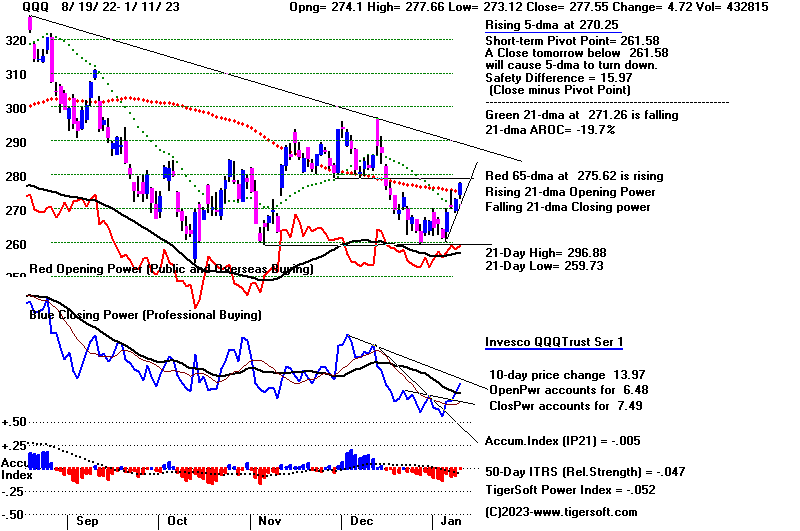 |
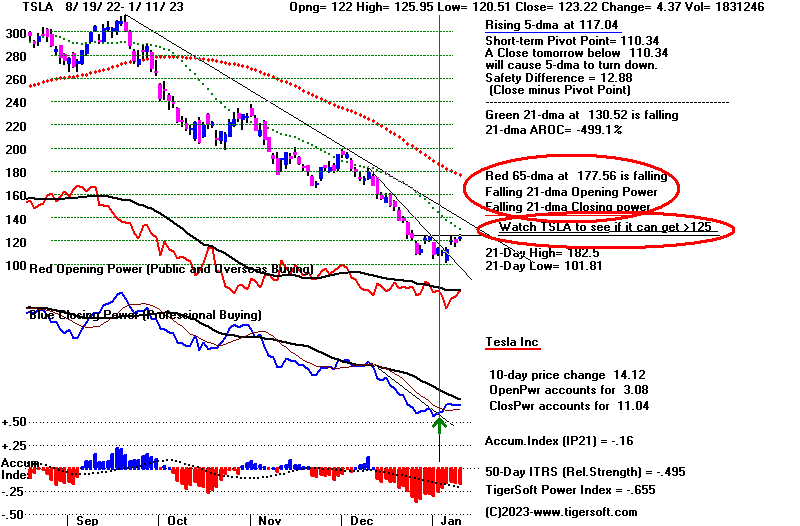 |
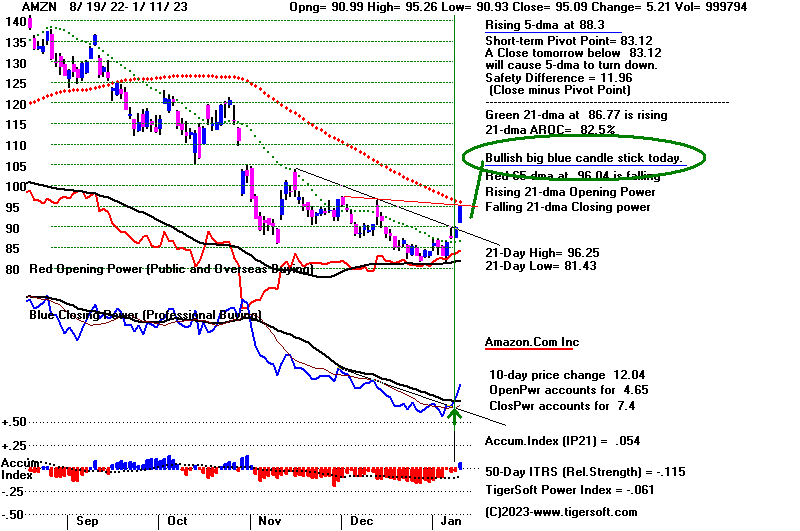 |
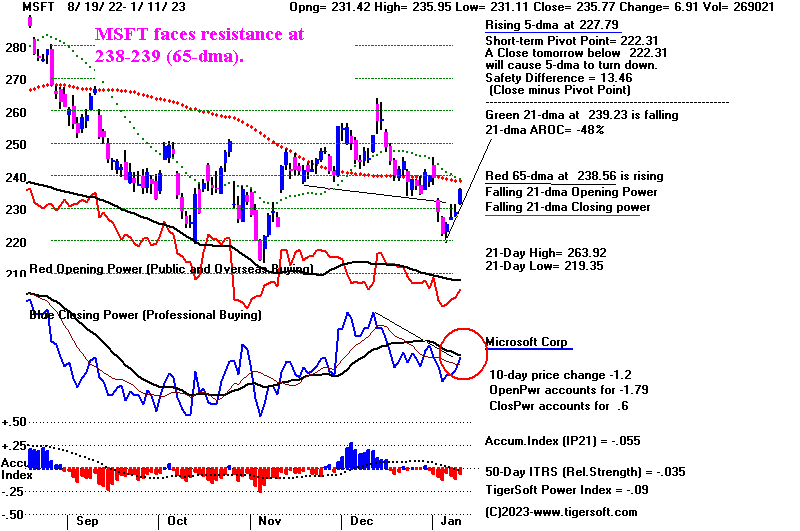 |
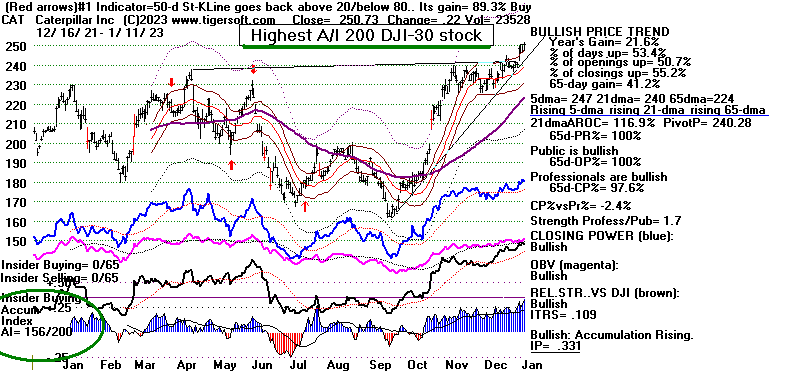 |
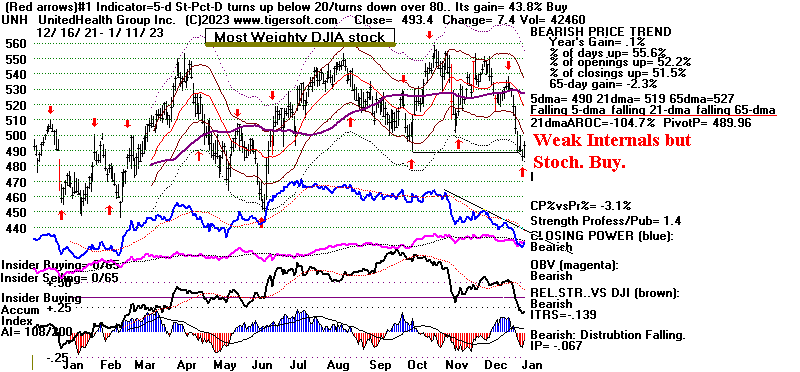 |
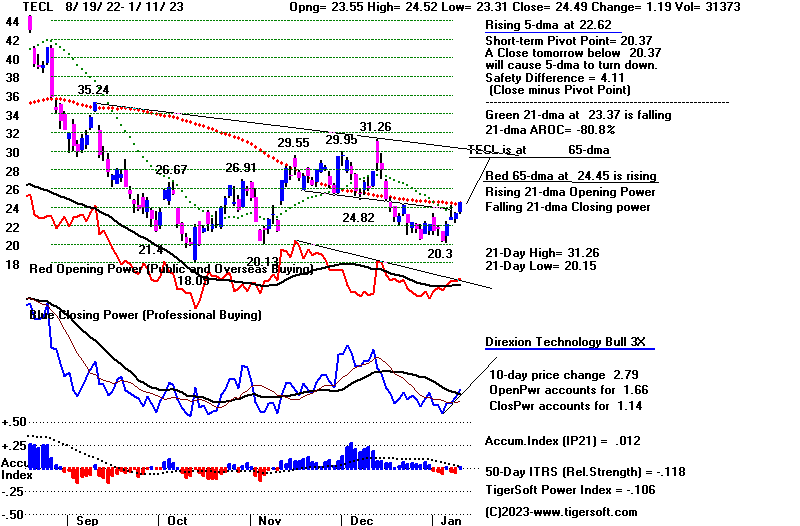 |
Table 1 1/11/2023
DJIA 33973.01 268.91 +0.80%
S&P 500 3969.61 50.36 +1.28%
Nasdaq 10931.67 189.04 +1.76%
Advances 2,396 vs 2,219
Declines 707 vs 877
New highs	81 + 127 = 208
New lows	5  + 30  = 35
NYSE	Latest Close	Previous Close	Week Ago
Issues traded	3,220	3,211	3,230
Advances	2,396	2,219	2,534
Declines	707	877	611
Unchanged	117	115	85
New highs	81	61	65
New lows	5	6	19
Adv. volume*	620,774,638	576,499,853	833,688,496
Decl. volume*	226,405,711	185,398,824	133,843,784
Total volume*	857,218,314	779,395,947	970,472,632
Closing Arms (TRIN)†	1.29	0.73	0.64
Block trades*	4,640	4,246	4,632
Adv. volume	3,071,681,051	2,910,234,212	3,806,471,577
Decl. volume	1,164,931,419	839,364,173	590,497,192
Total volume	4,303,366,847	3,851,036,239	4,414,084,449
NASDAQ	Latest Close	Previous Close	Week Ago
Issues traded	4,854	4,783	4,802
Advances	3,198	3,247	3,369
Declines	1,438	1,326	1,234
Unchanged	218	210	199
New highs	127	102	102
New lows	30	39	57
Closing Arms (TRIN)†	0.52	0.60	0.61
Block trades	36,837	32,689	31,797
Adv. volume	4,212,746,375	3,707,433,054	4,108,494,476
Decl. volume	991,903,604	914,818,242	915,205,080
Total volume	5,284,397,410	4,710,689,070	5,085,380,920
|
Table 2 QUICKSILVER on ETFS - 1/11/2023 ---
     Bullish = 4  RETL,  SOXL,  OIH, YINN
     Bearish = 0
ETF       CLOSE   CHANGE    PIVOT-PT    5-dma AROC    CL-PWR  CANDLE  IP21   ITRS   POWER INDEX
================================================================================================
DIA       339.76   2.53      329.22        107.7%     -------  BLUE   .185    ---    -----
---------------------------------------------------------------------------------------------
COMPQX    10931.67   189.04  10305.24      224.3%     -------  BLUE   .04    -.049    -.009
---------------------------------------------------------------------------------------------
SPY       395.52   4.94      379.38        152.4%     -------  BLUE   .078   -.017     .061
---------------------------------------------------------------------------------------------
QQQ       277.55   4.72      261.58        220.4%     -------  BLUE  -.004   -.047    -.051
-------------------------------------------------------------------------------------- -------
MDY       464.12   5.68      442.85        184.7%     Bullish  BLUE   .12     .011     .131
---------------------------------------------------------------------------------------------
IWM       182.76   2.25      173.68        203.3%     -------  BLUE   .088   -.036     .052
---------------------------------------------------------------------------------------------
FAS       83.6   2.03        75.96         359.3%     Bullish  BLUE   .17    .077      .247
---------------------------------------------------------------------------------------------
RETL      8.71   .6          7.16          895.4%     -------  BLUE   .238    .017     .255
---------------------------------------------------------------------------------------------
SOXL      12.4   .43         9.57          1078.5%    Bearish  BLUE   .024    .271     .295
---------------------------------------------------------------------------------------------
TECL      24.49   1.2        20.37         643.7%     Bearish  BLUE   .012   -.118    -.106
---------------------------------------------------------------------------------------------
IBB       133.99   .76       131.82        86.3%     -------  BLUE   .056    -.001     .055
---------------------------------------------------------------------------------------------
GLD       174.62  -.12       170.52        56.3%     Bullish  RED    .025     .106     .131
---------------------------------------------------------------------------------------------
DBO       14.98   .4         14.35         242.3%     Bullish  BLUE   .181   -.15      .031
---------------------------------------------------------------------------------------------
OIH       317.74  -.32       296.14        444.6%     Bullish  RED    .264    .062     .326
---------------------------------------------------------------------------------------------
CPER     25.34   .65         23.18         564.9%     Bullish  BLUE  -.084    .188     .104
---------------------------------------------------------------------------------------------
TAN     80.21   3.17         70.91         467.1%     Bearish  BLUE  -.046    .098     .052
---------------------------------------------------------------------------------------------
UUP       27.75   0          28.27        -46.5%     -------  ----   .142    -.102     .04
---------------------------------------------------------------------------------------------
CORN      25.98   .04        25.93        -25%       Bullish  BLUE   .262    -.075     .187
---------------------------------------------------------------------------------------------
WEAT      7.49   .09         7.55         -39.9%     Bullish  BLUE   .053    -.158    -.105
---------------------------------------------------------------------------------------------
YINN      64.95   1.89       60.42         347.1%    Bullish  BLUE   .088    1.954     2.042
|
Table 3  RANKING OF KEY DIRECTORIES BASED PCT.OF STOCKS ABOVE 65-DMA
              1/11/23
 44 = Bullish
 4 = Bearish
---------------------------------------------------------------------------------------
Directory     Current       day-1         day-2         day-3         day-4         day-5
----------------------------------------------------------------------------------------
COPPER         1             1             .857          .857          .857          .857
EDU            1             1             1             .833          .666          .666
GOLD           .956          .956          .869          .913          .826          .869
INFRA          .939          .878          .878          .878          .787          .878
UTILITY        .921          .894          .842          .789          .684          .815
HOMEBLDG       .888          .888          .833          .888          .833          .888
INSURANC       .88           .84           .84           .84           .76           .84
BONDFUND       .873          .873          .873          .885          .816          .827
ETFS           .872          .836          .836          .818          .763          .763
GUNS           .857          .642          .642          .642          .571          .571
JETS           .846          .846          .846          .769          .769          .615
DOWJONES       .833          .866          .8            .766          .633          .666
               =====
INDMATER       .833          .763          .722          .708          .583          .611
SEMI           .819          .808          .787          .734          .521          .563
               =====
INDEXES        .81           .756          .708          .708          .497          .567
ELECTRON       .796          .774          .744          .714          .548          .571
CHINA          .795          .772          .772          .795          .795          .795
GAMING         .789          .631          .526          .526          .421          .473
SP500          .775          .717          .696          .713          .591          .664
               =====
HIGHPRIC       .771          .693          .642          .59           .448          .573
DJI-13         .769          .846          .769          .769          .615          .615
CHEM           .767          .744          .744          .72           .581          .674
SP-100         .755          .711          .677          .722          .622          .666
COMPUTER       .75           .75           .7            .65           .55           .45
RUS-1000       .745          .685          .66           .657          .553          .614
               ====
TRANSP         .736          .736          .684          .578          .526          .473
GREEN          .722          .722          .666          .611          .388          .388
NASD-100       .72           .66           .64           .64           .5            .57
               =====
AUTO           .716          .679          .547          .547          .396          .452
HOSPITAL       .714          .642          .642          .642          .642          .571
FIDSTKS        .71           .674          .644          .662          .562          .609
NIFTY          .681          .568          .522          .522          .454          .454
REIT           .676          .476          .523          .553          .423          .576
FINANCE        .675          .675          .637          .65           .475          .575
SOFTWARE       .66           .553          .571          .482          .446          .535
RETAIL         .659          .595          .51           .553          .446          .51
MILITARY       .653          .576          .538          .653          .576          .615
BIOTECH        .59           .562          .491          .522          .502          .5
BEVERAGE       .571          .571          .642          .642          .571          .714
BIGBANKS       .571          .571          .571          .571          .571          .571
LOWPRICE       .555          .51           .458          .424          .363          .349
COMODITY       .538          .564          .512          .538          .538          .512
OILGAS         .523          .523          .485          .485          .409          .361
FOOD           .51           .51           .428          .448          .489          .469
============================================================================================
SOLAR          .5            .5            .375          .312          .125          .187
============================================================================================
HACKERS        .375          .312          .375          .375          .375          .375
REGBANKS       .36           .4            .36           .4            .28           .28
MARIJUAN       .2            .1            .1            .1            .1            .2
COAL           .166          .166          .333          .333          .166          .166
|
=====================================================================================
Wednesday
- 4:53 AM - Futures: DJI +44 NASDAQ +12 Data
Used: 1/10/2023
| |
               1/10/2023
               DJIA	33704.10	186.45	0.56%
               S&P 500	3919.25	        27.16	0.70%
               Nasdaq 	10742.63	106.98	1.01%
               Advances	2,219 vs 1,907
               Declines	877   vs 1,194
               New highs	61 + 102 = 163
               New lows	6  + 39	 =  45
|
|
| |
Instead of contining to decline after Monday's mid-day reversal down, we saw
a reversal back up on bullish breadth. In fact, this was the fourth fine breadth day
in the last eight days. This generated a Buy B20 to reinforce our unreversed,
seasonal
Buy B6 and B13 signals. As the DJI and the other key ETFs move up through
overhead resistance, we have to expect minor reversals. The good breadth is the key
now. It shows that many more NYSE stocks are benefitting from the economic
resiliency
shown in the last Jobs' Report than are being harmed by short-term interest rates reaching
4.5%. As long as breadth stays positive like this, the market should move still
higher. Given
the seasonality, it is by no means probable that a rise to the DJI's 3.0% band,
about 560
points higher, will bring a Peerless Sell. In fact, the average Buy B20 since the
year 2000
allowed the DJI to rise an additional 4.55%. In our case, that would allow the DJI
to
rally another 1500 points.
If we take into account that the DJI's 21-day ma is not yet even rising and the key ETFs
21-day ma of Closing Power is falling, then we probably should not expect that much of an
advance. But it appears reasonable to hold onto DIA, SOXL, CAT (highest AI/200
stock
that is making new highs) and a few of the highest ranked Bullish MAXCPs.
Let's watch to see if GS, the second most weighty stock in DJI-30 can continue to rise
after testing its rising 65-dma, if the most heavily weighted DJI-30 stock, United Health
can recover after getting a new red optimized Buy and if the third most heavily weighted
DJI-30
stock can keep rising after making a new high. It could be a target for
profit-taking.
And most important, watch to see if DIA, SPY and QQQ can show Closing Power strength
and rise from their openings now that their CL-PWRs have reached that indicator's falling
21-dma.
|
|
| |
Charts - 1/9/2023
2022 PEERLESS DJI, Signals, Indicators Daily DJI Volume
10-DayUp/Down Vol Stoch-20 CCI RSI Pct of All Stocks above 65-dma
Inverted Traders Index
DJI-IPA DJI-OBV Short-Term Rates
NASDAQ S&P OEX NYSE DJ-15 DJ-20 DJI-30 Bond Funds
DIA QQQ SPY IWM new - COIN (Bit Coin ETF)
TNA Short-Term Rates Ten Year Rates PST (Short Treasuries)
DOLLAR-UUP
ALLSTOCKs
Russell-1000
Insurance-Stocks
Recent 2006 vers-Peerless signals
http://www.tigersoftware.com/OLDPEER/UPD90110.bmp
MDY - http://www.tigersoftware.com/CHARTX/MDY.GIF
USO-CrudeOil DBO FAS GLD HD IBB JETS JNUG KOL NAIL NUGT NRGU OIH
PALL RSX RETL SDS AGQ SLV SOXL TAN TECL TLT TMF TNA UGA USO
China: YINN
CHAU
Commodities: CANE
CORN DBC JJC, NIB CORN, CUT (paper)
MOO, NRGU
SOYB WEAT UUP (Dollar) LIT
(Lithium)
Stocks AA AAPL ADBE ALXN AMAT AMGN AMD AMZN AXP BA BABA
BAC BIDU BLDP CAT CHKP CNX CPB CRM CVX CMG DE DIS ENPH FB FSLR
FTNT GILD GME GOOG GS HD IBM INTU JPM KO KR LRCX MRK MRNA
MOS MSFT NEM NFLX NKE NOC NUE NVDA PANW PG PYPL REGN REV
SO QCOM QDEL TSLA TXN XOM V VRTX WFC WMT XLE ZM ZOM
Leveraged Short ETFs:
FAZ - financials, TZA and SRTY- small caps, MZZ - mid caps, TECS -Techs,
SOXS -
semi-conductors LABD
- Biotechs
Bullish MAXCPs http://www.tigersoftware.com/UPPING/1-10-2023/BULLISH.htm
Bearish MINCPs http://www.tigersoftware.com/Downing/1-10-2023/BEARISH.htm
|
|
| |
PEERLESS B20 SIGNALS: 12/7/1928 - 11/3/2022Date Signal DJI Gain Paper Loss
--------------------------------------------------------------
19310721 B20 146.7 -.034 134.1 -.0858 high 8/5
19340817 B20 91.1 .016 90.4 -.0076 8/20
19351122 B20 144.6 -.011 138.90 -.0394 12/19
19380922 B20 137.4 .146 129.9 -.0545 high 9/26
19380928 B20 133.7 .178 none 0
19390202      B20            144.3     .036       none      0
19431110      B20            132.7     .236       129.6    -.0233      11/30
19431207      B20            133.4     .229       none      0
19451205      B20            193.1     .032       189.1    -.0207      12/21
19461204      B20            170.3     .078       none      0
19470529      B20            169.3     .092       none      0
19500720      B20            207.7     .247       203.8    -.0187      7/25
19500727      B20            206.1     .25        203.8     0
19501109      B20            227.2     .14        222.3    -.0215      12/2
19540112      B20            281.5     .664       none       0
19580122      B20            445.7     .459       436.9    -.0197      2/25
20070831      B20          13357.74    .034       13113.3  -.0182      9/17
20130701      B20          14974.96    .032       none      0
20131017      B20          15371.65    .074       none      0
20140213      B20          16027.59    .060       none      0
20140818      B20          16838.74    .085       none      0
20151223      B20          17602.61    .007       none      0
20160629      B20          17694.68    .036       none      0
20180404      B20          24505.22    .022      23932.76  -.0234     4/6
20190819      B20          26135.79    .027      25479.42  -.024
20200611      B20          25128.17    .06       25015.55  -.001
--------------------------------------------------------------
N=  26 Avg.Gain=  .122   Avg.Paper Loss= -.014
The results are exaggerated, most likely, by the huge rallies of the
1950s and that post-war boom.
There were 16 B20s before 1959, none again until 2007 and
then 10 cases throught 2022. In the earlier period, 2 of the 16 produced
losses and 3 of the earler 16 B20s saw paper losses of more than 3 losses
of more than 3%.
It is not clear why there were no B20s from 1959 to 2006.
In the period from 2007 to 2020, all ten B20s were closed out profitably
and in 8 instances there was no paper loss.  The average gain was in these was
a much more modest 4.55%.
                       Code:
           For i = 82 To rn
             If la(i) / MA(i) > 1.012 Then 55134 'DJI must be below 1.2% band.
             If mo(i) = 9 And s9(i - 1) = 12 Then 55134 'can't follow an S12 the day before.                         goodbreadth = z
             For j = i - 7 To i
              If adv(j) / dec(j) > 2.5 Then goodbreadth = goodbreadth + 1
             Next j

              hi999 = -9999
              For j = i - 80 To i
                    If la(j) > hi999 Then hi999 = la(j)
              Next j
              gd999 = (hi999 - la(i)) / hi999
              ge999 = (la(i - 65) - la(i)) / la(i - 65)
              If gd999 > .17 Then 55134 'eliminates cases where DJI is within 17% of 65-day high.
              If ge999 > .13 Then 55134 'eliminates cases where DJI is up more than 13% over 65-dma.
              If ge999 > .117 And gd999 > .121 Then 55134
              If ge999 < -.15 Then 55134 ''eliminates cases where DJI is more than 15% below 65-dma.
              If goodbreadth > 3 Then s9(i) = 120:   PI = i: mb(i) = 20: PI = i: B20Arrows (PI):i=i+ 3
                        'B20 if 4 or more good breadth days in the last 8 trading days.
              55134     Next i
|
|
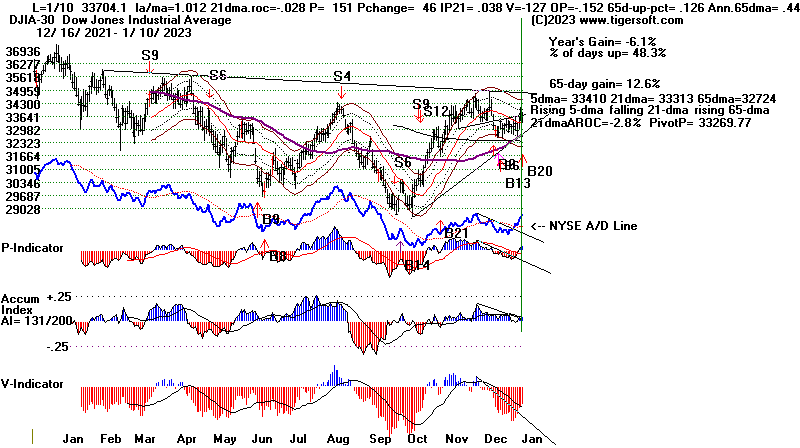 |
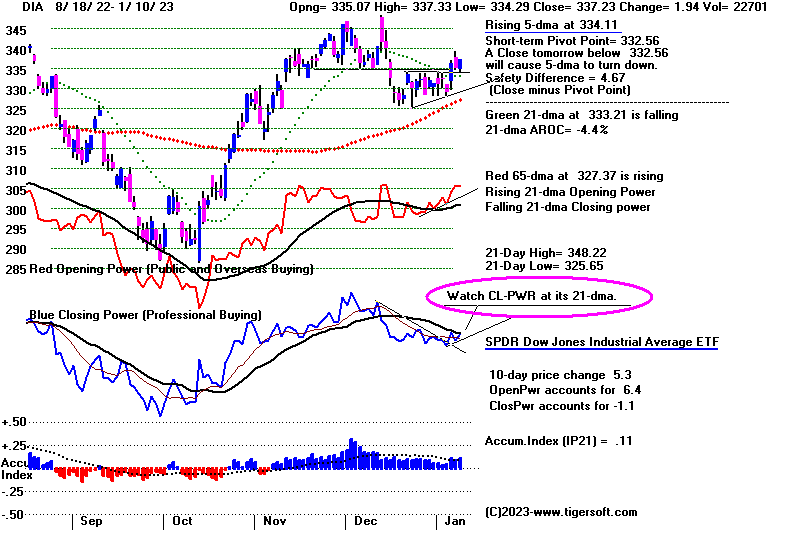 |
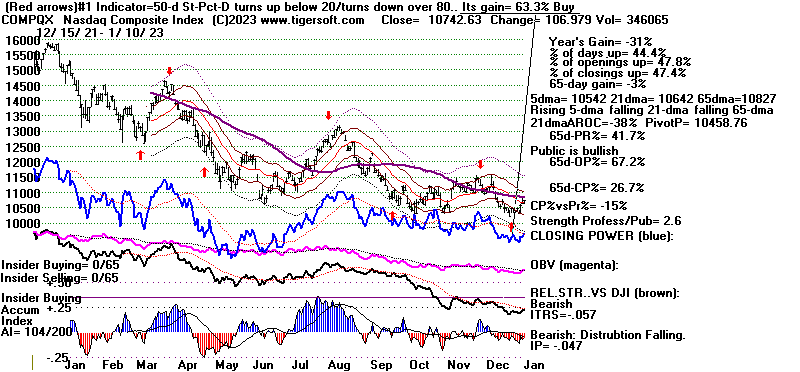 |
 |
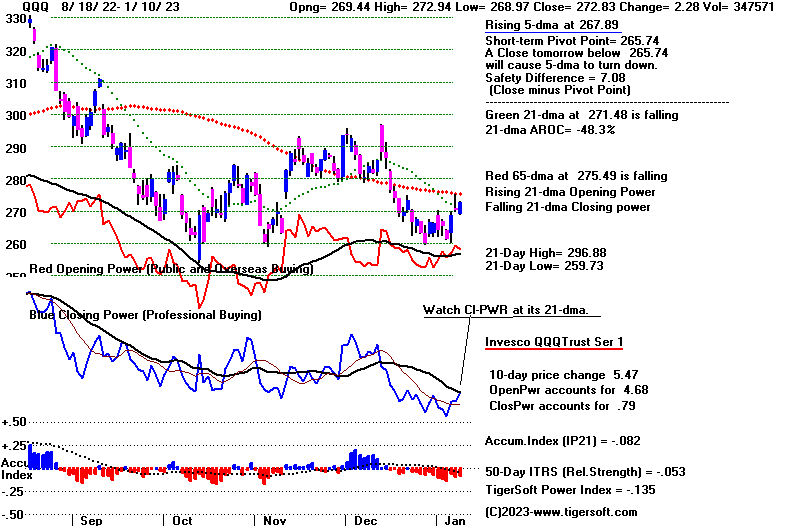 |
 |
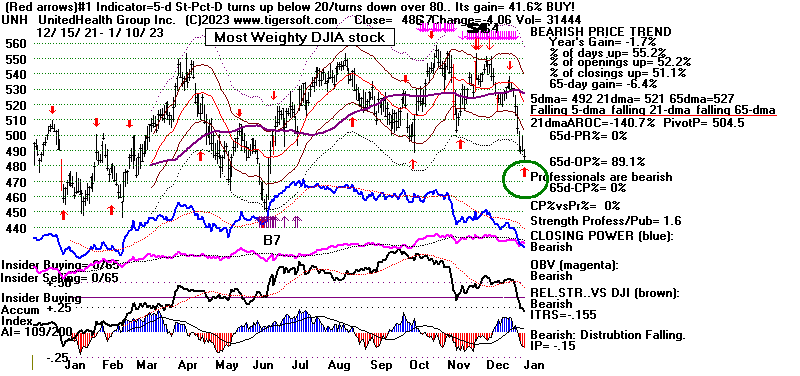 |
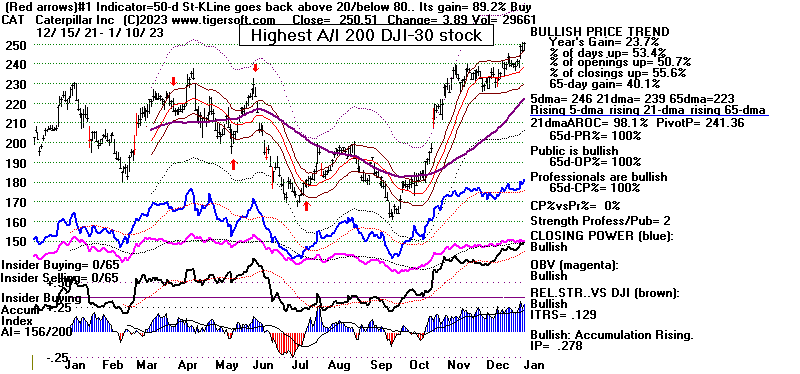 |
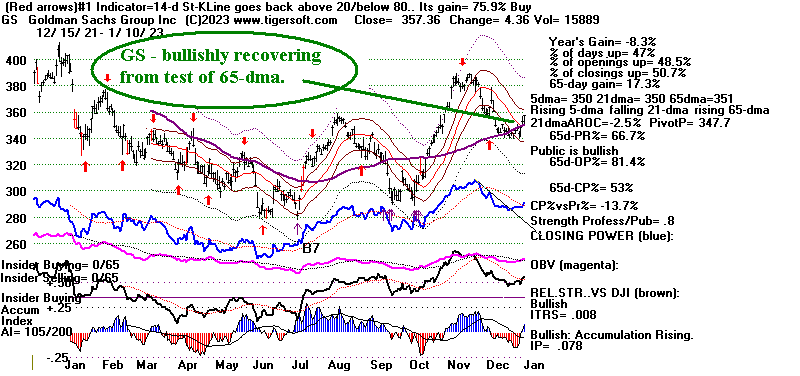 |
TABLE 1 1/10/2023
DJIA 33704.10 186.45 0.56%
S&P 500 3919.25 27.16 0.70%
Nasdaq 10742.63 106.98 1.01%
Advances 2,219 vs 1,907
Declines 877 vs 1,194
New highs 61 + 102 = 163
New lows 6 + 39 = 45
NYSE	Latest Close	Previous Close	Week Ago
Issues traded	3,211	3,221	3,227
Advances	2,219	1,907	1,891
Declines	877	1,194	1,254
Unchanged	115	120	82
New highs	61	100	71
New lows	6	9	36
Adv. volume*	576,499,853	532,993,887	452,276,087
Decl. volume*	185,398,824	373,402,126	441,820,915
Total volume*	779,395,947	915,602,864	898,744,161
Closing Arms (TRIN)†	0.73	0.98	1.58
Block trades*	4,246	4,319	4,692
Adv. volume	2,910,234,212	2,645,690,149	1,920,554,565
Decl. volume	839,364,173	1,619,968,220	2,016,417,140
Total volume	3,851,036,239	4,311,775,122	3,959,146,371
NASDAQ	Latest Close	Previous Close	Week Ago
Issues traded	4,783	4,817	4,843
Advances	3,247	2,759	2,516
Declines	1,326	1,842	2,118
Unchanged	210	216	209
New highs	102	117	107
New lows	39	38	93
Closing Arms (TRIN)†	0.60	0.73	1.18
Block trades	32,689	31,148	31,052
Adv. volume	3,707,433,054	3,431,984,967	2,370,747,920
Decl. volume	914,818,242	1,671,197,811	2,346,852,150
Total volume	4,710,689,070	5,132,191,715	4,780,654,557
|
Table 2 QUICKSILVER on ETFS - 1/10/2023 ---
     Bullish = 1    SOXL,  YINN
     Bearish = 0
ETF       CLOSE   CHANGE    PIVOT-PT    5-dma AROC    CL-PWR  CANDLE  IP21   ITRS   POWER INDEX
================================================================================================
DIA       337.23   1.94      332.56        90.3%     -------   BLUE   .11      ----     -----
---------------------------------------------------------------------------------------------
COMPQX    10742.63   106.98  10458.76      169.8%     -------  BLUE  -.046   -.057    -.103
---------------------------------------------------------------------------------------------
SPY       390.58   2.72      383.76        127.1%     -------  BLUE  -.001   -.024    -.025
---------------------------------------------------------------------------------------------
QQQ       272.83   2.29      265.74        156.8%     -------  BLUE  -.081   -.052    -.133
---------------------------------------------------------------------------------------------
MDY       458.44   4.43      447.45        197.8%     -------  BLUE   .044   -.001     .043
---------------------------------------------------------------------------------------------
IWM       180.51   2.63      175.56        202.4%     -------  BLUE   .005   -.044    -.039
---------------------------------------------------------------------------------------------
FAS       81.57   1.46       77.9          459%       Bullish  BLUE   .078    .111     .189
---------------------------------------------------------------------------------------------
RETL      8.11   .48         7.35          907.5%     -------  BLUE   .17    -.031     .139
---------------------------------------------------------------------------------------------
SOXL      11.97   .44        10.07         1269.5%    -------  BLUE  -.038    .353     .315
---------------------------------------------------------------------------------------------
TECL      23.29   .42        21.65         417.1%     -------  BLUE  -.047   -.07     -.117
---------------------------------------------------------------------------------------------
IBB       133.23   2.95      131.71        121.4%     -------  BLUE  -.038    .015    -.023
---------------------------------------------------------------------------------------------
GLD       174.74   .64       172.67        106.7%     Bullish  BLUE  -.014    .077     .063
---------------------------------------------------------------------------------------------
DBO       14.58  -.05        14.28        -69%        Bullish  RED    .146   -.201    -.055
---------------------------------------------------------------------------------------------
OIH       318.06   5.83      290.66        476.3%     Bullish  BLUE   .184    .035     .219
---------------------------------------------------------------------------------------------
CPER     24.69   .4          22.66         407%       Bullish  BLUE  -.216    .111    -.105
---------------------------------------------------------------------------------------------
TAN     77.04   2.33         73.3          333.6%     Bearish  BLUE  -.143    .024    -.119
---------------------------------------------------------------------------------------------
UUP       27.75   .02        28.01        -64.3%      -------  ----   .164   -.119     .045
---------------------------------------------------------------------------------------------
CORN      25.94   .02        26.11        -132.2%     Bullish  ----   .246   -.098     .148
---------------------------------------------------------------------------------------------
WEAT      7.4  -.13          7.55         -302.6%     Bullish  ----  -.004   -.194    -.198
---------------------------------------------------------------------------------------------
YINN      63.06   2.03       60.7          1024.4%    -------  BLUE  -.007    1.592     1.585
|
Table 3       RANKING OF KEY DIRECTORIES BASED PCT.OF STOCKS ABOVE 65-DMA
              1/10/23
Bullish = 43
Bearish = 5
---------------------------------------------------------------------------------------
Directory     Current       day-1         day-2         day-3         day-4         day-5
----------------------------------------------------------------------------------------
COPPER         1             .857          .857          .857          .857          .857
EDU            1             1             .833          .666          .666          .833
GOLD           .956          .869          .913          .826          .869          .782
UTILITY        .894          .842          .789          .684          .815          .763
HOMEBLDG       .888          .833          .888          .833          .888          .833
INFRA          .878          .878          .878          .787          .878          .757
BONDFUND       .873          .873          .885          .816          .839          .85
DOWJONES       .866          .8            .766          .633          .666          .633
               =====
DJI-13         .846          .769          .769          .615          .615          .615
JETS           .846          .846          .769          .769          .615          .307
INSURANC       .84           .84           .84           .76           .84           .72
ETFS           .836          .836          .818          .763          .781          .727
SEMI           .808          .787          .734          .521          .553          .478
               =====
ELECTRON       .774          .744          .714          .548          .571          .488
CHINA          .772          .772          .795          .795          .795          .727
INDMATER       .763          .722          .708          .583          .638          .555
INDEXES        .756          .708          .708          .497          .578          .481
COMPUTER       .75           .7            .65           .55           .45           .45
CHEM           .744          .744          .72           .581          .674          .627
TRANSP         .736          .684          .578          .526          .473          .315
GREEN          .722          .666          .611          .388          .388          .333
SP500          .717          .696          .713          .587          .666          .561
               =====
SP-100         .711          .677          .722          .622          .655          .622
HIGHPRIC       .693          .642          .59           .448          .573          .452
RUS-1000       .685          .66           .657          .553          .616          .518
               =====
AUTO           .679          .547          .547          .396          .452          .377
FINANCE        .675          .637          .65           .462          .587          .487
               =====
FIDSTKS        .674          .644          .662          .562          .603          .526
NASD-100       .66           .64           .64           .5            .57           .5
GUNS           .642          .642          .642          .571          .571          .428
HOSPITAL       .642          .642          .642          .642          .571          .5
GAMING         .631          .526          .473          .473          .473          .368
RETAIL         .595          .51           .553          .446          .531          .425
MILITARY       .576          .538          .653          .576          .615          .576
BEVERAGE       .571          .642          .642          .571          .714          .571
BIGBANKS       .571          .571          .571          .571          .571          .571
NIFTY          .568          .522          .522          .454          .454          .386
COMODITY       .564          .512          .512          .538          .512          .512
BIOTECH        .562          .488          .525          .502          .502          .411
SOFTWARE       .553          .589          .482          .446          .535          .5
OILGAS         .523          .485          .485          .409          .361          .323
FOOD           .51           .428          .428          .489          .469          .51
LOWPRICE       .51           .461          .426          .363          .346          .283
====================================================================================================
SOLAR          .5            .375          .312          .125          .187          .125
====================================================================================================
REIT           .476          .515          .561          .43           .569          .461
REGBANKS       .4            .36           .4            .28           .28           .32
HACKERS        .312          .375          .375          .375          .375          .375
COAL           .166          .333          .333          .166          .166          .166
MARIJUAN       .1            .1            .1            .1            .2            0
|
==================================================================================
Tuesday
- 6:00 AM - Futures: DJI -171 NASDAQ -67
Data Used: 1/9/2023
| |
1/9/2023DJIA 33517.65 -112.96 -0.34%
S&P 500 3892.09 -2.99 -0.08%
Nasdaq 10635.65 66.36 +0.63%
NYSE Advances 1,907 vs 2,717
NYSE Declines 1,194 vs 433
New highs 100 + 117 = 217
New lows 9 + 38 = 47
|
|
| |
Professionals sold the
DJI off ahead of the NASDAQ today. This is
probably only profit-taking.
Peerless did not give a Sell and the
seasonality remains quite bullish.
The key question now is whether the DJI's
short-term profit-taking in BA
and DJIA drug stocks can turn the larger
market down. Bonds are still rising.
Above, we see that the number of new
highs was more than four times
the number of new lows and there were
still 713 more NYSE advancers
than decliners at the close. GS,
the second most heavily weighted DJI stock rose
and UNH, its superior in the DJI, held
steady at its lower regression channel
band.
It's true that the Professionals
are bearish. The falling Closing Powers
in the key ETFs show that, as does
todays' reversal down in the second
half of today's trading. But
I would still put more weight on the fact
that the 10-year bond yield is
coming down and Bonds are rallying
combined with the bullish
seasonality. If the DJI behaved as it normally
does for the month after January
9th in the years 1967, 1971, 1975, 1979...
2019, it would rise 1.2%. It
was up 73.3% of the time in this period in the
year before Presidential Elections
from 1965 to the present.
I did look at the significance in
the past, since 1999, of the reversal today
with the high tagging the 2.1%
upper band and with negative volume internals
and a falling 21-day ma. In
these circumstances, not allowing for the bullish
seasonality or the presence or the
absence of a Peerless signal, the odds would
favor a decline rather than a
rally. As a result of this information, let's hold off
new buying and see if the DJI can
turn up again after a few day's weakness.
But because Peerless remains on a
Buy, continue to hold all our long positions
and avoid the short side.
Reversal down from 2.2% Upper Band
with 21-dma falling and both ONBPct and PVV(i)<0 and IP21<.03 Cases since 1999-2022
8/18/99 DJI declined to lower band. S9V, S12
12/14/00 DJI decline to lower band. No Peerless Sell.
1/5/01 DJI declined to lower band. S12.
5/15/02 DJI declined below lower band. S9, S12
1/8/03 DJI declined below lower band. S12
11/3/04 Continued to rise.
7/31/06 Continued to rise.
9/9/10 Continued to rise.
12/8/11 Continued to rise
2/27/18 DJI fell below lower band. S9
10/17/19 Continued to rise.
12/16/21 DJI fell below lower band. S9
4/21/22 DJI fell below lower band. No Peerless
Conclusion: 13 cases. 5 (38.5%) cases DJI continued to rise.
5 cases DJI fell below lower band.
3 cases DJI fell to lower band.
Code
For i = 66 To RN
If la(i) <= ma65(i) Then 6509
midpoint = (hi(i) + lo(i)) / 2
If la(i) > midpoint Then 6509
If hi(i) / ma(i) < 1.02 Then 6509
If newipxxx(i) > .025 Then 6509
aroc = ((ma(i) - ma(i - 1)) / ma(i - 1)) * 250
If aroc > 0 Then 6509
If pvv(i) > -80 Then 6509
PI = i: stsells16arrows (PI): GoTo 6509
' These would give a Sell.
6509 Next i
|
|
|
| |
Charts - 1/6/2023
2022 PEERLESS DJI, Signals, Indicators Daily DJI Volume
10-DayUp/Down Vol Stoch-20 CCI RSI Pct of All Stocks above 65-dma
Inverted Traders Index
DJI-IPA DJI-OBV Short-Term Rates
NASDAQ S&P OEX NYSE DJ-15 DJ-20 DJI-30 Bond Funds
DIA QQQ SPY IWM new - COIN (Bit Coin ETF)
TNA Short-Term Rates Ten Year Rates PST (Short Treasuries)
DOLLAR-UUP
ALLSTOCKs
Russell-1000
Insurance-Stocks
Recent 2006 vers-Peerless signals
http://www.tigersoftware.com/OLDPEER/UPD90109.bmp
MDY - http://www.tigersoftware.com/CHARTX/MDY.GIF
USO-CrudeOil DBO FAS GLD HD IBB JETS JNUG KOL NAIL NUGT NRGU OIH
PALL RSX RETL SDS AGQ SLV SOXL TAN TECL TLT TMF TNA UGA USO
China: YINN
CHAU
Commodities: CANE
CORN DBC JJC, NIB CORN, CUT (paper)
MOO, NRGU
SOYB WEAT UUP (Dollar) LIT
(Lithium)
Stocks AA AAPL ADBE ALXN AMAT AMGN AMD AMZN AXP BA BABA
BAC BIDU BLDP CAT CHKP CNX CPB CRM CVX CMG DE DIS ENPH FB FSLR
FTNT GILD GME GOOG GS HD IBM INTU JPM KO KR LRCX MRK MRNA
MOS MSFT NEM NFLX NKE NOC NUE NVDA PANW PG PYPL REGN REV
SO QCOM QDEL TSLA TXN XOM V VRTX WFC WMT XLE ZM ZOM
Leveraged Short ETFs:
FAZ - financials, TZA and SRTY- small caps, MZZ - mid caps, TECS -Techs,
SOXS -
semi-conductors LABD
- Biotechs
Bullish MAXCPs http://www.tigersoftware.com/UPPING/1-9-2023/BULLISH.htm
Bearish MINCPs http://www.tigersoftware.com/Downing/1-9-2023/BEARISH.htm |
|
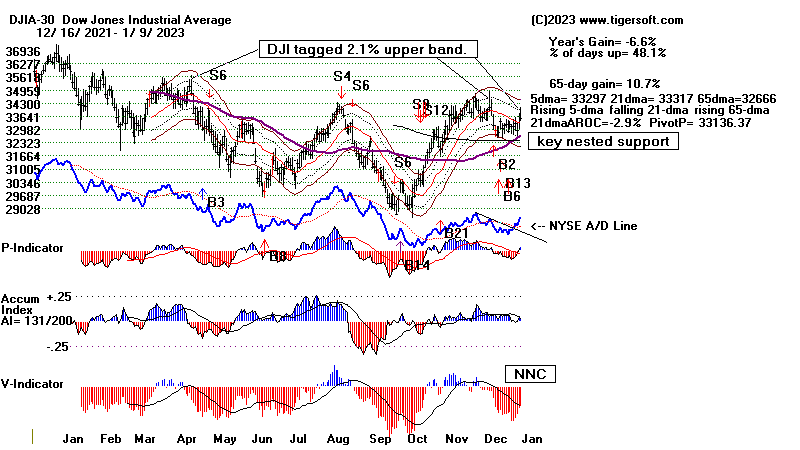
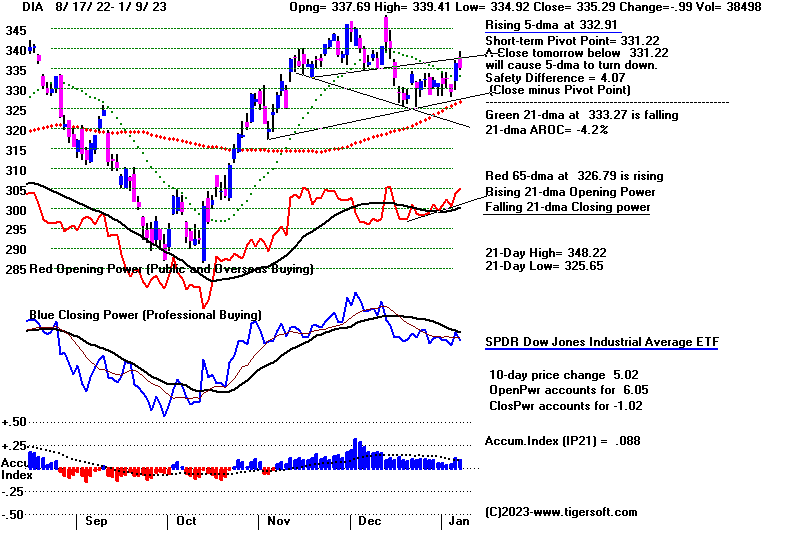
|
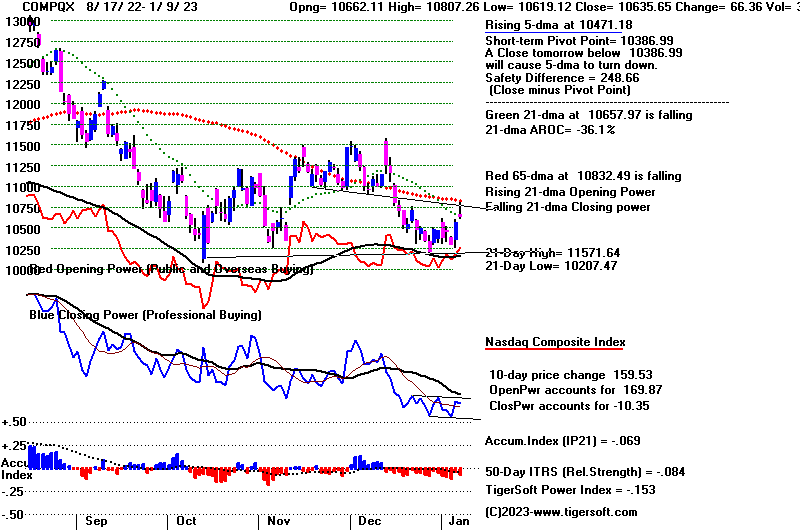 |
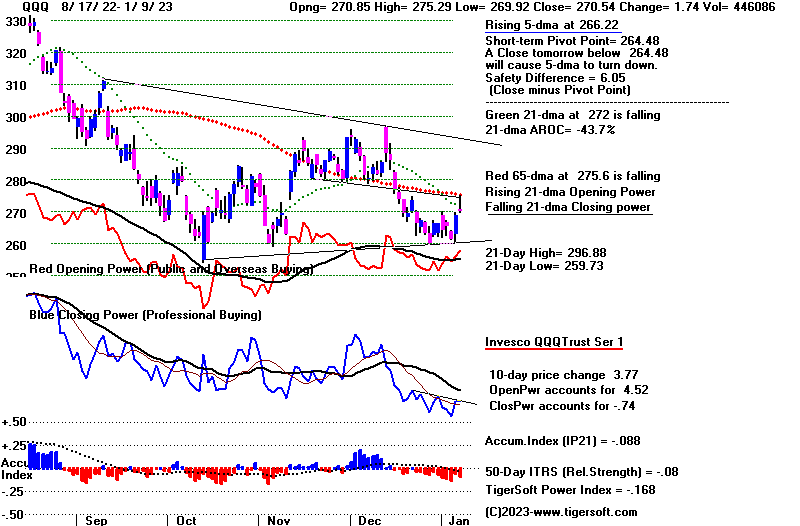 |
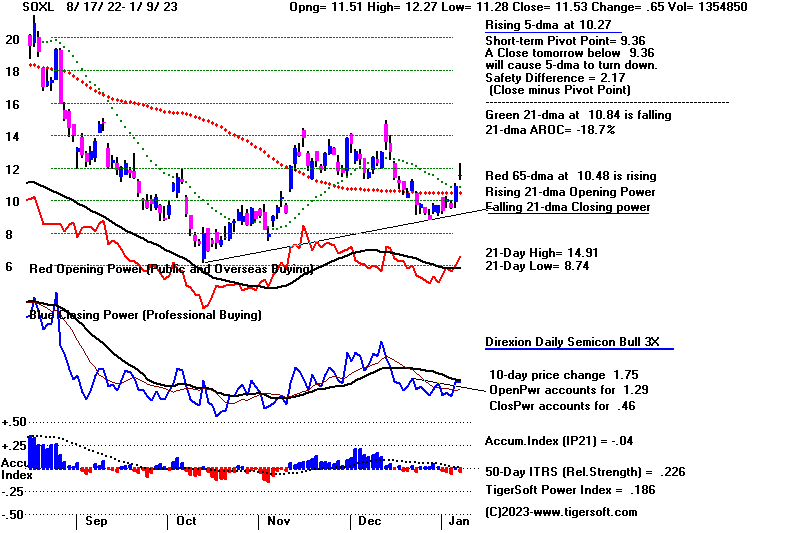 |
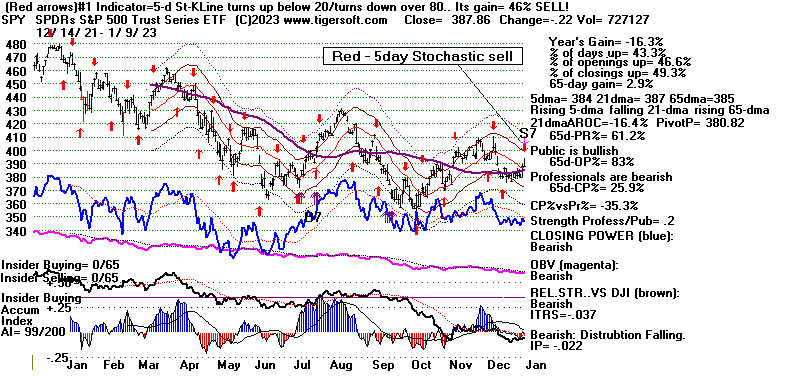 |
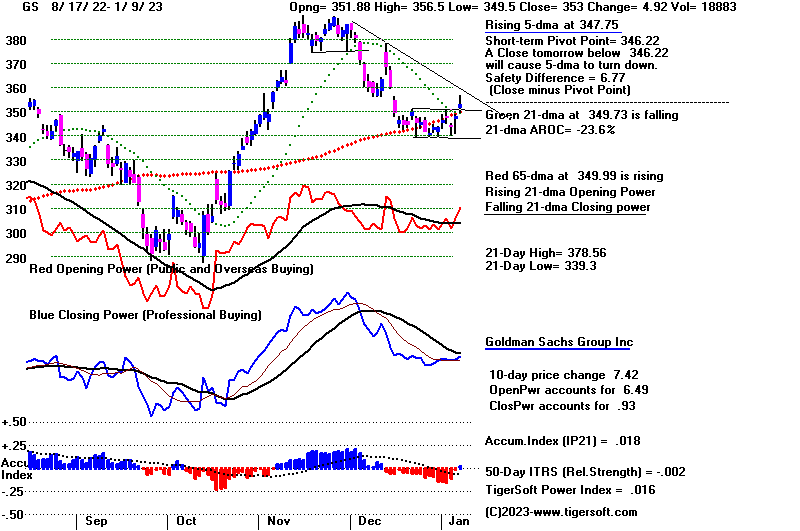 |
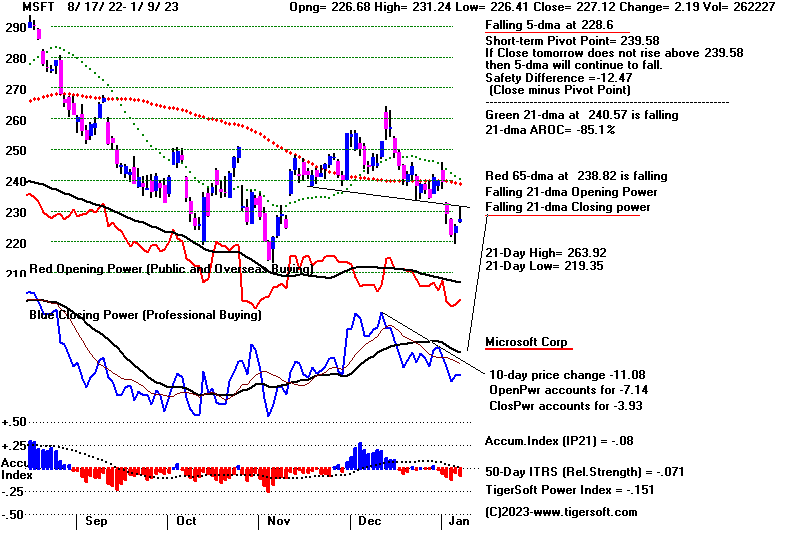 |
The biggest decliners today were BA and drug stocks.
AMGN, MRK and JNJ |
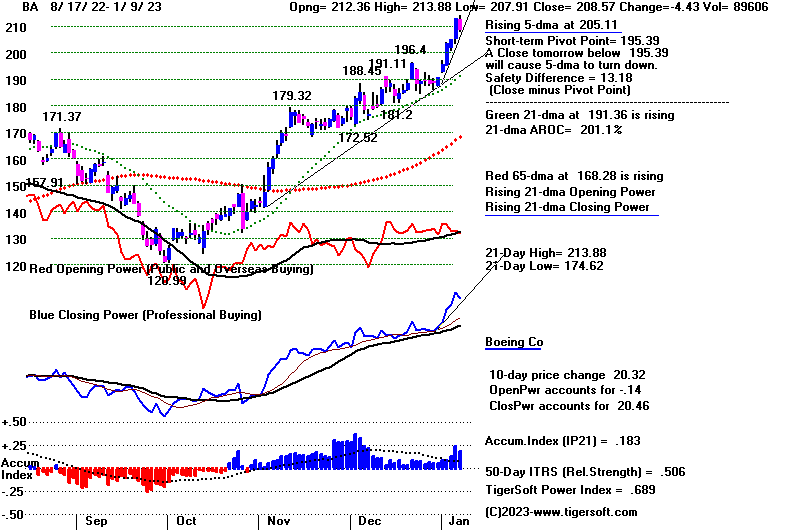 |
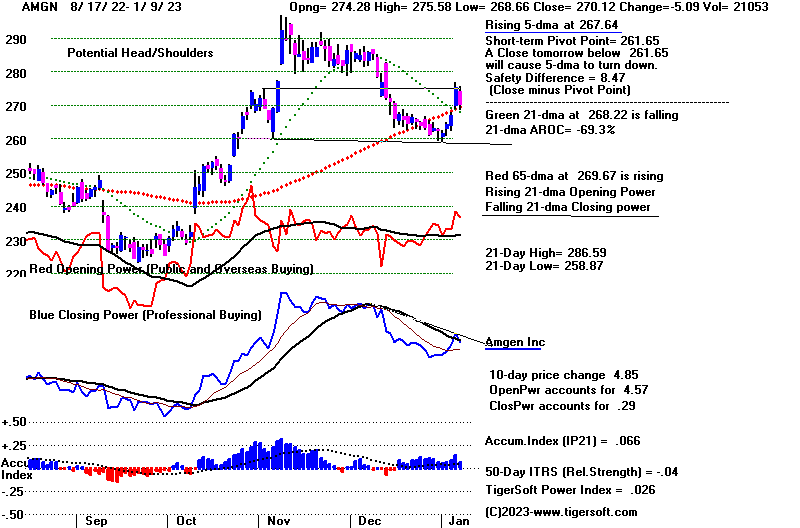 |
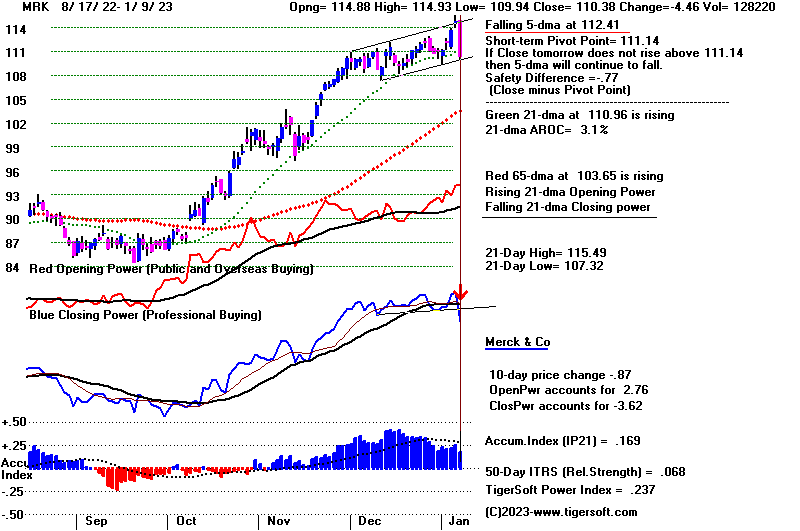 |
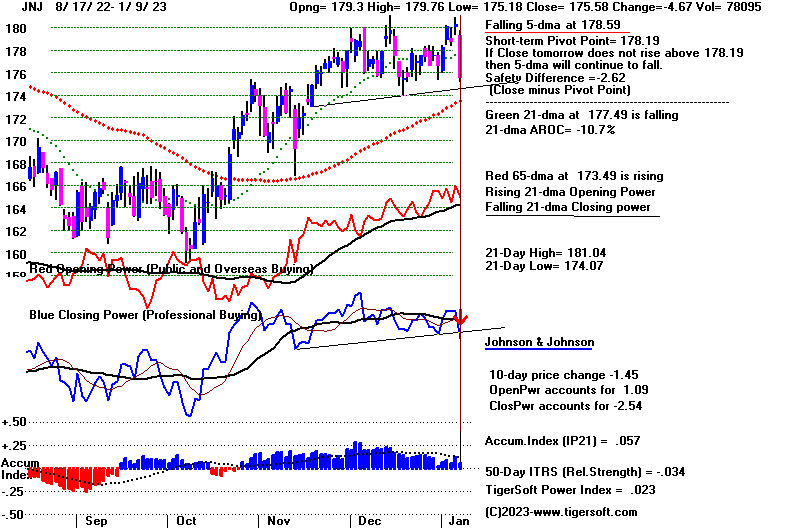 |
Table 1 1/9/2023
DJIA	33517.65	-112.96	-0.34%
S&P 500	3892.09	        -2.99	-0.08%
Nasdaq 	10635.65	66.36	+0.63%
NYSE Advances	1,907  vs	2,717
NYSE Declines	1,194	vs      433
New highs	100 + 117 = 217
New lows	9 + 38  = 47
NYSE	Latest Close	Previous Close	Week Ago
Issues traded	3,221	3,243	3,260
Advances	1,907	2,717	1,400
Declines	1,194	433	1,714
Unchanged	120	93	146
New highs	100	79	49
New lows	9	25	72
Adv. volume*	532,993,887	711,994,375	284,576,532
Decl. volume*	373,402,126	99,292,542	432,299,921
Total volume*	915,602,864	816,001,400	730,101,865
Closing Arms (TRIN)†	0.98	1.18	1.12
Block trades*	4,319	4,390	4,080
Adv. volume	2,645,690,149	3,282,653,340	1,233,684,531
Decl. volume	1,619,968,220	616,491,113	1,685,758,787
Total volume	4,311,775,122	3,923,568,486	2,979,871,579
NASDAQ	Latest Close	Previous Close	Week Ago
Issues traded	4,817	4,914	4,910
Advances	2,759	3,368	2,294
Declines	1,842	1,315	2,378
Unchanged	216	231	238
New highs	117	130	101
New lows	38	101	181
Closing Arms (TRIN)†	0.73	1.25	0.61
Block trades	31,148	37,732	25,909
Adv. volume	3,431,984,967	3,466,700,143	2,304,468,811
Decl. volume	1,671,197,811	1,688,935,916	1,458,576,797
|
Table 2 QUICKSILVER on ETFS - 1/96/2023 ---
     Bullish = 1     YINN
     Bearish = 0
ETF       CLOSE   CHANGE    PIVOT-PT    5-dma AROC    CL-PWR  CANDLE  IP21   ITRS   POWER INDEX
================================================================================================
DIA       335.29  -.99       331.22        59.6%      -------  RED    .088   ----------------
---------------------------------------------------------------------------------------------
COMPQX    10635.65   66.36   10386.99      81%        -------  RED   -.069   -.084    -.153
---------------------------------------------------------------------------------------------
SPY       387.86  -.22       380.82        70.9%      -------  RED   -.021   -.038    -.059
---------------------------------------------------------------------------------------------
QQQ       270.54   1.74      264.48        80.3%      -------  RED   -.088   -.08     -.168
---------------------------------------------------------------------------------------------
MDY       454.01  -.12       440.72        125.9%     -------  RED    .011   -.012    -.001
---------------------------------------------------------------------------------------------
IWM       177.88   .3        173.4         100.6%     -------  RED   -.039   -.06     -.099
---------------------------------------------------------------------------------------------
FAS       80.11  -.96        74.42         428.3%     -------  RED    .033    .117     .15
---------------------------------------------------------------------------------------------
RETL      7.63  -.09         6.78          472.7%     -------  RED    .103   -.077     .026
---------------------------------------------------------------------------------------------
SOXL      11.53   .66        9.36          938.6%     -------  ----  -.039    .227     .188
---------------------------------------------------------------------------------------------
TECL      22.87   .75        21.48         178.7%     -------  BLUE  -.033   -.12     -.153
---------------------------------------------------------------------------------------------
IBB       130.28  -2.86      130.04       -38.4%      -------  RED   -.042   -.024    -.066
---------------------------------------------------------------------------------------------
GLD       174.1   .39        171.06        130%       Bullish  RED   -.038    .07      .032
---------------------------------------------------------------------------------------------
DBO       14.63   .24        14.78        -198.6%     Bullish  RED    .074   -.19     -.116
---------------------------------------------------------------------------------------------
OIH       312.23   6.65      289.59        137.6%     Bullish  RED    .098    .01      .108
---------------------------------------------------------------------------------------------
CPER     24.29   .5          22.79         259.7%     Bullish  BLUE  -.253    .082    -.171
---------------------------------------------------------------------------------------------
TAN     74.71   .84          72.17         121.8%     Bearish  RED   -.182    .002    -.18
---------------------------------------------------------------------------------------------
UUP       27.73  -.17        28.11        -14.3%      Bearish  ----   .137   -.113     .024
---------------------------------------------------------------------------------------------
CORN      25.92  -.01        26.63        -192%       Bullish  ----   .258   -.103     .155
---------------------------------------------------------------------------------------------
WEAT      7.53   .01         7.86         -292.5%     Bullish  ----   .008   -.182    -.174
---------------------------------------------------------------------------------------------
YINN      61.03   .11        51.01         1329.5%     -------  RED   -.01    1.311     1.301
|
 Table 3      RANKING OF KEY DIRECTORIES BASED PCT.OF STOCKS ABOVE 65-DMA
              1/9/23
 Bullish = 40
 Bearish 9
---------------------------------------------------------------------------------------
Directory     Current       day-1         day-2         day-3         day-4         day-5
----------------------------------------------------------------------------------------
EDU            1             .833          .666          .666          .833          .833
INFRA          .878          .878          .787          .878          .757          .848
BONDFUND       .873          .885          .816          .839          .85           .758
GOLD           .869          .913          .826          .869          .782          .782
COPPER         .857          .857          .857          .857          .857          .857
JETS           .846          .769          .769          .615          .307          .307
UTILITY        .842          .789          .684          .815          .763          .815
INSURANC       .84           .84           .76           .84           .76           .72
ETFS           .836          .818          .763          .781          .763          .727
HOMEBLDG       .833          .888          .833          .888          .833          .833
DOWJONES       .8            .766          .633          .666          .633          .633
SEMI           .787          .734          .521          .553          .478          .563
CHINA          .772          .795          .795          .795          .727          .681
DJI-13         .769          .769          .615          .615          .615          .769
CHEM           .744          .72           .581          .674          .627          .604
ELECTRON       .744          .714          .548          .571          .488          .541
INDMATER       .722          .708          .583          .638          .569          .583
INDEXES        .708          .708          .497          .578          .481          .529
COMPUTER       .7            .65           .55           .45           .45           .4
SP500          .696          .713          .587          .662          .573          .593
TRANSP         .684          .578          .526          .473          .315          .368
SP-100         .677          .722          .622          .655          .622          .611
GREEN          .666          .611          .388          .388          .333          .333
RUS-1000       .66           .657          .553          .616          .53           .556
FIDSTKS        .644          .662          .562          .603          .538          .562
BEVERAGE       .642          .642          .571          .714          .571          .714
GUNS           .642          .642          .571          .571          .428          .5
HIGHPRIC       .642          .59           .448          .573          .469          .512
HOSPITAL       .642          .642          .642          .571          .5            .571
NASD-100       .64           .64           .5            .57           .5            .53
FINANCE        .637          .65           .462          .575          .487          .45
SOFTWARE       .589          .5            .446          .535          .5            .464
BIGBANKS       .571          .571          .571          .571          .571          .285
AUTO           .547          .547          .396          .452          .377          .358
MILITARY       .538          .653          .576          .615          .615          .692
GAMING         .526          .473          .421          .526          .368          .368
NIFTY          .522          .522          .454          .454          .386          .431
REIT           .515          .553          .438          .576          .453          .446
COMODITY       .512          .512          .512          .512          .512          .589
RETAIL         .51           .553          .446          .531          .446          .446
===============================================================================================
BIOTECH        .488          .522          .505          .502          .42           .403
OILGAS         .485          .485          .409          .361          .323          .485
LOWPRICE       .461          .429          .366          .346          .286          .263
FOOD           .428          .428          .469          .469          .51           .632
HACKERS        .375          .375          .375          .375          .375          .375
SOLAR          .375          .312          .125          .187          .125          .187
REGBANKS       .36           .4            .28           .28           .32           .36
COAL           .333          .333          .166          .166          .166          .166
MARIJUAN       .1            .1            .1            .2            0             .1
|
==================================================================================
Monday
- 5:15 AM - Futures: DJI +89 NASDAQ +49 Data
Used: 1/6/2023
| |
        1/6/2023
DJIA	33630.61	700.53	2.13%
S&P 500	3895.08	        86.98	2.28%
Nasdaq 	10569.29	264.05	2.56%
NY advances  = 2,717  vs  1,293
NY declines  =   433  vs  1,831
new highs = 79 + 130 = 209
new lows  = 25 + 101 = 126
|
|
| |
Our seasonal Peerless Buys look
like they will bring a DJI rally to the upper
3% band, about 700 points higher. A Sell
there is by no means certain.
Breadth was excellent Friday as the DJI moved
up more than 2%. Note that
January short-covering along with
bargain-hunting in beaten down techs is at
work here. Avoid the short side, hold
long DIA, SOXL, CAT (our current
Tahiti DJI stock) and some of the bullish
MAXCPs.
There is lots of overhead resistance. A
low volume rally like we are
seeing will take some time to overcome it.
Small retracements should
be expected.
A number of DJI blue chips, shown below, are
breaking out, just as we might
expect if this were to be a January
"lift-off". That might seem to be asking
a lot so long as the FED does not declare a
cessation in its raising of interest
rates. But they are only human, right.
Powell and his friends very late to raise
rates. Now they are afraid to be late to
lower them. It may not matter. No
FOMC is scheduled this month and mere silence
from them appears to be
golden. In fact, gold stocks are lifting
off now because they sense the FED
will be quiet this month even after last
Friday's good Jobs Report. The "gold
bugs" love unattended inflation. In
additon, the strength in Bonds now also
supports the notion that the FED will not
intrude this month.
Let's see if we can get a second good day of
really fine breadth and a strong
closing to show that Professionals want more of
this rally. Volume will
need to pick up, too. But we have gotten
used to the blue chips being
the best way to play the market. So, even
if the Nasdaq, QQQ and
IWM continue to lag, we can do alright.
Just avoid the short side.
|
|
| |
Charts - 1/6/2023
2022 PEERLESS DJI, Signals, Indicators Daily DJI Volume
10-DayUp/Down Vol Stoch-20 CCI RSI Pct of All Stocks above 65-dma
Inverted Traders Index
DJI-IPA DJI-OBV Short-Term Rates
NASDAQ S&P OEX NYSE DJ-15 DJ-20 DJI-30 Bond Funds
DIA QQQ SPY IWM new - COIN (Bit Coin ETF)
TNA Short-Term Rates Ten Year Rates PST (Short Treasuries)
DOLLAR-UUP
ALLSTOCKs
Russell-1000
Insurance-Stocks
Recent 2006 vers-Peerless signals
http://www.tigersoftware.com/OLDPEER/UPD90106.bmp
MDY - http://www.tigersoftware.com/CHARTX/MDY.GIF
USO-CrudeOil DBO FAS GLD HD IBB JETS JNUG KOL NAIL NUGT NRGU OIH
PALL RSX RETL SDS AGQ SLV SOXL TAN TECL TLT TMF TNA UGA USO
China:
YINN CHAU
Commodities: CANE
CORN DBC JJC, NIB CORN, CUT (paper)
MOO, NRGU
SOYB WEAT UUP (Dollar) LIT
(Lithium)
China: YINN
CHAU
Commodities: CANE
CORN DBC JJC, NIB CORN, CUT (paper)
MOO, NRGU
SOYB WEAT UUP (Dollar) LIT
(Lithium)
Stocks AA AAPL ADBE ALXN AMAT AMGN AMD AMZN AXP BA BABA
BAC BIDU BLDP CAT CHKP CNX CPB CRM CVX CMG DE DIS ENPH FB FSLR
FTNT GILD GME GOOG GS HD IBM INTU JPM KO KR LRCX MRK MRNA
MOS MSFT NEM NFLX NKE NOC NUE NVDA PANW PG PYPL REGN REV
SO QCOM QDEL TSLA TXN XOM V VRTX WFC WMT XLE ZM ZOM
Leveraged Short ETFs:
FAZ - financials, TZA and SRTY- small caps, MZZ - mid caps, TECS -Techs,
SOXS -
semi-conductors LABD
- Biotechs
Bullish MAXCPs http://www.tigersoftware.com/UPPING/1-6-2023/BULLISH.htm
Bearish MINCPs http://www.tigersoftware.com/Downing/1-6-2023/BEARISH.htm |
|
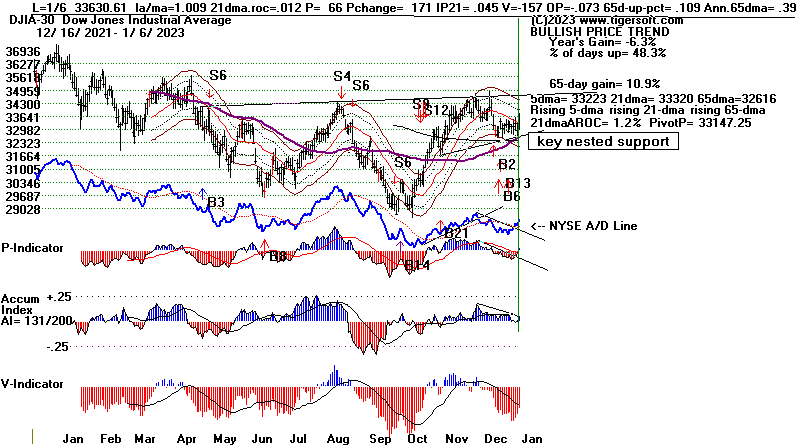
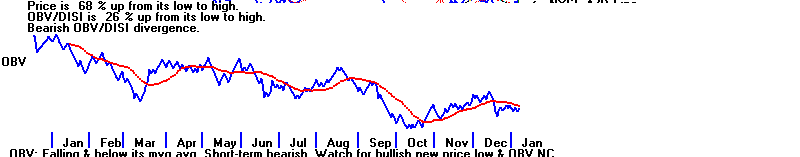 |
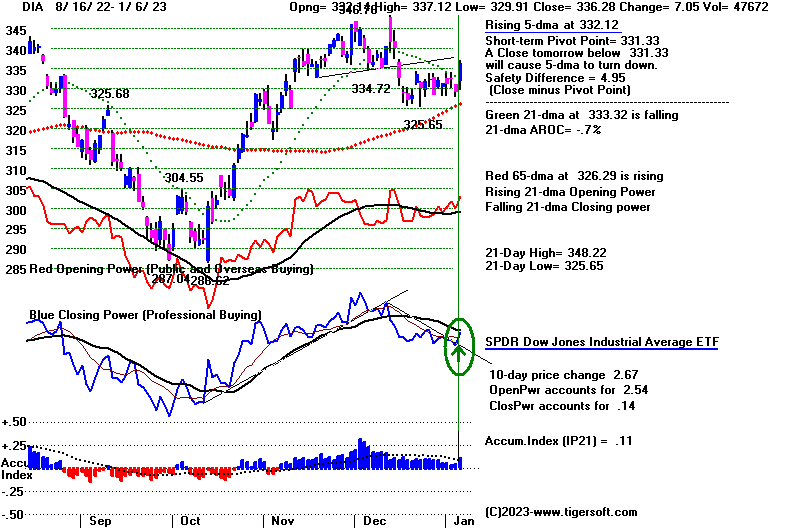 |
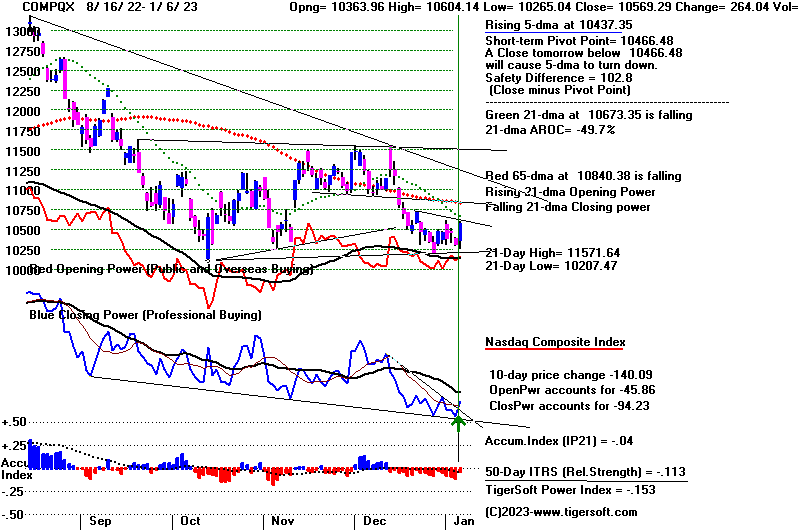 |
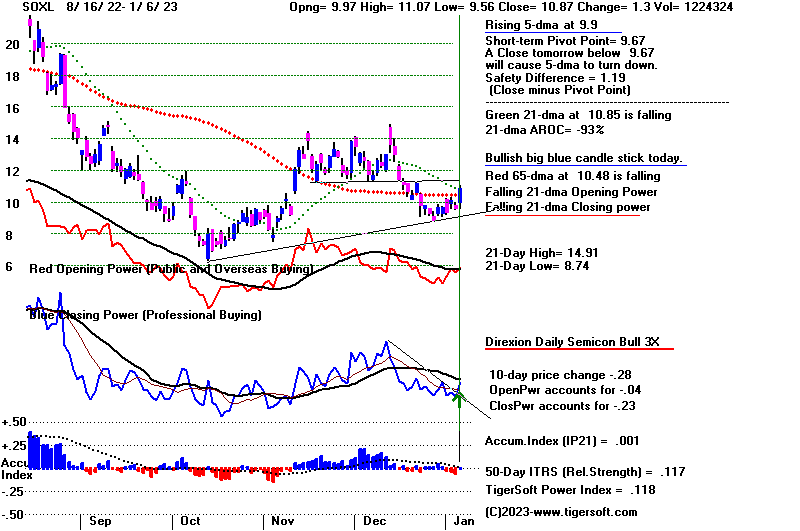 |
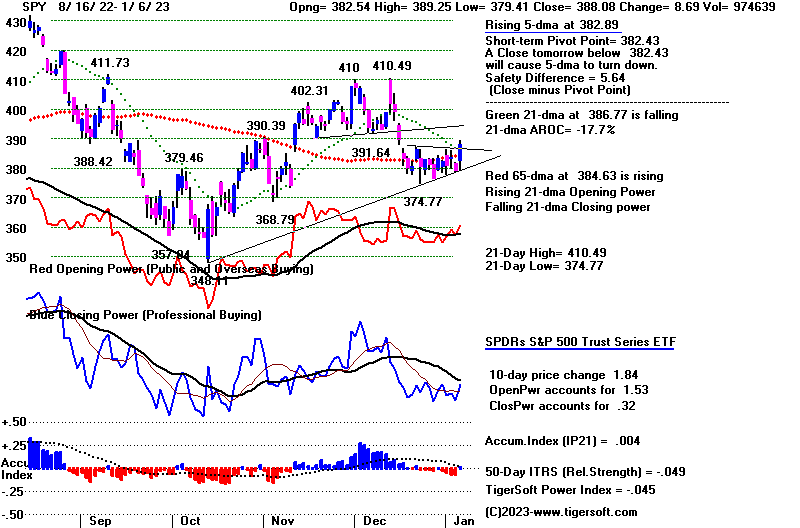 |
Bullish looking breakouts in DJI-30 stocks
TRV, CAT, MRK, JPM (impending)
BA -runaway |
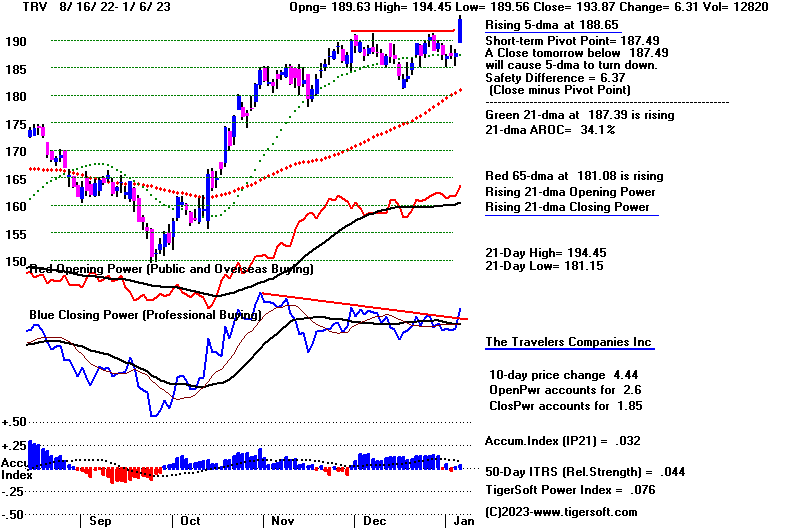 |
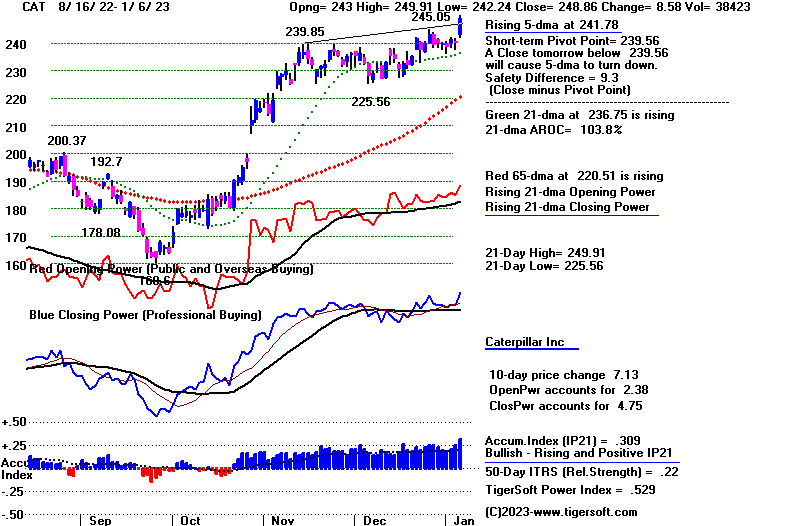 |
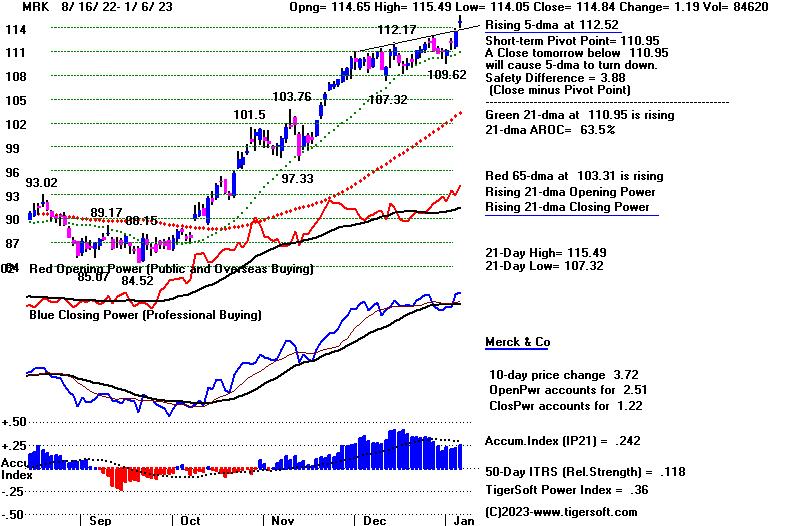 |
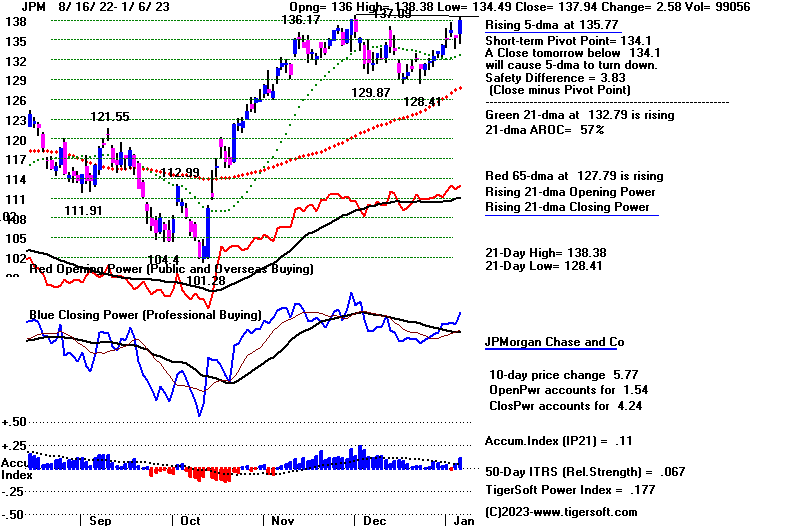 |
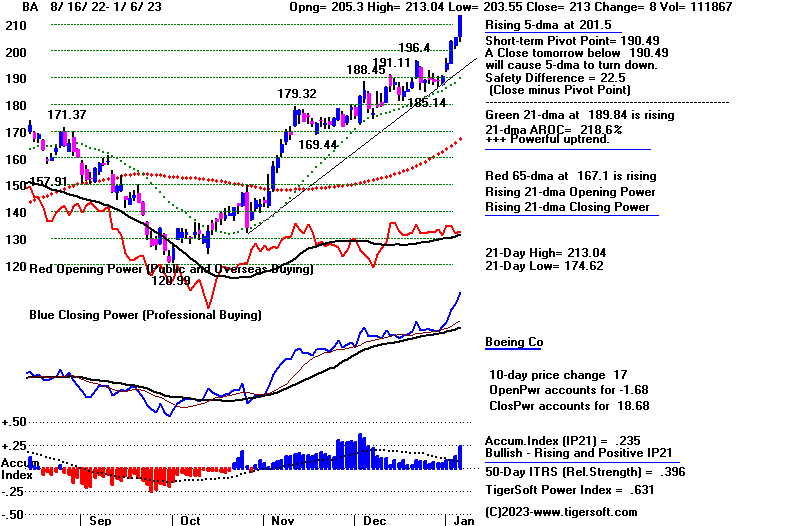 |
Question now is will GS and HD turn around and breakout of tight
little range it is in?
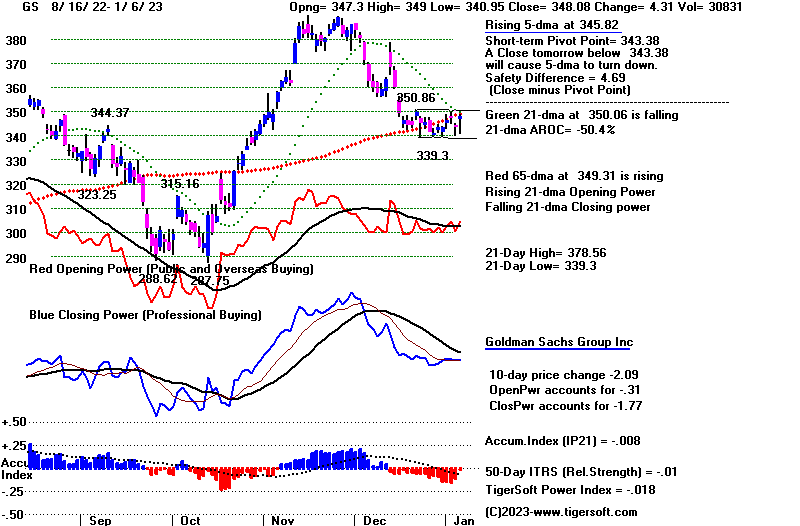
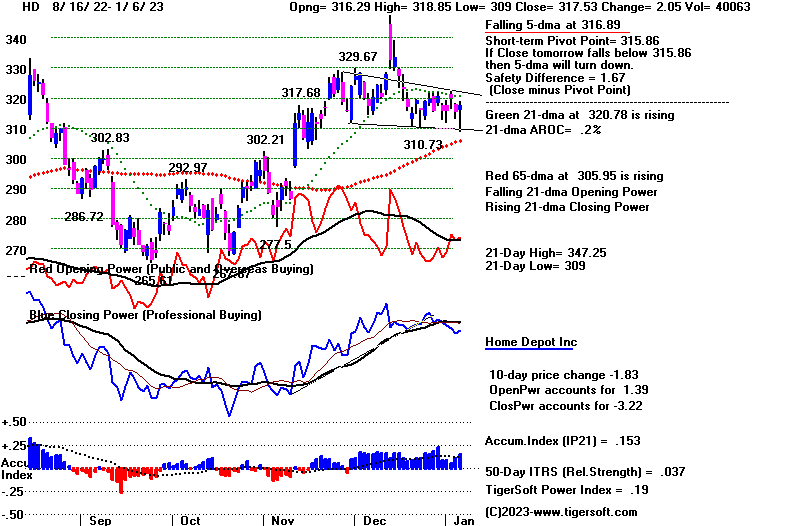 |
Will most weighty DJI stock, UNH, bounce back or breakdown?
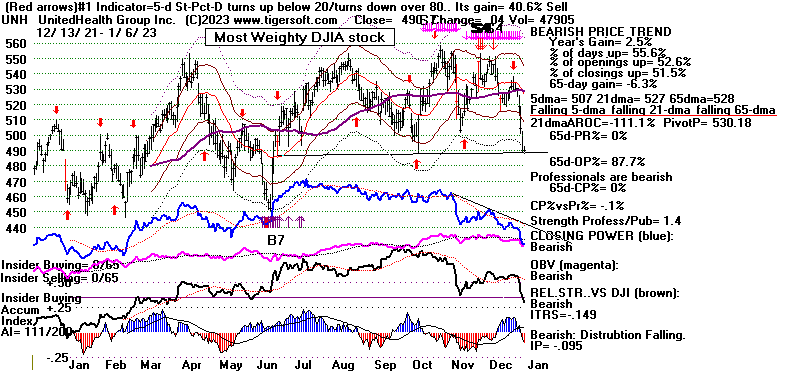 |
Will AMGN get past expected resistance at 280?
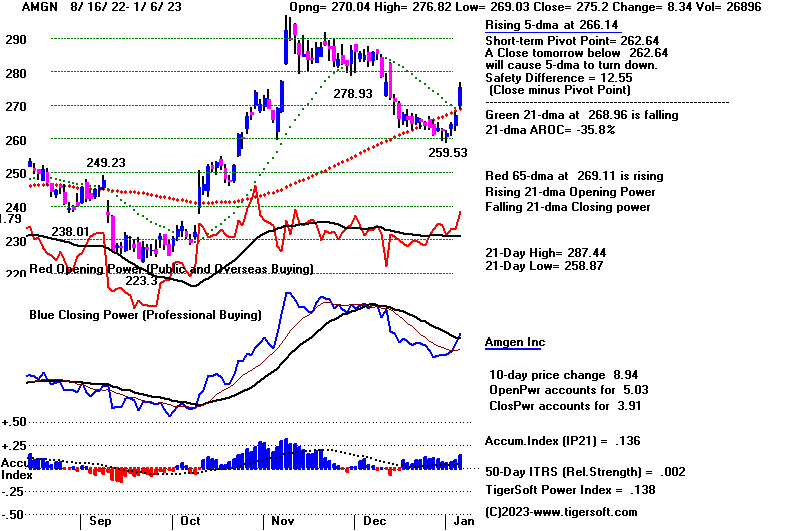 |
Table 1 - Breadth and Volume Statistics 1/6/2023
DJIA 33630.61 700.53 2.13%
S&P 500 3895.08 86.98 2.28%
Nasdaq 10569.29 264.05 2.56%
NY advances  = 2,717  vs  1,293
NY declines  =   433  vs  1,831
new highs = 79 + 130 = 209
new lows  = 25 + 101 = 126
NYSE	Latest Close	Previous Close	Week Ago
Issues traded	3,243	3,235	3,260
Advances	2,717	1,293	1,400
Declines	433	1,831	1,714
Unchanged	93	111	146
New highs	79	64	49
New lows	25	37	72
Adv. volume*	711,994,375	335,046,086	284,576,532
Decl. volume*	99,292,542	527,903,261	432,299,921
Total volume*	816,001,400	867,785,830	730,101,865
Closing Arms (TRIN)†	1.18	0.90	1.12
Block trades*	4,390	4,272	4,080
Adv. volume	3,282,653,340	1,703,063,575	1,233,684,531
Decl. volume	616,491,113	2,160,135,607	1,685,758,787
Total volume	3,923,568,486	3,893,457,747	2,979,871,579
NASDAQ	Latest Close	Previous Close	Week Ago
Issues traded	4,914	4,821	4,910
Advances	3,368	1,892	2,294
Declines	1,315	2,720	2,378
Unchanged	231	209	238
New highs	130	106	101
New lows	101	90	181
Closing Arms (TRIN)†	1.25	0.96	0.61
Block trades	37,732	32,833	25,909
Adv. volume	3,466,700,143	1,976,420,487	2,304,468,811
Decl. volume	1,688,935,916	2,733,905,411	1,458,576,797
Total volume	5,199,787,458	4,764,276,405	3,959,035,029
|
Table 2 QUICKSILVER on ETFS - 1/6/2023 --- Bullish = 1 YINN
Bearish = 0
ETF       CLOSE   CHANGE    PIVOT-PT    5-dma AROC    CL-PWR  CANDLE  IP21   ITRS   POWER INDEX
================================================================================================
DIA       336.28   7.06      331.33        63.7%     -------  BLUE   .11     ----    -------
---------------------------------------------------------------------------------------------
COMPQX    10569.29   264.05  10466.48      43.8%     Bearish  BLUE  -.039   -.112      -.151
---------------------------------------------------------------------------------------------
SPY       388.08   8.7       382.43        60.7%     -------  BLUE   .005   -.048      -.043
---------------------------------------------------------------------------------------------
QQQ       268.8   7.22       266.28        44.5%     Bearish  BLUE  -.057   -.11      -.167
---------------------------------------------------------------------------------------------
MDY       454.13   11.28     442.79        105.4%     -------  BLUE   .027   -.012     .015
---------------------------------------------------------------------------------------------
IWM       177.58   3.9       174.36        78.3%     -------  BLUE  -.032    -.059    -.091
---------------------------------------------------------------------------------------------
FAS       81.07   5.11       73.55         448.6%     Bullish  BLUE   .037    .138     .175
---------------------------------------------------------------------------------------------
RETL      7.72   .56         6.95          583.4%     Bearish  BLUE   .156   -.071     .085
---------------------------------------------------------------------------------------------
SOXL      10.87   1.3        9.67          620.6%     Bearish  BLUE   .002    .118     .12
---------------------------------------------------------------------------------------------
TECL      22.12   1.75       22.1         -18.6%     Bearish  BLUE   .004    -.214    -.21
---------------------------------------------------------------------------------------------
IBB       133.14   1.32      131.29        68.6%     -------  BLUE   .049     .012     .061
---------------------------------------------------------------------------------------------
GLD       173.71   3.19      169.64        142.5%     Bullish  BLUE   .012    .072     .084
---------------------------------------------------------------------------------------------
DBO       14.39   .04        15.21        -166.7%     Bullish  RED    .057   -.177    -.12
---------------------------------------------------------------------------------------------
OIH       305.58   9.44      304.05        62.4%     Bullish  BLUE   .099     .024     .123
---------------------------------------------------------------------------------------------
CPER     23.79   .61         23.09         137.1%     Bullish  BLUE  -.229    .103    -.126
---------------------------------------------------------------------------------------------
TAN     73.87   2.96         72.94         54.5%     Bearish  BLUE  -.146     .031    -.115
---------------------------------------------------------------------------------------------
UUP       27.9  -.37         27.81         0%     -------  RED    .13        -.12      .01
---------------------------------------------------------------------------------------------
CORN      25.93   0          26.93        -194.3%     Bullish  RED    .269   -.106     .163
---------------------------------------------------------------------------------------------
WEAT      7.52  -.03         7.98         -187.1%     Bullish  RED    .052   -.177    -.125
---------------------------------------------------------------------------------------------
YINN      60.92   .5         46.18         1041.7%     Bullish  BLUE   .042  1.577     1.619
|
Table 3       RANKING OF KEY DIRECTORIES BASED PCT.OF STOCKS ABOVE 65-DMA
              1/6/23
 Bullish = 39
 Bearish = 9
---------------------------------------------------------------------------------------
Directory     Current       day-1         day-2         day-3         day-4         day-5
----------------------------------------------------------------------------------------
GOLD           .913          .826          .869          .782          .782          .782
HOMEBLDG       .888          .833          .888          .833          .833          .888
BONDFUND       .885          .816          .839          .85           .77           .735
INFRA          .878          .787          .878          .757          .848          .878
COPPER         .857          .857          .857          .857          .857          1
INSURANC       .84           .76           .84           .76           .72           .76
EDU            .833          .666          .666          .833          .833          .666
ETFS           .818          .763          .781          .763          .745          .763
CHINA          .795          .795          .795          .727          .681          .659
UTILITY        .789          .684          .815          .763          .815          .842
DJI-13         .769          .615          .615          .615          .769          .769
JETS           .769          .769          .615          .307          .307          .307
DOWJONES       .766          .633          .666          .633          .633          .733
               =====
SEMI           .734          .521          .553          .478          .553          .574
SP-100         .722          .622          .655          .622          .622          .655
CHEM           .72           .581          .674          .627          .604          .674
ELECTRON       .714          .548          .571          .488          .533          .548
SP500          .713          .587          .662          .569          .608          .642
              ======
INDMATER       .708          .583          .638          .569          .583          .611
INDEXES        .702          .497          .578          .481          .535          .524
FIDSTKS        .662          .562          .603          .538          .562          .597
RUS-1000       .657          .553          .616          .53           .561          .583
              =======
MILITARY       .653          .576          .615          .615          .692          .615
COMPUTER       .65           .55           .45           .45           .4            .45
FINANCE        .65           .462          .575          .475          .45           .512
BEVERAGE       .642          .571          .714          .571          .714          .785
GUNS           .642          .571          .571          .428          .5            .428
HOSPITAL       .642          .642          .571          .5            .571          .571
NASD-100       .64           .5            .57           .5            .54           .55
              ======
GREEN          .611          .388          .388          .333          .333          .5
HIGHPRIC       .59           .448          .573          .469          .525          .56
TRANSP         .578          .526          .473          .315          .368          .368
BIGBANKS       .571          .571          .571          .571          .285          .428
REIT           .553          .43           .584          .461          .469          .507
RETAIL         .553          .446          .531          .446          .446          .489
AUTO           .547          .396          .452          .377          .377          .377
BIOTECH        .522          .502          .505          .42           .406          .403
NIFTY          .522          .454          .454          .386          .454          .477
COMODITY       .512          .512          .487          .512          .589          .615
=============================================================================================
SOFTWARE       .5            .464          .535          .5            .464          .482
=============================================================================================
OILGAS         .485          .409          .361          .323          .485          .476
GAMING         .473          .421          .473          .421          .421          .421
LOWPRICE       .429          .369          .349          .286          .263          .257
FOOD           .428          .469          .448          .51           .632          .612
REGBANKS       .4            .28           .28           .32           .36           .4
HACKERS        .375          .375          .375          .375          .375          .375
COAL           .333          .166          .166          .166          .166          .166
SOLAR          .312          .125          .187          .125          .187          .187
MARIJUAN       .1            .1            .2            0             .1            .1
|
================================================================================
Friday -
6:04 AM - Futures:
DJI +345 NASDAQ +127 Data Used:
1/5/2023
| |
           1/5/2023
DJIA	32930.08	-339.69	-1.02
S&P 500	3808.10	        -44.87	-1.16
Nasdaq	10305.24	-153.52	-1.47
NYSE Advances	1,293  vs	2,534
NYSE Declines	1,831  vs 	611
New Highs =  64 + 106 = 170
New Lows  =  37 + 90  = 127
|
|
| |
Again Short-Term Rates
moved up past 4.5%. This put the fear in those holding
last year's best performers and they nailed down profits in a number of
DJI-30 stocks.
Just five of the DJI-30, HON, UNH, HD, MSFT and GS, accounted for 240
points
of today's decline. Watch their key support levels shown below.
A break in them
and the DJI's 65-dma would force us to cast to the side the bullish
seasonality that
we have been relying on to try to get a good recovery in DIA and SOXL.
I studied the data back to 1929 to see how significant it is that the
DJI remains
below its 21-dma this far into the new year, when normally there should
be a
rally to the upper band. The only case where there was no such
rally was in
1931. In this case, the DJI made a fake-out sell-off to a new low
in mid January
and then rallied above the upper band in February. This, of
course, was in a long
bear market that had much further to drop in 1932 when more banks
failed and
the Depression deepened.
There are two other cases where January was very weak. In
1982 and 2008 much
bigger bear market declines followed. From this, I would
conclude that we really
must see a rally in the next week. Another week of
"no traction' is bound
to bring a breaking of support in the weak NASDAQ and QQQ.
And most likely,
the DJI will then fall below its key nested support, shown below.
But for now, we see a higher opening on a positive Jobs' Report.
Let's see if
Professionals add to positions on this rally rather than again
sell into the early
gains. That would be much more in keeping with the expected
bullish seasonality,
but another big reversal down today would be scary. In that
case, we
would have to sell if the support levels shown below are broken.
|
|
| |
Charts - 1/5/2023
2022 PEERLESS DJI, Signals, Indicators Daily DJI Volume
10-DayUp/Down Vol Stoch-20 CCI RSI Pct of All Stocks above 65-dma
Inverted Traders Index
DJI-IPA DJI-OBV Short-Term Rates
NASDAQ S&P OEX NYSE DJ-15 DJ-20 DJI-30 Bond Funds
DIA QQQ SPY IWM new - COIN (Bit Coin ETF)
TNA Short-Term Rates Ten Year Rates PST (Short Treasuries)
DOLLAR-UUP
ALLSTOCKs
Russell-1000
Insurance-Stocks
Recent 2006 vers-Peerless signals
http://www.tigersoftware.com/OLDPEER/UPD90105.bmp
MDY - http://www.tigersoftware.com/CHARTX/MDY.GIF
USO-CrudeOil DBO FAS GLD HD IBB JETS JNUG KOL NAIL NUGT NRGU OIH
PALL RSX RETL SDS AGQ SLV SOXL TAN TECL TLT TMF TNA UGA USO
China:
YINN CHAU
Commodities: CANE
CORN DBC JJC, NIB CORN, CUT (paper)
MOO, NRGU
SOYB WEAT UUP (Dollar) LIT
(Lithium)
China: YINN
CHAU
Commodities: CANE
CORN DBC JJC, NIB CORN, CUT (paper)
MOO, NRGU
SOYB WEAT UUP (Dollar) LIT
(Lithium)
Stocks AA AAPL ADBE ALXN AMAT AMGN AMD AMZN AXP BA BABA
BAC BIDU BLDP CAT CHKP CNX CPB CRM CVX CMG DE DIS ENPH FB FSLR
FTNT GILD GME GOOG GS HD IBM INTU JPM KO KR LRCX MRK MRNA
MOS MSFT NEM NFLX NKE NOC NUE NVDA PANW PG PYPL REGN REV
SO QCOM QDEL TSLA TXN XOM V VRTX WFC WMT XLE ZM ZOM
Leveraged Short ETFs:
FAZ - financials, TZA and SRTY- small caps, MZZ - mid caps, TECS -Techs,
SOXS -
semi-conductors LABD
- Biotechs
Bullish MAXCPs http://www.tigersoftware.com/UPPING/1-5-2023/BULLISH.htm
Bearish MINCPs http://www.tigersoftware.com/Downing/1-5-2023/BEARISH.htm
|
|
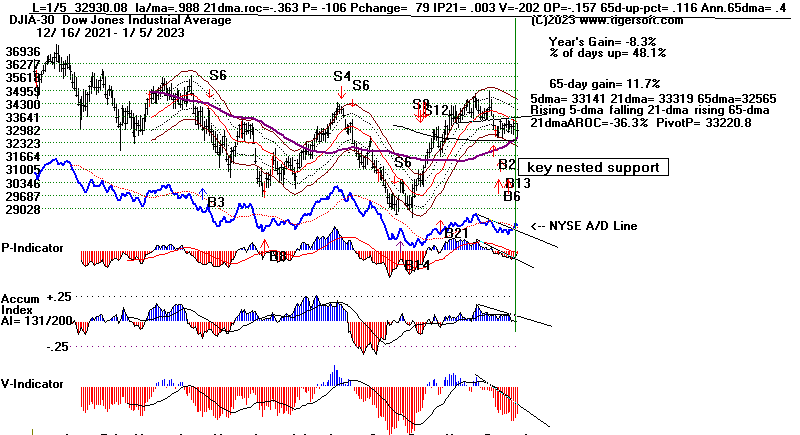
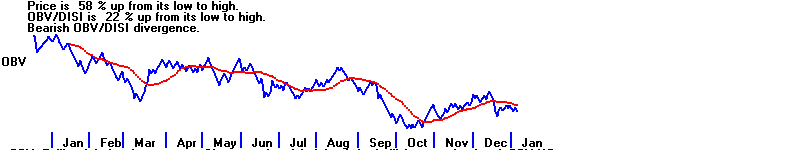
525 is DIA's key support.
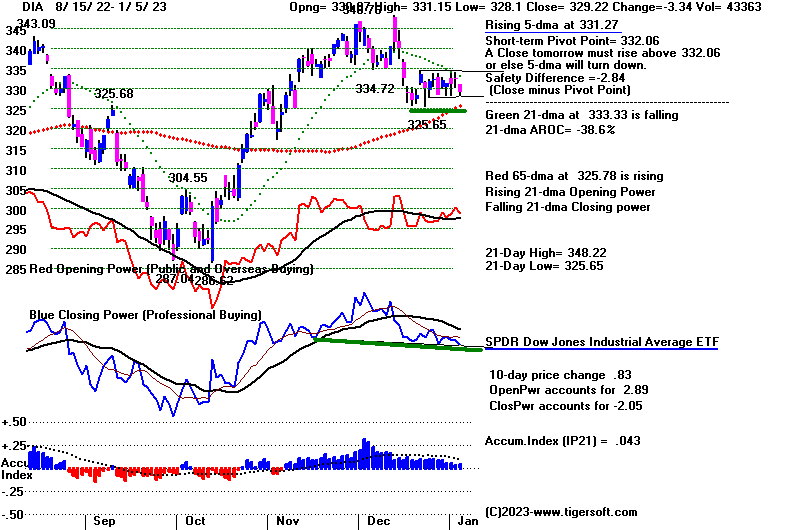
|
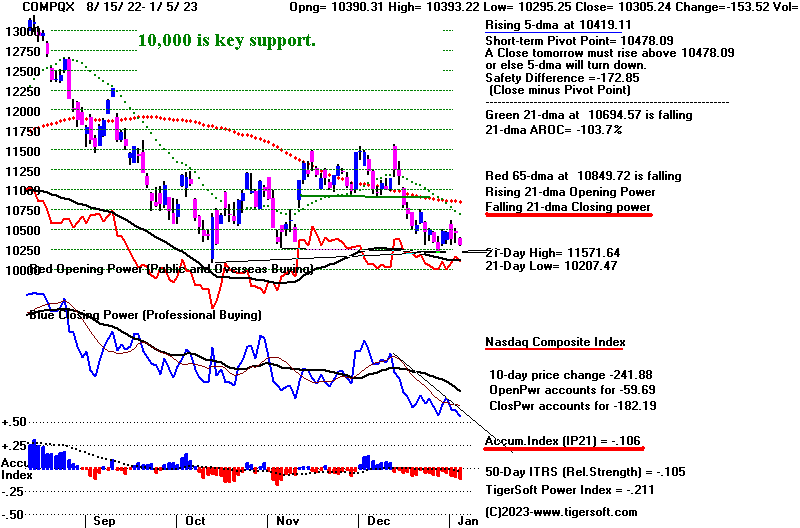 |
260 is key support...
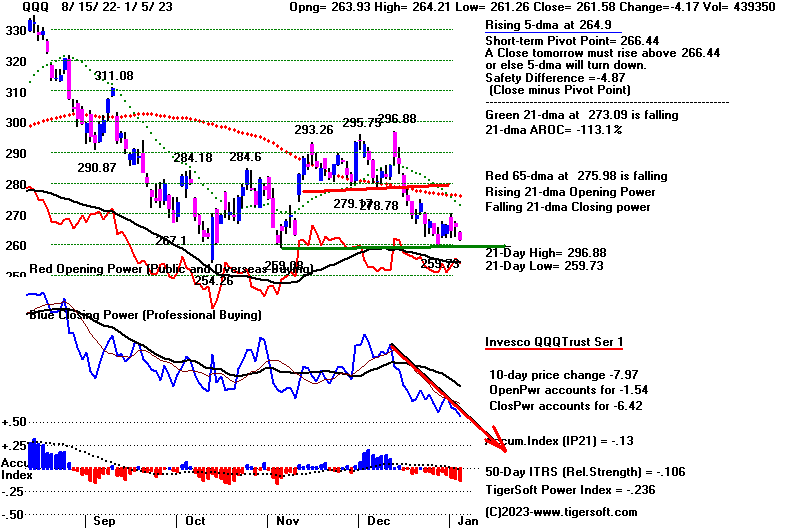 |
370 is key support
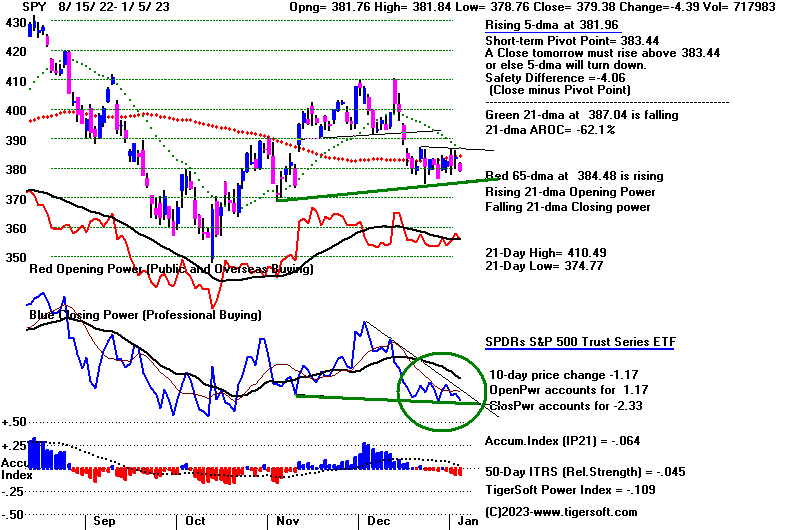 |
SOXL is technically vulnerable.
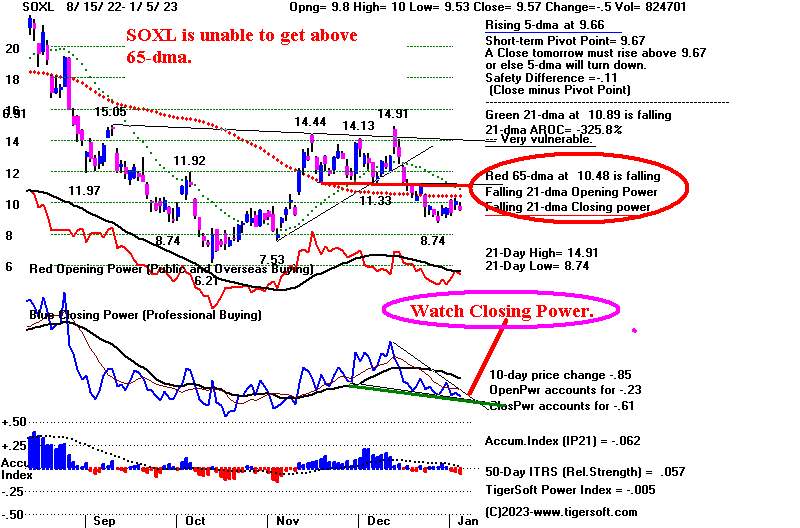 |
Weakest DJI Stocks: UNH, AAPL, MSFT
Watch key supports in HON (203), HD (310), GS (339) |
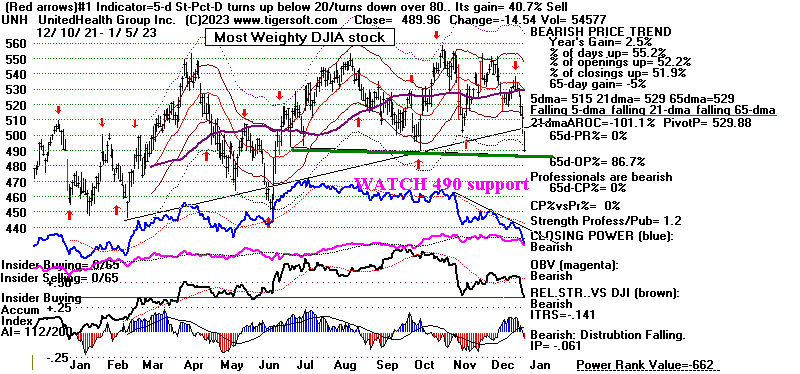 |
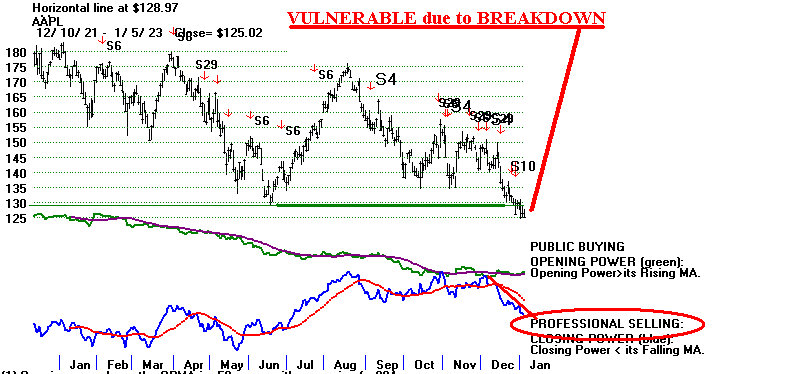 |
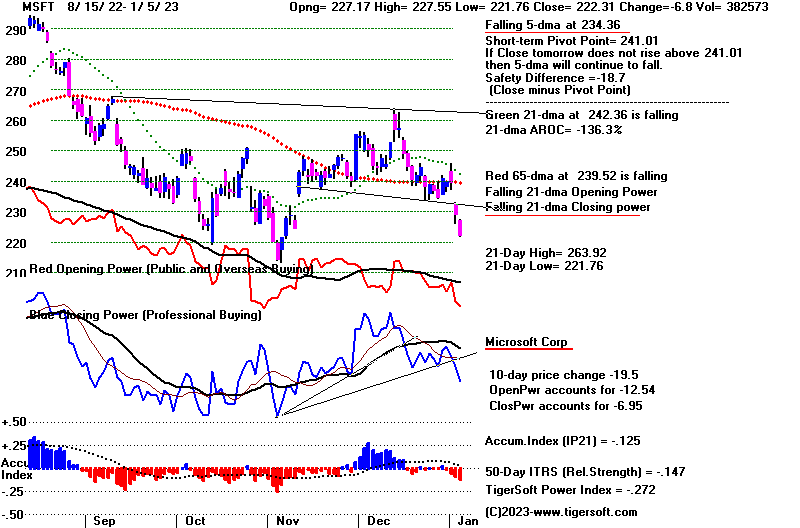 |
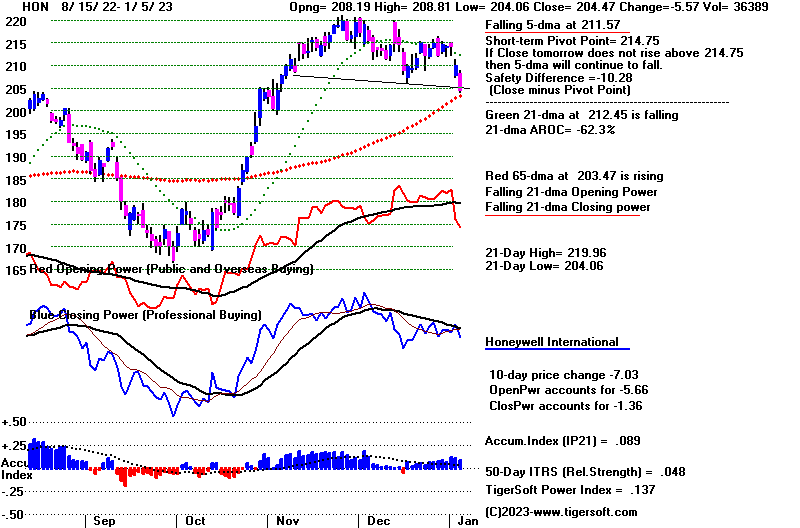 |
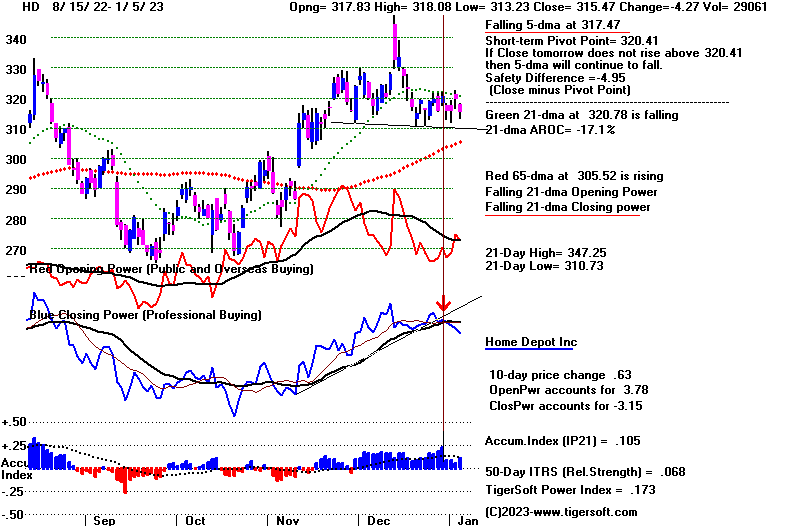 |
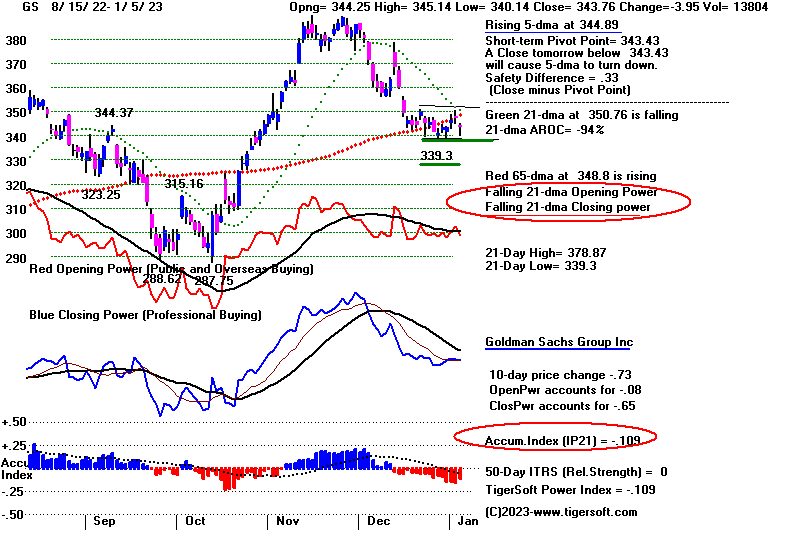 |
| Strongest DJI Stocks - BA and MRK |
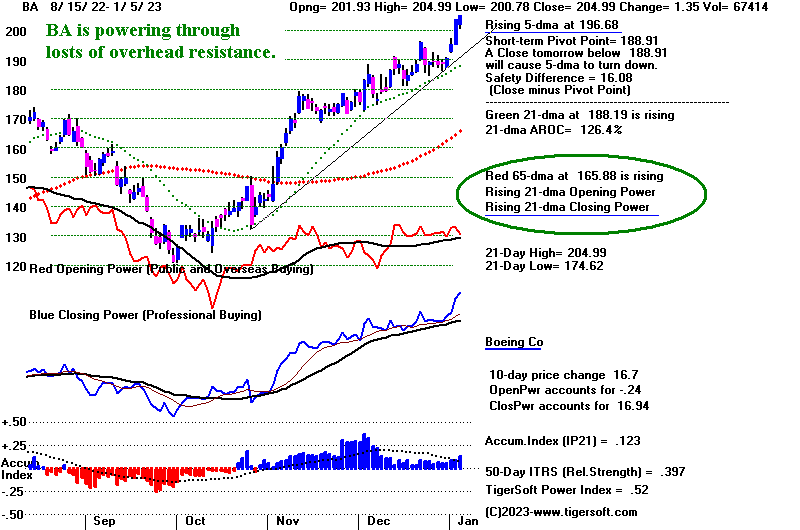 |
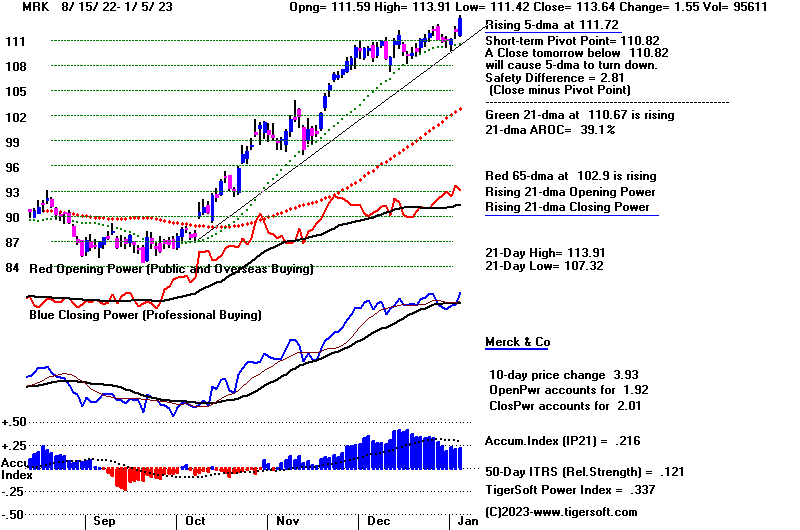 |
Table 1 - Breadth and Volume Statistics 1/5/2023
DJIA 32930.08 -339.69 -1.02
S&P 500 3808.10 -44.87 -1.16
Nasdaq 10305.24 -153.52 -1.47
NYSE Advances 1,293 vs 2,534
NYSE Declines 1,831 vs 611
New Highs = 64 + 106 = 170
New Lows = 37 + 90 = 127
NYSE	Latest Close	Previous Close	Week Ago
Issues traded	3,235	3,230	3,254
Advances	1,293	2,534	2,629
Declines	1,831	611	525
Unchanged	111	85	100
New highs	64	65	56
New lows	37	19	84
Adv. volume*	335,046,086	833,688,496	602,838,900
Decl. volume*	527,903,261	133,843,784	58,297,174
Total volume*	867,785,830	970,472,632	668,494,561
Closing Arms (TRIN)†	0.90	0.64	0.52
Block trades*	4,272	4,632	4,126
Adv. volume	1,703,063,575	3,806,471,577	2,685,791,927
Decl. volume	2,160,135,607	590,497,192	279,777,679
Total volume	3,893,457,747	4,414,084,449	3,003,688,938
NASDAQ	Latest Close	Previous Close	Week Ago
Issues traded	4,821	4,802	4,780
Advances	1,892	3,369	3,742
Declines	2,720	1,234	867
Unchanged	209	199	171
New highs	106	102	89
New lows	90	57	209
Closing Arms (TRIN)†	0.96	0.61	0.52
Block trades	32,833	31,797	27,101
Adv. volume	1,976,420,487	4,108,494,476	3,689,443,700
Decl. volume	2,733,905,411	915,205,080	447,007,842
Total volume	4,764,276,405	5,085,380,920	4,154,103,083
|
Table 2 QUICKSILVER on ETFS - 1/5/2023
--- Bullish = 1 YINN
Bearish = 1 TECL
ETF       CLOSE   CHANGE    PIVOT-PT    5-dma AROC    CL-PWR  CANDLE  IP21   ITRS   POWER INDEX
================================================================================================
DIA       329.22    -3.34      332.06        9.8%     Bearish  RED    .043    ----    -----
---------------------------------------------------------------------------------------------
COMPQX    10305.24  -153.52  10478.09      44.2%      Bearish  RED   -.106   -.104    -.21
---------------------------------------------------------------------------------------------
SPY       379.38  -4.38      383.44        35.7%      Bearish  RED   -.064   -.044    -.108
---------------------------------------------------------------------------------------------
QQQ       261.58  -4.16      266.44        28%        Bearish  RED   -.13   -.106     -.236
---------------------------------------------------------------------------------------------
MDY       442.85  -4.6       444.78        73.8%      Bearish  RED   -.028   -.001    -.029
---------------------------------------------------------------------------------------------
IWM       173.68  -1.88      174.85        90.7%      Bearish  RED   -.088   -.044    -.132
---------------------------------------------------------------------------------------------
FAS       75.96  -1.94       74.32         317%       Bearish  RED   -.02    .113      .093
---------------------------------------------------------------------------------------------
RETL      7.16  -.19         6.9           545.2%     Bearish  BLUE   .103   -.026     .077
---------------------------------------------------------------------------------------------
SOXL      9.57  -.5          9.67          372.7%     Bearish  RED   -.061    .058    -.003
---------------------------------------------------------------------------------------------
TECL      20.37  -1.28       22.2         -60.2%      Bearish  RED   -.055   -.226    -.281
---------------------------------------------------------------------------------------------
IBB       131.82   .11       131.34        131.4%     -------  BLUE   .017    .034     .051
---------------------------------------------------------------------------------------------
GLD       170.52  -2.15      168.85        76.8%      -------  RED   -.057    .065     .008
---------------------------------------------------------------------------------------------
DBO       14.35   .07        14.88        -202.4%     -------  BLUE   .004   -.167    -.163
---------------------------------------------------------------------------------------------
OIH       296.14   5.48      301.88        32.9%      -------  BLUE   .04    .006     .046
---------------------------------------------------------------------------------------------
CPER     23.18   .52         23.16         4.4%       -------  BLUE  -.283    .074    -.209
---------------------------------------------------------------------------------------------
TAN     70.91  -2.39         73.08        -63.3%      Bearish  RED   -.236    .048    -.188
---------------------------------------------------------------------------------------------
UUP       28.27   .26        27.9          35.7%      Bullish  BLUE   .197   -.107     .09
---------------------------------------------------------------------------------------------
CORN      25.93  -.18        26.96        -205.7%     Bullish  RED    .274   -.092     .182
---------------------------------------------------------------------------------------------
WEAT      7.55   0           7.81         -236.5%     Bullish  ----   .043   -.167    -.124
---------------------------------------------------------------------------------------------
YINN      60.42  -.28        49.75         1446.3%     -------  BLUE   0    1.703     1.703
|
Table 3       RANKING OF KEY DIRECTORIES BASED PCT.OF STOCKS ABOVE 65-DMA
              1/5/23
 Bullish = 30
 Bearish = 18
---------------------------------------------------------------------------------------
Directory     Current       day-1         day-2         day-3         day-4         day-5
----------------------------------------------------------------------------------------
COPPER         .857          .857          .857          .857          1             1
HOMEBLDG       .833          .888          .833          .833          .888          .777
GOLD           .826          .869          .782          .782          .782          .782
BONDFUND       .816          .839          .85           .77           .735          .62
INFRA          .787          .878          .757          .848          .878          .696
JETS           .769          .615          .307          .307          .307          .307
ETFS           .763          .781          .763          .745          .781          .745
INSURANC       .76           .84           .76           .72           .76           .64
CHINA          .72           .72           .66           .62           .6            .58
UTILITY        .684          .815          .763          .815          .868          .842
EDU            .666          .666          .833          .833          .666          .5
HOSPITAL       .642          .571          .5            .571          .571          .571
DOWJONES       .633          .666          .633          .633          .733          .633
               =====
DJI-13         .615          .615          .615          .769          .769          .692
SP-100         .611          .644          .622          .622          .655          .588
CHEM           .608          .695          .652          .608          .695          .565
SP500          .585          .66           .569          .604          .65           .543
               =====
INDMATER       .583          .638          .569          .583          .625          .541
MILITARY       .576          .615          .615          .692          .615          .538
BEVERAGE       .571          .714          .571          .714          .785          .785
BIGBANKS       .571          .571          .571          .285          .428          .285
GUNS           .571          .571          .428          .5            .428          .285
FIDSTKS        .562          .603          .538          .562          .597          .514
RUS-1000       .552          .614          .53           .561          .588          .481
               =====
COMPUTER       .55           .45           .45           .4            .45           .3
ELECTRON       .548          .571          .488          .533          .533          .353
TRANSP         .526          .473          .315          .368          .421          .368
SEMI           .521          .553          .478          .553          .553          .329
COMODITY       .512          .487          .487          .589          .589          .589
BIOTECH        .509          .509          .432          .415          .41           .338
===============================================================================================
NASD-100       .5            .57           .5            .54           .55           .44
===============================================================================================
INDEXES        .497          .578          .481          .535          .54           .432
FOOD           .469          .448          .489          .632          .612          .591
SOFTWARE       .464          .553          .5            .464          .5            .41
FINANCE        .462          .575          .475          .437          .5            .4
NIFTY          .454          .454          .386          .454          .5            .34
HIGHPRIC       .448          .573          .469          .525          .573          .422
RETAIL         .446          .531          .446          .446          .489          .425
REIT           .43           .576          .469          .476          .492          .384
GAMING         .421          .473          .368          .473          .421          .315
OILGAS         .409          .361          .323          .485          .485          .38
AUTO           .396          .452          .377          .377          .396          .32
GREEN          .388          .388          .333          .333          .5            .333
HACKERS        .375          .375          .375          .375          .375          .375
LOWPRICE       .372          .352          .289          .263          .257          .234
REGBANKS       .28           .28           .32           .36           .4            .28
COAL           .166          .166          .166          .166          .166          .166
SOLAR          .125          .187          .125          .187          .187          .125
MARIJUAN       .1            .2            0             .1            .1            0
|
====================================================================================
Thursday - 6:00 AM - Futures: DJI -147 NASDAQ -63 Data
Used: 1/4/2023
| |
1/4/2023
DJIA	33269.77	133.40	 +0.40%
S&P 500	3852.97	        28.83	 +0.75%
Nasdaq 	10458.76	71.78	 +0.69%
NYSE Advances	2,534	vs 1,891
Declines	611	vs 1,254
New highs	65 + 102 = 167
New lows	19 + 57  = 86
NYSE Latest Close Previous Close Week Ago
Issues traded 3,230 3,227 3,245
Advances 2,534 1,891 718
Declines 611 1,254 2,455
|
|
| |
Short-Term
Rates ran up Wednesday past 4.5%. Traders tried to
shrug this
off, but this morning they are more
cautious. See how the narrowly the key
ETFs have been trading for the last
two weeks. Whichever way the DJI
breaks will be an important clue
for what will follow.
The seasonality keep encouraging a
recovery. And breadth was excellent today.
See above there were 4x times more
advancers than decliners despite the DJI's
modest ).4% gain. The break
in the downtrend of the A/D Line should mean
continuning improvement in the
P-Indicator and this ought to mean no Sell S9
if the DJI should jump 2.4% from
here, past the present resistance at its 21-day
ma.
Very few stocks look exceptionally
weak other than the past years' tech favorites,
notably, TSLA, AMZN, GOOG and AAPL.
This may allow the NASDAQ,
QQQ and SOXL to form bases and
start playing catch-up after more backing and
filling. But the FED's
apparent determination not to drop rates and fight inflation
this coming year is a deterrent.
Normally, rallies take place when the FED starts
to drop short-term interest rates.
Today, short-term rates rose above 4.5%.
Last year, UNH, the highest priced
Dow stock did a yeoman-like job holding
up the DJI. It has just
broken its price and Closing Power uptrend. Boeing
is now strongly rallying, and has
doubled from it Covid low. We cannot deterimine
a trend yet in Home Depot and
Goldman Sachs, two very high prices DJI-30
stocks. But it is bullish
that CAT, the #3 most heavily weighted DJI stock is
the highest AI/200 stock.
The NASDAQ and QQQ, as I've
said, are basing. Their Closing Powers
have not yet broken their
downtrends. They must not break to new lows,
just as the DJI must not
break below its 65-dma rising support. That would
call into question the whole
bullishness of the current year.
There are some bullish MAXCPs
that warrant purchasing. We will hold
DIA and SOXL in deference to
the Peerless Buys and the bullish seasonality.
Chinese stocks are turning
back up. This will also help the world markets.
At present, we are avoiding
the short side of the market altogether. |
|
| |
Charts - 1/4/2023
2022 PEERLESS DJI, Signals, Indicators Daily DJI Volume
10-DayUp/Down Vol Stoch-20 CCI RSI Pct of All Stocks above 65-dma
Inverted Traders Index
DJI-IPA DJI-OBV Short-Term Rates
NASDAQ S&P OEX NYSE DJ-15 DJ-20 DJI-30 Bond Funds
DIA QQQ SPY IWM new - COIN (Bit Coin ETF)
TNA Short-Term Rates Ten Year Rates PST (Short Treasuries)
DOLLAR-UUP
ALLSTOCKs
Russell-1000
Insurance-Stocks
Recent 2006 vers-Peerless signals
http://www.tigersoftware.com/OLDPEER/UPD90104.bmp
MDY - http://www.tigersoftware.com/CHARTX/MDY.GIF
USO-CrudeOil DBO FAS GLD HD IBB JETS JNUG KOL NAIL NUGT NRGU OIH
PALL RSX RETL SDS AGQ SLV SOXL TAN TECL TLT TMF TNA UGA USO
China:
YINN CHAU
Commodities: CANE
CORN DBC JJC, NIB CORN, CUT (paper)
MOO, NRGU
SOYB WEAT UUP (Dollar) LIT
(Lithium)
China: YINN
CHAU
Commodities: CANE
CORN DBC JJC, NIB CORN, CUT (paper)
MOO, NRGU
SOYB WEAT UUP (Dollar) LIT
(Lithium)
Stocks AA AAPL ADBE ALXN AMAT AMGN AMD AMZN AXP BA BABA
BAC BIDU BLDP CAT CHKP CNX CPB CRM CVX CMG DE DIS ENPH FB FSLR
FTNT GILD GME GOOG GS HD IBM INTU JPM KO KR LRCX MRK MRNA
MOS MSFT NEM NFLX NKE NOC NUE NVDA PANW PG PYPL REGN REV
SO QCOM QDEL TSLA TXN XOM V VRTX WFC WMT XLE ZM ZOM
Leveraged Short ETFs:
FAZ - financials, TZA and SRTY- small caps, MZZ - mid caps, TECS -Techs,
SOXS -
semi-conductors LABD
- Biotechs
Bullish MAXCPs http://www.tigersoftware.com/UPPING/1-4-2023/BULLISH.htm
Bearish MINCPs http://www.tigersoftware.com/Downing/1-4-2023/BEARISH.htm
|
|
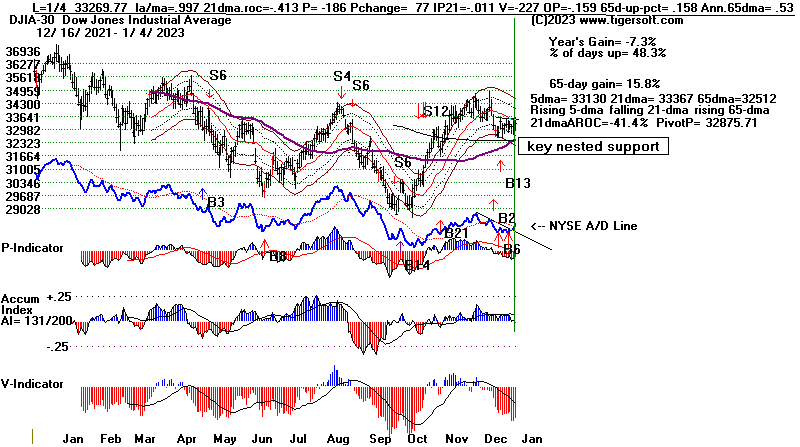 |
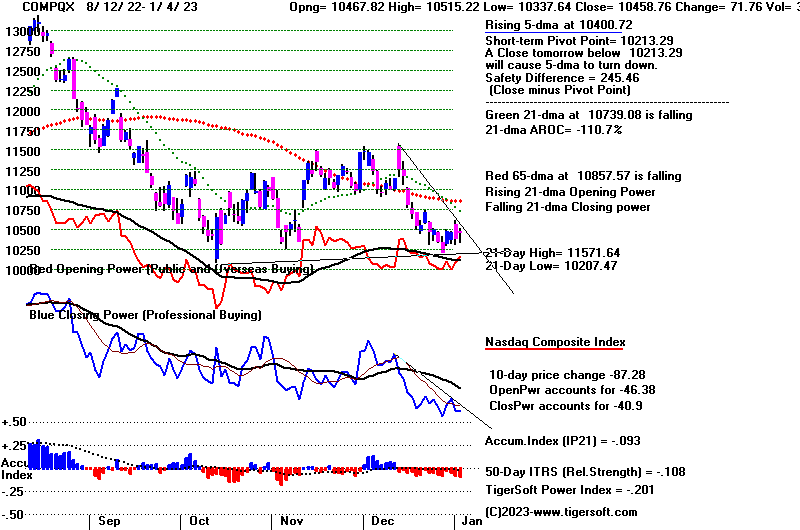 |
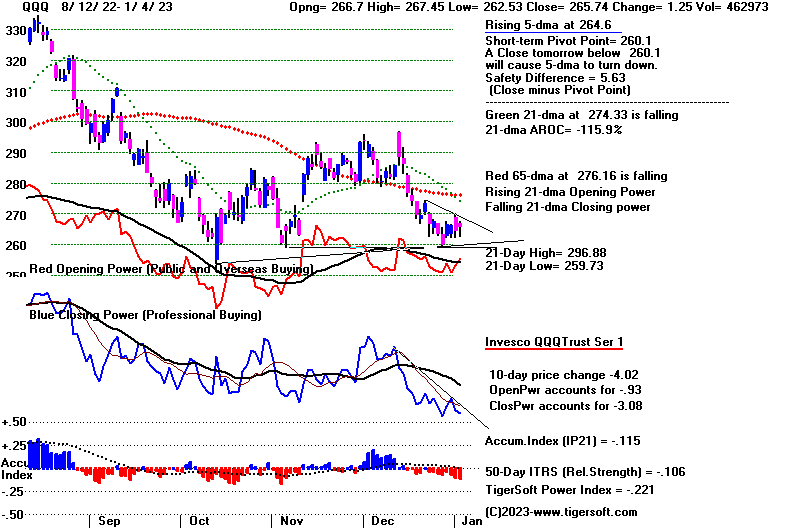 |
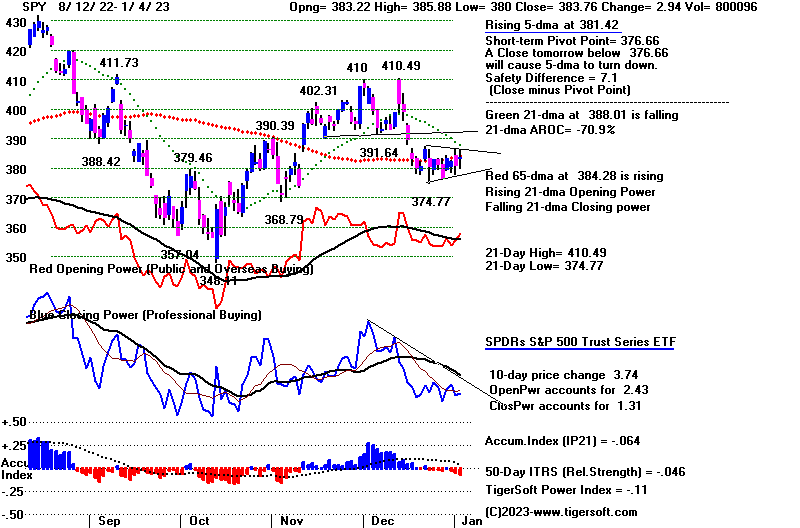 |
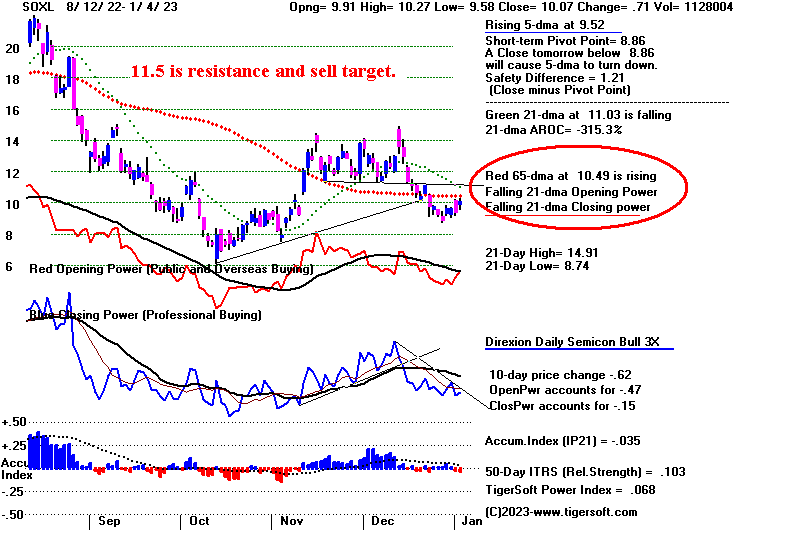 |
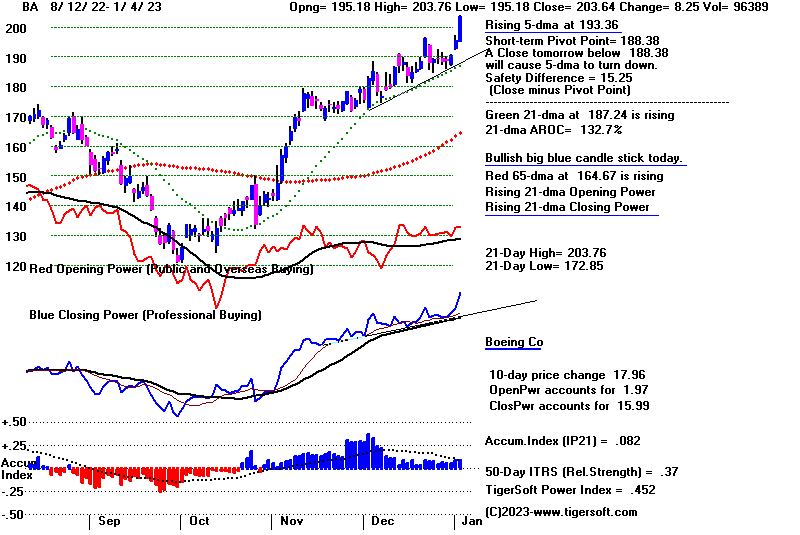 |
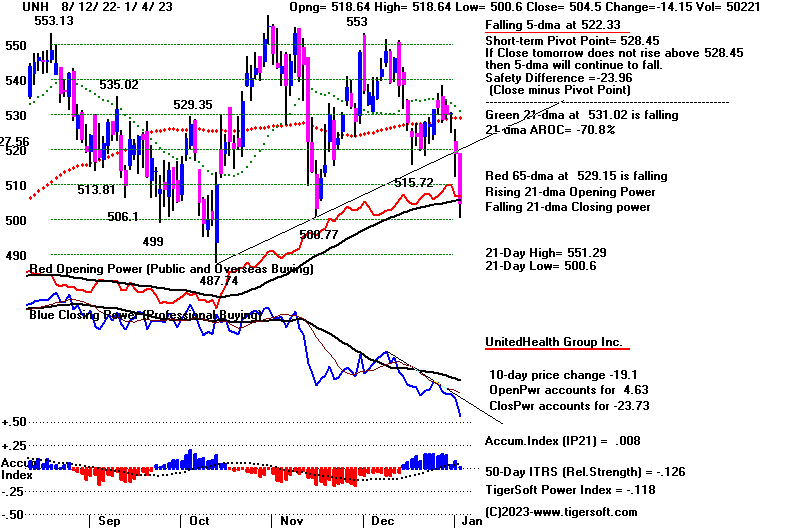 |
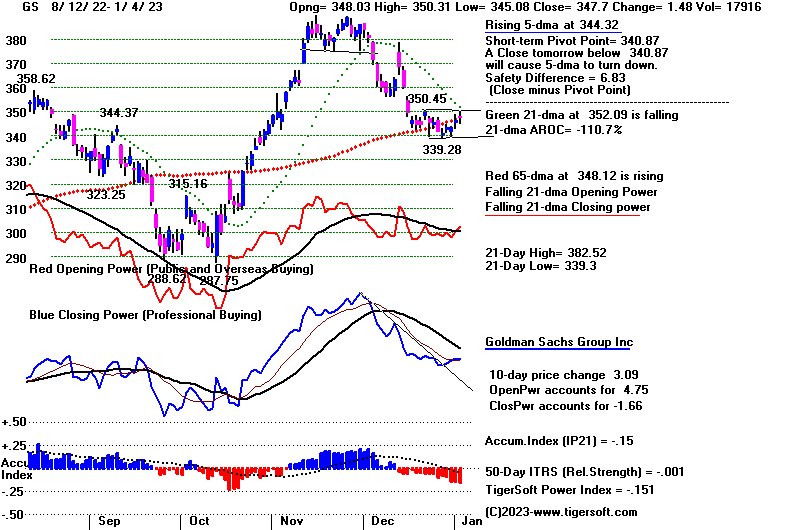 |
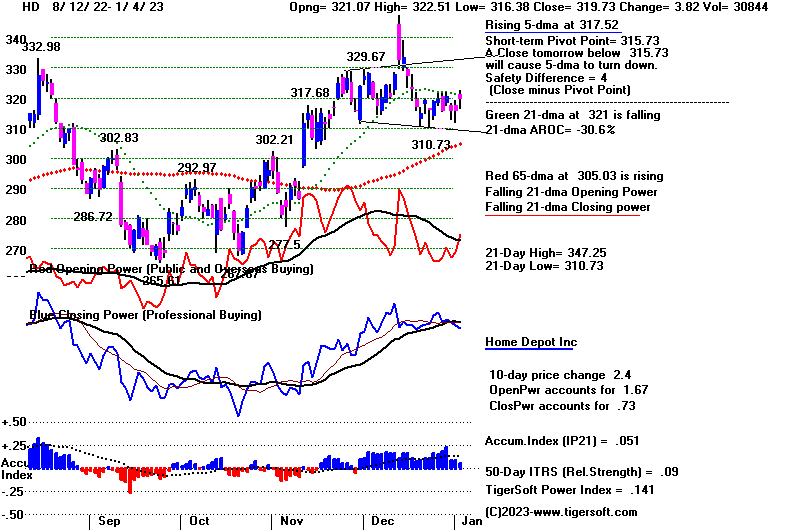 |
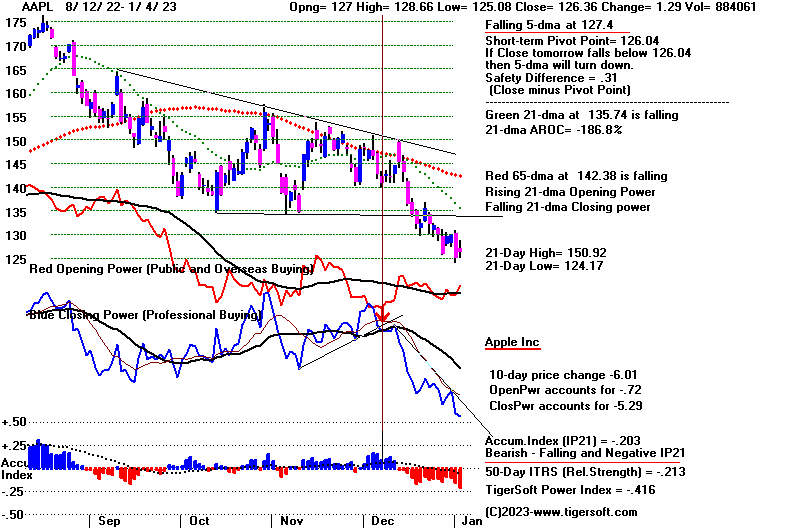 |
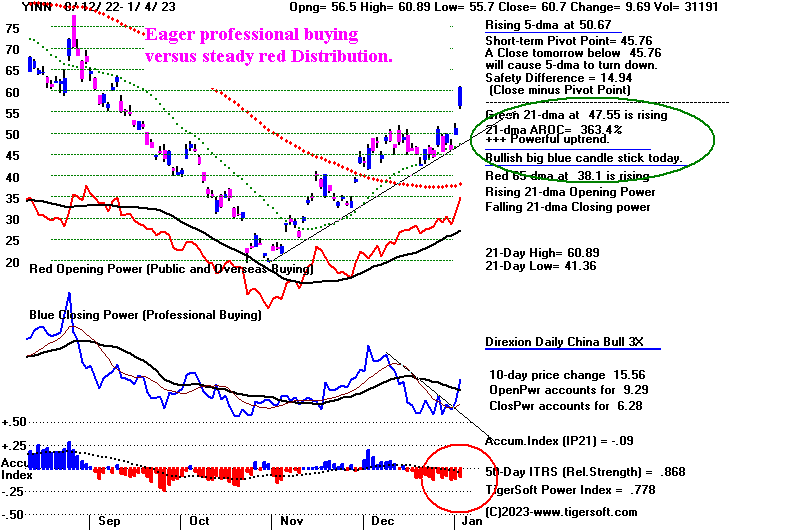 |
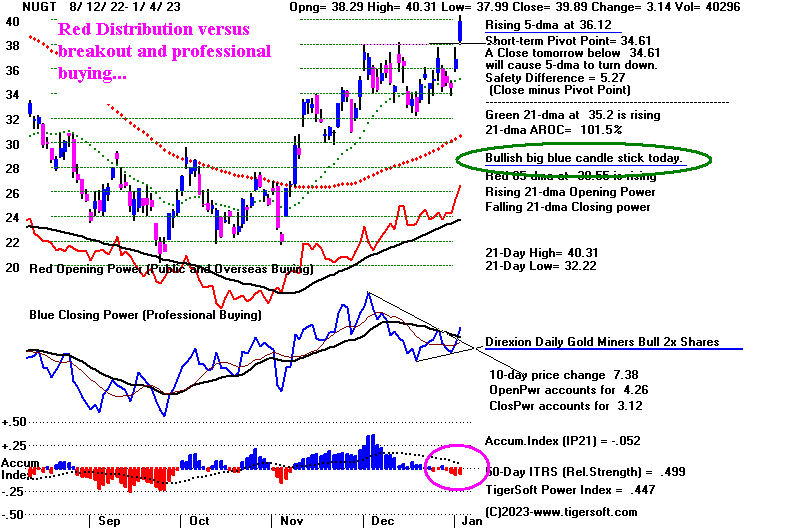 |
| |
| |
| |
| |
Table 1 - Breadth and Volume Statistics 1/4/2023
DJIA 33269.77 133.40 0.40
S&P 500 3852.97 28.83 0.75
Nasdaq Composite 10458.76 71.78 0.69
NYSE Advances 2,534 vs 1,891
Declines 611 vs 1,254
New highs 65 + 102 = 167
New lows 19 + 57 = 86
NYSE Latest Close Previous Close Week Ago
Issues traded 3,230 3,227 3,245
Advances 2,534 1,891 718
Declines 611 1,254 2,455
Unchanged 85 82 72
New highs 65 71 62
New lows 19 36 180
Adv. volume* 833,688,496 452,276,087 95,820,808
Decl. volume* 133,843,784 441,820,915 516,571,296
Total volume* 970,472,632 898,744,161 625,406,414
Closing Arms (TRIN)† 0.64 1.58 1.30
Block trades* 4,632 4,692 3,919
Adv. volume 3,806,471,577 1,920,554,565 550,877,318
Decl. volume 590,497,192 2,016,417,140 2,457,388,820
Total volume 4,414,084,449 3,959,146,371 3,083,527,250
NASDAQ Latest Close Previous Close Week Ago
Issues traded 4,802 4,843 4,794
Advances 3,369 2,516 1,546
Declines 1,234 2,118 3,042
Unchanged 199 209 206
New highs 102 107 99
New lows 57 93 502
Closing Arms (TRIN)† 0.61 1.18 0.92
Block trades 31,797 31,052 25,159
Adv. volume 4,108,494,476 2,370,747,920 1,340,021,635
Decl. volume 915,205,080 2,346,852,150 2,434,616,753
Total volume 5,085,380,920 4,780,654,557 3,842,976,514
|
Table 2 QUICKSILVER on ETFS - 1/4/2023 ---
Bullish = 1 YINN
Bearish = 3 DBO, CPER, WEAT
ETF CLOSE CHANGE PIVOT-PT 5-dma AROC CL-PWR CANDLE IP21 ITRS POWER INDEX
================================================================================================
DIA 332.56 1.34 328.57 2.9% ------- RED .034 0 .034
---------------------------------------------------------------------------------------------
COMPQX 10458.76 71.77 10213.29 50.8% Bearish RED -.093 -.107 -.2
---------------------------------------------------------------------------------------------
SPY 383.76 2.94 376.66 31% Bearish BLUE -.063 -.044 -.107
---------------------------------------------------------------------------------------------
QQQ 265.74 1.26 260.1 40.9% Bearish RED -.114 -.105 -.219
---------------------------------------------------------------------------------------------
MDY 447.45 6.73 436.32 41.1% Bearish BLUE -.069 -.008 -.077
---------------------------------------------------------------------------------------------
IWM 175.56 2.16 170.53 67.5% Bearish BLUE -.129 -.053 -.182
---------------------------------------------------------------------------------------------
FAS 77.9 3.48 71.25 393.1% Bearish BLUE -.066 .166 .1
---------------------------------------------------------------------------------------------
RETL 7.35 .57 6.41 466.5% Bearish BLUE .058 .011 .069
---------------------------------------------------------------------------------------------
SOXL 10.07 .71 8.86 427.1% Bearish BLUE -.034 .104 .07
---------------------------------------------------------------------------------------------
TECL 21.65 .17 20.63 -9.3% Bearish RED -.038 -.164 -.202
---------------------------------------------------------------------------------------------
IBB 131.71 1.67 128.39 93.8% ------- BLUE -.018 .02 .002
---------------------------------------------------------------------------------------------
GLD 172.67 1.61 167.91 118.2% ------- RED -.112 .05 -.062
---------------------------------------------------------------------------------------------
DBO 14.28 -.5 14.95 -276.9% ------- RED -.058 -.199 -.257
---------------------------------------------------------------------------------------------
OIH 290.66 1.07 294.19 -220.1% ------- BLUE -.054 -.021 -.075
---------------------------------------------------------------------------------------------
CPER 22.66 -.13 23.16 -78.1% ------- RED -.312 .01 -.302
---------------------------------------------------------------------------------------------
TAN 73.3 1.13 71.83 15.1% Bearish BLUE -.222 .032 -.19
---------------------------------------------------------------------------------------------
UUP 28.01 -.1 28.07 7.2% Bullish ---- .229 -.139 .09
---------------------------------------------------------------------------------------------
CORN 26.11 -.52 27.03 -95% Bullish RED .167 -.112 .055
---------------------------------------------------------------------------------------------
WEAT 7.55 -.31 7.92 -171.4% ------- RED -.097 -.2 -.297
---------------------------------------------------------------------------------------------
YINN 60.7 9.69 45.76 1015.4% ------- BLUE -.089 .869 .78
|
Table 3 RANKING OF KEY DIRECTORIES BASED PCT.OF STOCKS ABOVE 65-DMA
1/4/23
Bullish = 34
---------------------------------------------------------------------------------------
Directory Current day-1 day-2 day-3 day-4 day-5
----------------------------------------------------------------------------------------
HOMEBLDG .888 .833 .833 .888 .777 .888
INFRA .878 .757 .848 .878 .787 .878
GOLD .869 .782 .782 .782 .804 .869
COPPER .857 .857 .857 1 1 1
INSURANC .84 .76 .72 .76 .68 .76
BONDFUND .839 .85 .77 .735 .632 .574
UTILITY .815 .763 .815 .868 .842 .789
ETFS .781 .763 .745 .781 .763 .781
CHINA .72 .66 .62 .6 .58 .66
BEVERAGE .714 .571 .714 .785 .785 .785
CHEM .695 .652 .63 .673 .608 .652
DOWJONES .666 .633 .633 .733 .666 .7
-----
EDU .666 .833 .833 .666 .5 .5
SP500 .66 .569 .604 .646 .563 .62
-----
SP-100 .644 .622 .622 .655 .6 .644
INDMATER .638 .569 .583 .625 .555 .652
DJI-13 .615 .615 .769 .769 .769 .769
JETS .615 .307 .307 .307 .307 .384
MILITARY .615 .615 .692 .615 .538 .576
RUS-1000 .614 .53 .561 .588 .496 .568
-----
FIDSTKS .603 .538 .562 .597 .532 .579
INDEXES .578 .481 .535 .54 .437 .529
REIT .576 .461 .484 .5 .4 .553
FINANCE .575 .475 .437 .487 .412 .5
HIGHPRIC .573 .469 .525 .573 .435 .5
BIGBANKS .571 .571 .285 .428 .285 .428
ELECTRON .571 .488 .533 .533 .36 .488
GUNS .571 .428 .5 .428 .285 .285
HOSPITAL .571 .5 .571 .571 .571 .571
NASD-100 .57 .5 .54 .55 .45 .49
-----
SEMI .553 .478 .553 .553 .319 .478
SOFTWARE .553 .517 .464 .5 .41 .446
RETAIL .531 .446 .446 .489 .425 .553
BIOTECH .509 .429 .418 .41 .336 .344
==================================================================================================
COMODITY .487 .487 .564 .589 .589 .589
GAMING .473 .368 .421 .473 .315 .368
TRANSP .473 .315 .368 .421 .368 .473
NIFTY .454 .386 .454 .5 .34 .409
AUTO .452 .377 .377 .396 .32 .358
COMPUTER .45 .45 .4 .45 .3 .35
FOOD .448 .489 .612 .612 .591 .571
GREEN .388 .333 .333 .5 .333 .444
HACKERS .375 .375 .375 .375 .375 .375
OILGAS .361 .323 .485 .485 .409 .533
LOWPRICE .352 .292 .266 .257 .234 .246
REGBANKS .28 .32 .36 .4 .32 .44
MARIJUAN .2 0 .1 .1 0 .1
SOLAR .187 .125 .187 .187 .125 .187
COAL .166 .166 .166 .166 .166 .833
|
===================================================================================
Wednesday - 6:00 AM - Futures: DJI
+148 NASDAQ +82 Data Used: 1/3/2023
| |
1/3/2023
DJIA 33136.37 -10.88 -0.03%
S&P 500 3824.14 -15.36 -0.40%
Nasdaq 10386.98 -79.50 -0.76%
NYSE Advances 1,891 vs 1,400
NYSE Declines 1,254 vs 1,714
New Highs 71 + 107 = 178
New Lows 36 + 93 = 129 ,054
|
|
| |
Bullish as the seasonality is, eager
sellers came out with guns "a-blazing" in the
first few hours of trading. What had been a
pre-market +300 gain was turned
into a 300-point decline by the DJI at the mid-day.
Though the DJI slowly
fought its way back to only a 11 point loss at the
close, the NASDAQ could
not recover nearly as much. The NASDAQ was
clobbered by Tesla which
fell 12 more to another new low. This leaves
the NASDAQ and QQQ much
closer to their lows of last year. They must turn
around soon.
I suppose tax-losses can also be taken early in the
new year in the beaten-down
techs. So, let's give the NASDAQ and SOXL a
little more time to turn up
in this ordinarily very bullish year. I would
prefer to buy the beaten-down
tech stocks only when their 5-day ma turns up along
with their Closing Powers.
That cannot happen easily with those stocks making
new lows like Tesla. Do not
try to call a bottom with these weakest techs.
For now, both the Closing Powers and the 5-day moving
averages for DIA,
SPY and QQQ are both still falling The usual
bullish seasonality of January
in the third-year of the four-year Presidential cycle
may still enter the picture,
but there is a big selller at the DJI's 21-day ma.
That resistance must be
overcome. The market needs leadership.
There is very little of that apparent,
even among the MAXCPs. The market seems
becalmed and in a waiting mode.
We will keep looking for that.
The good news is that the DJI's 65-dma is rising
quickly, bonds moved up
and are on a new red Buy and the NYSE A/D Line
downtrend could be
broken Wednesday if the higher opening launches a
recovery on the NYSE also.
So, out of repect for the bullish seasonality and the
absence of a new Peerless Sell,
continue to hold DIA, SOXL and the high accumulation
turn-arounds I
mentioned yesterday. |
|
| |
Charts - 1/3/2023
2022 PEERLESS DJI, Signals, Indicators Daily DJI Volume
10-DayUp/Down Vol Stoch-20 CCI RSI Pct of All Stocks above 65-dma
Inverted Traders Index
DJI-IPA DJI-OBV Short-Term Rates
NASDAQ S&P OEX NYSE DJ-15 DJ-20 DJI-30 Bond Funds
DIA QQQ SPY IWM new - COIN (Bit Coin ETF)
TNA Short-Term Rates Ten Year Rates PST (Short Treasuries)
DOLLAR-UUP
ALLSTOCKs
Russell-1000
Insurance-Stocks
Recent 2006 vers-Peerless signals
http://www.tigersoftware.com/OLDPEER/UPD90103.bmp
MDY - http://www.tigersoftware.com/CHARTX/MDY.GIF
USO-CrudeOil DBO FAS GLD HD IBB JETS JNUG KOL NAIL NUGT NRGU OIH
PALL RSX RETL SDS AGQ SLV SOXL TAN TECL TLT TMF TNA UGA USO
China: YINN
CHAU
Commodities: CANE
CORN DBC JJC, NIB CORN, CUT (paper)
MOO, NRGU
SOYB WEAT UUP (Dollar) LIT
(Lithium)
China: YINN
CHAU
Commodities: CANE
CORN DBC JJC, NIB CORN, CUT (paper)
MOO, NRGU
SOYB WEAT UUP (Dollar) LIT
(Lithium)
Stocks AA AAPL ADBE ALXN AMAT AMGN AMD AMZN AXP BA BABA
BAC BIDU BLDP CAT CHKP CNX CPB CRM CVX CMG DE DIS ENPH FB FSLR
FTNT GILD GME GOOG GS HD IBM INTU JPM KO KR LRCX MRK MRNA
MOS MSFT NEM NFLX NKE NOC NUE NVDA PANW PG PYPL REGN REV
SO QCOM QDEL TSLA TXN XOM V VRTX WFC WMT XLE ZM ZOM
Leveraged Short ETFs:
FAZ - financials, TZA and SRTY- small caps, MZZ - mid caps, TECS -Techs,
SOXS -
semi-conductors LABD
- Biotechs
Bullish MAXCPs http://www.tigersoftware.com/UPPING/1-3-2023/BULLISH.htm
Bearish MINCPs http://www.tigersoftware.com/Downing/1-3-2023/BEARISH.htm |
|
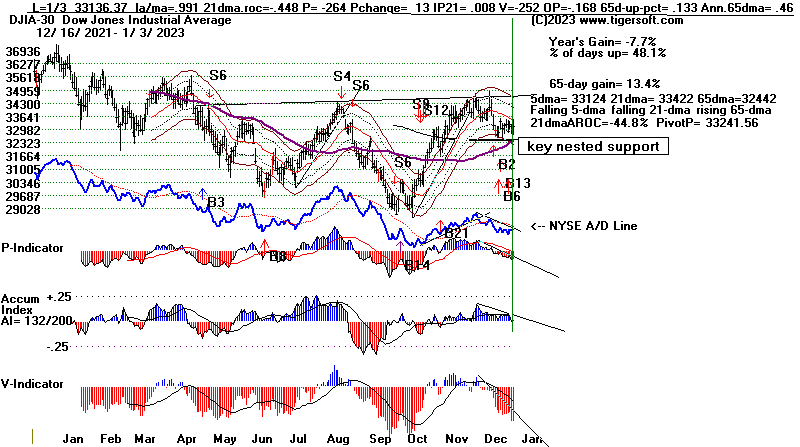 |
 |
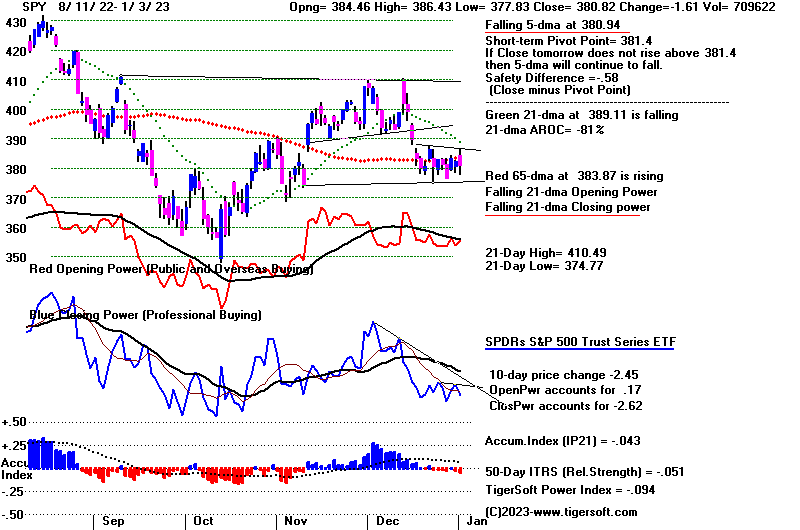 |
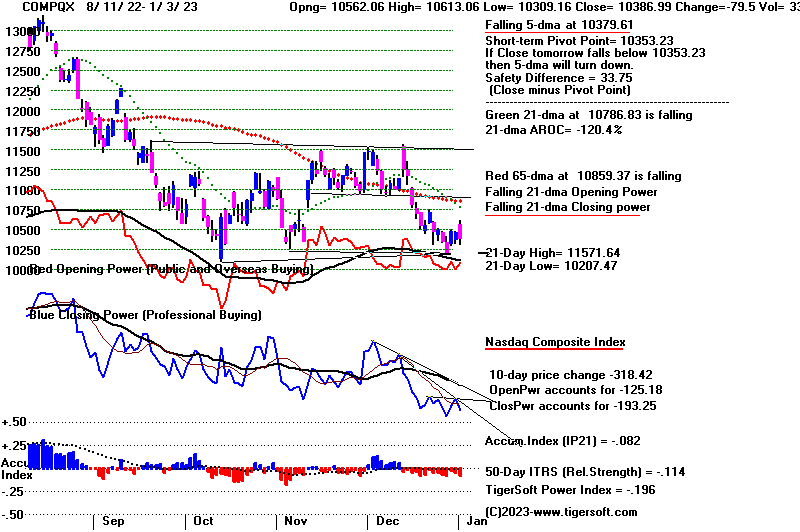 |
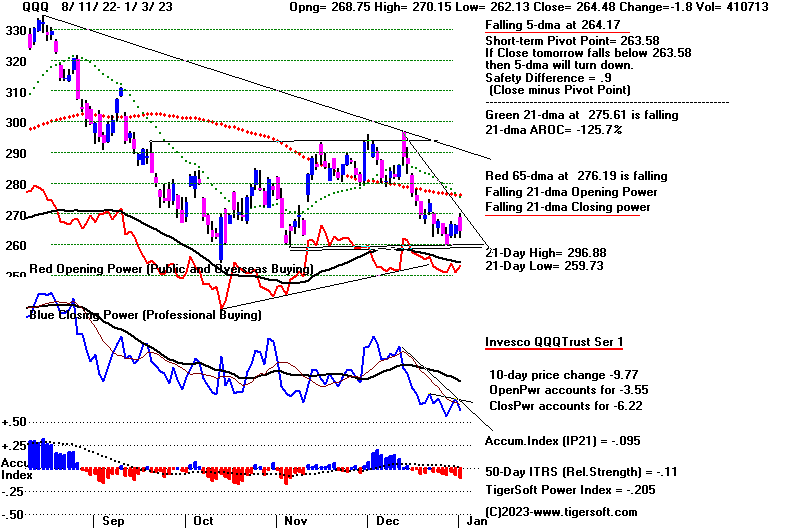 |
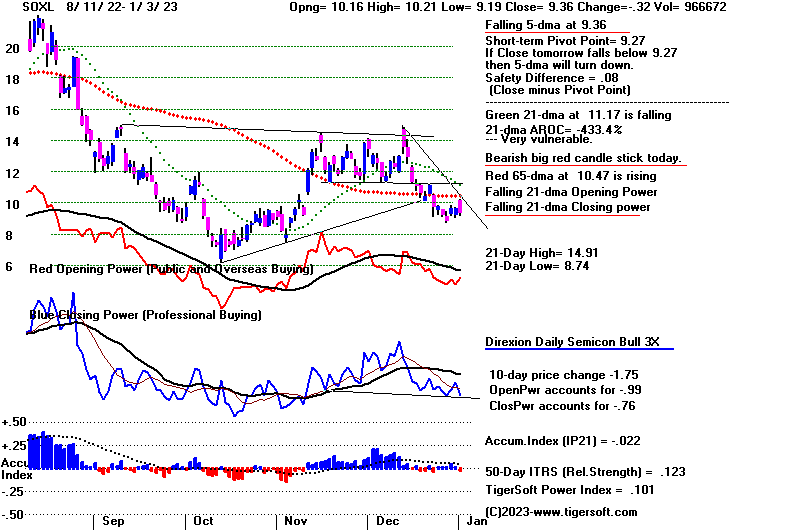 |
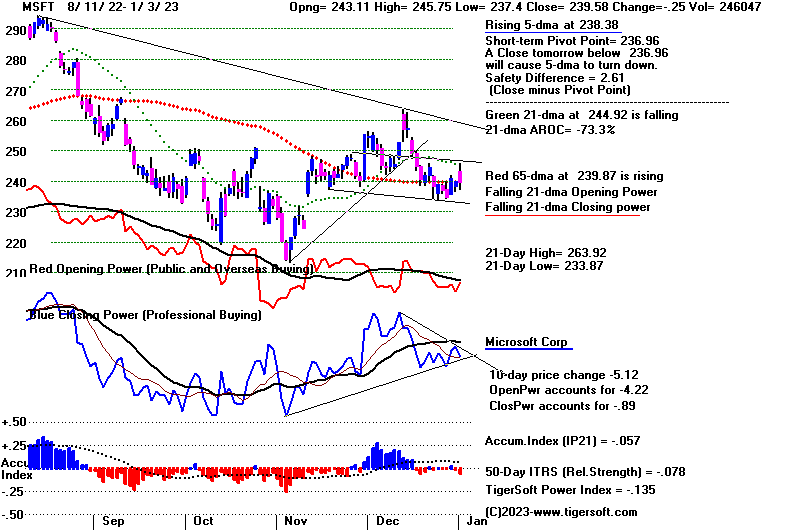 |
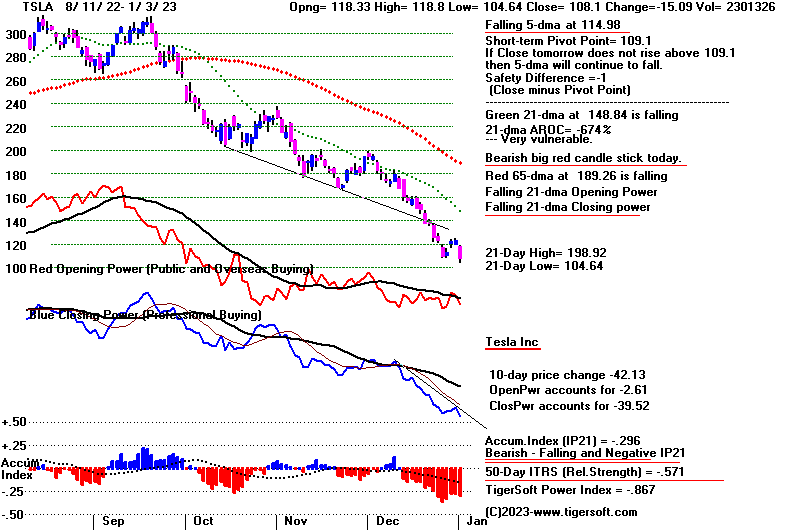 |
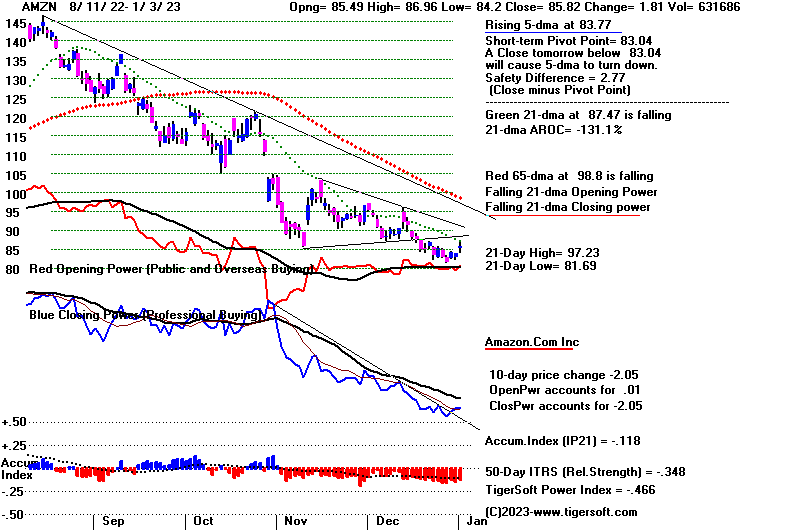 |
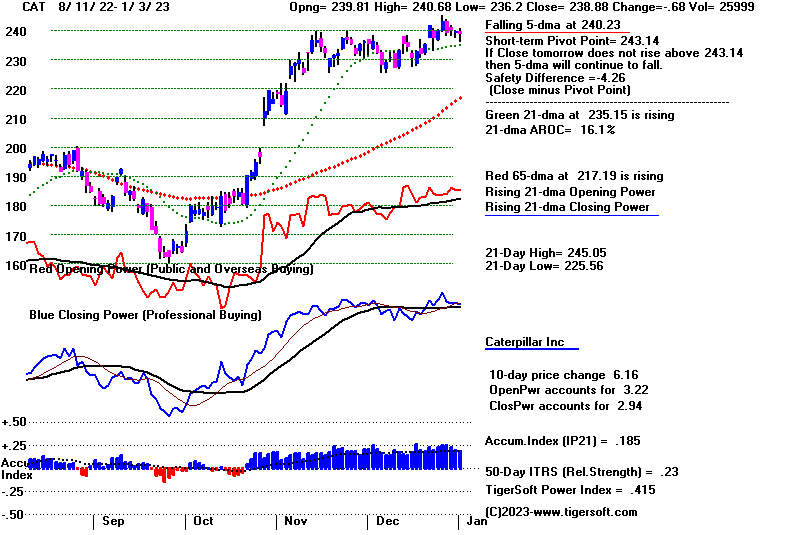 |
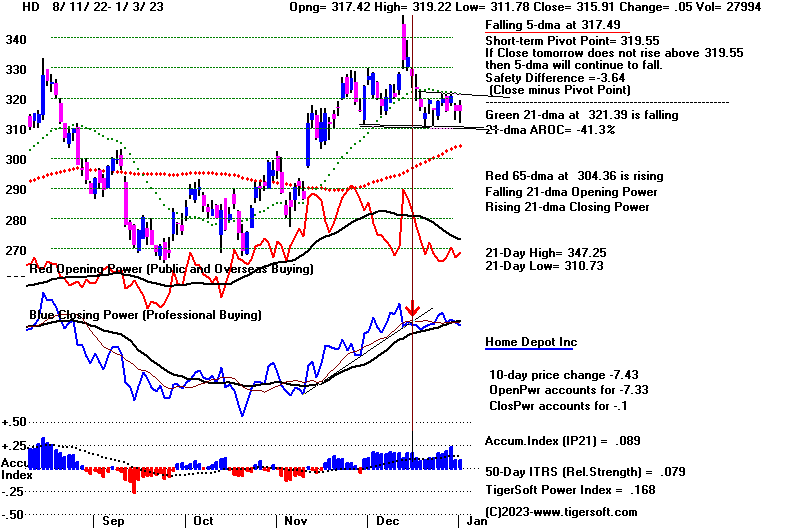 |
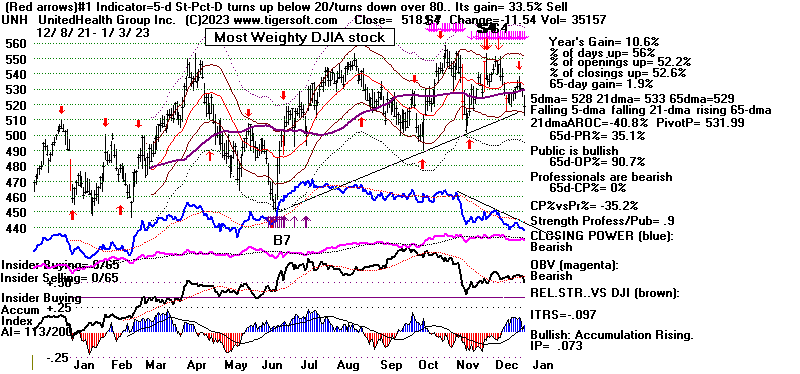 |
1/3/2023
DJIA 33136.37 -10.88 -0.03%
S&P 500 3824.14 -15.36 -0.40%
Nasdaq 10386.98 -79.50 -0.76%
NYSE Advances 1,891 vs 1,400
NYSE Declines 1,254 vs 1,714
New Highs 71 + 107 = 178
New Lows 36 + 93 = 129
NYSE Latest Close Previous Close Week Ago
Issues traded 3,227 3,260 3,261
Advances 1,891 1,400 1,409
Declines 1,254 1,714 1,770
Unchanged 82 146 82
New highs 71 49 65
New lows 36 72 137
Adv. volume* 452,276,087 284,576,532 328,563,550
Decl. volume* 441,820,915 432,299,921 274,788,552
Total volume* 898,744,161 730,101,865 609,347,797
Closing Arms (TRIN)† 1.58 1.12 0.76
Block trades* 4,692 4,080 3,857
Adv. volume 1,920,554,565 1,233,684,531 1,532,750,364
Decl. volume 2,016,417,140 1,685,758,787 1,469,147,826
Total volume 3,959,146,371 2,979,871,579 3,030,305,147
NASDAQ Latest Close Previous Close Week Ago
Issues traded 4,843 4,910 4,838
Advances 2,516 2,294 1,587
Declines 2,118 2,378 3,063
Unchanged 209 238 188
New highs 107 101 103
New lows 93 181 534
Closing Arms (TRIN)† 1.18 0.61 1.42
Block trades 31,052 25,909 25,192
Adv. volume 2,370,747,920 2,304,468,811 1,013,924,400
Decl. volume 2,346,852,150 1,458,576,797 2,784,039,541
Total volume 4,780,654,557 3,959,035,029 3,827,292,054
|
Table 2 QUICKSILVER on ETFS - 1/3/2023 ---
Bullish = 1 YINN
Bearish = 3 DBO, CPER, WEAT
ETF CLOSE CHANGE PIVOT-PT 5-dma AROC CL-PWR CANDLE IP21 ITRS POWER INDEX
================================================================================================
DIA 331.22 -.11 332.37 -10.7% Bearish RED .053 --------------
---------------------------------------------------------------------------------------------
COMPQX 10386.99 -79.49 10353.23 -53.3% Bearish RED -.081 -.113 -.194
---------------------------------------------------------------------------------------------
SPY 380.82 -1.61 381.4 -27.4% Bearish RED -.042 -.05 -.092
---------------------------------------------------------------------------------------------
QQQ 264.48 -1.8 263.58 -54.4% Bearish RED -.094 -.109 -.203
---------------------------------------------------------------------------------------------
MDY 440.72 -2.07 443.82 -32.7% Bearish RED -.064 -.025 -.089
---------------------------------------------------------------------------------------------
IWM 173.4 -.96 173.22 -28.5% Bearish RED -.101 -.066 -.167
---------------------------------------------------------------------------------------------
FAS 74.42 .87 72.15 157.5% Bearish RED -.023 .192 .169
---------------------------------------------------------------------------------------------
RETL 6.78 -.17 6.72 -95.9% Bearish RED .057 -.016 .041
---------------------------------------------------------------------------------------------
SOXL 9.36 -.31 9.27 -217% Bearish RED -.021 .124 .103
---------------------------------------------------------------------------------------------
TECL 21.48 -.62 21.69 -197.3% Bearish RED -.021 -.12 -.141
---------------------------------------------------------------------------------------------
IBB 130.04 -1.25 129.27 -76.3% ------- RED .03 .014 .044
---------------------------------------------------------------------------------------------
GLD 171.06 1.42 168.67 112.8% ------- RED -.102 .037 -.065
---------------------------------------------------------------------------------------------
DBO 14.78 -.43 15.11 -73.2% ------- RED -.091 -.186 -.277 Bearish
---------------------------------------------------------------------------------------------
OIH 289.59 -14.46 303.81 -206.5% ------- RED -.037 .005 -.032
---------------------------------------------------------------------------------------------
CPER 22.79 -.3 23.02 -58.4% ------- RED -.32 .02 -.300 Bearish
---------------------------------------------------------------------------------------------
TAN 72.17 -.77 73.08 -183.8% Bearish RED -.191 .012 -.179
---------------------------------------------------------------------------------------------
UUP 28.11 .3 27.97 23.3% Bullish ---- .19 -.166 .024
---------------------------------------------------------------------------------------------
CORN 26.63 -.3 26.62 50.4% Bullish RED .163 -.118 .045
---------------------------------------------------------------------------------------------
WEAT 7.86 -.12 7.82 44.5% ------- RED -.074 -.19 -.264
---------------------------------------------------------------------------------------------
YINN 51.01 4.83 50.81 687.8% ------- BLUE -.11 .566 .456
|
Table 3 RANKING OF KEY DIRECTORIES BASED ON PCT.OF STOCKS ABOVE 65-DMA
1/3/23
Bullish = 22
Bearish = 25
---------------------------------------------------------------------------------------
Directory Current day-1 day-2 day-3 day-4 day-5
----------------------------------------------------------------------------------------
COPPER .857 .857 1 1 1 1
BONDFUND .85 .77 .735 .632 .586 .758
EDU .833 .833 .666 .5 .5 .5
HOMEBLDG .833 .833 .888 .777 .888 .888
GOLD .782 .782 .782 .804 .869 .847
ETFS .763 .745 .781 .763 .8 .745
UTILITY .763 .815 .868 .842 .789 .842
INSURANC .76 .72 .76 .68 .76 .76
INFRA .757 .848 .878 .787 .878 .848
CHINA .66 .62 .6 .58 .66 .62
CHEM .652 .63 .695 .586 .673 .652
DOWJONES .633 .633 .733 .666 .7 .733
=====
SP-100 .622 .622 .655 .6 .644 .655
DJI-13 .615 .769 .769 .769 .769 .846
MILITARY .615 .692 .615 .538 .615 .576
BEVERAGE .571 .714 .785 .785 .785 .785
BIGBANKS .571 .285 .428 .285 .428 .571
INDMATER .569 .583 .625 .555 .652 .652
SP500 .569 .604 .646 .559 .624 .634
=====
FIDSTKS .538 .562 .597 .532 .579 .591
RUS-1000 .53 .561 .588 .496 .57 .581
=====
SOFTWARE .517 .482 .5 .41 .446 .482
=================================================================================================
HOSPITAL .5 .571 .571 .571 .571 .571
NASD-100 .5 .54 .55 .45 .49 .51
=====
=================================================================================================
FOOD .489 .612 .591 .591 .571 .571
ELECTRON .488 .533 .533 .36 .496 .526
COMODITY .487 .564 .564 .589 .589 .564
INDEXES .481 .535 .54 .437 .529 .54
SEMI .478 .553 .553 .319 .468 .521
FINANCE .475 .437 .487 .4 .512 .525
HIGHPRIC .469 .525 .573 .435 .5 .543
REIT .461 .476 .507 .407 .538 .561
COMPUTER .45 .4 .45 .3 .35 .35
RETAIL .446 .446 .489 .425 .553 .51
BIOTECH .429 .415 .413 .336 .341 .382
GUNS .428 .5 .428 .285 .357 .357
NIFTY .386 .454 .5 .34 .409 .454
AUTO .377 .377 .396 .32 .358 .358
HACKERS .375 .375 .375 .375 .437 .437
GAMING .368 .421 .421 .368 .368 .421
GREEN .333 .333 .5 .333 .444 .444
OILGAS .323 .485 .485 .409 .533 .504
REGBANKS .32 .36 .4 .32 .44 .4
TRANSP .315 .368 .421 .368 .473 .526
JETS .307 .307 .307 .307 .384 .384
LOWPRICE .299 .277 .268 .243 .252 .302
COAL .166 .166 .166 .166 .833 .666
SOLAR .125 .187 .187 .125 .187 .25
MARIJUAN 0 .1 .1 0 .1 .1
|
===================================================================================
Tuesday -
3:00 AM - Futures: DJI +291 NASDAQ +122 Data
Used: 12/30/22
| |
12-30-22
DJIA 33147.25 -73.55 -0.22%
S&P 500 3839.50 -9.78 -0.25%
Nasdaq 10466.48 -11.61 -0.11%
NHs 49 + 101 = 150
NLs 72 + 181 = 253
|
|
| |
Happy New Year!
Our new year now is the 3rd year of
the four-year Presidential cycle. Such
years are reliably quite bullish.
Since 1943, these years brought excellent
gains for at least three months,
with only one exception, 2003.
After next
DJIA Pct
Up.
DJIA Avg.Gain
---------------
----------------
5 trading days
1.6%
73.3%
10 trading days
2.7%
86.7%
21 trading days
3.4%
80.0%
42 trading days
6.0%
86.7%
65 trading days
8.7%
93.3%
130 trading days
13.8%
93.3%
This bullish seasonality is consistently
present in all but one of these year since 1943.
We have to go back to the Depression years to
find tops in January (1939) and
February (1931 and 1935.) Should the DJI
stall out in the next two months and drop
below the lower band, it will probably mean we
are in for a very bad year.
Tops before DJI breaks below lower band.
2/24/1931, 2/18/1935 and 1/3/1939
7/15/1943,
7/24/1947, 9/14/1951, 9/22/1955, 8/3/1959, 12/24/1963,
9/25/1967, 4/28/1971,
7/15/1975, 10/5/1979, 11/29/1983, 8/25/87,
10/18/91, 12/14/1995,
8/25/1999, 1/13/2003, 7/19/2007,
5/2/2011,
5/19/2015, 4/23/2019
This bullish seasonality is the basis of the
current Peerless Buy signals and was
the reason the Hotline suggested covering all
short sales on the last day of the
old year. Because tax-loss selling has
now come to an end, we should see
rallies in many of the most beaten down stocks
that showed a rise in their
Closing Power on Friday. Ideally, we also
want to see their 5-day moving
averages turn up. Buy some of the bullish
MAXCPs and high Accumulation
low priced and depressed stocks shown below.
We will want to see SOXL
and NVDA turn up now, too. And it will be
important for the DJI to get back
above its 21-day ma and for it to make gains
beyond its opening so that its Closing
Power can break above its downtrend.
|
|
| |
Charts - 12/30/2022
2022 PEERLESS DJI, Signals, Indicators Daily DJI Volume
10-DayUp/Down Vol Stoch-20 CCI RSI Pct of All Stocks above 65-dma
Inverted Traders Index
DJI-IPA DJI-OBV Short-Term Rates
NASDAQ S&P OEX NYSE DJ-15 DJ-20 DJI-30 Bond Funds
DIA QQQ SPY IWM new - COIN (Bit Coin ETF)
TNA Short-Term Rates Ten Year Rates PST (Short Treasuries)
DOLLAR-UUP
ALLSTOCKs
Russell-1000
Insurance-Stocks
Recent 2006 vers-Peerless signals
http://www.tigersoftware.com/OLDPEER/UPD81230.bmp
MDY - http://www.tigersoftware.com/CHARTX/MDY.GIF
USO-CrudeOil DBO FAS GLD HD IBB JETS JNUG KOL NAIL NUGT NRGU OIH
PALL RSX RETL SDS AGQ SLV SOXL TAN TECL TLT TMF TNA UGA USO
China: YINN
CHAU
Commodities: CANE
CORN DBC JJC, NIB CORN, CUT (paper)
MOO, NRGU
SOYB WEAT UUP (Dollar) LIT
(Lithium)
China: YINN
CHAU
Commodities: CANE
CORN DBC JJC, NIB CORN, CUT (paper)
MOO, NRGU
SOYB WEAT UUP (Dollar) LIT
(Lithium)
Stocks AA AAPL ADBE ALXN AMAT AMGN AMD AMZN AXP BA BABA
BAC BIDU BLDP CAT CHKP CNX CPB CRM CVX CMG DE DIS ENPH FB FSLR
FTNT GILD GME GOOG GS HD IBM INTU JPM KO KR LRCX MRK MRNA
MOS MSFT NEM NFLX NKE NOC NUE NVDA PANW PG PYPL REGN REV
SO QCOM QDEL TSLA TXN XOM V VRTX WFC WMT XLE ZM ZOM
Leveraged Short ETFs:
FAZ - financials, TZA and SRTY- small caps, MZZ - mid caps, TECS -Techs,
SOXS -
semi-conductors LABD
- Biotechs
Bullish MAXCPs http://www.tigersoftware.com/UPPING/12-30-22/BULLISH.htm
Bearish MINCPs http://www.tigersoftware.com/Downing/12-30-22/BEARISH.htm
|
|
DJI is having troubles rising
back above its 21-dma. A good rally today will break the
downtrend in the NYSE A/D Line.
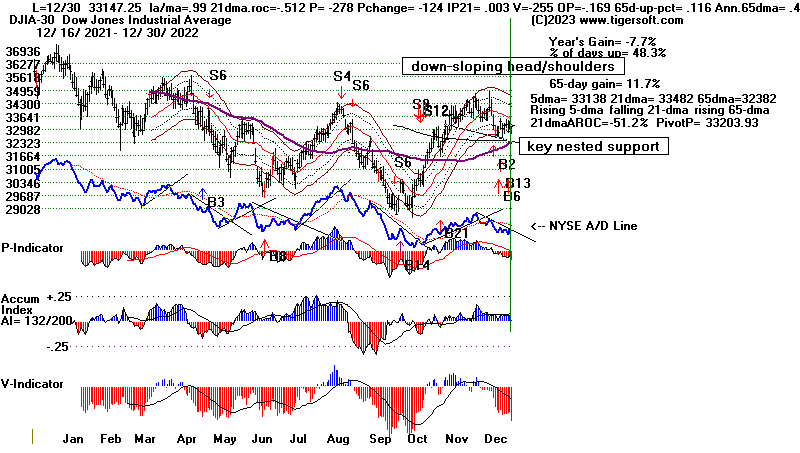 |
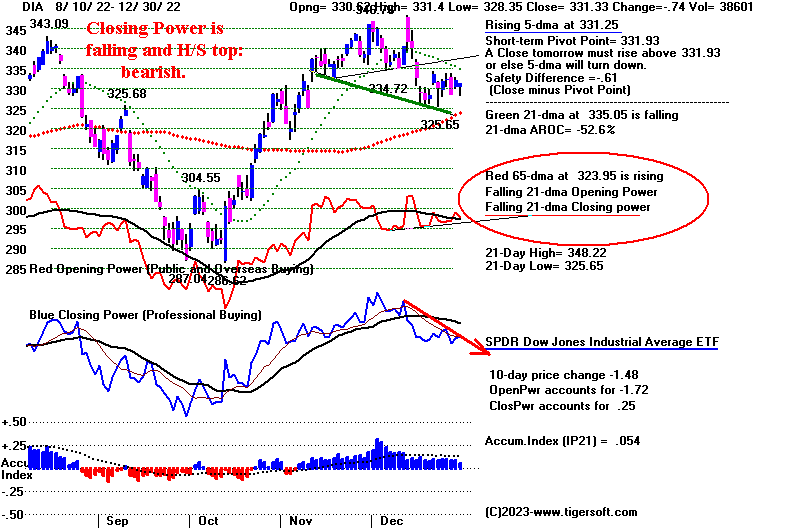 |
Short-term Closing Power
turned up with 5-dma rising.
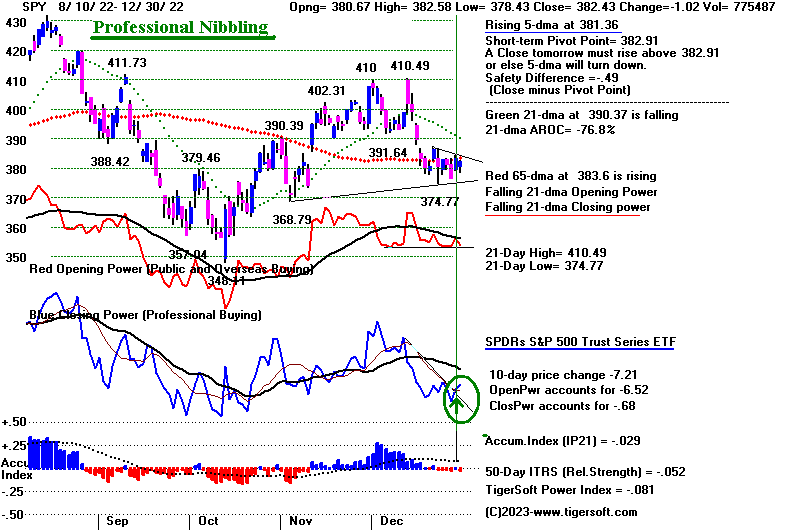 |
NASDAQ still has falling 5-dma, but short-term CP turned up
without a new low being made.
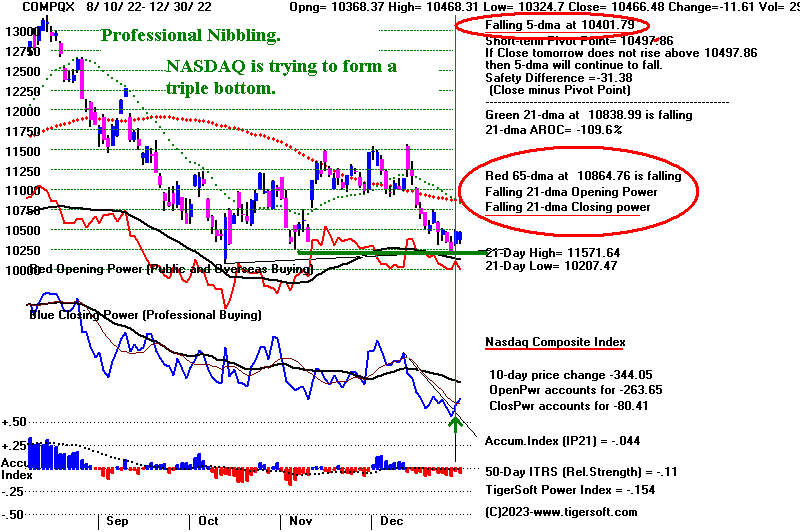 |
QQQ still shows a falling 5-dma, but its short-term Cl.Pwr.
did turn up.
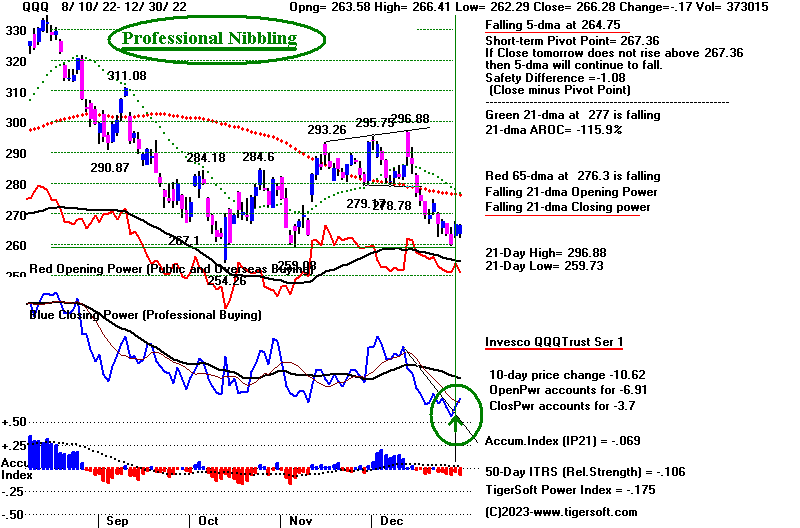 |
5-dma is still falling, but short-term ClPwr. turned up.
Closing Power for NVDA is still
falling but it is holding at support
of 65-dma.
 |
New low limits upside potential here.
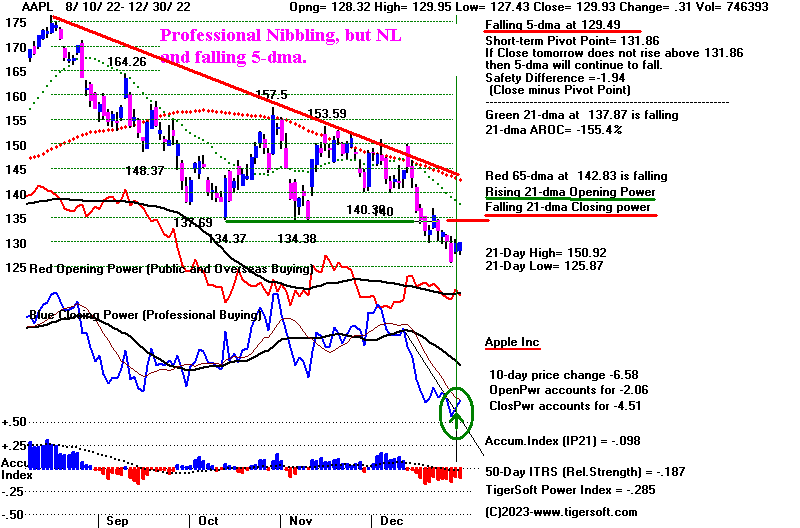 |
UNH is under steady Clos.Pwer selling pressure.
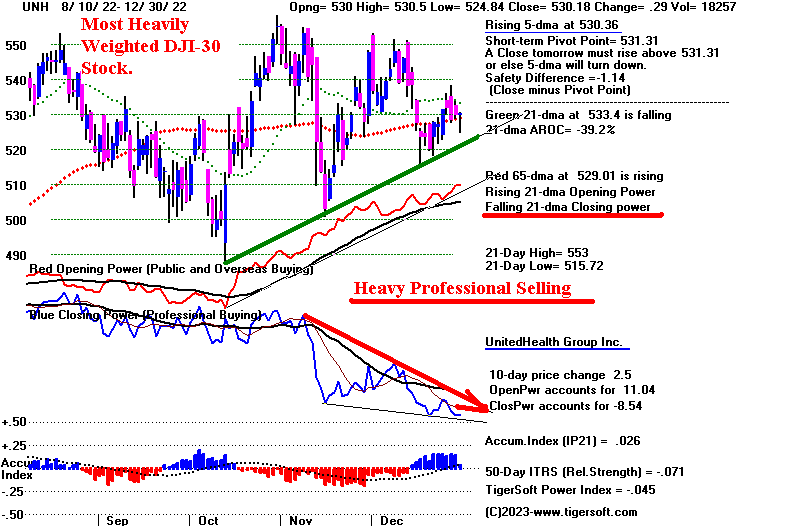 |
Home Depot looks like it is tightly bound beteeen support at
310 and
resistance at 330.
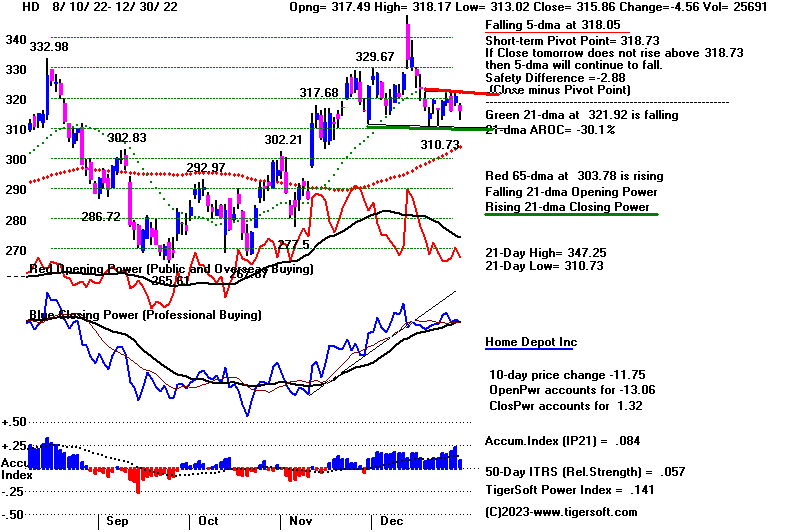 |
Tiger ":Tahiti" Stock at end of 4th qtr is CAT.
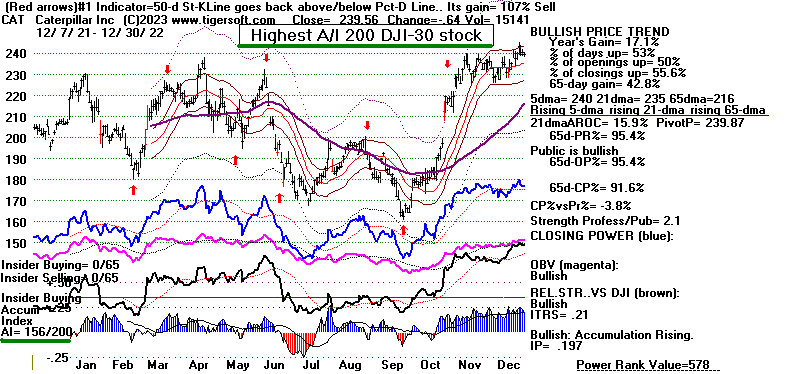 |
TSLA is due to rebound now that tax-loss selling is over.
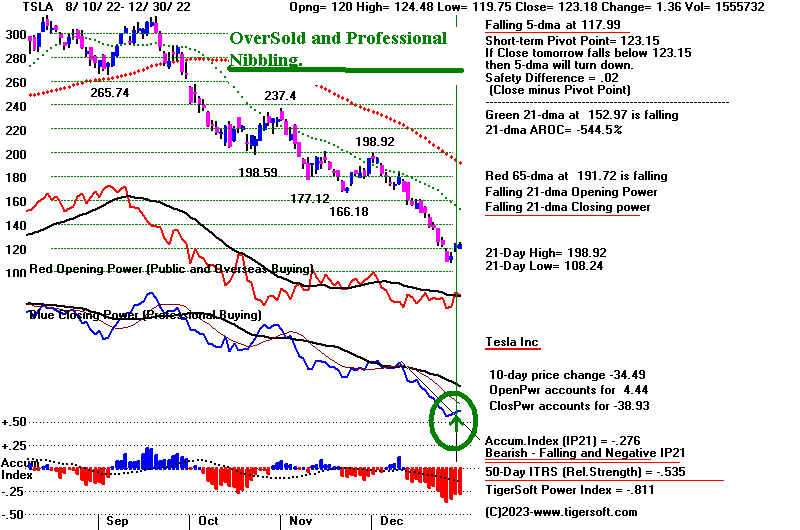 |
AMZN is due to rebound now that tax-loss selling
is over.
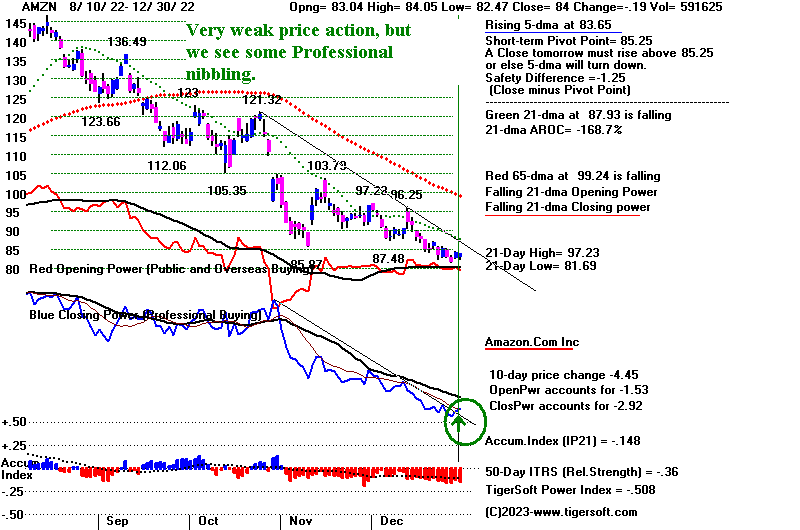 |
Interesting Speculations for 2023 based on
high Accumulation for last
100 days: TRH, |
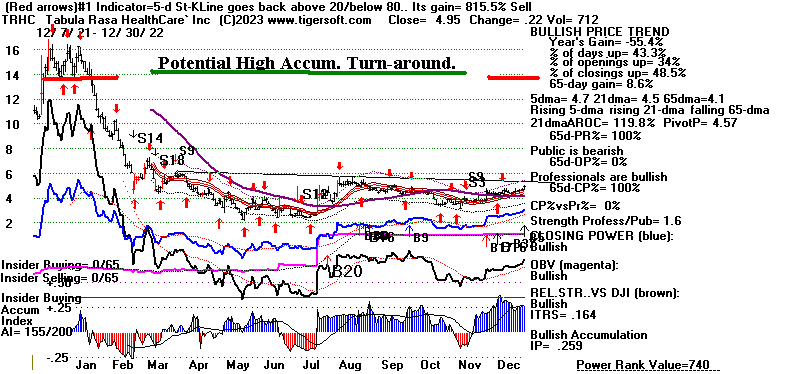 |
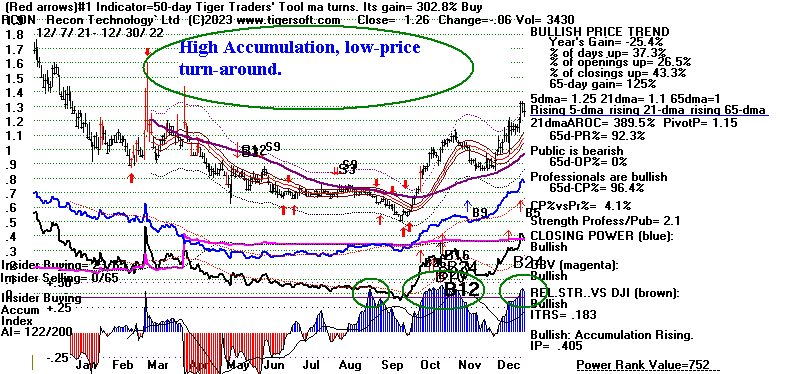 |
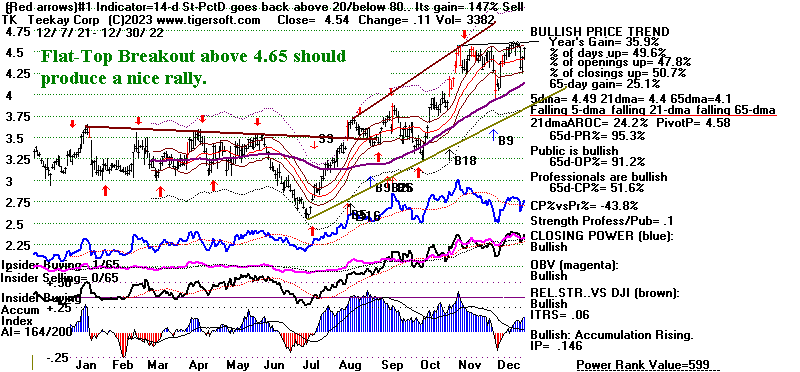 |
Table 1 - Breadth Statistics NYSE Latest Close Previous Close Week Ago
Issues traded 3,260 3,254 3,229
Advances 1,400 2,629 2,088
Declines 1,714 525 1,022
Unchanged 146 100 119
New highs 49 56 52
New lows 72 84 82
Adv. volume* 284,576,532 602,838,900 410,492,663
Decl. volume* 432,299,921 58,297,174 159,525,615
Total volume* 730,101,865 668,494,561 577,667,066
Closing Arms (TRIN)† 1.12 0.52 0.88
Block trades* 4,080 4,126 3,909
Adv. volume 1,233,684,531 2,685,791,927 1,942,534,345
Decl. volume 1,685,758,787 279,777,679 833,549,418
Total volume 2,979,871,579 3,003,688,938 2,819,286,009
NASDAQ Latest Close Previous Close Week Ago
Issues traded 4,910 4,780 4,764
Advances 2,294 3,742 2,365
Declines 2,378 867 2,165
Unchanged 238 171 234
New highs 101 89 71
New lows 181 209 274
Closing Arms (TRIN)† 0.61 0.52 0.83
Block trades 25,909 27,101 26,118
Adv. volume 2,304,468,811 3,689,443,700 1,993,512,978
Decl. volume 1,458,576,797 447,007,842 1,512,024,860
Total volume 3,959,035,029 4,154,103,083 3,544,680,373
|
Table 2 QUICKSILVER on ETFS - 12/30/2022 ---
Bullish = 1 YINN
Bearish = 2 DBO, WEAT
ETF CLOSE CHANGE PIVOT-PT 5-dma AROC CL-PWR CANDLE IP21 ITRS POWER INDEX
================================================================================================
DIA 331.33 -.73 331.93 16.2% ------- BLUE .054 ---------------
---------------------------------------------------------------------------------------------
COMPQX 10466.48 -11.61 10497.86 -4.6% Bearish BLUE -.043 -.109 -.152
---------------------------------------------------------------------------------------------
SPY 382.43 -1.01 382.91 22.4% ------- BLUE -.029 -.051 -.08
---------------------------------------------------------------------------------------------
QQQ 266.28 -.16 267.36 -9.1% Bearish BLUE -.069 -.104 -.173
---------------------------------------------------------------------------------------------
MDY 442.79 -1.99 443.61 28.7% Bearish BLUE -.078 -.033 -.111
---------------------------------------------------------------------------------------------
IWM 174.36 -.49 174.39 21.9% Bearish BLUE -.101 -.07 -.171
---------------------------------------------------------------------------------------------
FAS 73.55 -.77 72.13 177.4% Bearish BLUE -.028 .116 .088
---------------------------------------------------------------------------------------------
RETL 6.95 .05 6.91 260.9% Bearish BLUE .058 -.026 .032
---------------------------------------------------------------------------------------------
SOXL 9.67 0 9.77 -58.1% Bearish BLUE .008 .189 .197
---------------------------------------------------------------------------------------------
TECL 22.1 -.1 22.34 -45.8% ------- BLUE .03 -.089 -.059
---------------------------------------------------------------------------------------------
IBB 131.29 -.05 132.03 -97% ------- BLUE .081 .019 .1
---------------------------------------------------------------------------------------------
GLD 169.64 .79 167.26 85.8% ------- BLUE -.04 .03 -.01
---------------------------------------------------------------------------------------------
DBO 15.21 .33 15 191.1% ------- BLUE -.189 -.153 -.342
---------------------------------------------------------------------------------------------
OIH 304.05 2.17 302.03 218% ------- BLUE -.064 .073 .09
---------------------------------------------------------------------------------------------
CPER 23.09 -.07 23.06 78.2% Bullish BLUE -.292 .066 -.226
---------------------------------------------------------------------------------------------
TAN 72.94 -.14 74.86 -198% Bearish BLUE -.24 .015 -.225
---------------------------------------------------------------------------------------------
UUP 27.81 -.09 27.98 -32.2% Bullish ---- .11 -.172 -.062
---------------------------------------------------------------------------------------------
CORN 26.93 -.03 26.36 123.8% Bullish BLUE .127 -.095 .032
---------------------------------------------------------------------------------------------
WEAT 7.98 .17 7.79 179.3% Bullish BLUE -.096 -.159 -.255
---------------------------------------------------------------------------------------------
YINN 46.18 -3.57 44.49 93.2% ------- RED -.125 .43 .305
|
Table 3 RANKING OF KEY DIRECTORIES BASED PCT.OF STOCKS ABOVE 65-DMA
12/30/22
Bullish = 28
Bearish = 20
---------------------------------------------------------------------------------------
Directory Current day-1 day-2 day-3 day-4 day-5
----------------------------------------------------------------------------------------
COPPER .857 1 1 1 1 1
INFRA .848 .878 .787 .878 .848 .848
EDU .833 .666 .5 .5 .5 .5
HOMEBLDG .833 .888 .777 .888 .888 .888
UTILITY .815 .868 .842 .789 .842 .842
GOLD .782 .782 .804 .869 .847 .847
BONDFUND .77 .735 .632 .586 .747 .77
DJI-13 .769 .769 .769 .769 .846 .846
ETFS .745 .781 .763 .8 .763 .745
INSURANC .72 .76 .68 .76 .76 .76
BEVERAGE .714 .785 .785 .785 .785 .785
MILITARY .692 .615 .538 .615 .615 .538
DOWJONES .633 .733 .666 .7 .733 .766
=====
CHEM .63 .695 .608 .652 .652 .63
SP-100 .622 .655 .6 .644 .666 .655
CHINA .62 .6 .58 .66 .62 .6
FOOD .612 .591 .571 .571 .571 .551
SP500 .604 .646 .559 .62 .642 .608
=====
INDMATER .583 .625 .555 .652 .652 .597
HOSPITAL .571 .571 .571 .571 .571 .571
COMODITY .564 .564 .564 .589 .564 .589
FIDSTKS .562 .597 .532 .579 .597 .573
RUS-1000 .561 .588 .496 .57 .586 .558
=====
SEMI .557 .557 .326 .473 .515 .526
NASD-100 .54 .55 .45 .49 .52 .53
=====
INDEXES .535 .54 .437 .529 .54 .502
ELECTRON .533 .533 .36 .496 .518 .511
HIGHPRIC .525 .573 .435 .5 .556 .538
===============================================================================================
GUNS .5 .428 .285 .357 .357 .357
===============================================================================================
OILGAS .485 .485 .409 .533 .514 .409
SOFTWARE .482 .517 .41 .446 .482 .428
REIT .476 .5 .415 .546 .553 .507
NIFTY .454 .5 .34 .409 .454 .431
RETAIL .446 .489 .425 .553 .531 .446
FINANCE .437 .487 .4 .5 .537 .5
GAMING .421 .421 .315 .421 .421 .421
BIOTECH .415 .41 .338 .341 .385 .415
COMPUTER .4 .45 .3 .35 .4 .45
AUTO .377 .396 .32 .358 .358 .339
HACKERS .375 .375 .375 .437 .437 .437
TRANSP .368 .421 .368 .473 .526 .473
REGBANKS .36 .4 .32 .44 .4 .28
GREEN .333 .5 .333 .444 .444 .444
JETS .307 .307 .307 .384 .384 .384
BIGBANKS .285 .428 .285 .428 .571 .571
LOWPRICE .277 .271 .246 .254 .296 .274
SOLAR .187 .187 .125 .187 .25 .312
COAL .166 .166 .166 .833 .666 .5
MARIJUAN .1 .1 0 .1 .1 .1
|
===================================================================================
Friday - 6:15 AM - Futures: DJI -140 NASDAQ -107 Data Used: 12/29/22
| |
12-29-22
DJIA 33220.80 345.09 1.05
S&P 500 3849.28 66.06 1.75
Nasdaq 10478.09 264.80 2.59
New highs 56 + 89 = 145
New lows 84 + 209 = 293
NYSE Advances 2,629 vs 718 (day before)
NYSE Declines 525 vs 2,455 (day before)
|
|
| |
Happy New Year. Third years in Presidential
Election Years usually bring
good advances through
the middle of the Summer. So, good things may happen
in 2023.
The immediate market
future is likely to be most affected by year-end tax
pressures and shifts
into stocks that seem likely to perform the best in the
year. The DJI
based on Peerless signals may still manage to rise by more than
2%, at which point a
Sell signal is likely. CAT is the highest AI/200 stock
and our Tahiti
long-term pick. The highest priced stock in the DJI-30 and thus
the most heavily
weighted is UNH. See its uptrend and current red Buy signal below.
The third most heavily
weighted DJI stock, following CAT, is GS. This is a
key stock to watch
always, and now in particular, because of how well-connected
it is especially to the
FED. Its Closing Power trend is down.
The Openiing and
Closing Powers as well as the 5-day ma are falling for
DIA. Profits are
sometimes delayed in the taking until the new year. The
window-dressing buys in
DIA come to an end now. So, we expect weakness
in the DJI immediately
ahead. It will be bearish on an intermediate-term
basis if it breaks
below its 65-dma and the neckline in its drooping head and
shoulders pattern.
Again the DJI is unable to get back above its 21-day ma.
The older version of
Peerless would like to call Thursday's rally a two-day reversal
up. But the newer
current version does not. Instead, we consider the rally to be
typical of year-end
cross-currents.
It is the NASDAQ, tech
stocks, SOXL and QQQ which ought to have some
potential next week
when tax loss selling comes off. Down so much this year,
they must be tempting a
lot of traders as "long" plays. If they do rally, we will
see their Closing
Powers turn up convincingly. Watch the tech stocks below closely
for very good
"lonng" trades. Their decline today proves the Wall Street adage
that tax loss selling
often does not end until the very last hour of trading on the
last day of the
expiring old year.
Right now we are long
DIA and SOXL and short a number of bearish MINCPs.
I would close out the
bearish MINCP short sales today because of how often these
stocks try to bounce
back when tax loss selling ends,. |
|
| |
Charts - 12/29/2022
2022 PEERLESS DJI, Signals, Indicators Daily DJI Volume
10-DayUp/Down Vol Stoch-20 CCI RSI Pct of All Stocks above 65-dma
Inverted Traders Index
DJI-IPA DJI-OBV Short-Term Rates
NASDAQ S&P OEX NYSE DJ-15 DJ-20 DJI-30 Bond Funds
DIA QQQ SPY IWM new - COIN (Bit Coin ETF)
TNA Short-Term Rates Ten Year Rates PST (Short Treasuries)
DOLLAR-UUP
ALLSTOCKs
Russell-1000
Insurance-Stocks
Recent 2006 vers-Peerless signals
http://www.tigersoftware.com/OLDPEER/UPD81229.bmp
MDY - http://www.tigersoftware.com/CHARTX/MDY.GIF
USO-CrudeOil DBO FAS GLD HD IBB JETS JNUG KOL NAIL NUGT NRGU OIH
PALL RSX RETL SDS AGQ SLV SOXL TAN TECL TLT TMF TNA UGA USO
China: YINN
CHAU
Commodities: CANE
CORN DBC JJC, NIB CORN, CUT (paper)
MOO, NRGU
SOYB WEAT UUP (Dollar) LIT
(Lithium)
China: YINN
CHAU
Commodities: CANE
CORN DBC JJC, NIB CORN, CUT (paper)
MOO, NRGU
SOYB WEAT UUP (Dollar) LIT
(Lithium)
Stocks AA AAPL ADBE ALXN AMAT AMGN AMD AMZN AXP BA BABA
BAC BIDU BLDP CAT CHKP CNX CPB CRM CVX CMG DE DIS ENPH FB FSLR
FTNT GILD GME GOOG GS HD IBM INTU JPM KO KR LRCX MRK MRNA
MOS MSFT NEM NFLX NKE NOC NUE NVDA PANW PG PYPL REGN REV
SO QCOM QDEL TSLA TXN XOM V VRTX WFC WMT XLE ZM ZOM
Leveraged Short ETFs:
FAZ - financials, TZA and SRTY- small caps, MZZ - mid caps, TECS -Techs,
SOXS -
semi-conductors LABD
- Biotechs
Bullish MAXCPs http://www.tigersoftware.com/UPPING/12-29-22/BULLISH.htm
Bearish MINCPs http://www.tigersoftware.com/Downing/12-29-22/BEARISH.htm
|
|
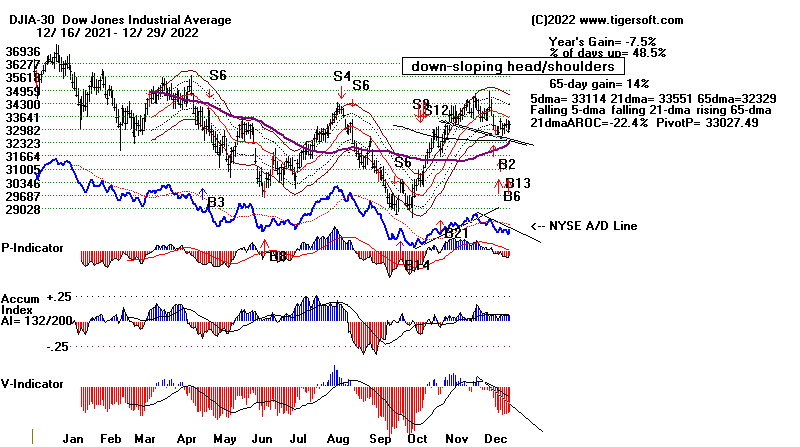
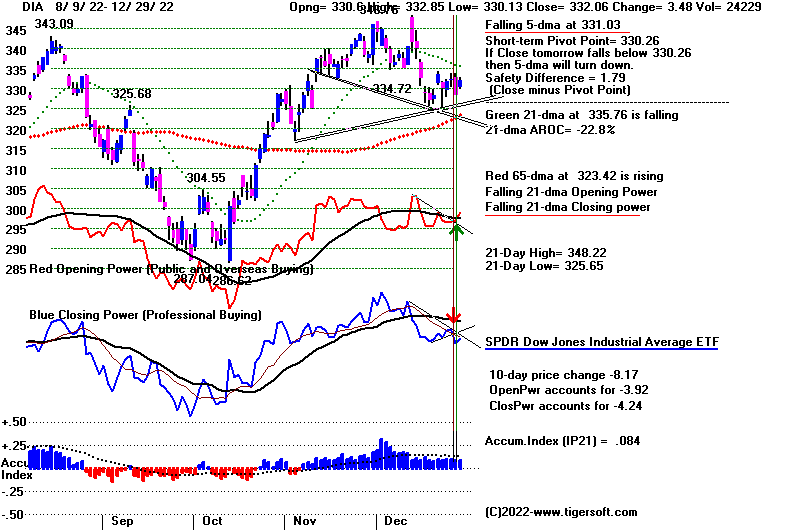 |
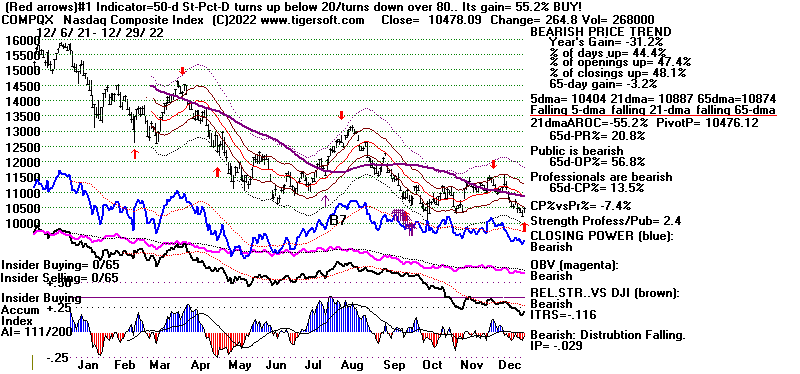
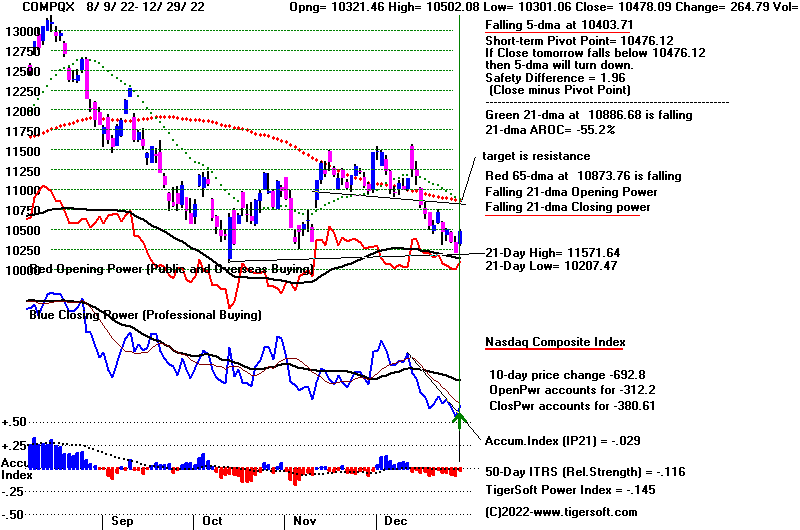
|
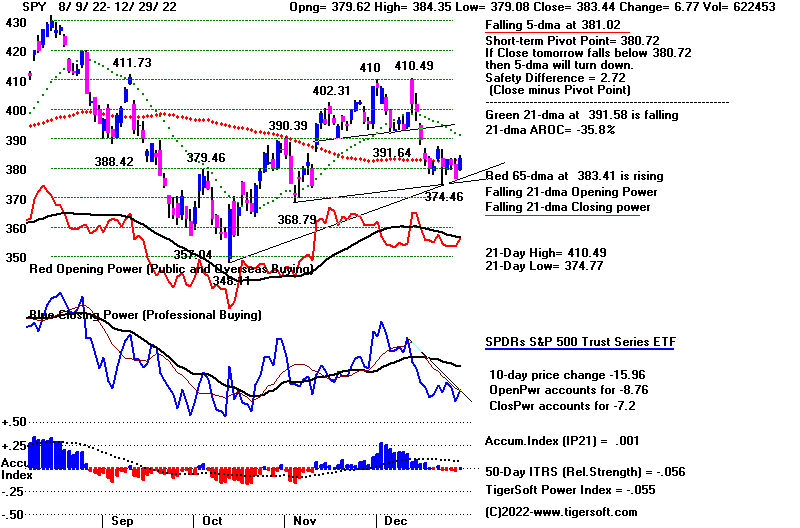 |
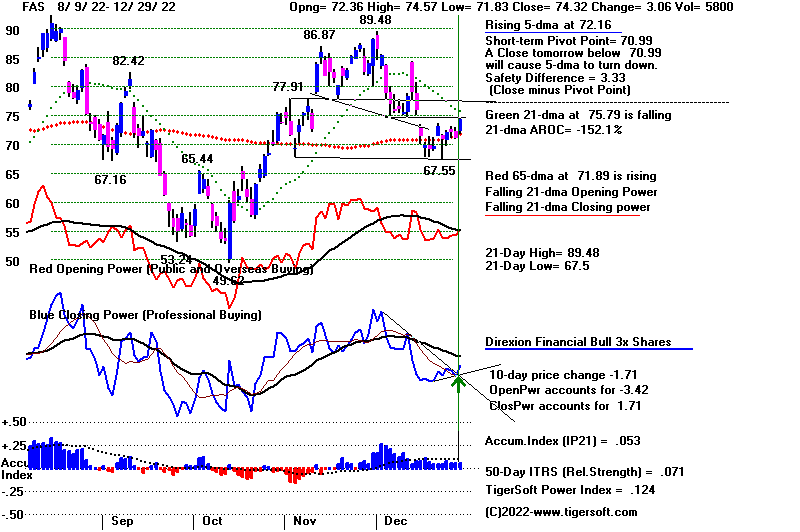 |
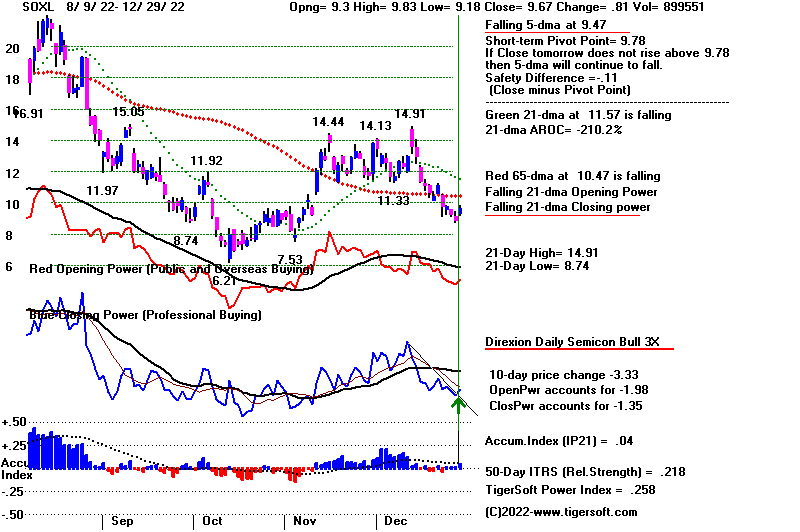 |
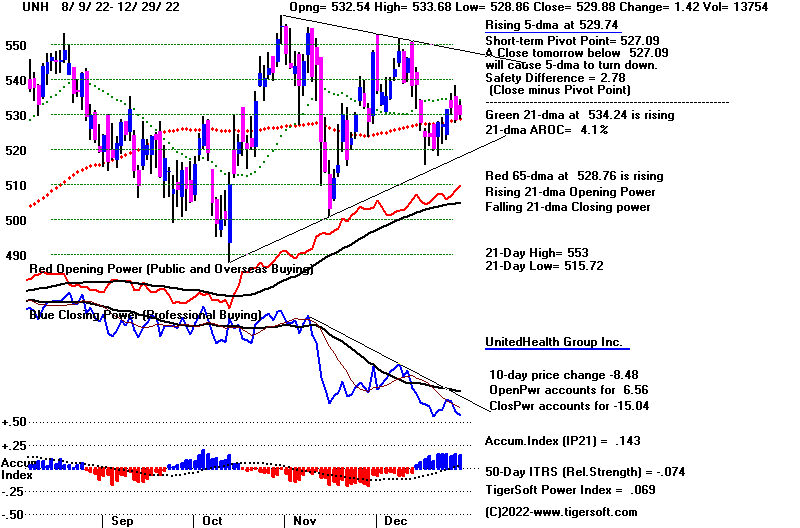 |
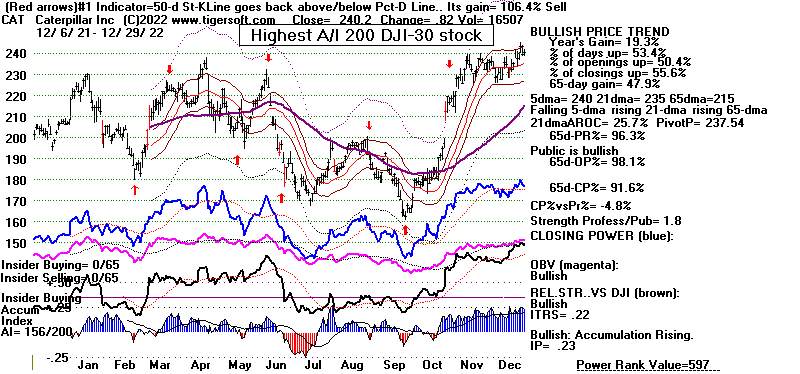 |
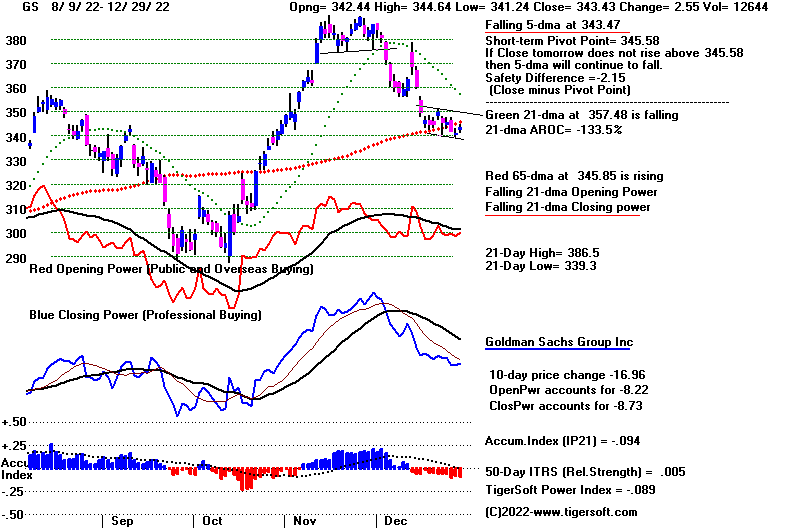 |
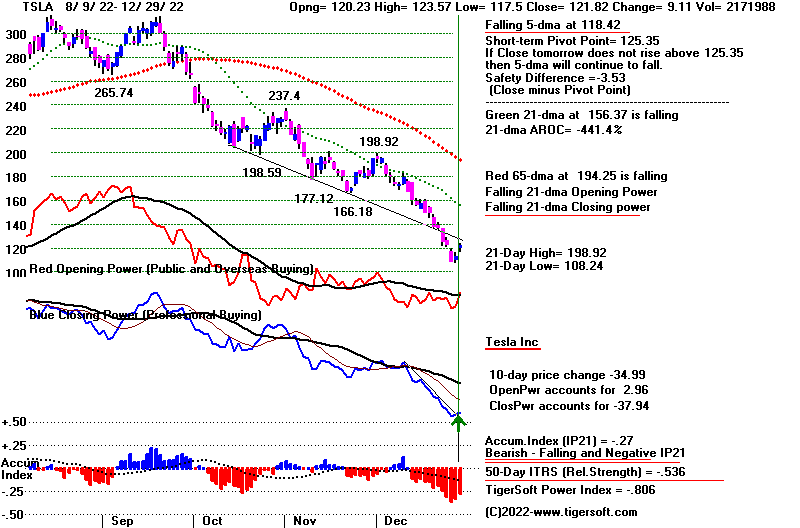 |
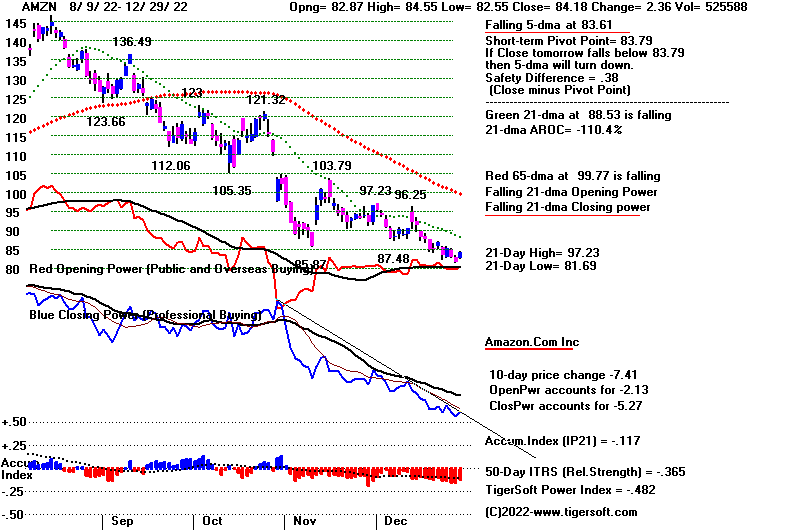 |
 |
 |
Table 1 - Breadth Statistics 12-29-22
DJIA 33220.80 345.09 1.05
S&P 500 3849.28 66.06 1.75
Nasdaq 10478.09 264.80 2.59
New highs 56 + 89 = 145
New lows 84 + 209 = 293
NYSE Advances 2,629 vs 718 (day before)
NYSE Declines 525 vs 2,455 (day before)
NYSE Latest Close Previous Close Week Ago
Issues traded 3,254 3,245 3,259
Advances 2,629 718 698
Declines 525 2,455 2,442
Unchanged 100 72 119
New highs 56 62 47
New lows 84 180 201
Adv. volume* 602,838,900 95,820,808 202,670,947
Decl. volume* 58,297,174 516,571,296 597,160,491
Total volume* 668,494,561 625,406,414 810,447,668
Closing Arms (TRIN)† 0.52 1.30 0.70
Block trades* 4,126 3,919 4,669
Adv. volume 2,685,791,927 550,877,318 1,135,528,956
Decl. volume 279,777,679 2,457,388,820 2,772,607,760
Total volume 3,003,688,938 3,083,527,250 3,956,957,366
NASDAQ Latest Close Previous Close Week Ago
Issues traded 4,780 4,794 4,815
Advances 3,742 1,546 1,505
Declines 867 3,042 3,075
Unchanged 171 206 235
New highs 89 99 96
New lows 209 502 483
Closing Arms (TRIN)† 0.52 0.92 0.87
Block trades 27,101 25,159 40,168
Adv. volume 3,689,443,700 1,340,021,635 1,821,790,297
Decl. volume 447,007,842 2,434,616,753 3,249,552,164
Total volume 4,154,103,083 3,842,976,514 5,125,076,610
|
Table 2 QUICKSILVER on ETFS - 12/29/2022 ---
Bullish = 1 SOXL
Bearish = 2 DBO, WEAT
ETF CLOSE CHANGE PIVOT-PT 5-dma AROC CL-PWR CANDLE IP21 ITRS POWER INDEX
================================================================================================
DIA 332.06 3.49 330.26 -23.2% ------- BLUE .085 ------------------
---------------------------------------------------------------------------------------------
COMPQX 10478.09 264.8 10476.12 -110.7% Bearish BLUE -.029 -.114 -.143
---------------------------------------------------------------------------------------------
SPY 383.44 6.78 380.72 -36.6% ------- BLUE .002 -.054 -.052
---------------------------------------------------------------------------------------------
QQQ 266.44 6.34 266.76 -131.6% Bearish BLUE -.032 -.106 -.138
---------------------------------------------------------------------------------------------
MDY 444.78 8.46 440.25 -7.9% ------- BLUE -.011 -.045 -.056
---------------------------------------------------------------------------------------------
IWM 174.85 4.32 173.6 -30.3% Bearish BLUE -.073 -.083 -.156
---------------------------------------------------------------------------------------------
FAS 74.32 3.07 70.99 82% Bearish BLUE .054 .073 .127
---------------------------------------------------------------------------------------------
RETL 6.9 .49 6.6 -66.9% Bearish BLUE .079 -.125 -.046
---------------------------------------------------------------------------------------------
SOXL 9.67 .81 9.78 -752.8% Bearish BLUE .041 .22 .261
---------------------------------------------------------------------------------------------
TECL 22.2 1.57 22.3 -429.9% ------- BLUE .064 -.091 -.027
---------------------------------------------------------------------------------------------
IBB 131.34 2.95 133.83 -90.9% Bullish BLUE .112 -.017 .095
---------------------------------------------------------------------------------------------
GLD 168.85 .94 166.76 1.5% ------- BLUE -.009 .011 .002
---------------------------------------------------------------------------------------------
DBO 14.88 -.07 14.64 43.7% ------- BLUE -.213 -.152 -.365
---------------------------------------------------------------------------------------------
OIH 301.88 7.69 291.03 34.9% ------- BLUE -.051 .12 .069
---------------------------------------------------------------------------------------------
CPER 23.16 0 22.73 19.6% Bullish BLUE -.251 .058 -.193
---------------------------------------------------------------------------------------------
TAN 73.08 1.25 75.86 -356.9% Bearish BLUE -.159 -.02 -.179
---------------------------------------------------------------------------------------------
UUP 27.9 -.17 27.99 -8.9% Bullish ---- .1 -.161 -.061
---------------------------------------------------------------------------------------------
CORN 26.96 -.07 26.27 122.6% Bullish BLUE .121 -.096 .025
---------------------------------------------------------------------------------------------
WEAT 7.81 -.11 7.7 38.5% ------- ---- -.093 -.186 -.279
---------------------------------------------------------------------------------------------
YINN 49.75 3.99 45.3 393.6% ------- BLUE -.076 .341 .265
|
Table 3 2RANKING OF KEY DIRECTORIES BASED PCT.OF STOCKS ABOVE 65-DMA
12/29/22
Bulllish = 29
Bearish = 17
---------------------------------------------------------------------------------------
Directory Current day-1 day-2 day-3 day-4 day-5
----------------------------------------------------------------------------------------
COPPER 1 1 1 1 1 1
HOMEBLDG .888 .777 .888 .888 .888 .888
INFRA .878 .787 .878 .848 .818 .909
UTILITY .868 .842 .789 .842 .842 .868
BEVERAGE .785 .785 .785 .785 .785 .785
GOLD .782 .804 .869 .847 .847 .869
ETFS .781 .763 .8 .763 .763 .8
DJI-13 .769 .769 .769 .846 .846 .846
INSURANC .76 .68 .76 .76 .76 .8
BONDFUND .735 .632 .586 .747 .758 .793
DOWJONES .733 .666 .7 .733 .766 .8
=====
CHEM .695 .608 .673 .63 .652 .673
EDU .666 .5 .5 .5 .5 .666
SP-100 .655 .6 .644 .666 .655 .7
SP500 .646 .559 .62 .638 .614 .666
=====
INDMATER .625 .555 .652 .652 .597 .666
MILITARY .615 .538 .615 .615 .538 .692
CHINA .6 .58 .66 .62 .62 .68
FIDSTKS .597 .532 .579 .597 .573 .633
FOOD .591 .571 .551 .571 .551 .53
RUS-1000 .588 .496 .57 .586 .559 .623
=====
HIGHPRIC .573 .435 .5 .556 .543 .646
HOSPITAL .571 .571 .571 .571 .571 .5
COMODITY .564 .564 .564 .564 .589 .564
SEMI .557 .326 .473 .515 .526 .652
NASD-100 .55 .45 .49 .52 .53 .64
=====
INDEXES .54 .437 .529 .54 .508 .616
ELECTRON .533 .36 .496 .518 .518 .639
SOFTWARE .517 .428 .446 .482 .428 .535
==================================================================================================
GREEN .5 .333 .444 .444 .444 .444
NIFTY .5 .34 .409 .454 .431 .522
REIT .5 .407 .553 .561 .484 .553
==================================================================================================
RETAIL .489 .425 .553 .531 .468 .531
FINANCE .487 .4 .5 .525 .487 .537
OILGAS .485 .409 .533 .514 .419 .495
COMPUTER .45 .3 .35 .4 .45 .5
BIGBANKS .428 .285 .428 .571 .571 .571
GUNS .428 .285 .357 .357 .357 .428
GAMING .421 .315 .368 .473 .421 .526
TRANSP .421 .368 .473 .526 .473 .578
BIOTECH .41 .336 .344 .385 .415 .421
REGBANKS .4 .32 .44 .4 .28 .4
AUTO .396 .32 .358 .358 .339 .415
HACKERS .375 .375 .437 .437 .437 .437
JETS .307 .307 .384 .384 .384 .538
LOWPRICE .271 .249 .257 .299 .274 .299
SOLAR .187 .125 .187 .25 .312 .312
COAL .166 .166 .833 .666 .666 .666
MARIJUAN .1 0 .1 .1 .1 .1
|
====================================================================================
====================================================================================
Thursday - 6:00 AM - Futures: DJI +73 NASDAQ +68 Data
Used: 12/28/22
| |
12-28-22DJIA 32875.71 -365.85 -1.10
S&P 500 3783.22 -46.03 -1.20
Nasdaq 10213.29 -139.94 - 1.4
new highs = 62 + 99 = 161
new lows = 180 + 502 = 682
|
|
| |
Short-Term
Rates shot up to a new high today. That spooked bonds, Bond Funds,
FAS.and Goldman Sachs, the second most heaily weighted
stock in DJI. Tax loss
selling contined to propel the NASDAQ,
QQQ and most of the biggest tech stocks
lower. TESLA was an exception, but it was
very oversold.
Both the Opening and Closing Powers are
falling bearish for DIA, SPY, the
NASDAQ and QQQ, as seen in their candle
sticks shown below. Weak as the
DJI and DIA looked today, they still show
rising 5-day moving averages and
are above the nested support of their
65-dma and their recent lows. Watch closely
at this point to see if the DJI can
rebound with conviction today. That would
help save it from completing a head and
shoulders pattern and encourage our
hopes that the seasonal Peerless buys can
still bring a rally to the upper band.
Where will the market go next week as the
new year starts? A lot will depend on
the big tech stocks and ETFs shown below
starting to hold up and having their
Closing Power turn up in preparation for
a 10%-15% rally as tax-loss selling lifts off.
Hold the bearish MINCPs short and stay
long DIA . SOXL remains on
a Stochastic RED Buy. Let's see if
it can't turn around soon.
|
|
| |
Charts - 12/28/2022
2022 PEERLESS DJI, Signals, Indicators Daily DJI Volume
10-DayUp/Down Vol Stoch-20 CCI RSI Pct of All Stocks above 65-dma
Inverted Traders Index
DJI-IPA DJI-OBV Short-Term Rates
NASDAQ S&P OEX NYSE DJ-15 DJ-20 DJI-30 Bond Funds
DIA QQQ SPY IWM new - COIN (Bit Coin ETF)
TNA Short-Term Rates Ten Year Rates PST (Short Treasuries)
DOLLAR-UUP
ALLSTOCKs
Russell-1000
Insurance-Stocks
Recent 2006 vers-Peerless signals
http://www.tigersoftware.com/OLDPEER/UPD81228.bmp
MDY - http://www.tigersoftware.com/CHARTX/MDY.GIF
USO-CrudeOil DBO FAS GLD HD IBB JETS JNUG KOL NAIL NUGT NRGU OIH
PALL RSX RETL SDS AGQ SLV SOXL TAN TECL TLT TMF TNA UGA USO
China: YINN
CHAU
Commodities: CANE
CORN DBC JJC, NIB CORN, CUT (paper)
MOO, NRGU
SOYB WEAT UUP (Dollar) LIT
(Lithium)
China: YINN
CHAU
Commodities: CANE
CORN DBC JJC, NIB CORN, CUT (paper)
MOO, NRGU
SOYB WEAT UUP (Dollar) LIT
(Lithium)
Stocks AA AAPL ADBE ALXN AMAT AMGN AMD AMZN AXP BA BABA
BAC BIDU BLDP CAT CHKP CNX CPB CRM CVX CMG DE DIS ENPH FB FSLR
FTNT GILD GME GOOG GS HD IBM INTU JPM KO KR LRCX MRK MRNA
MOS MSFT NEM NFLX NKE NOC NUE NVDA PANW PG PYPL REGN REV
SO QCOM QDEL TSLA TXN XOM V VRTX WFC WMT XLE ZM ZOM
Leveraged Short ETFs:
FAZ - financials, TZA and SRTY- small caps, MZZ - mid caps, TECS -Techs,
SOXS -
semi-conductors LABD
- Biotechs
Bullish MAXCPs http://www.tigersoftware.com/UPPING/12-28-22/BULLISH.htm
Bearish MINCPs http://www.tigersoftware.com/Downing/12-28-22/BEARISH.htm |
|
|
Falling Opening and Closing Power
 |
Falling Opening and Closing Powers
 |
 |
 |
 |
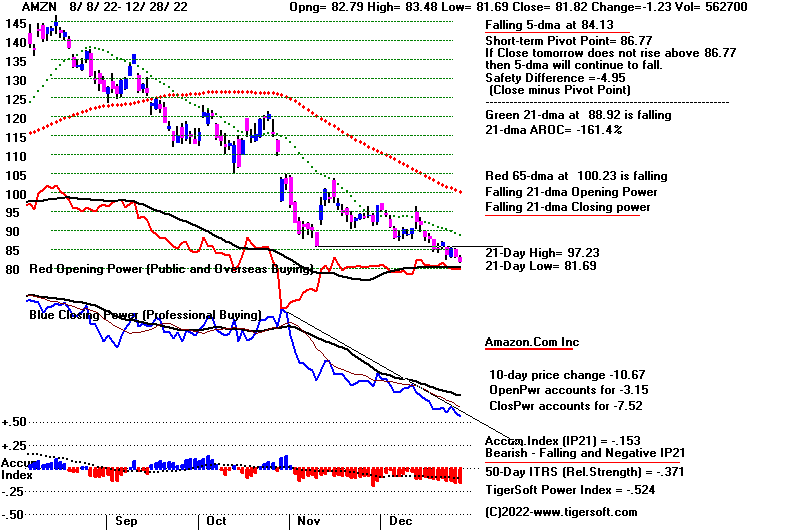 |
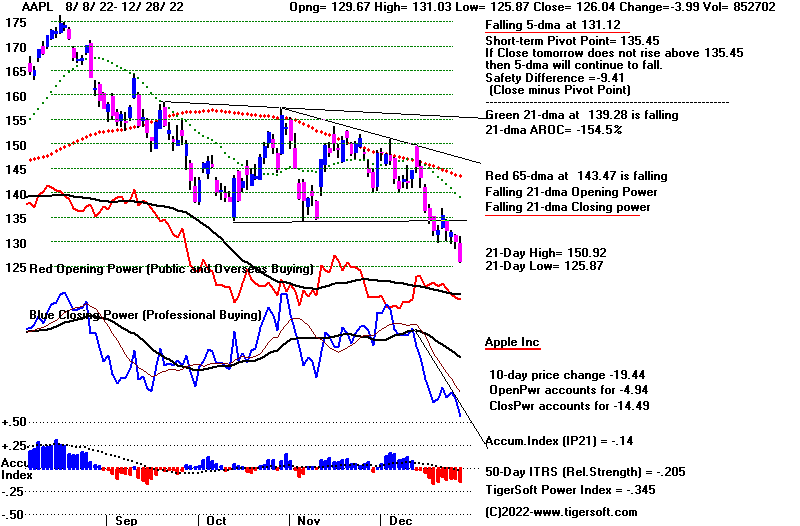 |
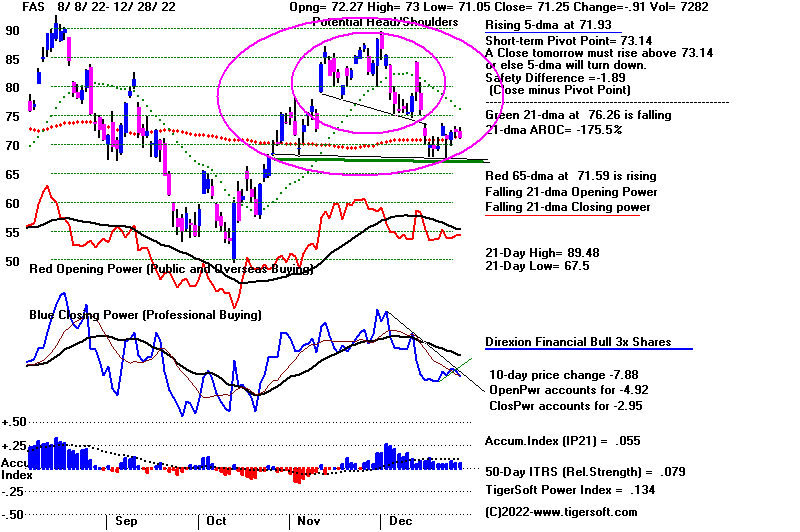 |
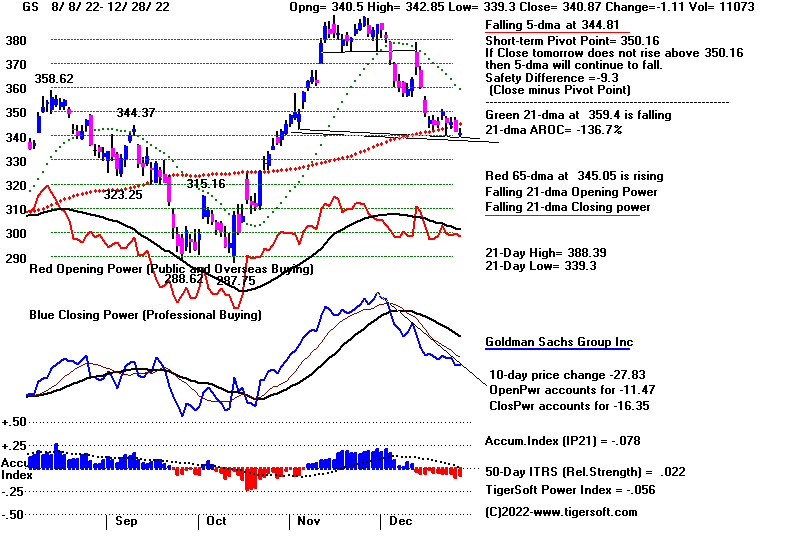 |
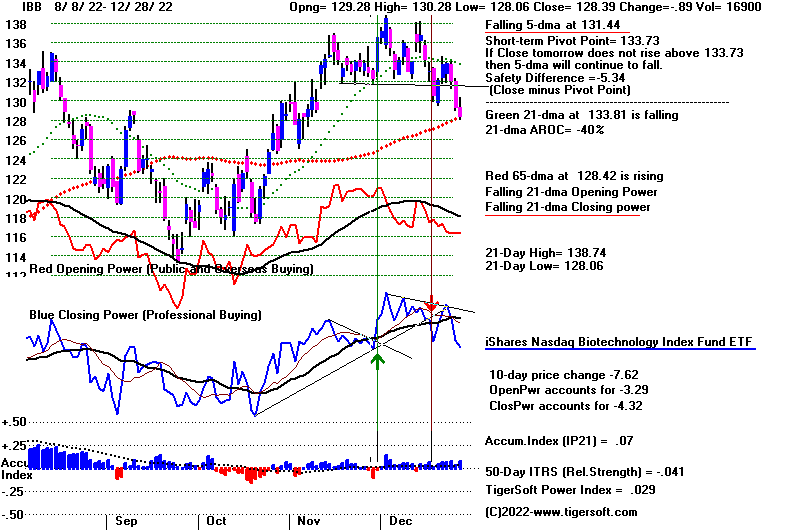 |
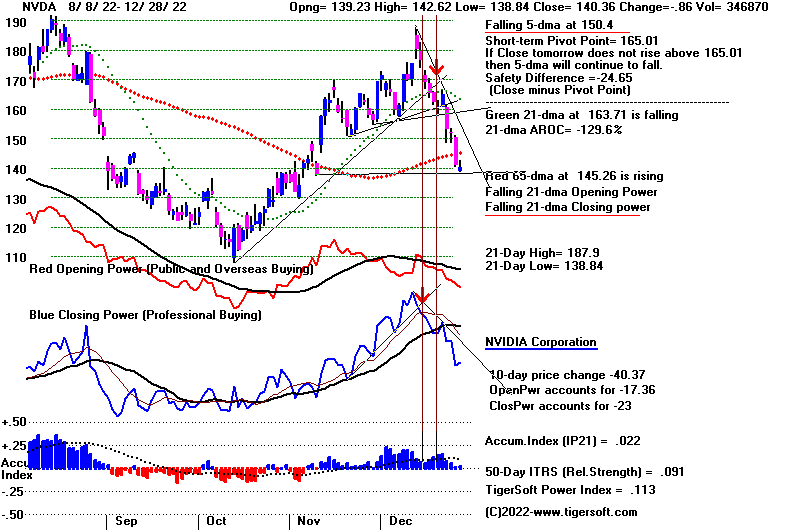 |
Table 1 - Breadth Statistics
12-28-22DJIA 32875.71 -365.85 -1.10
S&P 500 3783.22 -46.03 -1.20
Nasdaq 10213.29 -139.94 - 1.4
new highs = 62 + 99 = 161
new lows = 180 + 502 = 682
NYSE Latest Close Previous Close Week Ago
Issues traded 3,245 3,261 3,251
Advances 718 1,409 2,409
Declines 2,455 1,770 728
Unchanged 72 82 114
New highs 62 65 52
New lows 180 137 73
Adv. volume* 95,820,808 328,563,550 705,349,316
Decl. volume* 516,571,296 274,788,552 95,875,147
Total volume* 625,406,414 609,347,797 808,085,822
Closing Arms (TRIN)† 1.30 0.76 0.50
Block trades* 3,919 3,857 4,454
Adv. volume 550,877,318 1,532,750,364 3,245,763,387
Decl. volume 2,457,388,820 1,469,147,826 491,138,026
Total volume 3,083,527,250 3,030,305,147 3,775,205,521
NASDAQ Latest Close Previous Close Week Ago
Issues traded 4,794 4,838 4,838
Advances 1,546 1,587 3,117
Declines 3,042 3,063 1,480
Unchanged 206 188 241
New highs 99 103 82
New lows 502 534 316
Closing Arms (TRIN)† 0.92 1.42 1.04
Block trades 25,159 25,192 30,500
Adv. volume 1,340,021,635 1,013,924,400 2,903,737,852
Decl. volume 2,434,616,753 2,784,039,541 1,435,651,701
Total volume 3,842,976,514 3,827,292,054 4,401,426,086
|
Table 2 QUICKSILVER on ETFS - 12/28/2022 ---
Bullish = 0
Bearish = 2 DBO, WEAT
ETF CLOSE CHANGE PIVOT-PT 5-dma AROC CL-PWR CANDLE IP21 ITRS POWER INDEX
================================================================================================
DIA 328.57 -3.8 333.6 2.9% Bearish RED .084 0 .084
---------------------------------------------------------------------------------------------
COMPQX 10213.29 -139.94 10709.37 -158.7% Bearish RED -.079 -.131 -.21
---------------------------------------------------------------------------------------------
SPY 376.66 -4.74 386.23 -50.7% Bearish RED -.024 -.061 -.085
---------------------------------------------------------------------------------------------
QQQ 260.1 -3.48 273.45 -176% Bearish RED -.07 -.122 -.192
---------------------------------------------------------------------------------------------
MDY 436.32 -7.5 445.48 -9.8% Bearish RED -.034 -.051 -.085
---------------------------------------------------------------------------------------------
IWM 170.53 -2.69 175.9 -68.7% Bearish RED -.127 -.097 -.224
---------------------------------------------------------------------------------------------
FAS 71.25 -.9 73.14 115.9% Bearish RED .055 .08 .135
---------------------------------------------------------------------------------------------
RETL 6.41 -.31 6.99 -111% Bearish RED .041 -.151 -.11
---------------------------------------------------------------------------------------------
SOXL 8.86 -.41 11.14 -769.3% Bearish RED .007 .121 .128
---------------------------------------------------------------------------------------------
TECL 20.63 -1.06 24.11 -513.7% Bearish RED .028 -.138 -.11
---------------------------------------------------------------------------------------------
IBB 128.39 -.88 133.73 -139.6% Bearish RED .07 -.04 .03
---------------------------------------------------------------------------------------------
GLD 167.91 -.76 168.8 -34.8% ------- RED -.021 .007 -.014
---------------------------------------------------------------------------------------------
DBO 14.95 -.16 14.75 162.2% ------- RED -.192 -.169 -.361
---------------------------------------------------------------------------------------------
OIH 294.19 -9.62 299.8 14.4% Bearish RED -.054 .106 .052
---------------------------------------------------------------------------------------------
CPER 23.16 .14 23.07 30.5% ------- ---- -.262 .044 -.218
---------------------------------------------------------------------------------------------
TAN 71.83 -1.25 78.42 -328.5% Bearish RED -.205 -.009 -.214
---------------------------------------------------------------------------------------------
UUP 28.07 .1 27.95 34% Bullish BLUE .126 -.157 -.031
---------------------------------------------------------------------------------------------
CORN 27.03 .41 26.31 195.7% Bullish BLUE .065 -.098 -.033
---------------------------------------------------------------------------------------------
WEAT 7.92 .1 7.75 233% ------- BLUE -.132 -.185 -.317
---------------------------------------------------------------------------------------------
YINN 45.76 -5.05 46.09 346.8% Bearish RED -.095 .198 .103
|
TABLE 3 RANKING OF KEY DIRECTORIES BASED PCT.OF STOCKS ABOVE 65-DMA
12/28/22
Bullish = 21
Bearish = 27 Bearish is now a plurality.
---------------------------------------------------------------------------------------
Directory Current day-1 day-2 day-3 day-4 day-5
----------------------------------------------------------------------------------------
COPPER 1 1 1 1 1 1
UTILITY .842 .789 .842 .842 .868 .815
GOLD .804 .869 .847 .847 .869 .847
INFRA .787 .878 .848 .818 .909 .818
BEVERAGE .785 .785 .785 .785 .785 .714
HOMEBLDG .777 .888 .888 .888 .888 .888
DJI-13 .769 .769 .846 .846 .923 .846
ETFS .763 .8 .763 .763 .818 .745
INSURANC .68 .76 .76 .76 .8 .72
DOWJONES .666 .7 .733 .766 .833 .733
=====
BONDFUND .632 .586 .747 .758 .793 .793
CHEM .608 .673 .652 .63 .695 .586
SP-100 .6 .644 .666 .655 .711 .633
CHINA .58 .66 .62 .62 .68 .66
FOOD .571 .551 .551 .551 .53 .53
HOSPITAL .571 .571 .571 .571 .5 .5
COMODITY .564 .564 .538 .589 .564 .564
SP500 .559 .62 .638 .61 .672 .597
=====
INDMATER .555 .652 .652 .597 .666 .569
MILITARY .538 .615 .615 .538 .692 .615
FIDSTKS .532 .579 .597 .573 .639 .568
===============================================================================================
EDU .5 .5 .5 .5 .666 .5
===============================================================================================
RUS-1000 .496 .57 .586 .559 .624 .541
=====
NASD-100 .45 .49 .52 .53 .63 .54
======
INDEXES .437 .529 .54 .508 .616 .475
HIGHPRIC .435 .5 .556 .543 .646 .5
SOFTWARE .428 .464 .482 .428 .535 .5
RETAIL .425 .553 .531 .468 .531 .468
OILGAS .409 .533 .514 .419 .504 .409
REIT .407 .546 .569 .492 .546 .484
FINANCE .4 .5 .525 .475 .537 .437
HACKERS .375 .437 .437 .437 .437 .437
TRANSP .368 .473 .526 .473 .578 .526
ELECTRON .36 .496 .518 .518 .631 .556
NIFTY .34 .409 .454 .431 .522 .454
BIOTECH .336 .341 .388 .415 .421 .374
GREEN .333 .444 .444 .444 .444 .444
AUTO .32 .358 .358 .339 .415 .377
REGBANKS .32 .44 .4 .28 .4 .2
GAMING .315 .368 .421 .473 .526 .526
JETS .307 .384 .384 .384 .538 .461
SEMI .305 .473 .526 .536 .652 .568
COMPUTER .3 .35 .4 .45 .5 .35
BIGBANKS .285 .428 .571 .571 .571 .571
=========
GUNS .285 .357 .357 .357 .428 .214
LOWPRICE .249 .26 .302 .277 .296 .271
COAL .166 .833 .666 .666 .666 .5
SOLAR .125 .187 .25 .312 .312 .375
MARIJUAN 0 .1 .1 .1 .1 .1
|
====================================================================================
Wednesday -
6:00 AM - Futures: DJI +33 NASDAQ -5
Data Used: 12/27/22
| |
12-27-22 Last Chg %Chg
DJIA 33241.56 +37.63 0.11%
S&P 500 3829.25 -15.57 -0.40%
Nasdaq 10353.23 -144.64 -1.3% weak
New highs = 65 + 103 = 168
New lows = 137 + 534 = 671
|
|
| |
Will the wide
divergence between the NASDAQ and QQQ, on the
one hand, and the DJI-30, on
the other, ever come to an end?.
Fears of recession in high PE
"growth" techs is now being compounded
by heavy year-end tax-loss
seliling. The weakness we see in TSLA and
AMZN has even spread to AAPL.
We will be watching to see if they
can bounce back some when the
tax-loss selling ends next week. But
for now, know that this heavy
downward pressure usually lasts until the end
of the year. That is
the reason, we have been saying each night hold
some of the very weak
"bearish MINCPs" shown here.
The seasonal Santa Claus Buys
have applied especially to the high priced,
most heavily weighted DJI-30
stocks shown below, UNH, HD and CAT,
as well as MRK. The now
rising 10-year rates hurt not just bonds but also
GS, the second highest priced
DJI stock, which has not been able to
participate in the current
rally. The DJI-30 is being boosted now by
window-dressing Buys from
funds that want to look like they have been
in the right blue-chips for
some time. When the year 2022 ends, it may
transpire that this
artificial boost will come to an end and the DIA may sell off.
Unless volume and breadth
pick up, we may get a Peerless Sell on a rally
above the 2.3% upper band.
It will reflect the mediocre Santa Claus rally.
Despite these cross-currents,
next year may be bullish, Politicians usually
do their best to have a
rising economy in the Presidential Election year.
One way to achieve that is to
do things which strengthen the DJI in the
third year of the 4-year
Presidentail cycle. That is my explanation for
why the DJI in the third year
typically does three times (+15%) better
than it does in the other
years of the cycle.
So, we remain hedged with
shorts among techs from our bearish
MINCPs and long DIA.
Next week, there should be a good rally in SOXL,
which shows a reliable Red
TigerSoft Buy now. Watch it. Its turning
up will be a bullish sign for
the beaten down techs rallying too.
|
|
| |
Charts - 12/27/2022
2022 PEERLESS DJI, Signals, Indicators Daily DJI Volume
10-DayUp/Down Vol Stoch-20 CCI RSI Pct of All Stocks above 65-dma
Inverted Traders Index
DJI-IPA DJI-OBV BOND FUNDS
NASDAQ S&P OEX NYSE DJ-15 DJ-20 DJI-30
DIA QQQ SPY IWM new - COIN (Bit Coin ETF)
TNA Short-Term Rates Ten Year Rates PST (Short Treasuries)
DOLLAR-UUP
ALLSTOCKs
Russell-1000
Insurance-Stocks
Recent 2006 vers-Peerless signals
http://www.tigersoftware.com/OLDPEER/UPD81227.bmp
MDY - http://www.tigersoftware.com/CHARTX/MDY.GIF
USO-CrudeOil DBO FAS GLD HD IBB JETS JNUG KOL NAIL NUGT NRGU OIH
PALL RSX RETL SDS AGQ SLV SOXL TAN TECL TLT TMF TNA UGA USO
China: YINN
CHAU
Commodities: CANE
CORN DBC JJC, NIB CORN, CUT (paper)
MOO, NRGU
SOYB WEAT UUP (Dollar) LIT
(Lithium)
China: YINN
CHAU
Commodities: CANE
CORN DBC JJC, NIB CORN, CUT (paper)
MOO, NRGU
SOYB WEAT UUP (Dollar) LIT
(Lithium)
Stocks AA AAPL ADBE ALXN AMAT AMGN AMD AMZN AXP BA BABA
BAC BIDU BLDP CAT CHKP CNX CRM CVX CMG DE DIS ENPH FB FSLR
FTNT GILD GME GOOG GS HD IBM INTU JPM KO KR LRCX MRK MRNA
MOS MSFT NEM NFLX NKE NOC NUE NVDA PANW PG PYPL REGN REV
SO QCOM QDEL TSLA TXN XOM V VRTX WFC WMT XLE ZM ZOM
Leveraged Short ETFs:
FAZ - financials, TZA and SRTY- small caps, MZZ - mid caps, TECS -Techs,
SOXS -
semi-conductors LABD
- Biotechs
Bullish MAXCPs http://www.tigersoftware.com/UPPING/12-27-22/BULLISH.htm
Bearish MINCPs http://www.tigersoftware.com/Downing/12-27-22/BEARISH.htm |
|
Seasonal Peerless Buys should bring a rallly to upper 3% band.
 |
SPY shows an optimized red Buy but its big high tech
components have
caused it to under-[erform DJI by 5.5% over last 10 weeks.
 |
NASDAQ weak and testing 12-mo lows.
Falling Opening and Closing Power.
ITRS <-11%.
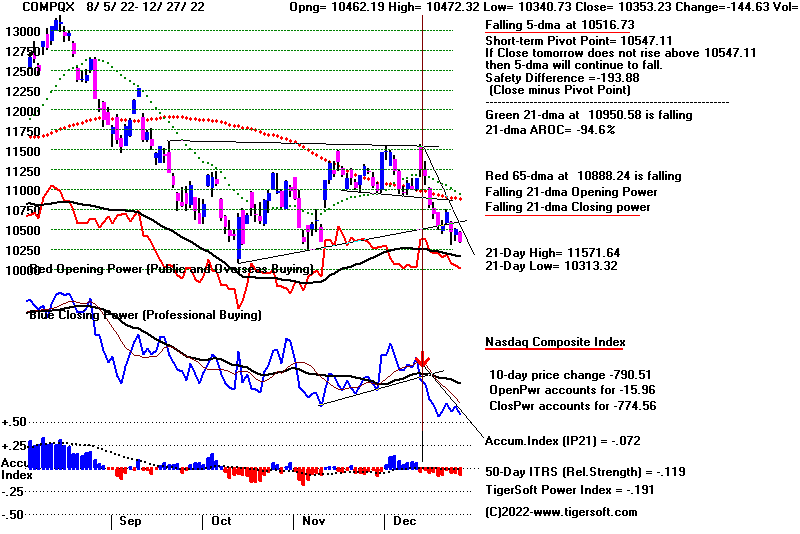 |
QQQ - weak
and testing 12-mo lows. Falling Opening and Closing Power.
ITRS <-11%.
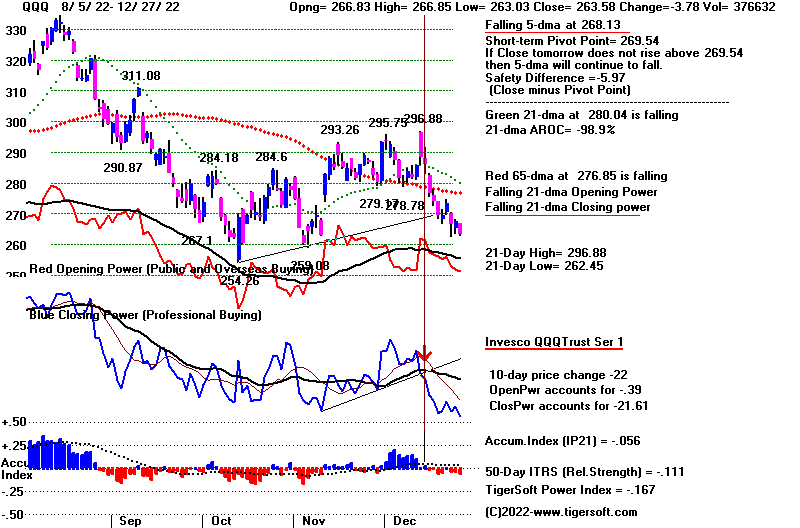 |
 |
 |
 |
 |
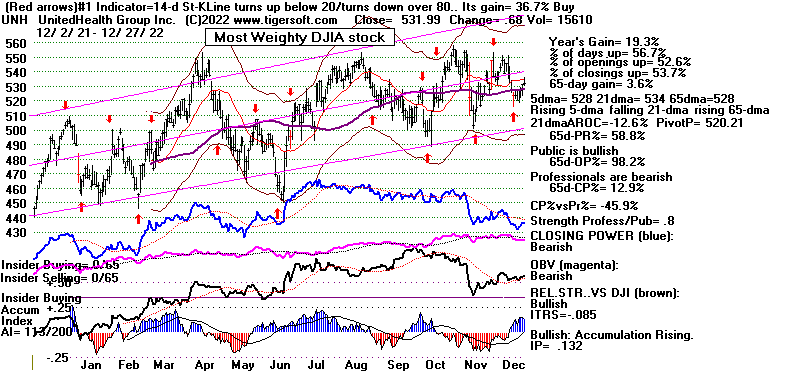 |
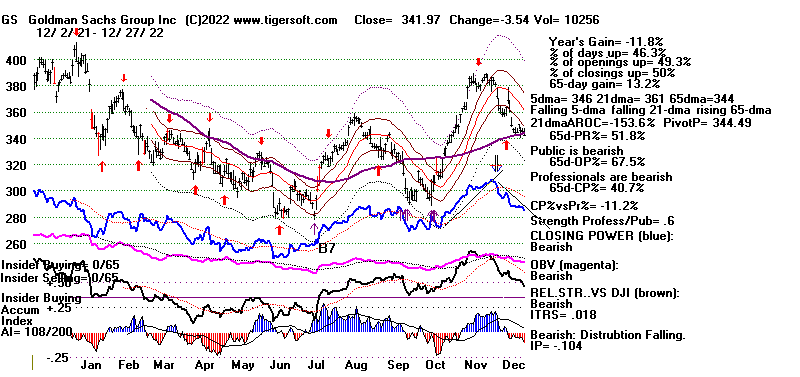 |
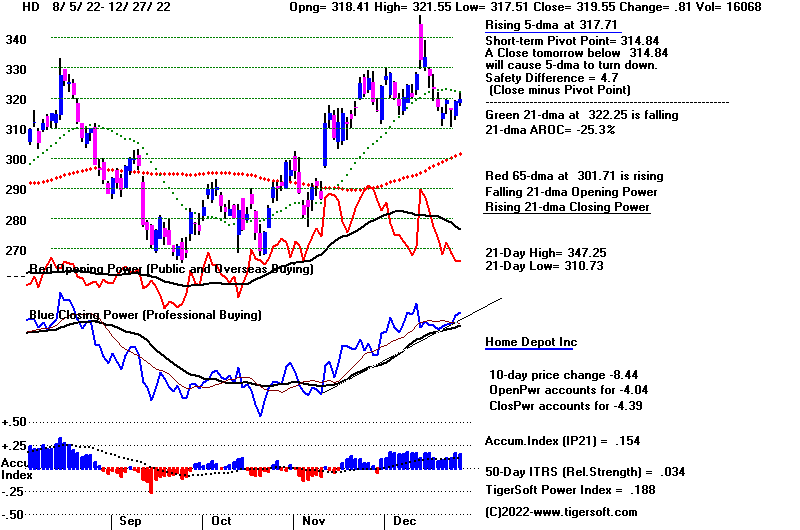 |
 |
12-27-22
Last Chg %Chg
DJIA 33241.56 +37.63 0.11%
S&P 500 3829.25 -15.57 -0.40%
Nasdaq 10353.23 -144.64 -1.3%
New highs = 65 + 103 = 168
New lows = 137 + 534 = 671
NYSE Latest Close Previous Close Week Ago
Issues traded 3,261 3,229 3,285
Advances 1,409 2,088 1,650
Declines 1,770 1,022 1,500
Unchanged 82 119 135
New highs 65 52 48
New lows 137 82 164
Adv. volume* 328,563,550 410,492,663 528,352,348
Decl. volume* 274,788,552 159,525,615 338,129,748
Total volume* 609,347,797 577,667,066 878,891,800
Closing Arms (TRIN)† 0.76 0.88 0.64
Block trades* 3,857 3,909 4,693
Adv. volume 1,532,750,364 1,942,534,345 2,483,673,443
Decl. volume 1,469,147,826 833,549,418 1,450,121,639
Total volume 3,030,305,147 2,819,286,009 3,985,376,798
NASDAQ Latest Close Previous Close Week Ago
Issues traded 4,838 4,764 4,860
Advances 1,587 2,365 2,378
Declines 3,063 2,165 2,218
Unchanged 188 234 264
New highs 103 71 86
New lows 534 274 467
Closing Arms (TRIN)† 1.42 0.83 1.21
Block trades 25,192 26,118 31,909
Adv. volume 1,013,924,400 1,993,512,978 2,166,482,888
Decl. volume 2,784,039,541 1,512,024,860 2,435,060,926
Total volume 3,827,292,054 3,544,680,373 4,707,191,752
|
Table 2 QUICKSILVER on ETFS - 12/27/2022 ---
Bullish = 0
Bearish = 3 DBO, Copper, WEAT
ETF CLOSE CHANGE PIVOT-PT 5-dma AROC CL-PWR CANDLE IP21 ITRS POWER INDEX
================================================================================================
DIA 332.37 .44 328.38 75.5% ------- ---- .091 ----- ------
---------------------------------------------------------------------------------------------
COMPQX 10353.23 -144.63 10547.11 -91.3% Bearish RED -.072 -.117 -.189
---------------------------------------------------------------------------------------------
SPY 381.4 -1.51 380.54 18.1% ------- RED -.014 -.053 -.067
---------------------------------------------------------------------------------------------
QQQ 263.58 -3.78 269.54 -114.5% Bearish RED -.056 -.109 -.165
---------------------------------------------------------------------------------------------
MDY 443.82 .21 437.19 101.1% ------- BLUE -.041 -.036 -.077
---------------------------------------------------------------------------------------------
IWM 173.22 -1.17 172.92 34.8% Bearish RED -.121 -.081 -.202
---------------------------------------------------------------------------------------------
FAS 72.15 .02 69.59 199.2% Bearish RED .055 .15 .205
---------------------------------------------------------------------------------------------
RETL 6.72 -.19 6.56 -95.8% Bearish RED .05 -.06 -.01
---------------------------------------------------------------------------------------------
SOXL 9.27 -.5 10.41 -685.5% Bearish RED .009 .218 .227
---------------------------------------------------------------------------------------------
TECL 21.69 -.65 22.96 -270.4% ------- RED .047 -.033 .014
---------------------------------------------------------------------------------------------
IBB 129.27 -2.76 132.08 -48.7% Bearish RED .035 -.039 -.004
---------------------------------------------------------------------------------------------
GLD 168.67 1.41 169.08 70.1% ------- BLUE -.067 -.017 -.084
---------------------------------------------------------------------------------------------
DBO 15.11 .11 14.47 232% ------- BLUE -.139 -.193 -.332
---------------------------------------------------------------------------------------------
OIH 303.81 1.78 293.33 350.8% ------- BLUE -.034 .146 .112
---------------------------------------------------------------------------------------------
CPER 23.02 -.04 23.02 63.3% ------- RED -.269 .001 -.268
---------------------------------------------------------------------------------------------
TAN 73.08 -1.78 76.81 -281.7% Bearish RED -.194 -.012 -.206
---------------------------------------------------------------------------------------------
UUP 27.97 -.01 27.88 -17.9% Bullish ---- .131 -.202 -.071
---------------------------------------------------------------------------------------------
CORN 26.62 .26 26 147.2% Bullish BLUE -.077 -.155 -.232
---------------------------------------------------------------------------------------------
WEAT 7.82 .03 7.56 162.9% ------- ---- -.187 -.226 -.413
---------------------------------------------------------------------------------------------
YINN 50.81 6.32 42.58 635.1% Bearish BLUE -.05 .432 .382
|
Table 3 RANKING OF KEY DIRECTORIES BASED PCT.OF STOCKS ABOVE 65-DMA
12/27/22
Bullish = 25
Bearish = 21
---------------------------------------------------------------------------------------
Directory Current day-1 day-2 day-3 day-4 day-5
----------------------------------------------------------------------------------------
COPPER 1 1 1 1 1 1
HOMEBLDG .888 .888 .888 .888 .888 .888
INFRA .878 .848 .818 .909 .818 .727
GOLD .869 .847 .847 .869 .847 .717
COAL .833 .666 .666 .666 .5 .5
ETFS .8 .763 .763 .818 .763 .709
UTILITY .789 .842 .842 .868 .815 .789
BEVERAGE .785 .785 .785 .785 .714 .785
DJI-13 .769 .846 .846 .923 .846 .769
INSURANC .76 .76 .76 .8 .72 .6
DOWJONES .7 .733 .766 .833 .733 .733
=======
CHEM .673 .652 .652 .673 .63 .543
CHINA .66 .62 .62 .68 .66 .66
INDMATER .652 .652 .597 .666 .583 .486
SP-100 .644 .666 .655 .711 .633 .655
SP500 .62 .638 .61 .668 .606 .602
======
MILITARY .615 .615 .538 .692 .615 .576
BONDFUND .586 .747 .758 .793 .804 .816
FIDSTKS .579 .597 .573 .639 .573 .538
HOSPITAL .571 .571 .571 .5 .5 .357
RUS-1000 .57 .586 .559 .624 .544 .531
COMODITY .564 .538 .564 .564 .564 .538
RETAIL .553 .531 .468 .531 .468 .468
FOOD .551 .551 .53 .53 .53 .51
REIT .546 .561 .5 .553 .476 .469
OILGAS .533 .514 .419 .504 .409 .371
INDEXES .529 .54 .508 .616 .486 .47
===============================================================================================
EDU .5 .5 .5 .666 .5 .5
FINANCE .5 .525 .475 .525 .437 .387
HIGHPRIC .5 .556 .543 .646 .504 .517
===============================================================================================
ELECTRON .496 .518 .518 .631 .548 .563
NASD-100 .49 .52 .53 .63 .56 .56
======
SEMI .473 .515 .526 .642 .568 .6
TRANSP .473 .526 .473 .578 .526 .526
SOFTWARE .464 .5 .428 .535 .5 .482
GREEN .444 .444 .444 .444 .444 .5
REGBANKS .44 .4 .28 .4 .2 .2
HACKERS .437 .437 .437 .437 .437 .437
BIGBANKS .428 .571 .571 .571 .571 .571
NIFTY .409 .454 .431 .522 .454 .477
JETS .384 .384 .384 .538 .461 .384
GAMING .368 .421 .421 .578 .526 .368
AUTO .358 .358 .339 .415 .377 .452
GUNS .357 .357 .357 .428 .214 .214
COMPUTER .35 .4 .45 .5 .4 .5
BIOTECH .341 .385 .418 .421 .38 .358
LOWPRICE .26 .305 .28 .299 .274 .277
SOLAR .187 .25 .312 .312 .375 .375
MARIJUAN .1 .1 .1 .1 .1 .1
|
=================================================================================
Tuesday -
5:30 AM - Futures: DJI +220 NASDAQ +60
Data Used: 12/23/22|
| |
12-23-22
Last Chg %Chg
DJIA 33203.93 176.44 0.53%
S&P 500 3844.82b 22.43 0.59%
Nasdaq 10497.86 21.74 0.21%
New highs 52 + 71 = 123
New lows 82 + 274 = 356
|
|
| |
Santa Claus Is Alive and Well on
Wall Street.
The Peerless Buy signals that we
now, particularly the B13 and B6, tell
us that the odds clearly favor a
Santa Claus rally. And in fact, since 1965,
the DJI has risen 85% of the time
over the two weeks following December
26th in the second year of the
four-year Presidential Cycle since 1966. The
average gain has been 2% over this
period.
Even if we are in a bear market
which will eventually drop the DJIA,
I am struck by how the DJI rose
at this time of year in the seriously
bearish years of 1929, 1930, 1931,
1937, 1941, 1987, 2008 and 2009,
among others.
The rally will most likely lift the
DJI 30 stocks that show a rising zig-zag of
Closing Power or uptrending Closing
Powers. See the DJI-30 stocks whose
candle-stick charts are sown below.
These are favored now ahead of the QQQ and
NASDAQ whose relative strength
indicators remain weak, presumably
because of tax-loss selling.
I would think that the DJI will
make it back to 34000 on this rally. But
the NASDAQ and QQQ may delay their
rallies until ttax-loss selling
ends after January 1st. Stay
short some of the weakest bearish MINCPs
for a little longer.
Hold long DIA and SOXL
|
|
|
Charts - 12/23/2022
2022 PEERLESS DJI, Signals, Indicators Daily DJI Volume
10-DayUp/Down Vol Stoch-20 CCI RSI Pct of All Stocks above 65-dma
Inverted Traders Index
DJI-IPA DJI-OBV BOND FUNDS
NASDAQ S&P OEX NYSE DJ-15 DJ-20 DJI-30
DIA QQQ SPY IWM new - COIN (Bit Coin ETF)
TNA Short-Term Rates Ten Year Rates PST (Short Treasuries)
DOLLAR-UUP
ALLSTOCKs
Russell-1000
Insurance-Stocks
Recent 2006 vers-Peerless signals
http://www.tigersoftware.com/OLDPEER/UPD81223.bmp
MDY - http://www.tigersoftware.com/CHARTX/MDY.GIF
USO-CrudeOil DBO FAS GLD HD IBB JETS JNUG KOL NAIL NUGT NRGU OIH
PALL RSX RETL SDS AGQ SLV SOXL TAN TECL TLT TMF TNA UGA USO
China: YINN
CHAU
Commodities: CANE
CORN DBC JJC, NIB CORN, CUT (paper)
MOO, NRGU
SOYB WEAT UUP (Dollar) LIT
(Lithium)
China: YINN
CHAU
Commodities: CANE
CORN DBC JJC, NIB CORN, CUT (paper)
MOO, NRGU
SOYB WEAT UUP (Dollar) LIT
(Lithium)
Stocks AA AAPL ADBE ALXN AMAT AMGN AMD AMZN AXP BA BABA
BAC BIDU BLDP CAT CHKP CNX CRM CVX CMG DE DIS ENPH FB FSLR
FTNT GILD GME GOOG GS HD IBM INTU JPM KO KR LRCX MRK MRNA
MOS MSFT NEM NFLX NKE NOC NUE NVDA PANW PG PYPL REGN REV
SO QCOM QDEL TSLA TXN XOM V VRTX WFC WMT XLE ZM ZOM
Leveraged Short ETFs:
FAZ - financials, TZA and SRTY- small caps, MZZ - mid caps, TECS -Techs,
SOXS -
semi-conductors LABD
- Biotechs
Bullish MAXCPs http://www.tigersoftware.com/UPPING/12-23-22/BULLISH.htm
Bearish MINCPs http://www.tigersoftware.com/Downing/12-23-22/BEARISH.htm |
|
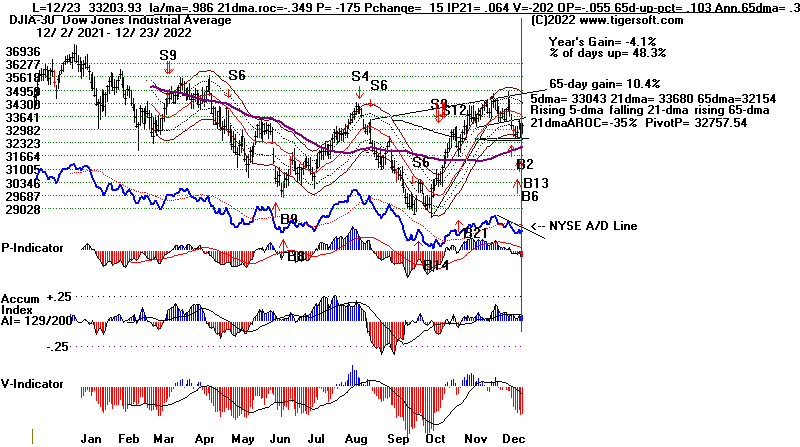 |
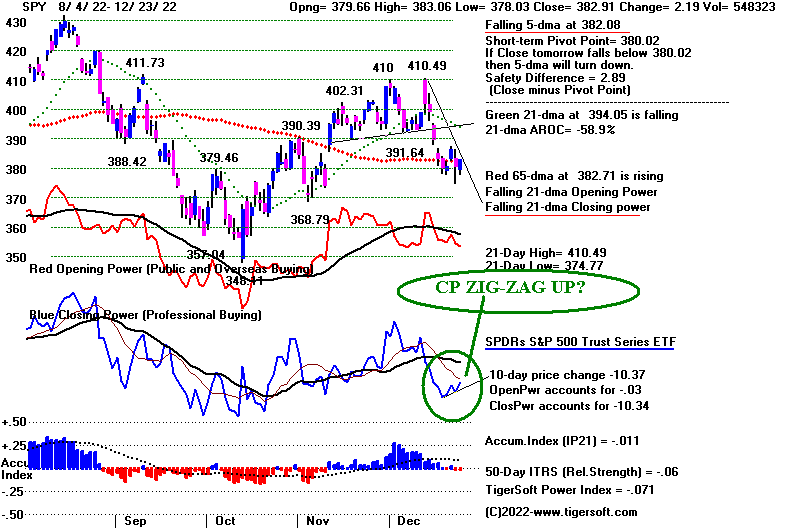 |
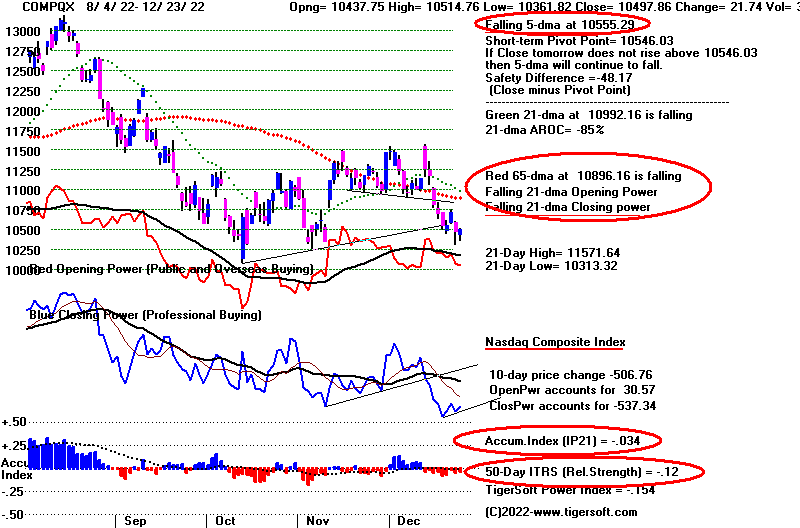 |
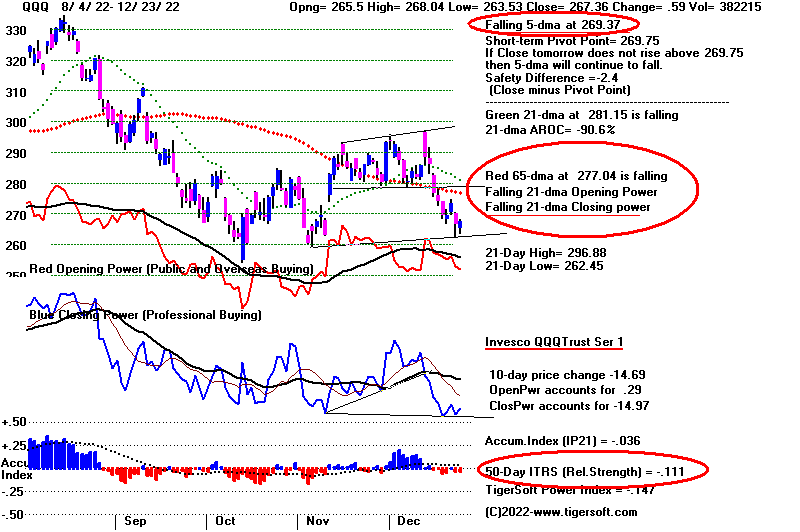 |
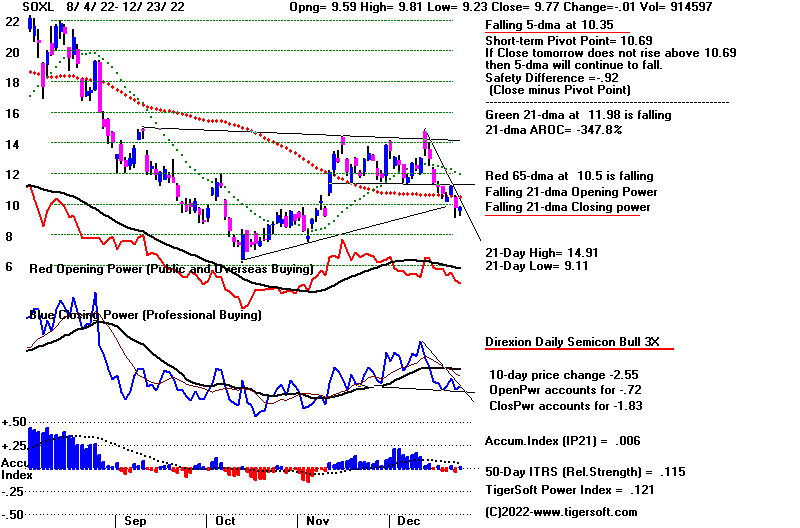 |
 |
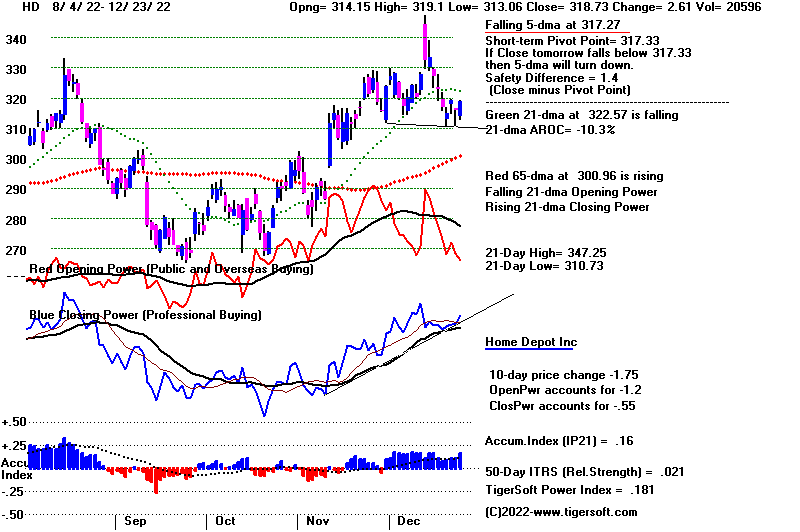 |
|
 |
 |
 |
 |
Table 1 - Breadth Statistics 12-23-22
Last Chg %Chg
DJIA 33203.93 176.44 0.53%
S&P 500 3844.82b 22.43 0.59%
Nasdaq 10497.86 21.74 0.21%
New highs 52 + 71 = 123
New lows 82 + 274 = 356
NYSE Latest Close Previous Close Week Ago
Issues traded 3,229 3,259 3,235
Advances 2,088 698 961
Declines 1,022 2,442 2,140
Unchanged 119 119 134
New highs 52 47 31
New lows 82 201 178
Adv. volume* 410,492,663 202,670,947 685,773,639
Decl. volume* 159,525,615 597,160,491 2,502,892,296
Total volume* 577,667,066 810,447,668 3,232,478,068
Closing Arms (TRIN)† 0.88 0.70 1.47
Block trades* 3,909 4,669 6,810
Adv. volume 1,942,534,345 1,135,528,956 1,723,890,611
Decl. volume 833,549,418 2,772,607,760 5,642,903,423
Total volume 2,819,286,009 3,956,957,366 7,493,668,747
NASDAQ Latest Close Previous Close Week Ago
Issues traded 4,764 4,815 4,817
Advances 2,365 1,505 1,722
Declines 2,165 3,075 2,851
Unchanged 234 235 244
New highs 71 96 66
New lows 274 483 458
Closing Arms (TRIN)† 0.83 0.87 1.39
Block trades 26,118 40,168 39,566
Adv. volume 1,993,512,978 1,821,790,297 2,386,956,275
Decl. volume 1,512,024,860 3,249,552,164 5,484,675,702
Total volume 3,544,680,373 5,125,076,610 7,968,178,089
|
Table 2 QUICKSILVER on ETFS - 12/23/2022 ---
Bullish = 0
Bearish = 3 DBO, Corn, WEAT
ETF CLOSE CHANGE PIVOT-PT 5-dma AROC CL-PWR CANDLE IP21 ITRS POWER INDEX
================================================================================================
DIA 331.93 1.67 327.38 44.9% Bearish BLUE .101 ---- ------
---------------------------------------------------------------------------------------------
COMPQX 10497.86 21.74 10546.03 -97.9% Bearish BLUE -.033 -.119 -.152
---------------------------------------------------------------------------------------------
SPY 382.91 2.19 380.02 -4.7% Bearish BLUE -.011 -.058 -.069
---------------------------------------------------------------------------------------------
QQQ 267.36 .6 269.75 -127.2% Bearish BLUE -.035 -.11 -.145
---------------------------------------------------------------------------------------------
MDY 443.61 3.36 434.92 40.7% Bearish BLUE -.035 -.048 -.083
---------------------------------------------------------------------------------------------
IWM 174.39 .79 172.01 .6% Bearish BLUE -.109 -.087 -.196
---------------------------------------------------------------------------------------------
FAS 72.13 1.14 69.32 169.4% Bearish BLUE .071 .102 .173
---------------------------------------------------------------------------------------------
RETL 6.91 .31 6.85 -248.2% Bearish BLUE .057 -.116 -.059
---------------------------------------------------------------------------------------------
SOXL 9.77 -.01 10.69 -630.5% Bearish BLUE .006 .117 .123
---------------------------------------------------------------------------------------------
TECL 22.34 .04 22.93 -335.6% Bearish BLUE .052 -.078 -.026
---------------------------------------------------------------------------------------------
IBB 132.03 -1.8 130.56 -36.6% ------- RED .069 -.017 .052
---------------------------------------------------------------------------------------------
GLD 167.26 .5 166.32 14% Bearish BLUE -.04 -.025 -.065
---------------------------------------------------------------------------------------------
DBO 15 .36 14.43 227.2% Bearish BLUE -.164 -.216 -.38
---------------------------------------------------------------------------------------------
OIH 302.03 11 283.19 277% Bearish BLUE -.053 .096 .043
---------------------------------------------------------------------------------------------
CPER 23.06 .33 22.73 61.2% ------- BLUE -.145 0 -.145
---------------------------------------------------------------------------------------------
TAN 74.86 -1 77.4 -230.7% Bearish RED -.153 .004 -.149
---------------------------------------------------------------------------------------------
UUP 27.98 -.01 28.07 -58.8% Bullish ---- .118 -.179 -.061
---------------------------------------------------------------------------------------------
CORN 26.36 .09 25.85 57.5% Bullish ---- -.12 -.158 -.278
---------------------------------------------------------------------------------------------
WEAT 7.79 .09 7.57 91.6% ------- BLUE -.222 -.238 -.46
---------------------------------------------------------------------------------------------
YINN 44.49 -.81 45.13 -151.1% Bearish RED -.119 .197 .078
|
Table 3 RANKING OF KEY DIRECTORIES BASED PCT.OF STOCKS ABOVE 65-DMA
12/23/22
Bullish = 34
Bearish = 13
---------------------------------------------------------------------------------------
Directory Current day-1 day-2 day-3 day-4 day-5
----------------------------------------------------------------------------------------
COPPER 1 1 1 1 1 1
HOMEBLDG .888 .888 .888 .888 .888 .888
INFRA .848 .818 .909 .818 .696 .818
GOLD .847 .847 .869 .847 .717 .76
DJI-13 .846 .846 .923 .846 .769 .769
UTILITY .842 .842 .868 .815 .789 .815
BEVERAGE .785 .785 .785 .714 .785 .785
ETFS .763 .763 .818 .763 .727 .763
INSURANC .76 .76 .8 .72 .6 .72
BONDFUND .747 .758 .793 .804 .827 .839
DOWJONES .733 .766 .833 .733 .733 .733
======
COAL .666 .666 .666 .5 .5 .5
SP-100 .666 .655 .711 .633 .655 .644
CHEM .652 .652 .695 .608 .586 .586
INDMATER .652 .597 .666 .583 .5 .555
SP500 .638 .61 .668 .602 .608 .64
========
CHINA .62 .62 .68 .66 .66 .7
MILITARY .615 .538 .692 .615 .576 .615
FIDSTKS .597 .573 .639 .573 .538 .603
RUS-1000 .586 .559 .624 .544 .532 .587
BIGBANKS .571 .571 .571 .571 .571 .571
HOSPITAL .571 .571 .5 .5 .357 .5
REIT .561 .492 .561 .484 .461 .569
HIGHPRIC .556 .543 .646 .504 .517 .616
FOOD .551 .53 .51 .53 .51 .53
INDEXES .54 .508 .616 .486 .47 .562
COMODITY .538 .564 .538 .564 .538 .589
RETAIL .531 .468 .531 .468 .468 .489
TRANSP .526 .473 .578 .526 .526 .578
FINANCE .525 .475 .525 .425 .387 .425
NASD-100 .52 .53 .63 .56 .56 .57
======
ELECTRON .518 .518 .631 .548 .556 .639
SEMI .515 .526 .642 .568 .589 .663
OILGAS .514 .419 .504 .409 .371 .38
============================================================================================
EDU .5 .5 .666 .5 .5 .666
SOFTWARE .5 .446 .535 .5 .464 .464
============================================================================================
NIFTY .454 .431 .522 .454 .477 .5
GREEN .444 .444 .444 .444 .5 .5
HACKERS .437 .437 .437 .437 .437 .437
GAMING .421 .421 .526 .578 .368 .578
COMPUTER .4 .45 .5 .4 .5 .5
REGBANKS .4 .28 .4 .2 .2 .24
BIOTECH .385 .415 .424 .38 .355 .391
JETS .384 .384 .538 .461 .384 .538
AUTO .358 .339 .415 .377 .452 .49
GUNS .357 .357 .428 .214 .214 .285
LOWPRICE .305 .282 .302 .274 .271 .305
SOLAR .25 .312 .312 .375 .375 .625
MARIJUAN .1 .1 .1 .1 .1 .3
|
=================================================================================
Friday - 4:45 AM - Futures: DJI +78
NASDAQ +30 Data Used: 12/22/22
| |
12/22/2022
DJIA 33027.49
-348.99 -1.05%
S&P 500 3822.39 -56.05
-1.45%
Nasdaq 10476.12 -233.25
-2.18%
New highs = 47 + 96 = 143
New lows = 201 + 483 = 684 |
|
| |
The breadth statistics on
Thursday were almost the exact opposite of Wednesday's.
But the DJI reversed course
in mid-session and regained nearly 500 points from
its lows. This
reinforces the notion that the DJIA is the leader while the other
averages suffer from very
heavy tax loss selling in the their heaviest weighted
components. The
declines in TSLA, AMZN and even AAPL may intensify,
though volume on the sell-off
was low.
A very low volume bounce the
day before and after Christmas should be expected.
After that, the DJI may be
able to get back to 34000 and reach a top in early January,
if seasonality winds out.
But first, we need to see the steep downtrends of the
Closing Powers be broken
before we should expect much of a rally in SPY,
QQQ or the NASDAQ. The
weakest stocks among the bearish MINCPs have
included TSLA and AMZN.
As oversold as they are, they may well be under
tax-loss selling until the
end of the year. So, I would not cover our bearish
MINCP short sales. SOXL
was weak today, but it is still above is 65-dma and
shows a red optimzed
Stochastic Buy. Hold it long provided you are short some
of the bearish MINCPs.
The high reliability of the
seasonally based Buy B6 and B13 should get us to hold
DIA, too, even though its
Closing Power moving average is falling.
----
Have a safe, happy and
healthy holidays filled with joyful story-telling and
merry-making. My
warmest regards go out to all of you and your families..
|
|
| |
Charts - 12/22/2022
2022 PEERLESS DJI, Signals, Indicators Daily DJI Volume
10-DayUp/Down Vol Stoch-20 CCI RSI Pct of All Stocks above 65-dma
Inverted Traders Index
DJI-IPA DJI-OBV BOND FUNDS
NASDAQ S&P OEX NYSE DJ-15 DJ-20 DJI-30
DIA QQQ SPY IWM new - COIN (Bit Coin ETF)
TNA Short-Term Rates Ten Year Rates PST (Short Treasuries)
DOLLAR-UUP
ALLSTOCKs
Russell-1000
Insurance-Stocks
Recent 2006 vers-Peerless signals
http://www.tigersoftware.com/OLDPEER/UPD81222.bmp
MDY - http://www.tigersoftware.com/CHARTX/MDY.GIF
USO-CrudeOil DBO FAS GLD HD IBB JETS JNUG KOL NAIL NUGT NRGU OIH
PALL RSX RETL SDS AGQ SLV SOXL TAN TECL TLT TMF TNA UGA USO
China: YINN
CHAU
Commodities: CANE
CORN DBC JJC, NIB CORN, CUT (paper)
MOO, NRGU
SOYB WEAT UUP (Dollar) LIT
(Lithium)
China: YINN
CHAU
Commodities: CANE
CORN DBC JJC, NIB CORN, CUT (paper)
MOO, NRGU
SOYB WEAT UUP (Dollar) LIT
(Lithium)
Stocks AA AAPL ADBE ALXN AMAT AMGN AMD AMZN AXP BA BABA
BAC BIDU BLDP CAT CHKP CNX CRM CVX CMG DE DIS ENPH FB FSLR
FTNT GILD GME GOOG GS HD IBM INTU JPM KO KR LRCX MRK MRNA
MOS MSFT NEM NFLX NKE NOC NUE NVDA PANW PG PYPL REGN REV
SO QCOM QDEL TSLA TXN XOM V VRTX WFC WMT XLE ZM ZOM
Leveraged Short ETFs:
FAZ - financials, TZA and SRTY- small caps, MZZ - mid caps, TECS -Techs,
SOXS -
semi-conductors LABD
- Biotechs
Bullish MAXCPs http://www.tigersoftware.com/UPPING/12-22-22/BULLISH.htm
Bearish MINCPs http://www.tigersoftware.com/Downing/12-22-22/BEARISH.htm |
|
 |
 |
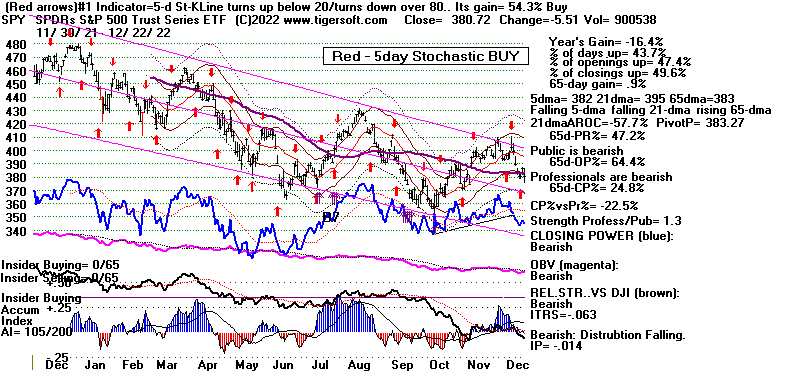 |
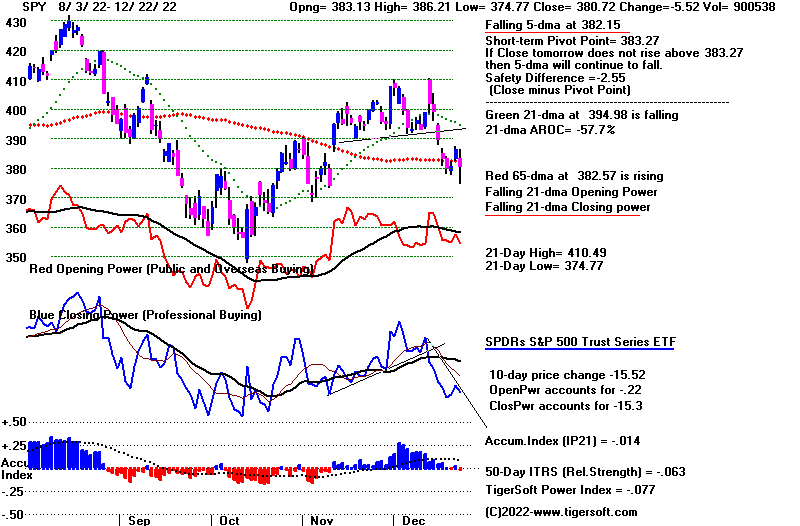 |
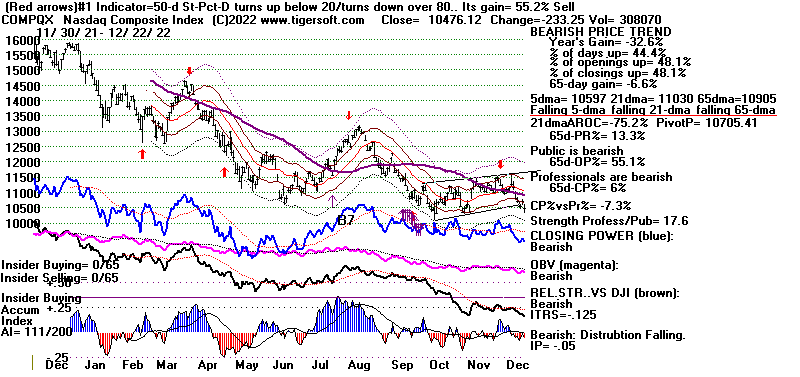 |
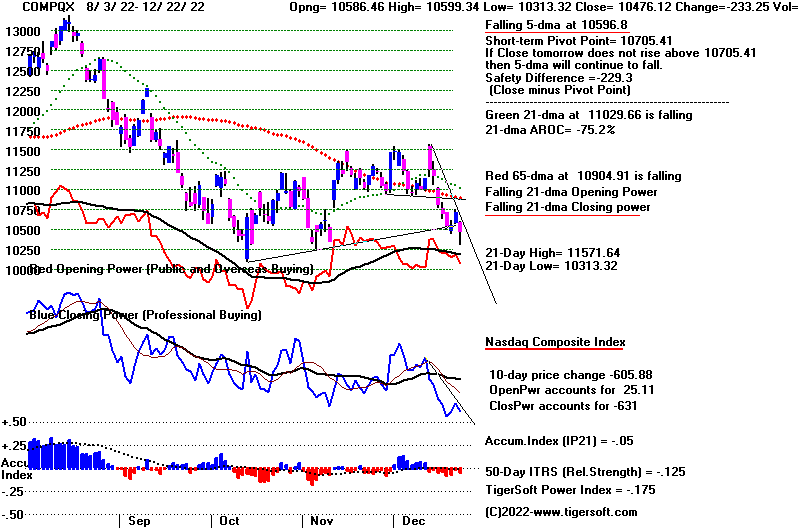 |
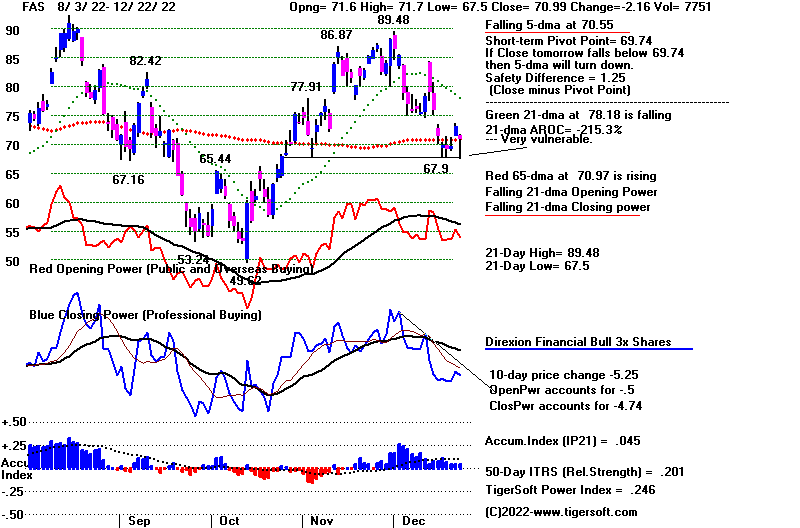 |
 |
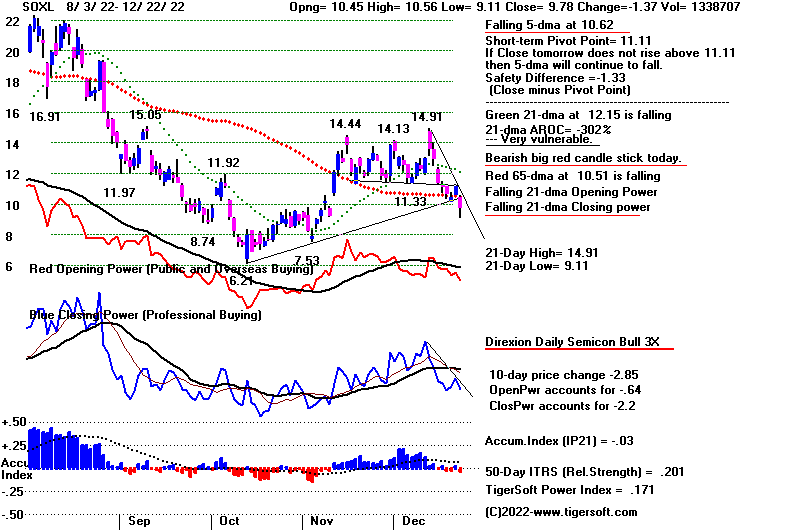 |
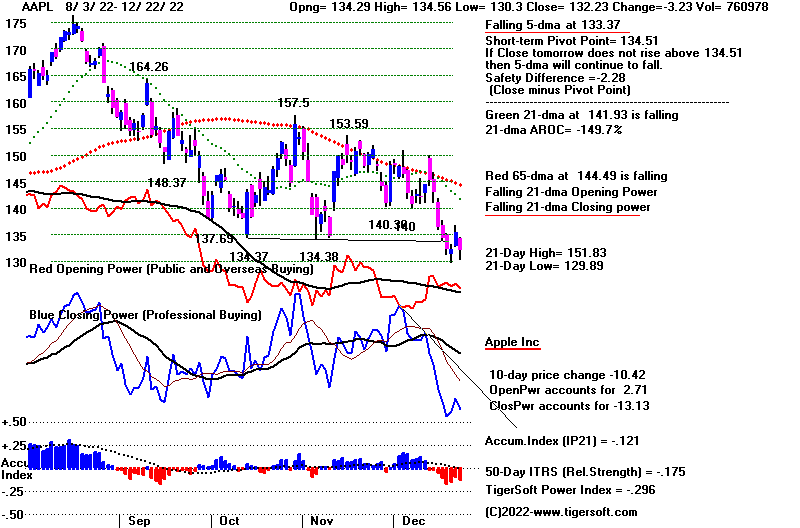 |
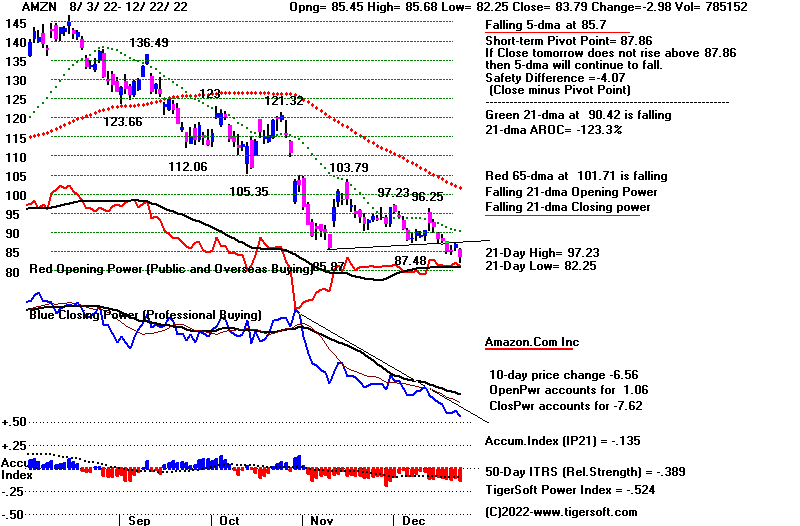 |
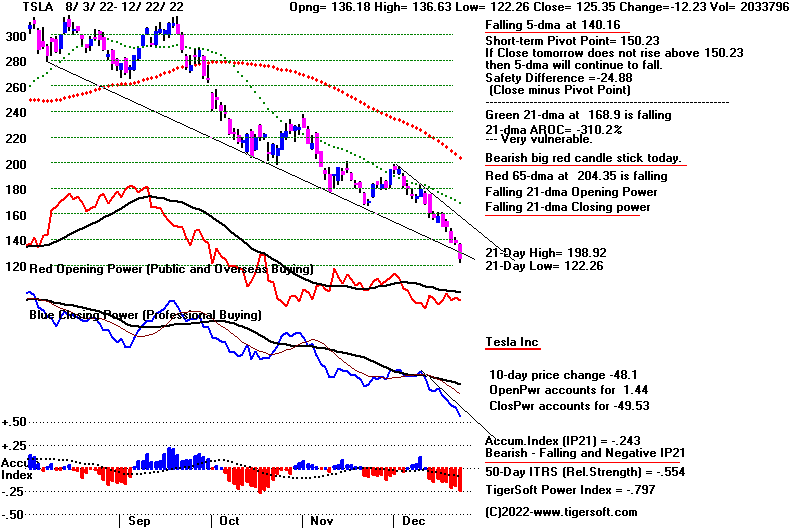 |
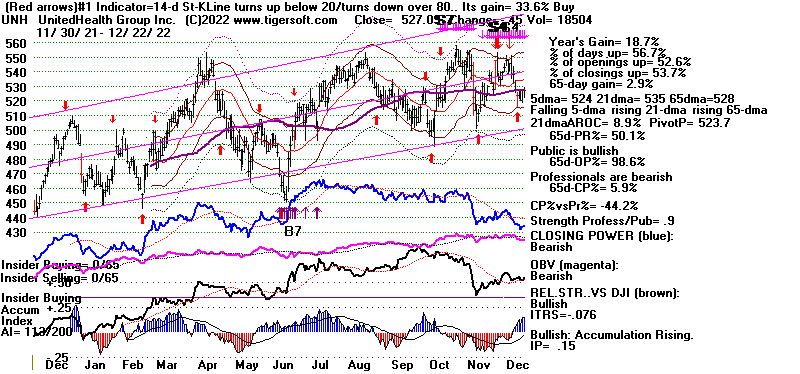 |
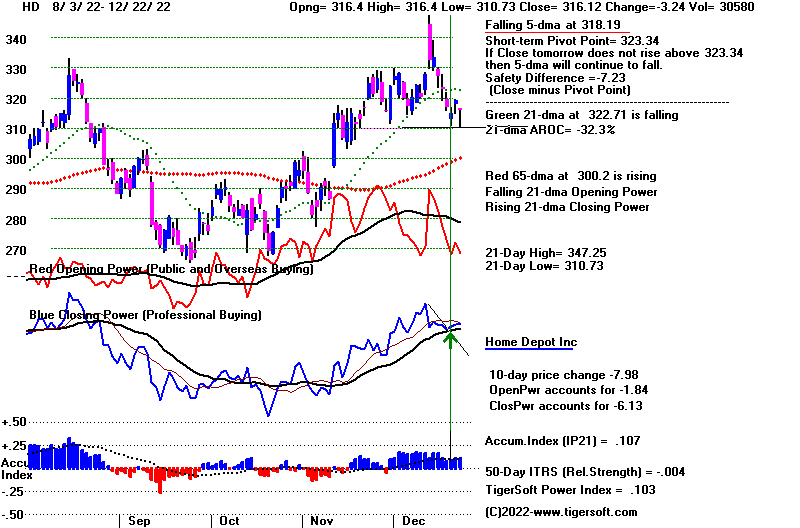 |
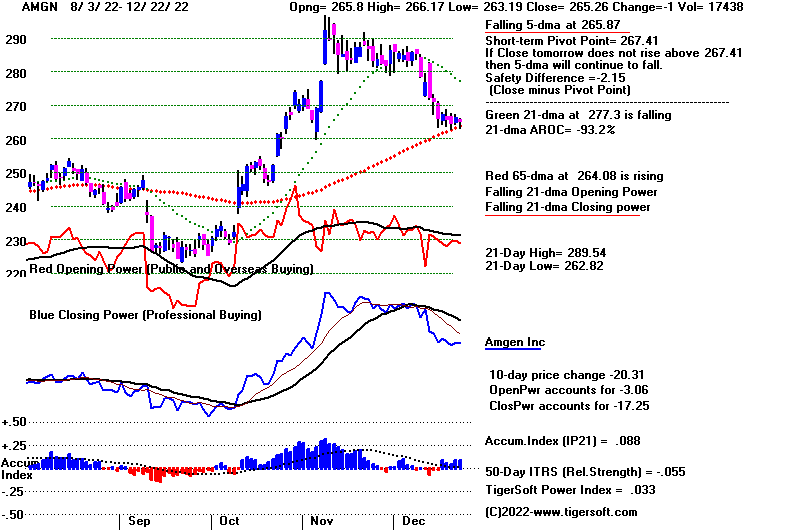 |
Table 1 - Breadth Statistics 12/22/2022
DJIA 33027.49 -348.99 -1.05%
S&P 500 3822.39 -56.05 -1.45%
Nasdaq 10476.12 -233.25 -2.18%
New highs = 47 + 96 = 143
New lows = 201 + 483 = 684
NYSE
Issues traded 3,259 3,251 3,251
Advances 698 2,409 601
Declines 2,442 728 2,537
Unchanged 119 114 113
New highs 47 52 38
New lows 201 73 126
Adv. volume* 202,670,947 705,349,316 128,110,458
Decl. volume* 597,160,491 95,875,147 894,275,773
Total volume* 810,447,668 808,085,822 1,027,101,337
Closing Arms (TRIN)† 0.70 0.50 1.46
Block trades* 4,669 4,454 4,737
Adv. volume 1,135,528,956 3,245,763,387 620,626,713
Decl. volume 2,772,607,760 491,138,026 3,827,096,219
Total volume 3,956,957,366 3,775,205,521 4,493,905,168
NASDAQ
Issues traded 4,815 4,838 4,888
Advances 1,505 3,117 1,223
Declines 3,075 1,480 3,419
Unchanged 235 241 246
New highs 96 82 84
New lows 483 316 376
Closing Arms (TRIN)† 0.87 1.04 0.70
Block trades 40,168 30,500 41,798
Adv. volume 1,821,790,297 2,903,737,852 1,866,445,174
Decl. volume 3,249,552,164 1,435,651,701 3,636,585,843
Total volume 5,125,076,610 4,401,426,086 5,536,073,488
|
Table 2 QUICKSILVER on ETFS - 12/22/2022 ---
Bullish = 0
Bearish = 2 DBO, WEAT
ETF CLOSE CHANGE PIVOT-PT 5-dma AROC CL-PWR CANDLE IP21 ITRS POWER INDEX
================================================================================================
DIA 330.26 -3.34 328.97 -38.5% Bearish RED .081 ---- -----
---------------------------------------------------------------------------------------------
COMPQX 10476.12 -233.25 10705.41 -156.8% Bearish RED -.049 -.125 -.174
---------------------------------------------------------------------------------------------
SPY 380.72 -5.51 383.27 -116% Bearish RED -.014 -.063 -.077
---------------------------------------------------------------------------------------------
QQQ 266.76 -6.69 274.25 -185.7% Bearish RED -.032 -.115 -.147
---------------------------------------------------------------------------------------------
MDY 440.25 -5.23 440.03 -67.4% Bearish RED -.063 -.059 -.122
---------------------------------------------------------------------------------------------
IWM 173.6 -2.3 174.37 -59.7% Bearish RED -.112 -.093 -.205
---------------------------------------------------------------------------------------------
FAS 70.99 -2.15 69.74 -43.2% Bearish RED .046 .201 .247
---------------------------------------------------------------------------------------------
RETL 6.6 -.39 7.25 -681.6% Bearish ---- .027 -.15 -.123
---------------------------------------------------------------------------------------------
SOXL 9.78 -1.36 11.11 -739.7% Bearish RED -.03 .202 .172
---------------------------------------------------------------------------------------------
TECL 22.3 -1.81 23.9 -551.3% Bearish RED .047 -.013 .034
---------------------------------------------------------------------------------------------
IBB 133.83 .1 133 -15.4% ------- BLUE .064 -.006 .058
---------------------------------------------------------------------------------------------
GLD 166.76 -2.04 166.79 42.1% Bearish RED -.008 -.061 -.069
---------------------------------------------------------------------------------------------
DBO 14.64 -.11 14.34 27.6% Bearish RED -.186 -.244 -.43
---------------------------------------------------------------------------------------------
OIH 291.03 -8.77 285.93 7.1% Bearish RED -.073 .089 .016
---------------------------------------------------------------------------------------------
CPER 22.73 -.34 22.78 -13.1% Bearish RED -.137 -.029 -.166
---------------------------------------------------------------------------------------------
TAN 75.86 -2.56 78.43 -279.8% Bearish RED -.128 .004 -.124
---------------------------------------------------------------------------------------------
UUP 27.99 .04 28.31 -48.1% Bullish ---- .073 -.211 -.138
---------------------------------------------------------------------------------------------
CORN 26.27 -.04 26.06 46.1% Bullish ---- -.059 -.182 -.241
---------------------------------------------------------------------------------------------
WEAT 7.7 -.05 7.65 39.3% Bearish ---- -.208 -.269 -.477
---------------------------------------------------------------------------------------------
YINN 45.3 -.79 45.85 -31.1% Bearish RED -.093 .16 .067
|
Table 3 RANKING OF KEY DIRECTORIES BASED PCT.OF STOCKS ABOVE 65-DMA
12/22/22
Bullish = 29
Bearish = 19
---------------------------------------------------------------------------------------
Directory Current day-1 day-2 day-3 day-4 day-5
----------------------------------------------------------------------------------------
COPPER 1 1 1 1 1 1
HOMEBLDG .888 .888 .888 .888 .888 .888
GOLD .847 .869 .847 .717 .76 .739
DJI-13 .846 .923 .846 .769 .769 .923
UTILITY .842 .868 .815 .789 .815 .815
INFRA .818 .909 .818 .696 .818 .848
BEVERAGE .785 .785 .714 .785 .785 .857
DOWJONES .766 .833 .733 .733 .733 .833
=====
ETFS .763 .818 .763 .727 .781 .763
INSURANC .76 .8 .72 .6 .72 .72
BONDFUND .758 .793 .804 .827 .85 .862
COAL .666 .666 .5 .5 .5 .666
SP-100 .655 .711 .633 .655 .644 .766
CHEM .652 .695 .63 .565 .608 .63
CHINA .62 .68 .66 .66 .7 .68
SP500 .61 .668 .602 .604 .638 .696
=====
INDMATER .597 .666 .583 .5 .555 .611
FIDSTKS .573 .639 .573 .538 .603 .656
BIGBANKS .571 .571 .571 .571 .571 .571
HOSPITAL .571 .5 .5 .357 .5 .428
COMODITY .564 .538 .538 .538 .589 .589
RUS-1000 .559 .624 .544 .532 .585 .632
=====
HIGHPRIC .543 .646 .504 .517 .607 .676
MILITARY .538 .692 .615 .576 .615 .692
FOOD .53 .51 .51 .51 .53 .51
NASD-100 .53 .63 .56 .56 .57 .6
SEMI .526 .642 .568 .589 .652 .694
ELECTRON .518 .631 .548 .556 .631 .676
INDEXES .508 .616 .486 .47 .551 .659
===============================================================================================
EDU .5 .666 .5 .5 .666 .666
===============================================================================================
REIT .492 .553 .492 .469 .538 .669
FINANCE .475 .525 .425 .375 .425 .487
TRANSP .473 .578 .526 .526 .578 .578
RETAIL .468 .531 .468 .468 .489 .553
COMPUTER .45 .5 .4 .5 .5 .55
SOFTWARE .446 .553 .5 .464 .464 .535
GREEN .444 .444 .444 .5 .5 .666
HACKERS .437 .437 .437 .437 .437 .5
NIFTY .431 .522 .454 .477 .5 .522
GAMING .421 .526 .526 .421 .578 .578
OILGAS .419 .504 .409 .371 .38 .457
BIOTECH .415 .421 .382 .355 .385 .402
JETS .384 .538 .461 .384 .538 .538
GUNS .357 .428 .214 .214 .285 .357
AUTO .339 .415 .377 .452 .49 .566
SOLAR .312 .312 .375 .375 .625 .75
LOWPRICE .282 .305 .277 .271 .305 .313
REGBANKS .28 .4 .2 .2 .24 .24
MARIJUAN .1 .1 .1 .1 .3 .3
|
====================================================================================
Thursday -
5:50 AM - Futures: DJI -127
NASDAQ -82 Data Used: 12/2122
| |
12/21/2022
DJIA 33376.48 +526.74 +1.60%
S&P 500 3878.44 +56.82 +1.49%
Nasdaq 10709.37 +162.26 +1.54%
New highs = 52 + 82 = 134
New lows = 73 + 316 = 389 |
|
| |
The DJI bounced up
from its lower 3% band in keeping with the seasonal
bullish of the start of a Santa
Claus rally. In second years of the Presidential
4-year cycle since 1966, the DJI
rallies 71% of the time over the next five
trading days and 79% over the next
month. When it fails to rally with good
breadth by the end of the year, we
typically get a Sell S4 at that time. It is
very unusual not to get a rally
from this point until the end of the year. But
this can happen with ominous
results. In 2007, the Santa Claus rally peaked
on the 24th and a 10% DJI sell-off
ensued. Fortunately, this is the lone case
of the DJI topping out before the
25th of December in the last 20 years.
Ever since Quantiative Easing began
and the FED assumed such a dominant
role, NY Professionals have
dominated the market and our Closing Power
with its trend-changes have served
us well. But right now bulls may need to
see much higher openings showing
both overseas buying and pre-opening
manipulation. This is because
volume is typically low at this time of the year
and because Professionals tend not
to be very active at this time. The bond
market will not even be open Friday
this week.
Presently, our Closing Power trends
are down for DIA, SPY, QQQ and
the NASDAQ. As a result, I
would simply hold DIA and SOXL (which
| does have a rising Closing Power and a
Stochastic Red Buy signal.) Because
of the heavy tax loss selling, stay
hedged with some shorts in the weakest
MINCPs.
The market is open on Friday on the
NYSE and NASDAQ. There will be
a Hotline posted here early Friday
AM. |
|
| |
Charts - 12/21/2022
2022 PEERLESS DJI, Signals, Indicators Daily DJI Volume
10-DayUp/Down Vol Stoch-20 CCI RSI Pct of All Stocks above 65-dma
Inverted Traders Index
DJI-IPA DJI-OBV BOND FUNDS
NASDAQ S&P OEX NYSE DJ-15 DJ-20 DJI-30
DIA QQQ SPY IWM new - COIN (Bit Coin ETF)
TNA Short-Term Rates Ten Year Rates PST (Short Treasuries)
DOLLAR-UUP
ALLSTOCKs
Russell-1000
Insurance-Stocks
Recent 2006 vers-Peerless signals
http://www.tigersoftware.com/OLDPEER/UPD81221.bmp
MDY - http://www.tigersoftware.com/CHARTX/MDY.GIF
USO-CrudeOil DBO FAS GLD HD IBB JETS JNUG KOL NAIL NUGT NRGU OIH
PALL RSX RETL SDS AGQ SLV SOXL TAN TECL TLT TMF TNA UGA USO
China: YINN
CHAU
Commodities: CANE
CORN DBC JJC, NIB CORN, CUT (paper)
MOO, NRGU
SOYB WEAT UUP (Dollar) LIT
(Lithium)
China: YINN
CHAU
Commodities: CANE
CORN DBC JJC, NIB CORN, CUT (paper)
MOO, NRGU
SOYB WEAT UUP (Dollar) LIT
(Lithium)
Stocks AA AAPL ADBE ALXN AMAT AMGN AMD AMZN AXP BA BABA
BAC BIDU BLDP CAT CHKP CNX CRM CVX CMG DE DIS ENPH FB FSLR
FTNT GILD GME GOOG GS HD IBM INTU JPM KO KR LRCX MRK MRNA
MOS MSFT NEM NFLX NKE NOC NUE NVDA PANW PG PYPL REGN REV
SO QCOM QDEL TSLA TXN XOM V VRTX WFC WMT XLE ZM ZOM
Leveraged Short ETFs:
FAZ - financials, TZA and SRTY- small caps, MZZ - mid caps, TECS -Techs,
SOXS -
semi-conductors LABD
- Biotechs
Bullish MAXCPs http://www.tigersoftware.com/UPPING/12-21/BULLISH.htm
Bearish MINCPs http://www.tigersoftware.com/Downing/12-21/BEARISH.htm |
|
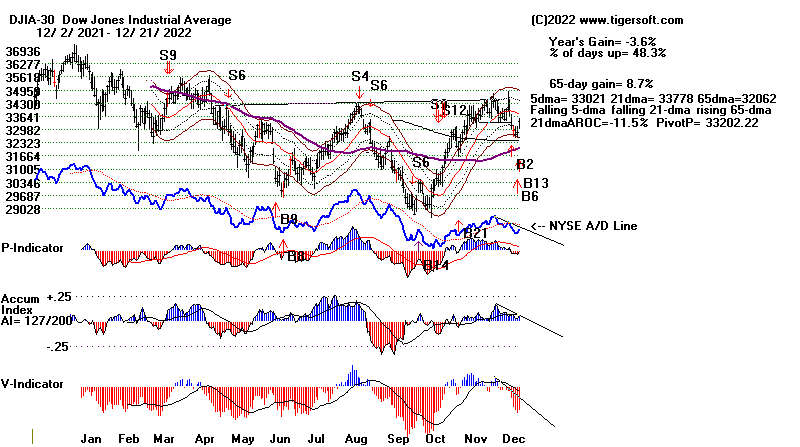 |
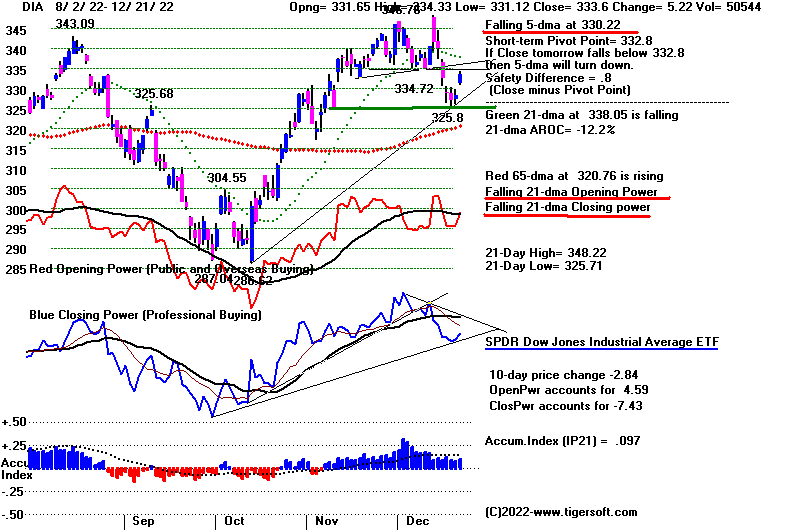 |
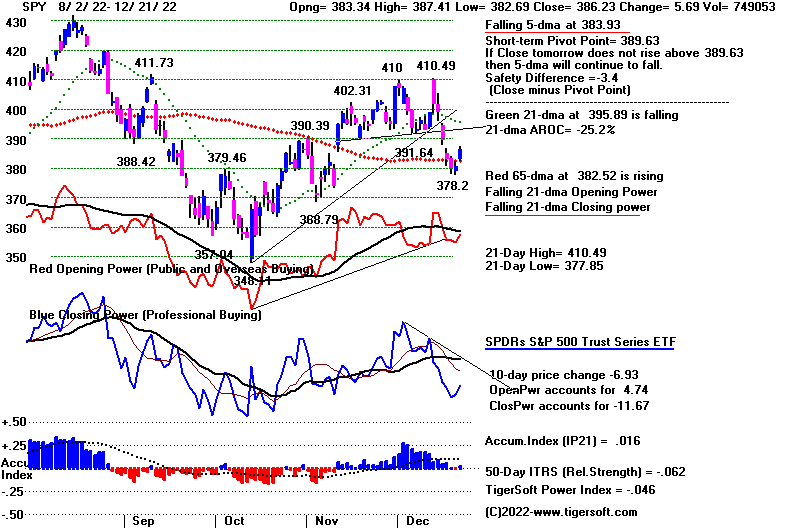 |
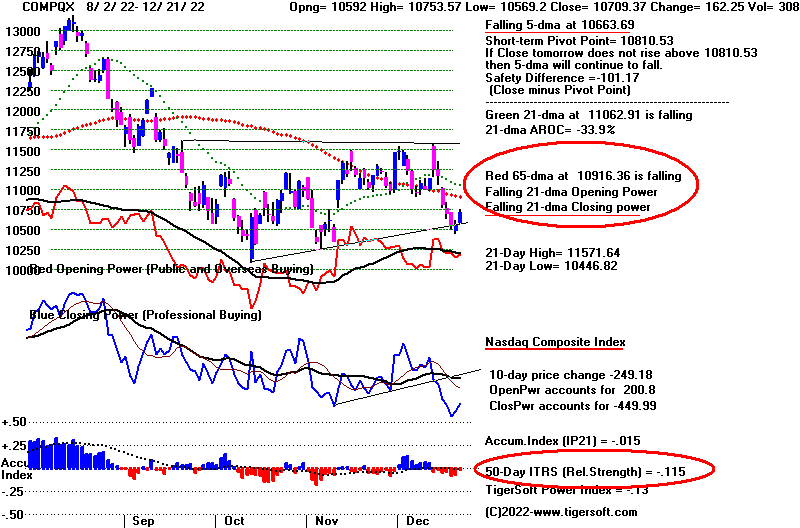 |
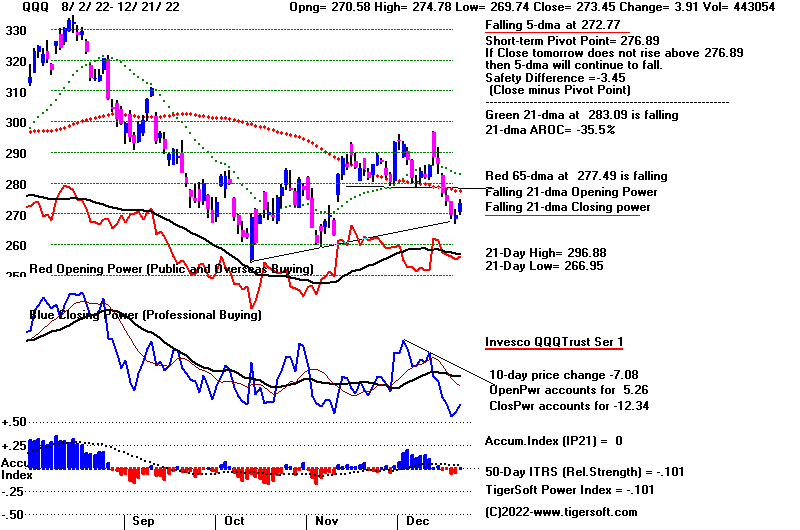 |
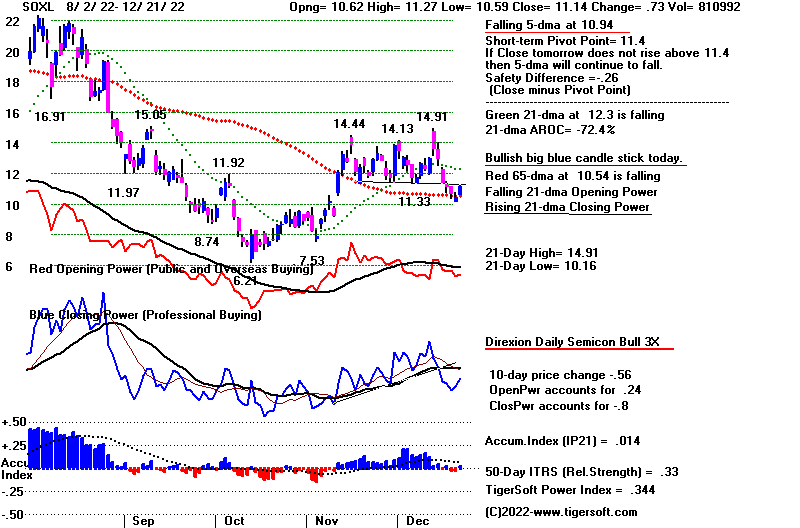 |
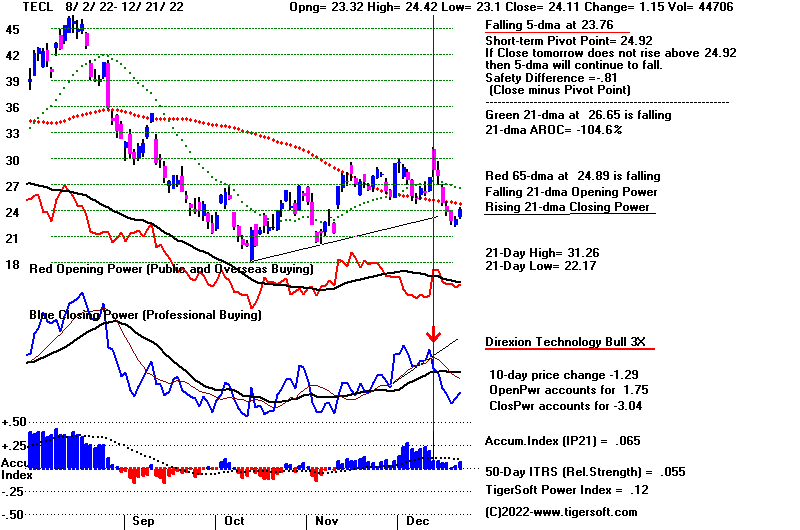 |
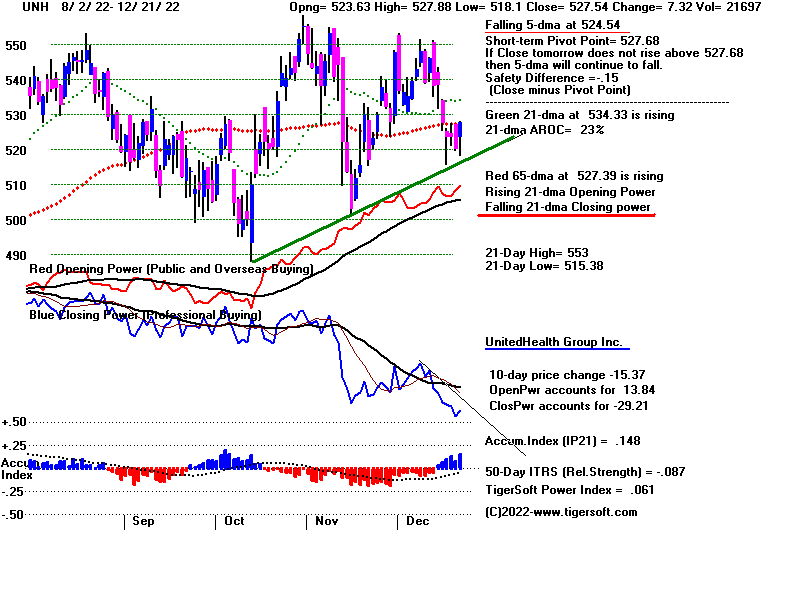 |
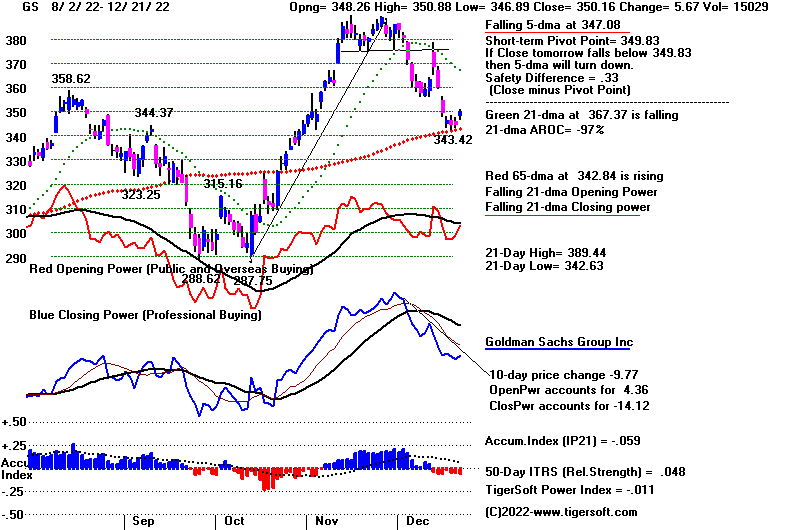 |
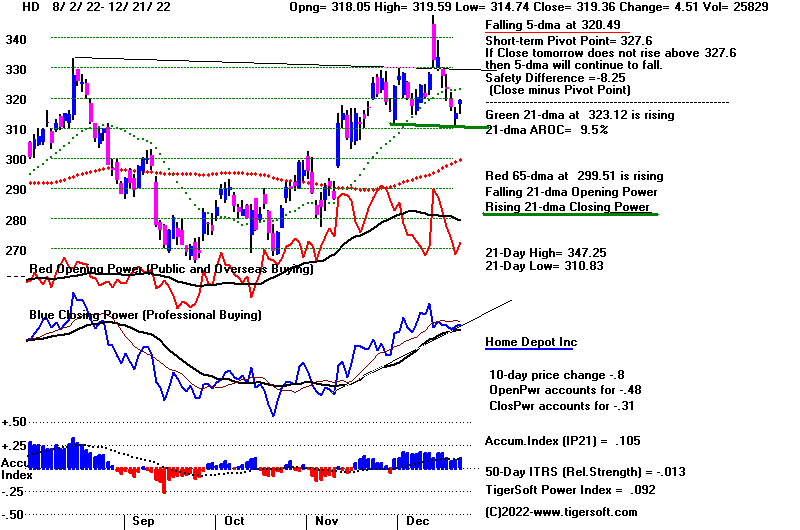 |
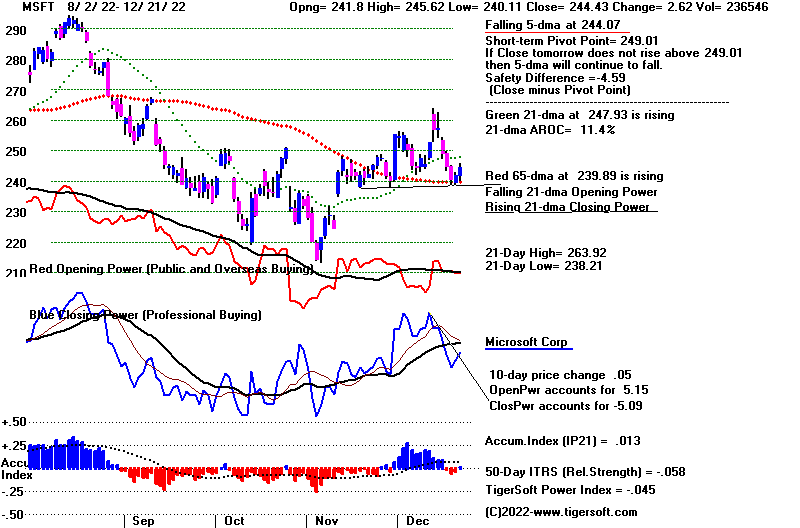 |
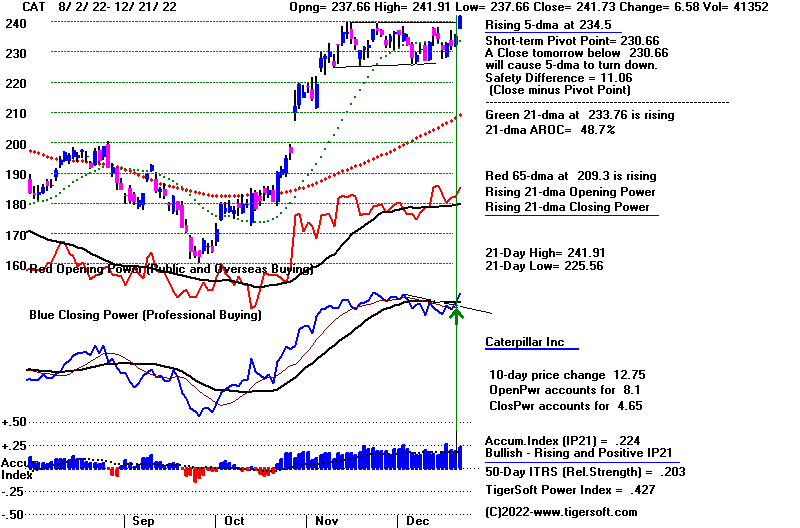 |
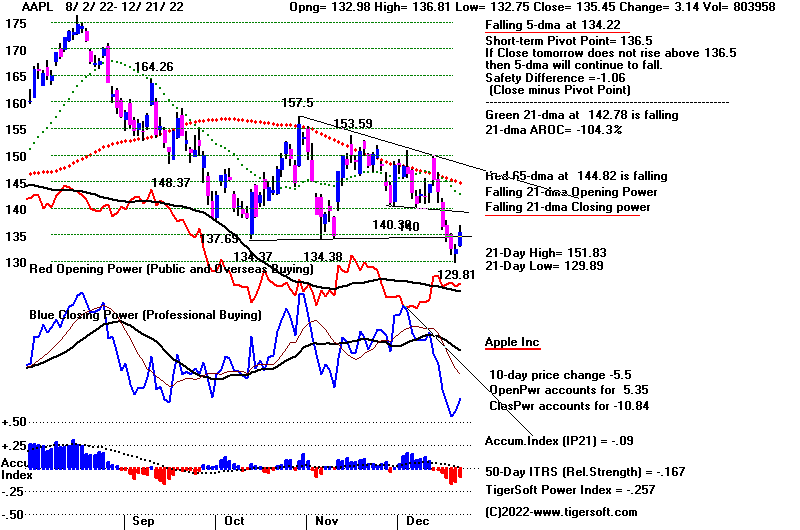 |
Table 1 - Breadth Statistics
12/21/2022
DJIA 33376.48 526.74 +1.60%
S&P 500 3878.44 56.82 +1.49%
Nasdaq 10709.37 162.26 +1.54%
New highs = 52 + 82 = 134
New lows = 73 + 316 = 389
NYSE Latest Close Previous Close Week Ago
Issues traded 3,251 3,285 3,232
Advances 2,409 1,650 1,305
Declines 728 1,500 1,791
Unchanged 114 135 136
New highs 52 48 46
New lows 73 164 92
Adv. volume* 705,349,316 528,352,348 355,745,190
Decl. volume* 95,875,147 338,129,748 652,701,600
Total volume* 808,085,822 878,891,800 1,048,650,485
Closing Arms (TRIN)† 0.50 0.64 1.23
Block trades* 4,454 4,693 5,082
Adv. volume 3,245,763,387 2,483,673,443 1,591,863,489
Decl. volume 491,138,026 1,450,121,639 2,688,945,274
Total volume 3,775,205,521 3,985,376,798 4,472,347,259
NASDAQ Latest Close Previous Close Week Ago
Issues traded 4,838 4,860 4,848
Advances 3,117 2,378 1,897
Declines 1,480 2,218 2,695
Unchanged 241 264 256
New highs 82 86 99
New lows 316 467 246
Closing Arms (TRIN)† 1.04 1.21 0.86
Block trades 30,500 31,909 38,770
Adv. volume 2,903,737,852 2,166,482,888 2,444,828,872
Decl. volume 1,435,651,701 2,435,060,926 2,988,509,212
Total volume 4,401,426,086 4,707,191,752 5,485,155,9
|
Table 2 QUICKSILVER on ETFS - 12/20/2022 ---
Bullish = 2 FAS, SOXL,
Bearish = 3 DBO, CORN, WEAT
ETF CLOSE CHANGE PIVOT-PT 5-dma AROC CL-PWR CANDLE IP21 ITRS POWER INDEX
================================================================================================
DIA 333.6 5.22 332.8 -99.8% Bearish BLUE .097 ---- ------
---------------------------------------------------------------------------------------------
COMPQX 10709.37 162.26 10810.53 -214.5% Bearish BLUE -.014 -.114 -.128
---------------------------------------------------------------------------------------------
SPY 386.23 5.69 389.63 -170.3% Bearish BLUE .017 -.062 -.045
---------------------------------------------------------------------------------------------
QQQ 273.45 3.91 276.89 -237.1% Bearish BLUE 0 -.101 -.101
---------------------------------------------------------------------------------------------
MDY 445.48 8.29 446.19 -125.1% Bearish BLUE -.048 -.063 -.111
---------------------------------------------------------------------------------------------
IWM 175.9 2.98 175.68 -122.5% Bearish BLUE -.109 -.093 -.202
---------------------------------------------------------------------------------------------
FAS 73.14 3.55 71.6 -202.8% Bearish BLUE .044 .22 .264
---------------------------------------------------------------------------------------------
RETL 6.99 .43 7.56 -877% Bearish BLUE .022 -.113 -.091
---------------------------------------------------------------------------------------------
SOXL 11.14 .73 11.4 -821.4% ------- BLUE .014 .33 .344
---------------------------------------------------------------------------------------------
TECL 24.11 1.15 24.92 -802.4% ------- BLUE .065 .056 .121
---------------------------------------------------------------------------------------------
IBB 133.73 1.65 134.24 -112.5% ------- BLUE .067 -.01 .057
---------------------------------------------------------------------------------------------
GLD 168.8 -.28 165.35 20.9% ------- RED -.005 -.053 -.058
---------------------------------------------------------------------------------------------
DBO 14.75 .28 14.56 -31% Bearish BLUE -.191 -.259 -.45
---------------------------------------------------------------------------------------------
OIH 299.8 6.47 290.62 122.8% Bearish ---- -.031 .112 .081
---------------------------------------------------------------------------------------------
CPER 23.07 .05 22.79 -50.2% Bearish BLUE -.128 -.02 -.148
---------------------------------------------------------------------------------------------
TAN 78.42 1.61 80.24 -272.4% Bearish BLUE -.096 -.007 -.103
---------------------------------------------------------------------------------------------
UUP 27.95 .07 28.26 -8.9% Bullish ---- .062 -.223 -.161
---------------------------------------------------------------------------------------------
CORN 26.31 .31 26.03 65.4% Bullish BLUE -.086 -.189 -.275
---------------------------------------------------------------------------------------------
WEAT 7.75 .19 7.64 105.2% Bearish BLUE -.228 -.287 -.515
---------------------------------------------------------------------------------------------
YINN 46.09 3.51 45.58 -325.4% Bearish BLUE -.064 .148 .084
|
Table 3 RANKING OF KEY DIRECTORIES BASED PCT.OF STOCKS ABOVE 65-DMA
12/21/22
Bullish = 38
Bearish = 9
---------------------------------------------------------------------------------------
Directory Current day-1 day-2 day-3 day-4 day-5
----------------------------------------------------------------------------------------
COPPER 1 1 1 1 1 1
DJI-13 .923 .846 .769 .769 .923 .923
INFRA .909 .818 .696 .818 .848 .878
HOMEBLDG .888 .888 .888 .888 .888 .888
GOLD .869 .847 .717 .76 .739 .826
UTILITY .868 .815 .789 .815 .815 .815
DOWJONES .833 .733 .733 .733 .833 .866
======
ETFS .818 .763 .727 .781 .781 .818
INSURANC .8 .72 .6 .72 .72 .76
BONDFUND .793 .804 .827 .85 .85 .873
BEVERAGE .785 .714 .785 .785 .857 .857
SP-100 .711 .633 .655 .644 .755 .822
CHEM .695 .63 .586 .586 .652 .739
MILITARY .692 .615 .576 .615 .692 .73
CHINA .68 .66 .66 .7 .68 .68
SP500 .668 .602 .604 .634 .696 .775
======
COAL .666 .5 .5 .5 .666 .5
EDU .666 .5 .5 .666 .666 .666
INDMATER .666 .583 .5 .555 .597 .708
HIGHPRIC .646 .504 .517 .607 .672 .801
SEMI .642 .568 .589 .652 .684 .8
======
FIDSTKS .639 .573 .538 .603 .656 .751
ELECTRON .631 .548 .556 .631 .661 .744
NASD-100 .63 .56 .56 .57 .6 .71
RUS-1000 .624 .544 .532 .585 .628 .726
======
INDEXES .616 .486 .47 .551 .648 .772
TRANSP .578 .526 .526 .578 .578 .684
BIGBANKS .571 .571 .571 .571 .571 .714
REIT .553 .484 .476 .546 .661 .715
SOFTWARE .553 .517 .464 .464 .517 .625
COMODITY .538 .538 .512 .589 .589 .615
JETS .538 .461 .384 .538 .538 .692
RETAIL .531 .468 .468 .489 .553 .659
GAMING .526 .526 .368 .631 .578 .578
FINANCE .525 .425 .375 .412 .487 .55
NIFTY .522 .454 .477 .5 .522 .704
FOOD .51 .51 .489 .53 .51 .551
OILGAS .504 .409 .371 .38 .457 .466
=================================================================================================
COMPUTER .5 .4 .5 .5 .55 .65
HOSPITAL .5 .5 .357 .5 .428 .5
=================================================================================================
GREEN .444 .444 .5 .5 .666 .722
HACKERS .437 .437 .437 .437 .5 .5
GUNS .428 .214 .214 .285 .357 .642
BIOTECH .421 .38 .358 .385 .396 .446
AUTO .415 .377 .452 .49 .547 .622
REGBANKS .4 .2 .2 .24 .24 .36
SOLAR .312 .375 .375 .625 .75 .75
LOWPRICE .305 .28 .274 .305 .305 .308
MARIJUAN .1 .1 .1 .3 .3 .4
|
====================================================================================
Wednesday -
5:34 AM - Futures: DJI
+327 NASDAQ +69 Data
Used: 12/20/22
| |
11/20/2022
DJIA 32849.74
92.20 +0.28%
S&P 500 3821.62
3.96
+0.10%
Nasdaq 10547.11
1.08
+0.01%
New Highs 48 87 = 135
New Lows 164 468 = 534 |
|
| |
Peerless generated
a Buy B6 on Tuesday. This occurs in second years
of the Presidential cycle in
Decembers on tests of the lower 3% band.
There have been 11 previous Buy
B6s. They average gains of 10% when
next reversed. Five had no
paper losses, The biggest paper loss was
2% and that was on a Buy B6 that
took place in a deep bear market and
much earlier in December.
I hope you did some buying because
of Tuesday's close in the DJI being
higher than its opening. Even
though it was not by much, the improvement
in Closing Power rather than
another decline did show us that heavy
Professional selling is coming to
an end now that we are in the normally bullish
period of December.
We had hoped that the DJI's
Closiing Power would turn up more
markedly than today, but perhaps a
rally in here will be based mostly
on higher openings as the DJI
fights to get back to 33400 where it
recently broke down from.
Breadth was positive today, but tax loss
selling will hold back stocks and
ETFs that do not quickly get back
above their 65-dma as the Christmas
rally unfolds.
Tax loss selling will be a problem
now and until 2023 for those stocks
and ETFs far below their 65-dma.
You can see the tax loss selling at work
as former leaders TSLA, AMZN and
AAPL fell more today (Tuesday).
Such selling is apt to be
relentless now due to how sellers finally choose end
their procrastination in taking
losses and while funds do window-dressing
so as not to disclose their failure
to act sooner in taking big losses.
FAS and GS failed to show a
reversal on Tuesday. That may come to an
end today. Their
failure to rally Tuesday along with the declines in DJI
leaders UNH and HD are
problematic. I would still buy DIA because
of the Buy B6, but it's now hard to
find leaders ready to rise if the Buy B6
works out. We will watch the
NASDAQ and QQQ to see if they break
their current support levels.
Here much will depend if a few select biotechs
can generate any speculative
confidence and whether the oversold semi-
conductor ETF, SOXL (which has a
red Stochastic-5 buy) can show
some bounce.
Hold short the bearish MINCPs.
The number of new lows far outpaces
the new highs. Buy DIA and
SOXL.
--------------------- Past Buy B6s since 1930 -------------------
Date Signal
DJIA Gain
Paper Loss
----------------------------------------------------------------------
19301226 B6 161.2
.059
160.2
-.0062 12/29
19341220 B6 99.6
.044
none
0
19501204 B6 222.3
.166
none
0
19661228 B6 788.58
.125 785.69
-.0036 12/30
19781218 B6 787.51
.112 none
0
19861231 B6 1895.91
.269 none
0
19981210 B6 8841.58
.241
8695.6 -.0165 12/14
20021209 B6 8473.41
.035 8303.78
-.02 12/27
20021224 B6 8432.61
.039 8303.78
-.013 12/27
20141212 B6 17280.83 .060
17068.9
-.007
20181226 B6 22878.45 .052
none
0
--------------------------------------------------------------------------------
N= 11
Avg. .100
|
|
| |
Charts - 12/20/2022
2022 PEERLESS DJI, Signals, Indicators Daily DJI Volume
10-DayUp/Down Vol Stoch-20 CCI RSI Pct of All Stocks above 65-dma
Inverted Traders Index
DJI-IPA DJI-OBV BOND FUNDS
NASDAQ S&P OEX NYSE DJ-15 DJ-20 DJI-30
DIA QQQ SPY IWM new - COIN (Bit Coin ETF)
TNA Short-Term Rates Ten Year Rates PST (Short Treasuries)
DOLLAR-UUP
ALLSTOCKs
Russell-1000
Insurance-Stocks
Recent 2006 vers-Peerless signals
http://www.tigersoftware.com/NEWPEER/UPD81220.bmp
MDY - http://www.tigersoftware.com/CHARTX/MDY.GIF
USO-CrudeOil DBO FAS GLD HD IBB JETS JNUG KOL NAIL NUGT NRGU OIH
PALL RSX RETL SDS AGQ SLV SOXL TAN TECL TLT TMF TNA UGA USO
China: YINN
CHAU
Commodities: CANE
CORN DBC JJC, NIB CORN, CUT (paper)
MOO, NRGU
SOYB WEAT UUP (Dollar) LIT
(Lithium)
China: YINN
CHAU
Commodities: CANE
CORN DBC JJC, NIB CORN, CUT (paper)
MOO, NRGU
SOYB WEAT UUP (Dollar) LIT
(Lithium)
Stocks AA AAPL ADBE ALXN AMAT AMGN AMD AMZN AXP BA BABA
BAC BIDU BLDP CAT CHKP CNX CRM CVX CMG DE DIS ENPH FB FSLR
FTNT GILD GME GOOG GS HD IBM INTU JPM KO KR LRCX MRK MRNA
MOS MSFT NEM NFLX NKE NOC NUE NVDA PANW PG PYPL REGN REV
SO QCOM QDEL TSLA TXN XOM V VRTX WFC WMT XLE ZM ZOM
Leveraged Short ETFs:
FAZ - financials, TZA and SRTY- small caps, MZZ - mid caps, TECS -Techs,
SOXS -
semi-conductors LABD
- Biotechs
Bullish MAXCPs http://www.tigersoftware.com/UPPING/12-20/BULLISH.htm
Bearish MINCPs http://www.tigersoftware.com/Downing/12-20/BEARISH.htm |
|
New Peerless
Buy B6 is a reliable signal.
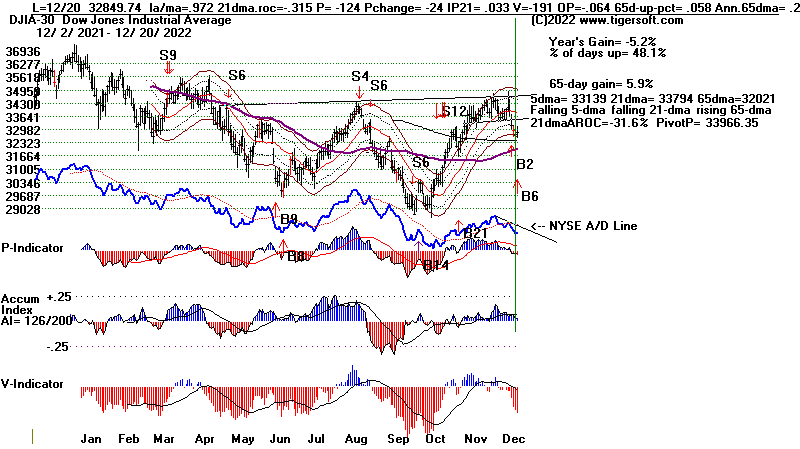 |
Closing Power barely turned up on Tuesday. Resistance
at 334-335 is target
for Santa Claus rally.
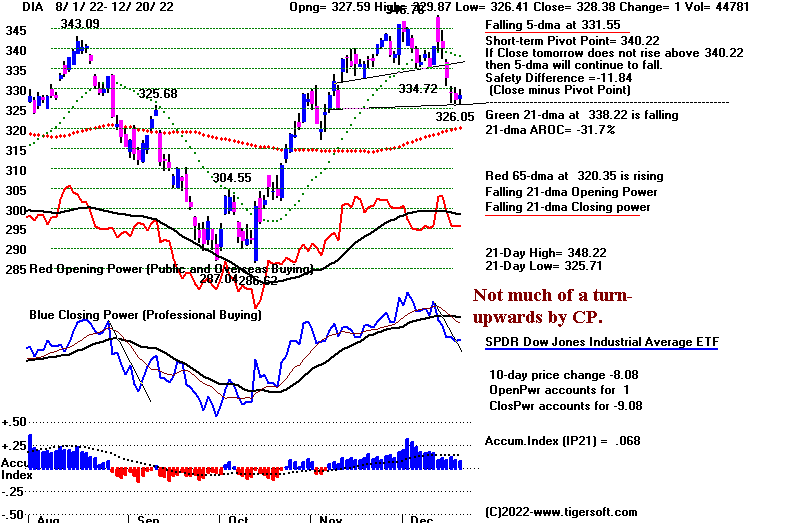 |
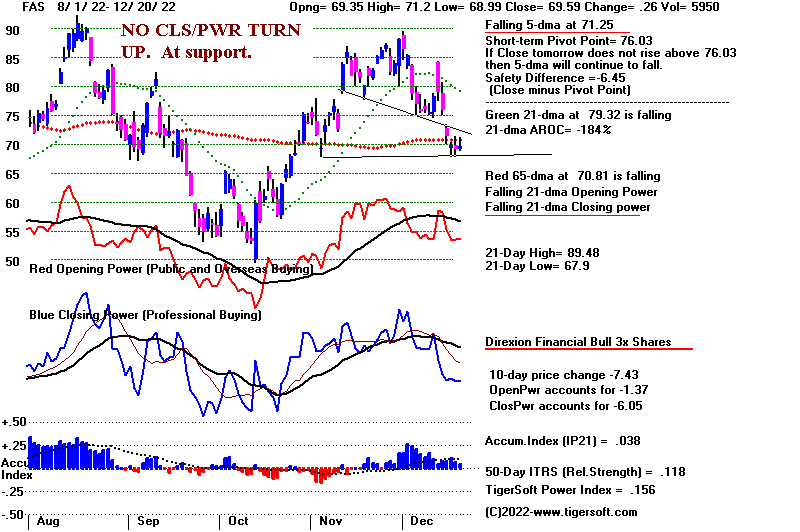 |
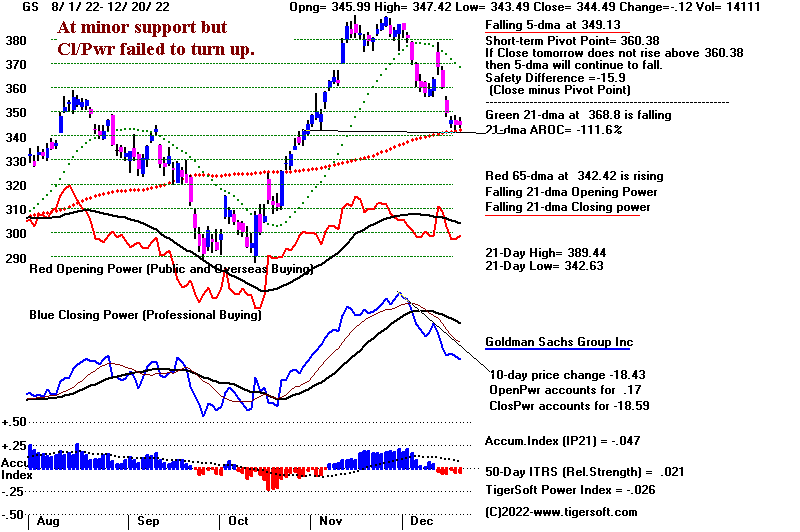 |
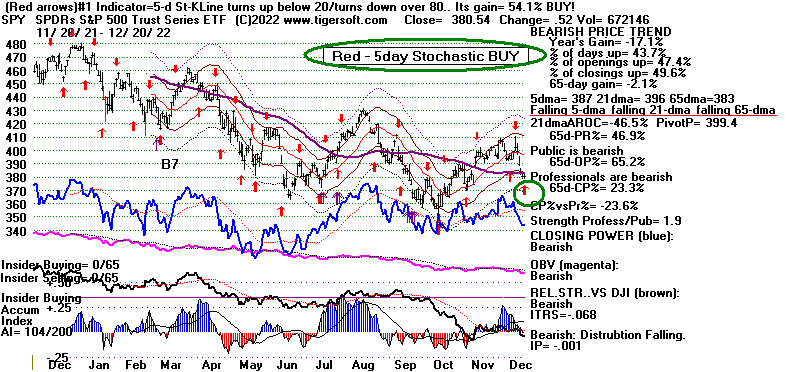 |
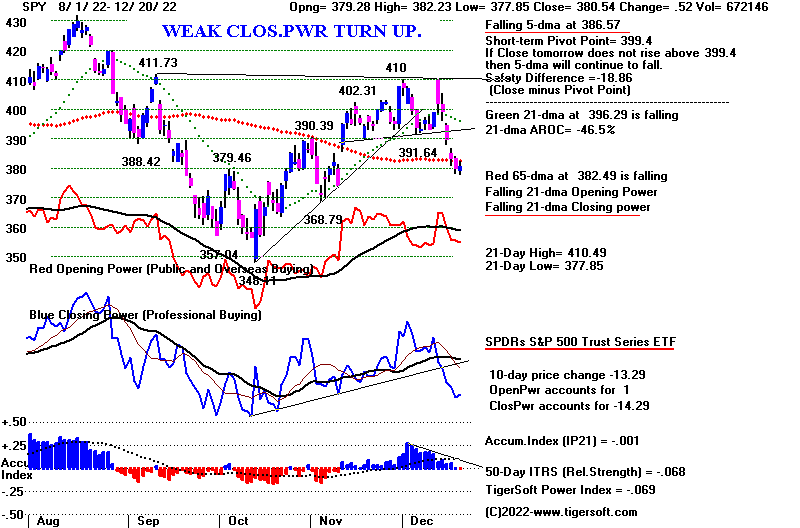 |
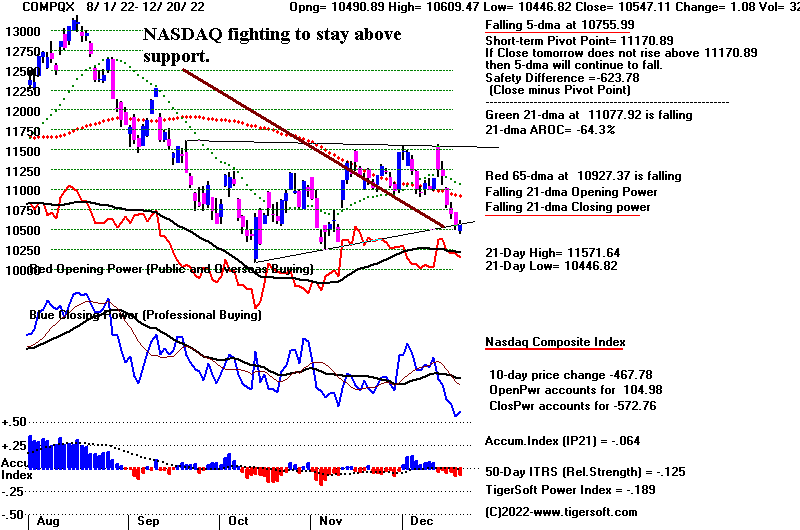 |
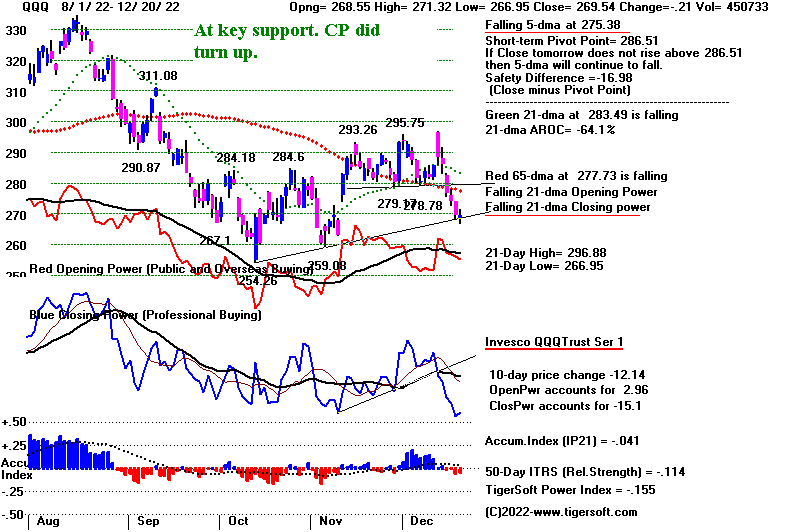 |
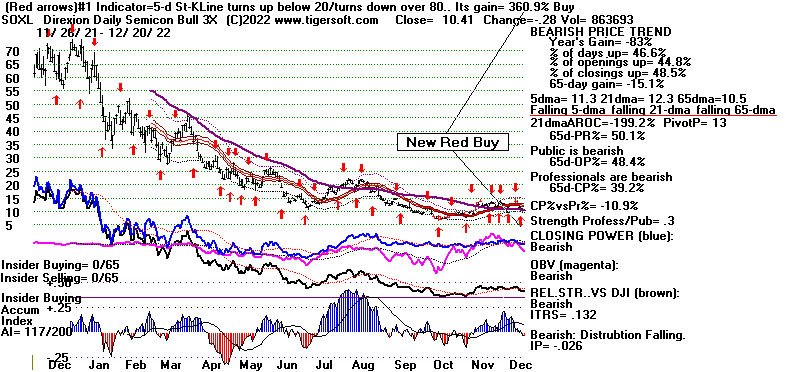 |
 |
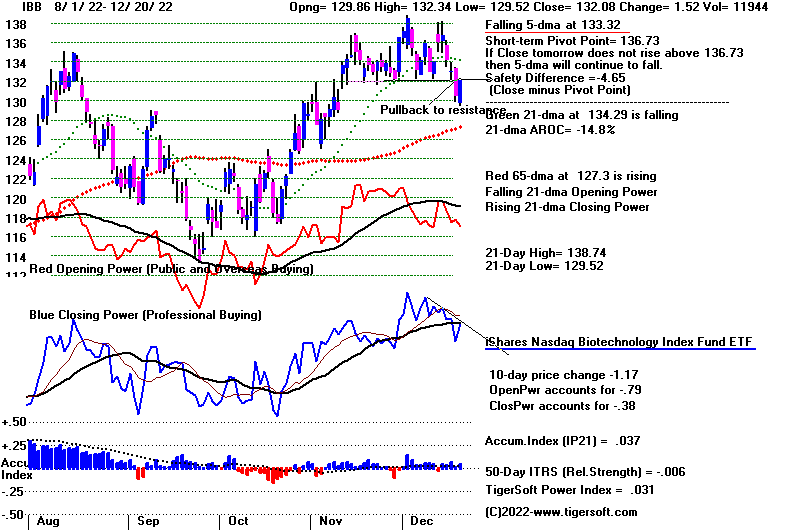 |
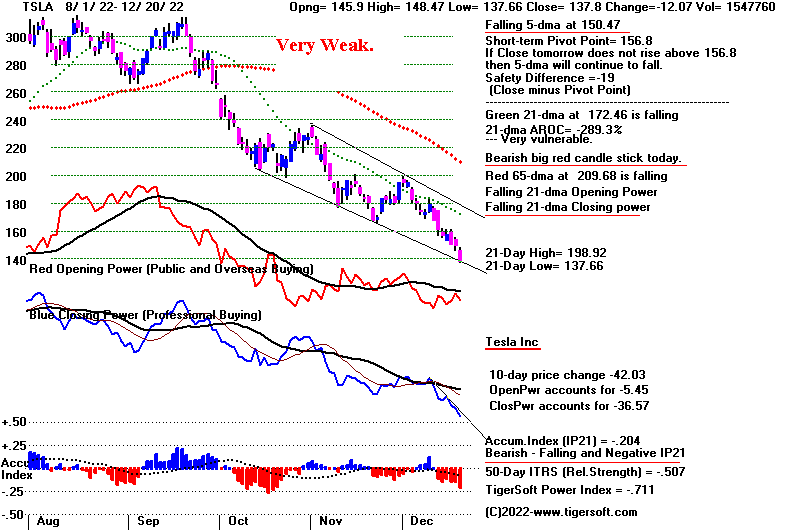 |
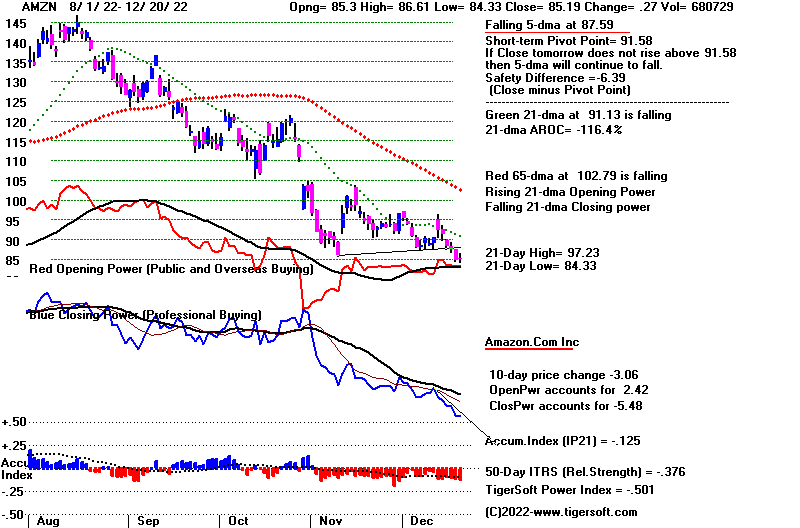 |
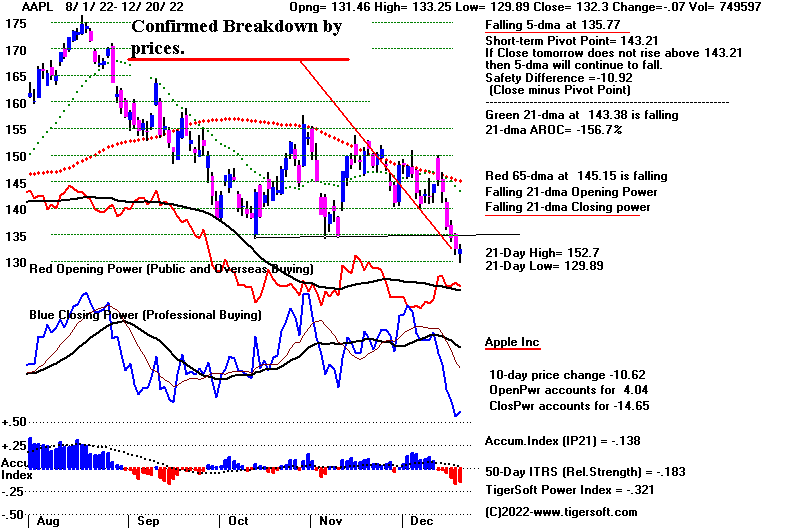 |
Table 1 - Breadth Statistics 11/20/2022
DJIA 32849.74 92.20 +0.28%
S&P 500 3821.62c 3.96 +0.10%
Nasdaq 10547.11 1.08 +0.01%
New Highs 48 87 = 135
New Lows 164 468 = 534
NYSE Latest
Issues traded 3,285 3,256 3,288
Advances 1,650 932 2,227
Declines 1,500 2,222 936
Unchanged 135 102 125
New highs 48 41 91
New lows 164 166 56
Adv. volume* 528,352,348 252,970,358 740,686,688
Decl. volume* 338,129,748 675,419,805 415,751,697
Total volume* 878,891,800 938,598,105 1,177,322,775
Closing Arms (TRIN)† 0.64 1.13 1.55
Block trades* 4,693 4,747 5,171
Adv. volume 2,483,673,443 1,062,250,261 3,010,933,099
Decl. volume 1,450,121,639 2,858,174,978 1,967,367,902
Total volume 3,985,376,798 3,969,615,175 5,079,364,895
NASDAQ Latest Close
Issues traded 4,860 4,863 4,911
Advances 2,378 1,278 2,781
Declines 2,218 3,349 1,874
Unchanged 264 236 256
New highs 87 79 123
New lows 468 535 247
Closing Arms (TRIN)† 1.21 1.39 0.74
Block trades 31,909 28,832 39,590
Adv. volume 2,166,482,888 989,036,868 4,025,080,301
Decl. volume 2,435,060,926 3,604,808,918 1,995,617,169
Total volume 4,707,191,752 4,631,829,294 6,126,895,639
|
Table 2 QUICKSILVER on ETFS - 12/20/2022 ---
Bullish = 0
Bearish = 3 DBO, CORN, WEAT
ETF CLOSE CHANGE PIVOT-PT 5-dma AROC CL-PWR CANDLE IP21 ITRS POWER INDEX
================================================================================================
DIA 328.38 1 340.22 -200.9% Bearish BLUE .069 === ======
---------------------------------------------------------------------------------------------
COMPQX 10547.11 1.08 11170.89 -325.6% Bearish BLUE -.064 -.124 -.188
---------------------------------------------------------------------------------------------
SPY 380.54 .52 399.4 -274.1% Bearish BLUE 0 -.068 -.068
---------------------------------------------------------------------------------------------
QQQ 269.54 -.21 286.51 -342.2% Bearish BLUE -.041 -.113 -.154
---------------------------------------------------------------------------------------------
MDY 437.19 2.27 456.56 -240.5% Bearish BLUE -.073 -.065 -.138
---------------------------------------------------------------------------------------------
IWM 172.92 .91 180.19 -239.4% Bearish BLUE -.102 -.093 -.195
---------------------------------------------------------------------------------------------
FAS 69.59 .27 76.03 -651.3% Bearish BLUE .038 .119 .157
---------------------------------------------------------------------------------------------
RETL 6.56 -.29 8.27 -1125.4% Bearish RED .009 -.128 -.119
---------------------------------------------------------------------------------------------
SOXL 10.41 -.28 13 -1345.5% Bearish BLUE -.025 .133 .108
---------------------------------------------------------------------------------------------
TECL 22.96 .03 28.05 -1126% Bearish BLUE .021 -.038 -.017
---------------------------------------------------------------------------------------------
IBB 132.08 1.52 136.73 -146.2% ------- BLUE .037 -.005 .032
---------------------------------------------------------------------------------------------
GLD 169.08 2.76 168.1 17.1% Bearish BLUE .024 -.037 -.013
---------------------------------------------------------------------------------------------
DBO 14.47 .04 14.84 -61.8% Bearish BLUE -.089 -.282 -.371
---------------------------------------------------------------------------------------------
OIH 293.33 10.14 292.7 -18.7% Bearish BLUE .049 .091 .14
---------------------------------------------------------------------------------------------
CPER 23.02 .29 23.3 -47.9% Bearish BLUE -.136 -.015 -.151
---------------------------------------------------------------------------------------------
TAN 76.81 -.59 82.73 -271.3% Bearish BLUE -.109 -.029 -.138
---------------------------------------------------------------------------------------------
UUP 27.88 -.19 28 -44.4% Bullish ---- .054 -.209 -.155
---------------------------------------------------------------------------------------------
CORN 26 .15 25.97 9.6% Bullish BLUE -.157 -.188 -.345
---------------------------------------------------------------------------------------------
WEAT 7.56 -.01 7.59 -26.3% Bearish ---- -.243 -.317 -.56
---------------------------------------------------------------------------------------------
YINN 42.58 -2.55 49.06 -588.4% Bearish BLUE -.098 -.032 -.13
|
Table 3 RANKING OF KEY DIRECTORIES BASED PCT.OF STOCKS ABOVE 65-DMA
12/20/22
Bulliah = 29
Bearish = 17
---------------------------------------------------------------------------------------
Directory Current day-1 day-2 day-3 day-4 day-5
----------------------------------------------------------------------------------------
COPPER 1 1 1 1 1 1
HOMEBLDG .888 .888 .888 .888 .888 .888
GOLD .847 .717 .76 .739 .826 .869
DJI-13 .846 .769 .769 .923 .923 .923
INFRA .818 .696 .818 .848 .878 .878
UTILITY .815 .789 .815 .815 .815 .815
BONDFUND .804 .827 .85 .85 .885 .885
ETFS .763 .727 .781 .781 .836 .836
DOWJONES .733 .733 .733 .833 .866 .866
-----
INSURANC .72 .6 .72 .72 .76 .8
BEVERAGE .714 .785 .785 .857 .857 1
CHINA .66 .66 .7 .68 .68 .68
SP-100 .633 .655 .644 .755 .822 .822
CHEM .63 .586 .608 .63 .739 .717
MILITARY .615 .576 .615 .692 .73 .73
SP500 .602 .604 .634 .692 .783 .791
-----
INDMATER .583 .5 .555 .597 .708 .694
FIDSTKS .573 .538 .603 .656 .757 .763
BIGBANKS .571 .571 .571 .571 .714 .714
SEMI .568 .589 .652 .684 .768 .789
NASD-100 .56 .56 .57 .6 .71 .76
-----
ELECTRON .548 .556 .631 .661 .729 .744
RUS-1000 .544 .532 .585 .628 .725 .742
-----
COMODITY .538 .512 .564 .589 .615 .615
GAMING .526 .368 .578 .631 .578 .631
TRANSP .526 .526 .578 .578 .684 .684
SOFTWARE .517 .482 .464 .517 .625 .678
FOOD .51 .489 .51 .51 .551 .551
HIGHPRIC .504 .517 .607 .672 .814 .823
----------------------------------------------------------------------------------------------
COAL .5 .5 .5 .666 .5 .666
EDU .5 .5 .666 .666 .666 .666
HOSPITAL .5 .357 .5 .428 .5 .5
----------------------------------------------------------------------------------------------
INDEXES .486 .47 .551 .648 .772 .8
REIT .484 .469 .553 .669 .692 .746
RETAIL .468 .468 .489 .553 .659 .638
JETS .461 .384 .538 .538 .692 .692
NIFTY .454 .477 .5 .522 .704 .795
GREEN .444 .5 .5 .666 .666 .666
HACKERS .437 .437 .437 .5 .5 .5
FINANCE .425 .375 .412 .475 .55 .637
OILGAS .409 .371 .38 .457 .457 .504
COMPUTER .4 .5 .5 .55 .65 .65
BIOTECH .38 .355 .388 .396 .438 .432
AUTO .377 .452 .49 .547 .641 .698
SOLAR .375 .375 .625 .75 .687 .625
LOWPRICE .28 .277 .308 .305 .308 .327
GUNS .214 .214 .285 .357 .642 .714
REGBANKS .2 .2 .24 .24 .36 .44
MARIJUAN .1 .1 .3 .3 .4 .6
|
====================================================================================
Tuesday -
6:05 AM - Futures: DJI -10 NASDAQ
-50 Data Used: 12/19/22
| |
12/19/2022
DJIA 32757.54
-162.92 -0.49%
S&P 500 3817.66
-34.70 -0.90%
Nasdaq 10546.03 -159.38
-1.49%
New highs 41
+ 79 = 120
New Lows 166 + 535
= 701 |
|
| |
Peerless refused to give a Santa Claus Buy B13
today. The reason was that
the volume indicators dropped into negative territiry too much.
Such low Obv-Pct
and V-I scores as we saw today are assiociated too closely with
lower prices
until just before Christmas eve. The Buy B2 at the lower
band may still on its own
bring a rally. But I have urged folks here to wait until
DIA's Closing Power turns up.
Then Buy DIA or MRK or HD. The tech stocks are just under
too much tax loss
selling pressure, especially where they ae making confirned
new lows or are simply
below their 65-dma. Shorting the weakest among the Bearish
MINCPs has been
profitable. Hold them short for a while longer.
|
|
| |
Charts - 12/19/2022
2022 PEERLESS DJI, Signals, Indicators Daily DJI Volume
10-DayUp/Down Vol Stoch-20 CCI RSI Pct of All Stocks above 65-dma
Inverted Traders Index
DJI-IPA DJI-OBV BOND FUNDS
NASDAQ S&P OEX NYSE DJ-15 DJ-20 DJI-30
DIA QQQ SPY IWM new - COIN (Bit Coin ETF)
TNA Short-Term Rates Ten Year Rates PST (Short Treasuries)
DOLLAR-UUP
ALLSTOCKs
Russell-1000
Insurance-Stocks
Recent 2006 vers-Peerless signals
http://www.tigersoftware.com/NEWPEER/UPD81219.bmp
MDY - http://www.tigersoftware.com/CHARTX/MDY.GIF
USO-CrudeOil DBO FAS GLD HD IBB JETS JNUG KOL NAIL NUGT NRGU OIH
PALL RSX RETL SDS AGQ SLV SOXL TAN TECL TLT TMF TNA UGA USO
China: YINN
CHAU
Commodities: CANE
CORN DBC JJC, NIB CORN, CUT (paper)
MOO, NRGU
SOYB WEAT UUP (Dollar) LIT
(Lithium)
China: YINN
CHAU
Commodities: CANE
CORN DBC JJC, NIB CORN, CUT (paper)
MOO, NRGU
SOYB WEAT UUP (Dollar) LIT
(Lithium)
Stocks AA AAPL ADBE ALXN AMAT AMGN AMD AMZN AXP BA BABA
BAC BIDU BLDP CAT CHKP CNX CRM CVX CMG DE DIS ENPH FB FSLR
FTNT GILD GME GOOG GS HD IBM INTU JPM KO KR LRCX MRK MRNA
MOS MSFT NEM NFLX NKE NOC NUE NVDA PANW PG PYPL REGN REV
SO QCOM QDEL TSLA TXN XOM V VRTX WFC WMT XLE ZM ZOM
Leveraged Short ETFs:
FAZ - financials, TZA and SRTY- small caps, MZZ - mid caps, TECS -Techs,
SOXS -
semi-conductors LABD
- Biotechs
Bullish MAXCPs http://www.tigersoftware.com/UPPING/12-19/BULLISH.htm
Bearish MINCPs http://www.tigersoftware.com/Downing/12-19/BEARISH.htm |
|
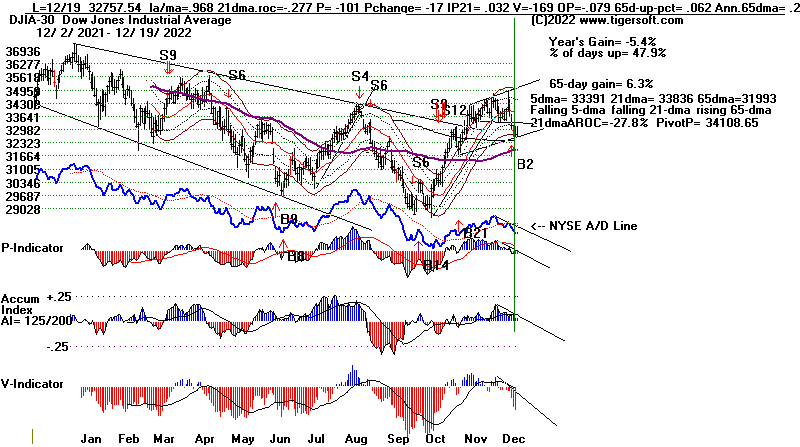 |
 |
 |
 |
 |
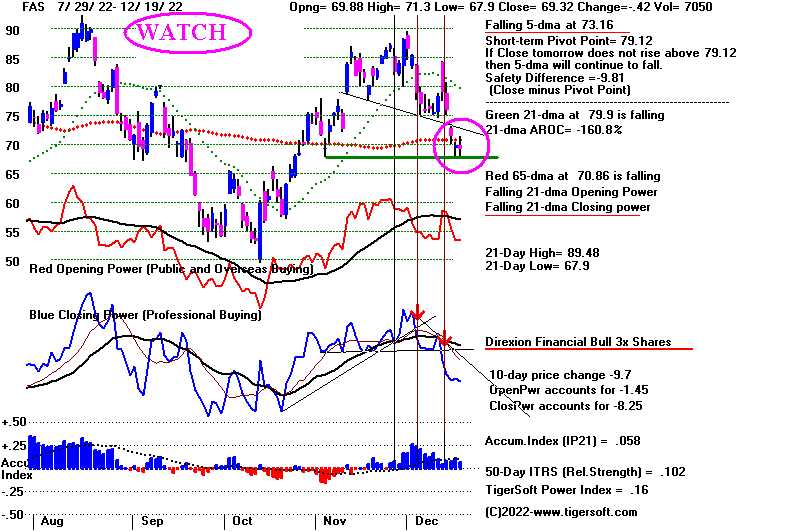 |
 |
 |
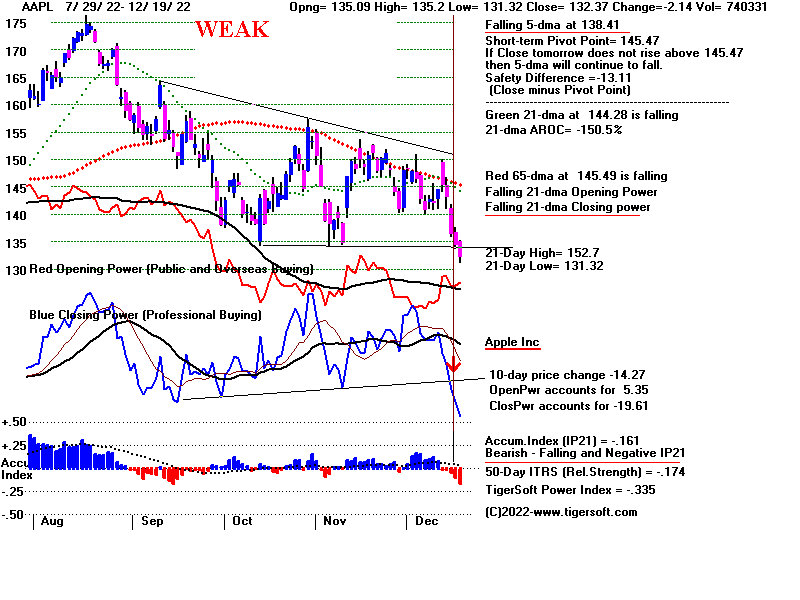 |
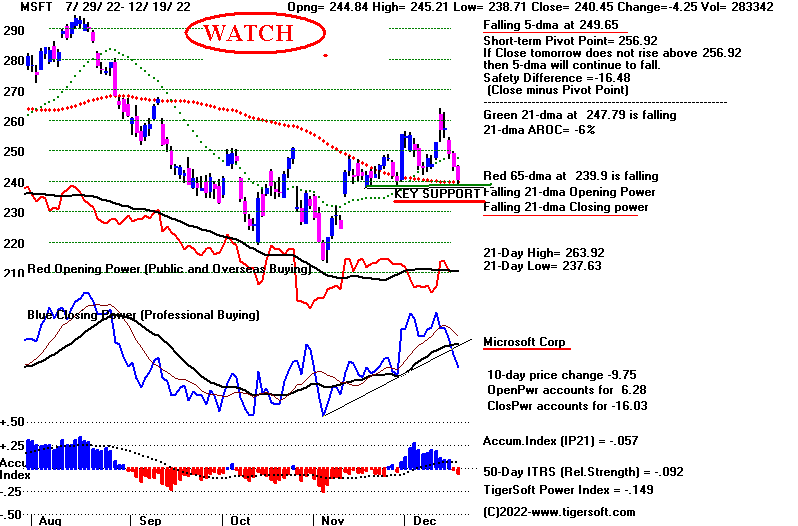 |
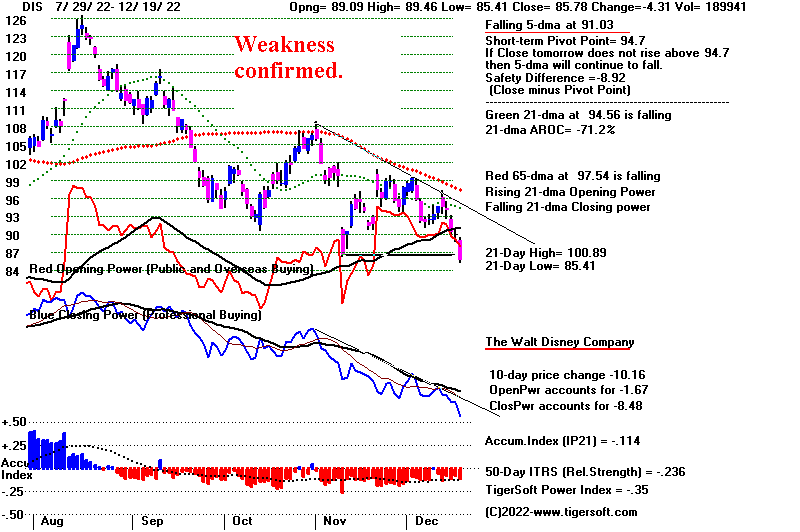 |
 |
 |
 |
Table 1 - Breadth Statistics 12/19/2022
DJIA 32757.54 -162.92 -0.49
S&P 500 3817.66 -34.70 -0.90
Nasdaq 10546.03 -159.38 -1.49
New highs 41 + 79 = 120
New Lows 166 + 535 = 701
NYSE Latest Close Previous Close Week Ago
Issues traded 3,256 3,235 3,265
Advances 932 961 2,006
Declines 2,222 2,140 1,135
Unchanged 102 134 124
New highs 41 31 48
New lows 166 178 90
Adv. volume* 252,970,358 685,773,639 650,506,834
Decl. volume* 675,419,805 2,502,892,296 188,323,349
Total volume* 938,598,105 3,232,478,068 849,255,435
Closing Arms (TRIN)† 1.13 1.47 0.66
Block trades* 4,747 6,810 4,476
Adv. volume 1,062,250,261 1,723,890,611 2,793,564,822
Decl. volume 2,858,174,978 5,642,903,423 1,045,988,830
Total volume 3,969,615,175 7,493,668,747 3,904,136,311
NASDAQ Latest Close Previous Close Week Ago
Issues traded 4,863 4,817 4,834
Advances 1,278 1,722 2,679
Declines 3,349 2,851 1,876
Unchanged 236 244 279
New highs 79 66 87
New lows 535 458 294
Closing Arms (TRIN)† 1.39 1.39 0.54
Block trades 28,832 39,566 30,573
Adv. volume 989,036,868 2,386,956,275 3,453,719,035
Decl. volume 3,604,808,918 5,484,675,702 1,316,346,738
Total volume 4,631,829,294 7,968,178,089 4,829,996,357
|
Table 2 QUICKSILVER on ETFS - 12/19/2022 ---
Bullish = 0
Bearish = 3 DBO, CORN, WEAT
ETF CLOSE CHANGE PIVOT-PT 5-dma AROC CL-PWR CANDLE IP21 ITRS POWER INDEX
================================================================================================
DIA 327.38 -1.59 341.81 -196.5% Bearish RED .08 ----- -------
---------------------------------------------------------------------------------------------
COMPQX 10546.03 -159.38 11256.81 -271.3% Bearish RED -.081 -.127 -.208
---------------------------------------------------------------------------------------------
SPY 380.02 -3.25 401.97 -239.8% Bearish RED .003 -.07 -.067
---------------------------------------------------------------------------------------------
QQQ 269.75 -4.5 288.65 -280.3% Bearish RED -.055 -.115 -.17
---------------------------------------------------------------------------------------------
MDY 434.92 -5.11 458.7 -233.8% Bearish RED -.072 -.065 -.137
---------------------------------------------------------------------------------------------
IWM 172.01 -2.36 181.38 -244% Bearish RED -.118 -.097 -.215
---------------------------------------------------------------------------------------------
FAS 69.32 -.42 79.12 -603.6% Bearish RED .058 .103 .161
---------------------------------------------------------------------------------------------
RETL 6.85 -.4 8.28 -986.7% Bearish RED .029 -.083 -.054
---------------------------------------------------------------------------------------------
SOXL 10.69 -.42 13.63 -921.6% Bearish RED -.025 .043 .018
---------------------------------------------------------------------------------------------
TECL 22.93 -.97 28.75 -908.9% Bearish RED .002 -.084 -.082
---------------------------------------------------------------------------------------------
IBB 130.56 -2.44 136 -129.8% Bearish RED .008 -.019 -.011
---------------------------------------------------------------------------------------------
GLD 166.32 -.47 168.51 19.2% Bearish RED -.038 -.064 -.102
---------------------------------------------------------------------------------------------
DBO 14.43 .09 14.65 -6.9% Bearish BLUE -.052 -.292 -.344
---------------------------------------------------------------------------------------------
OIH 283.19 -2.74 294.41 10.5% Bearish RED .068 .028 .096
---------------------------------------------------------------------------------------------
CPER 22.73 -.05 23.24 -65.1% Bearish RED -.231 0 -.231
---------------------------------------------------------------------------------------------
TAN 77.4 -1.03 81.15 -128.1% Bearish RED -.116 -.028 -.144
---------------------------------------------------------------------------------------------
UUP 28.07 -.24 28.13 -54.9% Bullish ---- .076 -.191 -.115
---------------------------------------------------------------------------------------------
CORN 25.85 -.21 25.95 -40.4% Bullish RED -.177 -.173 -.35
---------------------------------------------------------------------------------------------
WEAT 7.57 -.08 7.6 -45.9% Bearish ---- -.253 -.269 -.522
---------------------------------------------------------------------------------------------
YINN 45.13 -.72 48.08 -153.1% Bearish RED -.102 -.065 -.167
|
Table 3 RANKING OF KEY DIRECTORIES BASED PCT.OF STOCKS ABOVE 65-DMA
12/19/22
Bullish= 25
Bearish= 19
---------------------------------------------------------------------------------------
Directory Current day-1 day-2 day-3 day-4 day-5
----------------------------------------------------------------------------------------
COPPER 1 1 1 1 1 1
HOMEBLDG .888 .888 .888 .888 .888 .888
BONDFUND .827 .85 .85 .885 .885 .885
UTILITY .789 .815 .815 .815 .815 .815
BEVERAGE .785 .785 .857 .857 1 .928
DJI-13 .769 .769 .923 .923 .923 .923
DOWJONES .733 .733 .833 .866 .866 .866
=====
ETFS .727 .781 .781 .836 .854 .836
GOLD .717 .76 .739 .826 .869 .826
INFRA .696 .818 .848 .878 .878 .878
CHINA .66 .7 .68 .68 .66 .62
SP-100 .655 .644 .755 .822 .822 .8
SP500 .604 .634 .692 .779 .797 .802
=====
INSURANC .6 .72 .72 .76 .8 .76
SEMI .589 .652 .684 .768 .768 .778
CHEM .586 .608 .652 .717 .739 .717
MILITARY .576 .615 .692 .73 .73 .807
BIGBANKS .571 .571 .571 .714 .714 .714
NASD-100 .56 .57 .6 .71 .75 .75
=====
ELECTRON .556 .631 .661 .729 .736 .751
FIDSTKS .538 .603 .656 .757 .763 .775
RUS-1000 .532 .585 .628 .725 .741 .731
=====
TRANSP .526 .578 .578 .684 .684 .789
HIGHPRIC .517 .607 .672 .814 .818 .801
COMODITY .512 .564 .564 .615 .615 .589
================================================================================================
COAL .5 .5 .666 .5 .666 .666
COMPUTER .5 .5 .55 .65 .65 .65
EDU .5 .666 .666 .666 .666 .666
GREEN .5 .5 .666 .666 .666 .611
INDMATER .5 .555 .597 .708 .694 .708
================================================================================================
FOOD .489 .51 .489 .551 .551 .51
SOFTWARE .482 .482 .517 .625 .66 .607
NIFTY .477 .5 .522 .704 .772 .727
INDEXES .47 .551 .648 .772 .8 .767
REIT .469 .546 .676 .7 .73 .715
RETAIL .468 .489 .553 .659 .638 .659
AUTO .452 .49 .547 .641 .698 .679
HACKERS .437 .437 .5 .5 .5 .5
JETS .384 .538 .538 .692 .692 .769
FINANCE .375 .412 .475 .537 .637 .7
SOLAR .375 .625 .75 .687 .625 .5
OILGAS .371 .38 .457 .457 .504 .438
GAMING .368 .578 .578 .631 .631 .631
HOSPITAL .357 .5 .428 .5 .5 .428
BIOTECH .355 .385 .399 .438 .432 .421
LOWPRICE .277 .31 .308 .308 .322 .316
GUNS .214 .285 .357 .642 .714 .714
REGBANKS .2 .24 .24 .36 .48 .56
MARIJUAN .1 .3 .3 .4 .5 .6
|
/2022
=================================================================================
Monday -
5:55 AM - Futures: DJI
+0 NASDAQ +15 Data
Used: 12/16/2022
| |
12/16/2022
DJIA 32920.46
-281.76 -0.85
S&P 500 3852.36 -43.39 -1.11
Nasdaq 10705.41
-105.11 -0.97
New Highs 31 + 66 = 97
New lows 178 + 458 = 636 |
|
| |
Friday
Sellers took the DJI down to its 3.5% lower band where it turned around a little.
So, that level may act as
enough support this week to cause our Closing Powers to hook
back up. And that would
be our sign to buy DIA, HD, SOXL and NVDA. To do this,
the key ETFs' Closing Powers
shown below willl now need to close above their
openings. Given the
past reliabilty of past Buy B2s and B13s (which is likely today),
traders should then expect a
rally until early January, at the least. Much bigger gains
have sometimes resulted from
Buy B13s at the end of the second year in the four-year
Presidential cycle: Decembers
1950 (+12.2%), 1962 (+44.5%), 1966 (+9.6),
1974 (44.7%), 1986 (+25.4%)
and 1998 (+23.6%)
But avoid tech stocks below
their 65-dma because of tax loss selling. Stay short
the weakest Bearish MINCPs.
In January, the beaten down techs should enjoy quite
a bounce.
There are some good reasons
for a rally now besides the statistics for Buy B2s and
B13s. Officials from
the FOMC will now be quiet for two weeks unless there is a
sudden market panic.
Perhaps, the war in the Ukraine will be more peaceful at this time
of the year. The
invader-in-chief, Vladimir Putin , is in more and more trouble at home
because of the great number
of Russian casualties. And now rumors are circulating
that he is seriously ill with
cancer, to the point where he fell down some stairs at his home.
Of course, an end to the war
would drop commodity and oil prices. The FED would
then have to pause its rate
hikes. Peace would make the market soar.
Watch GS and FAS closely.
Late Friday, Professionals stopped selling FAS (financials)
but were unwilling to move up
prices past its opening. That is what we should see for
the major ETFs before buying
them because of the Buy B2 at the 3% lower band.
Watch AAPL. It is at its lows
and could go either way.
It is likely we will get a
Peerless Buy B13 to show us that we should soon be seeing
a Santa Claus rally.
These Buys occur from December 17th through the 23rd and are
expected to bring a rally
into early January at the earliest. They do not occur after fresh
Sell S9s and are not allowed
more than a small percentage above the 21-day ma.
Number = 38
All were eventually profitable.
Gains of greater than 5% = 21
Paper losses of 2% or more = 5
19361217 B13
180.8
.048 175.9
-.0271 12/21
19811217 B13
870.53
.011 838.95
-.0362 12/21
19971217 B13/B9
7957.41 .154
7580.42 -.0473 1/9
19991217 B13
11257.43
.019 10997.9 -.023
1/4
20001218 B13
10645.42
.025 10318.9 -.0306
12/20
38 Past Buy B13 signals: 1928-2021
----------------------------------
Date Signal DJI Gain Paper Loss
19281218 B13 275.4 .135 none 0
19291220 B13 232.7 .074 perfect 0
19331219 B13 97.3 .138 perfect 0
19341217 B13 100.9 .031 99.6 -.0128 12/20
19351217 B13 140.6 .017 138.90 -.012 12/19
19361217 B13 180.8 .048 175.9 -.0271 12/21
19371228 B13 118.9 .084 perfect 0
19381220 B13 150.5 .026 149.6 -.0059 12/21
19391218 B13 149.2 .024 148.5 -.0046 12/27
19401217 B13 130.5 .011 128.4 -.016 12/23
19411222 B13 106.6 .044 106.3 -.0028 12/23
19441220 B13 150.6 .089 148.7 -.0126 12/27
19451217 B13 190.4 .046 189.1 -.0068 12/21
19481217 B13 175.9 .024 175.00 -.0051 1/3
19491220 B13 197.2 .119 196.4 -.004 12/21
19501218 B13 231.00 .122 229.7 -.0056 12/26
19571217 B13 425.7 .527 perfect 0
19611221 B13 720.1 .016 none 0
19621217 B13 645.5 .455 640.1 -.0083 12/18
19631224 B13 756.9 .240 none 0
19661221 B13 797.43 .096 785.69 -.015 12/30
19721218 B13 1013.25 .034 1000.00 -.013 12/21
19741217 B13 597.54 .447 none 0
19801217 B13 928.5 .048 none 0
19811217 B13 870.53 .011 838.95 -.0362 12/29
19861217 B13 1918.31 .254 1895.91 -.0116 12/31
19911217 B13 2902.28 .156 none 0
19951218 B13 5075.21 .093 5059.32 -.0031 12/20
19961217 B13 6308.33 .087 6268.35 -.0063 12/16
19971217 B13/B9 7957.41 .154 7580.42 -.0473 1/9
19981217 B13 8875.82 .236 none 0
19991217 B13 11257.43 .019 10997.9 -.023 1/4
20001218 B13 10645.42 .025 10318.9 -.0306 12/20
20081219 B13 8579.11 .044 8419.49 -.0186 12/23
20091217 B13 10308.26 .069 none 0
20111219 B13 11766.26 .115 perfect 0
20141217 B13 17356.87 .055 17164.9 -.011 1/30
20191218 B13 28239.28 .037 none 0
|
|
|
| |
Charts - 12/16/2022
2022 PEERLESS DJI, Signals, Indicators Daily DJI Volume
10-DayUp/Down Vol Stoch-20 CCI RSI Pct of All Stocks above 65-dma
Inverted Traders Index
DJI-IPA DJI-OBV BOND FUNDS
NASDAQ S&P OEX NYSE DJ-15 DJ-20 DJI-30
DIA QQQ SPY IWM new - COIN (Bit Coin ETF)
TNA Short-Term Rates Ten Year Rates PST (Short Treasuries)
DOLLAR-UUP
ALLSTOCKs
Russell-1000
Insurance-Stocks
Recent 2006 vers-Peerless signals
http://www.tigersoftware.com/NEWPEER/UPD81216.bmp
MDY - http://www.tigersoftware.com/CHARTX/MDY.GIF
USO-CrudeOil DBO FAS GLD HD IBB JETS JNUG KOL NAIL NUGT NRGU OIH
PALL RSX RETL SDS AGQ SLV SOXL TAN TECL TLT TMF TNA UGA USO
China: YINN
CHAU
Commodities: CANE
CORN DBC JJC, NIB CORN, CUT (paper)
MOO, NRGU
SOYB WEAT UUP (Dollar) LIT
(Lithium)
China: YINN
CHAU
Commodities: CANE
CORN DBC JJC, NIB CORN, CUT (paper)
MOO, NRGU
SOYB WEAT UUP (Dollar) LIT
(Lithium)
Stocks AA AAPL ADBE ALXN AMAT AMGN AMD AMZN AXP BA BABA
BAC BIDU BLDP CAT CHKP CNX CRM CVX CMG DE DIS ENPH FB FSLR
FTNT GILD GME GOOG GS HD IBM INTU JPM KO KR LRCX MRK MRNA
MOS MSFT NEM NFLX NKE NOC NUE NVDA PANW PG PYPL REGN REV
SO QCOM QDEL TSLA TXN XOM V VRTX WFC WMT XLE ZM ZOM
Leveraged Short ETFs:
FAZ - financials, TZA and SRTY- small caps, MZZ - mid caps, TECS -Techs,
SOXS -
semi-conductors LABD
- Biotechs
Bullish MAXCPs http://www.tigersoftware.com/UPPING/12-16/BULLISH.htm
Bearish MINCPs http://www.tigersoftware.com/Downing/12-16/BEARISH.htm |
|
 |
DIA
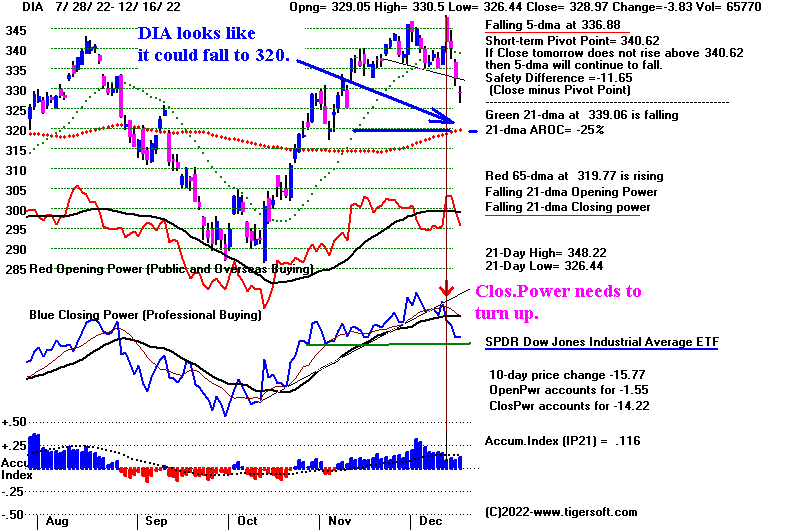 |
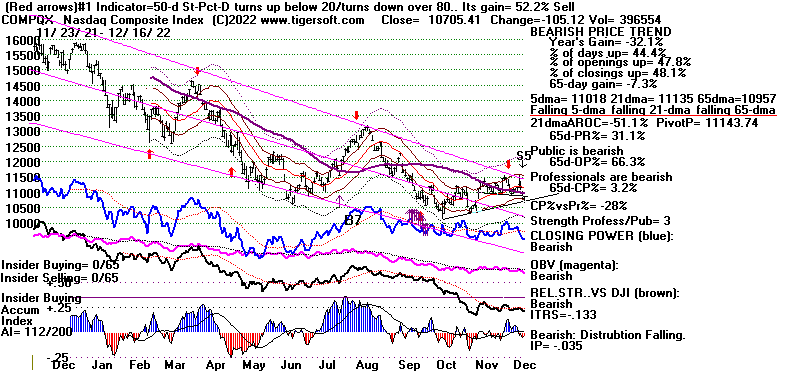 |
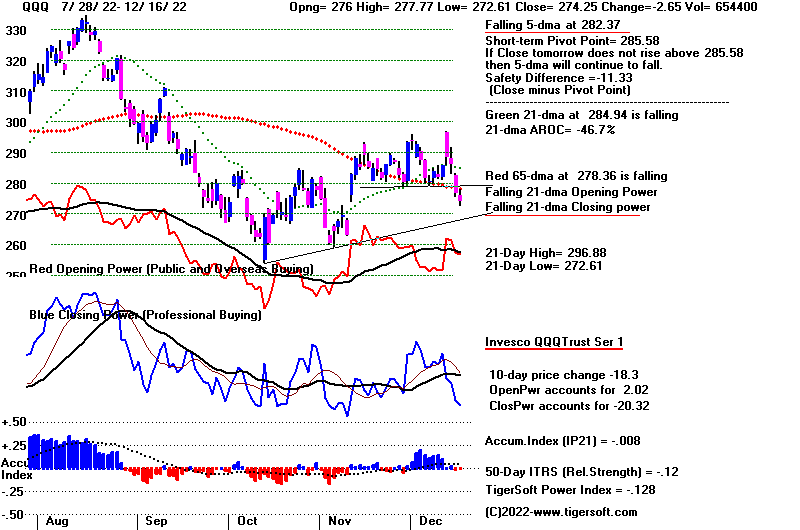 |
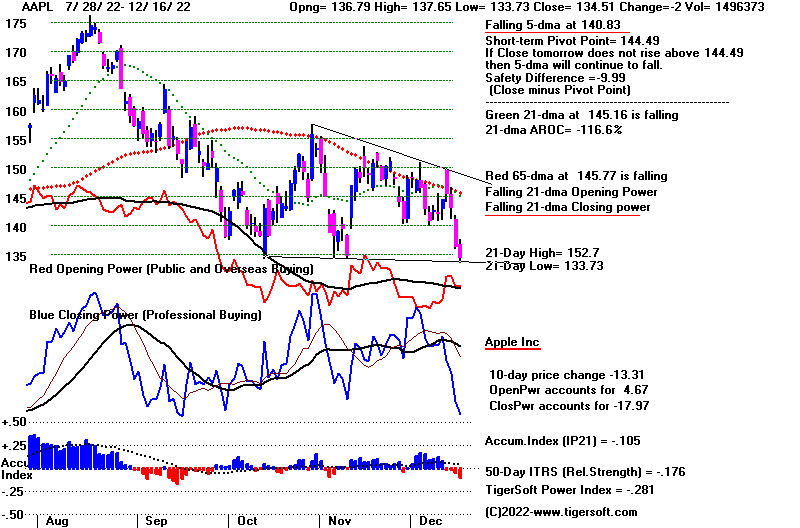 |
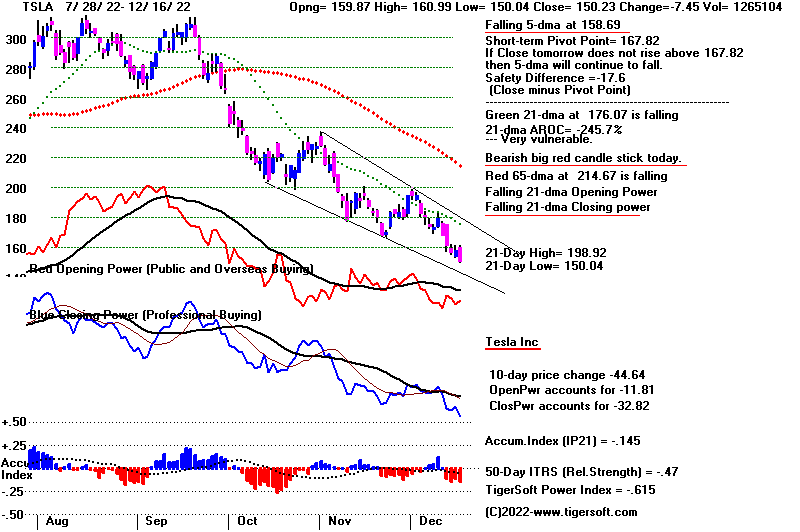 |
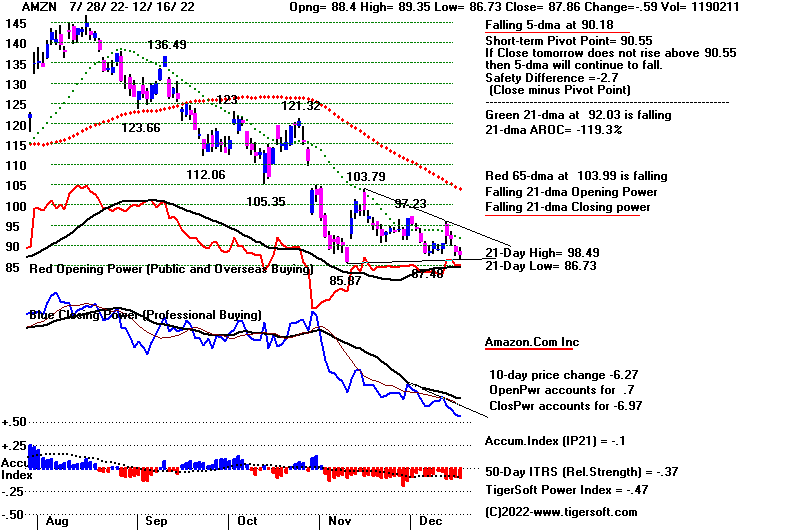 |
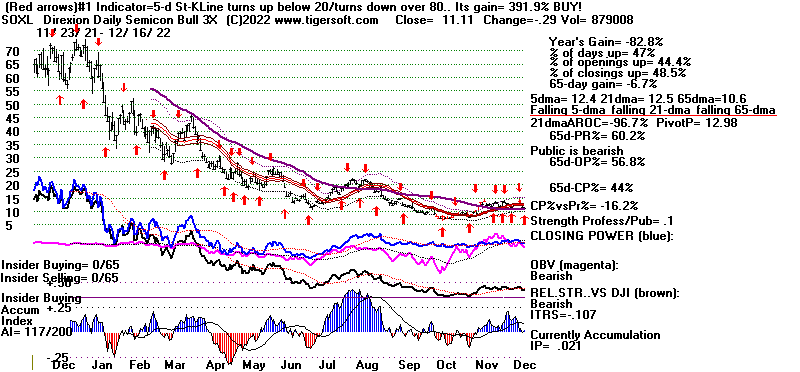 |
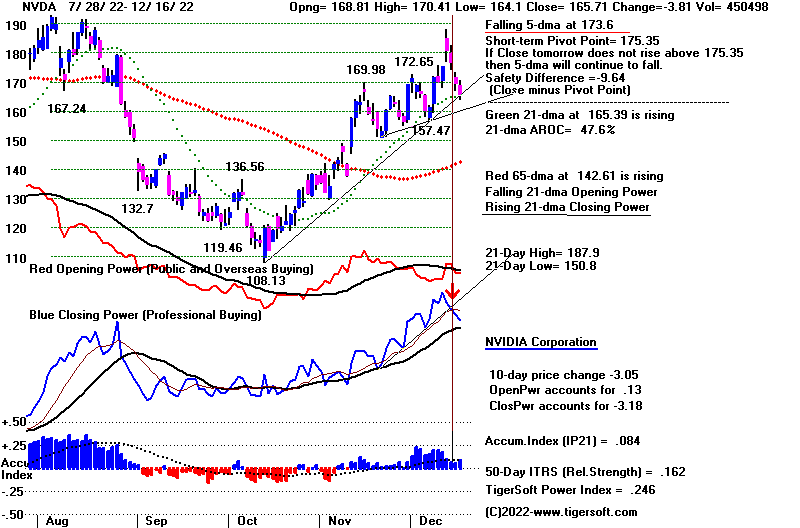
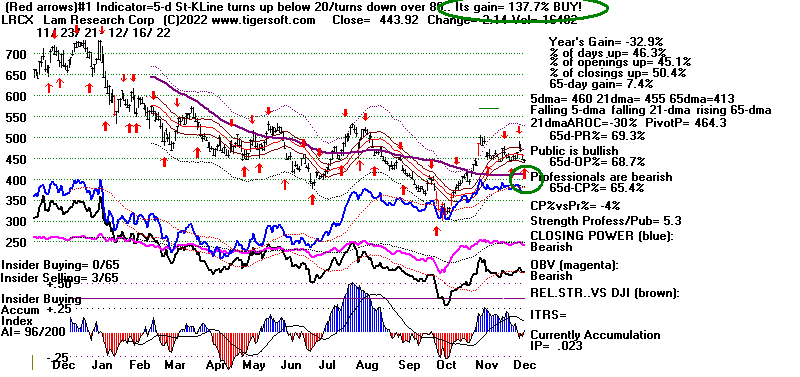 |
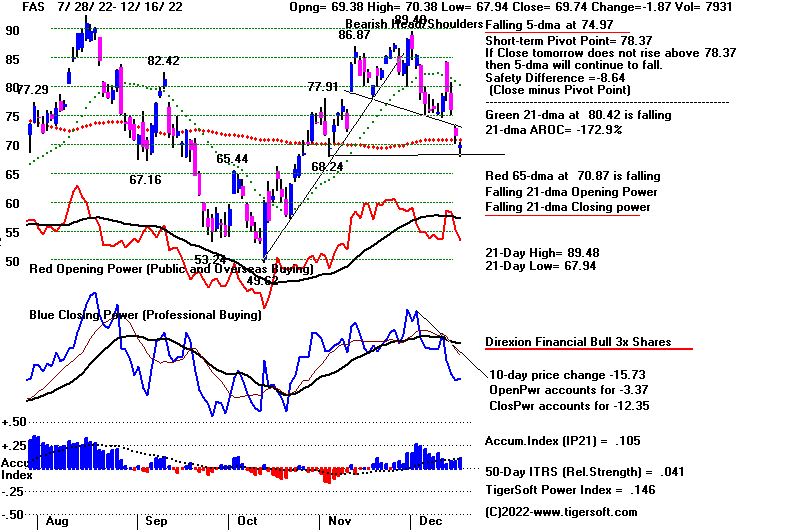 |
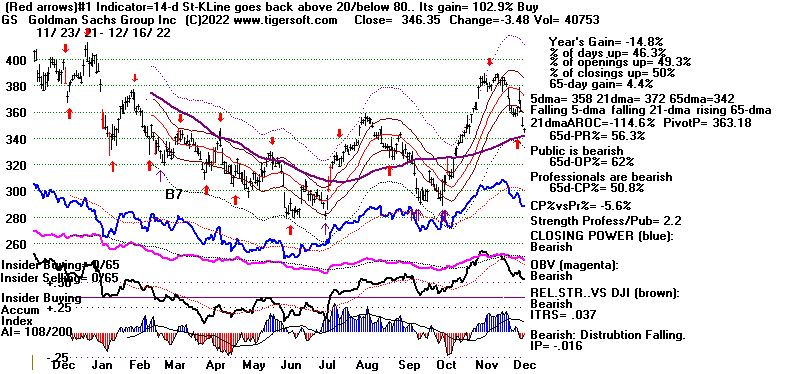 |
 |
12/16/2022
DJIA 32920.46 -281.76 -0.85
S&P 500 3852.36 -43.39 -1.11
Nasdaq 10705.41 -105.11 -0.97
New Highs 31 + 66 = 97
New lows 178 + 458 = 636
NYSE Latest Close Previous Close Week Ago
Issues traded 3,235 3,251 3,259
Advances 961 601 926
Declines 2,140 2,537 2,218
Unchanged 134 113 115
New highs 31 38 43
New lows 178 126 63
Adv. volume* 685,773,639 128,110,458 290,671,849
Decl. volume* 2,502,892,296 894,275,773 542,366,743
Total volume* 3,232,478,068 1,027,101,337 856,195,382
Closing Arms (TRIN)† 1.47 1.46 0.74
Block trades* 6,810 4,737 4,285
Adv. volume 1,723,890,611 620,626,713 1,367,914,713
Decl. volume 5,642,903,423 3,827,096,219 2,439,327,766
Total volume 7,493,668,747 4,493,905,168 3,888,263,390
NASDAQ Latest Close Previous Close Week Ago
Issues traded 4,817 4,888 4,810
Advances 1,722 1,223 1,654
Declines 2,851 3,419 2,863
Unchanged 244 246 293
New highs 66 84 68
New lows 458 376 248
Closing Arms (TRIN)† 1.39 0.70 0.90
Block trades 39,566 41,798 26,463
Adv. volume 2,386,956,275 1,866,445,174 1,649,364,351
Decl. volume 5,484,675,702 3,636,585,843 2,578,310,808
Total volume 7,968,178,089 5,536,073,488 4,337,449,69204,122
|
Table 2 QUICKSILVER on ETFS - 12/16/2022 ---
Bullish = 0
Bearish = 3 DBO, CORN, WEAT
ETF CLOSE CHANGE PIVOT-PT 5-dma AROC CL-PWR CANDLE IP21 ITRS POWER INDEX
================================================================================================
DIA 328.97 -3.83 340.62 -94.6% Bearish RED .117 ---- -------
---------------------------------------------------------------------------------------------
COMPQX 10705.41 -105.12 11143.74 -135.1% Bearish RED -.035 -.133 -.168
---------------------------------------------------------------------------------------------
SPY 383.27 -6.36 398.95 -126.2% Bearish RED .05 -.072 -.022
---------------------------------------------------------------------------------------------
QQQ 274.25 -2.64 285.58 -137.2% Bearish RED -.007 -.119 -.126
---------------------------------------------------------------------------------------------
MDY 440.03 -6.16 456.03 -122.3% Bearish BLUE .004 -.061 -.057
---------------------------------------------------------------------------------------------
IWM 174.37 -1.31 180.72 -118.5% Bearish BLUE -.054 -.096 -.15
---------------------------------------------------------------------------------------------
FAS 69.74 -1.86 78.37 -382.2% Bearish BLUE .105 .042 .147
---------------------------------------------------------------------------------------------
RETL 7.25 -.31 8.42 -642.9% Bearish RED .141 -.087 .054
---------------------------------------------------------------------------------------------
SOXL 11.11 -.29 12.98 -477.7% ------- RED .022 -.107 -.085
---------------------------------------------------------------------------------------------
TECL 23.9 -1.02 27.78 -402% ------- RED .049 -.158 -.109
---------------------------------------------------------------------------------------------
IBB 133 -1.24 134.06 -.4% ------- ---- .058 -.012 .046
---------------------------------------------------------------------------------------------
GLD 166.79 1.44 165.68 -8.1% Bearish BLUE 0 -.055 -.055
---------------------------------------------------------------------------------------------
DBO 14.34 -.22 14.45 58.5% Bearish BLUE -.084 -.255 -.339
---------------------------------------------------------------------------------------------
OIH 285.93 -4.69 282.58 262.9% Bearish BLUE .1 .05 .15
---------------------------------------------------------------------------------------------
CPER 22.78 -.01 23.03 -97.3% Bearish BLUE -.218 .002 -.216
---------------------------------------------------------------------------------------------
TAN 78.43 -1.81 79.46 -11.8% ------- RED -.05 -.027 -.077
---------------------------------------------------------------------------------------------
UUP 28.31 .05 28.38 -8.9% Bullish ---- .022 -.161 -.139
---------------------------------------------------------------------------------------------
CORN 26.06 .03 26.06 61.7% Bullish BLUE -.161 -.137 -.298
---------------------------------------------------------------------------------------------
WEAT 7.65 .01 7.64 131.9% Bearish ---- -.25 -.241 -.491
---------------------------------------------------------------------------------------------
YINN 45.85 .27 46.57 -257.8% ------- RED -.027 -.103 -.13
|
Table 3 RANKING OF KEY DIRECTORIES BASED PCT.OF STOCKS ABOVE 65-DMA
12/16/22
Bullish = 33
Bearish = 11
---------------------------------------------------------------------------------------
Directory Current day-1 day-2 day-3 day-4 day-5
----------------------------------------------------------------------------------------
COPPER 1 1 1 1 1 1
HOMEBLDG .888 .888 .888 .888 .888 .888
BONDFUND .85 .85 .885 .885 .885 .885
INFRA .818 .848 .878 .878 .878 .878
UTILITY .815 .815 .815 .815 .815 .842
BEVERAGE .785 .857 .857 1 .928 1
ETFS .781 .781 .836 .854 .854 .836
DJI-13 .769 .923 .923 .923 .923 .846
GOLD .76 .739 .826 .869 .804 .826
DOWJONES .733 .833 .866 .866 .866 .833
------
INSURANC .72 .72 .76 .8 .76 .76
CHINA .7 .68 .68 .66 .62 .64
EDU .666 .666 .666 .666 .666 .833
SEMI .652 .684 .768 .768 .757 .736
SP-100 .644 .755 .822 .822 .8 .755
SP500 .634 .692 .779 .793 .804 .759
-----
ELECTRON .631 .661 .729 .736 .729 .714
SOLAR .625 .75 .687 .625 .5 .437
MILITARY .615 .692 .73 .73 .807 .73
CHEM .608 .652 .739 .717 .739 .739
HIGHPRIC .607 .672 .814 .818 .793 .754
FIDSTKS .603 .656 .757 .763 .775 .704
RUS-1000 .585 .628 .725 .741 .729 .69
-----
GAMING .578 .578 .578 .684 .631 .578
TRANSP .578 .578 .684 .684 .789 .684
BIGBANKS .571 .571 .714 .714 .714 .571
NASD-100 .57 .6 .71 .75 .74 .69
-----
COMODITY .564 .564 .589 .615 .589 .589
INDMATER .555 .597 .708 .694 .694 .708
INDEXES .551 .648 .772 .8 .767 .718
REIT .546 .669 .707 .738 .692 .692
JETS .538 .538 .692 .692 .769 .692
FOOD .51 .489 .53 .551 .51 .51
=================================================================================================
COAL .5 .666 .5 .666 .666 .666
COMPUTER .5 .55 .65 .65 .65 .65
GREEN .5 .666 .666 .666 .611 .555
HOSPITAL .5 .428 .5 .5 .428 .357
NIFTY .5 .522 .704 .772 .727 .613
------------------------------------------------------------------------------------------------
AUTO .49 .547 .641 .698 .679 .679
RETAIL .489 .553 .659 .638 .638 .659
SOFTWARE .482 .535 .625 .66 .589 .571
HACKERS .437 .5 .5 .5 .5 .5
FINANCE .412 .475 .537 .625 .675 .662
BIOTECH .385 .396 .44 .432 .418 .399
OILGAS .38 .457 .457 .504 .438 .361
LOWPRICE .31 .31 .31 .322 .313 .296
MARIJUAN .3 .3 .4 .5 .6 .5
GUNS .285 .357 .642 .714 .714 .714
REGBANKS .24 .24 .36 .48 .56 .48
|
====================================================================================
Friday
- 5:50 AM - Futures: DJI -384 NASDAQ
-78 Data Used: 12/15/2022
| |
12/15/2022
DJIA 33202.22 -764.13 -2.25%
Nasdaq 10810.53 -360.36 -3.23%
S&P 500 3895.75 -99.57 -2.49%
New Highs 38 + 84 = 118
New Lows 126 +376 = 502
|
|
| |
Professional selling is too pronounced to buy
yet. Stay hedged with Bearish MINCPs.
The 20% rally that the Professionals rigged on low volume in
October and November
is now being giving up without a fight. The trend was the
bull's friend. But once broken,
the Professionals' computerized buy programs have been put in
reverse. Now the Closing
Power trends are clearly down for DIA, NASDAQ, SPY, QQQ and FAS
(financials)
It remains to be seen if December's normally bullish seasonality
will be strong enough
to bring a reversal back up. Today the DJI fell almost to
its its 3% lower band. This
generated a Peerless Buy B2. But it is seasonally
determined. Had a similar decline
occurred in November, there would have been no Buy B2.
In three days the DJI has fallen from its 3% upper band (actually
just below that level)
to almost its 3% lower band. This is a remarkably quick
decline. Such sudden drops
from the upper 3% to the lower 3% band have been seen 22 times in
the past since
late 1928. In 15 cases, more than 2/3 of the time, a bottom
was soon reached and
the DJI bounced back to its 2.5% upper band, at least. But
in 7 cases, the DJI kept
failling. The odds of a profitable recovery are only 60% if
we look at the five instances
since the year 2000. There were 3 bouce-backs in 2000, but
there were much deeper
declines in these rapid sell-offs to the lower band in
November 2008 and in December
2018 (when the FED was busy raising rates until President Trump
stopped the tightening
just before Christmas. If we compare the two
Presidents' styles, I would have to say
Biden, being the more cautious, will not challenge the FED.
So, we have to very careful.
The best way to learn if and when the FED will be stepping back
from its declared plan
to raise rates above 5% in 2023, is for us to watch our
Closing Powers, for the big ETFs
and for FAS and GS, in particular. Right now they are
in clear down-trends. Professionals
do not expect any FED moderation even if a recession
results.
I've talked about the bearish pressure especially in beaten-down
big techs like
TSLA, AMZN and GOOG. But the same pressures are at work in
AAPL, too.
This force may not ease up until the new year actually starts.
This explains why the
QQQ and NASDAQ are under-perfoming the DJI by more than 10% over
the
last 50-trading days and are close to making new yearly
lows.
The price breakdowns below recent flat support generated
TigerSoft S5 Sells in
the NASDAQ and NYSE. The trend-breaks, top-formations,
Closing Power
trend-breaks and consolidation pattern breakdowns after a rise
for two months
now looks a lot like what happend in August. We will be
lucky if the DJI pulls
back only 50% of its October-November gain, it seems. So,
we need to see
signs that Professionals are changing their minds again. We
need to see the
Closing Powers hook back up. I would wait to buy
until next week when
the December seasonality is most apt to works its magic on the
market. |
|
| |
Charts - 12/15/2022
2022 PEERLESS DJI, Signals, Indicators Daily DJI Volume
10-DayUp/Down Vol Stoch-20 CCI RSI Pct of All Stocks above 65-dma
Inverted Traders Index
DJI-IPA DJI-OBV BOND FUNDS
NASDAQ S&P OEX NYSE DJ-15 DJ-20 DJI-30
DIA QQQ SPY IWM new - COIN (Bit Coin ETF)
TNA Short-Term Rates Ten Year Rates PST (Short Treasuries)
DOLLAR-UUP
ALLSTOCKs
Russell-1000
Insurance-Stocks
Recent 2006 vers-Peerless signals
http://www.tigersoftware.com/NEWPEER/UPD81215.bmp
MDY - http://www.tigersoftware.com/CHARTX/MDY.GIF
USO-CrudeOil DBO FAS GLD HD IBB JETS JNUG KOL NAIL NUGT NRGU OIH
PALL RSX RETL SDS AGQ SLV SOXL TAN TECL TLT TMF TNA UGA USO
China: YINN
CHAU
Commodities: CANE
CORN DBC JJC, NIB CORN, CUT (paper)
MOO, NRGU
SOYB WEAT UUP (Dollar) LIT
(Lithium)
China: YINN
CHAU
Commodities: CANE
CORN DBC JJC, NIB CORN, CUT (paper)
MOO, NRGU
SOYB WEAT UUP (Dollar) LIT
(Lithium)
Stocks AA AAPL ADBE ALXN AMAT AMGN AMD AMZN AXP BA BABA
BAC BIDU BLDP CAT CHKP CNX CRM CVX CMG DE DIS ENPH FB FSLR
FTNT GILD GME GOOG GS HD IBM INTU JPM KO KR LRCX MRK MRNA
MOS MSFT NEM NFLX NKE NOC NUE NVDA PANW PG PYPL REGN REV
SO QCOM QDEL TSLA TXN XOM V VRTX WFC WMT XLE ZM ZOM
Leveraged Short ETFs:
FAZ - financials, TZA and SRTY- small caps, MZZ - mid caps, TECS -Techs,
SOXS -
semi-conductors LABD
- Biotechs
Bullish MAXCPs http://www.tigersoftware.com/UPPING/12-15/BULLISH.htm
Bearish MINCPs http://www.tigersoftware.com/Downing/12-15/BEARISH.htm |
|
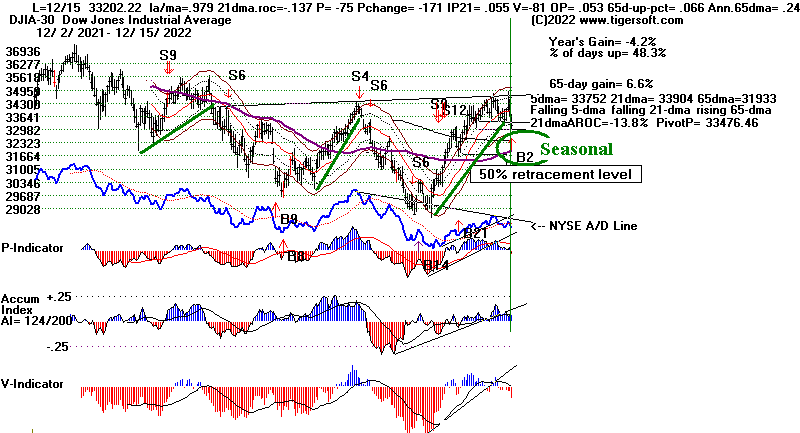
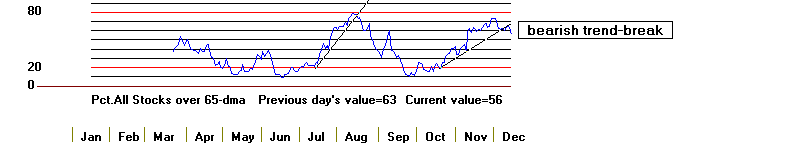 |
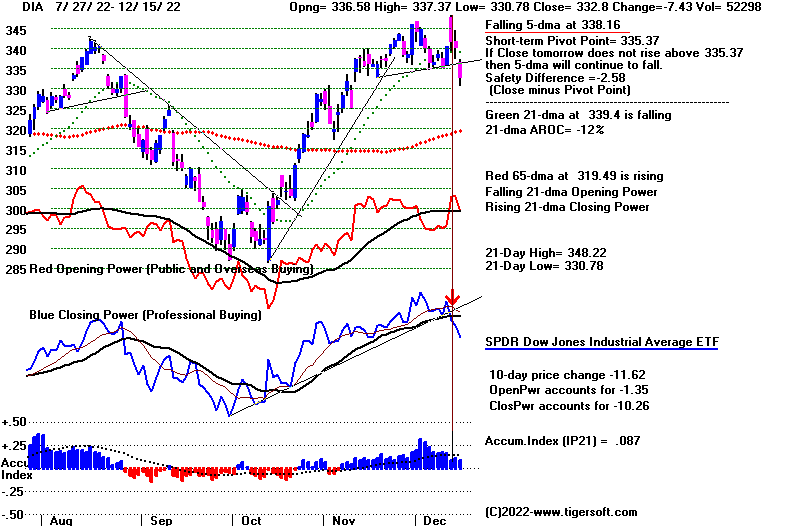 |
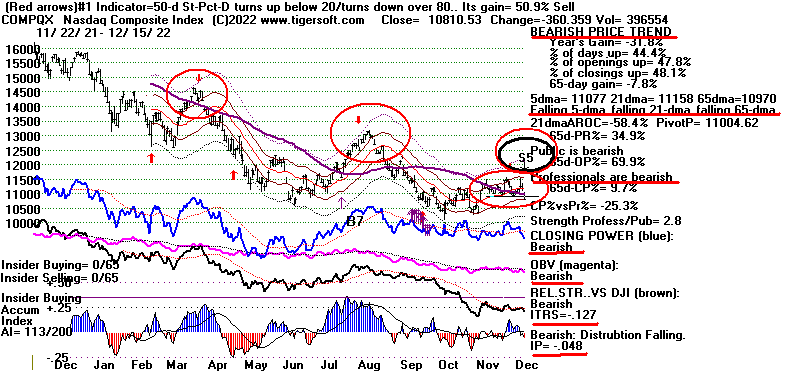 |
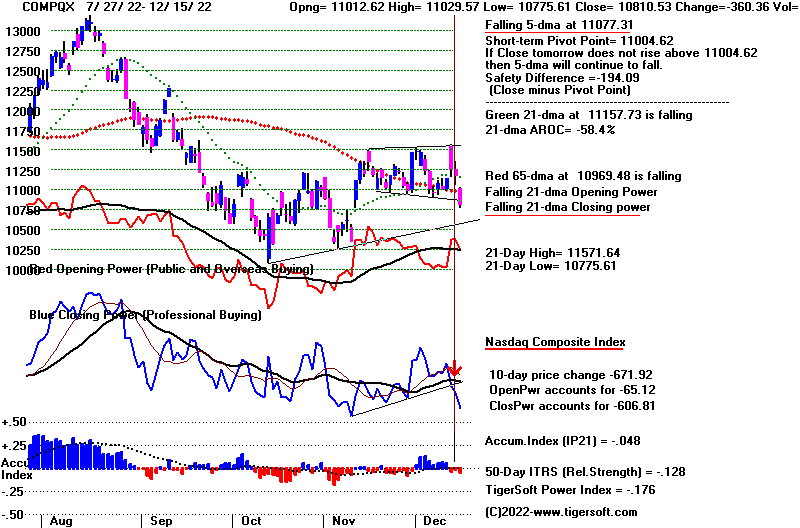 |
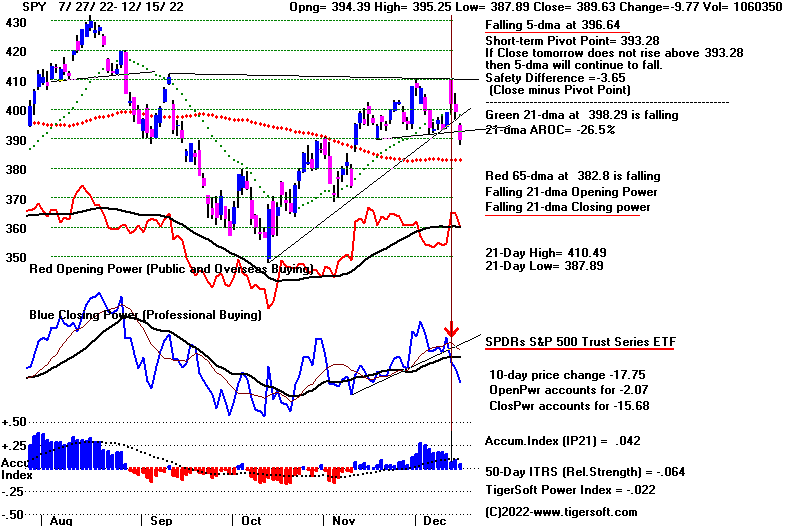 |
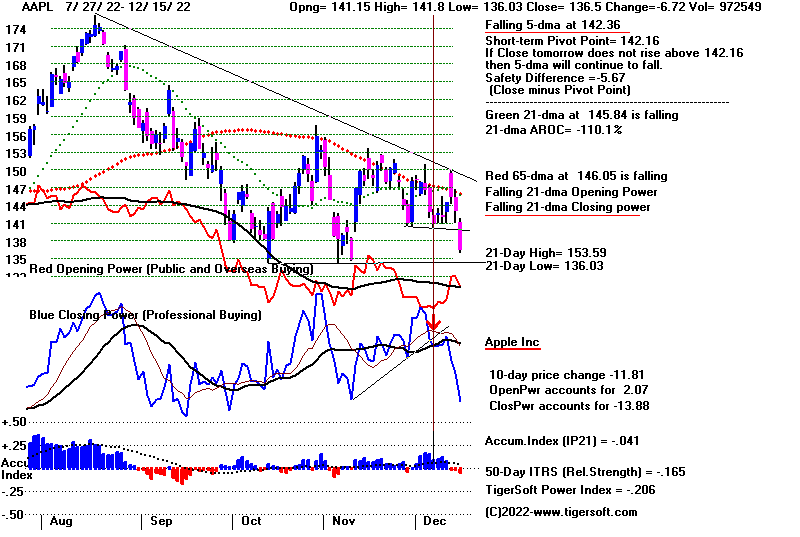 |
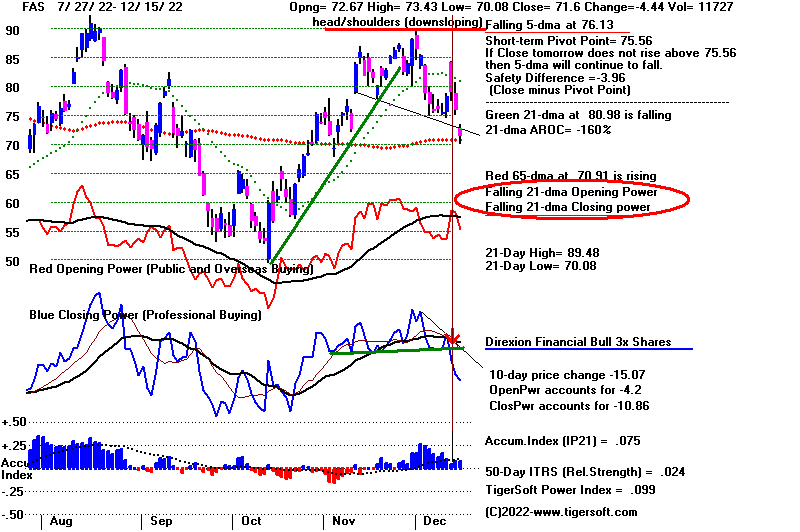 |
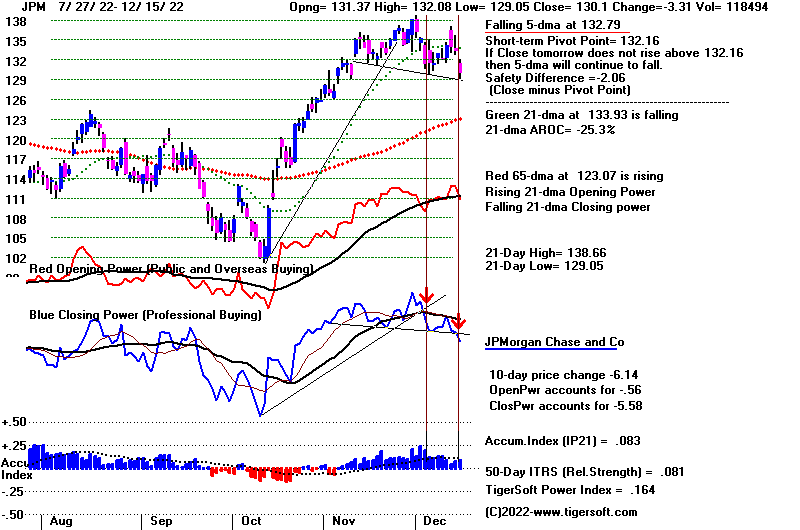 |
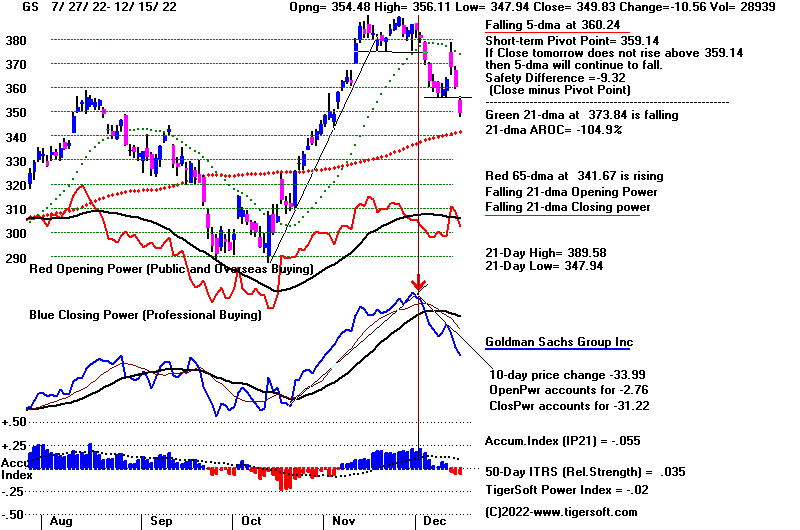 |
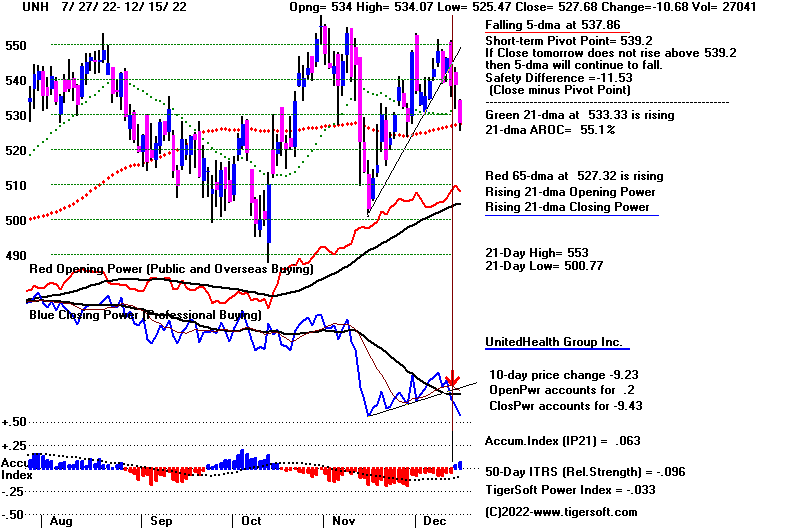 |
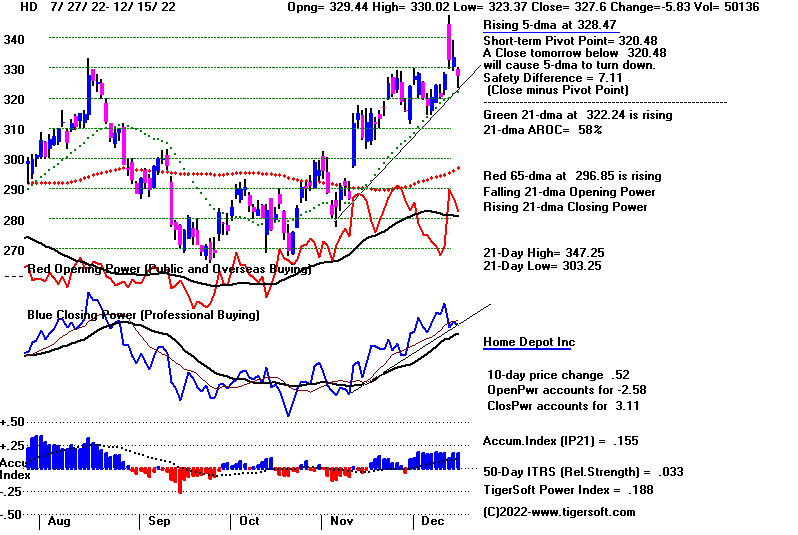 |
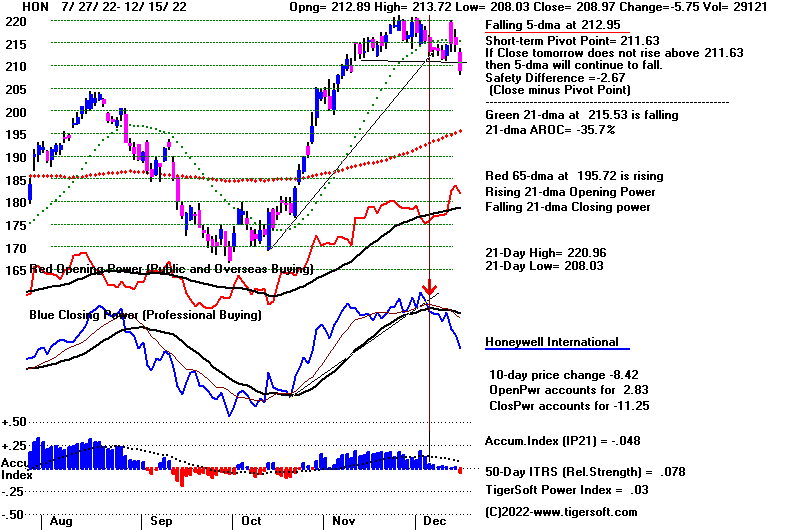 |
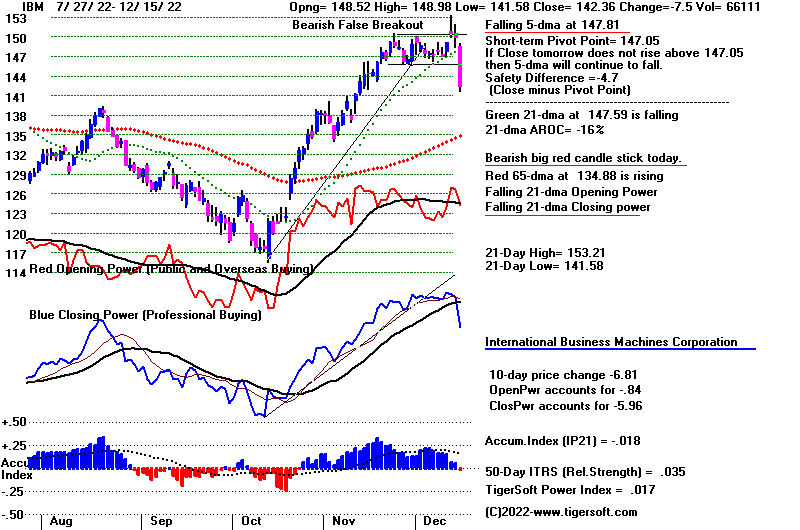 |
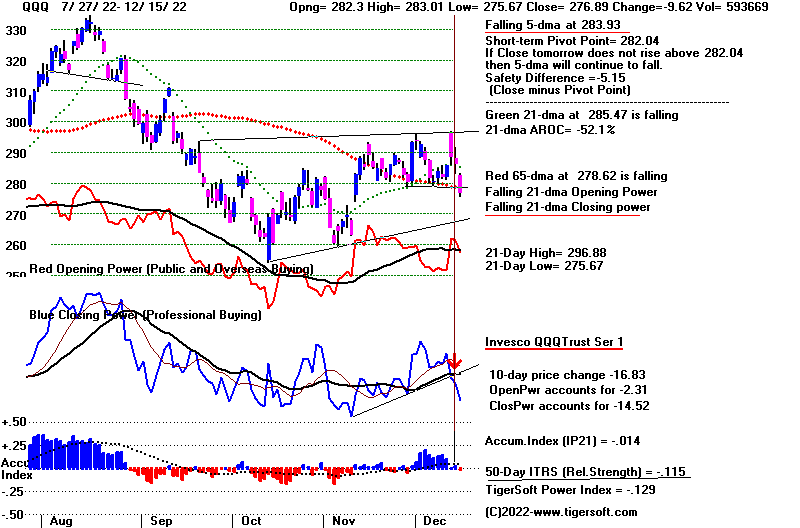 |
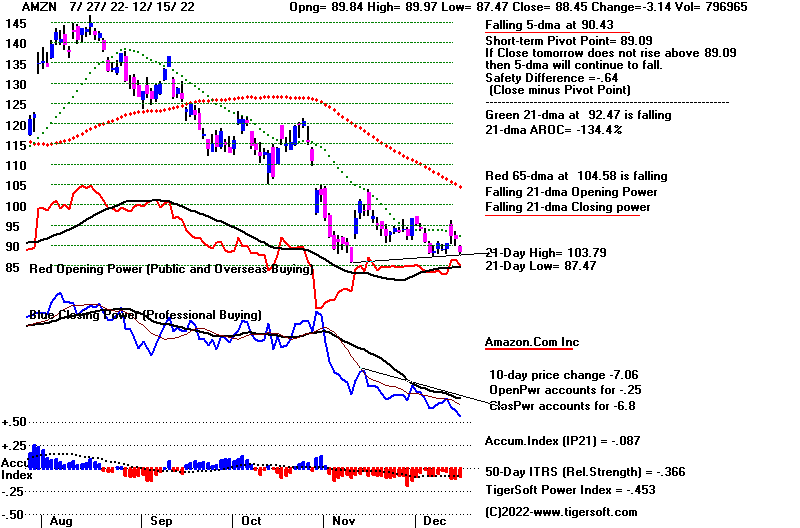 |
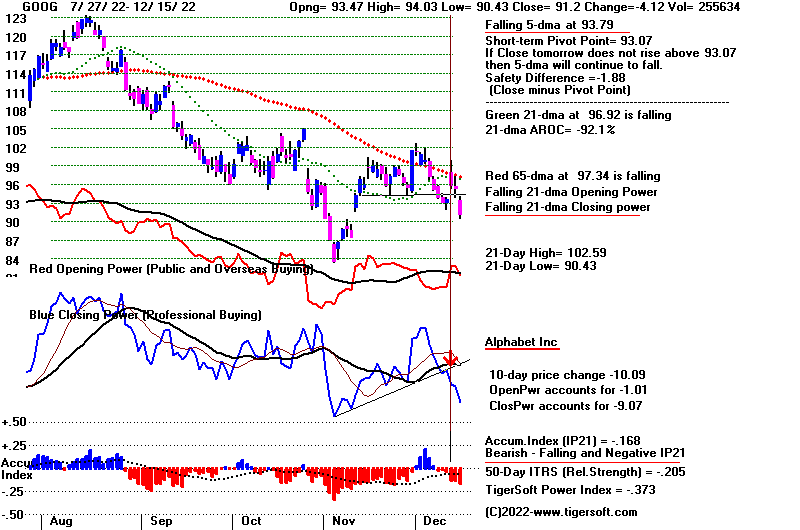 |
| |
Table 1 - Breadth Statistics 12/15/2022
DJIA 33202.22 -764.13 -2.25%
Nasdaq 10810.53 -360.36 -3.23%
S&P 500 3895.75 -99.57 -2.49%
NYSE Latest Close Previous Close Week Ago
Issues traded 3,251 3,232 3,265
Advances 601 1,305 1,740
Declines 2,537 1,791 1,378
Unchanged 113 136 147
New highs 38 46 49
New lows 126 92 71
Adv. volume* 128,110,458 355,745,190 525,424,510
Decl. volume* 894,275,773 652,701,600 296,374,694
Total volume* 1,027,101,337 1,048,650,485 832,537,532
Closing Arms (TRIN)† 1.46 1.23 0.73
Block trades* 4,737 5,082 4,431
Adv. volume 620,626,713 1,591,863,489 2,508,355,349
Decl. volume 3,827,096,219 2,688,945,274 1,451,504,672
Total volume 4,493,905,168 4,472,347,259 4,006,900,432
NASDAQ Latest Close Previous Close Week Ago
Issues traded 4,888 4,848 4,869
Advances 1,223 1,897 2,661
Declines 3,419 2,695 1,926
Unchanged 246 256 282
New highs 84 99 111
New lows 376 246 254
Closing Arms (TRIN)† 0.70 0.86 0.80
Block trades 41,798 38,770 26,060
Adv. volume 1,866,445,174 2,444,828,872 2,683,696,562
Decl. volume 3,636,585,843 2,988,509,212 1,546,354,819
Total volume 5,536,073,488 5,485,155,915 4,281,804,122
|
Table 2 QUICKSILVER on ETFS - 12/15/2022 ---
Bullish = 0
Bearish = 4 DBO,CPER, CORN, WEAT
ETF CLOSE CHANGE PIVOT-PT 5-dma AROC CL-PWR CANDLE IP21 ITRS POWER INDEX
================================================================================================
DIA 332.8 -7.42 335.37 -83.4% ------- RED .088 ----- ----
---------------------------------------------------------------------------------------------
COMPQX 10810.53 -360.36 11004.62 -121.9% Bearish RED -.047 -.129 -.176
---------------------------------------------------------------------------------------------
SPY 389.63 -9.77 393.28 -83% Bearish RED .042 -.066 -.024
---------------------------------------------------------------------------------------------
QQQ 276.89 -9.62 282.04 -122% Bearish RED -.014 -.117 -.131
---------------------------------------------------------------------------------------------
MDY 446.19 -10.37 451.13 -108.7% Bearish RED -.028 -.055 -.083
---------------------------------------------------------------------------------------------
IWM 175.68 -4.51 178.62 -143.1% Bearish RED -.119 -.094 -.213
---------------------------------------------------------------------------------------------
FAS 71.6 -4.43 75.56 -300.4% Bearish RED .076 .022 .098
---------------------------------------------------------------------------------------------
RETL 7.56 -.71 8.3 -702.2% Bearish RED .093 -.063 .03
---------------------------------------------------------------------------------------------
SOXL 11.4 -1.6 12.32 -472.5% Bearish RED -.004 -.101 -.105
---------------------------------------------------------------------------------------------
TECL 24.92 -3.13 26.08 -307.8% ------- RED .051 -.142 -.091
---------------------------------------------------------------------------------------------
IBB 134.24 -2.49 133.01 -61% ------- RED .028 -.007 .021
---------------------------------------------------------------------------------------------
GLD 165.35 -2.75 167.06 -33.5% Bearish RED -.05 -.064 -.114
---------------------------------------------------------------------------------------------
DBO 14.56 -.28 14.17 155.8% Bearish RED -.076 -.229 -.305
---------------------------------------------------------------------------------------------
OIH 290.62 -2.08 270.88 126.2% Bearish BLUE .046 .085 .131
---------------------------------------------------------------------------------------------
CPER 22.79 -.51 23.23 -137.7% Bearish RED -.229 -.033 -.262
---------------------------------------------------------------------------------------------
TAN 80.24 -2.49 78.62 71.7% ------- RED -.073 -.033 -.106
---------------------------------------------------------------------------------------------
UUP 28.26 .26 28.36 -7.1% Bullish BLUE -.029 -.153 -.182
---------------------------------------------------------------------------------------------
CORN 26.03 .06 25.74 67.6% Bullish BLUE -.189 -.146 -.335
---------------------------------------------------------------------------------------------
WEAT 7.64 .05 7.45 52.9% Bearish ---- -.246 -.26 -.506
---------------------------------------------------------------------------------------------
YINN 45.58 -3.48 48.3 -356.8% Bearish RED -.019 -.135 -.154
|
Table 3 RANKING OF KEY DIRECTORIES BASED PCT.OF STOCKS ABOVE 65-DMA
12/15/22
Bullish = 39
Bearish = 9
---------------------------------------------------------------------------------------
Directory Current day-1 day-2 day-3 day-4 day-5
----------------------------------------------------------------------------------------
COPPER 1 1 1 1 1 1
DJI-13 .923 .923 .923 .923 .846 .923
HOMEBLDG .888 .888 .888 .888 .888 .888
BEVERAGE .857 .857 1 .928 1 1
BONDFUND .85 .885 .885 .885 .873 .896
INFRA .848 .878 .878 .878 .878 .878
DOWJONES .833 .866 .866 .866 .833 .866
=====
UTILITY .815 .815 .815 .815 .842 .868
ETFS .781 .836 .854 .854 .854 .836
SP-100 .755 .822 .822 .8 .755 .777
SOLAR .75 .687 .625 .5 .437 .437
GOLD .739 .826 .869 .804 .826 .847
INSURANC .72 .76 .8 .76 .72 .8
MILITARY .692 .73 .73 .807 .73 .73
SP500 .692 .779 .793 .8 .759 .771
=====
SEMI .684 .768 .768 .757 .736 .768
CHINA .68 .68 .66 .62 .64 .64
HIGHPRIC .672 .814 .818 .793 .745 .775
REIT .669 .7 .746 .7 .676 .692
COAL .666 .5 .666 .666 .5 .5
EDU .666 .666 .666 .666 .666 .833
GREEN .666 .666 .666 .611 .555 .555
ELECTRON .661 .729 .736 .729 .714 .736
FIDSTKS .656 .757 .763 .775 .692 .751
CHEM .652 .739 .739 .717 .76 .782
INDEXES .648 .772 .8 .767 .718 .751
RUS-1000 .628 .725 .741 .729 .685 .703
NASD-100 .6 .71 .75 .74 .68 .74
=====
INDMATER .597 .708 .694 .694 .694 .708
GAMING .578 .578 .631 .684 .578 .631
TRANSP .578 .684 .684 .789 .684 .684
BIGBANKS .571 .714 .714 .714 .571 .571
COMODITY .564 .589 .589 .589 .589 .589
RETAIL .553 .659 .638 .638 .659 .723
COMPUTER .55 .65 .65 .65 .6 .6
AUTO .547 .641 .698 .679 .679 .698
JETS .538 .692 .692 .769 .692 .692
SOFTWARE .535 .642 .66 .589 .571 .607
NIFTY .522 .704 .772 .727 .613 .704
===================================================================================================
HACKERS .5 .5 .5 .5 .5 .5
===================================================================================================
FOOD .489 .53 .53 .51 .51 .51
FINANCE .475 .537 .625 .662 .662 .612
OILGAS .457 .457 .504 .438 .361 .428
HOSPITAL .428 .5 .5 .428 .357 .428
BIOTECH .396 .438 .435 .418 .393 .424
GUNS .357 .642 .714 .714 .714 .714
LOWPRICE .31 .313 .324 .313 .291 .294
MARIJUAN .3 .4 .5 .6 .5 .6
REGBANKS .24 .36 .48 .56 .48 .48
|
====================================================================================
Thursday
- 6:00 AM - Futures: DJI -390 NASDAQ
-203 Data Used: 12/14/2022
| |
12/14/2022
Last
Chg %Chg
DJIA 33966.35 -142.29 -0.42%
S&P 500 3995.32 -24.33 -0.61%
Nasdaq 11170.89 -85.93 -0.7% |
|
| |
Watch the Closing Powers now. Professionals pumped the market
up, now
they are taking it down using selling at the openings, too.
That the
market would sell off after such classicly bearish red "popsicles"
and
failures to surpass the various resistance points in the DJI, SPY,
NASDAQ and
QQQ should not come as a surpise. Especially, when
FED is
trying to scare the market by talking about 5% rates at some point
next year.
But the amount of Professional selling as evidenced by the
falling
Closing Powers shown in almost all the biggest companies' stocks
will be of
concern if it continues, especially with the DJI down 1%+ already
in the
futures market.
The bullish
seasonality in the second half of December should produce
a Buy B13
to start a Santa Claus rally next week. As reliable as they
are, I
would still want to see the Closing Powers reverse after a successful
test of the
recent lows. Let's also see if we can't get a Red Buy signal
from SPY's
5-day stochastic. The tax loss selling in the tech giants,
TSLA, AMZN
and GOOG, is apt to be merciless as the year comes
to an end.
Also bearish for now are the falling Closing Powers for
the
financials' ETF, FAS along with GS and JPM in the DJI-30.
I expect
MSFT, HD and NVDA to be able to hold up well unless
the DJI
plunges below its support at 33440. The weakest bearish
MINCPs are
apt to remain weak until the end of the year. Stay short
some of
these.
|
|
| |
Charts - 12/14/2022
2022 PEERLESS DJI, Signals, Indicators Daily DJI Volume
10-DayUp/Down Vol Stoch-20 CCI RSI Pct of All Stocks above 65-dma
Inverted Traders Index
DJI-IPA DJI-OBV BOND FUNDS
NASDAQ S&P OEX NYSE DJ-15 DJ-20 DJI-30
DIA QQQ SPY IWM new - COIN (Bit Coin ETF)
TNA Short-Term Rates Ten Year Rates PST (Short Treasuries)
DOLLAR-UUP
ALLSTOCKs
Russell-1000
Insurance-Stocks
Recent 2006 vers-Peerless signals
http://www.tigersoftware.com/NEWPEER/UPD81214.bmp
MDY - http://www.tigersoftware.com/CHARTX/MDY.GIF
USO-CrudeOil DBO FAS GLD HD IBB JETS JNUG KOL NAIL NUGT NRGU OIH
PALL RSX RETL SDS AGQ SLV SOXL TAN TECL TLT TMF TNA UGA USO
China: YINN
CHAU
Commodities: CANE
CORN DBC JJC, NIB CORN, CUT (paper)
MOO, NRGU
SOYB WEAT UUP (Dollar) LIT
(Lithium)
China: YINN
CHAU
Commodities: CANE
CORN DBC JJC, NIB CORN, CUT (paper)
MOO, NRGU
SOYB WEAT UUP (Dollar) LIT
(Lithium)
Stocks AA AAPL ADBE ALXN AMAT AMGN AMD AMZN AXP BA BABA
BAC BIDU BLDP CAT CHKP CNX CRM CVX CMG DE DIS ENPH FB FSLR
FTNT GILD GME GOOG GS HD IBM INTU JPM KO KR LRCX MRK MRNA
MOS MSFT NEM NFLX NKE NOC NUE NVDA PANW PG PYPL REGN REV
SO QCOM QDEL TSLA TXN XOM V VRTX WFC WMT XLE ZM ZOM
Leveraged Short ETFs:
FAZ - financials, TZA and SRTY- small caps, MZZ - mid caps, TECS -Techs,
SOXS -
semi-conductors LABD
- Biotechs
Bullish MAXCPs http://www.tigersoftware.com/UPPING/12-14/BULLISH.htm
Bearish MINCPs http://www.tigersoftware.com/Downing/12-14/BEARISH.htm |
|
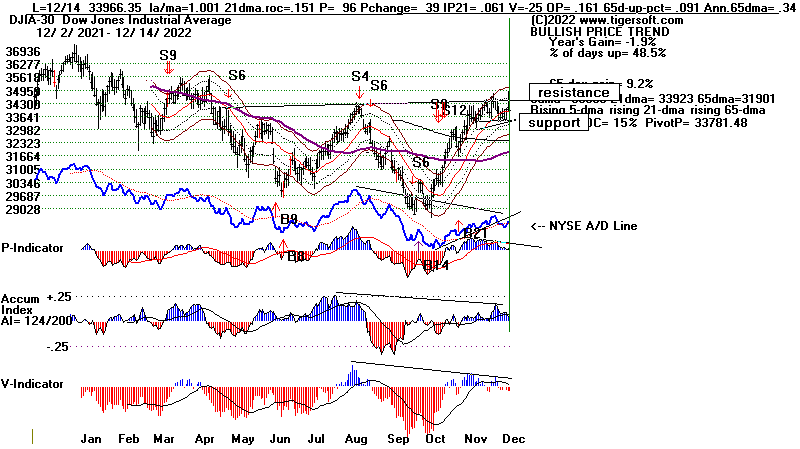 |
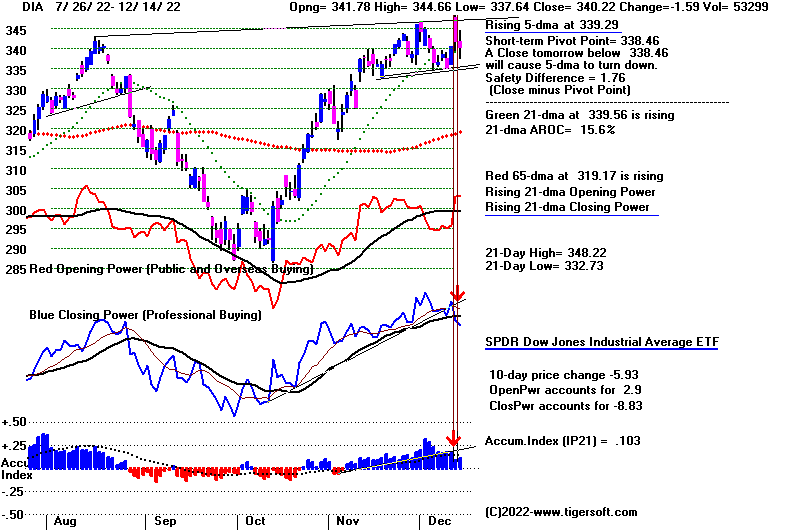 |
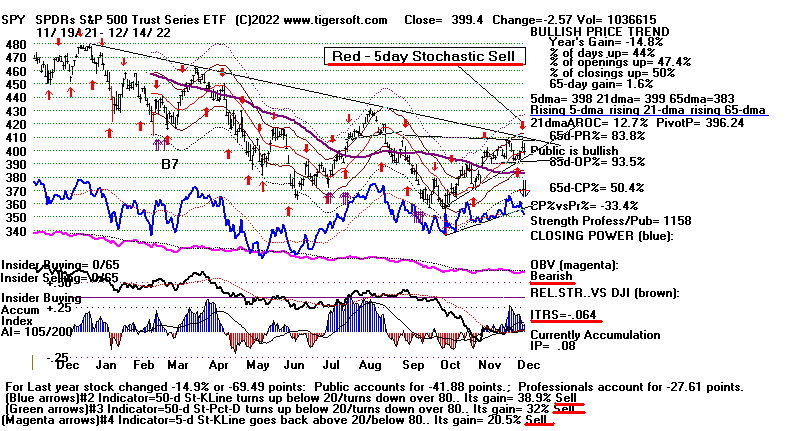 |
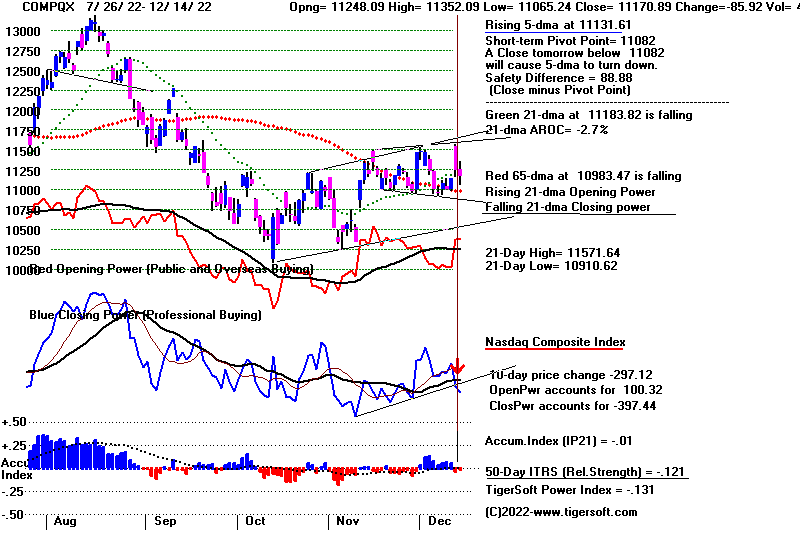 |
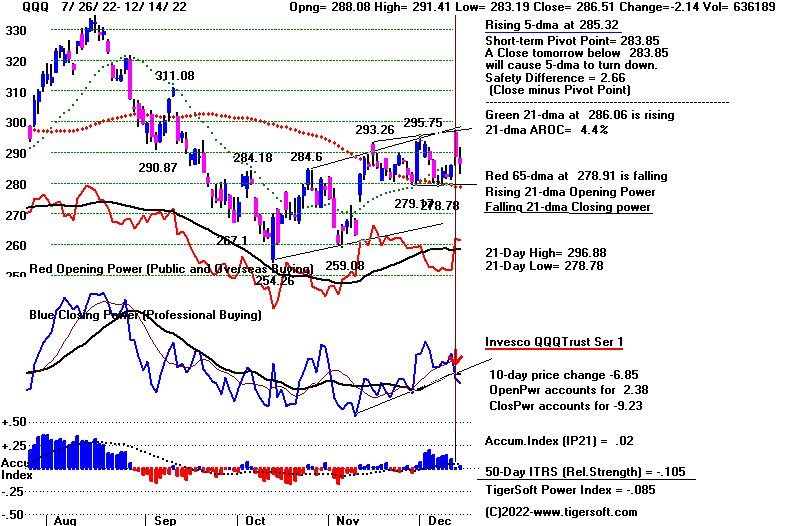 |
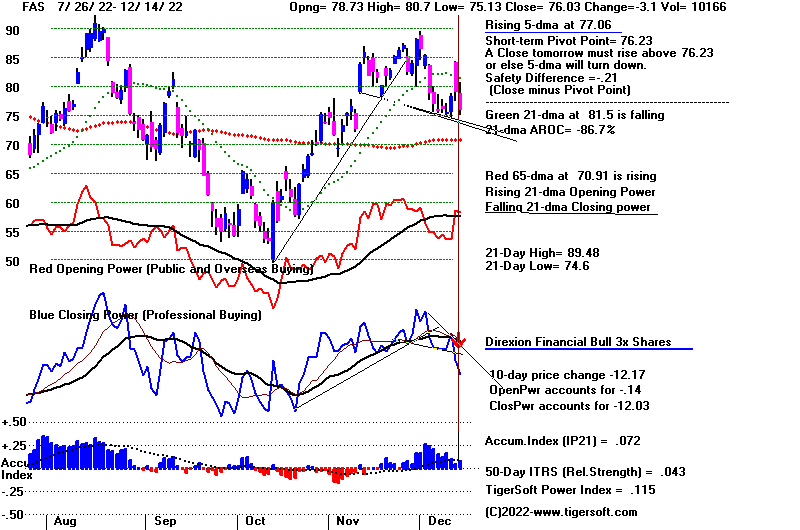 |
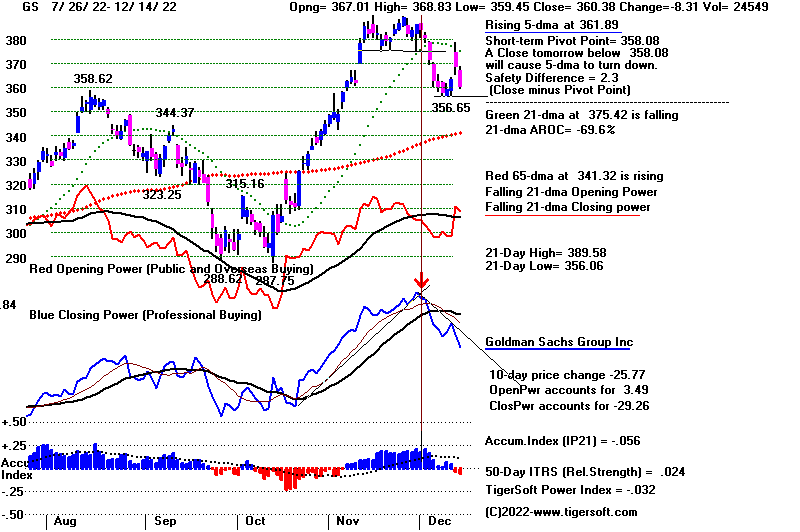 |
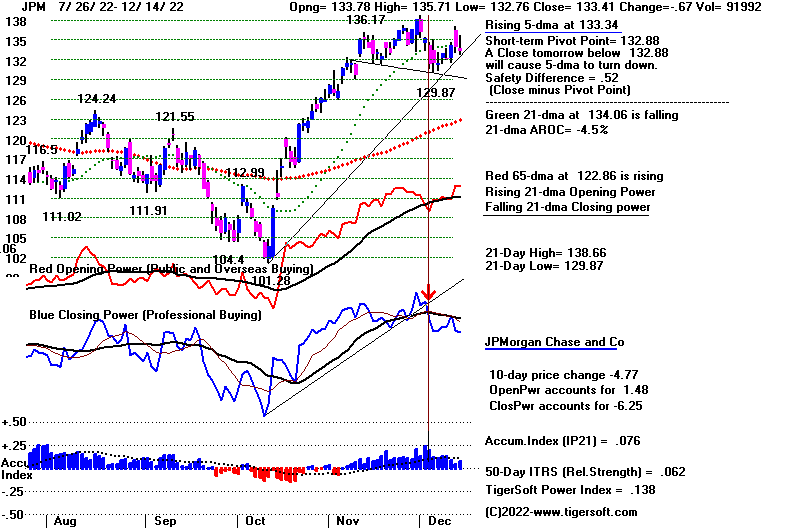 |
"3 locomotives of higher prices" - HD, MSFT and NVDA
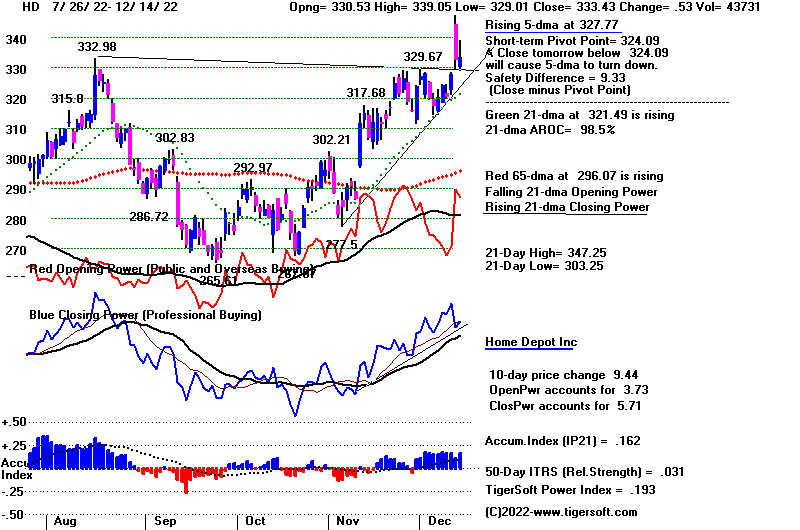
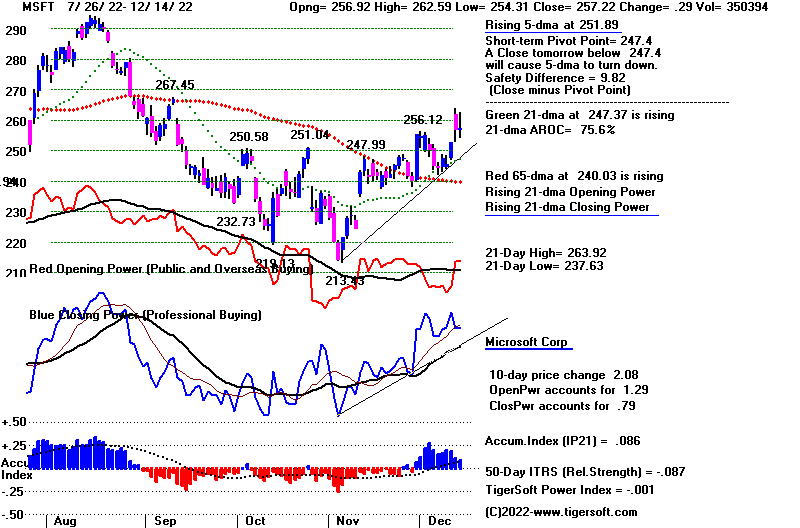
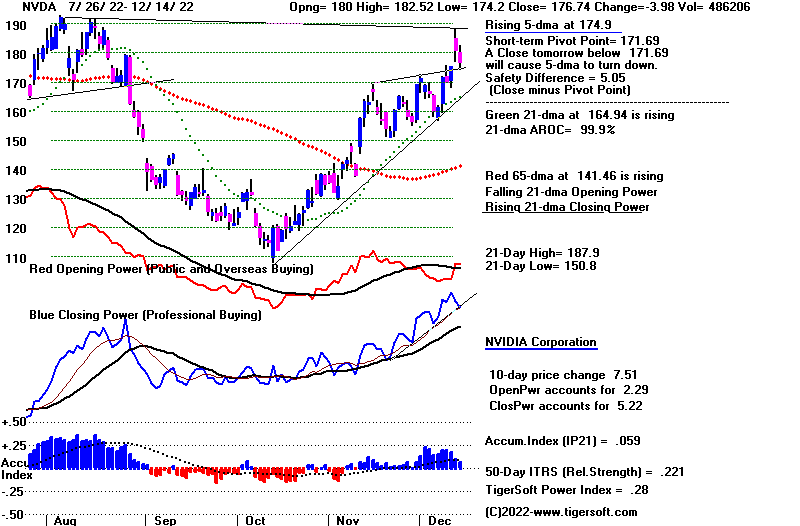 |
weak AAPL - biggest QQQ and SPY component
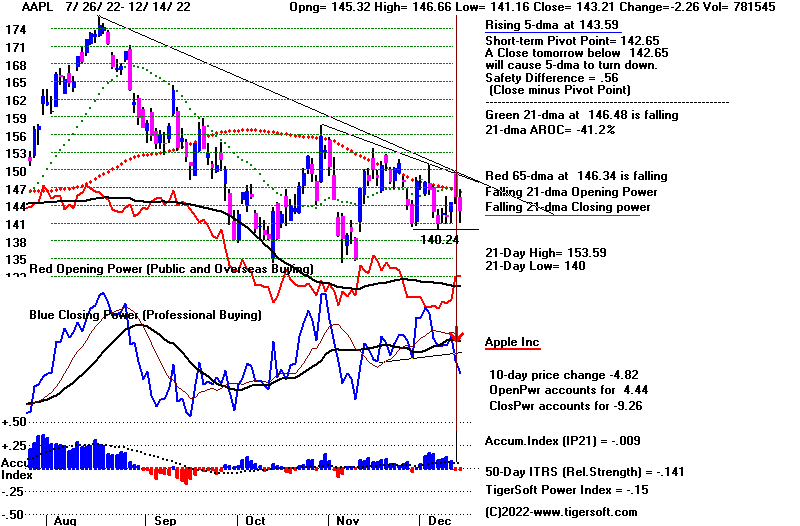 |
Weak high tech giants: TSLA, AMZN, GOOG
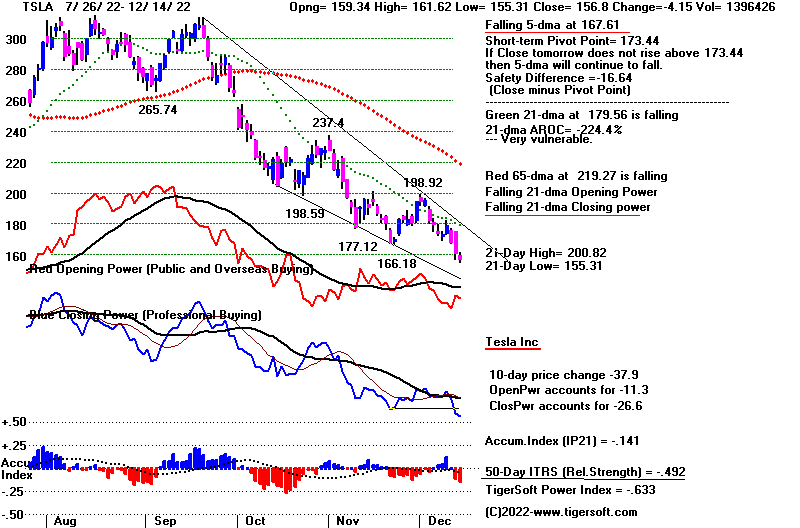
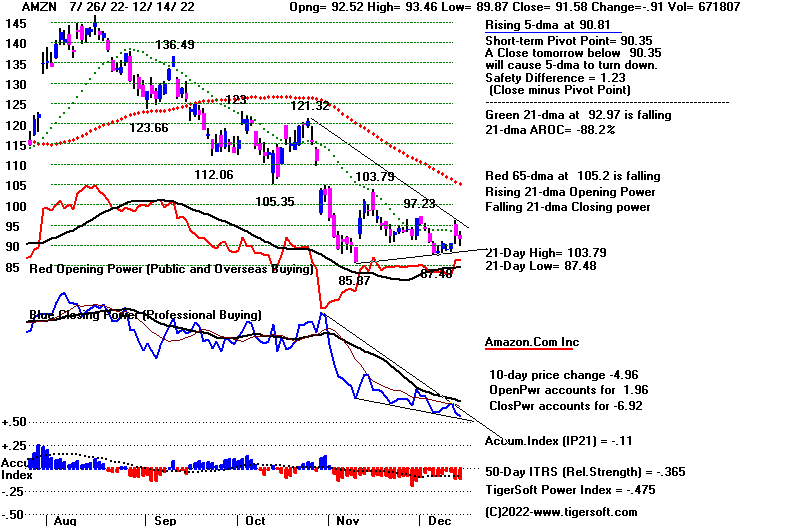
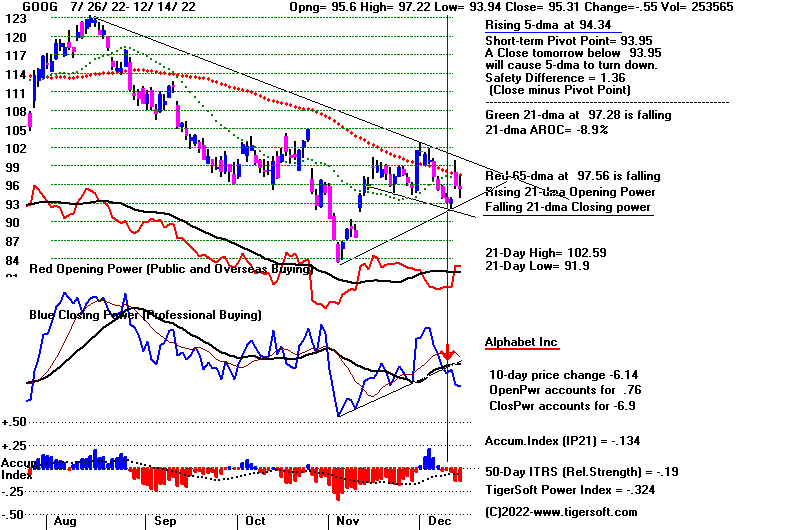
|
Biggest DJI component - UNH
 |
Table 1 - Breadth Statistics
12/14/2022
Last Chg %Chg
DJIA 33966.35 -142.29 -0.42%
S&P 500 3995.32 -24.33 -0.61%
Nasdaq 11170.89 -85.93 -0.7%
NYSE Latest Close Previous Close Week Ago
Issues traded 3,232 3,288 3,264
Advances 1,305 2,227 1,512
Declines 1,791 936 1,616
Unchanged 136 125 136
New highs 46 91 38
New lows 92 56 102
Adv. volume* 355,745,190 740,686,688 332,827,500
Decl. volume* 652,701,600 415,751,697 533,382,964
Total volume* 1,048,650,485 1,177,322,775 885,453,002
Closing Arms (TRIN)† 1.23 1.55 1.71
Block trades* 5,082 5,171 4,424
Adv. volume 1,591,863,489 3,010,933,099 1,414,305,331
Decl. volume 2,688,945,274 1,967,367,902 2,581,305,974
Total volume 4,472,347,259 5,079,364,895 4,118,053,025
NASDAQ Latest Close Previous Close Week Ago
Issues traded 4,848 4,911 4,820
Advances 1,897 2,781 1,966
Declines 2,695 1,874 2,584
Unchanged 256 256 270
New highs 99 123 70
New lows 246 247 326
Closing Arms (TRIN)† 0.86 0.74 1.22
Block trades 38,770 39,590 27,746
Adv. volume 2,444,828,872 4,025,080,301 1,648,690,343
Decl. volume 2,988,509,212 1,995,617,169 2,633,943,698
Total volume 5,485,155,915 6,126,895,639 4,343,866,6764,713,331,628
|
Table 2 QUICKSILVER on ETFS - 12/14/2022 ---
Bullish = 0
Bearish = 4 DBO, UUP (Dollar), CORN, WEAT
ETF CLOSE CHANGE PIVOT-PT 5-dma AROC CL-PWR CANDLE IP21 ITRS POWER INDEX
=======================================================================================================
DIA 340.22 -1.59 338.46 55.8% ------- RED .103 ---- ------
---------------------------------------------------------------------------------------------
COMPQX 11170.89 -85.92 11082 95.7% Bearish RED -.009 -.123 -.132
---------------------------------------------------------------------------------------------
SPY 399.4 -2.57 396.24 78.6% ------- RED .081 -.066 .015
---------------------------------------------------------------------------------------------
QQQ 286.51 -2.14 283.85 105.2% Bearish RED .021 -.107 -.086
---------------------------------------------------------------------------------------------
MDY 456.56 -2.14 456.1 44.3% Bearish RED .008 -.06 -.052
---------------------------------------------------------------------------------------------
IWM 180.19 -1.19 180.84 18% Bearish RED -.083 -.099 -.182
---------------------------------------------------------------------------------------------
FAS 76.03 -3.09 76.23 11.7% Bearish RED .073 .041 .114
---------------------------------------------------------------------------------------------
RETL 8.27 -.01 8.74 -177.3% Bearish ---- .061 -.015 .046
---------------------------------------------------------------------------------------------
SOXL 13 -.63 12.62 513.8% ------- RED .037 .055 .092
---------------------------------------------------------------------------------------------
TECL 28.05 -.7 26.61 492.1% ------- RED .07 -.033 .037
---------------------------------------------------------------------------------------------
IBB 136.73 .73 135.89 96.6% ------- BLUE .041 -.008 .033
---------------------------------------------------------------------------------------------
GLD 168.1 -.41 166.47 53.1% Bearish RED .01 -.076 -.066
---------------------------------------------------------------------------------------------
DBO 14.84 .19 14.11 188.3% Bearish BLUE -.06 -.216 -.276
---------------------------------------------------------------------------------------------
OIH 292.7 -1.71 283.43 179.8% Bearish RED .068 .123 .191
---------------------------------------------------------------------------------------------
CPER 23.3 .06 23.43 8.6% Bearish ---- -.186 -.017 -.203
---------------------------------------------------------------------------------------------
TAN 82.73 1.58 79.09 269% ------- BLUE -.034 -.067 -.101
---------------------------------------------------------------------------------------------
UUP 28 -.13 28.3 -68.9% Bullish RED -.08 -.176 -.256
---------------------------------------------------------------------------------------------
CORN 25.97 .02 25.68 46.5% Bullish BLUE -.168 -.169 -.337
---------------------------------------------------------------------------------------------
WEAT 7.59 -.01 7.56 6.6% Bearish ---- -.214 -.283 -.497
---------------------------------------------------------------------------------------------
YINN 49.06 .98 49.02 459.5% ------- BLUE .022 -.062 -.04
|
Table 3 RANKING OF KEY DIRECTORIES BASED PCT.OF STOCKS ABOVE 65-DMA
12/14/22
Bullish = 41
Bearish = 5
---------------------------------------------------------------------------------------
Directory Current day-1 day-2 day-3 day-4 day-5
----------------------------------------------------------------------------------------
COPPER 1 1 1 1 1 1
DJI-13 .923 .923 .923 .846 .923 .923
HOMEBLDG .888 .888 .888 .888 .888 .888
BONDFUND .885 .885 .885 .873 .896 .908
INFRA .878 .878 .878 .878 .878 .878
DOWJONES .866 .866 .866 .833 .866 .866
=====
BEVERAGE .857 1 .928 1 1 1
ETFS .836 .854 .854 .854 .854 .854
GOLD .826 .869 .804 .826 .847 .913
SP-100 .822 .822 .8 .755 .788 .777
UTILITY .815 .815 .815 .842 .868 .815
HIGHPRIC .814 .818 .793 .745 .771 .698
SP500 .779 .793 .8 .755 .773 .733
======
INDEXES .772 .8 .767 .718 .745 .718
SEMI .768 .768 .757 .736 .747 .694
INSURANC .76 .8 .76 .72 .76 .76
FIDSTKS .757 .763 .775 .692 .739 .71
CHEM .739 .739 .739 .739 .804 .739
MILITARY .73 .73 .807 .73 .73 .73
ELECTRON .729 .736 .729 .714 .714 .691
RUS-1000 .725 .741 .729 .685 .7 .658
=====
BIGBANKS .714 .714 .714 .571 .571 .571
NASD-100 .71 .75 .74 .68 .74 .68
=====
INDMATER .708 .694 .694 .694 .694 .736
NIFTY .704 .772 .727 .613 .704 .568
REIT .7 .738 .707 .684 .669 .638
JETS .692 .692 .769 .692 .692 .769
SOLAR .687 .625 .5 .437 .437 .437
TRANSP .684 .684 .789 .684 .684 .736
CHINA .68 .66 .62 .64 .64 .58
EDU .666 .666 .666 .666 .833 .833
GREEN .666 .666 .611 .555 .555 .5
RETAIL .659 .638 .638 .659 .723 .702
COMPUTER .65 .65 .65 .6 .6 .6
GUNS .642 .714 .714 .714 .714 .642
SOFTWARE .642 .678 .589 .571 .607 .553
AUTO .641 .698 .679 .679 .716 .698
COMODITY .589 .589 .564 .589 .589 .589
GAMING .578 .631 .631 .631 .631 .631
FINANCE .537 .625 .662 .65 .6 .6
FOOD .53 .53 .489 .51 .51 .51
========================================================================================
COAL .5 .666 .666 .5 .5 .5
HACKERS .5 .5 .5 .5 .5 .437
HOSPITAL .5 .5 .428 .357 .428 .428
===============================================================================================
OILGAS .457 .504 .438 .361 .438 .438
BIOTECH .438 .432 .421 .393 .421 .399
MARIJUAN .4 .5 .6 .5 .6 .7
REGBANKS .36 .48 .56 .48 .48 .52
LOWPRICE .313 .327 .316 .291 .294 .285
|
===================================================================================
Wednesday
- 6:00 AM - Futures: DJI -19 NASDAQ
-16 Data Used: 12/13/2022
| |
12/13/2022
DJIA 34108.64 103.60 +0.30%
S&P 500 4019.65 29.09 +0.73%
Nasdaq 11256.81 113.08 +1.01% |
|
| |
We don't
often see an eight hundred point reversal down from the opening.
But then we seldom see
all the major market indexes and ETFs simultanously hitting
so many reistance
points, namely price down-trends, flat overhead resistance
and falling 200-day
moving averages in the case of the SP-500 and NYSE.
The reversal also
marked a buying climax, in that the monthly CPI finally fell
a little because of the
big drop in oil and gasoline prices and this was obviosly
favorable to getting
the FED to pause in its rate hikes or, at least slow them
down. But the
fall in the CPI was also not unexpected. Just watching the
gas prices at the pump
would have alerted anyone to this change. And so,
many professionals took
profits and our candle-stick charts show various forms
of red popsicles and
red rolling pins, etc.
Seasonality as I have
said is quite bullish after the 15th of December. Tomorrow
expect the FED to sound
tough in their fight against inflation, but refuse to commit
to more rate hikes
after December's until February or March. This will amount
to a bullish pause.
But the "tough talk" should take the DJI back down to the
recent support, from
which a Santa Claus rally seems most likely.
It's true that UNH, the
most heavily weighted stock in DJI-30, fell today and
saw its CLosing Power
uptrend broken. And it's true that Tesla, a big part of
the QQQ and SPY, fell
to confirmed new lows. But it's also true that the
three
"locomotives" of the advance now, HD, NVDA and MSFT held onto
good gains today.
They should be held.
Traders looking for
ideas beyond shorting the Bearish MINCPs, should
look at our stock
charts for stocks showing optimized 5-day stochastic buys
and sells that have
gained more than 100% this past year. See how UCO
and GOOG meet this
criteria.
The Buy B21 and the
bullish seasonality should kick in a week again. ESP
subscribers can get the
Buy B21 now from the Tiger ESP page. |
|
| |
Charts - 12/13/2022
2022 PEERLESS DJI, Signals, Indicators Daily DJI Volume
10-DayUp/Down Vol Stoch-20 CCI RSI Pct of All Stocks above 65-dma
Inverted Traders Index
DJI-IPA DJI-OBV BOND FUNDS
NASDAQ S&P OEX NYSE DJ-15 DJ-20 DJI-30
DIA QQQ SPY IWM new - COIN (Bit Coin ETF)
TNA Short-Term Rates Ten Year Rates PST (Short Treasuries)
DOLLAR-UUP
ALLSTOCKs
Russell-1000
Insurance-Stocks
Recent 2006 vers-Peerless signals
http://www.tigersoftware.com/NEWPEER/UPD81213.bmp
MDY - http://www.tigersoftware.com/CHARTX/MDY.GIF
USO-CrudeOil DBO FAS GLD HD IBB JETS JNUG KOL NAIL NUGT NRGU OIH
PALL RSX RETL SDS AGQ SLV SOXL TAN TECL TLT TMF TNA UGA USO
China: YINN
CHAU
Commodities: CANE
CORN DBC JJC, NIB CORN, CUT (paper)
MOO, NRGU
SOYB WEAT UUP (Dollar) LIT
(Lithium)
China: YINN
CHAU
Commodities: CANE
CORN DBC JJC, NIB CORN, CUT (paper)
MOO, NRGU
SOYB WEAT UUP (Dollar) LIT
(Lithium)
Stocks AA AAPL ADBE ALXN AMAT AMGN AMD AMZN AXP BA BABA
BAC BIDU BLDP CAT CHKP CNX CRM CVX CMG DE DIS ENPH FB FSLR
FTNT GILD GME GOOG GS HD IBM INTU JPM KO KR LRCX MRK MRNA
MOS MSFT NEM NFLX NKE NOC NUE NVDA PANW PG PYPL REGN REV
SO QCOM QDEL TSLA TXN XOM V VRTX WFC WMT XLE ZM ZOM
Leveraged Short ETFs:
FAZ - financials, TZA and SRTY- small caps, MZZ - mid caps, TECS -Techs,
SOXS -
semi-conductors LABD
- Biotechs
Bullish MAXCPs http://www.tigersoftware.com/UPPING/12-13/BULLISH.htm
Bearish MINCPs http://www.tigersoftware.com/Downing/12-13/BEARISH.htm |
|
DJIA and DIA
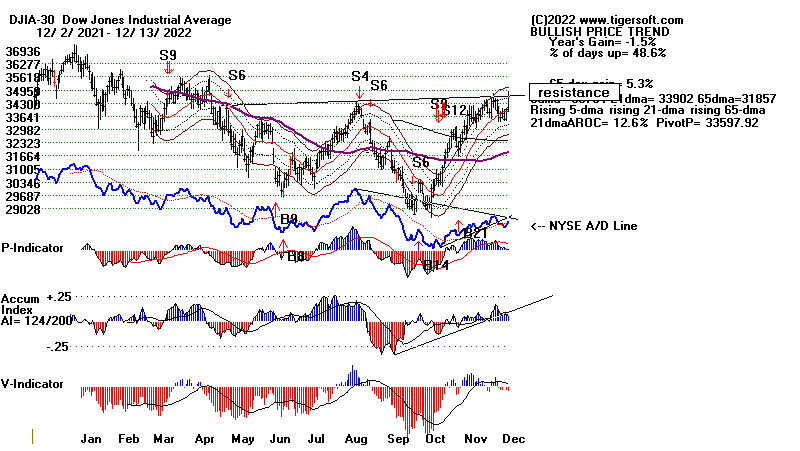 |
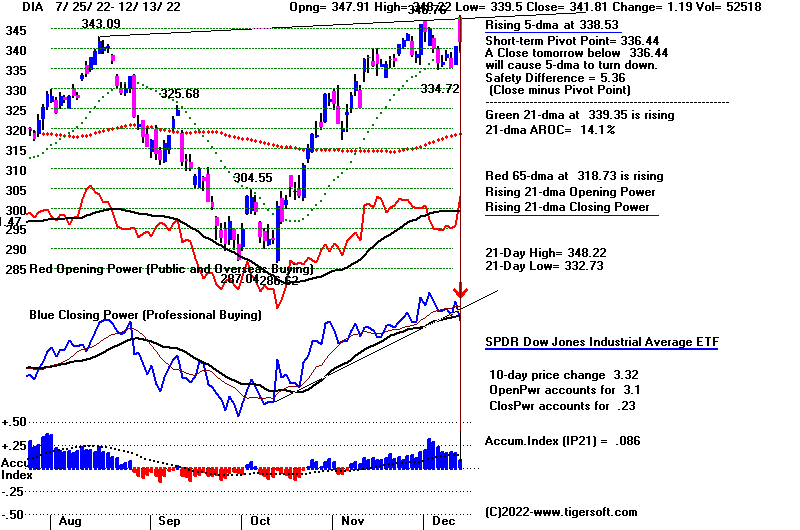 |
SP-500 and SPY
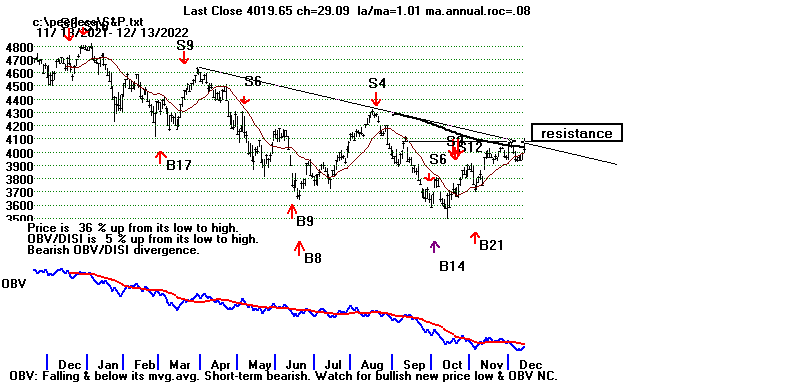
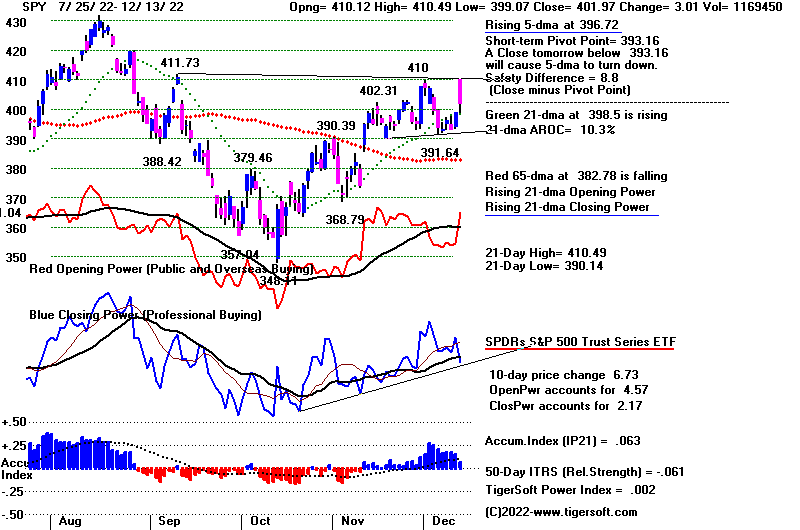 |
| NASDAQ 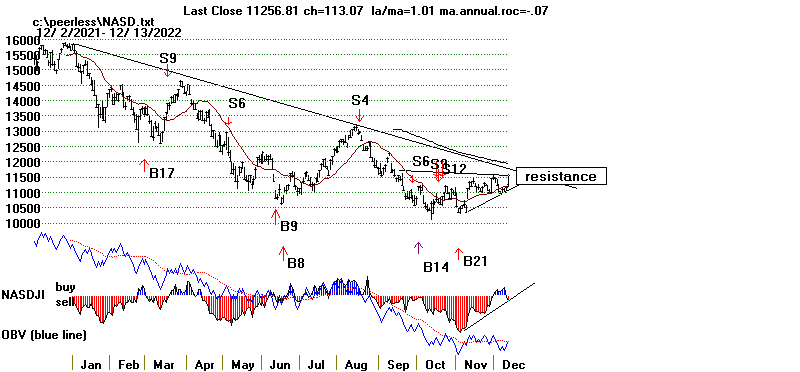
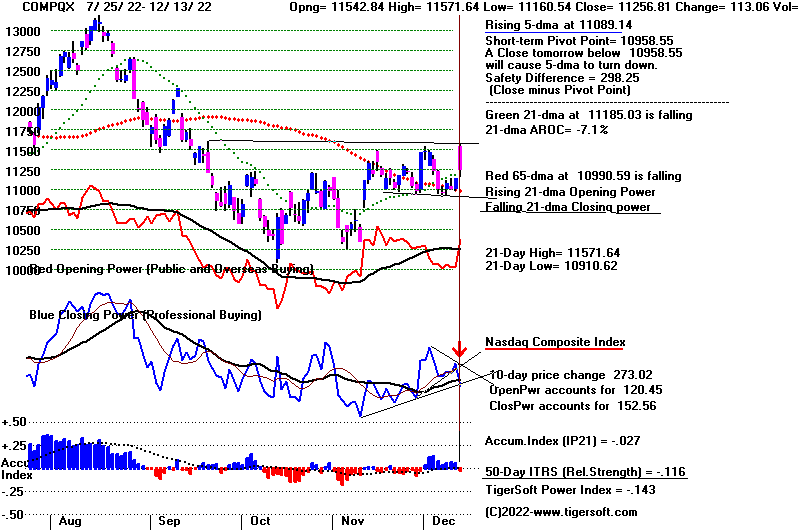
|
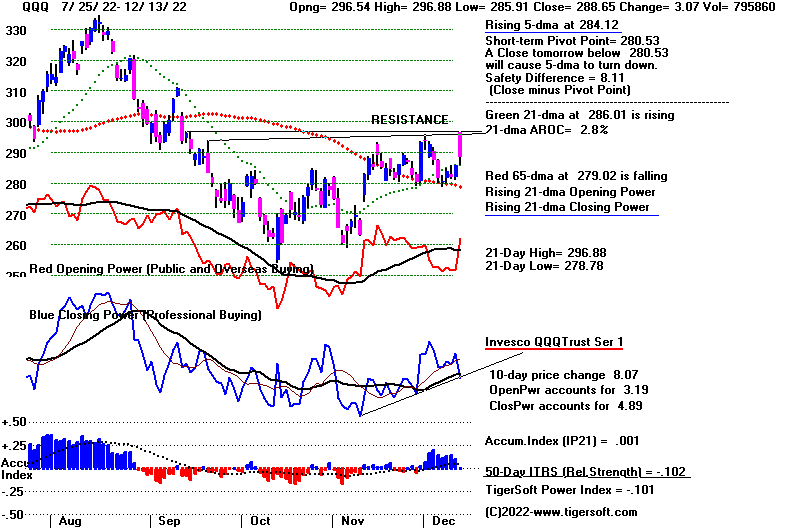 |
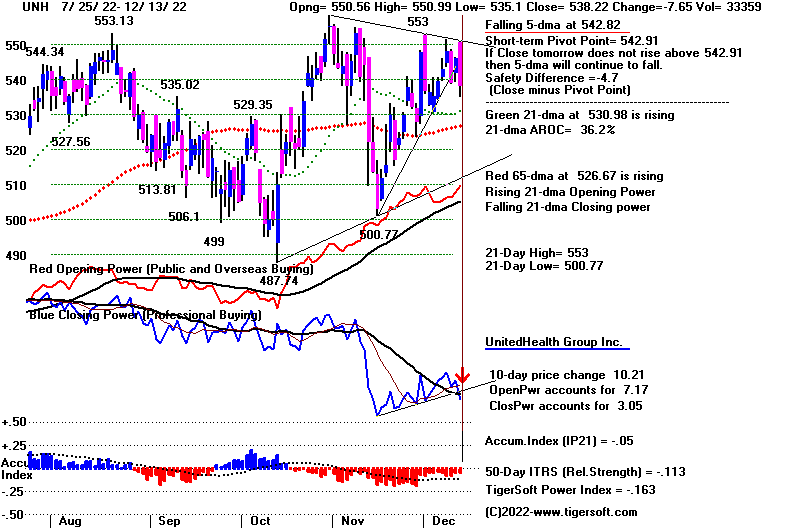
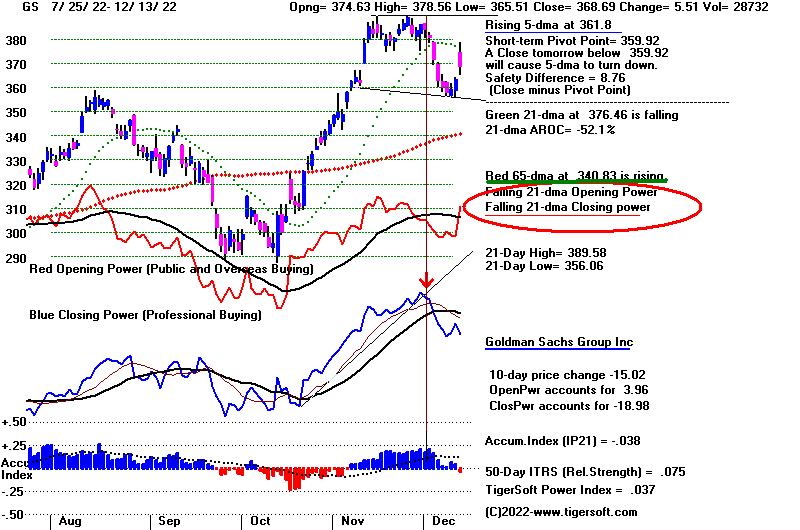 |
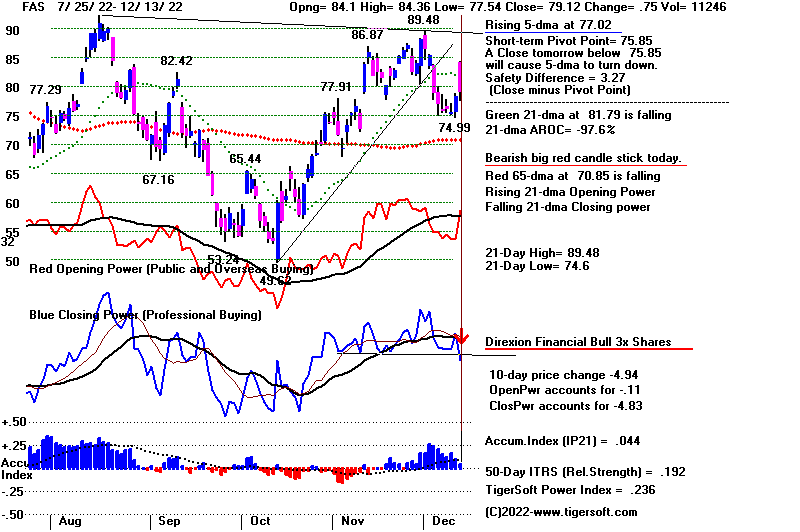 |
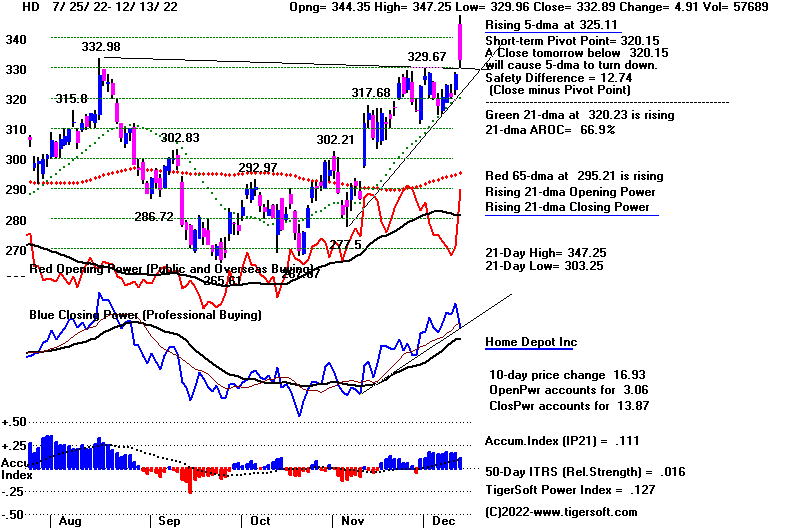 |
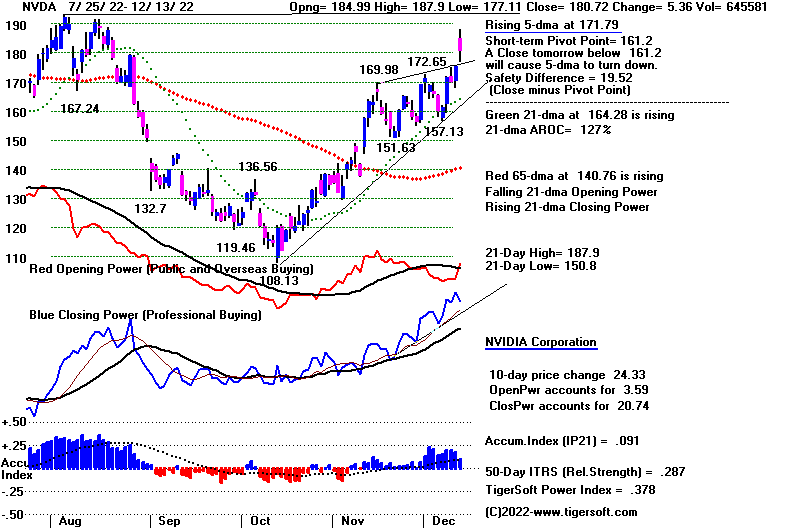 |
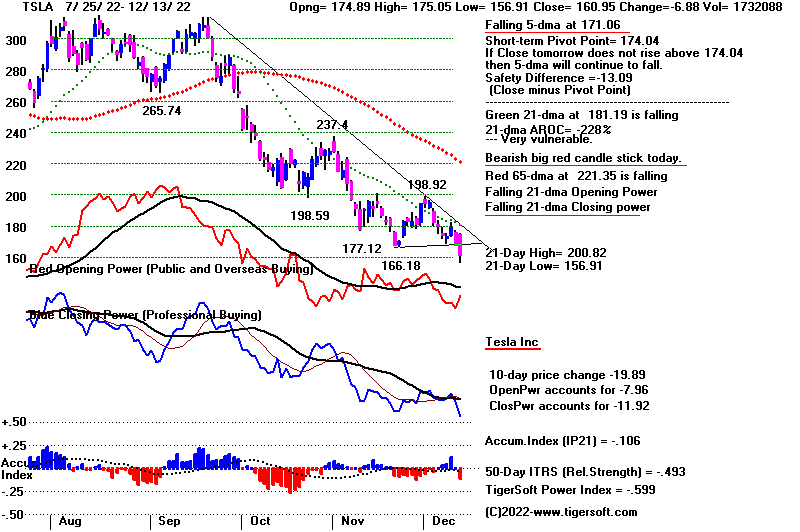 |
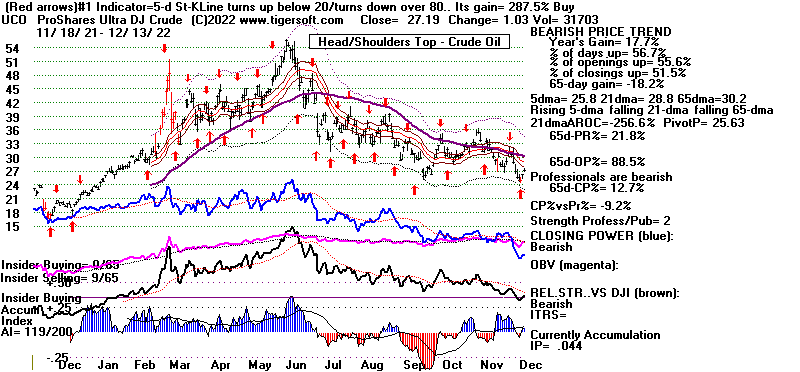 |
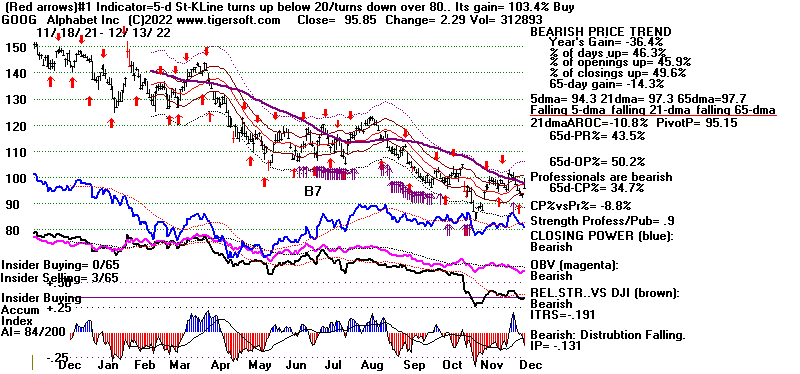 |
Table 1 - Breadth Statistics 12/13/2022
DJIA 34108.64 103.60 +0.30%
S&P 500 4019.65 29.09 +0.73%
Nasdaq 11256.81 113.08 +1.01%
NYSE Latest Close Previous Close Week Ago
Issues traded 3,288 3,265 3,275
Advances 2,227 2,006 906
Declines 936 1,135 2,231
Unchanged 125 124 138
New highs 91 48 37
New lows 56 90 114
Adv. volume* 740,686,688 650,506,834 281,158,629
Decl. volume* 415,751,697 188,323,349 676,801,258
Total volume* 1,177,322,775 849,255,435 969,965,743
Closing Arms (TRIN)† 1.55 0.66 0.88
Block trades* 5,171 4,476 4,881
Adv. volume 3,010,933,099 2,793,564,822 1,360,348,770
Decl. volume 1,967,367,902 1,045,988,830 2,942,807,100
Total volume 5,079,364,895 3,904,136,311 4,368,388,636
NASDAQ Latest Close Previous Close Week Ago
Issues traded 4,911 4,834 4,894
Advances 2,781 2,679 1,382
Declines 1,874 1,876 3,235
Unchanged 256 279 277
New highs 123 87 68
New lows 247 294 312
Closing Arms (TRIN)† 0.74 0.54 1.73
Block trades 39,590 30,573 34,183
Adv. volume 4,025,080,301 3,453,719,035 926,111,532
Decl. volume 1,995,617,169 1,316,346,738 3,754,332,752
Total volume 6,126,895,639 4,829,996,357 4,713,331,628
|
Table 2 Table 2 QUICKSILVER on ETFS - 12/13/2022 ---
Bullish = 1 SOXL,
Bearish = 4 DBO, UUP (Dollar), CORN, WEAT
ETF CLOSE CHANGE PIVOT-PT 5-dma AROC CL-PWR CANDLE IP21 ITRS POWER INDEX
=======================================================================================================
DIA 341.81 1.19 336.44 79.3% ------- RED .086 ---- -----
---------------------------------------------------------------------------------------------
COMPQX 11256.81 113.07 10958.55 109.6% Bearish RED -.026 -.119 -.145
---------------------------------------------------------------------------------------------
SPY 401.97 3.02 393.16 103% ------- RED .064 -.063 .001
---------------------------------------------------------------------------------------------
QQQ 288.65 3.07 280.53 123.3% ------- RED .002 -.104 -.102
---------------------------------------------------------------------------------------------
MDY 458.7 2.67 452.53 62% Bearish RED -.036 -.05 -.086
---------------------------------------------------------------------------------------------
IWM 181.38 .66 179.54 36.4% Bearish RED -.114 -.088 -.202
---------------------------------------------------------------------------------------------
FAS 79.12 .75 75.85 137.7% Bearish RED .045 .189 .234
---------------------------------------------------------------------------------------------
RETL 8.28 -.14 8.57 -176% Bearish RED .017 .097 .114
---------------------------------------------------------------------------------------------
SOXL 13.63 .65 11.7 778.4% ------- RED .017 .246 .263
---------------------------------------------------------------------------------------------
TECL 28.75 .97 25.4 562.1% ------- RED .07 .069 .139
---------------------------------------------------------------------------------------------
IBB 136 1.94 134.13 102.6% ------- RED -.026 -.019 -.045
---------------------------------------------------------------------------------------------
GLD 168.51 2.83 166.33 110.5% Bearish RED .027 -.096 -.069
---------------------------------------------------------------------------------------------
DBO 14.65 .2 14.3 7% Bearish BLUE -.092 -.233 -.325
---------------------------------------------------------------------------------------------
OIH 294.41 11.83 282.53 78.6% Bearish BLUE .033 .142 .175
---------------------------------------------------------------------------------------------
CPER 23.24 .21 23.26 38.8% Bearish RED -.191 -.028 -.219
---------------------------------------------------------------------------------------------
TAN 81.15 1.69 78.46 130.5% ------- RED -.044 -.083 -.127
---------------------------------------------------------------------------------------------
UUP 28.13 -.25 28.39 -61.7% Bullish BLUE -.046 -.222 -.268
---------------------------------------------------------------------------------------------
CORN 25.95 -.11 25.73 77.7% ------ RED -.208 -.203 -.411
---------------------------------------------------------------------------------------------
WEAT 7.6 -.04 7.58 126.2% Bearish RED -.222 -.327 -.549
---------------------------------------------------------------------------------------------
YINN 48.08 1.51 44.71 33.8% ------- RED -.003 .006 .003
|
Table 3 RANKING OF KEY DIRECTORIES BASED PCT.OF STOCKS ABOVE 65-DMA
12/13/22
Bullish = 43
Bearish = 3
---------------------------------------------------------------------------------------
Directory Current day-1 day-2 day-3 day-4 day-5
----------------------------------------------------------------------------------------
BEVERAGE 1 .928 1 1 1 1
COPPER 1 1 1 1 1 1
DJI-13 .923 .923 .846 .923 .923 .923
HOMEBLDG .888 .888 .888 .888 .888 .888
BONDFUND .885 .885 .873 .896 .908 .885
INFRA .878 .878 .878 .878 .878 .878
GOLD .869 .804 .826 .847 .913 .826
DOWJONES .866 .866 .833 .866 .866 .866
ETFS .854 .854 .854 .854 .872 .854
SP-100 .822 .8 .755 .788 .777 .777
HIGHPRIC .818 .793 .745 .771 .693 .689
UTILITY .815 .815 .842 .868 .815 .815
INDEXES .8 .767 .718 .745 .718 .751
INSURANC .8 .76 .72 .76 .76 .76
SP500 .793 .8 .755 .769 .735 .749
GUNS .785 .785 .642 .642 .571 .714
NIFTY .772 .727 .613 .704 .568 .59
SEMI .768 .757 .736 .747 .673 .694
FIDSTKS .763 .775 .692 .739 .71 .721
NASD-100 .75 .74 .68 .74 .68 .69
RUS-1000 .741 .729 .685 .7 .657 .663
CHEM .739 .739 .76 .782 .76 .76
REIT .738 .7 .692 .676 .63 .615
ELECTRON .736 .729 .714 .714 .676 .684
MILITARY .73 .807 .73 .73 .73 .769
BIGBANKS .714 .714 .571 .571 .571 .571
AUTO .698 .679 .679 .716 .698 .735
INDMATER .694 .694 .694 .694 .736 .736
JETS .692 .769 .692 .692 .769 .769
TRANSP .684 .789 .684 .684 .736 .736
SOFTWARE .678 .607 .571 .607 .553 .535
COAL .666 .666 .5 .5 .5 .5
EDU .666 .666 .666 .833 .833 .833
GREEN .666 .611 .555 .555 .5 .555
CHINA .66 .62 .64 .64 .58 .6
COMPUTER .65 .65 .6 .6 .6 .6
RETAIL .638 .638 .659 .723 .702 .68
GAMING .631 .631 .578 .684 .631 .631
FINANCE .625 .662 .65 .587 .6 .662
SOLAR .625 .5 .437 .437 .437 .437
COMODITY .589 .564 .564 .589 .589 .589
FOOD .53 .489 .489 .51 .51 .51
OILGAS .504 .438 .361 .438 .438 .466
---------------------------------------------------------------------------
HACKERS .5 .5 .5 .5 .437 .437
HOSPITAL .5 .428 .357 .428 .428 .428
MARIJUAN .5 .6 .5 .6 .6 .9
---------------------------------------------------------------------------
REGBANKS .48 .56 .48 .48 .52 .56
BIOTECH .432 .418 .396 .421 .391 .432
LOWPRICE .327 .319 .294 .294 .282 .291
|
===================================================================================
Tuesday -
6:00 AM - Futures:
DJI +751 NASDAQ+453 Data
Used: 12/12/2022
| |
12/12/2022
Last Chg
%Chg
DJIA 34005.04
528.58 +1.58%
Nasdaq 11143.74 139.12
+1.26%
S&P 500 3990.56
56.18 +1.43%
|
|
| |
The CPI
numbers released today are clearly expected to show that the
rate of inflation is cooling
off in the key area of oil prices. That expectation
is again lifting prices,
especially in the big indexes and general market ETFs,
DIA, SPY and QQQ.
CONSUMER PRICE INDEX - NOVEMBER 2022
The Consumer Price Index for All Urban Consumers (CPI-U) rose 0.1 percent in November
on a seasonally adjusted basis, after increasing 0.4 percent in October, the U.S.
Bureau of Labor Statistics reported today. Over the last 12 months, the all items
index increased 7.1 percent before seasonal adjustment.
The index for shelter was by far the largest contributor to the monthly all items
increase, more than offsetting decreases in energy indexes. The food index increased
0.5 percent over the month with the food at home index also rising 0.5 percent. The
energy index decreased 1.6 percent over the month as the gasoline index, the natural
gas index, and the electricity index all declined.
This is a market where hot
money is clearly flowing into DIA especially.
This has happened before,
most notably at the end of 1998 and the first
half of 1999. The
lagging A/D Line was and is no match for the hot money
flowing in the DJI-30.
Even S9s and S12s are suppressed at this time.
Keep in mnd that the DJI
averages gains are almost 3x larger in the 3rd year
of the Presidential Election
cycle than in the Presidential Election year itself
or Years 1 and 2.
DJI - 1998-1999
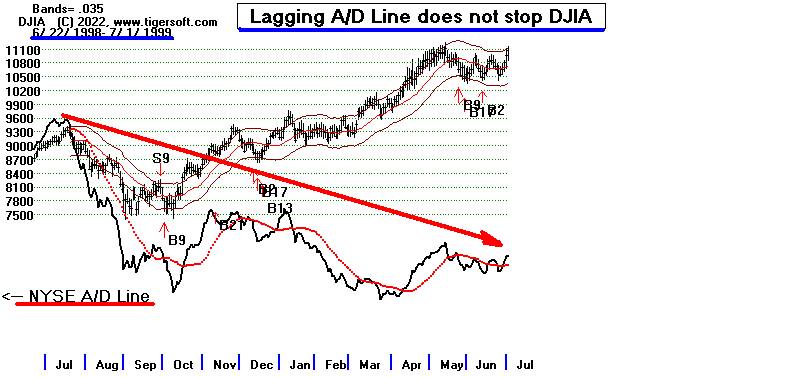
The new version of the Buy
B21 will be posted on the ESP page
Tueday night. It reflects
this bullish seasonality and is now in its take-off phase.
Understanding this helps us
appreciate why the Closing Powers shown below have
just hooked back up.
There is no point in argung with the tape or beng short QQQ.
The Closing Powers turning up
in here reflect a new aggresive buying on their part.
The strongest of the most
heavily weighted components are the locomotives
of the current move.
HD, MSFT and NVDA are the most favored now.
If this bullish seasonality
continues to play out, they are the best ways to
play this rally. The
bullish MAXCPs are not offering as much right now.
I expect the weakest stocks, and
those include TSLA and AMZN, to be
under tax selling pressure until
the end of the year. So, we should be more
selective.
|
|
| |
Charts - 12/12/2022
2022 PEERLESS DJI, Signals, Indicators Daily DJI Volume
10-DayUp/Down Vol Stoch-20 CCI RSI Pct of All Stocks above 65-dma
Inverted Traders Index
DJI-IPA DJI-OBV BOND FUNDS
NASDAQ S&P OEX NYSE DJ-15 DJ-20 DJI-30
DIA QQQ SPY IWM new -< COIN (Bit Coin ETF)
TNA Short-Term Rates Ten Year Rates PST (Short Treasuries)
DOLLAR-UUP
ALLSTOCKs
Russell-1000
Insurance-Stocks
Recent 2006 vers-Peerless signals
http://www.tigersoftware.com/NEWPEER/UPD81212.bmp
MDY - http://www.tigersoftware.com/CHARTX/MDY.GIF
USO-CrudeOil DBO FAS GLD HD IBB JETS JNUG KOL NAIL NUGT NRGU OIH
PALL RSX RETL SDS AGQ SLV SOXL TAN TECL TLT TMF TNA UGA USO
China: YINN
CHAU
Commodities: CANE
CORN DBC JJC, NIB CORN, CUT (paper)
MOO, NRGU
SOYB WEAT UUP (Dollar) LIT
(Lithium)
China: YINN
CHAU
Commodities: CANE
CORN DBC JJC, NIB CORN, CUT (paper)
MOO, NRGU
SOYB WEAT UUP (Dollar) LIT
(Lithium)
Stocks AA AAPL ADBE ALXN AMAT AMGN AMD AMZN AXP BA BABA
BAC BIDU BLDP CAT CHKP CNX CRM CVX CMG DE DIS ENPH FB FSLR
FTNT GILD GME GOOG GS HD IBM INTU JPM KO KR LRCX MRK MRNA
MOS MSFT NEM NFLX NKE NOC NUE NVDA PANW PG PYPL REGN REV
SO QCOM QDEL TSLA TXN XOM V VRTX WFC WMT XLE ZM ZOM
Leveraged Short ETFs:
FAZ - financials, TZA and SRTY- small caps, MZZ - mid caps, TECS -Techs,
SOXS -
semi-conductors LABD
- Biotechs
Bullish MAXCPs http://www.tigersoftware.com/UPPING/12-12/BULLISH.htm
Bearish MINCPs http://www.tigersoftware.com/Downing/12-12/BEARISH.htm |
|
DJI - New Buy B21 despite lagging A/D Line. Bullish
seasonality is more important.
B21 here uses concept of October
oftenbeing the killer of bear markets.
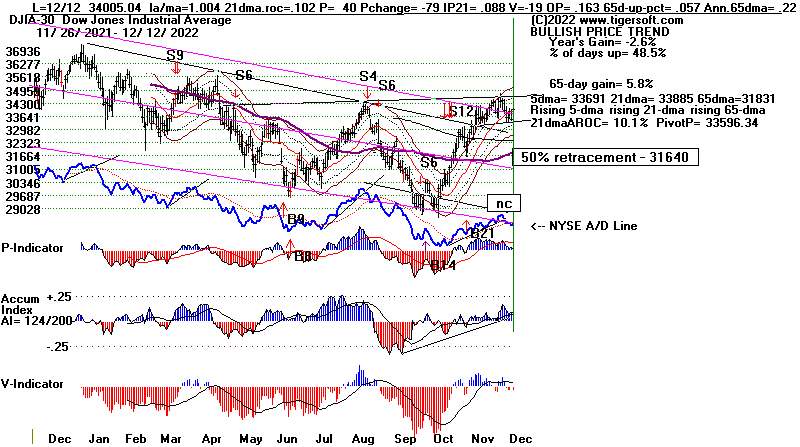 |
DIA - Closing Power has turned up at its rising 21-dma. DJI
must keep rising to
avoid the appearance of forming a head/shoulders top.
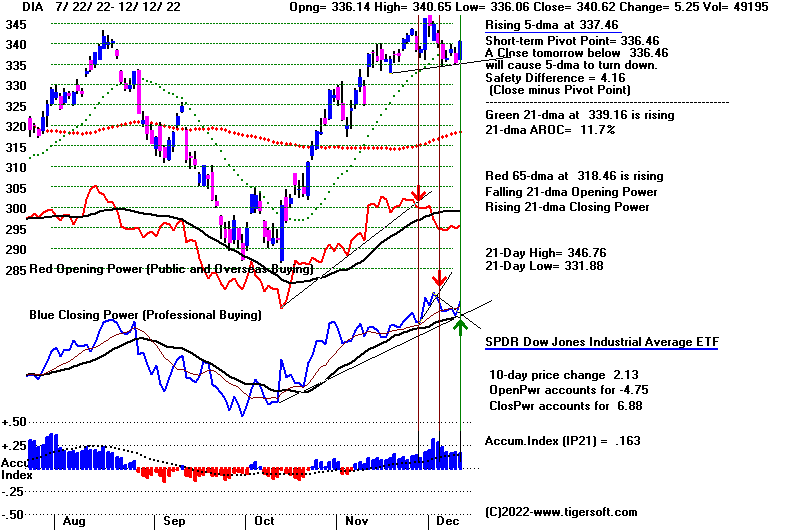 |
| Highest Priced and Most Heavily
Weighted Stocks in DJI-30 |
UNH - 21-dma of Closing Power is falling.
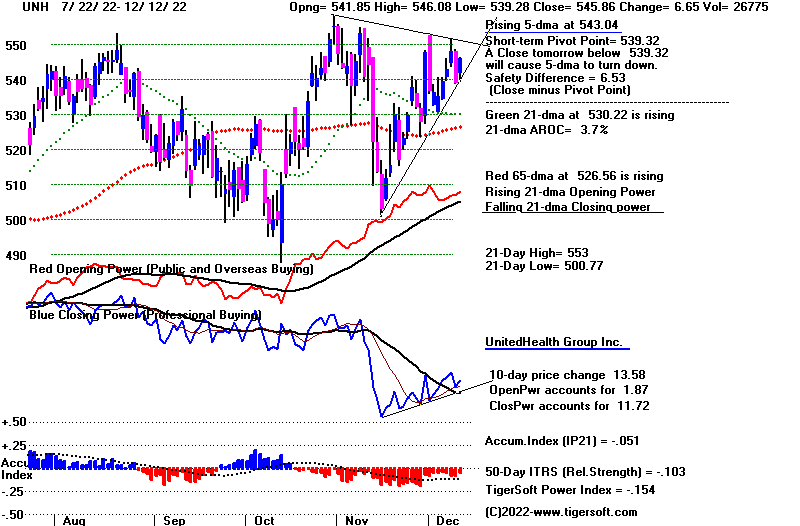 |
GS - Closing Power hooked back up, but its 21-dma is still falling.
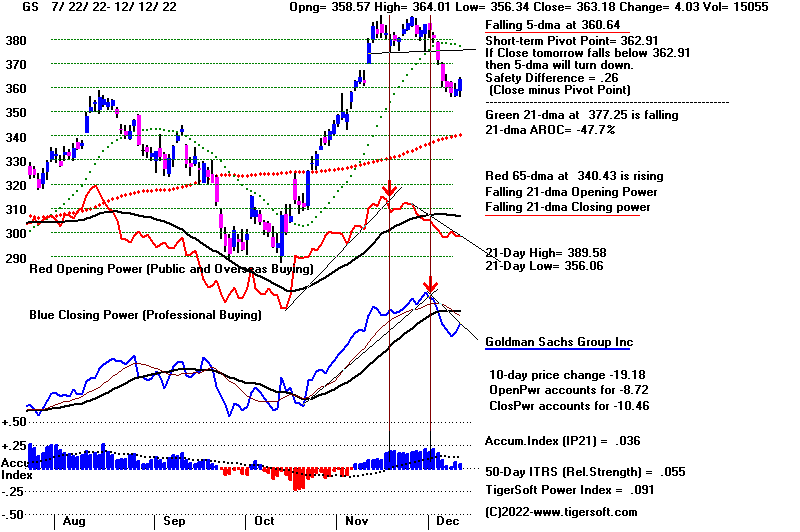 |
HD - Bullish rising Closing Power. Approaching 330 resistance.
 |
SP-500 - SPY
Bullish Red BUY.
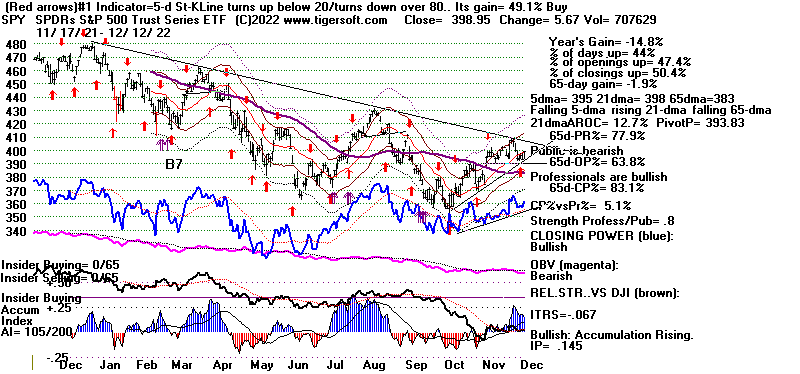
SPY - Rising 21-dma of Closing Power hooked back up.
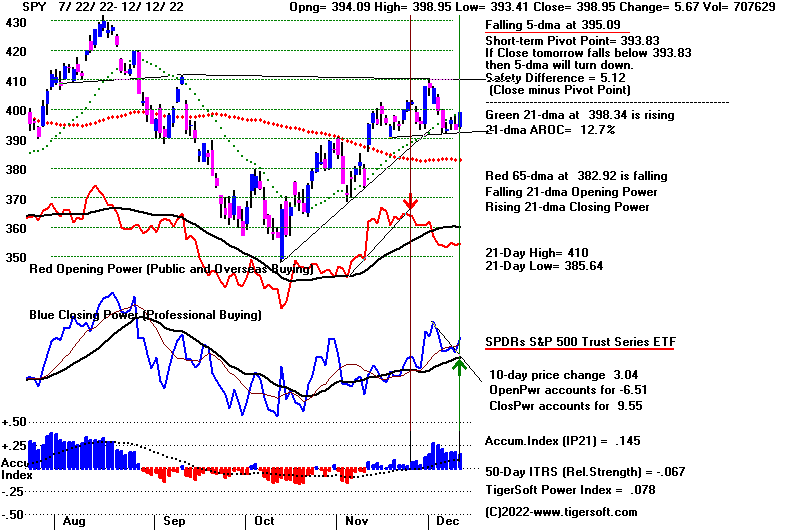 |
NASDAQ - Very weak OBV should limit rallies.
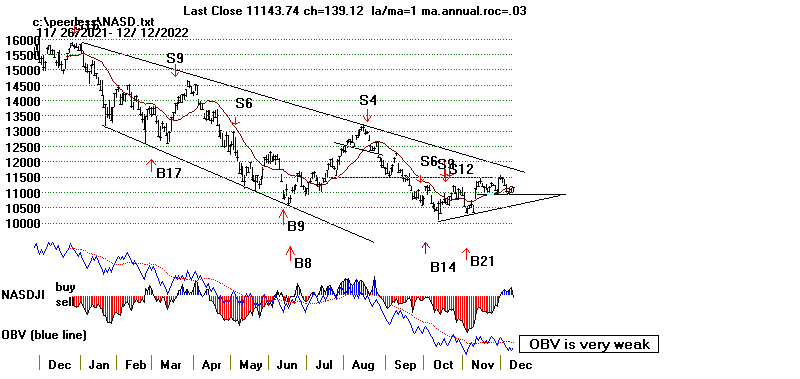 |
QQQ - Rising 21-dma of Closing Power has hooked back up.
Very low Relative
Strength: ITRS= -.116
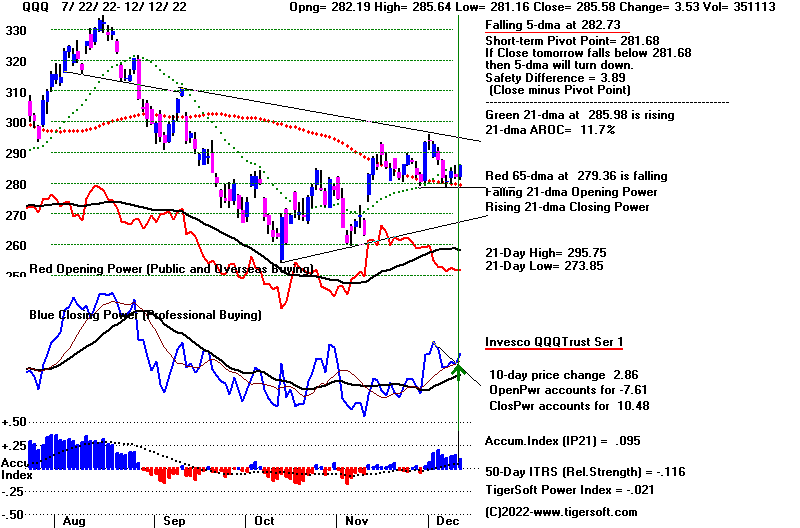 |
Five Biggest holdings of QQQ
Apple Inc. Allocation: 12.88%
Microsoft Corp. Allocation: 10.36%
GOOGLE 6.41%
Alphabet Inc Class C. Allocation:
3.25% and Alphabet Inc Class A. Allocation: 3.16%
Amazon.com Inc. Allocation: 5.17%
NVIDIA Corp. Allocation: 3.38% |
AAPL
Rising 21-dma of
Closing Power has hooked back up.
Very low Relative
Strength: ITRS= -.139
Falling 5-day ma
and 65-dma.
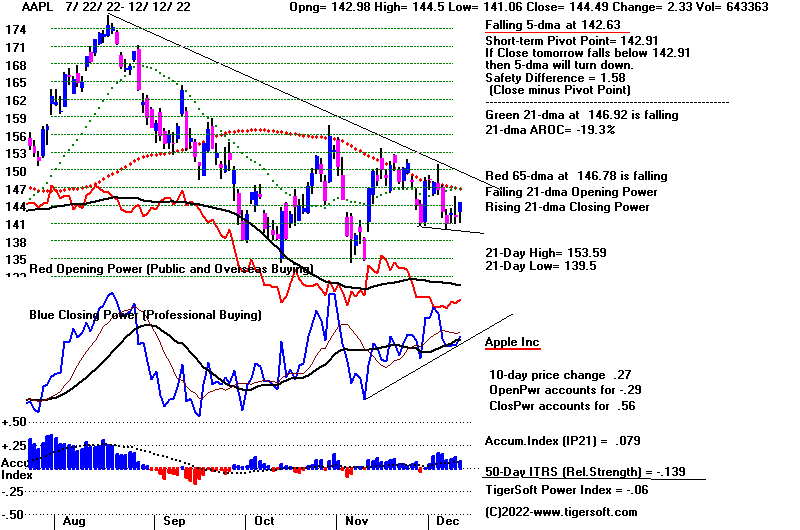 |
MSFT - Rising 21-dma of Closing Power has hooked back up
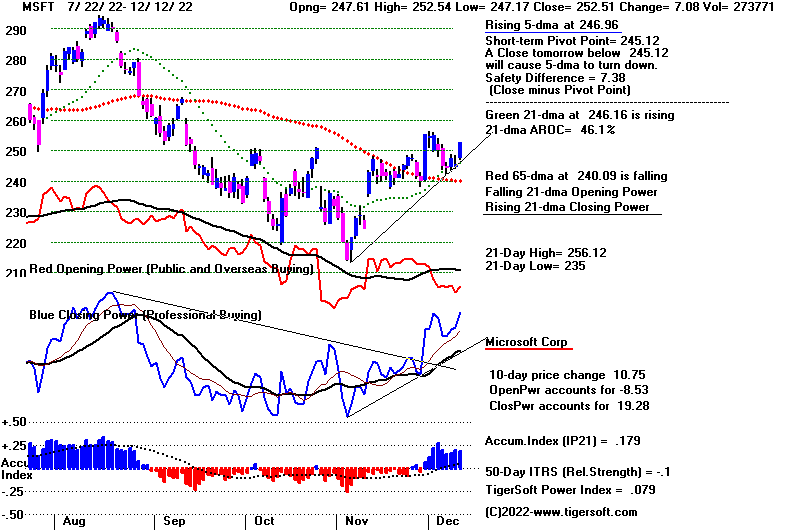 |
GOOG
 |
AMZN - Both Opening and Closing Power are falling.
- Very weak ITRS
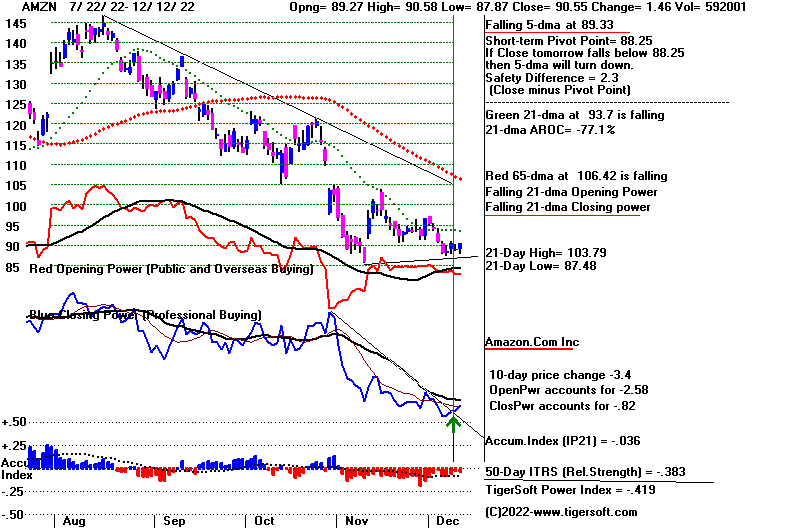 |
NVDA - Uptrend of Closing Power is bullishly accelerating.
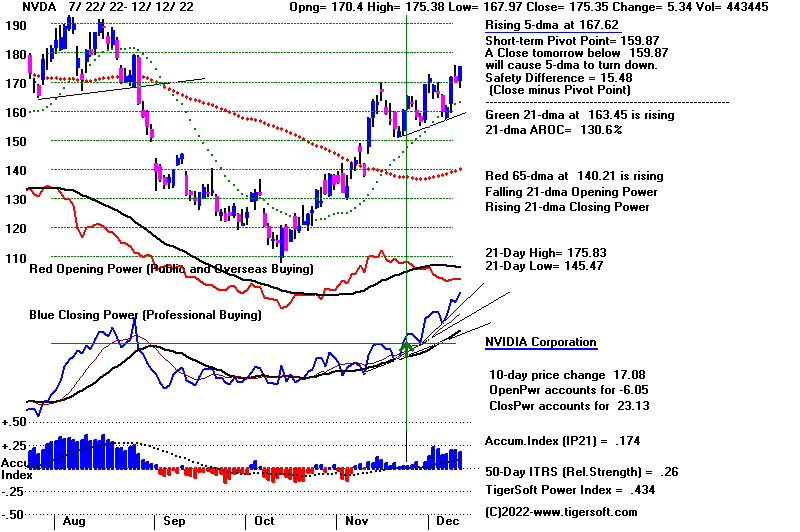 |
Table 1 - Breadth Statistics 12/12/2022
Last Chg %Chg
DJIA 34005.04 528.58 1.58%
Nasdaq 11143.74 139.12 1.26%
S&P 500 3990.56 56.18 1.43%
NYSE Latest Close Previous Close Week Ago
Issues traded 3,265 3,259 3,304
Advances 2,006 926 480
Declines 1,135 2,218 2,693
Unchanged 124 115 131
New highs 48 43 62
New lows 90 63 55
Adv. volume* 650,506,834 290,671,849 63,519,747
Decl. volume* 188,323,349 542,366,743 835,905,734
Total volume* 849,255,435 856,195,382 904,232,630
Closing Arms (TRIN)† 0.66 0.74 2.25
Block trades* 4,476 4,285 5,007
Adv. volume 2,793,564,822 1,367,914,713 311,650,361
Decl. volume 1,045,988,830 2,439,327,766 3,937,094,460
Total volume 3,904,136,311 3,888,263,390 4,280,824,911
NASDAQ Latest Close Previous Close Week Ago
Issues traded 4,834 4,810 4,884
Advances 2,679 1,654 1,189
Declines 1,876 2,863 3,468
Unchanged 279 293 227
New highs 87 68 108
New lows 294 248 168
Closing Arms (TRIN)† 0.54 0.90 0.91
Block trades 30,573 26,463 31,114
Adv. volume 3,453,719,035 1,649,364,351 1,223,770,374
Decl. volume 1,316,346,738 2,578,310,808 3,247,477,472
Total volume 4,829,996,357 4,337,449,692 4,510,035,402
|
Table 2 QUICKSILVER on ETFS - 12/12/2022 ---
Bullish = 4 FAS, RETL, SOXL, TECL
Bearish = 4 DBO, UUP (Dollar), CORN, WEAT
ETF CLOSE CHANGE PIVOT-PT 5-dma AROC CL-PWR CANDLE IP21 ITRS POWER INDEX
=======================================================================================================
DIA 340.62 5.25 336.46 8.7% ------- BLUE .164 --- ------
---------------------------------------------------------------------------------------------
COMPQX 11143.74 139.12 11014.89 -43.5% ------- BLUE .045 -.132 -.087
---------------------------------------------------------------------------------------------
SPY 398.95 5.67 393.83 -8.1% ------- BLUE .146 -.069 .077
---------------------------------------------------------------------------------------------
QQQ 285.58 3.54 281.68 -36.4% ------- BLUE .096 -.117 -.021
---------------------------------------------------------------------------------------------
MDY 456.03 4.9 453.07 -26.5% ------- BLUE -.021 -.05 -.071
---------------------------------------------------------------------------------------------
IWM 180.72 2.1 180.07 -59.6% Bearish BLUE -.088 -.09 -.178
---------------------------------------------------------------------------------------------
FAS 78.37 2.81 77.01 -42.4% Bearish BLUE .099 .26 .359
---------------------------------------------------------------------------------------------
RETL 8.42 .12 8.58 -215.2% ------- BLUE .102 .186 .288
---------------------------------------------------------------------------------------------
SOXL 12.98 .66 11.72 160% ------- BLUE .115 .279 .394
---------------------------------------------------------------------------------------------
TECL 27.78 1.7 25.79 39.9% Bullish BLUE .184 .108 .292
---------------------------------------------------------------------------------------------
IBB 134.06 1.05 133.25 -53.2% ------- BLUE .045 -.039 .006
---------------------------------------------------------------------------------------------
GLD 165.68 -1.38 164.84 38.9% ------- RED .104 -.114 -.01
---------------------------------------------------------------------------------------------
DBO 14.45 .28 14.63 -252.1% Bearish BLUE -.09 -.234 -.324
---------------------------------------------------------------------------------------------
OIH 282.58 11.7 289.98 -188.9% Bearish BLUE -.007 .152 .145
---------------------------------------------------------------------------------------------
CPER 23.03 -.2 23.06 34.5% ------- ---- -.008 -.059 -.067
---------------------------------------------------------------------------------------------
TAN 79.46 .84 79.09 -153.6% ------- BLUE -.09 -.106 -.196
---------------------------------------------------------------------------------------------
UUP 28.38 .02 28.48 -14.1% ------- ---- -.203 -.244 -.447
---------------------------------------------------------------------------------------------
CORN 26.06 .32 25.55 79.9% Bullish BLUE -.167 -.222 -.389
---------------------------------------------------------------------------------------------
WEAT 7.64 .19 7.41 80% Bearish BLUE -.164 -.351 -.515
---------------------------------------------------------------------------------------------
YINN 46.57 -1.73 47.76 59.4% ------- RED .042 -.04 .002
|
TABLE 3
RANKING OF KEY DIRECTORIES BASED PCT.OF STOCKS ABOVE 65-DMA
12/12/22
Bullish = 42
Bearish = 5
---------------------------------------------------------------------------------------
Directory Current day-1 day-2 day-3 day-4 day-5
----------------------------------------------------------------------------------------
COPPER 1 1 1 1 1 1
BEVERAGE .928 1 1 1 1 1
DJI-13 .923 .846 .923 .923 .923 .923
HOMEBLDG .888 .888 .888 .888 .888 .888
BONDFUND .885 .873 .896 .908 .885 .896
INFRA .878 .878 .878 .878 .878 .909
DOWJONES .866 .833 .866 .866 .866 .866
=====
ETFS .854 .854 .854 .872 .872 .854
UTILITY .815 .842 .868 .815 .815 .736
MILITARY .807 .73 .73 .73 .769 .807
GOLD .804 .826 .847 .913 .826 .847
SP-100 .8 .755 .788 .777 .777 .8
SP500 .8 .755 .769 .731 .751 .787
=====
HIGHPRIC .793 .745 .771 .693 .689 .767
TRANSP .789 .684 .684 .736 .789 .842
FIDSTKS .775 .692 .739 .71 .727 .775
GUNS .769 .769 .769 .692 .769 .769
JETS .769 .692 .692 .769 .769 .769
INDEXES .767 .718 .745 .718 .751 .789
INSURANC .76 .72 .76 .76 .76 .72
SEMI .757 .736 .747 .673 .684 .81
NASD-100 .74 .68 .74 .68 .7 .76
=====
CHEM .739 .76 .804 .739 .782 .782
ELECTRON .729 .714 .714 .676 .676 .751
RUS-1000 .729 .685 .7 .657 .664 .728
=====
NIFTY .727 .613 .704 .568 .59 .659
BIGBANKS .714 .571 .571 .571 .571 .571
REIT .7 .684 .684 .638 .592 .684
INDMATER .694 .694 .694 .736 .736 .763
AUTO .679 .679 .716 .698 .735 .735
COAL .666 .5 .5 .5 .5 .666
EDU .666 .666 .833 .833 .833 .833
FINANCE .662 .65 .587 .587 .662 .7
COMPUTER .65 .6 .6 .6 .6 .6
RETAIL .638 .659 .723 .702 .68 .68
GAMING .631 .578 .631 .684 .631 .631
CHINA .62 .64 .64 .58 .6 .6
GREEN .611 .555 .555 .5 .555 .722
SOFTWARE .607 .589 .607 .553 .535 .553
MARIJUAN .6 .5 .6 .6 .9 1
COMODITY .564 .564 .564 .589 .589 .589
REGBANKS .56 .48 .48 .52 .56 .68
============================================================================================
HACKERS .5 .5 .5 .437 .437 .5
SOLAR .5 .437 .437 .437 .437 .812
============================================================================================
FOOD .489 .489 .489 .51 .51 .51
OILGAS .438 .361 .438 .438 .466 .59
HOSPITAL .428 .357 .428 .428 .428 .571
BIOTECH .418 .393 .424 .391 .429 .49
LOWPRICE .319 .296 .296 .282 .291 .313
|
==================================================================================
Monday -
6:15 AM - Futures:
DJI +54 NASDAQ+19 Data Used: 12/9/2022
| |
12/9/2022
DJIA 33476.46 -305.02
-0.90%
S&P 500 3934.38 -29.13
-0.73%
Nasdaq 11004.62 -77.39
-0.70%
|
|
| |
Seasonality still suggests that we should wait until after
mid-December to
buy most stocks again when the odds of a DJI rally rise to
100% over the
following four weeks and again reach 100% over the next 6
months. Seasonality
gave us the new Buy B21 in early November, too. That
could still allow
a decline for the DJI so that it achieves a 50% retracement
of its rally since
the beginning of October. But the DJI seems to refuse
to break below its
near-term support. We have to reckon with this fact.
Weakness later today could bring some breakdowns in stocks
holding
just above their support levels. There are
quite a few, but most also show
positive IP21 readings and are above their 65-dma.
Normally, that would
mean any breakdown would be false. And such may
be the case in the
bullish month of December now, but a positive IP21
(Accum. Index) did
not protect DIA, SPY or QQQ from serious declines
after price breakdowns
early in 2022. I would take any such breakdowns
seriously even now.
The new Buy B21, like other types of Buy B21s, occurred
because
of the unusual strength in October, a month known for
seeing the end of bear
markets. Presumably, the next six months are the most
bullish in the four-year
Presidential cycle because politicians turn to finding ways
to boost the economy
in preparation for the key Presidential Election year when
votes and campaign
contributions are so important.
Tell that to the FED! With inflation high, the
pressure has been on Powell and
his friends at the FOMC to slow down the economy as a way
to curb runaway
prices. The oil stocks' and big bank stocks' declines
suggests that the economy
is weakening. But not to the point where there is a
recession or a bear market,
at least, among the DJI-30 stocks which are the most
resilient and able to
handle inflation and higher interest rates. Thus, the
DJI is holding up above
a price support only 9% below its peak.
Table 1 still warns us that there are 3x more new lows than
new highs among
all NYSE and NASDAQ stocks. So, in buying now and
until year end, because
of tax loss selling, we must avoid the weakest stocks.
But the bullish MAXCPs
are not impressive right now. So, what to do?
Selling short the weakest bearish MINCPS is one answer.
Buying gold stocks
I have also suggested. But with the DJI, QQQ and SPY
ETFs each holding up
above their recent lows, we could try trading them for
another rally back to their
recent highs even before the middle of December. With
QQQ, more than 10%
weaker than the DJI, I have suggested avoiding it, and, in
fact, even shorting it
as a hedge.
On Tuesday, we see what the CPI numbers were for last
month, November.
Because of oil's sell off, I would expect the CPI to drop
markedly. That
would help explain the strength we are seeing at the
opening now. More
important will be what the FED chooses to do about the
still very high rate
of inflation. Bank stocks, better than any other
group, are sensitive to
FED changes of policies. Since GS has broken down
(See below) and JPM
shows a potential head/shoulders, I
think we have to expect the FED
to be unready to reverse its tightening policies. If
I am right, then the
DJI will be right back at the current price levels a week
from now when
buying will become seasonally attractive.
So, the only action I would take now is buy
NVDA because of the
accelerating pace up of its Closing Power. Hold
QQQ short.
I am still working on a number of minor revisions to
the Peerless software,
but they should be done on Tuesday when I post the
revised Peerless
software on the ESP page then. |
|
| |
GO TO www.tigersoftware.com/5HLM/INDEX.htm
|
|
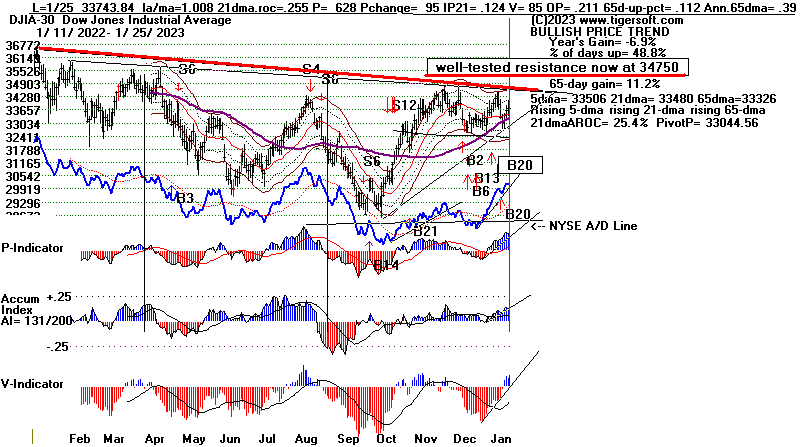
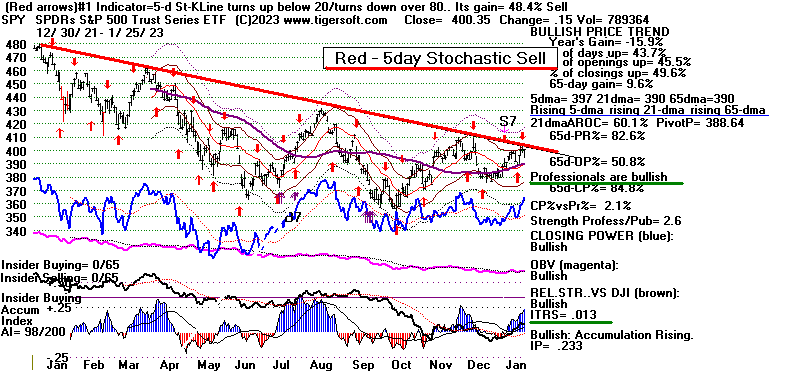
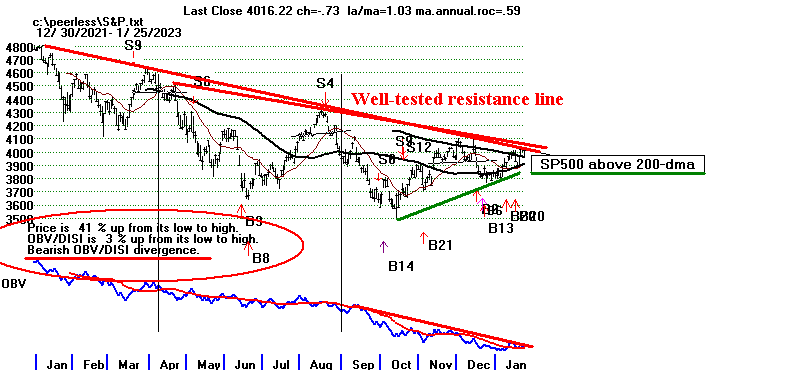
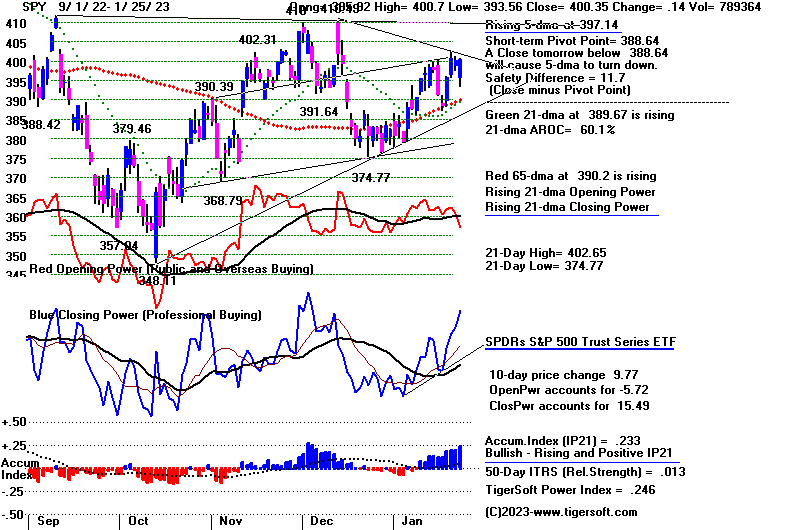
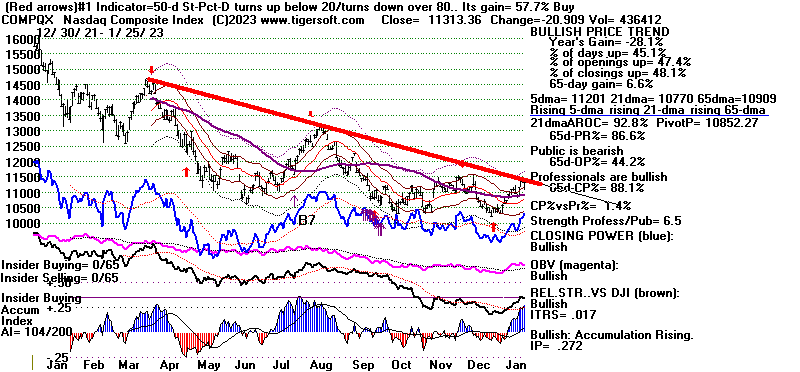
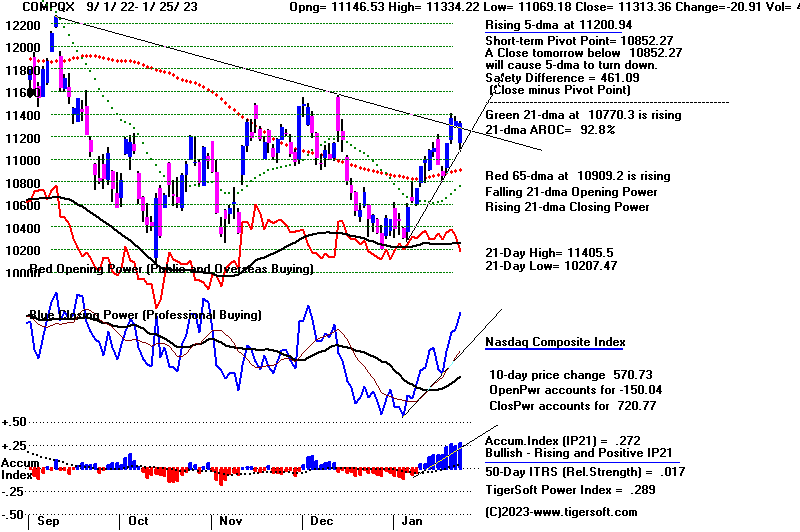
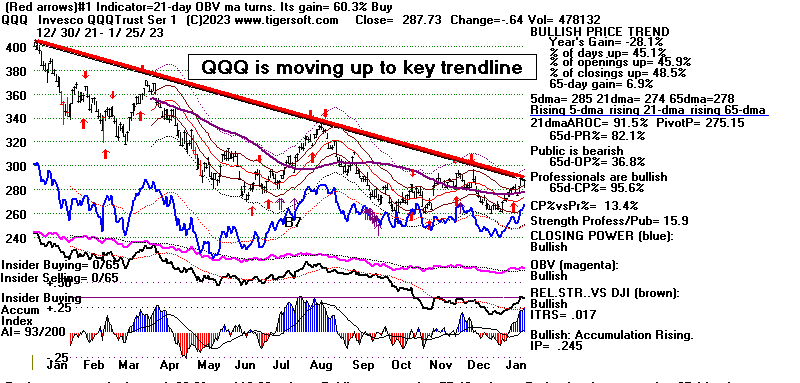

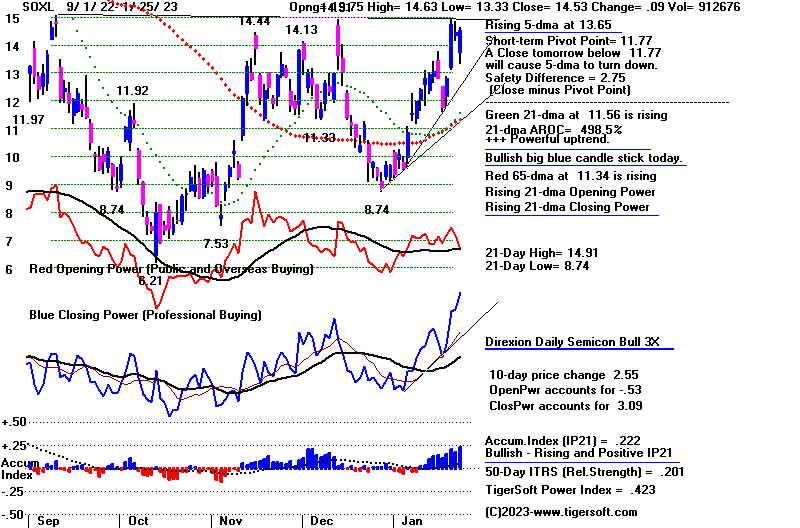
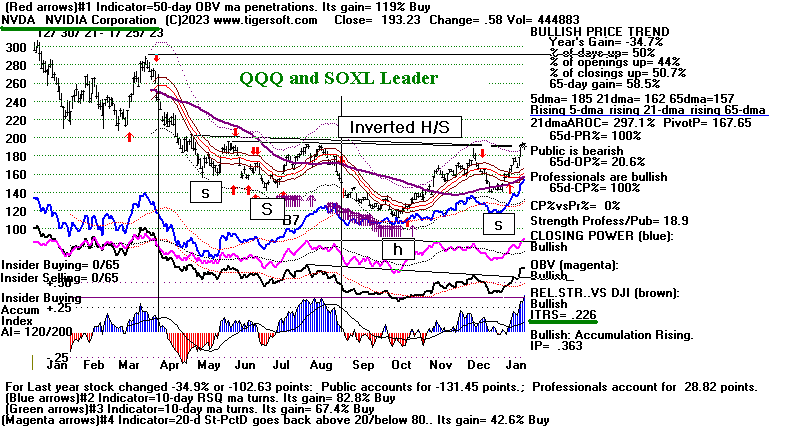