SORTING UP-PCT, OPEN-UP-PCT,
CLOSING-UP-PCT
(C) 2015 William Schmidt February 15, 2015 www.tigersoft.com
----------------------------------------------------------------------
The method for doing this from TigerSoft with the latest 2/13/2015
software is using:
PEERCOMM + CHARTS-2015 + RANKING RESULTS +
TIGER UP%, OPENPWR%, CPPWR%.
This produces a table of data as shown below.
Here I have produced the UP-PCT, etc. Table based on the
newHIUPPCT stocks from Tiger Data Page. This group is
built for users using the following criteria:
These have an UP-PCT ranging from 55 to 59. ASH for example
rose 59% of each of the past 250+ days for the past year, as of
2/13/2015. The OPEN-UP PCT shows that it opened up 51.4%
of the time and the CLOSE-UP PCT shows that it rose 56.2%
from the opening to the close this past year. Its current price is
127.58. It has risen 34.5% this past year. At the far right of these
Tiger Tables you will see a "UU" when the stock's Opening Power
and Closing Power are above their 21-day ma. To improve
trading short-term trading results buy these stocks when they
become "UU"s.
Stocks simultanously within all three of the following ranges
Daily Up % 55-59
OPEN-UP % 51-61
CLOSE-UP % 55-75
are believed to have the highest probability of advancing
day to day as long as the Closing Power is rising and does
not break a steep uptrend or break below its 21-day ma.
.
Click on any row and then the button "CHART" to see the
current graph. And re-sort the data by PCT-GAIN for the
year to see how the different values match up with how
the stock did for a year.
20 of these 39 stocks and ETFs closed up more than 34%.
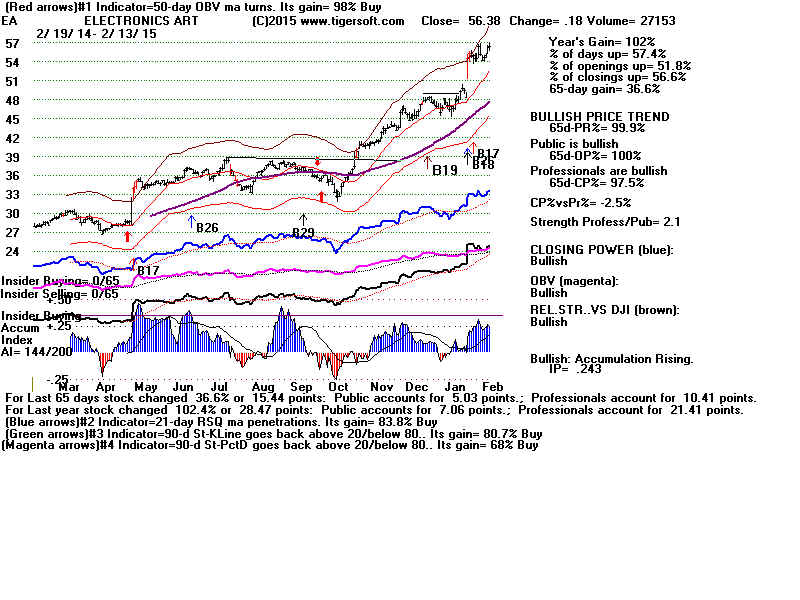
EA (102%) and SKX (+90.7%) were the best performers.
And since their "TGR" signature is "UU", they may still go
higher short-term.
18 of these trading instruments were actualy ETFs at this time.
If we eliminate them, then 14 (66.7%) of the 21 stocks
gained more than 34%. But don't disregard the ETFs.
They also include some big gainers:
IIF +71.2%
TQQQ + 64.9%
FAS +48.2%
QLD +41.8%
Stock
UP-PCT
OPEN-UP
CLOSE-UP
CURRENT
PCT
PCT
PCT
PRICE
GAIN
------------------------------------------------------------------------------------------------------------------------------
ASH            59            51.4          56.2          127.58        .345         UU
ESS            59            53.4          59.4          226.59        .368         DU
FDS            59            51.8          57.4          155.05        .501         ?U
IVE            59            55.4          57.4          94.7          .13          UU
MO             59            53.4          56.6          54.76         .558         UU

SKX            59            57            57.8          66.09         .907         UU
IIF            58.6          51.8          61            28.87         .712         ?U
IWD            58.2          55            57            105.39        .131         UU
BRCM           57.8          53.4          56.2          45.69         .483         UU
PPC            57.8          60.2          55            26.75         .602         ?D

REZ            57.8          51.4          59.4          62.12         .254         UD
EA             57.4          51.8          56.6          56.38         1.02         UU
NSC            57.4          55.8          59.8          109.91        .217         DU
VGT            57.4          62.2          55.8          108.04        .192         UU
CTL            57            59            56.2          39.46         .277         ?U

DDM            57            59.4          56.6          137.98        .276         UU
DFT            57            53.4          56.2          31.83         .226         D?
IGM            57            60.6          58.6          105.17        .159         UU
IVV            57            57            55.4          211.26        .147         UU
LOW            57            53.4          57.8          72.05         .548         UU

NOC            57            55.4          57            167.14        .404         UU
QLD            57            61.8          56.2          145.97        .418         UU
RSG            57            59            56.6          39.34         .166         ?D
SHW            57            54.6          57            285           .476         UU
TQQQ           57            61.4          56.2          106.86        .649         UU

TSO            57            52.6          56.6          81.92         .629         DU
XLK            57            59.8          57            42.65         .186         UU
BR             56.6          51.8          55.4          52.59         .412         UU
DIA            56.6          59.8          58.6          180.34        .123         UU
FAS            56.6          58.2          56.2          125.53        .482         UU

MAR            56.6          53            57.8          79.4          .541         DU
QQQ            56.6          60.2          55.4          106.91        .193         UU
CB             56.2          52.2          55.4          102.02        .186         DU
UPRO           56.2          56.6          55.4          139.44        .503         UU
VDC            56.2          57.4          56.2          127.48        .201         U?

IYW            55.8          59            57            107.68        .193         UU
BLL            55.4          53            55            74.93         .365         UU
KIE            55.4          54.2          56.2          67.42         .125         UU
XLY            55.4          58.6          57.4          74.89         .157         UU
|
|