(C) 2015 William Schmidt, Ph.D. 2/15/2015
------------------------------------------------------------------
With the bull market almost 6 years old, long-term
holding is probably not advisable unless one also
agrees to sell out when Peerless finally gives a
major Sell. Instead, watching for consistently
profitable trading situations seems a better approach
now. Earlier in a bull market, one could buy and
hold with much more success.
------------------------------------------------------
Targeted trading opportunities' profits quickly add up.
The trick here is to be patient, use the Calendar,
Peerless and Tiger tools.
If we can make 5 straight trades gaining 20%,
our money has risen more than 240%. If we can
we make 5 straight trades each gaining 10%,
our money jumps by 60%.
Opportunities that we can spot do not come every
day. So patience is needed. Here is a list
to start with of what I consider tradable
opportunities with a high chance of making 10%-20%
quickly.
1) Buy beaten down stocks in January whose
Closing Power breaks its downtrend. Goal 10%-25%
for stocks. More with leveraged ETFs.
Examples: Gold and Oil in 2015
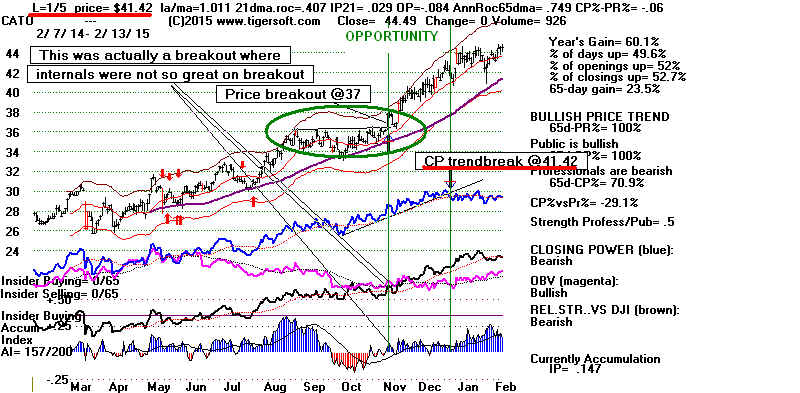
2) Buy a perfect flat topped breakout in a stock
with considerable upward momentum. Use 10%
stop loss or stop sell on close below 21-dma.
Sell when you have a 10%-15% profit.
Example: CATO below (perfect flat top and CP making
confirming new high). Tiger finds these before
the breakout using ALMOSTNH or NEW
HIGHS after the breakout. There are lots of
these in most years. But when they start to fail,
pullback from this approach. It is a danger sign
for the general market.
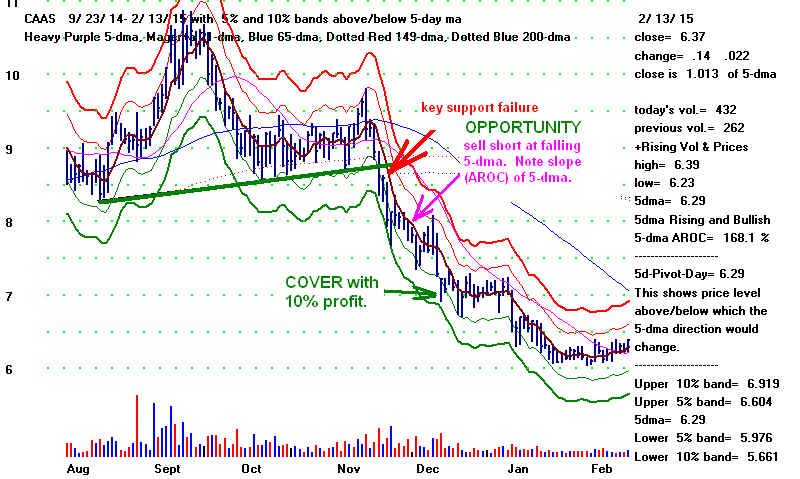
3) Sell short a stock in a steep downtrend on its
first few rallies to its falling 5-day ma. Use the
6 month charts to see the 5-day ma and volume.
Goal 10% but sometimes much more is achieved
by covering when Closing Power downtrend is
violated.
The BEARISH MINCP and NEWLOWS
lists of stocks will give you candidates for this.
Example: CAAS below.

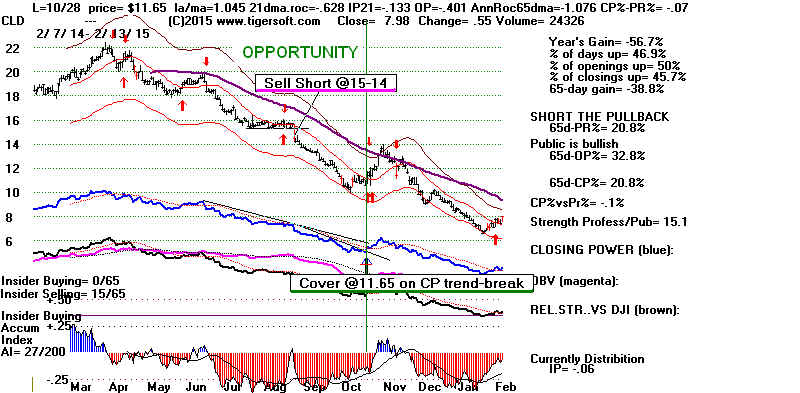
4) Sell short a stock that breaks below flat, well-tested
support and shows heavy distribution. Goal 20%.
Cover when Closing Power breaks its downtrendline.
Example: Notice heavy red distribution.
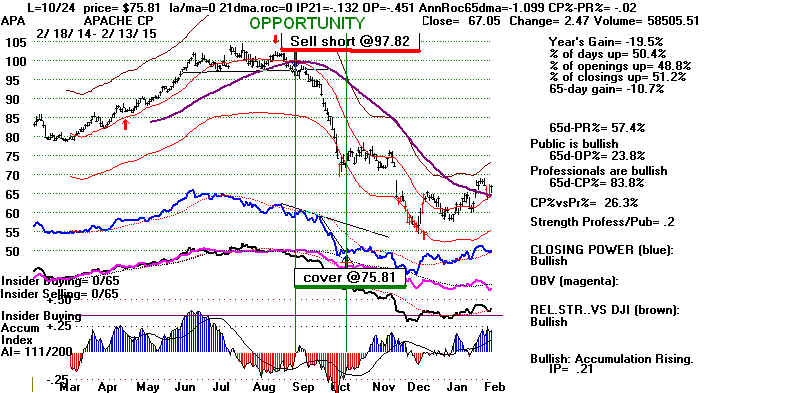
5) Sell short stocks showing distribution when they
have formed head/shoulders patterns and the CP
uptrendline has broken. Goal is 65-dma or
a projected low based on the height of the pattern
from neckline to head's peak. 10% gain is most
commonly achieved in high caps, 20% with smaller
stocks.
Example: APA
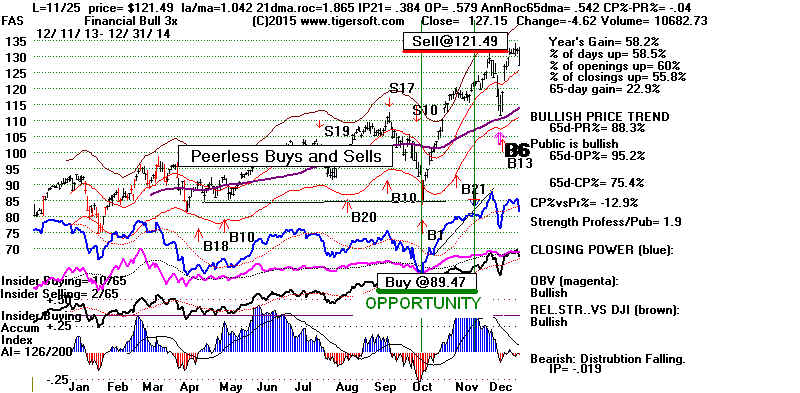
6) Buy FAS when Peerless gives a new Buy signal|
on weakness. Work with a 10% stop loss or a
Sell Stop on close below well-tested support.
FAS correlates very closely with DJI-30 and so
can be traded very well with Peerless. It is a
3x leveraged ETF.
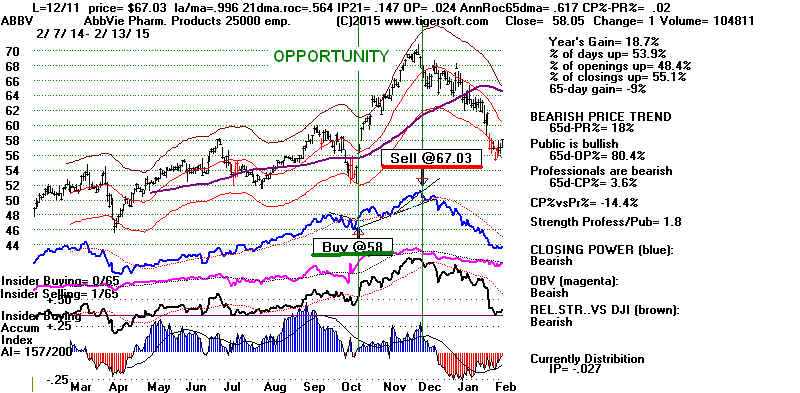
7) Buy on a pullback to support like the 65-dma|
when Closing Power turns up and there has recently
been a bif bulge of Accumulation. Goal 10%-20%
Example: AABV
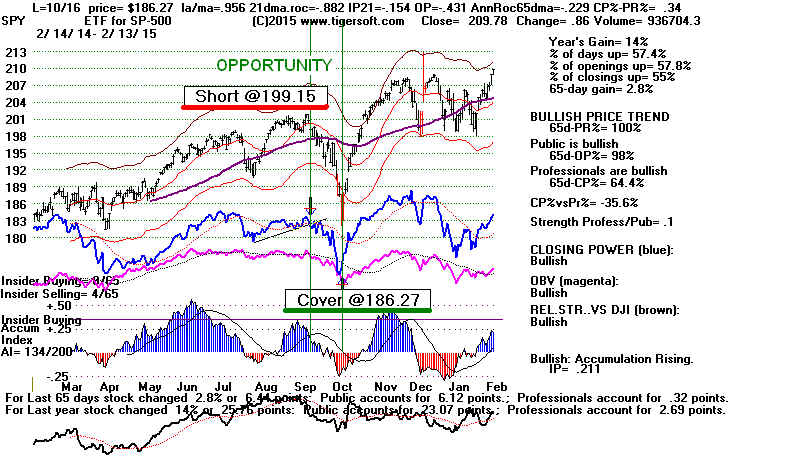
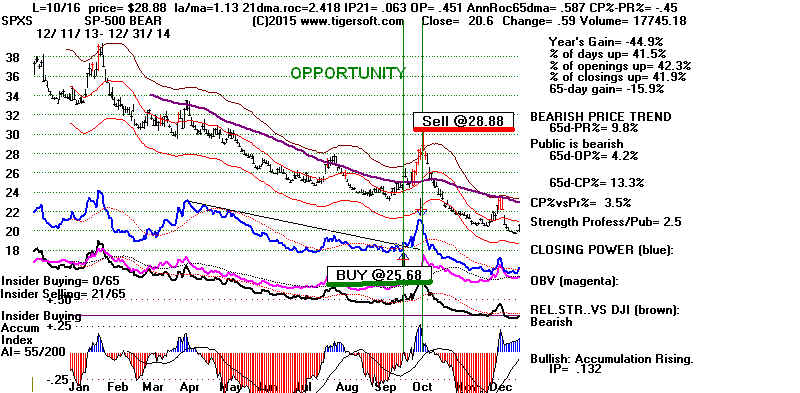
8) Sell Short leveraged general market instrument
in September for typical September-October
decline when Closing Power uptrend is broken,
especially if Peerless gives a Sell signal. Goal 10%
EXAMPLE: SPY and SPXS, 3x leveraged short on SP-500.
9) Buy Biotechs coming out of a long base when they show the highest
volume in a year. This usually occurs when they announce very
auspicious clinical trial results or they get FDA approval for one
of their developmental drugs.
10) Buy a stock showing a new optimized-best Stochastic Buy at support
and showing improving internals. Seek a 10% gain. Sell stops can
be used just beneath the support level.
To find these Run the Optimized Program for a directory of stocks:
Peercomm + Older Charting + Run/Setups + Run Best Indicator for All Stocks +
Click "X:" when job finished + Charts 2015 + Tiger Selections-#1 Indicators +
Sorts + New Buys (or Sells for short) + Inspect charts of those stocks with
a Gain of more than 50(%). Look for support levels and bullish divergences
or Non-Confirmations.
Example TSLA Buy on Buy arrow at 196.57 showing 14-day Stochastic buys
were best trading system. Sell at expected resistance of falling 65-dma at 200.
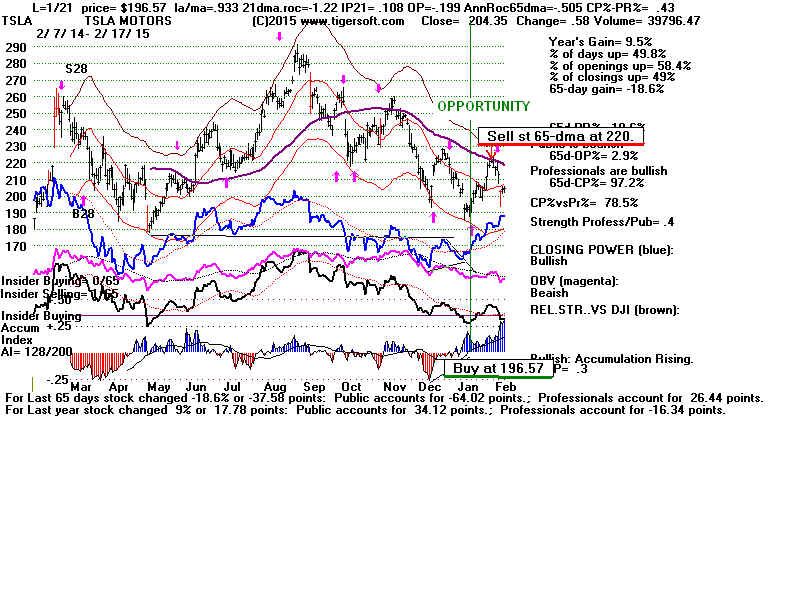
Example TSLA
11) Buy leveraged DIA or SPY soon after
December 17th for Santa Claus Rally. Goal 10%.