(C) 2015 William Schmidt, Ph.D. www.tigersoft.com Last edited 3/29/2015
--------------------------------------------------------------------------
This is a study of IBB's candle-sticks. From what I have observed
IBB is not atypical and we may confidently apply these general principles
to other ETFs and stocks. See other CandleSticks of Interest: 2014-2015
In no way does candle-stock theory constitute a substitute for applying our
knowledge of price patterns, momentum/ moving averages, Closing Power
trends/non-confirmations, volume and Accumulation. But because of their
clarity and simplicity, I think you will find Candle-sticks a very helpful
augmentation of other Tiger principles. Because of how closely Candle-sticks
relate to Closing Power, the other Tiger principles are seldom in conflict
with TigerSoft candle-sticks.
Tiger Candle sticks feature a black line showing the
day's high and low. There is a box colored either
red or blue. The color is red when the close is
below the opening. It is blue when the close is
above the opening. When the box is red, the top
of the box coincides with opening price and
the botton coincides with closing price. When
the box is blue, the bottom of the box shows
where the opening is and top of the box shows
where the close is.
Most often price uptrends are made up of a series
of blue boxes. Usually downtrends are made up
of a series of red boxes. It is the transitions we have
be alert for. Tiger users would normally watch for
Closing Power Non-Confirmations and trendbreaks.
But often a bearish or bullish candle-stick will occur
before there is a Closing Power trendbreak. Especially
short-term traders should be aware of the power that
certain candle-sticks have in bringing about reversals,
especially at tops.
Blue Boxes, Candle-Stick Patterns and Trends.
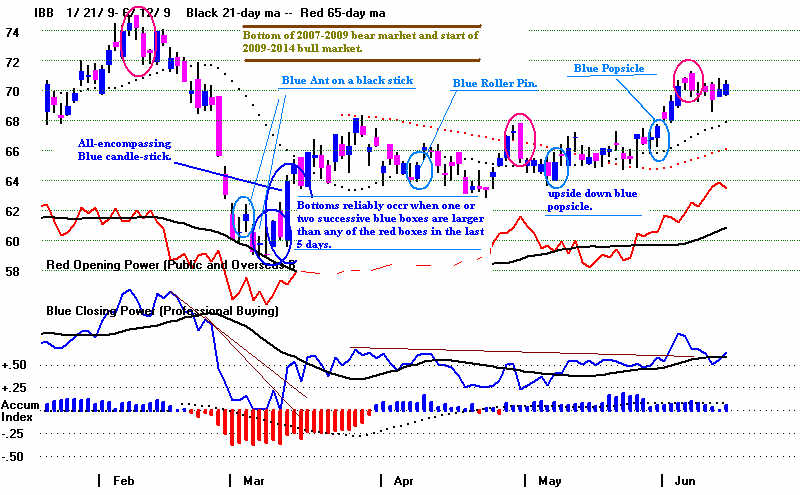
Declines reliably end when there is a blue box which
is bigger than the red boxes of the preceding decline's
last five days. This is also called a "blue encompassing"
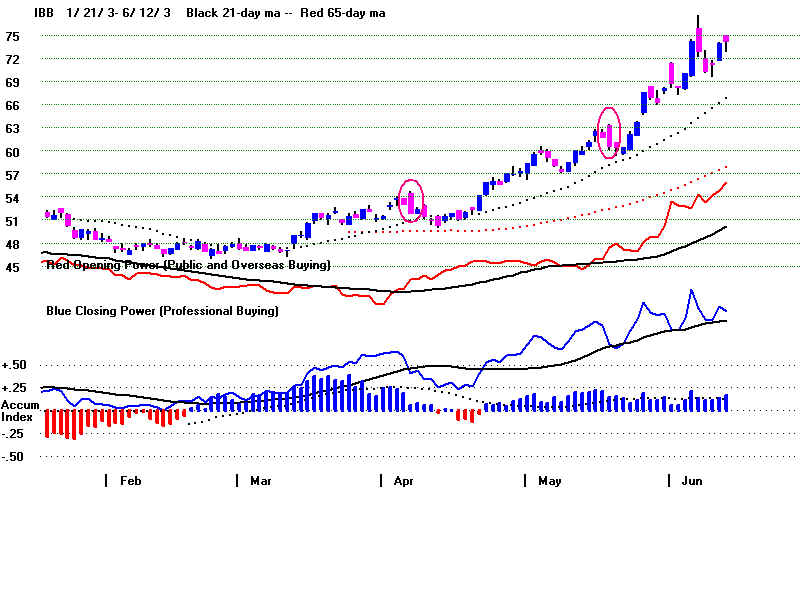
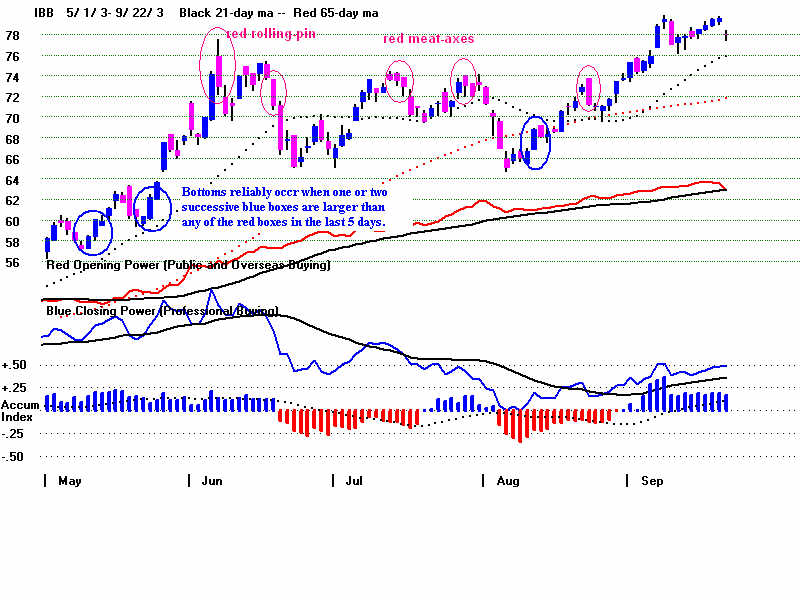
candle-stick. Bottoms also can occur when two successive
blue boxes are larger than any single red box appearing in the
last five days. See this as IBB reached its bottom just
as the new 2009-2015 bull market.
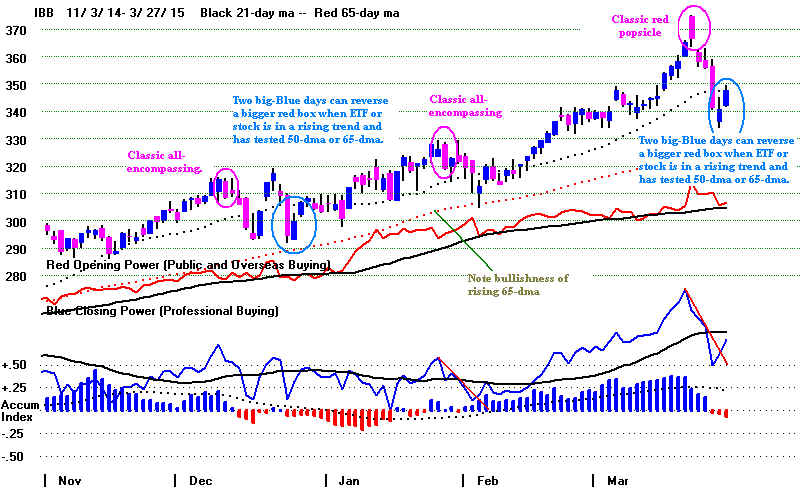
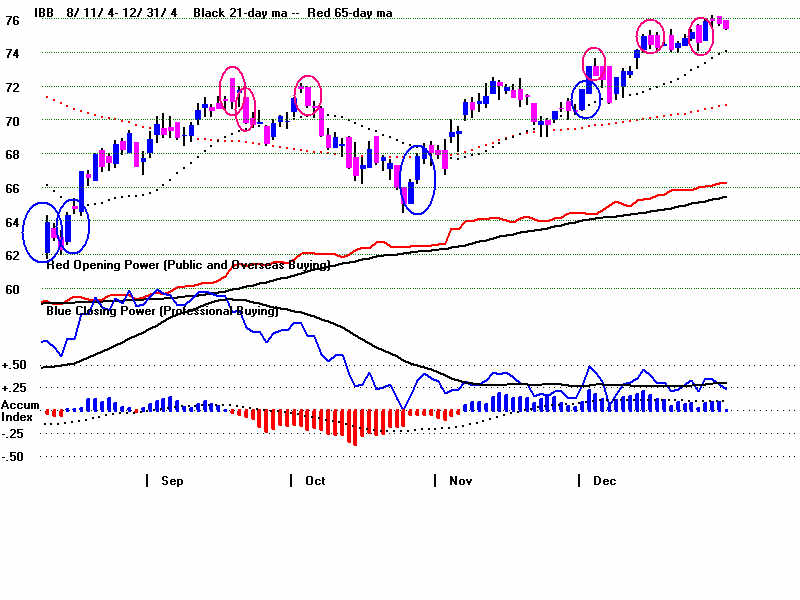
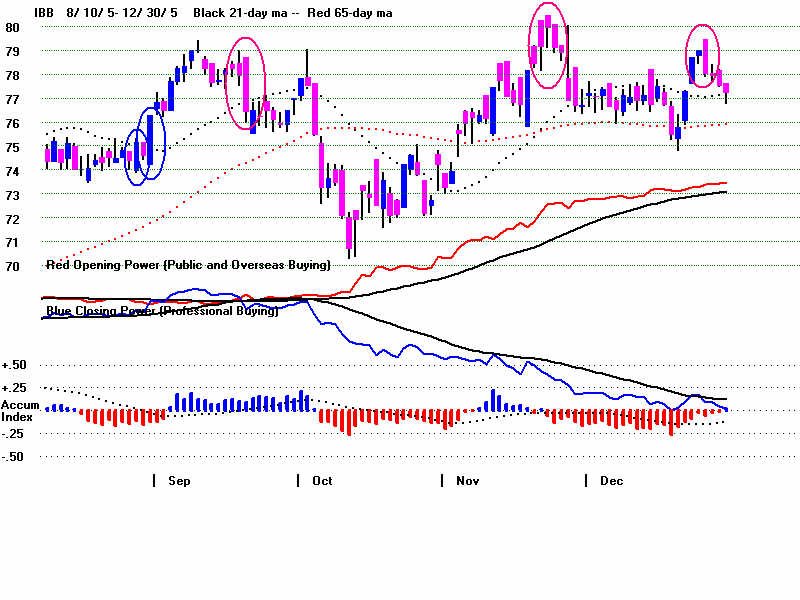
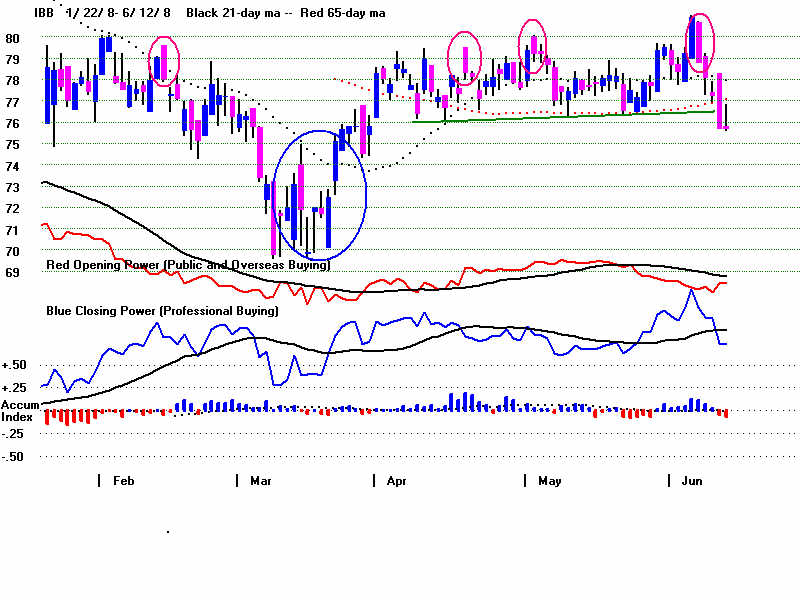
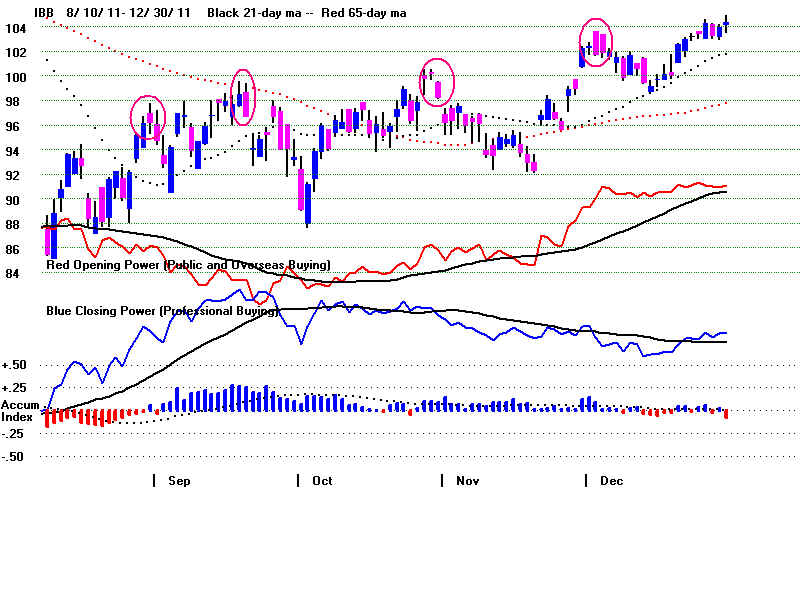
Two big Blues can reverse a bigger red "all-encompassing"
candle-stick. This occurs after support like a rising 65-dma has
been tested. The Closing Power downtrend will then also
be violated making entry in the market advisable. For example,
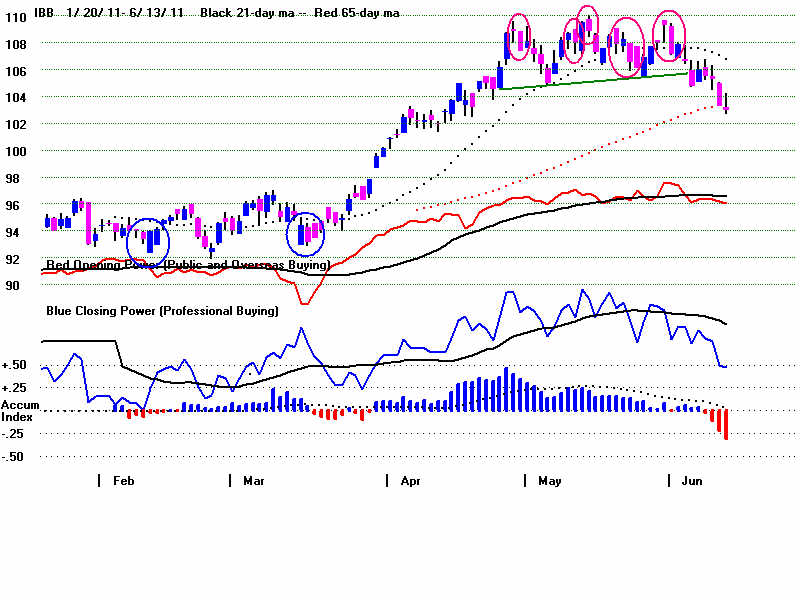
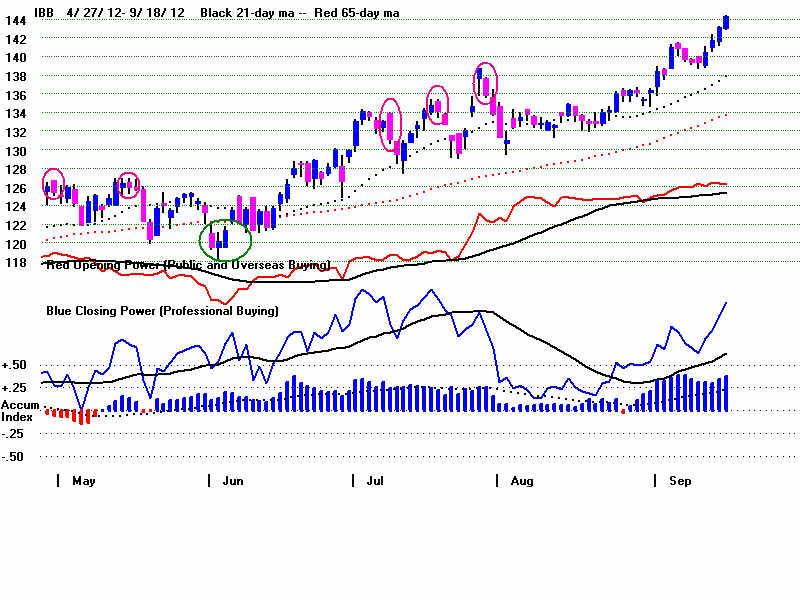
March 2015, mid-December 2014, September 2012, February 2012
and October 2011.
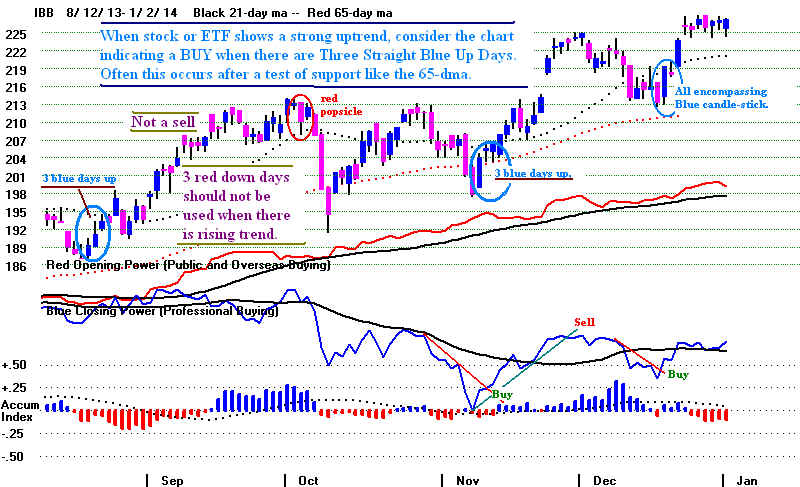
Red meat-axe
When IBB or any stock/ETF is in a strong uptrend, three straight
Blue boxes after a decline constitute a good place to Buy. (The
opposite proposition could be demonstrated for three straight Red boxes
after a rally when the stock is in a downtrend.)
"Blue roller pins" and blue popsicles" (right-side up and upside
down) are short-term bullish. "Blue ants on a stick", by themselves
one only bullish for a day or a two, generally speaking. You
will find many examples of these. You may even want to christen
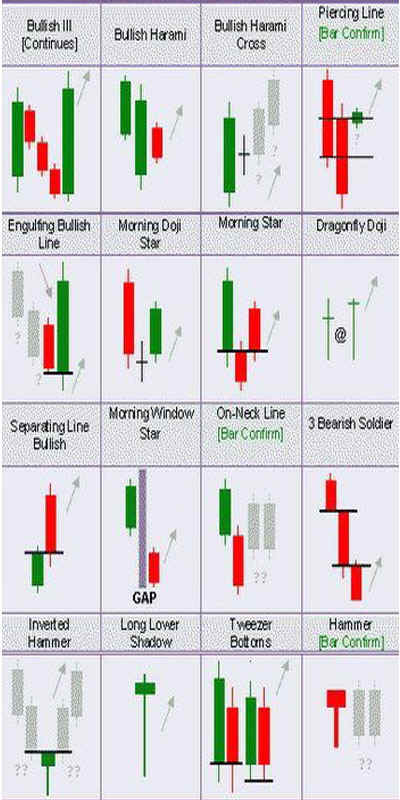
some with other memorable names. (My own understanding of Japanese
names matches my utter mystification with that language and culture.
Google such terms as "evening star", "hanging man", "doji" and
"three bullish soldiers", for more information. My impression is
is that some of these patterns are for only trading a day or two out.)
Tiger Candle-Sticks
red popsicle
red roller-pin
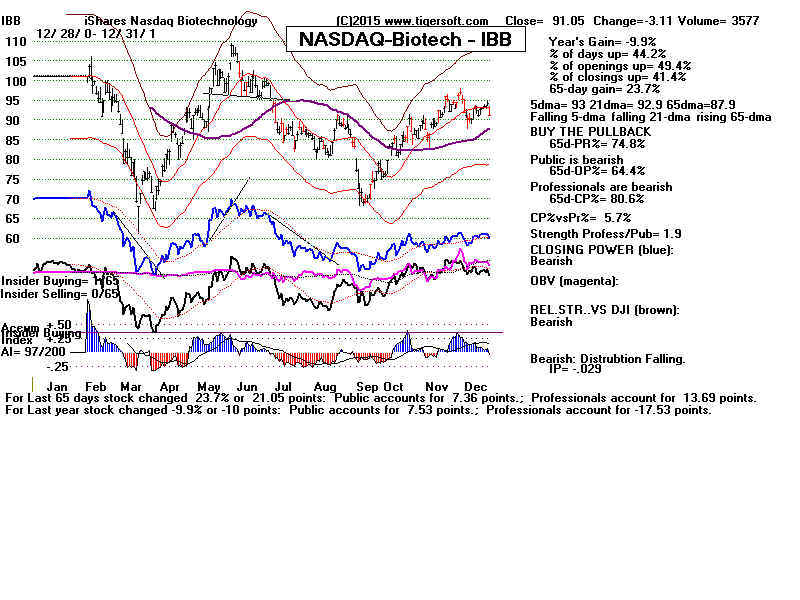
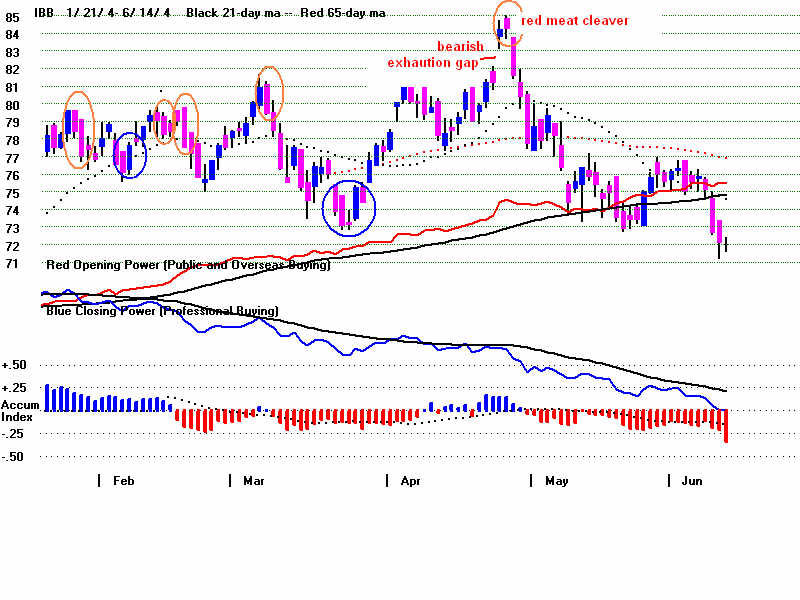
Red Boxes, "Popsicles" and Trends.
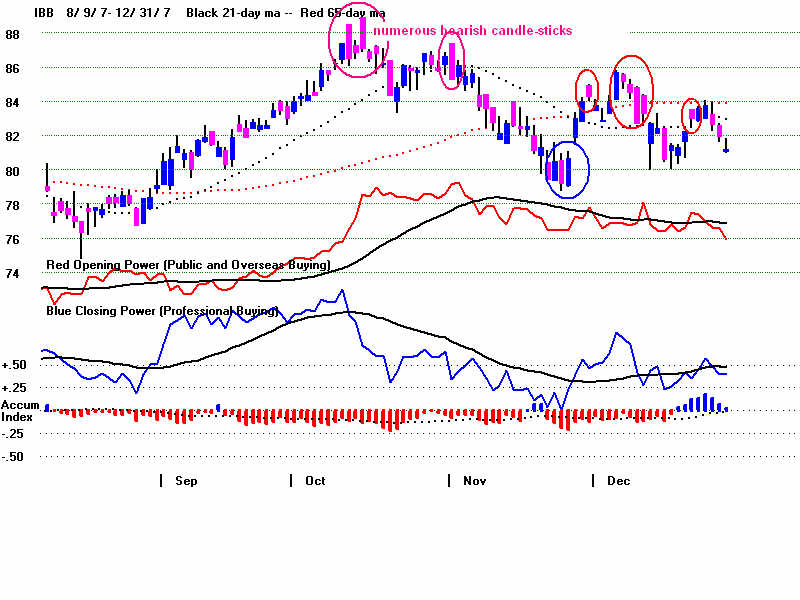
Rallies typically end with recognizable red candle-stick patterns.
The blue patterns suddenly turn red. The bigger and more numberous
the red boxes, the more bearish the situation. This is especially
true after a long run-up in a rising trend or at falling resistance
like the 65-ma when a stock or ETF is in a downtrend. IBB seldom
declined more than 20% from a peak, so the reader will want to
apply these ideas to other ETFs and stocks that showed longer
and more substantial downtrends. Elsewhere, see some ETFs in
sharp sell-offs in 2014-2015.
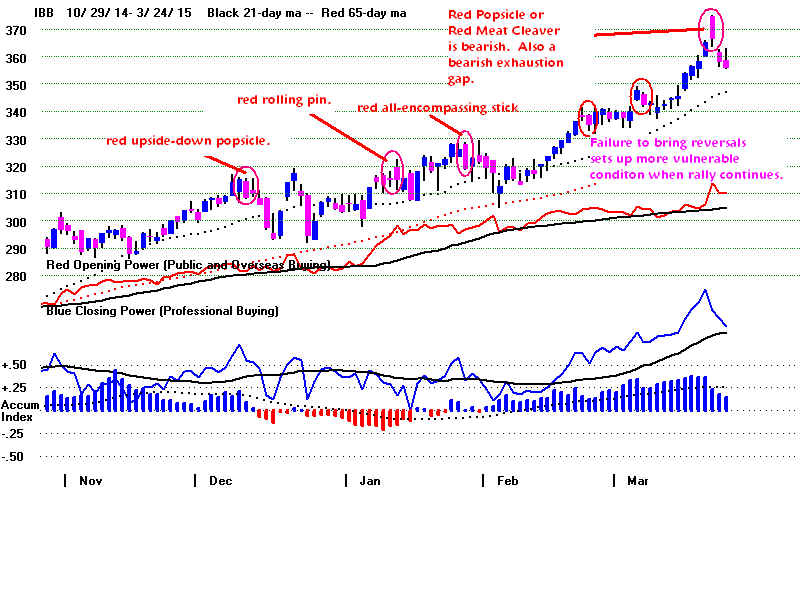
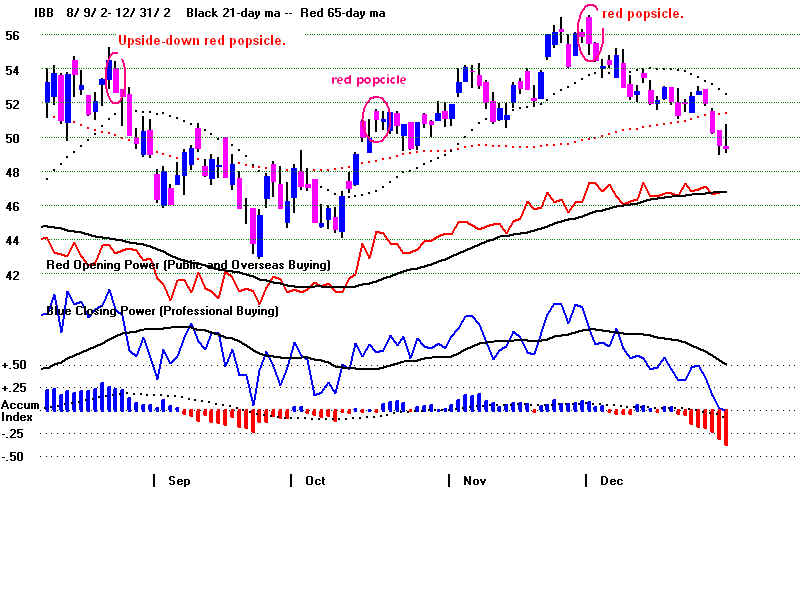
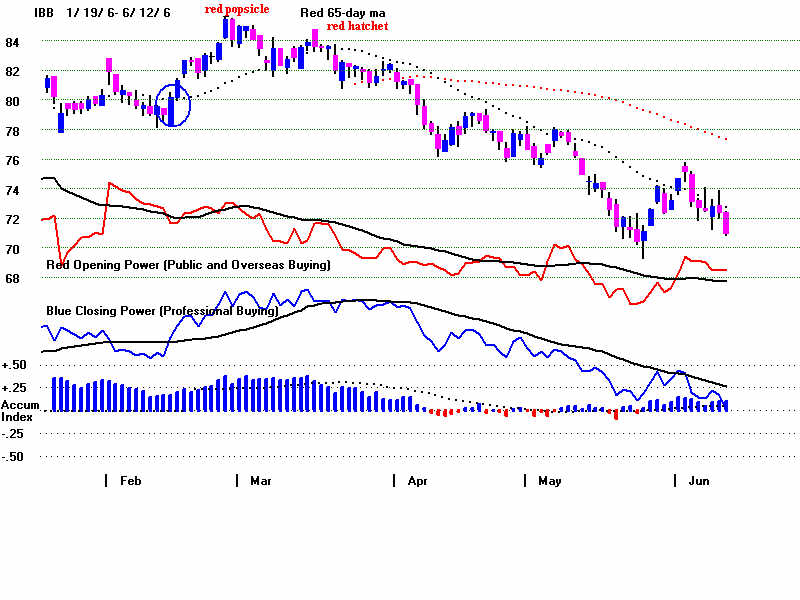
Rallies typically ended with recognizable patterns:
Red popsicles, right-side up or upside down.
These often look like blood-red meat cleavers.
They are dangerous after a long advance. The
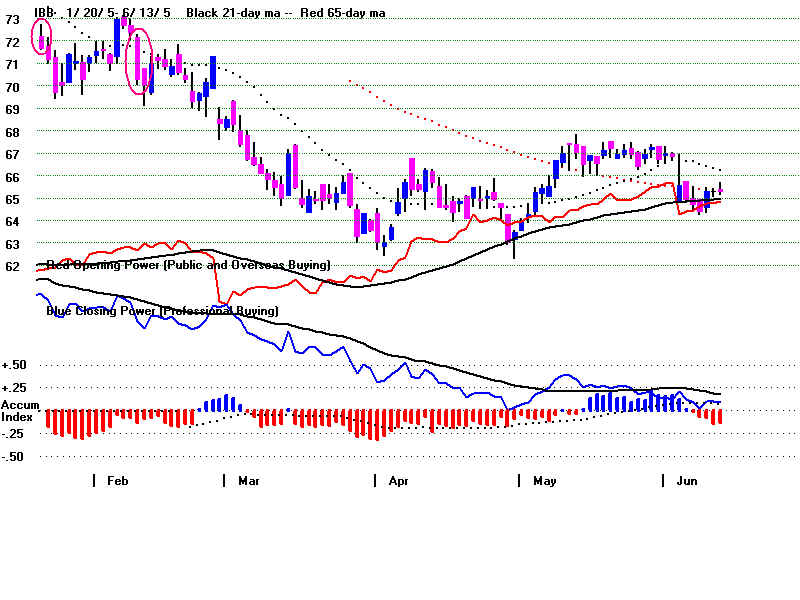
March 2015 example of a red popsicle below
in the chart below is an unusually clear-cut example.
There was also a smaller one in February. Prices
had not risen so much and its appearance actually
created only a short-term bullish consolidation.
December 2014 shows how an unside-down red
popsicle. Again, occurring after only a minor rally,
it led only to a minor four-day decline.
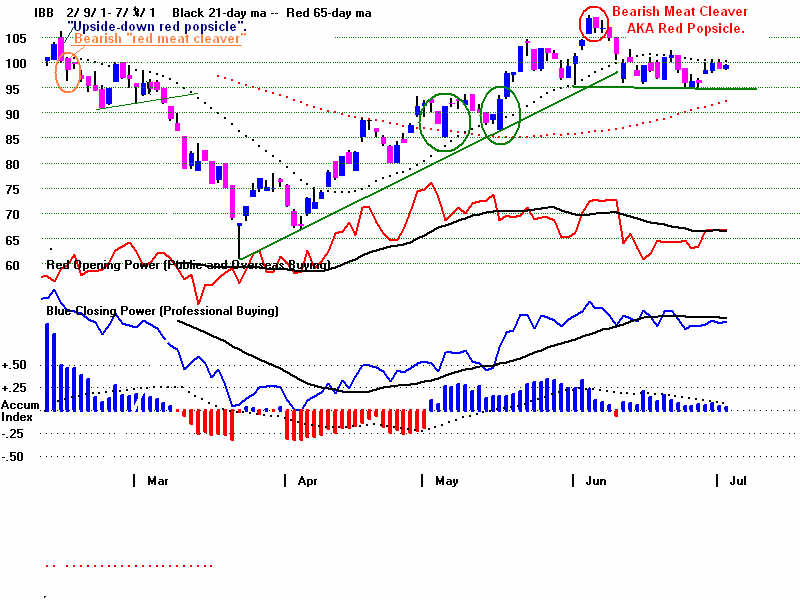
The appearance of 3 red popsicles in four days in
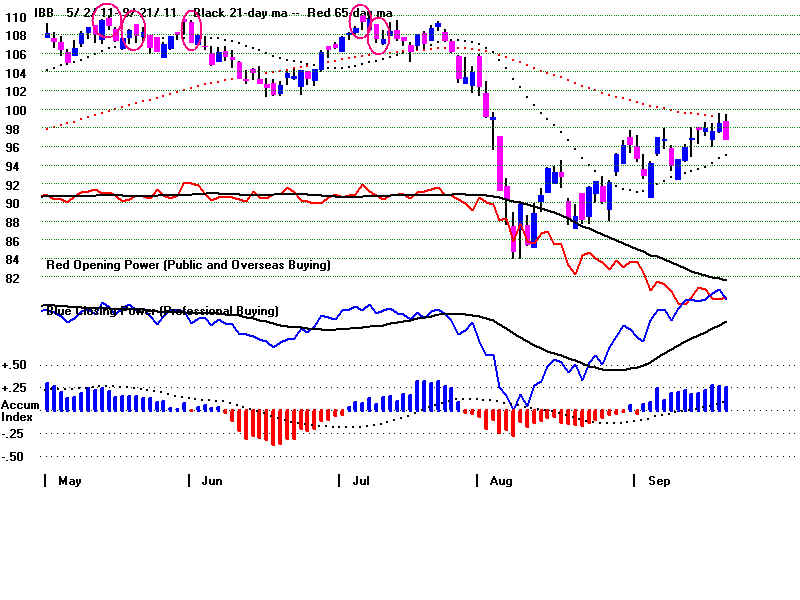
June 2001 was particularly bearish. It brought on
a severe decline: IBB fell from 102 to 72 in 3 months.
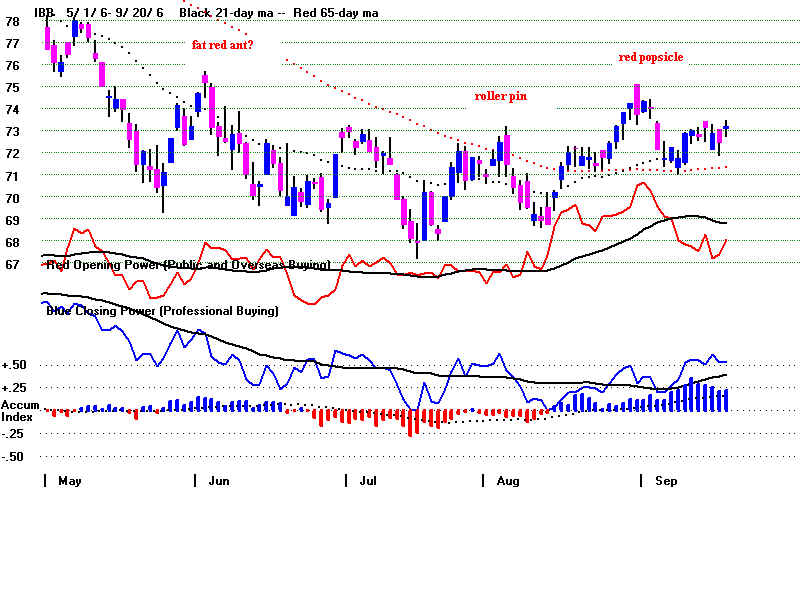
A red popsicle popping up at the falling 65-dma
in August 2001 was particularly timely. In an
on-going bear market, this where rallies typically
stall out.
The more red patterns that appear at or just after the
top, the more bearish the situation usually is.
Other notable red popsicles after rallies:
Nov 2002. IBB fell from 56 to 47.
July 2005. IBB started a consolidation.
Feb-March 2006. IBB fell from 84 to 70.
Aug 2006. IBB only consolidated from 74 back to 72.
October 2007. IBB fell from 87 to 79.
April-May 2008. IBB began a consolidation, falling from 78 to 76.
July - Aug 2008. IBB rose from 83 to 90 and then fell to 80.
Feb 2009. IBB fell from 74 to 60.
May 2010. IBB fell from 90 to 78.
Oct 2010. IBB fell from 90 to 87.
May 2013. IBB fell from 188 to 165.
July 2013. IBB rose from 192 to 200 and fell to 188.
Sept 2013. IBB rose from 206 to 210 and fell to 172.
March 2015. IBB fell from 165 to 137.
Red meat cleavers or red hatchets, right-side up or upside down.
These are common. See February 2001 and June 2001.
They differ from a popsicleonly in that they have a little more of a
black handle. Their bearish after a rally is the same as with a red
popsicle. Their appearance in a cluster of red candle sticks adds
to situation's bearishness.
Other notable examples after rallies:
June 2004. Prices fell 84 to 74.
February 2009. Prices fell from 74 to 59.
Long stemmed red roses or tulips. Example Sept 2008.
This was extremely bearish.
Red rolling pins. These have a big red boxes with
black sticks coing out about equally on both sides of
the box. An example can be seen in August 2002.
Other notable examples after rallies:
June 2003. Prices fell 72 to 66.
Red ants on a pin. (These consist of a red line
crossing the black vertical line.)
See April and May 2001. By themselves, these are
minor sells and bring only a few days' decline or
consolidation. When they occur with the other
red candlesticks mentioned here, they become
much more bearish.
All-encompassing red candle-sticks. In one day
these show a larger amount of red than any previous
blue candle-stick since the last bottom. These
are very common. They often appear after another
red pattern. They are reliably bearish. See the
classic case in March 2002. If they take place on
too much weakness after the top, the bearishness
of the situation may have already been largely used
up.
Three red popsicles.
red popsicle at failling 65-dma.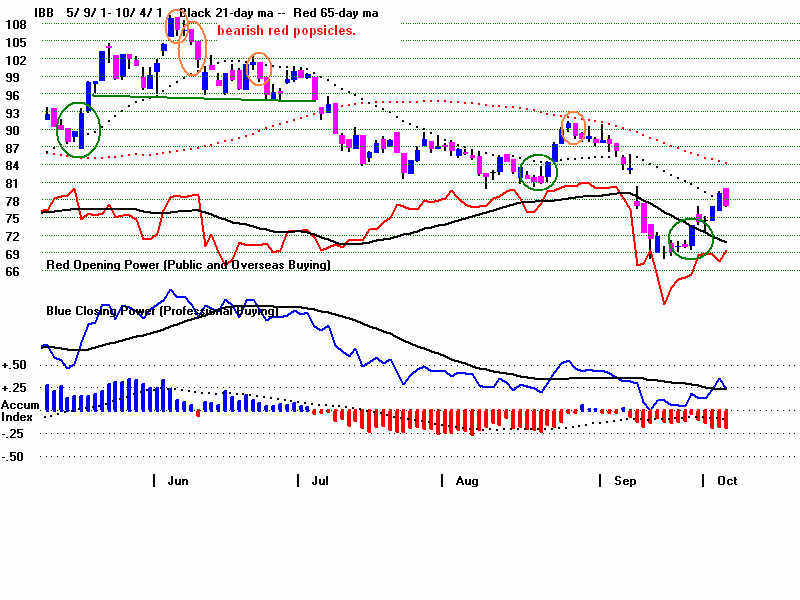 |
|
Our experimental S1s warn of red candle-sticks on TigerSoft charts are not reliable. They show the need to view the actual candle-stick chart. Dismiss these signals when prices are far below the 65-dma or just above it. They work best when prices are over-extended or prices reach expected resistance, such as seen in August 2001, or when a head/shoulders appears, such as seen in May 2001. 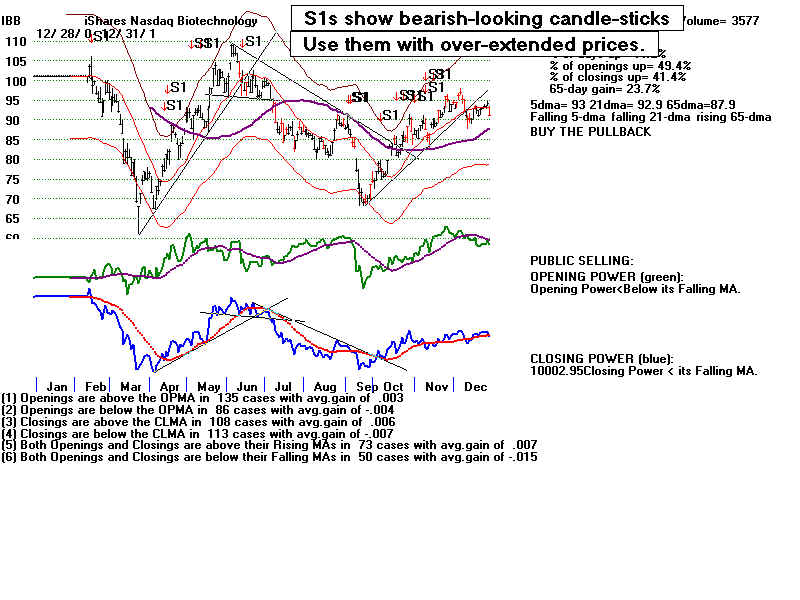 |
| 2001-2002 |
red hatchet
red ant on a stick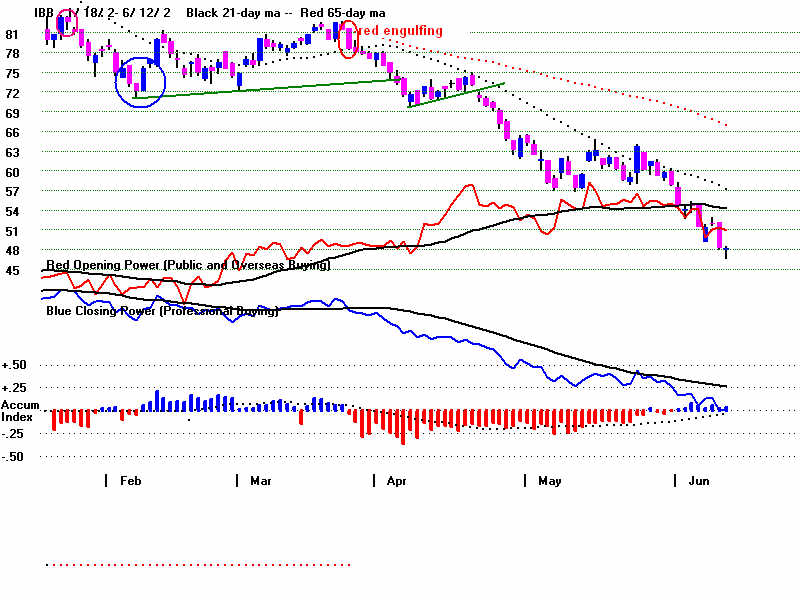 |
red hatchet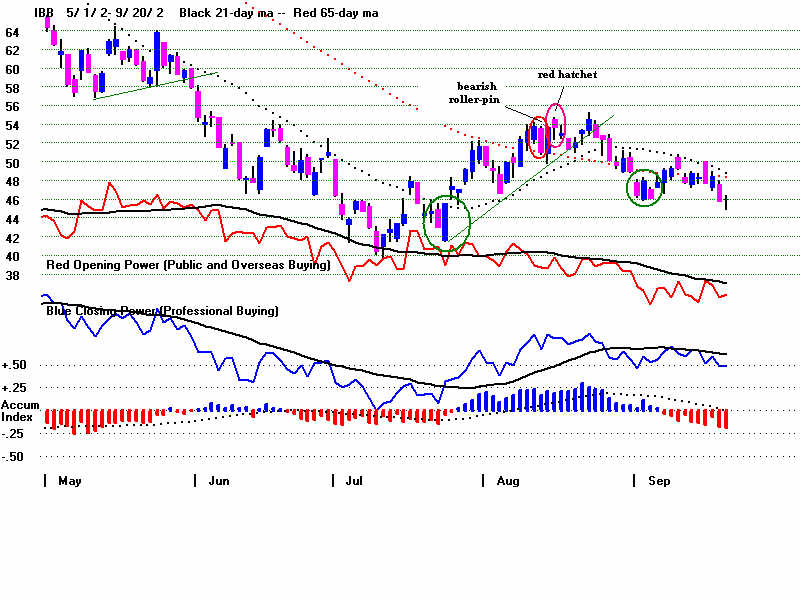 |
 |
| 2002-2003 |
 |
 |
 |
| 2003-2004 |
 |
red popsicles 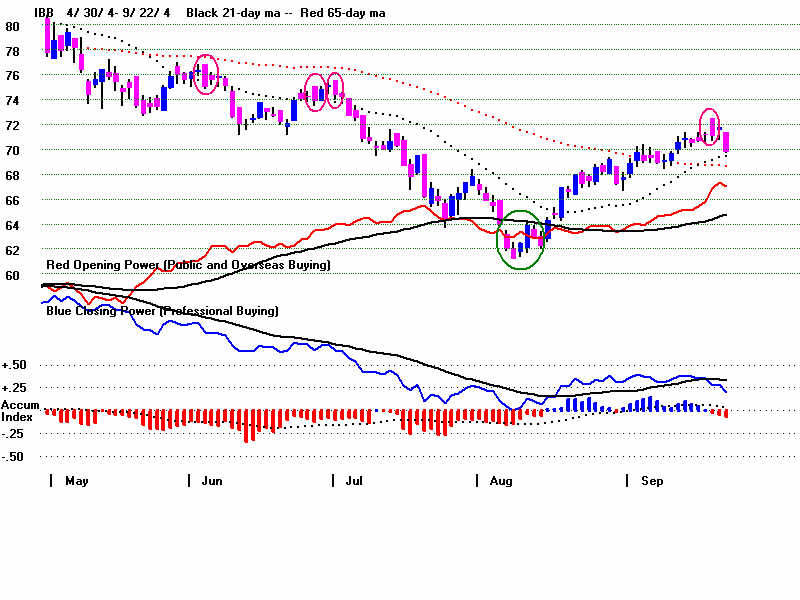 |
 |
| 2004-2005 |
 |
red popsicles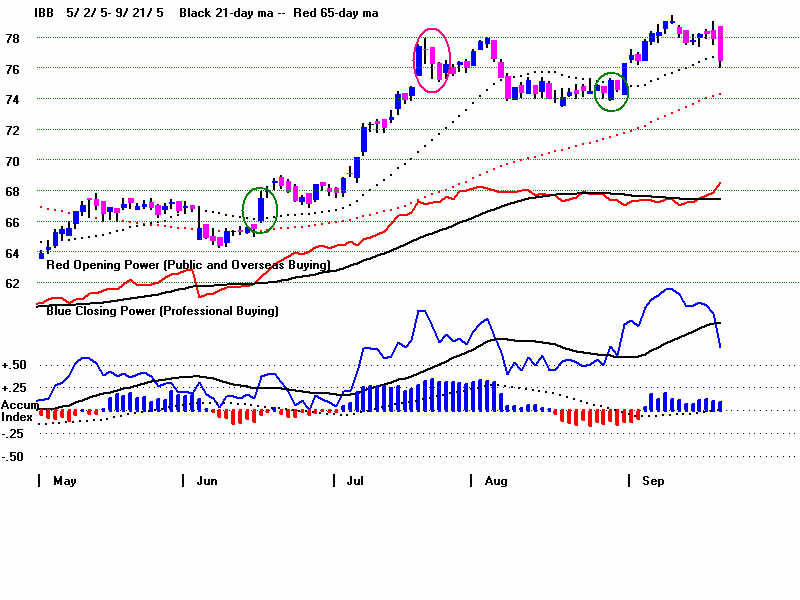 |
 |
| 2005-2006 |
3 red popsicles at top |
 |
 |
| 2006-2007 |
3 red ants in a row
All encompassing on weakness. 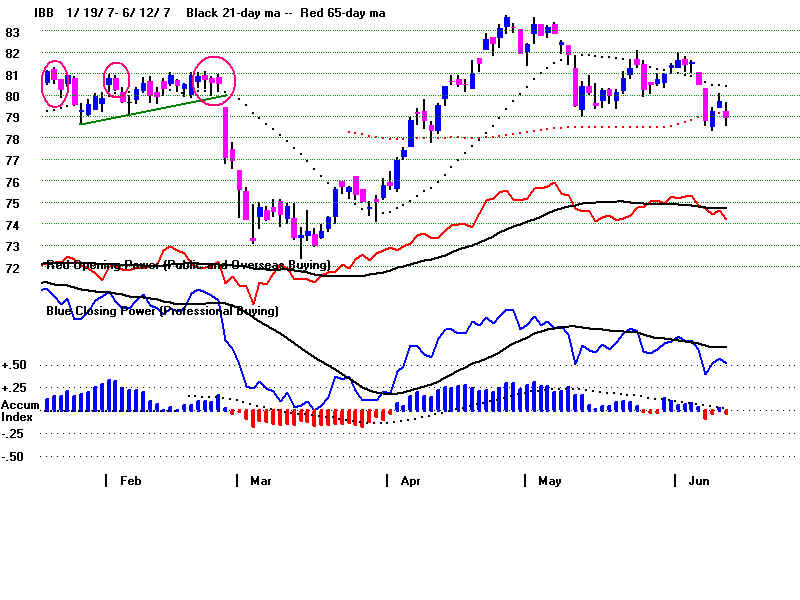 |
red popsicle
red popsicle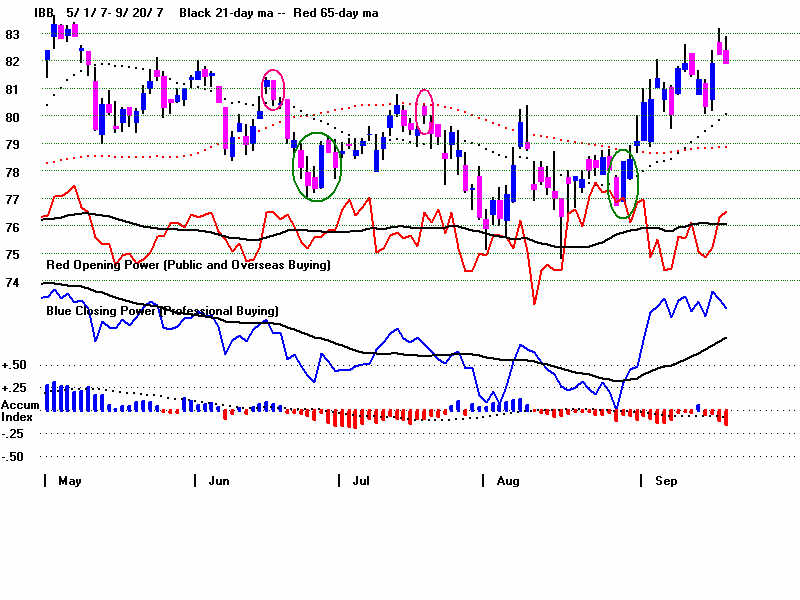 |
red popsicle all-encompassing
cluster of 4
"reds"
 |
| 2007-2008 |
 |
4 red popsicles need to bring reversal.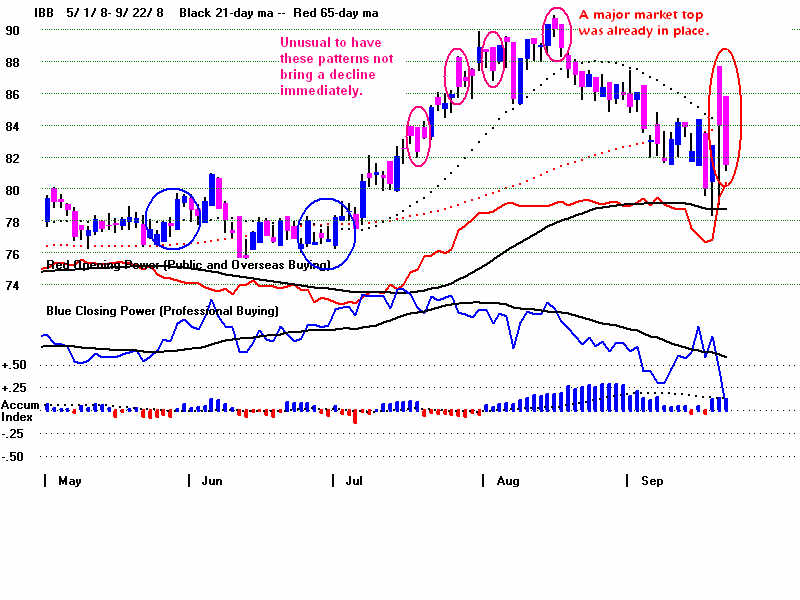 |
long stemmed tulip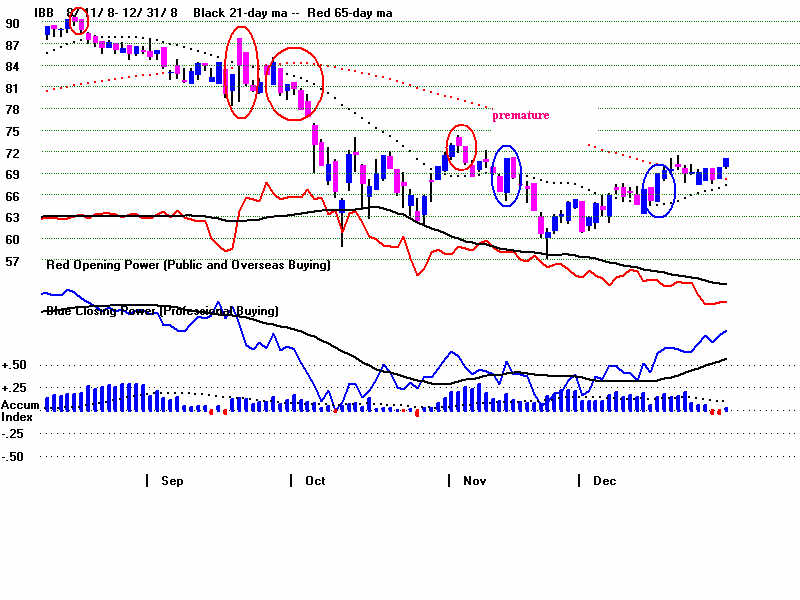 |
| 2008-2009 |
|
red popsicle (meat cleaver), roller pin, pinned red ant. |
|
upside-down red popsicle 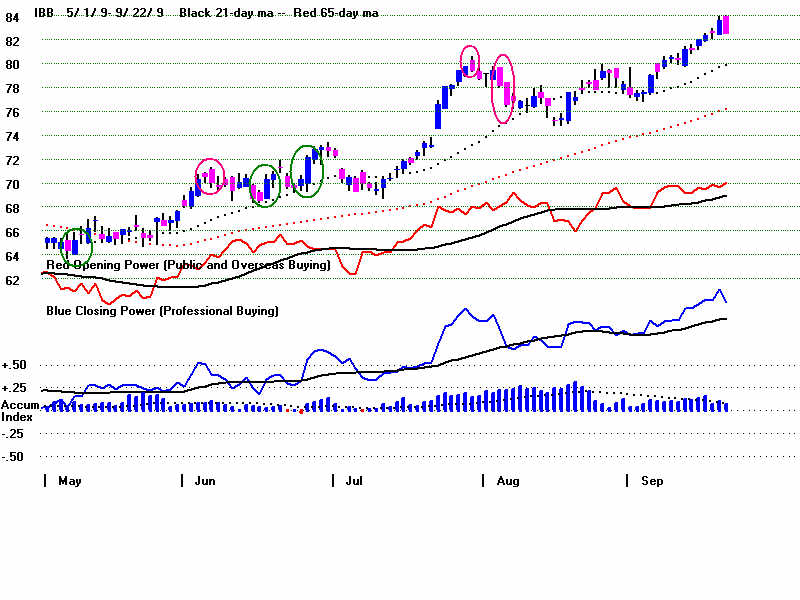 |
2 all-encompassings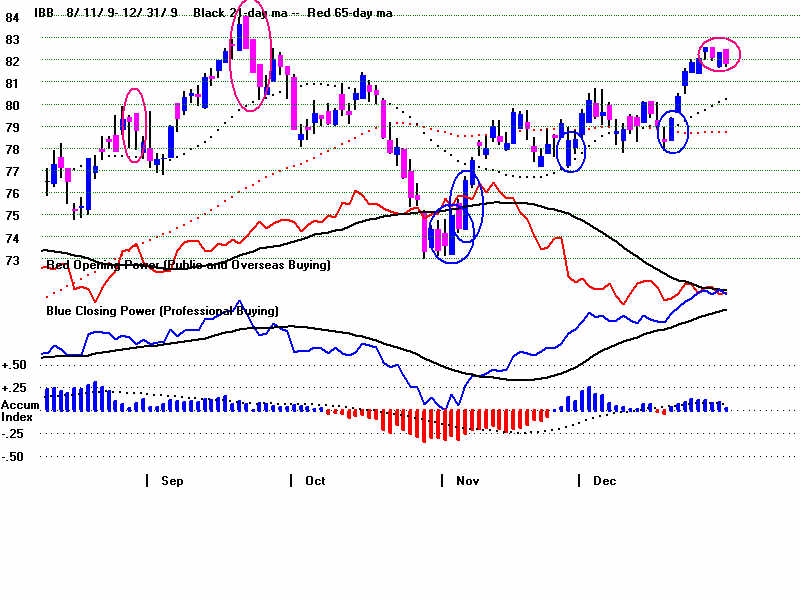 |
| 2009-2010 |
|
pinned red ant, all-encompassing red
popsicle red popsicle/red meat cleavers 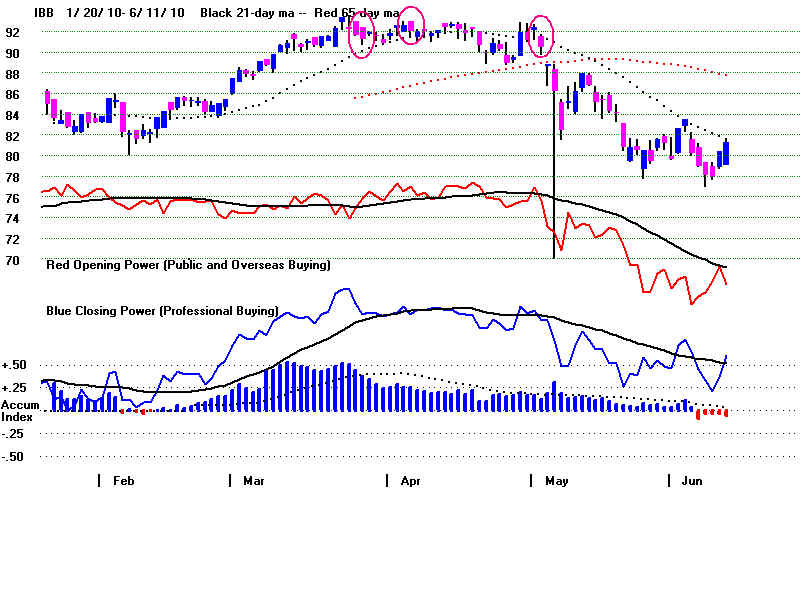 |
popsicle
red rolling pins
red hatchet red ant on stick |
3 red posicles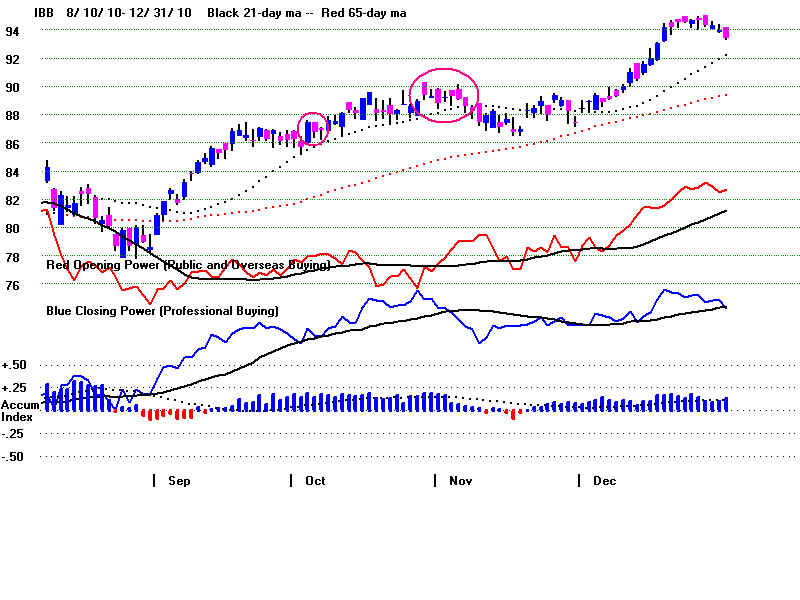 |
| 2010-2011 |
|
Multiple red figures at major top. ant, all encompassing rolling pins popsicle ant all encompassing
|
 |
 |
| 2011-2012 |
red popsicle
red hatchet popsicle
red popsicle pinned ant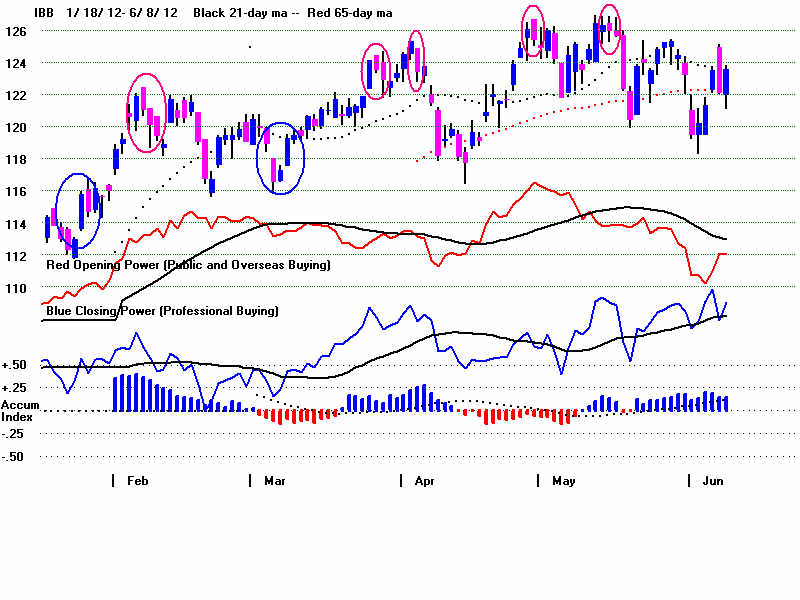 |
 |
two red ants all-encompassing 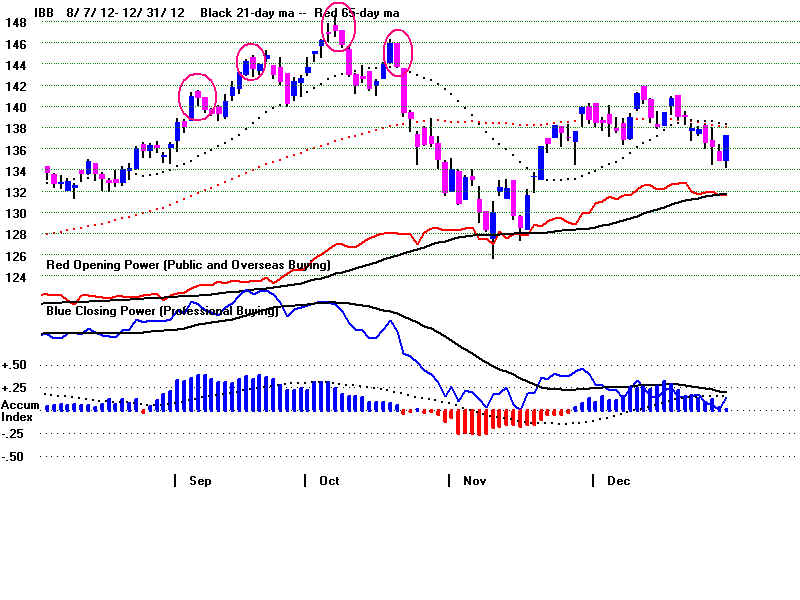 |
| 2012-2013 |
|
red roller pin upside down red popsicle. red popsicle. 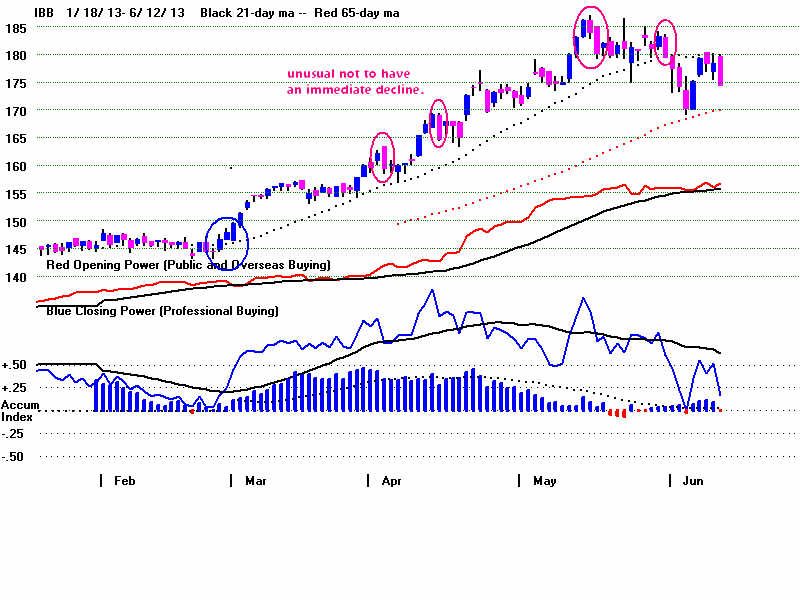 |
red popsicle, all-encompassing, red ant
three red popsicles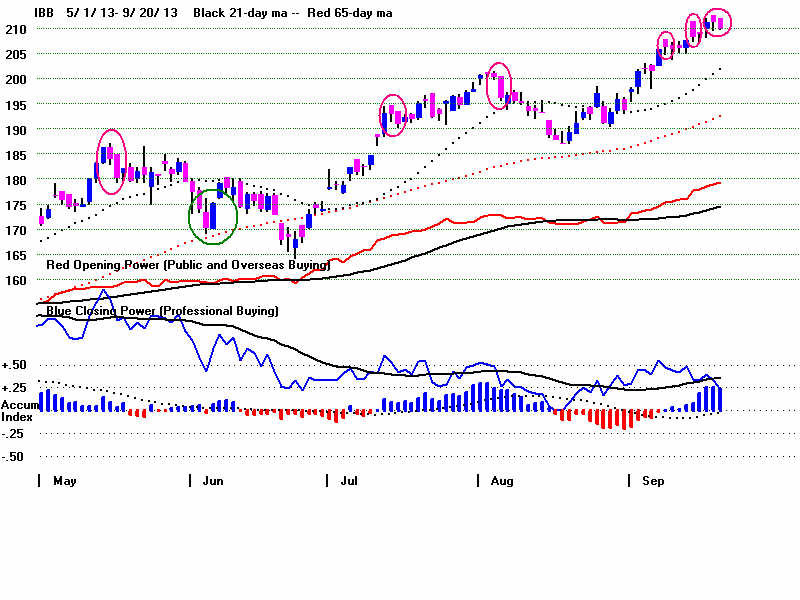 |
red hatchet red popsicle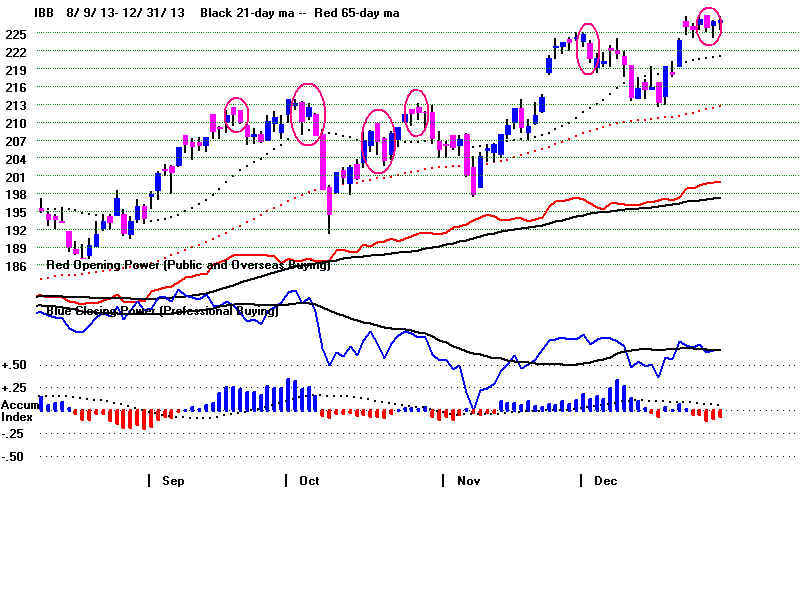 |
| 2013-2014 |
|
upside down
3 roller pins red popsicle 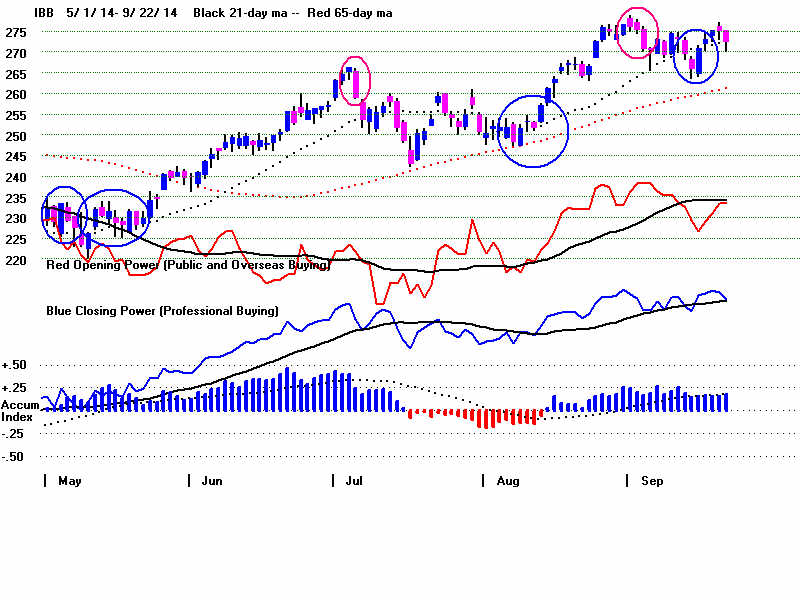 |
red encompassing
3 red roller pins |
roller pin
all-encompassing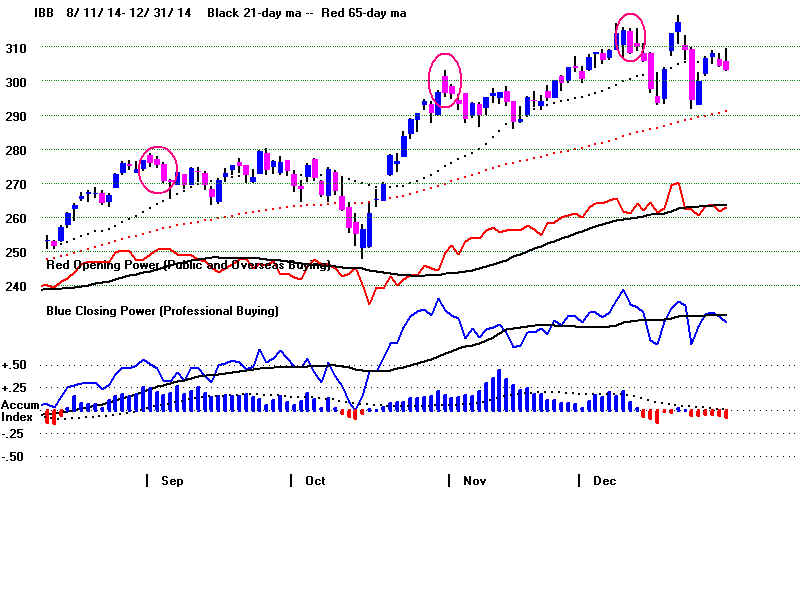 |
| 2015 |
|