TigerSoft News Service 5/9/2010 www.tigersoft.com
NON-PUBLIC RESEARCH - All rights strictly reserved. (C) 2010 www.tigersoft.com Wm. Schmidt, Ph.D.
TigerSoft
News Service 5/9/2010 www.tigersoft.com
NON-PUBLIC RESEARCH - All rights strictly
reserved. (C) 2010 www.tigersoft.com
Wm. Schmidt, Ph.D.
Peerless Needs to Judge Head & Shoulders
Pattern Completions
Head and
Shoulders Patterns Predict The Unpredictable!
Bearish Unexpected Events Are Often Marked by Head and Shoulders Patterns
CALLING ALL TOPS
Completed Head and Shoulders Tops Must Be Treated As Judged Peerless
Sells
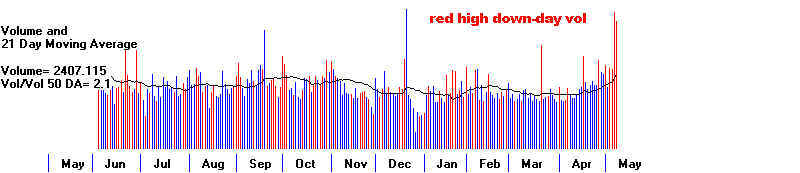
Instead of the usual Peerless Sell,
our tip-offs of a top this past week were
abundant numbers of head and shoulder tops and a
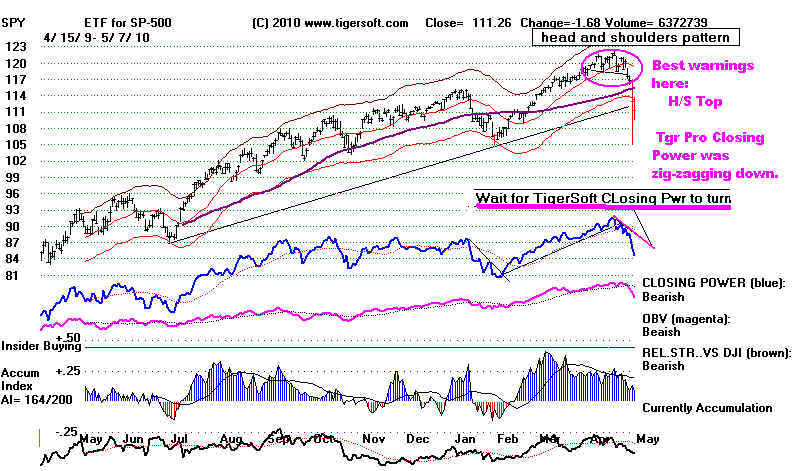
Tiger Professional Closing Power
that was zig-zagging lower after an extended, long
advance. The Closing Power is the
cumulative blue indicator just beneath the price
chart. In the chart below for the
QQQQ, you can see how well trend changes of
TIgerSoft's CLosing Power work
as Buys and Sells. The break in the CLosing
Power's uptrend served as an
excellent Sell on 4/30/2010. If there was any
doubt about the market's trend, the
completion of the head and shoulders pattern should
have removed it. In these
circumstances, we try to estimate how far down the
market will go, but this is
only an estimate. The decline we estimated was
5%, So far, we have seen a 10%
decline. Because, such guesses can be so wrong,
we have consistently said that
it is best to just wait for the Closing Power
downtrend to end. Historically, waiting
for the NYSE A/D Line downtrend also to be broken
before buying makes traing safer.
For Peerless, the presence of a head and shoulders top cannot easily be
programmed. We have to recognize it by sight
and experience. There have been lots
of them in the DJIA alone since 1915 to study.
We have discussed these at some length
in earlier studies.
A
closing price that clearly drops below the neckline is the Sell. The neckline need
not be flat and the pattern need not be
perfectly symetrical. You should be able to see
a left shoulder, a head and a right shoulder
whose formation first requires a deeper
decline to form a neckline low and then a low
volume rally that gives way to a decline
that clearly penetrates the neckline on a
closing basis. The neckline then becomes
resistance if the pattern is valid. For
this reason, after a head and shoulders top is
completed, it is better to give the market
enough chance to lay out the bearishness
of the pattern. The minimum downside
objective is the difference between the high
and the neckline subtracted from the point of
breakdown.
The
situation becomes much more dangerous when many of the most important
indexes and ETFs show clear clear and shoulders
patterns. This is partly because
the pattern's very appearance scares many
traders. The pattern's bearishness
has a large self-fulfilling aspect. But
there is more to it than that. It is the clear
closing below the neckline which is a judged
SELL. The NYSE AD Line normally
confirms the break below the neckline. In
2010, this occurred a day later. Instead,
the number of such patterns in indexes and ETFs
was the cause for our heightened
concern and recommendation to sell
over-extended stocks with declining CLosing
Power trends and sell short stocks breaking
below their 65-day ma if they showed
a head and shoulders top.
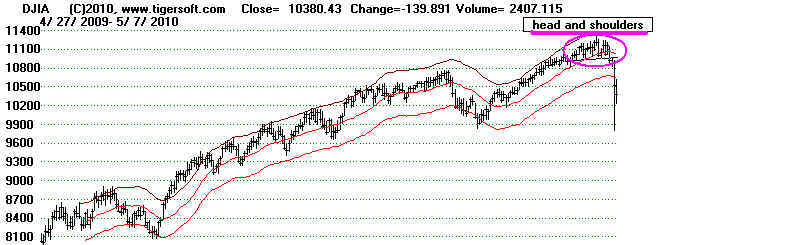
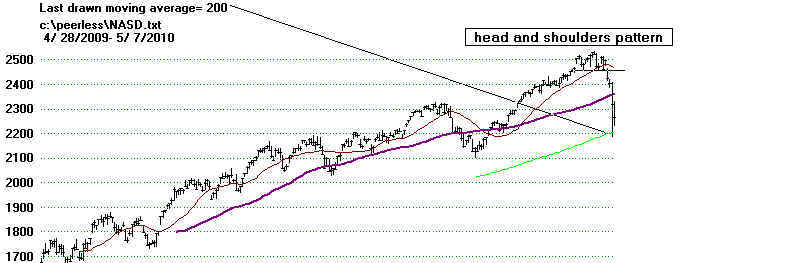
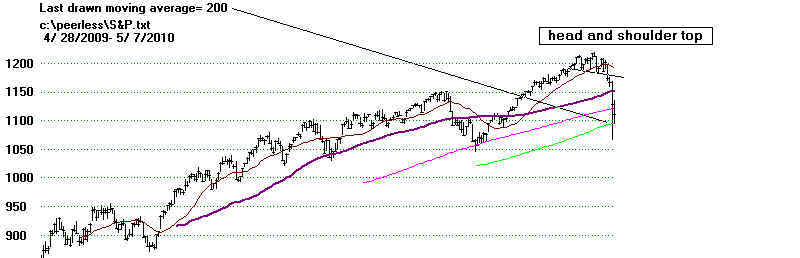
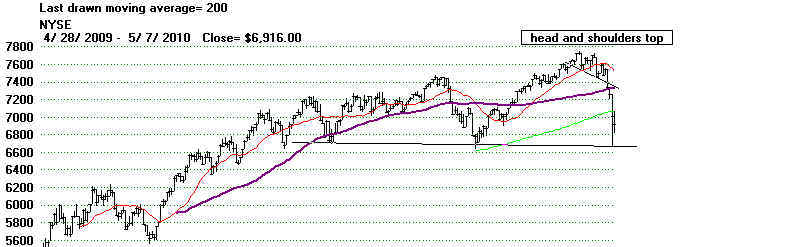
See the recent head and shoulders tops in DJIA, NASDAQ, SP-500, OEX, SPY, DIA
and QQQQ.
DJIA
NASDAQ
SP-500
NYSE
WHY WE NEED TO HEED
HEAD
AND SHOULDERS PATTERNS
The stock market does
not always discount future events. There are many
events that traders could not possibly know about long in
advance. What we
have discovered is that head and shoulders patterns are often the
way the
market quickly adjusts to bad news. The degree to which the
British Petroleum
rig would unleash a volcano of oil on the Gulf Coast was not
immediately known,
though Goldman traders knew sooner of the dangers than the
President
and so, they sold short on this news. "Suck
it, fishies and birdies!" wrote
a
Goldman trader.
What is important to
understand is just how often head and shoulders patterns
appear when a very bearish event must be quickly factored into
the stock market's
prices. We see this over and over. While head
and shoulders patterns have
long been recognized as bearish, what is new here is the
discovery of how often
the bad news which follows them is sudden and/or highly
significant.
Head and shoulders tops seem to appear when the stock market must
deal with an
unexpectedly bearish event, such as:
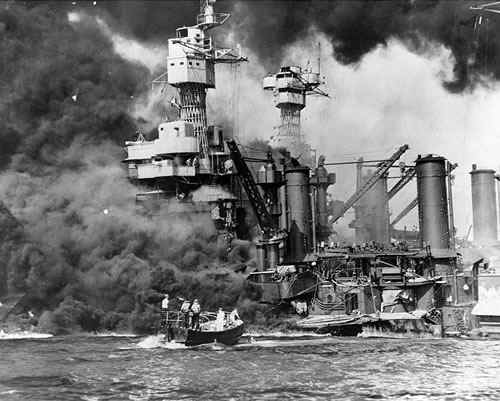
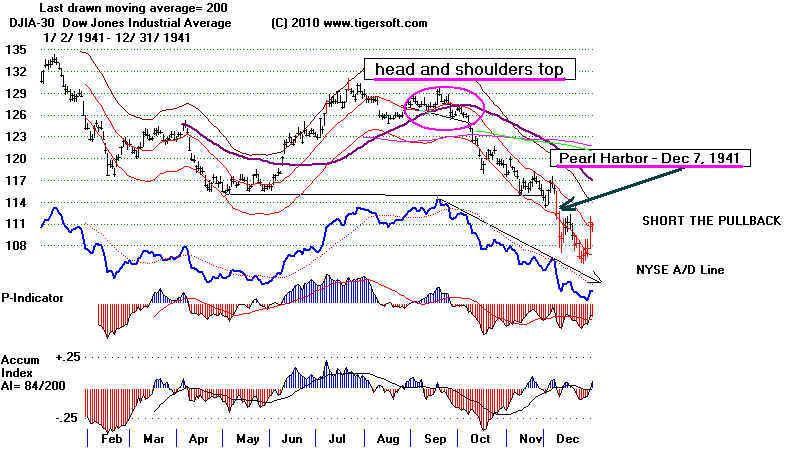
1941 - Japanese attack on Pearl Harbor,
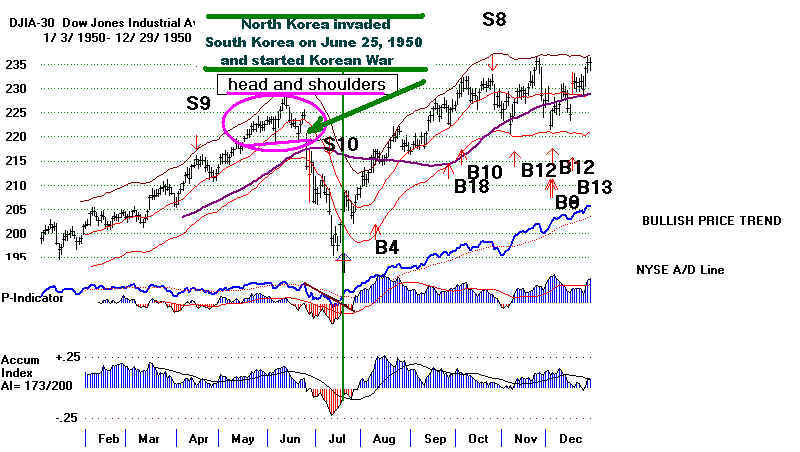
1950 - the North Korean invasion of South Korea,
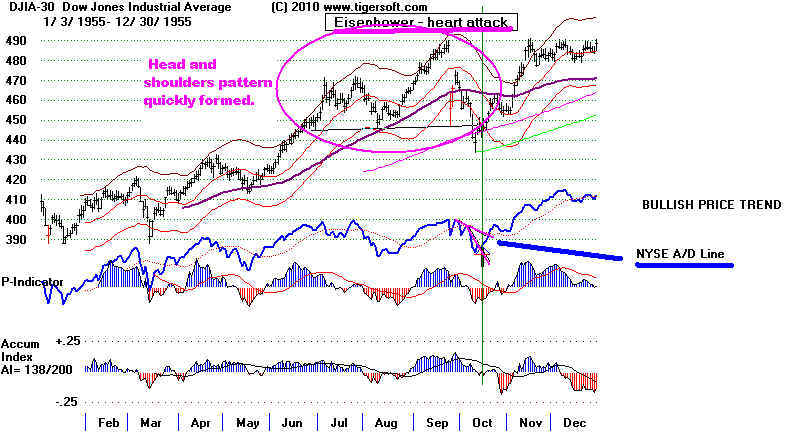
1955 - the Eisenhower heart attack,
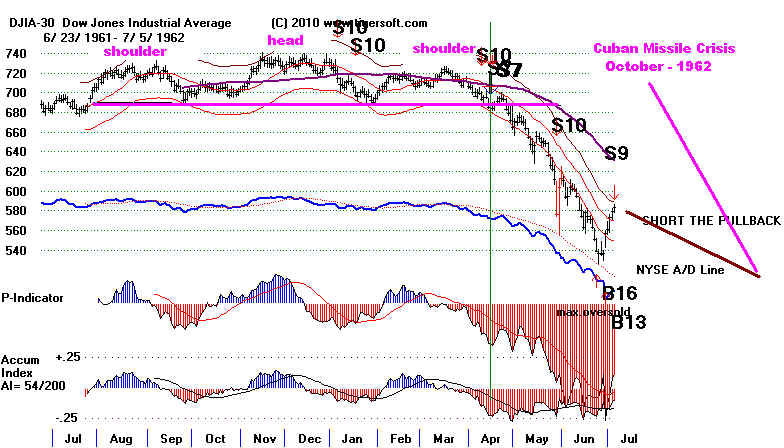
1962 - Cuban Missile Crisis
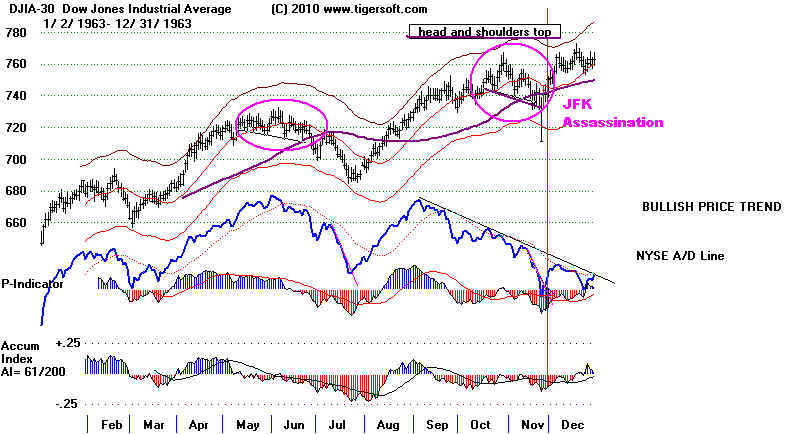
1963 - the JFK assassination
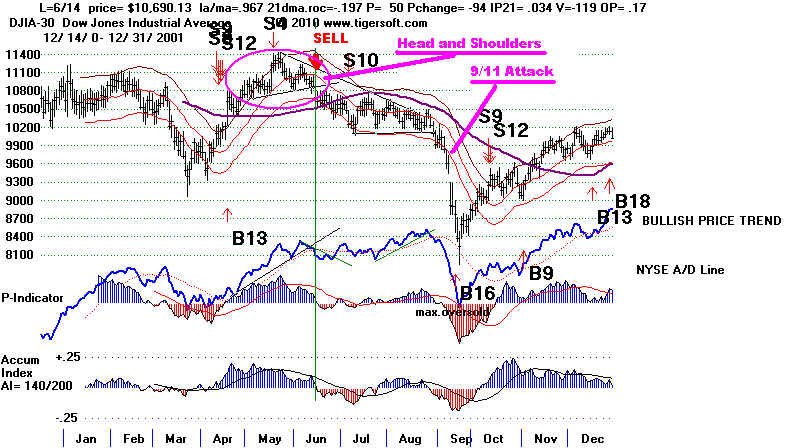
2001 - 9/11 Attack
2010 - the BP-Oil-Gulf Coast Catastrophe.
In each past case, watching for the A/D Line to break
its steep downtrend would have
given good signals to
BUY.
1941 - Japanese attack on Pearl Harbor
1950 - North Korean invasion of South
Korea
1955 - the Eisenhower heart
attack
1961 - Cuban Missile Crisis
1963 - the JFK assassination
2001 - 9/11 Attack
In
this case, there was no Peerless Buy signal, so using the A/D Line trend-breaks
should not have been applied to the
trading the DJIA, so much as individual stocks.
The 9/11 attack followed by 10 weeks the
completion of the head and shoulders pattern.