TigerSoft
News Service 2/8/2011
www.tigersoft.com
TigerSoft
News Service 2/8/2011
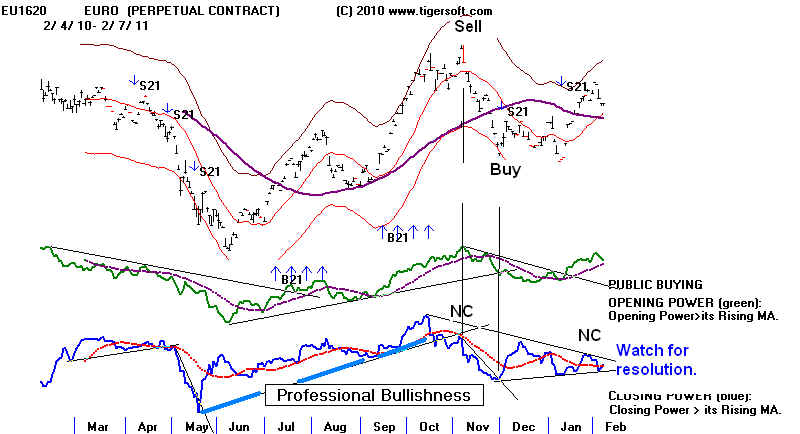
www.tigersoft.com TRADING THE EURO
WITH TIGERSOFT'S UNIQUE TECHNICAL TOOLS
FOR DISTINGUISHING PROFESSIONAL FROM PUBLIC BUYING.
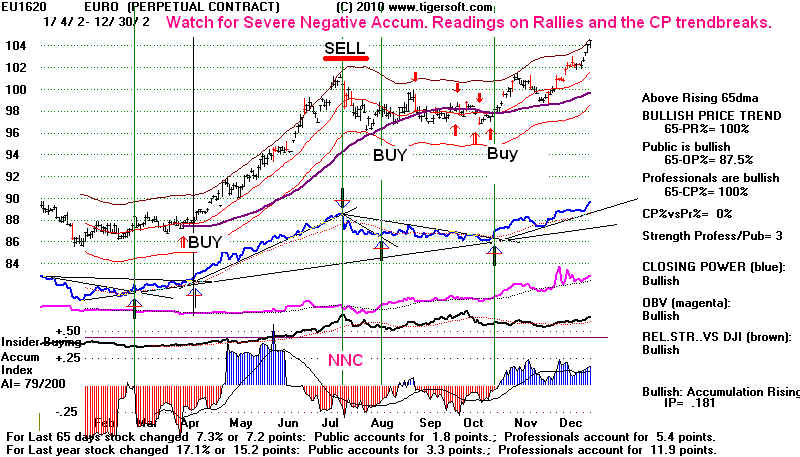
Note also extreme divergences between Prices and
TigerSoft's Accumulation Index.
 |
Tiger
Software
Research on Individual Stocks upon Request: Composite Seasonality Graph
|
|
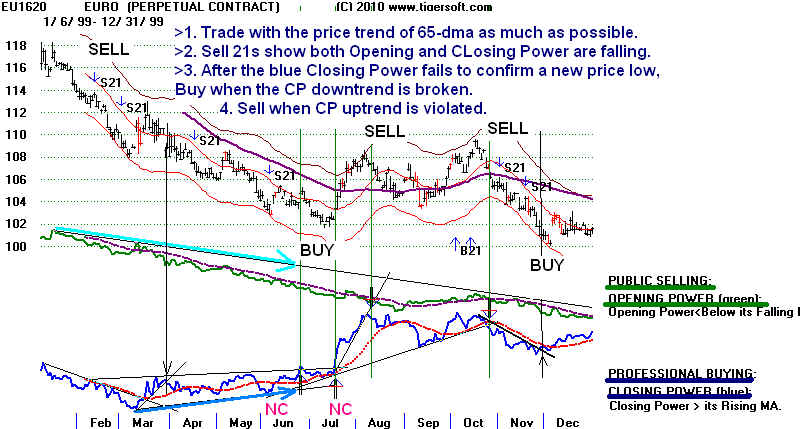
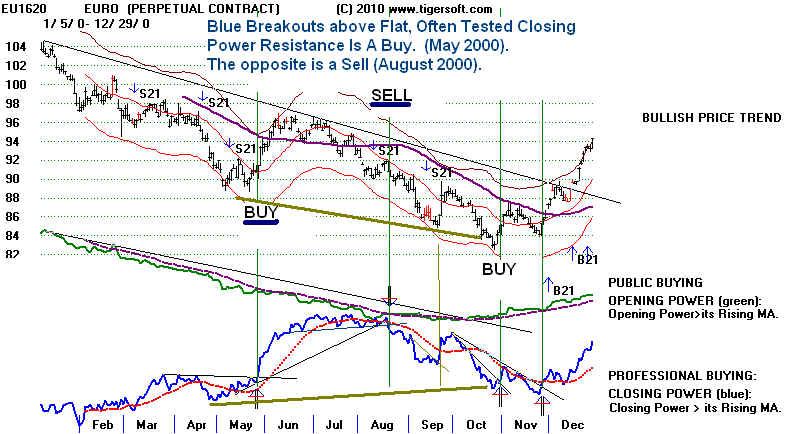
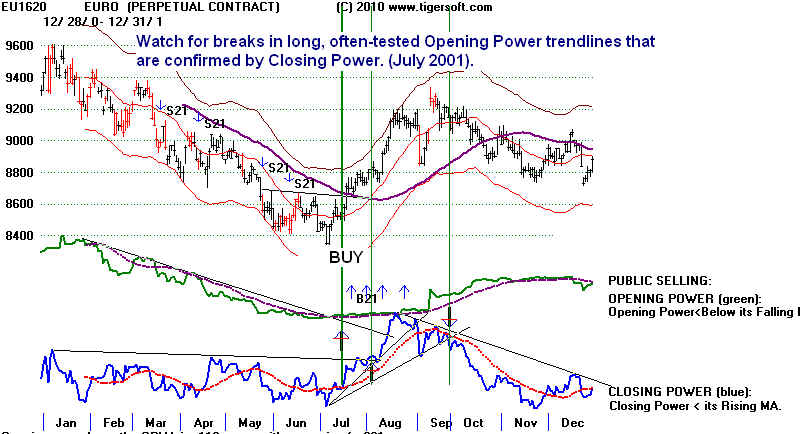
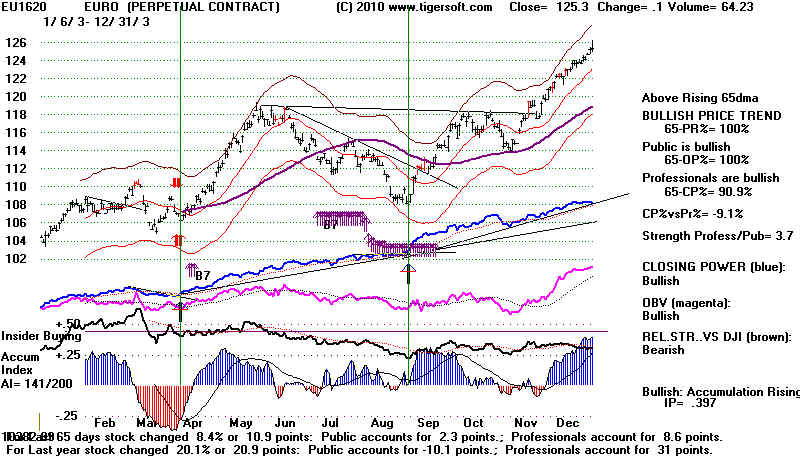
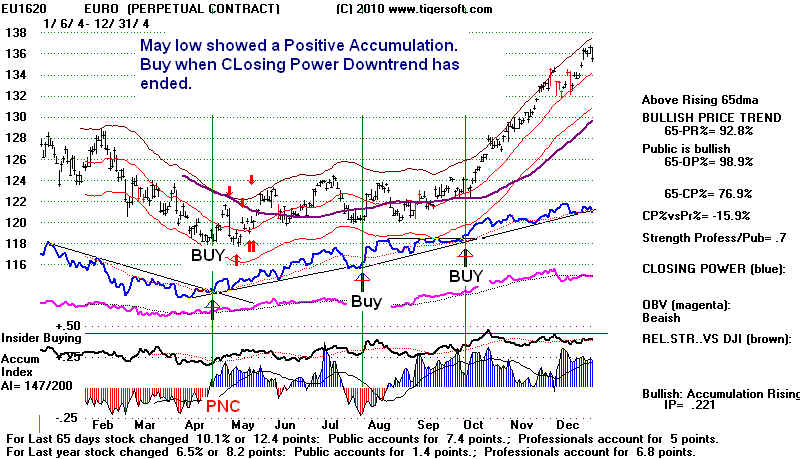
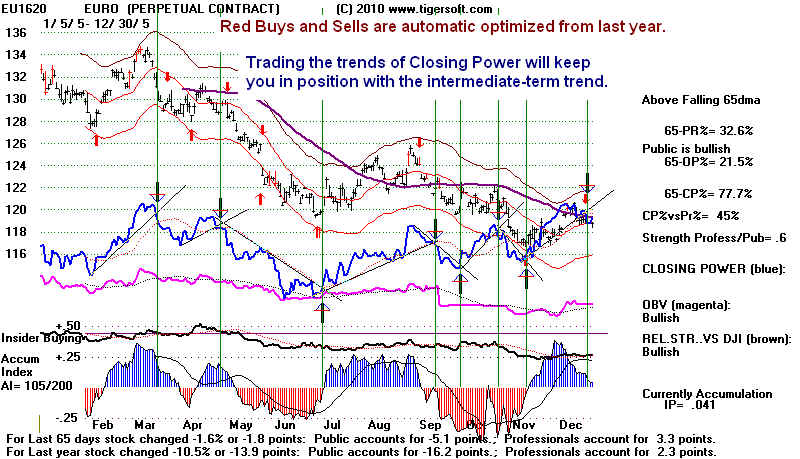
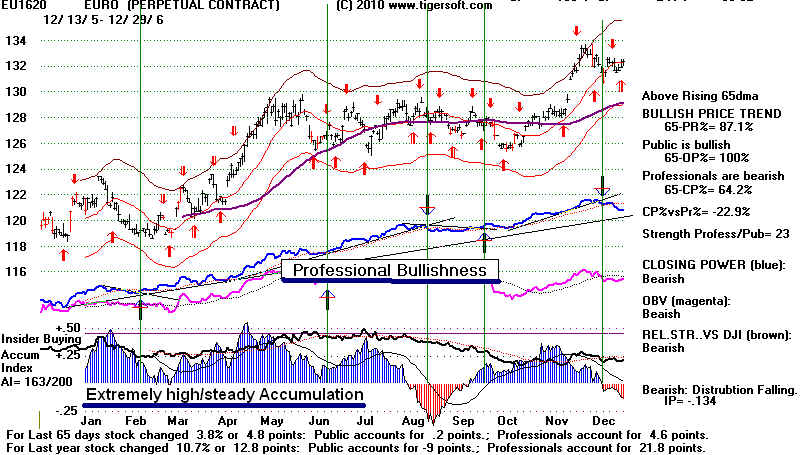
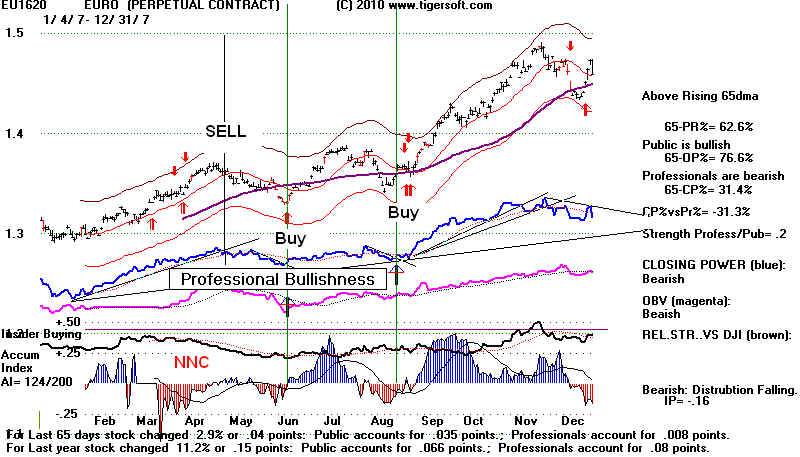
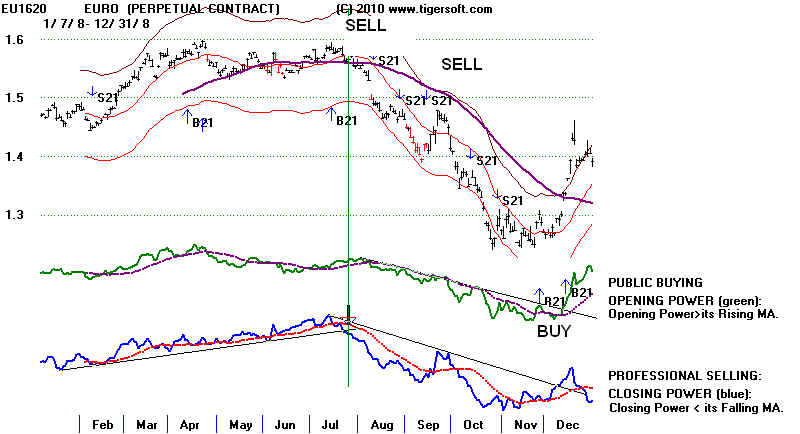
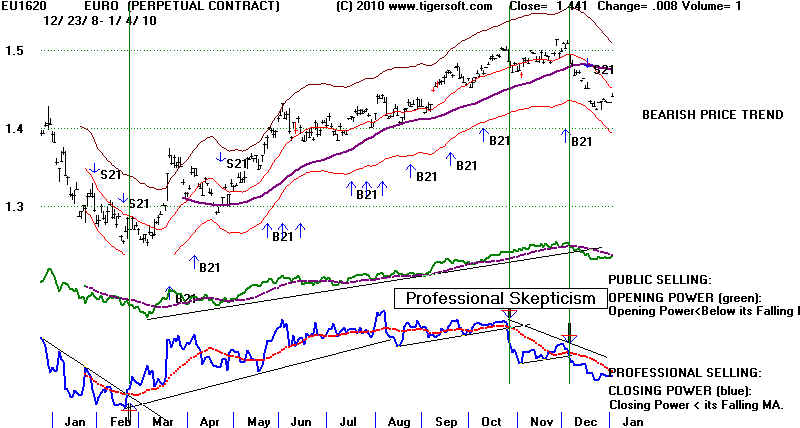
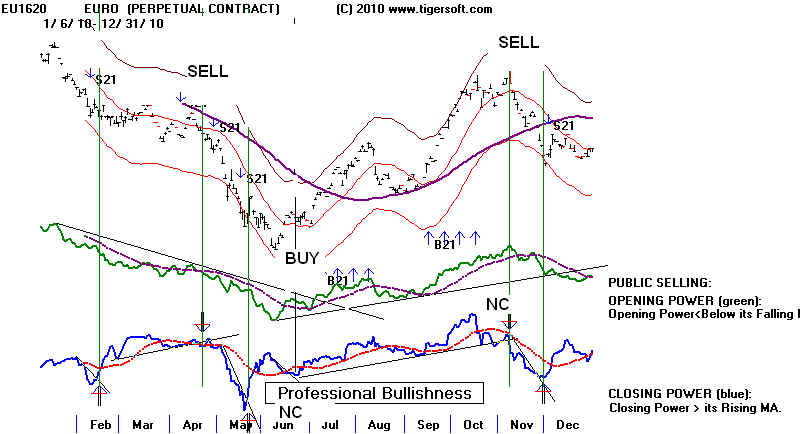
Here we look at the perpetual contracts for the EURO since 1999. Two different TigerSoft charts are shown. One emphasizes the difference between Opening Power and Closing Power. The other shows the cases where the Tiger Accumulation Index showed big divergences from the price action. The rules here are to be applied to stocks, ETFs, commodities, metals and also other currencies. The Software to run these programs is our TigerSoft Program. Its price is $298. It includes 3 months of data. Data after 3 months free service with the purchase of TigerSoft is only $150 a year. Rules for Buying and Selling (Short) 1) Trade with the price trend of the 65-dma as possible, except when it is flat or nearly so. 2) > Sell S21s show both Opening and CLosing Power are falling. The first or second S21 should be used to sell short. > Buy B21s show both Opening and CLosing Power are rising. The first or second B21 should be used to buy. 3) Look for divergences between Opening and CLosing Power. This measures the difference between Overseas and Public Buying and US Professional Buying. > After the Closing Power fails to confirm a new price high, Sell Short when the Closing Power breaks its uptrend. > After the Closing Power fails to confirm a new price low, Buy when the Closing Power breaks its downtrend. 4) Look for tests of the 65-dma. > On a rally to a falling 65-dma, Sell Short when the Closing Power breaks its uptrend. > On a decline to a rising 65-dma, Buy when the Closing Power breaks its downtrend. 5) Watch for flat, often-tested flat Closing Power line breakouts and breakdowns. > Such CLosing Power breakouts are Buys. > Such CLosing Power breakdowns are Sells. 6) Watch for extended, often-tested Closing Power line breakouts and breakdowns. > Such CLosing Power breakouts are Buys. > Such CLosing Power breakdowns are Sells. 7) Watch for extended, often-tested Opening Power line breakouts and breakdowns. > Such Opening Power breakouts are Buys if Closing Power is rising, too. > Such Opening Power breakdowns are Sells if Closing Power is falling, too. 8) Watch for Severe Accumulation Index Divergences between Price New Highs and New Lows. > Sell Short when the Closing Power uptrend is then violated. This clinches the Sell. > Buy when the Closing Power downtrend is then violated. This clinches the Buy. Buy B7s and B9s flag these diveregnces, 9) Watch for extremely high and steady Blue Accumulation or the Opposite in rec. >Extremely High and Steadily Positive Accumulation, as in early 2006, is very bullish. >Extremely Low and Steady Negative Accumulation is very bearish.
|