
TigerSoft News Service 2/11/2011 www.tigersoft.com
Trading Gold and Silver Stocks
with TigerSoft's Closing Power
by William Schmidt, Ph.D. (Columbia University)
(C) 2011 All rights reserved. Reproducing any part of this page without
giving full acknowledgement is a copyright infringement.
Tigersoft invented the key indicators used here. They are only available to TigerSoft Users.
For more information, please visit our main website - www.tigersoft.com
Research on Individual Stocks upon Request:
Composite Seasonality Graph of Any Stock for $125.
Example of historical research NEM - Newmont Mining. Order Here.
See the TigerSoft techniques for find Explosive Super Stocks: Oil Coal
 |
Tiger
Software Helping Investors since 1981
|
Trade Tiger's Accumulation Index, Closing Power and Automatic Buys and Sells |
Trading Gold and Silver Stocks
with TigerSoft's Closing Power
by
William Schmidt, Ph.D. (Columbia University)
Most of the time, we don't
know exactly why Professionals are net buyers of sellers of a stock.
To make money we don't have
to. We just trade the direction of the trend of TigerSoft's
Closing Power, while being
mindful of:
1) whether
the general market is on a Buy or Sell from our Peerless Stock Market Timing.
Peerless was on a Buy for the
last 6 months of 2010 and most of the time from March to December
in 2009.
2) what is
the direction of the stock's 65-day ma
The 65-day ma appears as a
bright purple line on the Tiger bar chart.
3) whether
the stock or ETF shows an important chart pattern.
4) whether
or not the stock or ETF shows heavy Accumulation (insider buying) or
heavy distribution
(insider selling). Bulges of Accumulation at the bottom of the Tiger
chart that surpass a
key threshold are considered as "insider buying". New highs at the
upper price band with a
negative (red) Accumulation Index are considered "Sell S9s" and
"key
distribution" that foretells many declines.
The rules for trading the
Closing Power trends are simple. Buy on a break to the upside when
the Closing Power (CP)
downtrend is broken. Sell when the CP uptrend is broken. Use the steeper
CP trendlines when the stock
has made an extended run. Three tests of a CP trendline make it
more reliable. And we
watch for divergences between CP and prices. Bigger moves and reversals
are set up when Closing Power
fails to confirm a new price high or low by making a corresponding
new high or low. Lots
of times excellent trades are made when the stock falls back to (or rises back to)
the 65-day ma and the CP
trend is then broken. Seeing the usage here will make these rules clearer.
Buys and Sells can be placed
on the chart by the user where Closing Power breaks its trendline.
TigerSoft computes the
percentage gains a trader would make on an initial position of $10000 where
the costs of commission and
slippage are $20 per trade. The results assume trades are entered at the
opening the next day after
the Buy or Sell.
The rules can be profitably
applied to most stocks, most of the time. The exceptions occur when
the Public is heavily in the
market and the stock is running out of control of the Professionals for
a period. This occurred
briefly in 2000, for example, at the end of the Internet Bubble.


IMPORTANT
BUY ON TIGERSOFT CP TREND BREAKS FOLLOWING AN ACCUMULATION
BULGE
SHOWING INSIDER BUYING
By far, the biggest gains are
made if one buys a stock soon after it has shown heavy insider
buying when the Closing Power
breaks above its downtrend or horizontal trendline. TigerSoft
shows such insider buying as
spikes by the Accumulation Index above the key "insider buying"
threshold. Each of the
next 6 charts show such insider buying just before the Closing Power
Buys occurring after its
downtrend is broken.
Selling is best done after the
stock has made a significant advance and it makes a new price high
which is not confirmed by its
Closing Power making a corresponding new high. Note that a negative
non-confirmation of a price new
high by the Tiger Accumulation Index (Tiger "S9") also works here.
After either of these occurrences,
Sell when the Closing Power breaks its uptrend.
ANV 2009-2010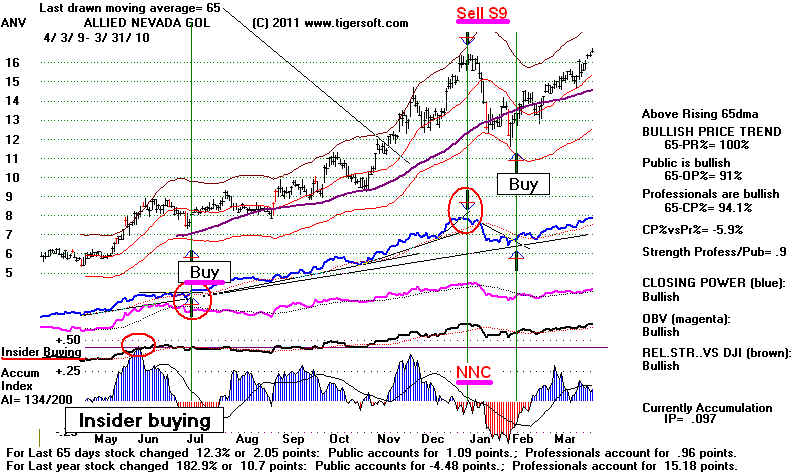 |
TRE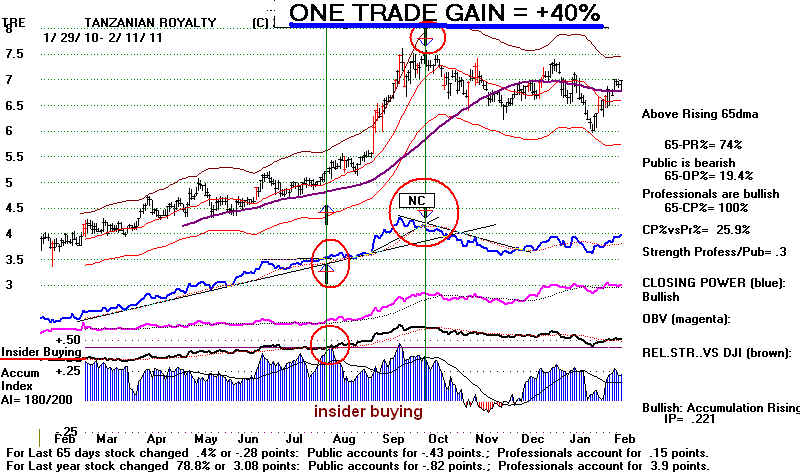 |
GPL
2010-2011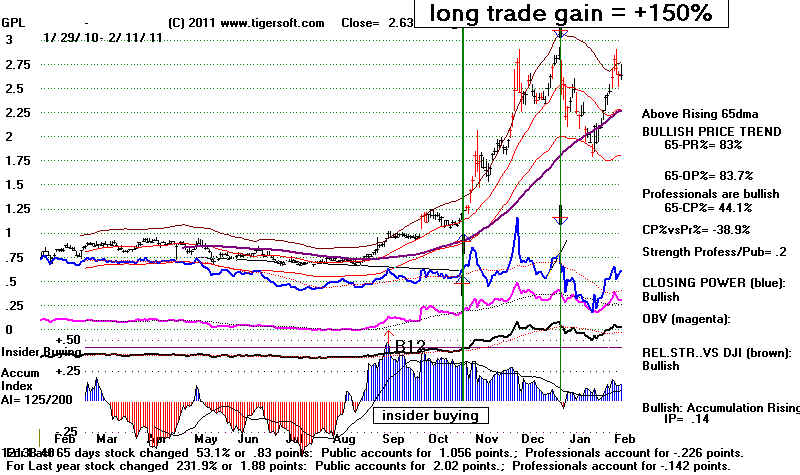 |
GORO 2010-2011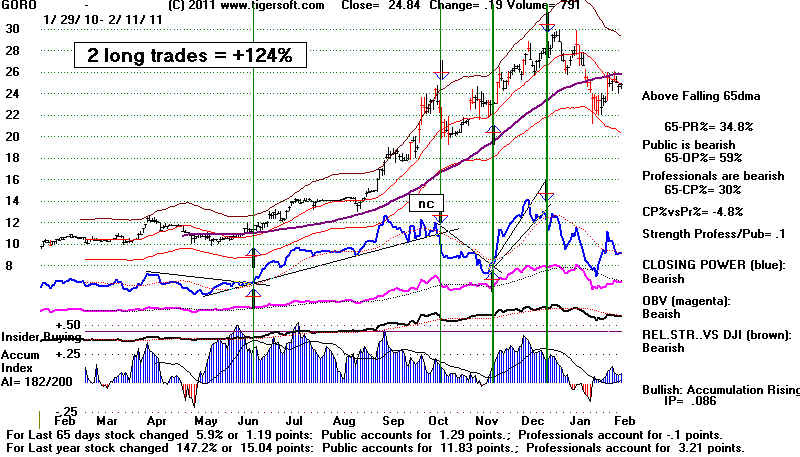 |
BVN
2010-2011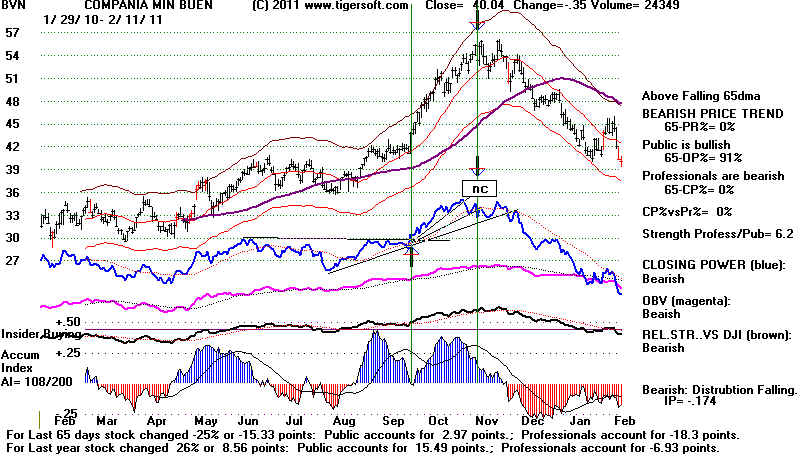 |
AXU
2010-2011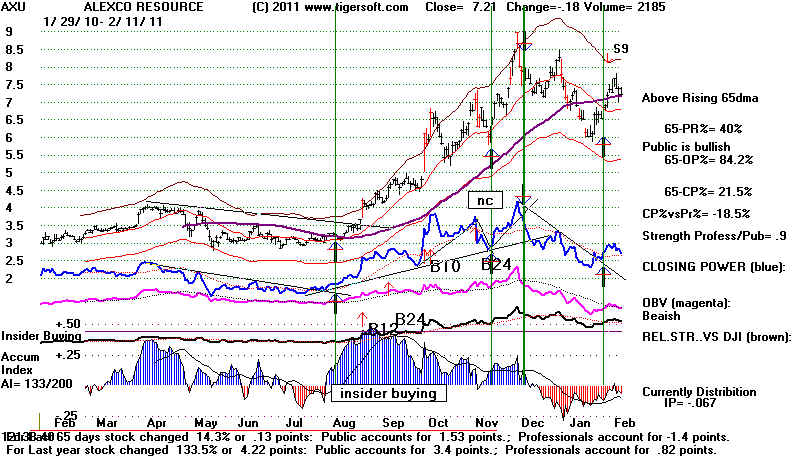 |
MORE TYPICAL CHARTS
Here are GLD (gold ETF), SLV
(silver ETF) and three stocks: NEM, PAAS and SSRI. Simply
trading the trends of Closing
Power is consistently profitable. The gains were generally less
because insider buying was
not present.
GLD
2010-2011 GOLD ETF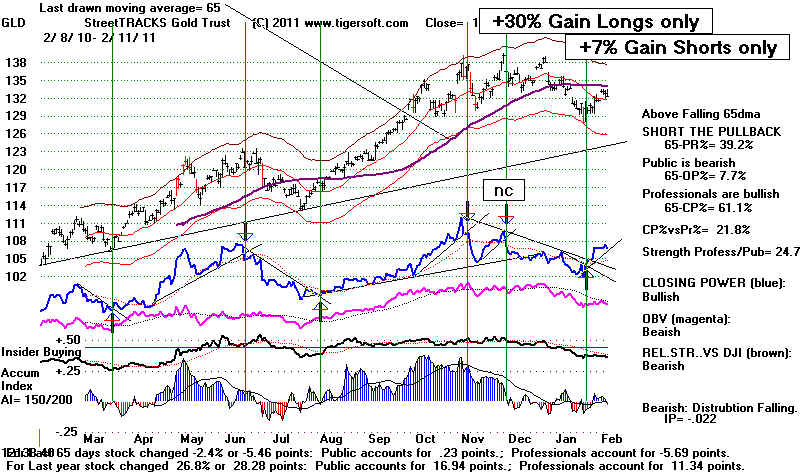 |
SLV
2010-2011 Silver ETF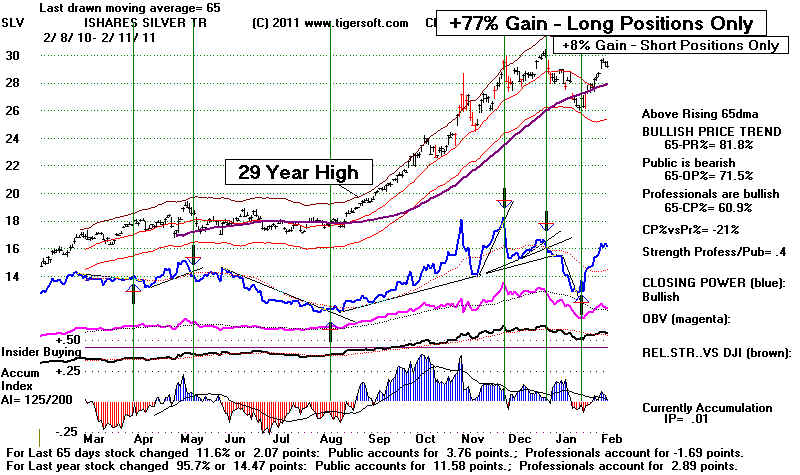 |
NEM
2010-2011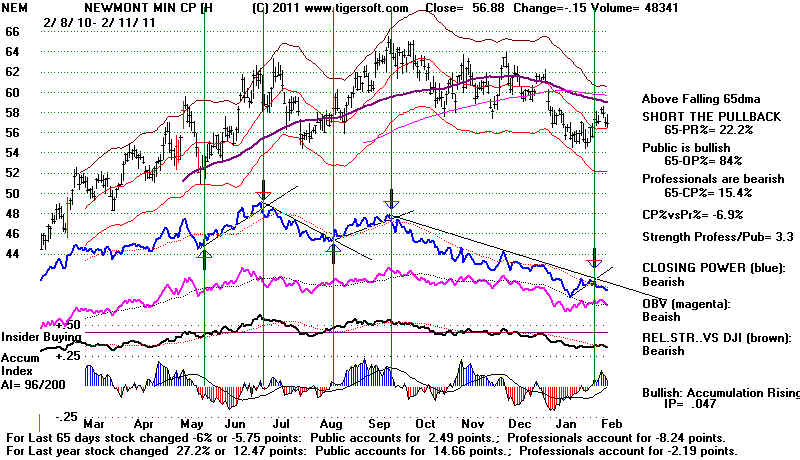 |
PAAS
2010-2011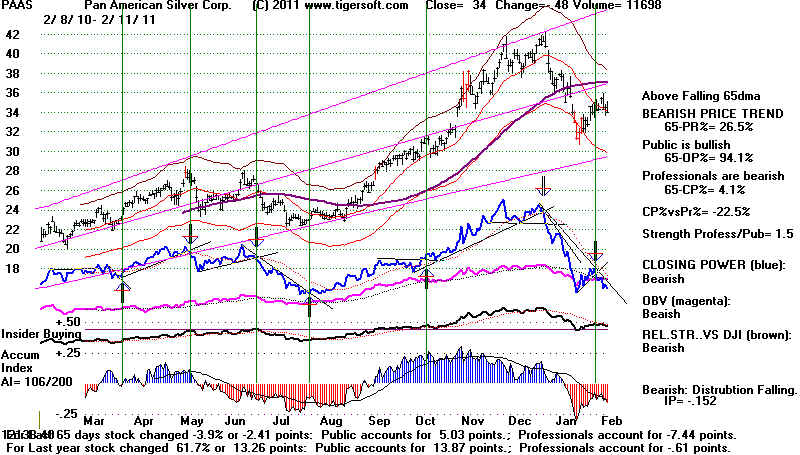 |
SSRI
2010-2011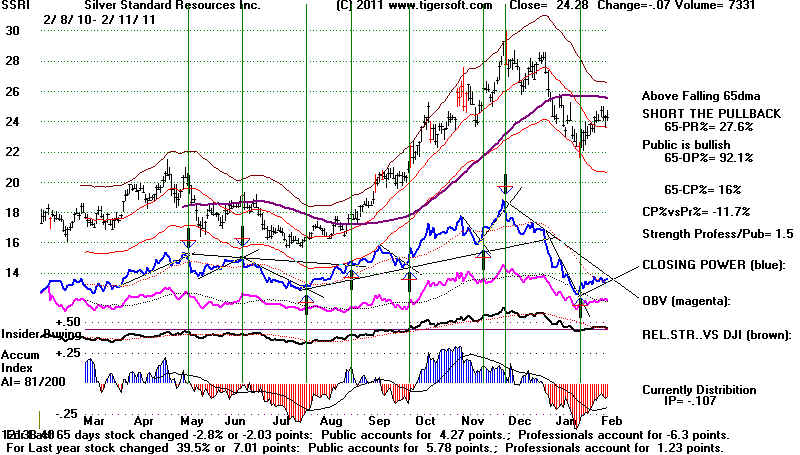 |
+