wpe50.jpg (1913 bytes)    TigerSoft News Service   8/22/2009      www.tigersoft.com    
       
                     
  USING TIGER'S POWER STOCK RANKER
     IN A MARKET ALREADY UP 45% OFF ITS LOWS    


by William Schmidt, Ph.D.   (Columbia University)
                              
wpe4F.jpg (33251 bytes)  

Tiger Software 
   Helping Investors since 1981
       Make Your Retirement Grow
    Suggestions: 
      
Peerless Stock Market Timing: 1928-1966         
Track Record of Major Peerless Signals
       Earlier Peerless-DJIA charts       
7 Paths To Making 25+%/Yr. Using TigerSoft 

       Index Options            
FOREX trading        
Investing Longer-Term         
Mutual Funds
       Speculative Stocks     
Swing Trading       
Day Trading        
Stock Options          
Commodity Trading
      

      Research on Individual Stocks upon Request:   Composite Seasonality Graph
of Any Stock for $125.
Example of historical research NEM - Newmont Mining.   Order Here.


USING TIGER'S POWER STOCK RANKER
     IN A MARKET ALREADY UP 40% OFF ITS LOWS

                                                                 
by William Schmidt, Ph.D.          


The first order of business with the DJI up 45% from its lows, is to consider how much
            upside potential there still is.    The chart below shows we are still on a major Buy from

            Peerless and that the NYSE A/D Line has already made a 12 month high.  The P-Indicator
            has hardly had its high levels be reduced from when it was 1000 points lower.  The
            Tiger Accumulation Index, like the P-Indicator,  is not as high as it was a month ago,
            but it is still very positive.  So, no Sell S9 or Sell S12 is insight at this point.
 wpe161.jpg (73219 bytes)          
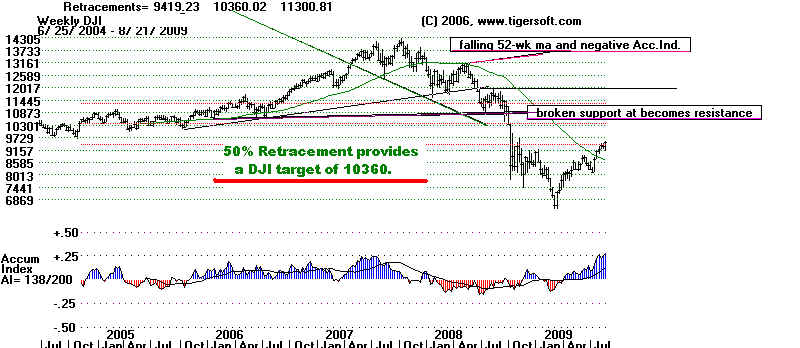
                      The DJIA has recently exceeded a 33% retracement (from October 2007 high to
              March 2009 low) and the resistance of its falling 52 week moving average, by
              virtue of excellent breadth and very high levels of Accumulation.  Now it
              seems bound to test the round number 10000 level and then the 50% retracement
              level of 10300.  The amount of upwards energy in the market must be respected.
              My own sense is that the broken support at 10800 seems the most likely place
              for sell orders to be placed abundantly enough to stop the recovery.

WKCURENT.BMP (835254 bytes)
                          
       
So, how can we play the market, if we assume that there may be 1000 more points
          to the upside?  First, understand that our reasearch shows that the highest Accumulation

          Explosive Super stocks make their best moves in the second six months after their
          initial bulges of Accumulation.   Accordingly, I would focus special attention on these
          explosive super stocks, all the while being aware of how far some have already risen
          watching for the red flags they are apt to offer shortly before they decline. 


Augmented B24s and B12s produce some of the very biggest gains. You can
          see some of the best in the following link..

       
New 8/14/2009 How To Find Each New Bull Market's Explosive Super Stocks: 1990-2009
          and
8/7/2009 Bulls Should Be Able To Spot The Red Warning Flags in Over-Priced Stocks.
   
     
          At this stage of the rally, it seems unlikely that a stock will just now begin
          a huge advance.  We are better of playing some of the ones we have
          found earlier on breakouts or on modest retreats to their 21-day ma, so long
          as their Accumulation Index is showing positive consistency with an AI/200
          score above 181 and a current Accumulation Index (IP21) value above .15
          as the 21-day ma is tagged.    Run the Analysis against ELITSTKS or AUG1224 on the
          Elite Stock Professional page or against any group of stocks you wish.

          Then display the "HIGHAI" stocks using "Tiger Selections" form the Tiger Page
          + "Tiger Groups: Lists and Explanations" + "HighAI" (#66).  Look in the column
          with the heading CL/MA for stocks near 1.0.  These are the stocks whose close
          is at the 21-day ma.  In the column just to the left is the current Accumulation
          Index ("IP21") value for the stock.  This yields several candidates:

                          CLose     IP21   AI/200

           CAMD       2.9           .38    .987
           ERC        13,18       .30     1.002

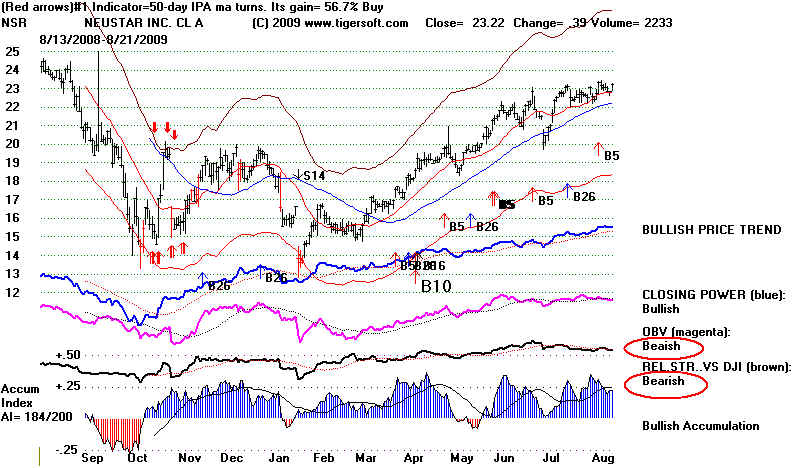
           NSR         23.07       .23      1.013  but looking at its chart below, we see that its OBV and Rel Str.
           are rated as "Bearish". 
NSR.BMP (1123254 bytes)

         
How else can TigerSoft's Power Ranker find the best stocks to play now?

       
1. One simple way is to use the Power Ranker's list of "Bullish" stocks from the
        HOTSTKS data base.
  Save time, by checking their current Accumulation Index
        (IP21) level as well as how many days their Accumulation Index has been positive
        for the last 200 tradfing days (AI/200) and if their CLosing Power is rising  "-U"
        in the spread sheet's column. 
Tiger screen + Tiger Selections (at top) +
        Tiger Groups: Lists and Explanations + Bullish.   The 8/21/2009 data shows:

       
STK   Close  AI/200  IP21  Cl/MA  TGR (Opening and Closing Power trends)
         IEC,   5.26     185       .36       .941    ?U
         SCLN  4.22   185       .
20       1.103   U?
         COMS 4.21   189      
.14      1.059  U!U
         FIRE   19.97  181     
.20       1.123 UU
         RADA  2.8       195     .56        1.018 DU
         DRCO 13.15  184      .39       1.048 DU
         CNBKA 24.59 181    .43        1.086 DU
         MSZ   21.15     193    .55         1.012 DU
         TXIC  8.88        169  
.04         1.076 UD
         WDC  32.85      173   .
25        1.045 DU

         I would eliminate any stock with an AI/200 under 140 and any stock with a
         current IP21 value below .37 or with a CLosing Power that is not rated "U".

         That leaves the following stocks

        STK   Close  AI/200  IP21  Cl/MA  TGR (Opening and Closing Power trends)
         IEC,   5.26     185       .36       .941    ?U
         RADA  2.8       195     .56        1.018 DU
         DRCO 13.15  184      .39       1.048 DU
         CNBKA 24.59 181    .43        1.086 DU
         MSZ   21.15     193    .55         1.012 DU


       Graphing these I see IEC has fallen back by nearly 1/3 after an advance
         from 1 to 7.5.  This is too volatile for my taste.  But the Closing Power is
         still strongly trending up. I see its most recent breakout was at 4.81 and at 4.
         There should be buyers near 4.   That's where I would want to buy it.

         RADA is also up a lot.  It closed at its rising 50-day ma.  That is normally
         good support.  But the stock is very thinly traded.  Augmented Buy B24s
         do usually find support at their rising 50-day ma.  So, let's see if a reversal
         starts.  That would be bullish.

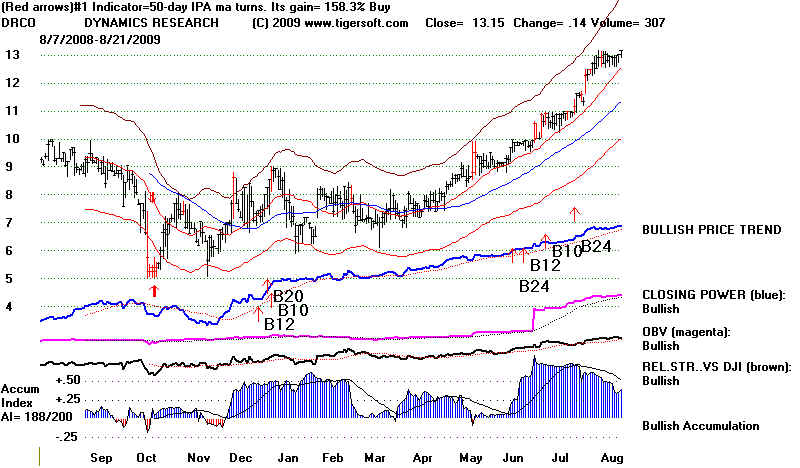
         DRCO looks like a good stock to buy.   It is emerging from a bullish flag pattern
         and all the internals are rate "Bullish".  This would be my pick from these
         stocks.

         CNBKA is thinly traded and now 8.6% over its 21-day ma.  That makes
         it riskier.  I also notice that it may have had a reversal day on Friday.  Placing
         a limit order right at the 21-day ma has worked well for the last two months.

         MSK has flat-lined for a month.  A move above 21 would be a breakout.

wpe16B.jpg (71426 bytes)
       
2.
A second way for traders to use the Power Ranker's is to find flat topped
         breakouts in powerful stocks.
  These are stocks that move past a well-tested
         flat resistance line.  After running the nightly analysis, I prefer just to graph the
         stocks making such new highs.  This is #15 Newhigh in the Tiger Analysis Lists,
         the middle column on the Graph Tiger Daily Data.  Note that I have had to set
         up a new list of stocks, named HOTSTKS2, because the number of stocks making
         new highs in the last two months and still near them has reached the 400+ limit
         that we can conveniently use.  Use the down arrow key on the right side of the key-
         npard to scroll through the stocks.   You could use this approach for any group of
         stocks you like.   We want the stocks to show all "Bullish" automatic notations
         on the right side of the graph and I would require either the IP21 (current accumulation)
         to be above .21
or the CLosing Power to make a new 12 month high.  There should
         be some hesitation.  So, I would require the stock to have hesitated between runs to
         new highs by 10 trading days.
  Often these stocks will show a Buy B5, Buy B10 or
         Buy B25.  An AI/200 score abovr 140 helps limit the number and size of false breakouts. 
         By these criteria here are some recent such breakouts:
                   Stock   CLose  AI/200  IP21  Closing Power NH     Other notes.
                   -------------------------------------------------------------------------------------------------------------------
                   ABV       77.48    134      .37     Yes
              
ACTG    9.11     158       .02     Yes                           Not a flat topped breakout.
                   ACTU     5.92       148      .27      Yes
              AIXG     20.8       151      .32       yes                          Not a flat topped breakout.            
                                                                                                       Up 10 fold from low!
                  ARO       39.55  
122      .25      no 
                 
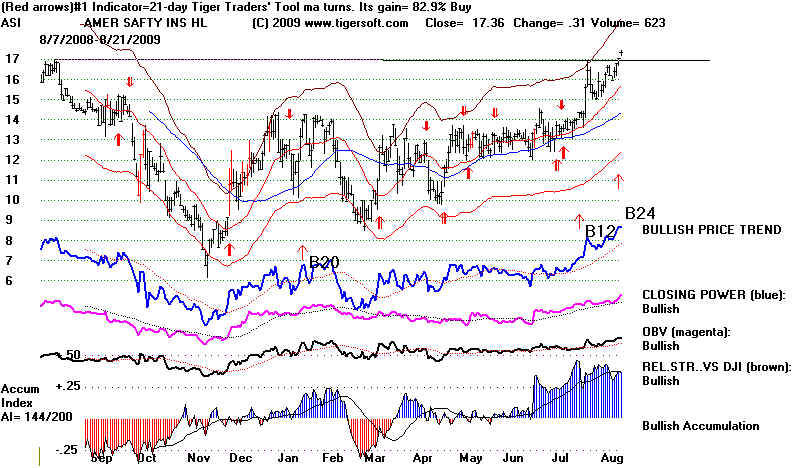
ASI        17.36     144     .38       yes                          10 day-hesitation and breakout.
.
                  ASML     26.91   162     .30       
no                             Not a flat topped breakout.
                  ATRI       136.8   130  -.02        no  
                 
BGF       17.65   129    .35         no                           Late... Wednesday was day of breakout
                 
CAVM    20.67   179    .22         yes                         Late... Wednesday was day of breakout         
              CBOU     8.15      171   .13        no                       Not a flat topped breakout.
                
CCE       20.41      85      .05        no
                    Not a flat topped breakout.
              ...
             
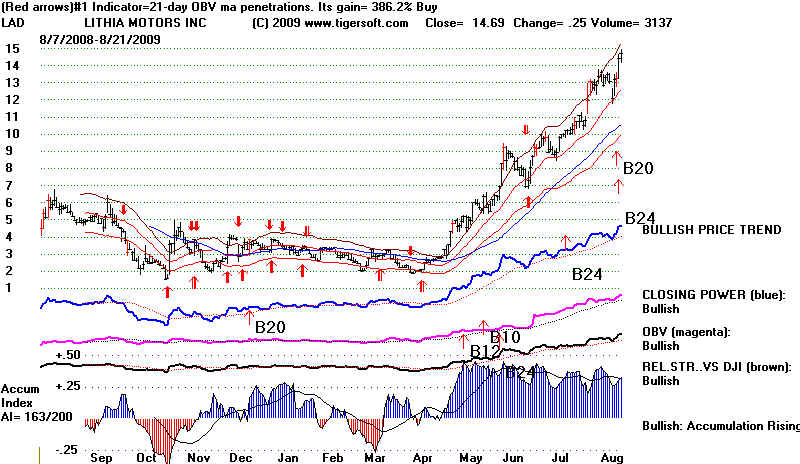
LAD        14.69    163      .32       yes                         10 day-hesitation and breakout. .
            
MUJ         13.7      181      .40       yes                         20-day hesitation and breakout.
            
LCAPA  18.38        172      .32        yes                            7-day hesitation
                MFLX     27.01      156       .22      yes                         
  5-day hesitation
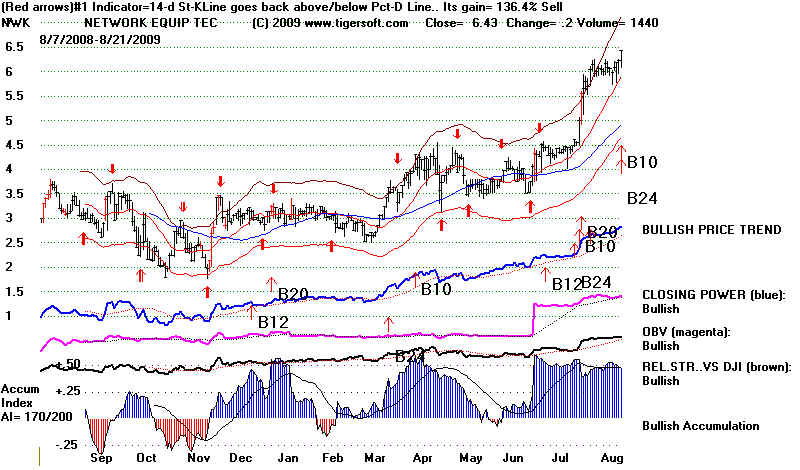
              NWK       6.43        170      .48       yes                           12-day hesitation.
                
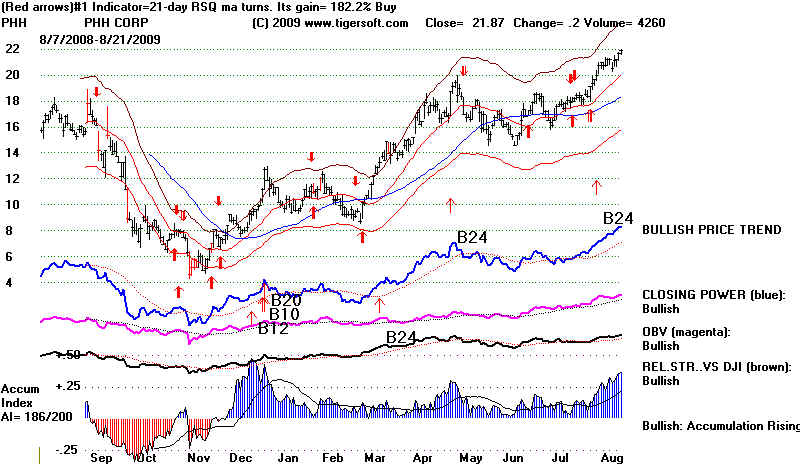
PHH        21.87      186      .35       yes                         6-day hesitation.

             ROVI      30.85      166      .50       yes                          Breakout was 13 days ago.
                 VAL         27.39      138      .50      yes                         6-day hesitation 
                VECO     21.71       145     .37        yes                         8-day hesitation.
                 VRTU      10.43       189     .31      yes                         
irregular pattern breakout.
wpe167.jpg (79312 bytes)

wpe168.jpg (76230 bytes)

wpe169.jpg (77783 bytes)

wpe16A.jpg (73133 bytes)
     3.  A third screener for traders using the Power Ranker is to search for very high current IP21
     stocks and then screen them with CLosing Power, OBV...  This weekend I found all the stocks
     whose
IP21 was greater than .45 and then used the Bullish and Both Up screens.
     But that is probably excessive.  We can screen a group of stocks, like the SP-500, NASDAQ-100,
     DJI-30, Oil Stocks of Biotechs to good advantage.  To do this run the Analysis against,
    say, the SP-500 stocks.  Then, use
Peercomm + View (top of page) + Spreadsheet Display of
    Values...
Find the column heading on the right side marked "IP21".  Click on the word "IP21".
    That reorders the data to show the highest IP21 stocks.  Note the stocks with an Ip21 above .44
    and then graph them normally, notiing the current Buy/Sell signal status, the CLosing Power,
    the 12 month high and where support is.               

                                  Last       IP21   12 mo high and Comments
      -------------------------------------------------------------------------------------
    
NASDAQ-100 
                   
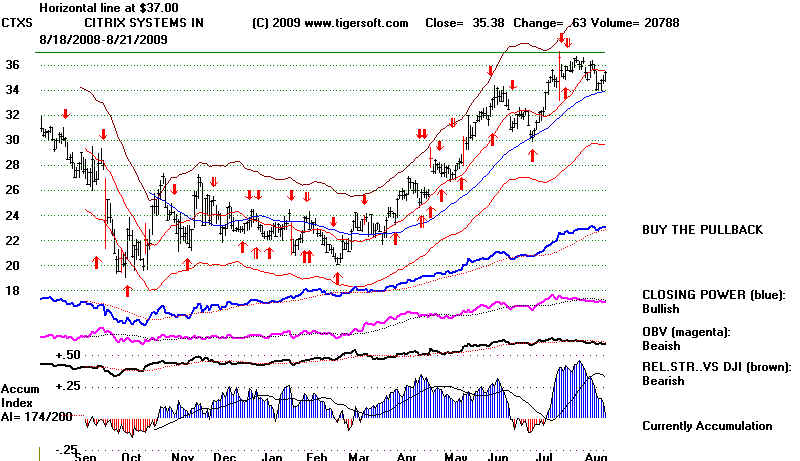
CTXS   27.70   .45       34 on Buy...  Friday saw a price Breakout to a recovery high.
                                                                                   Recent B12. B24, B26


SP-500  PNW    33.41   .46       38 on Buy.... Support is at the rising 21-day ma
                  
CTXS   27.70   .45       34 on Buy...  Friday saw a price Breakout to a recovery high.
                                                                                   Recent B12. B24, B26

                  
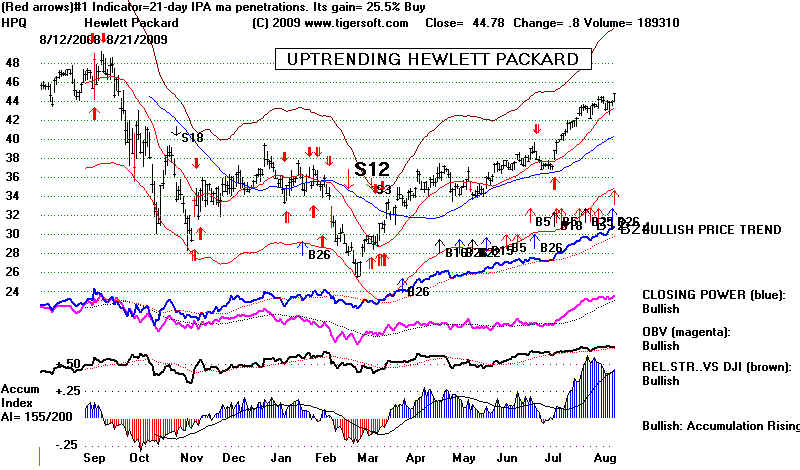
HPQ     44.78   .45        49 on Buy...  Friday saw a price Breakout to a recovery high.
                                                                                   Recent B12. B24, B26

    
OIL -      EPM      2.85    .59        5  AI/200 is only 92.  Strock is just above 50-day ma. Weak CP.
                    BRN      4.64    .50       13 AI/200=125  Short-term resistance is at 5.5 

                   
CRED  12.45  .46        13 AI200=167 Strong Closing Power.  Thin. 
                                                                Better to buy it at support at 11.5

                 
  LZ           61.32 .46        63 AI/200=150 Strong Closing Power.

     
BIOTECHS                                                           
                  
TBIO     0.51                .80   Strong CLosing Power.  .60 is near-term resistance  B12
                    NEOL   0.249             .50 Strong CLosing Power.  Near-term breakout.

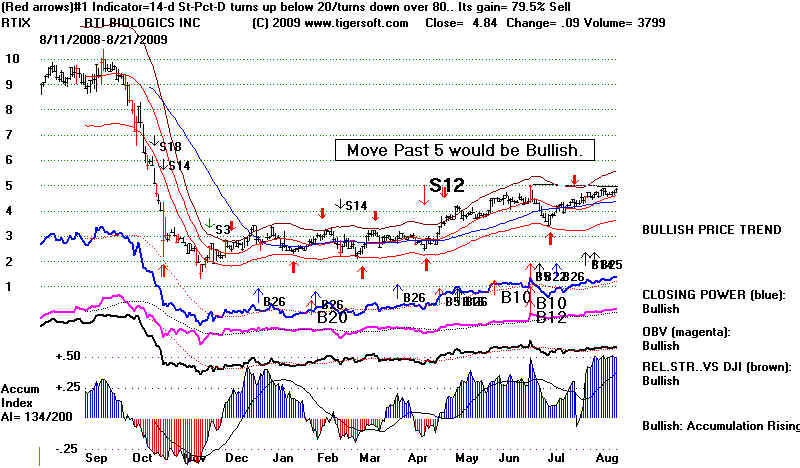
                    RTIX     4.84     .50     10.5    Very high Accumulation for two weeks. All Bullish. 5=resistance.
                  
SNMX  3.62    .45       5  4 is resistance.
wpe164.jpg (79826 bytes)

    wpe166.jpg (76655 bytes)


   4.
A fourth way for traders to use the Power Ranker is to search for the highest AI/200
     stocks and buy the very highest AI/200 stocks on retreats back to their 21-day ma, unless
     the internals look very weak (OBV%-Pr% below -29).  If you sell on CLosing Power trend-breaks,
     you can then trade the Tahiti system stocks,  instead of simply buying and holding them for
     21 months,  Run the Nightly Analyis,  then from the TIger screen use Ranking Results + Tiger     
     Accumulation Index Rankings.

                                 Last        AI/200   IP21   12 mo high and Comments
      -------------------------------------------------------------------------------------
    
NASDAQ-100 
                   
CTXS   35.38     174       .04      37  Recently dipped back to support of rising 50-dma.
                   
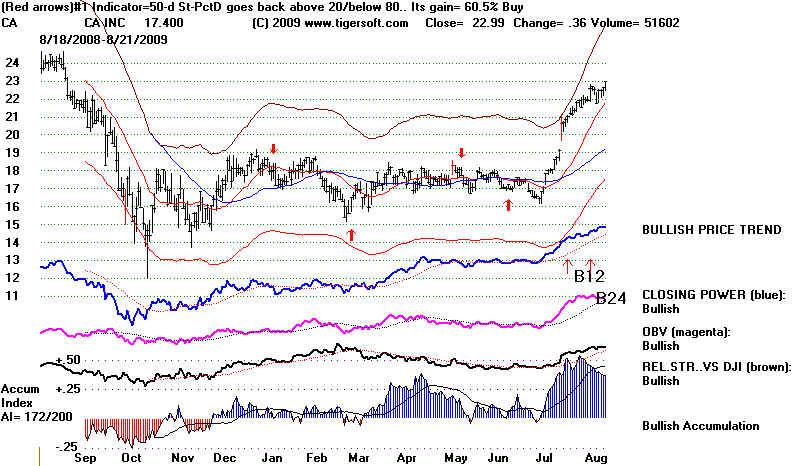
CA        22.29       172     .37       25  Recovery high on Friday.  All Bullish.

   
SP-500   VIA    26.03       188      .40  OBV%-Pr%=-77, which is bearish....
                    
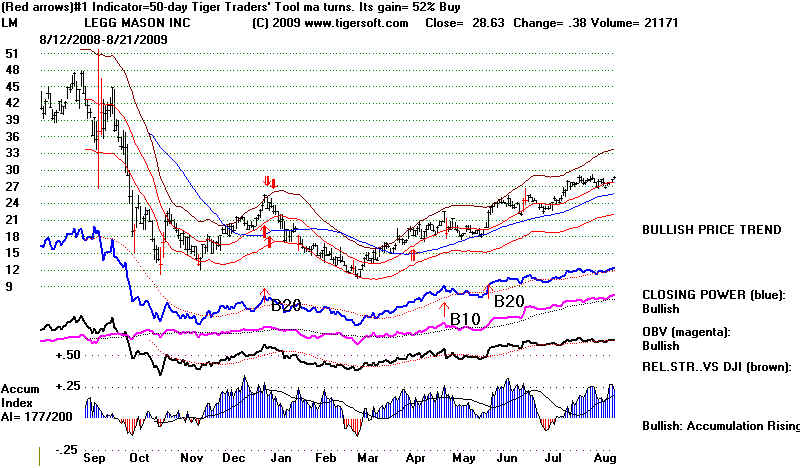
LM     28.63       177     .23   Steady uptrend.   Buy at 21-dma

    
OIL -      TPL     34.09      181     .04   Trades well with 14-day Stochastic. 

     
BIOTECHS                                                           
                  
SIGA     7.7           190   -.05       At falling 50-dma resistance.
                   OPTR    14.18      184   .02      just above fallign 50-dma.

wpe161.jpg (72158 bytes)

wpe162.jpg (73804 bytes)

wpe163.jpg (75858 bytes)


5. A fifth way for traders to use the Power Ranker's is to use a market pull-back
      as a chance to find stocks that are retreating back to their 21-day ma or lower with
      very good internals.  I would much rather buy weak stocks whose decline can be explained
      as being a result of their sympathy with the general market. 
 
           When the Nightly Analysis is run you can see all the stocks that have these signals.
                        B2 - Idosc NC of new low
                        B4 - pullback to strong 50-dma
                        B7 - CLose near lower band with rising Accumulation
                        B8 - Triple NC of new low.
                        B9 - IP21 positive NC at lower band.
                        B21 - pullbacks to rising 21-dma with good internals     
                
     
6. A sixth way for traders to use the Power Ranker's is to look for rank divergences
     between Price Change over, say, 100 days and Intra-Day Volume (Accumulation).  Run the
     Nightly Analysis.  Then from the Tiger screen, choose Ranking Results and 100 day Rank
     Divergences +Y
.  The last column in the display shows the difference in rank between
     a stock's price rank and its Accumulation (Intra-day) volume rank among up to 1000 tocks.
     But be careful, we want to see these stocks not show too much weakness.  For example,
     if their relative strength is falling this shows weakness, or if the CLosing Power is not
     rising in a way that matches price, or OBV is lagging.   Using this approach for HOTSTKS,
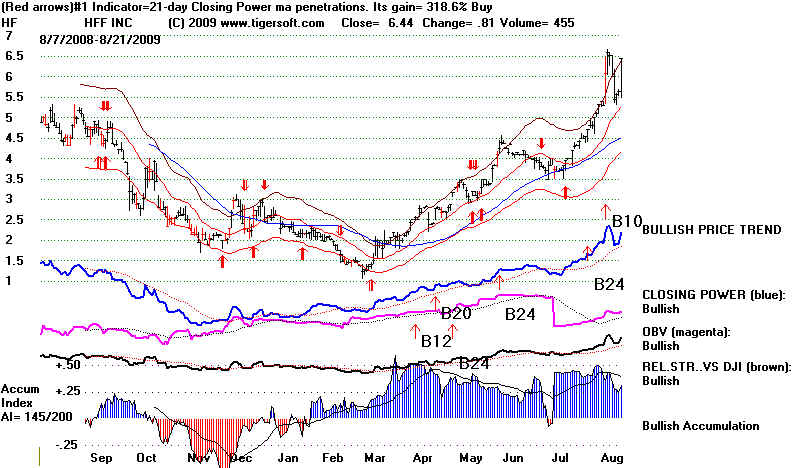
      we see that HF shows a bullish divergence of 40.  Its price change rank over 100 trading
      day is 375 of 437 stocks, while its Accumulation Index rank is 415.

wpe15F.jpg (76198 bytes)