TigerSoft News Service 11/10/2010
Visit our www.tigersoft.com
TigerSoft News Service 11/10/2010
Visit our www.tigersoft.com
What Periods in Past Most Resemble
The Stock Market Now?
The stock market's price action does sometimes repeat quite closely from year to year.
The mini-crashes in the Falls of 1978 and 1979 were my real-time alerts to this. Ten years
after the Ocotber 1987 Crash, there was a mini-Crash in October 1997. Will 2011-2012
bring a repeat ("redux" is the in-word) of 2008-2009?
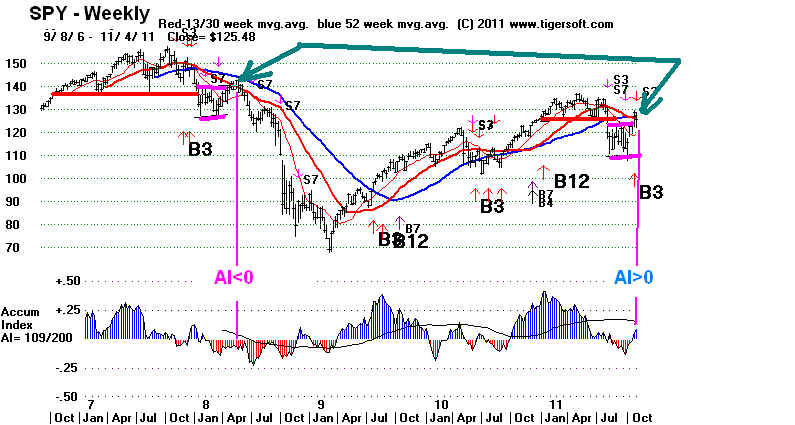
See the weekly SPY (ET for SP-500)..- As it did in June 2009, the SPY has now rallied
to its 52-week ma. In June 2009, it turned down. What will happen in 2011? The rally
has given us a key pivot point to watch. It is not so obvious as a test of a high or a test
of a low, in the Jesse Livermore tradition, but it is an important point to watch the market.
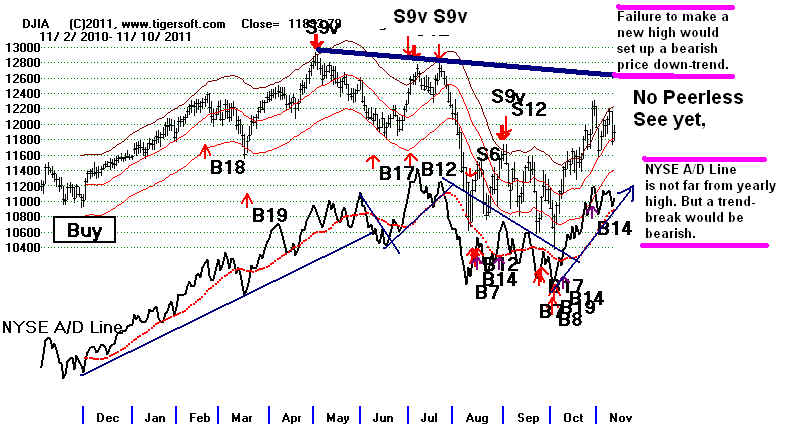
The Tiger Accumulation Index is now positive. The A/D Line (shown) in the daily DJI
chart is stronger now. There is no head/shoulders pattern in the DJI now, as
there was in June 2008. The period after Thanksgiving is normally bullish, whereas,
June is often a bearish month and followed soon afterward by September-October
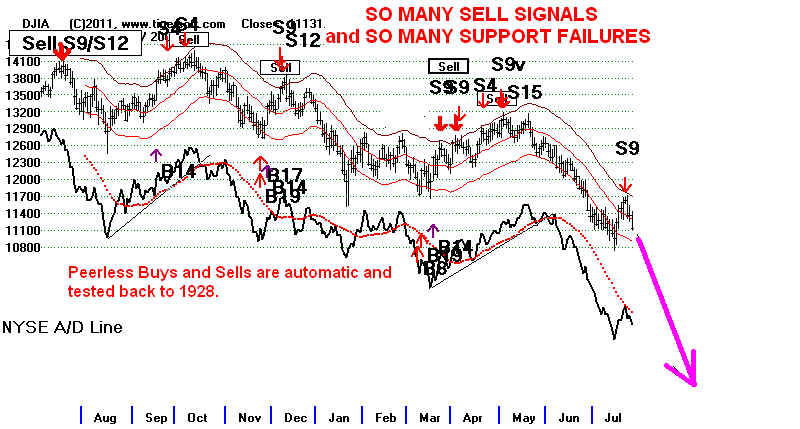
weakness. And most important, we do not have the fearsomely bearish Sell S9.
2011 DJI, Peerless Signals, NYSE A/D Line
We see no major Sell, no head and shoulders top and the A/D Line is much stronger.
by William Schmidt, Ph.D. (Columbia University)
(C) 2011 All rights reserved. Reproducing any part of this page without
giving full acknowledgement is a copyright infringement.
Buy and Holding Is Dangerous: See All The Peerless Real-Time Signals: 1981-2008
 |
Tiger
Software Helping Investors since 1981
|
"Hi Bill, Lots of folks have been running charts comparisons to the May peak in 2008
with today. Price action does look very similar, but my glance at the Tiger indicators
shows much more strength today. Any thoughts?"
My friend who sent this email, could have been referring to:
2008 crash deja vu: We'll relive it, and soon
Is 2011 2008 redux?
Market Rumors Attack: 2008 Redux… Bear Stearns to Lehman top ?
Sure Looks Like 2008
2008 Redux? - Playing the Ponzi
2007-2008
My reply
If we got an S9
or even an S12, I would worry about another sell off now..
But a 53% decline like occurred in
2008 would be a stretch. Sounds like far-right
fear-mongering, too. There are big
differences between now and 2008. The A/D Line is
in an uptrend and near its all-time
high. May 2008 was 7 months after the peak in October 2007.
November 2011 is only 3.5 months
after July peak of 2011. The market was made
much more vulnerable in 2008
because leading up to 2007, there had not been a 10%
correction for 53 months straight.
We had been rising since March 2009, 28 months,
half the time, in July 2011, when
the market turned down. The rise from March 2009
to July 2011, saw two corrections
deeper than 10%.
So what is our closest
parallel? My
three favorites...
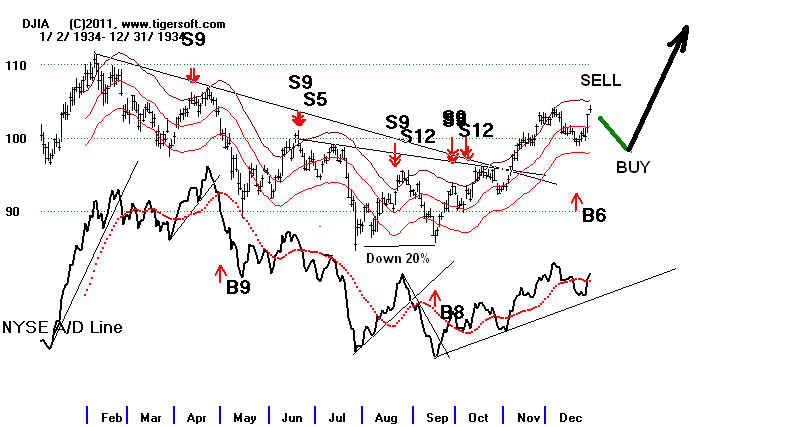
November 1934 - Bull Market of 1935-1937 lay ahead.
November 1934, following a
9-month 20% decline, which came after a recovery that more
than doubled the low made in the
1929-1932 Crash with high unemployment still everywhere,
as now, the market was setting up
superior gains to be made in 1935 and 1936. Breadth is
better now, in that the NYSE A/D
Line than in Nov-Dec 1934, in that it is now much close to its
12 month highs. See the
current DJI chart with the NYSE A/D Line at the top of this page.
1934
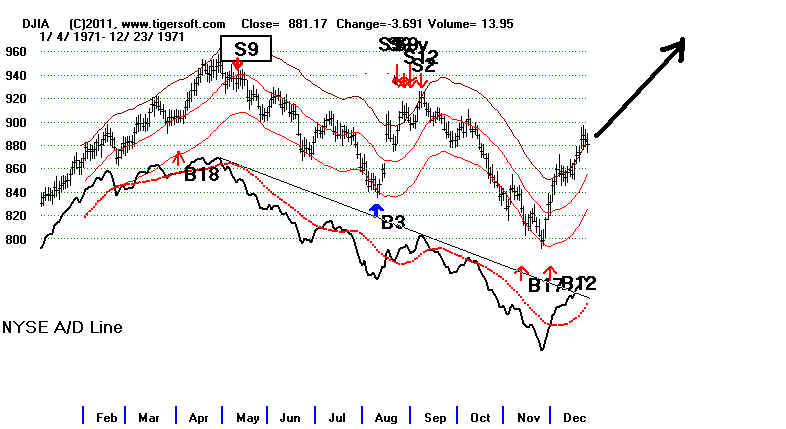
December 1971 - Bull Market of 1972 lay ahead.
December
1971. 1969-1970 brought a deep bear market, 70-71 saw a recovery
and
then 16% correction, much
like we saw the DJI fall in July and August 2011. As now, the next year
was a Presidential Election
year. Nixon got Arthur Burns, the Fed Chairman, to lower interest
rates to accommodate his
re-election needs for 1972. As a result, the DJI rose gradually in 1972
and did not decline
deeply.until after the Presidential Election of November 1972 was past
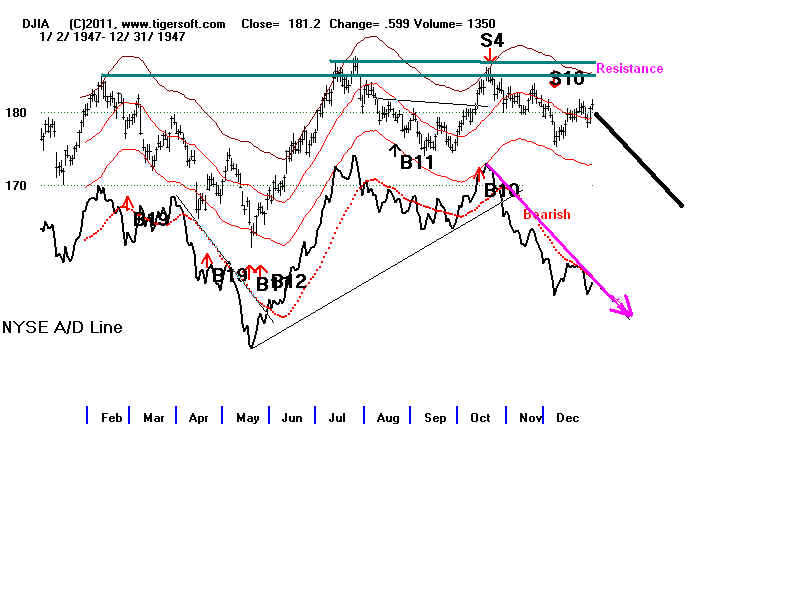
October 1947. - 15% Trading Range set
up by break in A/D Line
uptrend and Peerless Sells.
October 1947. 1946 saw a bad sell-off but the 1947
recovery stalled out short of the highs
just below 200 several
times. This is like the DJI which may stall out on a fourth attempt to
get past 12800.
In 1948, Truman called the then Republican controlled Congress "do nothings",
like Obama does
now. After the DJI failed to surpass 200, the NYSE A/D Line broke its uptrend-
line in October and
sold off to test its yearly lows. The result was a 10% decline from the
October
1948 peak, after which
another rally back to 200 began.