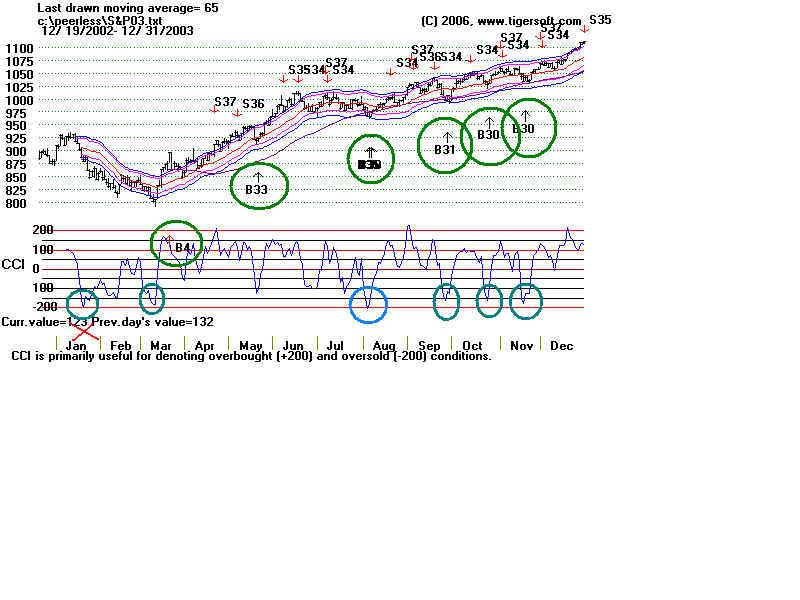
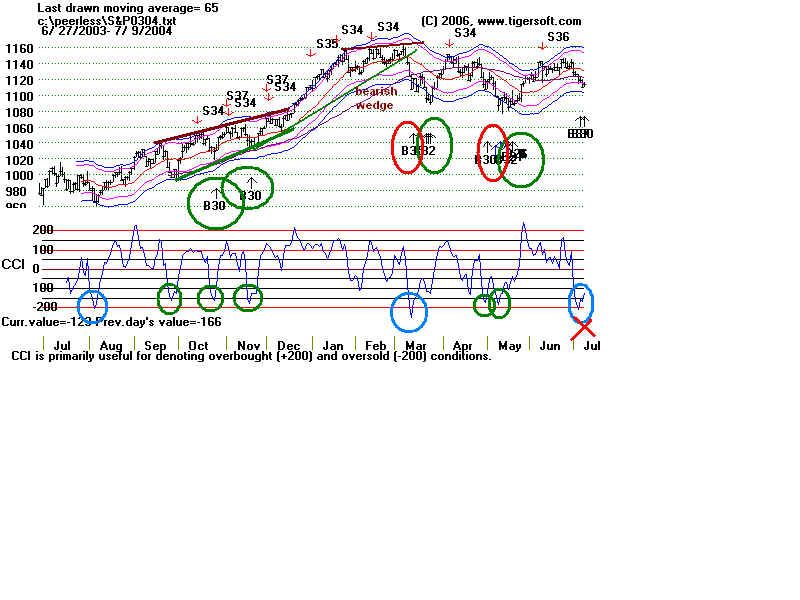
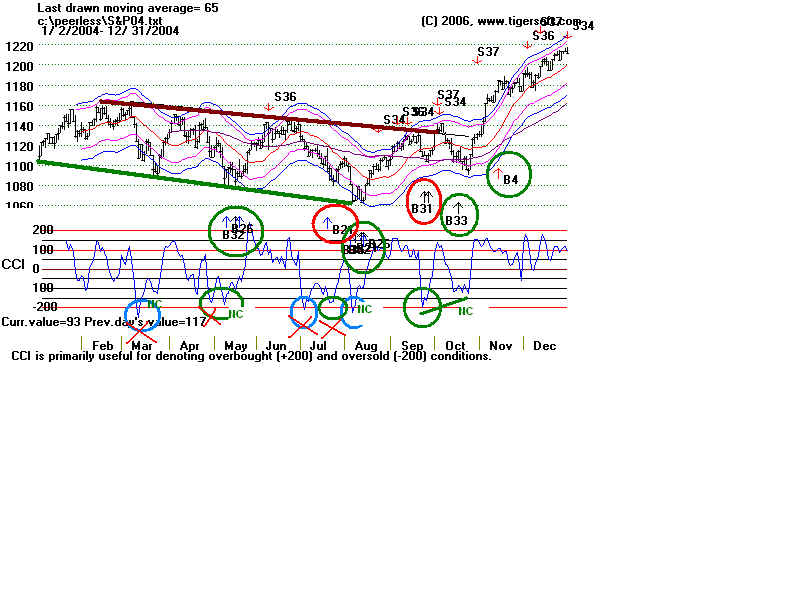
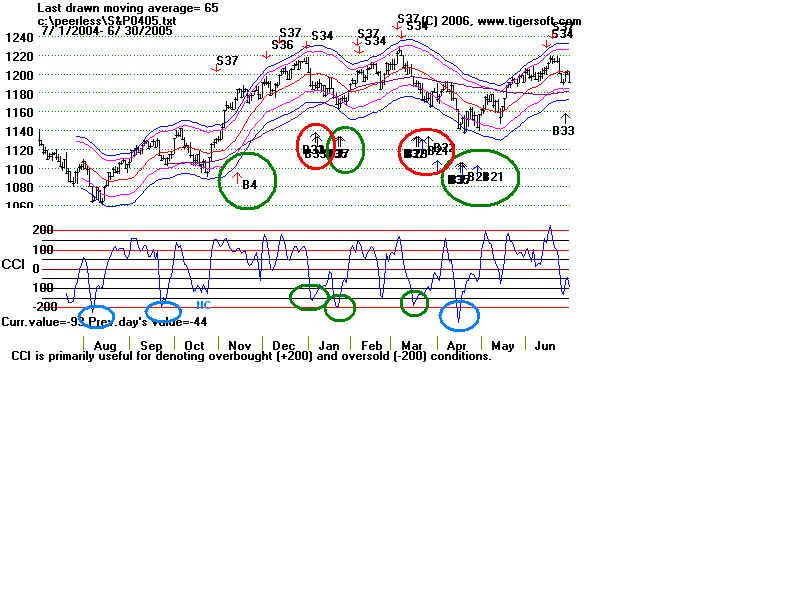
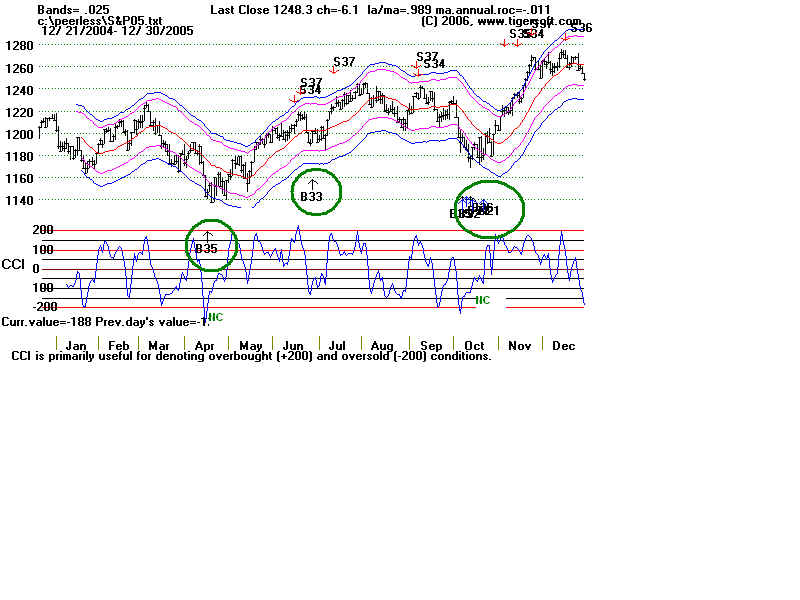
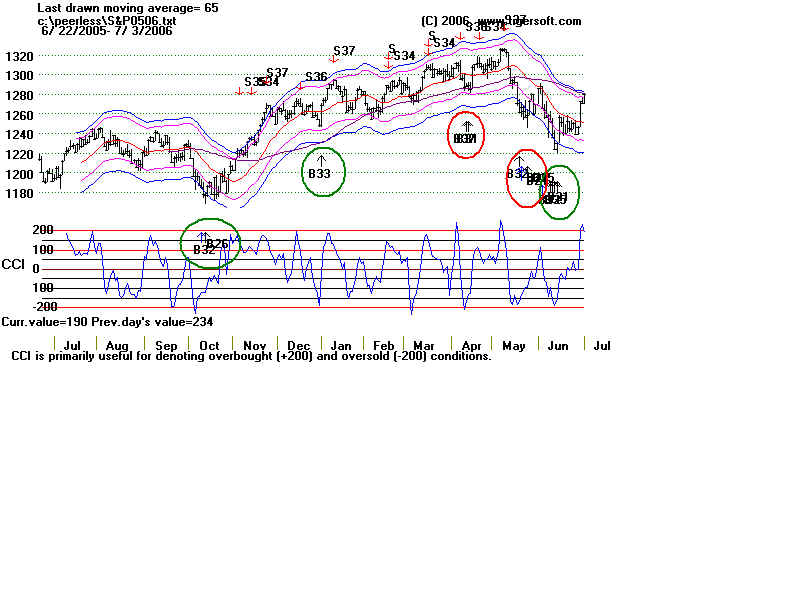
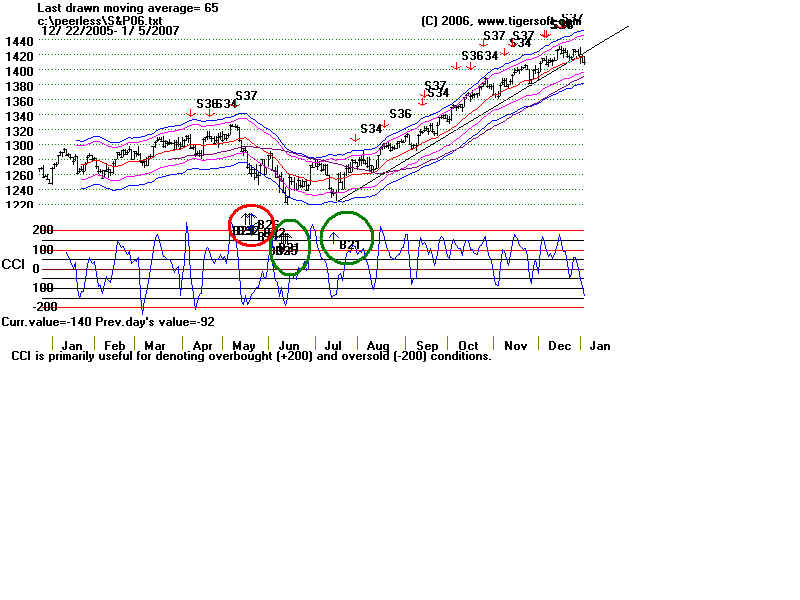
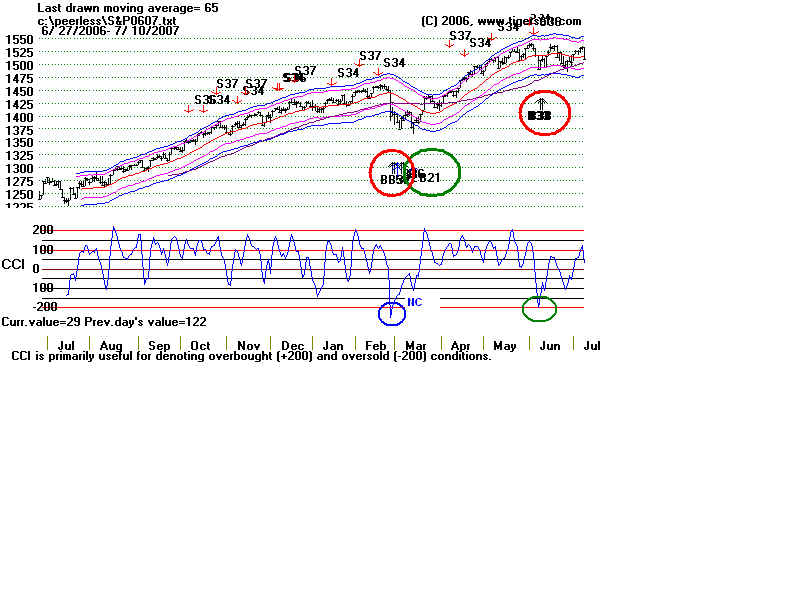
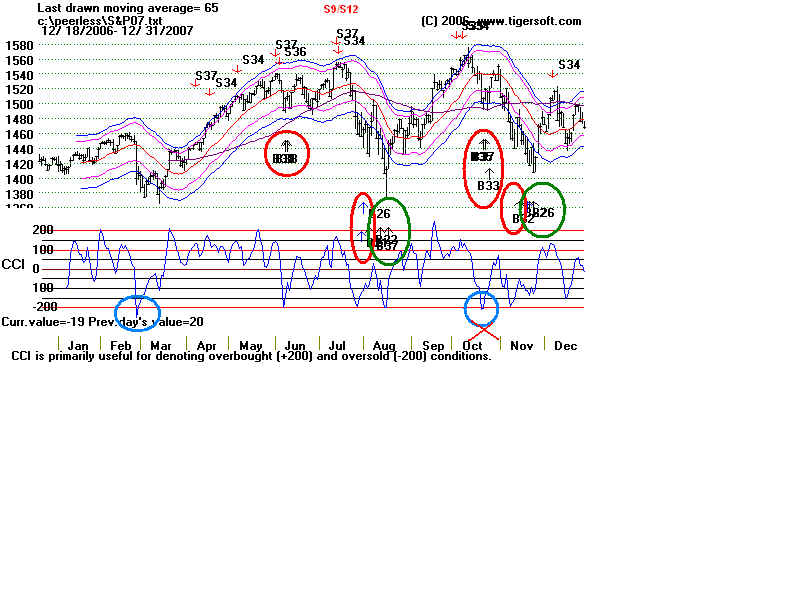
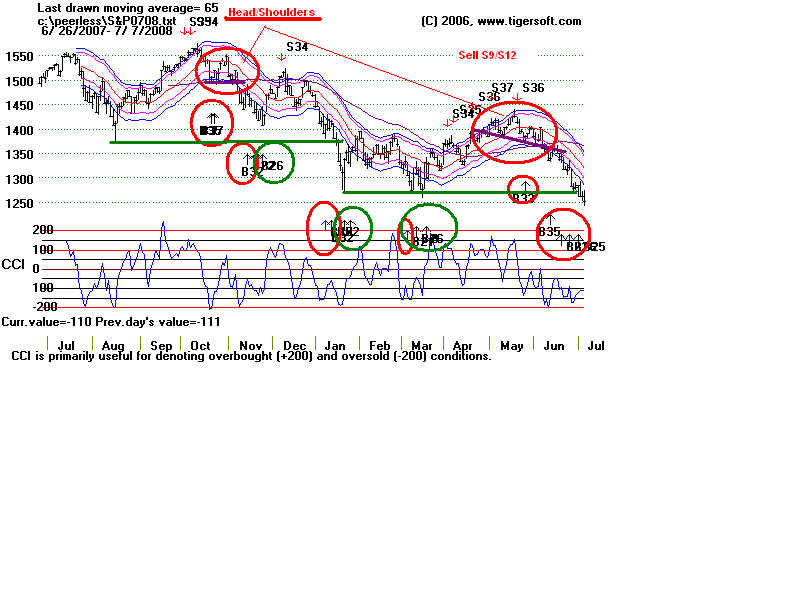
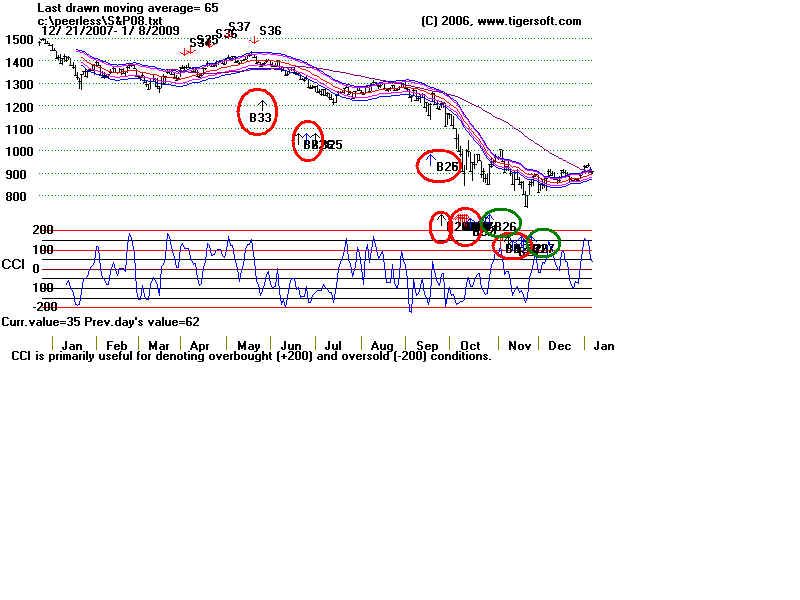
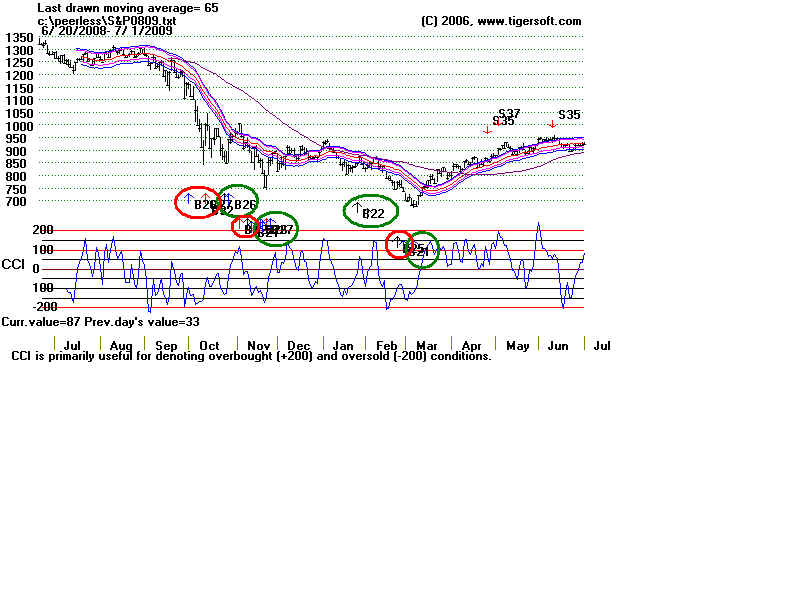
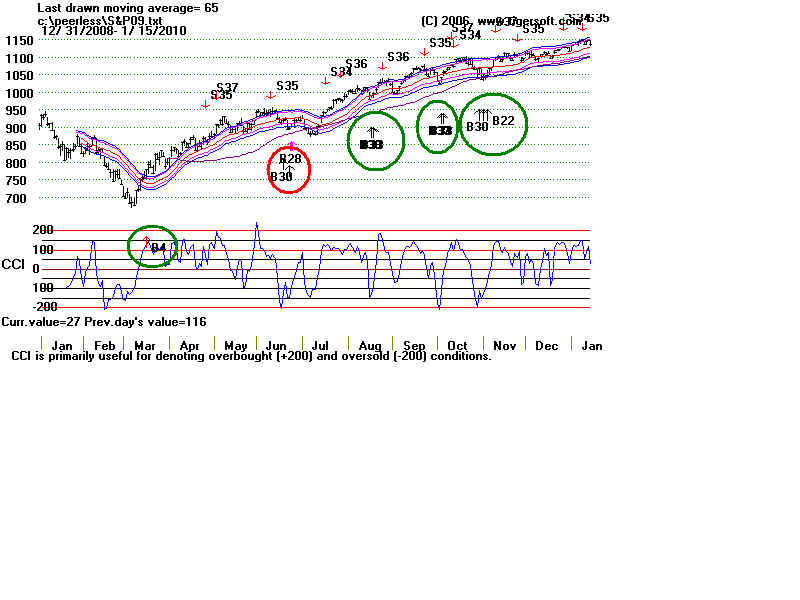
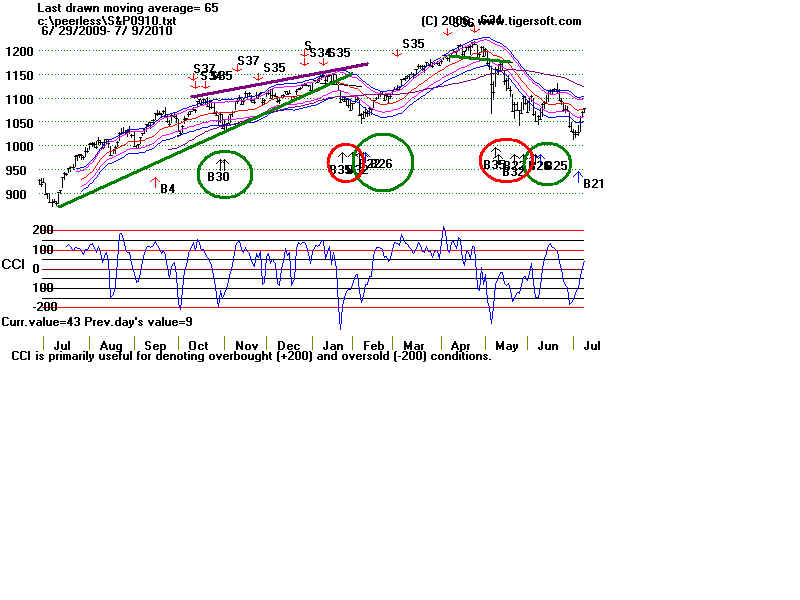
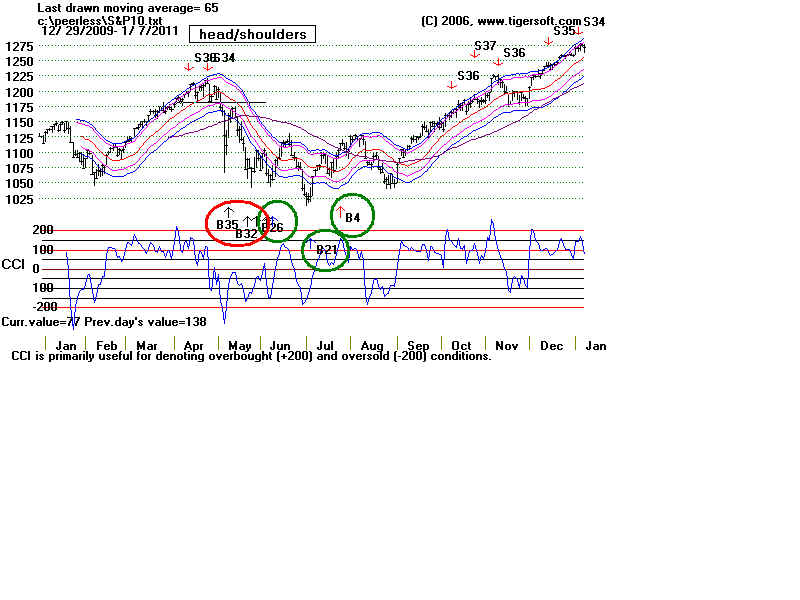
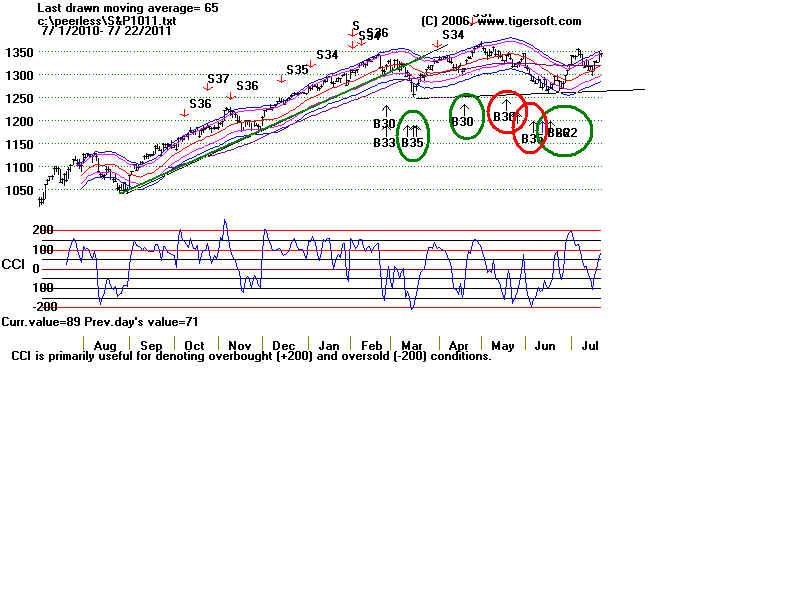
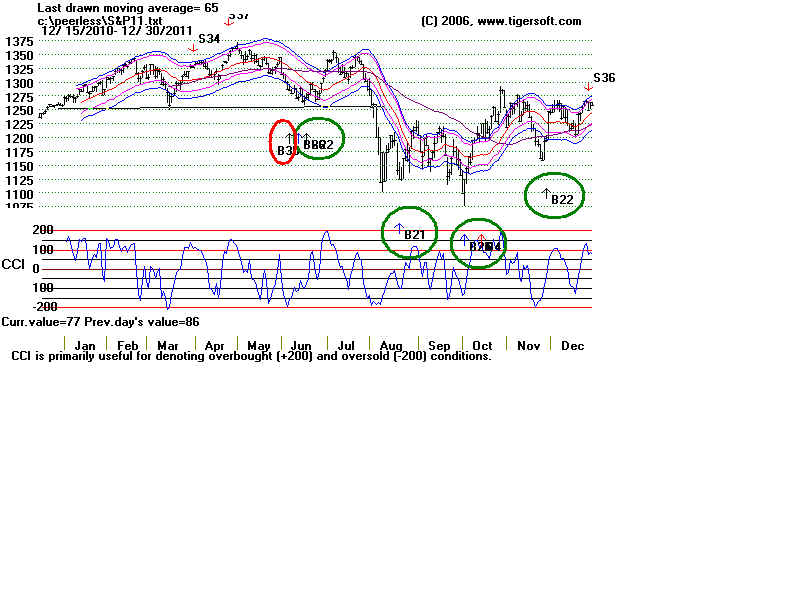
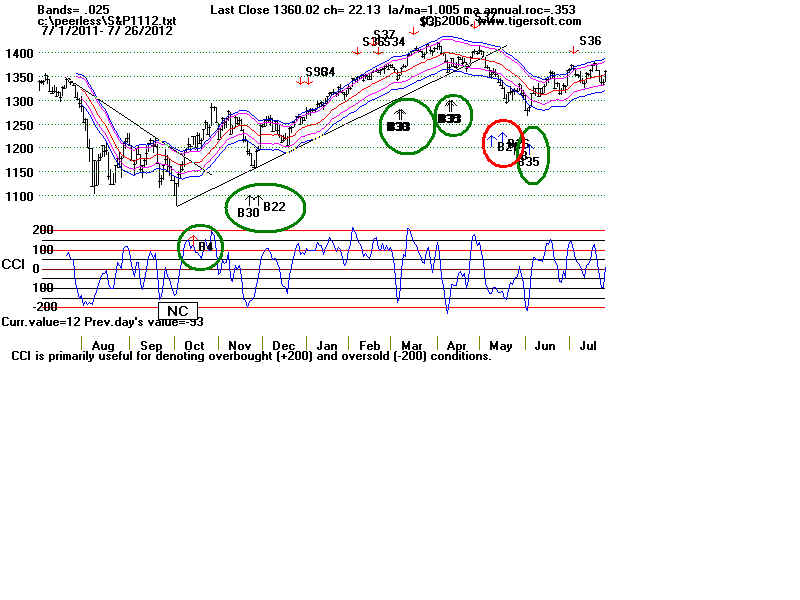
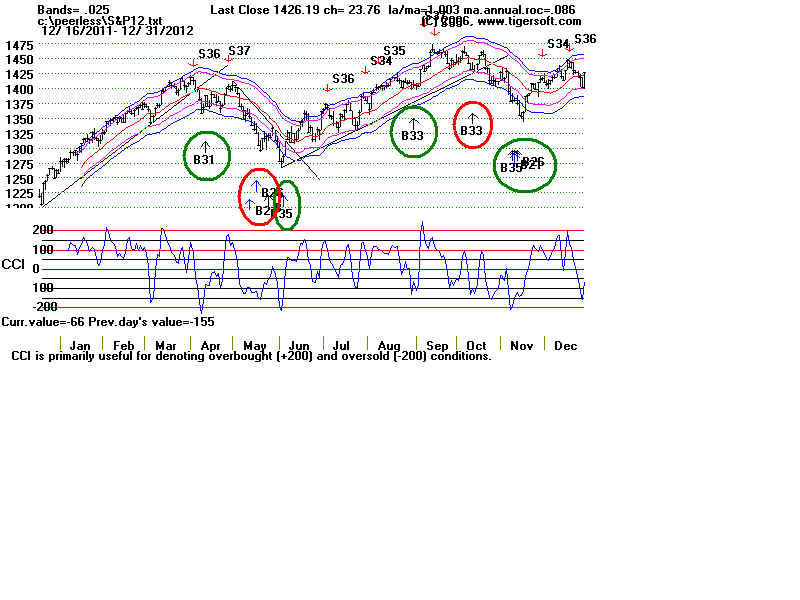
CCI Buy Signals
They are more reliable after the CCI has failed to confirm
a new price low than after simple over-sold conditions
below -150 or below -200.
To avoid losses, do not use them when price uptrend has
ended.
What do drops by CCI below -200 portend?
In 11 cases the SP-500 was at a spot that was good
place to buy immediately. 47.8% of all cases.
In 9 places, it was best to wait one to two months.
39.1% of all cases.
In 3 places it was a very bad time to buy. 13.0% of
all cases.
Date
Result
---------------------------------------
Aug 2003
Good
March 2004
Early.
July 2004 Early.
August 2004
Good
(Sept 2005 OK CCI was
marginally below -200)
April 2005
Good
October 2005 Good
March 2006 Good
April 2006 Good
February 2007 3- weeks Early
October 2007 3% rally and then
collapse.
September 2008 Very Bad.
CCI = -226
Feb 2009 Bad
CCI = -210.8
June 2009
Early
October 2009 Good (twice)
Jan 2010
Early
May 2010 Early
March 2011
Good
April 2012 Good
June 2012 Good
November 2012 Early
August 2013 Early
Jan 2014
Early CCI= -290.1
compared to -319.7 in October 1987
and -254.8 on 11/30/1987.
July 2014
Early
CCI= -288.8
2003 |
2003-2004 |
2004 |
2004-2005 |
2005 |
2005-2006 |
2006 |
2006-2007 |
2007 |
2007-2008 |
2008 |
2008-2009 |
2009 |
2009-2010 |
2010 |
2010-2011 |
2011 |
2011-2012 |
2012 |
2012-2013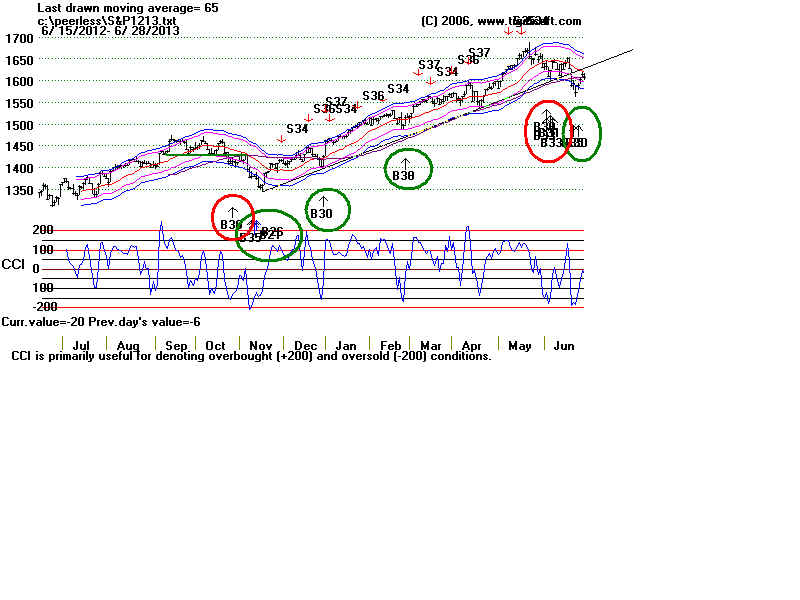 |
2013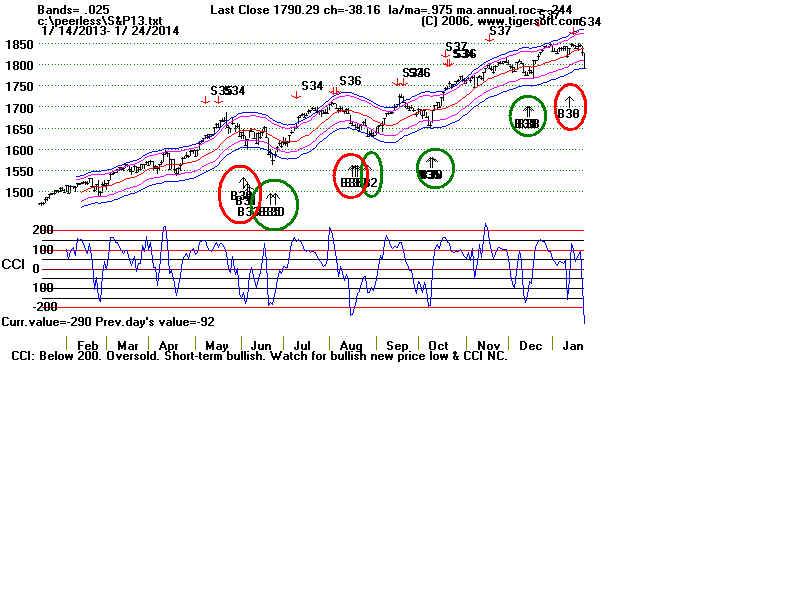 |
2013-2014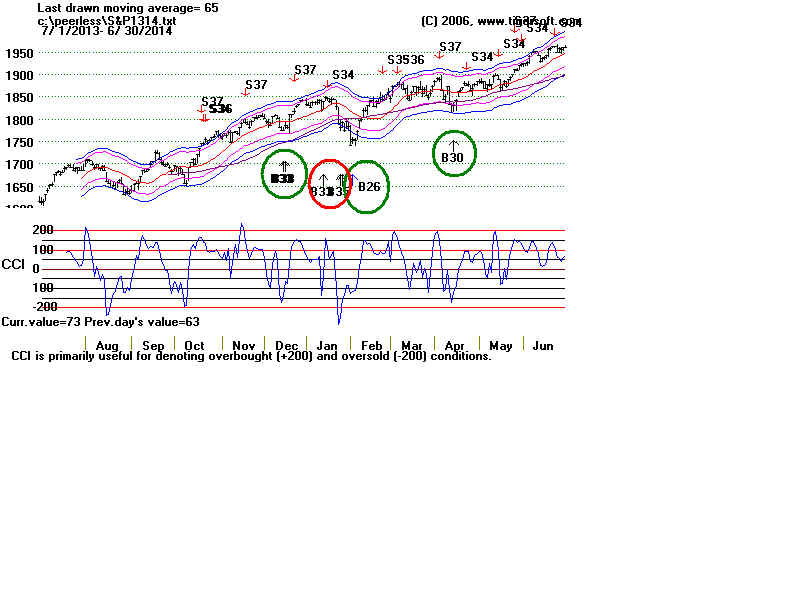 |
2014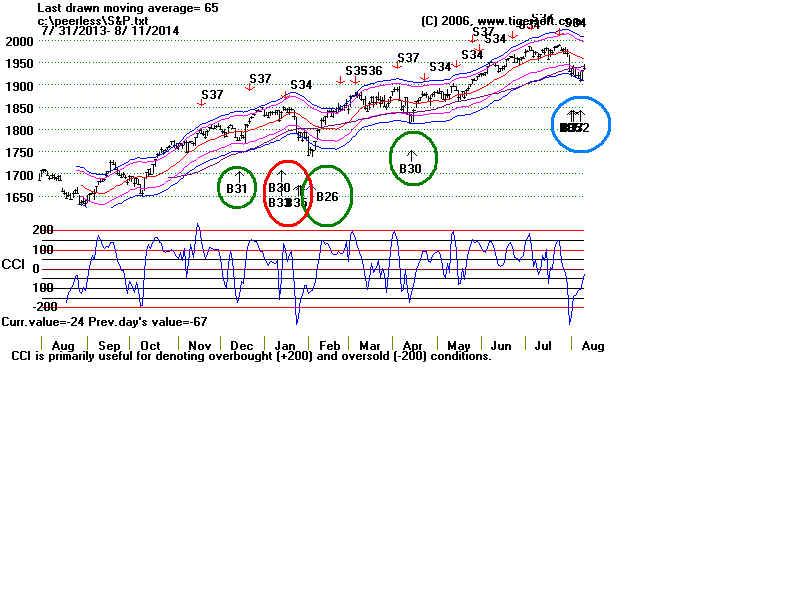 |