See also http://www.tigersoft.com/--6--/index.htm

INTRODUCTORY OPERATIONAL INSTRUCTIONS
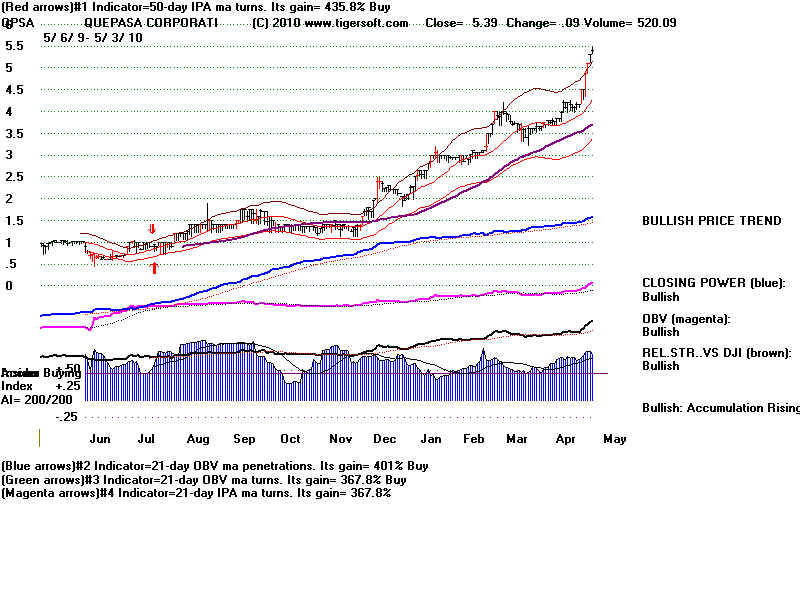
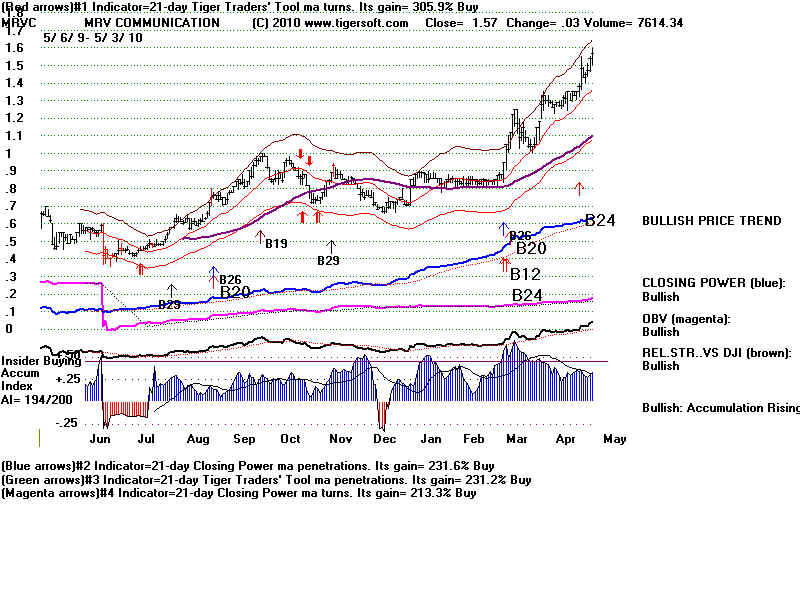
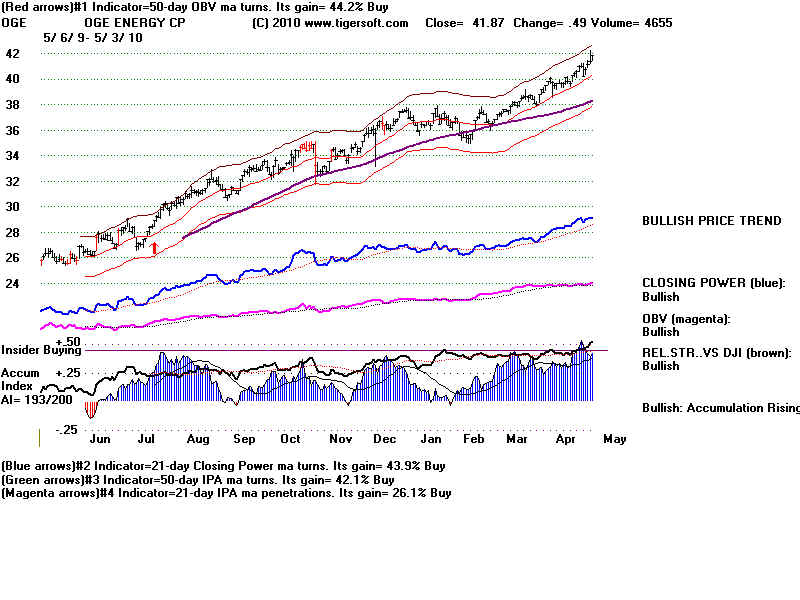
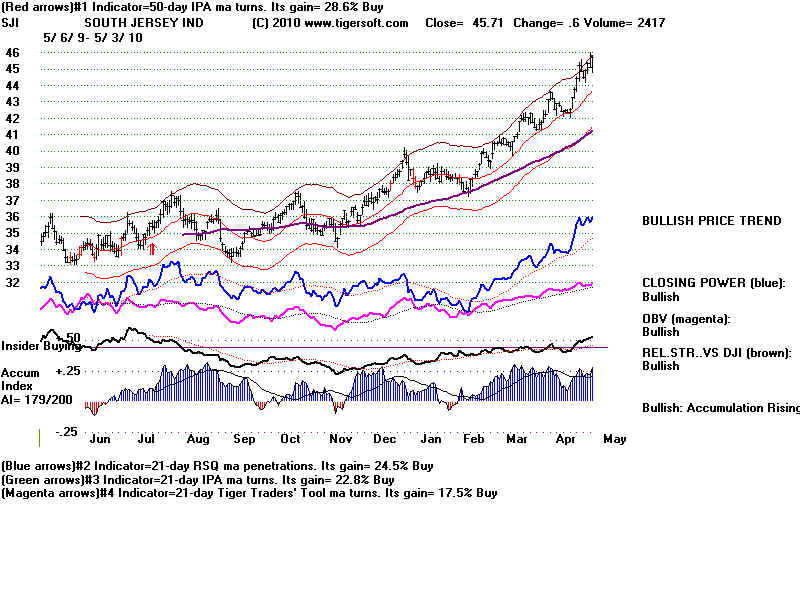
For longs, we want to find stocks that looks like these:
Below is a stock that rose from
2.75 to 95 nine years later. What was unusual
about its TigerSoft chart was how consistently positive was the TigerSoft
Accumulation Index. Our customers were in on the ground gloor with this one.
AMGEN 1990

IST 2004
Over and over the best performing stocks show the same
internal strength characteristics at the start of their big moves. Mainly
they show intense insider buying. The TigerSoft Accumulation Index bulges
past the level (+.50). This is a key screen used by the Tiger Power Ranker.
It is a vital part of the major Buys our graphs post and the Power Ranker
screens for. Each year shows many, many examples of this phenomenon
of insider buying.

DDRX 2008-2009
Most of these are stocks of companies you have never heard of.
But as the stock goes up, the word quickly gets out. High
performance
scans pick up these stocks. Use "TOPREL" with
TigerSoft.
hit 35 in 2010
LCUT 2010

   --- TIGER POWER RANKER INSTRUCTIONS ---

                                 Here are links for Tiger Power Ranker Usage:
  4/27/2010 -   Tiger Tahiti System Using Peerless: 1970-2010
     3/2/2010 -   Many Lesser Known Stocks Are Scoring Impressive,
                         TigerSoft Confirmed Breakouts. See their graphs here.
       Power-Ranker Manual.    http://www.tigersoftware.com/PR2008/index.html
     Supplemental Power-Ranker Instructions
     Instructional Materials on Ranking/Flagging Programs.

     3/5/2009       Using Tiger's Power Stock Ranker.
     4/5/2009       Tiger Stock Power Rank Techniques
     8/22/2009    Uses of The Tiger Power Ranker in A Strongly Rising Market
                                                   Breakouts above Flat Tops.
                                                   Explosive Super Stocks' Pullbacks
                                                   Spotting Rank Divergences between Price and Accumulation or OBV
                                                   Spotting Price Moves That Diverge from Accumulation.
                                                   Spotting Buy Points showing False Weakness.
     On Tiger Data page:
       NHCONF - Data now shows new 12 mo highs with IP21>.25 in last month.
  EXERCISE:
       5/3/2010   Example of Steps to Use Power Ranker against SP-500 Stocks
>Bring data up to date for SP-500 stocks
   use www.tigersoft.com/14441
   open and run SP-500.exe
>Start Peercomm
  > Select + SP500
    This picks the SP-500 as the universe of stocks.
  > Analyze
   This runs ranking and flagging program against the assumed directory
   that you have selected. (It runs faster if you do not have too much
   open on your computer.) The screen will say :Totals and Rankings are
   finished."
> When this happens click "X" at upper right to go back to basic Peercomm.
  > At the Peercomm screen you can click "View" for Spreadsheet of key values
    and "Power Rankings"
   but I prefer click "Charts - 2010" (upper button on right of Peercomm menu).
   This takes you to the newer Tiger screen..
> From Tiger Screen click "Daily Stocks" button on right.
  > Double click "Bullish #12 - Top Power Ranked with rising RSQ"
     Power Ranking is based on AI/200 score + IP21 + OBV-Pr% + Relative Strength

                    Stocks and Interpretation
    This first produces the highest Power ranked stock in SP-500 - PCL.
    PCL has an Accumulation Index which is below +.25.  Bottom index.
    Usually, we want +.23 from this indicator to buy on strength.
    It is at its price is at its rising red 21-day ma.
    The price pattern appears to be a head and shoulders pattern.
    The Blue CLosing Power is in a down-trend.  A move by the Closing Power
    above its downtrend would be bullish. Take note of this for a
    possible new buy in the future.
    Go to the next chart.  Click the down-arrow key on the right of the
    keybord.  If the Num-lock key is off, click 2-down-arrow.  This takes
    you to the next chart, the next stock in the SP-500 Power Ranking.
    The chart of LXK appears next.  Its current Accumulation Index is
    even lower.

    To see the exact value under "Operations" (pull-down menu)
    at the top, click in the middle of the pull-down menu -
    "Stocks - Power Rank, AI/200, IP21.."  The current AI value is
    "IP21", which in this case is only +.057 (too low, we want +.25)
    Go to the next chart.  Click the down-arrow key on the right of the
    keybord. CTRX appears.  Its IP21 is above +.25.  Except for the neutral
    Relative Strength indicator, the readigns at the right are all "bullish".
    Its Closing Power needs to turn up for a Buy. Note at lower left its AI/200
    score is above 192.  Our study of DJIA-30 stocks show sthat those
    with an AI/200 score above 193 achieved annualzied gains of 37% for the
    following 21 months.  See Power Ranking study here.
Go to the next chart...etc.
CLose this operation by clicking "X"
  > Try a different more purely mathematical approach to stock selection...

    From the Tiger screen pull down the from the top the Tiger Selections sub-menu
    and choose  "Tiger Groups".  Then click the row saying "BULLISH"
    and then click "Show Stocks".  This gives you a spread sheet showing the
    key values for each of the "bullish" ranked stocks.  The columns from left to
    right are:
      No. = Power Rank Order.
      Stock
      Close
      Day's change
      Pr% = how far towards the top is the stock from the low of a 100-day price range
      OBV% = how far towards the top is the stock's OBV from the low of its 100-day
             range
      IPA% - same as OBV%, except IPA
      AI/200 = how many of the last 200 days has the Accum. Index been positive
      IP21 = current value of Accum. Index.
      CL/MA = stock divided by 21-day ma
      St-20 = Pct-D (Current day)
      St-20 = Pct-D (previous day)
      Up% = percentage of days stock has risen day to day for last year.
      MACD = current MACD signal
      TGR = Open and CLosing Power Status: U=rising D = declining  ? =uncertain
                !=change in status

    The three most important variables are:
                AI/200 - longer term Accum. - AI>180 means stock is usually safer.
                IP21 - current Accum should bve above +.23 to buy.
                TGR - UU - means both Opening and CLosing Power are rising.

    Scan the IP21 column for stocks whose IP21 is above +.25 and note their TGR status.
       Here are the real key values:
                                IP21   TGR (first character is Opening Power status, second is Closing Pwr Status.
                    CTXS   .36      DU
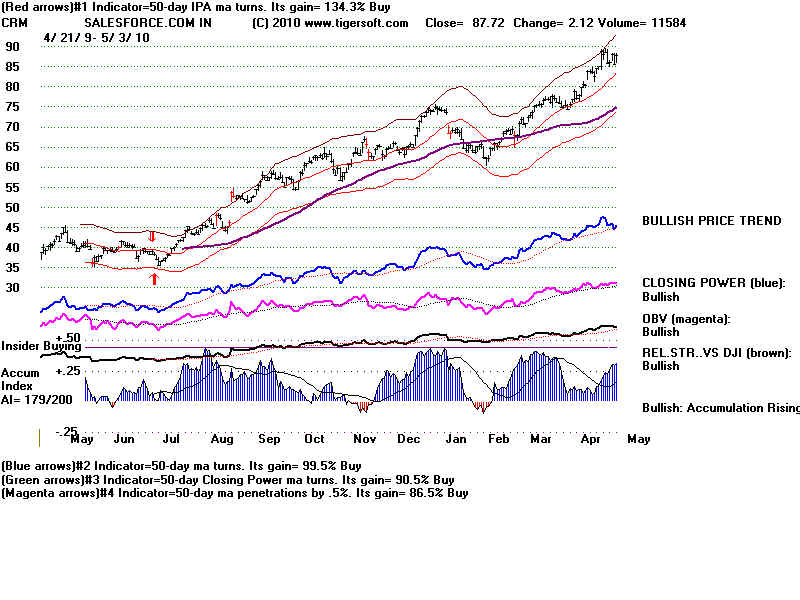
                    CRM     .31      UU!
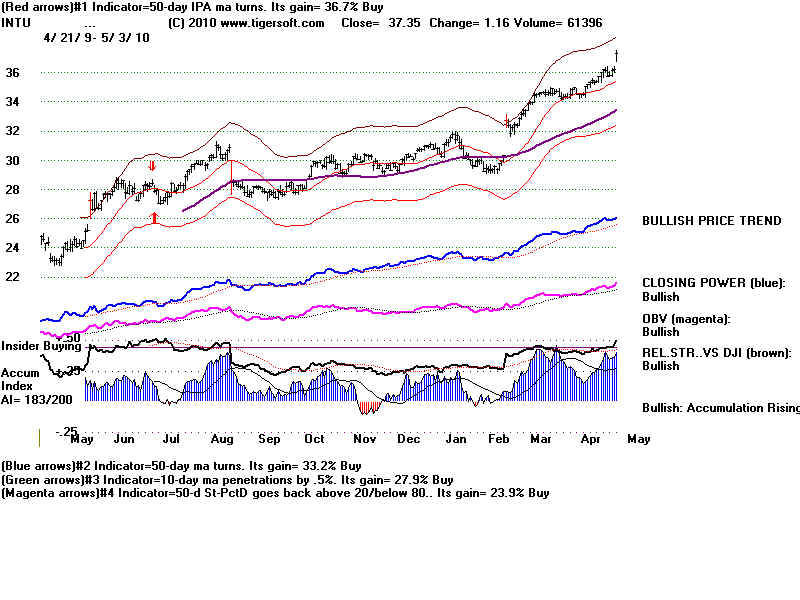
                    INTU     .40      ?U
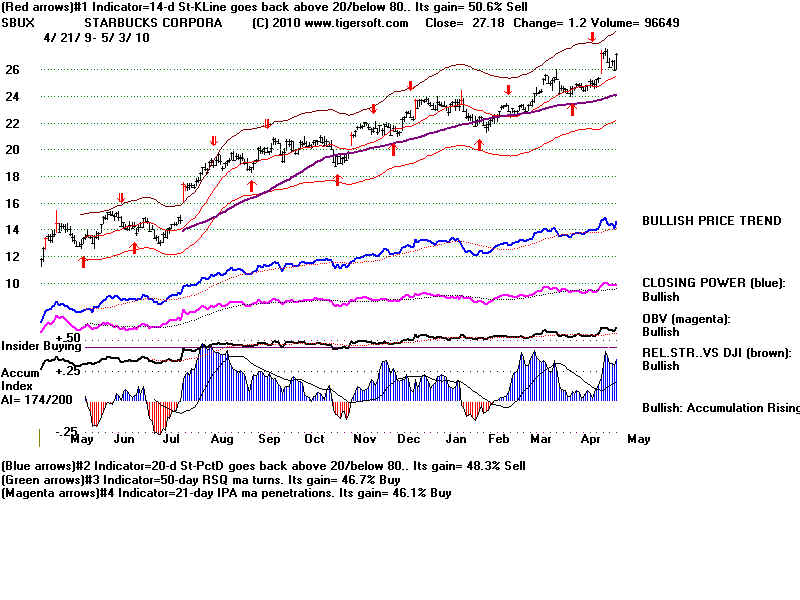
                    SBUX   .35      UU
       Examine each stock by clicking on the row of the spreadsheet where the
       stock's data is and then click the "Graph" button at upper right.

       CRM looks good.  If its Closing Power improves tomorrow, it should start another
       advance.  Of course, the upper band will tend to blunt the rally. So, we might look
       elsewhere, to find more upside potential.
INTU is taking off. Expect good earnings.
SBUX has just had its Closing Power turn up. It is a short-term Buy,
The red-down arrow is not very important, except to show that the
stock sis not pull back very far before turning up.
 Next use the same approach with the stocks in NHCONF
(whose data now shows new 12 mo highs with IP21>.25 in last month.)
Below are the charts of the top 4 stocks (most "bullish" stocks
in this universe.
