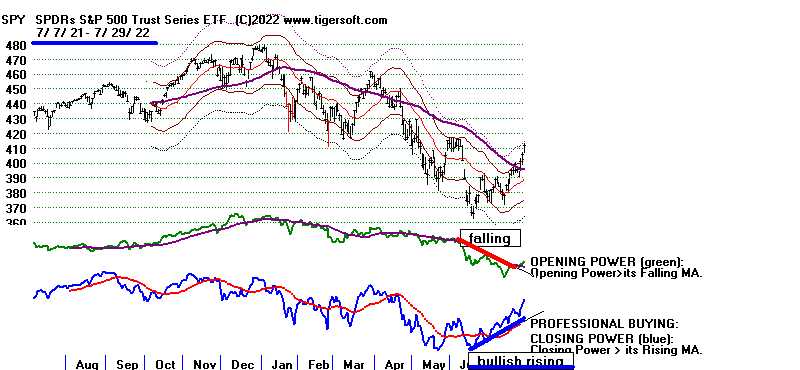
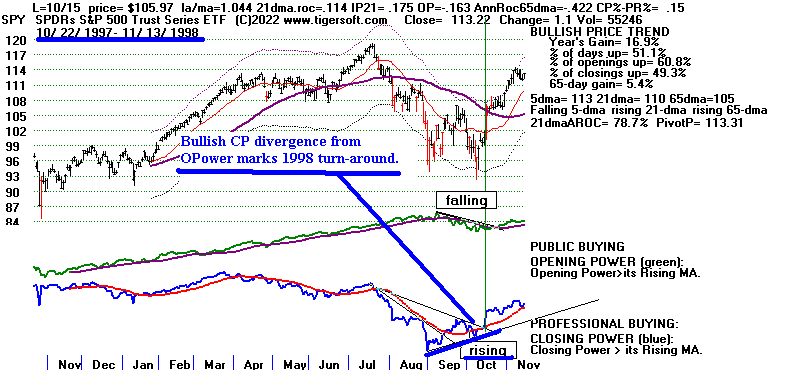
Bullish CP Divergences from Open.Pwr. at or soon after
important market bottoms:
SPY Charts: 1998, 2001, 2003, 2009, 2010, 2011,
2018, 2020, 2022.
Similar divergences appear on DIA, QQQ and NASDAQ charts.
We can also study how the blue Closing Power topped out when market
set up to decline again. Instead of continuing to rise, it starts to gradually back
often as a new month begins. See September 2021, November 2021, end of
December 2021 and April 2022. Look for CP top patterns (H/S) and drops
below 21-dma when it is flat.
| 2022
|
| 1998
|
2001
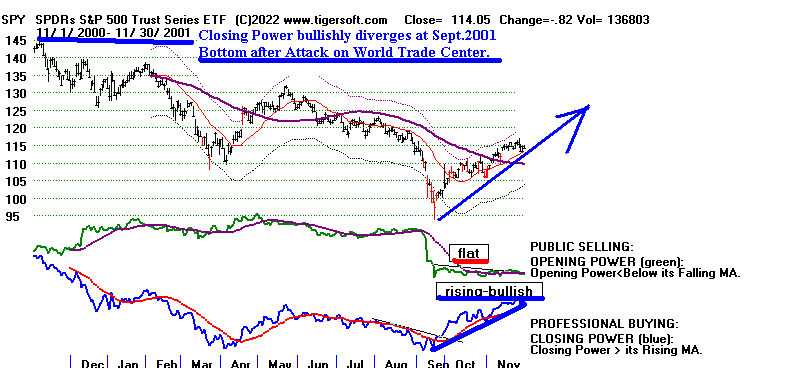 |
2003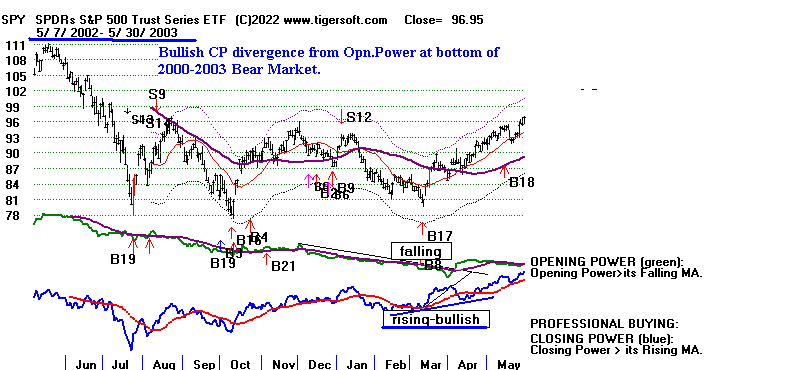 |
2009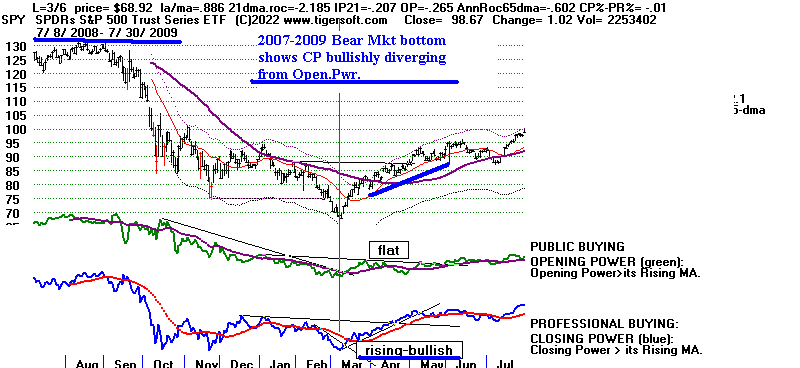 |
2010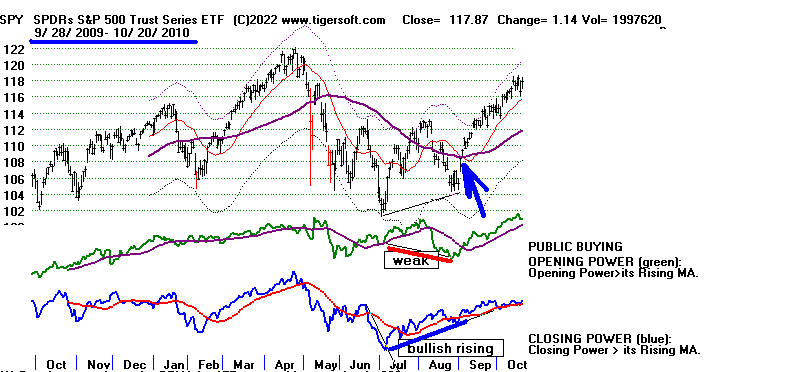
|
2011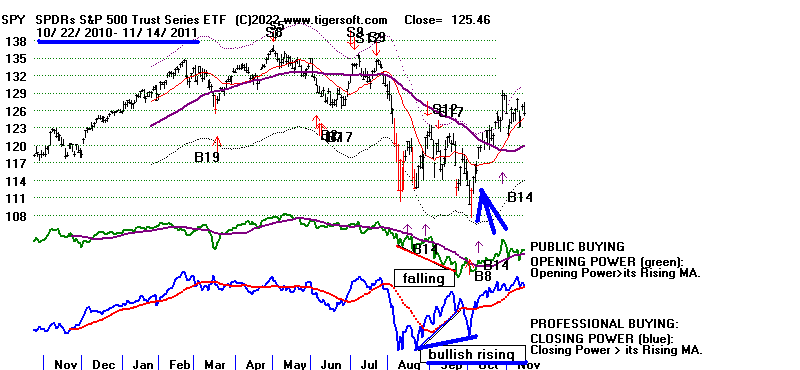 |
2018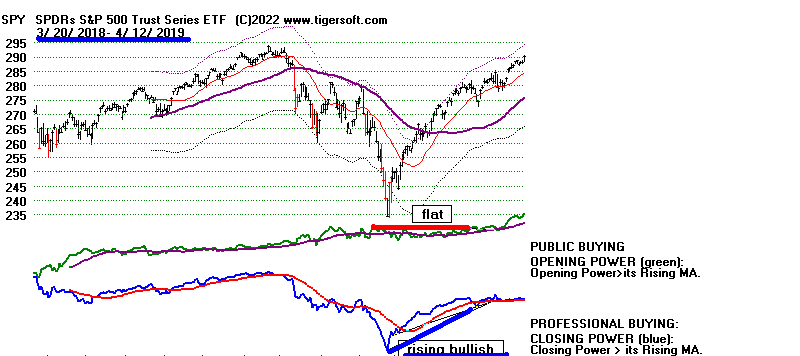 |
2020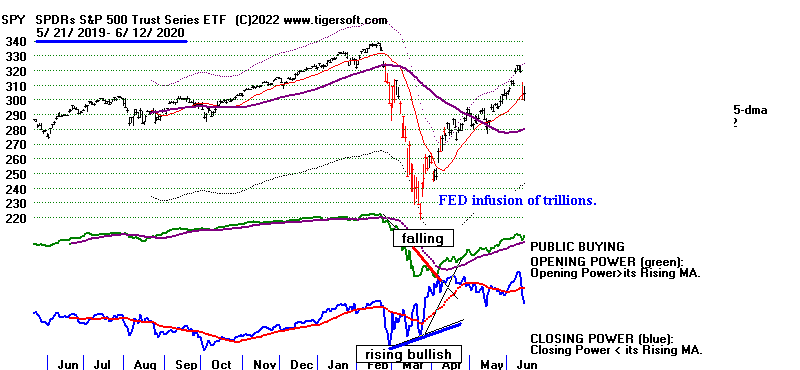 |