---TigerSoft HOTLINE --- 4/1/2022 ----
I M P O R T A N T
LOOK for Email on Saturday giving new HL Address....
-----------------------------------------------------------------------------------
We are using www.tigersoftware.com again.
(C) 2022 William Schmidt, Ph.D. - All rights
reserved.
http://www.tigersoftware.com/211BL/INDEX.htm
==============================================================
Applicable Studies:
The DJI-30 can hold up a lot longer than bears may expect even when the A/D Line
has been bearishly diverging for months. That is a key lesson from 1929, 1937,
1957,
1960, 1969, 1973, 2000 and 2007, among others.
http://www.tigersoftware.com/tops/INDEX.htm
(New)
Days where DJI was 3.7% down in one day but then rose and closed up for the day.
This is what happened on 1/24/2022. Can the DJI lead a weak market back up?
http://www.tigersoftware.com/BEARISH/BIGRDS.htm
As long as DJI does not close down more than 10% from its peak, buying when the red
Stochastic-20-K-Line has fallen below +10, showing very oversold status, its rising back
above it blue Pct-D gives short-term traders a good buy
signal even if Peerless is still on a Sell.
See Stochastic-20 charts of 2021 and 2022. The 6-day Inverted MKDS MA functions
much the same.
Previous Hotlines -> www.tigersoftware.com/211BL/INDEX.htm
www.tigersoftware.com/123ABCH/INDEX.htm
www.tigersoftware.com/1111H/INDEX.htm
====================================================================================
Always CLICK REFRESH. To refresh -
Point mouse at page and Hold down Control Key and hit F-5.
===> Please report any broken or
out-of-date links. william_schmidt@hotmail.com
Friday 5:53 AM PCT Futures: DJI +150
NASDAQ +70 Data through 3/31/2022
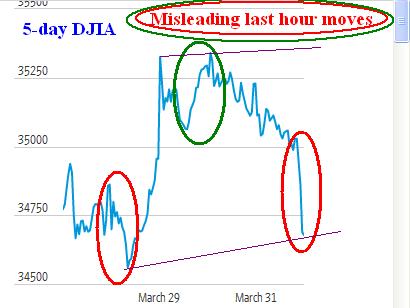
| Nearly 300 points of the 500-point sell-off
today came in the last hour. This makes the decline a mite suspect. But the Closing Powers did break their uptrends. So, though the DJI may rally a bit up from its 65-dma again, where can it go with up-day volume lagging and down-day volume so heavy, like it was today. When we look for leadershop in Table 1 and 3 below, we find the sources of Inflation and Gold on top. That helps explain the weakness in housing stocks (see bearish MINCP leaders). That Professionals prefer the safety of utilities to semi-conductors (SOXL) now is worrisome. Most often Aprils bring rallies. Perhaps, that's so we all have the money to pay taxes. In the short-term, let's see if DIA can rebound from its 65-dma. I take the Sell S9 now to be clinched by the trend-breaks in the closing Powers. I would hedge by shorting some the very weakest home-building stocks or ETFs shown in the bearish MINCPs and stay long NVDA. Mostl likely GLD will rally again. I say this based on the B7s on its chart showing that its Closing Power way above its price-level. |
|
|
 |
 |
 |
 |
 |
 |
 |
 |
 |
 |
Table 1 QUICKSILVER on ETFS - 3/31/2022 Bullish = 6 - GLD OIL/OIH CPER CORN WEAT Bearish = 3 - RSX. RETL and YINN ETF CLOSE CHANGE PIVOT-PT 5-dma AROC CL-PWR CANDLE IP21 ITRS POWER INDEX ================================================================================================== DIA 346.83 -5.29 348.54 -3.3% Bullish RED .098 ---- ---- --------------------------------------------------------------------------------------------- SPY 451.64 -7.06 452.69 12.6% Bullish RED .129 .01 . 139 --------------------------------------------------------------------------------------------- QQQ 362.54 -4.55 359.35 39.7% Bullish RED .118 -.001 .117 --------------------------------------------------------------------------------------------- MDY 490.45 -7.34 494.2 -2.7% ------- RED .056 .012 .068 --------------------------------------------------------------------------------------------- IWM 205.27 -2.19 206.12 -13.7% ------- RED .051 .014 .065 --------------------------------------------------------------------------------------------- FAS 117.57 -7.45 127.23 -204.8% Bearish RED .019 -.087 -.068 --------------------------------------------------------------------------------------------- RETL 19.2 -1.84 20.89 -607.4% Bearish RED -.073 -.26 -.333 --------------------------------------------------------------------------------------------- SOXL 38.78 -2.57 42.01 -387.2% ------- RED .098 -.227 -.129 --------------------------------------------------------------------------------------------- TECL 61.44 -2.6 60.58 55.6% Bullish RED .146 -.058 .088 --------------------------------------------------------------------------------------------- IBB 130.3 -.67 128.16 10.4% ------- RED .067 -.002 .065 --------------------------------------------------------------------------------------------- GLD 180.65 .07 182.38 -68.6% Bullish RED .232 .06 .292 --------------------------------------------------------------------------------------------- OIL 17.32 -.36 17.91 -137.1% ------- RED .103 .173 .276 --------------------------------------------------------------------------------------------- OIH 282.55 -3.22 293.52 -13.3% Bullish BLUE .131 .286 .417 --------------------------------------------------------------------------------------------- CPER 28.71 -.11 28.61 -3.5% Bullish RED .296 .07 .366 --------------------------------------------------------------------------------------------- UUP 26.3 .11 26.41 -19% ------- ---- .152 .037 .189 --------------------------------------------------------------------------------------------- CORN 27.16 .8 26.88 88.6% Bullish BLUE .15 .234 .384 --------------------------------------------------------------------------------------------- WEAT 9.86 -.16 10.61 -278.3% Bearish RED .044 .309 .353 --------------------------------------------------------------------------------------------- YINN 4.62 -.54 4.72 -320.8% ------- RED .145 -.483 -.338 --------------------------------------------------------------------------------------------- RSX 5.65 0 5.65 0% Bullish ---- -.211 -.754 -.965 |
 Table 2   Count of Stocks in Key Directories
             20220331
-------------------------------
NEWHIGHS       208
NEWLOWS        198
MAXCP          55
MINCP          121
TTTNH          76
TTTNL          67
CPCROSSA       16
CPCROSSD       213
ACCUMVER       11
HIGHIP21       10
HIUPPCT        73
VHIP21         50
LOWACCUM       220
REDSELL        131
AUGSELS7       8
TRAPDOOR       6
|
 Table 3      RANKING OF KEY DIRECTORIES BASED PCT.OF STOCKS ABOVE 65-DMA
              3/31/22
 Bullish = 24
 Bearish = 24
---------------------------------------------------------------------------------------
Directory     Current       day-1         day-2         day-3         day-4         day-5
----------------------------------------------------------------------------------------
COAL           1             1             1             1             1             1
GOLD           .913          .913          .913          .913          .934          .956
COPPER         .875          .875          1             .875          1             1
UTILITY        .871          .846          .871          .82           .794          .743
OILGAS         .819          .847          .838          .819          .866          .828
FOOD           .816          .816          .816          .775          .795          .816
INSURANC       .8            .8            .88           .76           .84           .72
COMODITY       .794          .794          .794          .743          .769          .794
TRANSP         .789          .789          .842          .736          .684          .631
SOLAR          .75           .875          .875          .875          .812          .875
MILITARY .73 .769 .807 .769 .807 .807 HACKERS .7 .75 .75 .7 .7 .65 EDU .666 .833 1 .833 .833 .666 INFRA .666 .666 .727 .696 .696 .696 REIT .653 .684 .792 .561 .492 .4 INDMATER .652 .694 .75 .708 .694 .708 INDEXES .648 .735 .767 .659 .589 .556 HOSPITAL .625 .687 .687 .687 .75 .625 FIDSTKS .585 .621 .668 .579 .544 .52 GREEN .526 .578 .578 .526 .526 .473 SP500 .522 .588 .632 .536 .524 .477
NIFTY .521 .565 .63 .565 .521 .565
SOFTWARE .517 .553 .571 .482 .446 .464
NASD-100 .515 .546 .597 .494 .474 .494
============================================================================================
JETS .5 .428 .428 .285 .214 .142
============================================================================================
RETAIL .489 .531 .638 .553 .553 .531
RUS-1000 .483 .531 .572 .475 .475 .453
SP-100 .477 .555 .588 .555 .555 .522
HIGHPRIC .469 .567 .621 .512 .41 .429
DOWJONES .466 .533 .6 .533 .533 .466
=====
LOWPRICE .463 .478 .503 .478 .519 .531
DJI-13 .461 .538 .615 .538 .538 .461
GUNS .461 .461 .538 .384 .384 .307
BIOTECH .448 .484 .54 .42 .426 .431
BEVERAGE .428 .571 .571 .357 .428 .357
GAMING .421 .473 .526 .421 .421 .421
ELECTRON .398 .458 .563 .473 .503 .473
CHEM .391 .456 .608 .456 .478 .456
SEMI .357 .442 .578 .463 .515 .473
COMPUTER .35 .5 .5 .45 .45 .4
AUTO .339 .377 .433 .339 .377 .358
ETFS .327 .4 .436 .272 .29 .272
FINANCE .219 .329 .439 .378 .414 .353
CHINA .18 .3 .3 .24 .2 .28
HOMEBLDG .166 .166 .277 .166 .166 .111
REGBANKS .16 .28 .4 .28 .4 .24
BIGBANKS .142 .142 .142 .142 .142 .142
BONDFUND .011 .011 .011 0 0 0
MARIJUAN 0 .5 .5 .25 .5 .25
|
====================================================================================
Thursday 5:53 AM PCT Futures: DJI -29
NASDAQ +28 Data
through 3/30/2022
| The DJI, NASDAQ and
QQQ still having rising price and Closing Power uptrends, so let's wait a little longer before considering the recovery ended because of the Sell S9. The strength in the Utility sector suggests that Professionals are becoming cautious and risk averse even as the FED signals privately that it wishes to avoid "rocking the boat" with any quick rate hikes. SOXL would be a natural place to invest if Professionals were more optimistic. But the SOXL rally has stopped at its falling 65-dma. Gold is rising again. This probably puts a time-limit on the rally. Another quiet day in the DJI seems ahead. Low volatility after a questionable rally like we havejust seen is probably more likely to lead to another decline rather than a rally, unless the war in the Ukriane were to suddenly end. The Bonds have mostly disappeared from our list of bearish MINCPs. In their place are more and more home-building stocks. With the housing shortage in the US becoming more and more acute, one would think home-builders would be doing much better. I take this as a sign that private home-buying is reaching a point of exhaustion while the actual costs of.the building of a house are "going through the roof". Watch Von's. Here in San Diego, a strike looms there. Wages are not keeping up with wages any better than renters' incomes are keeping up with rents. Strikes and rent controls hurt profits and are going become more and more prevalent. Right now this probably hurts the Democrats and the Biden Administration the most. Wall Street's response will be interesting. Let NVDA do a little base-building. Let's avoid short-selling now until we see clearer evidence that our Closing Powers have turned down. |
||
|
Charts - 3/30/2022 2022 PEERLESS DJI, Signals, Indicators Daily DJI Volume 10-DayUp/Down Vol Stoch-20 Pct of All Stocks above 65-dma Inverted Traders Index Cum. Inverted Traders Index DJI-IPA DJI-OBV NASDAQ S&P OEX NYSE DJI-15 DJI-20 DJI-30 DIA QQQ SPY IWM TNA Short-Term Rates Ten Year Rates DOLLAR-UUP ALLSTOCKs recent 2006 vers-Peerless signals http://tigersoftware.com/NEWPEER/UPD80330.BMP MDY - http://www.tigersoftware.com/CHARTZ/MDY.GIF USO-CrudeOil DBO FAS GLD HD IBB JETS JNUG KOL NUGT OIH PALL RSX RETL SDS AGQ SLV SOXL TAN TECL TLT TMF TNA UGA China: YINN CHAU Commodities: CANE CORN DBC JJC, NIB CORN, CUT (paper) MOO, SOYB WEAT UUP (Dollar) LIT (Lithium) STOCKS: MRNA DIS GE PYPL GME ZOM XLE NRGU AAPL ADBE ALXN AMAT AMGN AMD AMZN AXP BA BABA BAC BIDU BLDP CAT CRM CVX CMG DE ENPH FB GILD GOOG GS HD IBM INTU JPM LRCX MRK MSFT NEM NFLX NKE NVDA PG PYPL REGN REV SO SQ QCOM QDEL TSLA TXN XOM V VRTX WFC WMT ZM Bullish MAXCPs http://www.tigersoftware.com/UPPING/3-30/BULLISH.htm Bearish MINCPs http://www.tigersoftware.com/DOWNING/3-30/BEARISH.htm |
 |
 |
 |
 |
 |
 |
 |
 |
 |
 |
Table 1 QUICKSILVER on ETFS - 3/28/2022 Bullish = 6 - GLD OIL/OIH CPER CORN WEAT Bearish = 1 - RSX ETF CLOSE CHANGE PIVOT-PT 5-dma AROC CL-PWR CANDLE IP21 ITRS POWER INDEX ================================================================================================== DIA 352.12 -.85 347.06 125% Bullish ---- .157 ----- ----- --------------------------------------------------------------------------------------------- SPY 458.7 -2.85 450.49 164.5% Bullish RED .208 .01 .218 --------------------------------------------------------------------------------------------- QQQ 367.09 -4.1 359.65 211.1% Bullish RED .177 -.004 .173 --------------------------------------------------------------------------------------------- MDY 497.79 -7.73 490.72 128.2% Bullish RED .15 .009 .159 --------------------------------------------------------------------------------------------- IWM 207.46 -4.25 205.84 86.1% Bullish RED .118 .003 .121 --------------------------------------------------------------------------------------------- FAS 125.02 -3.48 122.73 186.8% Bearish RED .082 -.083 -.001 --------------------------------------------------------------------------------------------- RETL 21.04 -3.08 21.86 -29.7% ------- RED .073 -.211 -.138 --------------------------------------------------------------------------------------------- SOXL 41.35 -4.23 42.09 557.2% Bullish RED .156 -.256 -.1 --------------------------------------------------------------------------------------------- TECL 64.04 -2.7 60.74 625.6% Bullish RED .192 -.064 .128 --------------------------------------------------------------------------------------------- IBB 130.97 -1.74 130.03 100.3% Bullish RED .117 -.014 .103 --------------------------------------------------------------------------------------------- GLD 180.58 1.44 183.13 -34% Bullish BLUE .249 .071 .32 +++ --------------------------------------------------------------------------------------------- OIL 17.68 .34 17.8 -158.9% Bullish BLUE .149 .194 .343 +++ --------------------------------------------------------------------------------------------- OIH 285.77 .98 283.31 64.6% Bullish RED .173 .274 .447 +++ --------------------------------------------------------------------------------------------- CPER 28.82 -.1 28.73 -57.2% Bullish RED .336 .079 .415 +++ --------------------------------------------------------------------------------------------- UUP 26.19 -.14 26.4 -34.1% ------- ---- .088 .026 .114 --------------------------------------------------------------------------------------------- CORN 26.36 .32 26.69 -118.2% ------- ---- .139 .212 .351 +++ --------------------------------------------------------------------------------------------- WEAT 10.02 .13 10.43 -275.2% Bullish RED .046 .368 .414 +++ --------------------------------------------------------------------------------------------- YINN 5.16 -.07 4.94 70.4% ------- ---- .18 -.422 -.242 --------------------------------------------------------------------------------------------- RSX 5.65 0 5.65 0% Bullish ---- -.463 -.749 -1.212 |
  Table 2   Count of Stocks in Key Directories
          20220330
-------------------------------
NYSE ADV       1420 vs 2744 yesterday
NYSE DEC       906  vs 1420 yesterday
NEWHIGHS       198
NEWLOWS        108
MAXCP          93
MINCP          43
TTTNH          55
TTTNL          40
CPCROSSA       14
CPCROSSD       175
ACCUMVER       9
HIGHIP21       10
HIUPPCT        68
VHIP21         49
LOWACCUM       207
REDSELL        122
AUGSELS7       7
TRAPDOOR       11
|
 Table 3      RANKING OF KEY DIRECTORIES BASED PCT.OF STOCKS ABOVE 65-DMA
              3/30/22
 Bullish = 31
 Bearish = 17
---------------------------------------------------------------------------------------
Directory     Current       day-1         day-2         day-3         day-4         day-5
----------------------------------------------------------------------------------------
COAL           1             1             1             1             1             1
GOLD           .913          .913          .913          .934          .956          .956
COPPER         .875          1             .875          1             1             1
SOLAR          .875          .875          .875          .812          .875          .937
OILGAS         .847          .838          .819          .866          .828          .819
UTILITY        .846          .871          .82           .794          .743          .743
EDU            .833          1             .833          .833          .666          .666
FOOD           .816          .816          .775          .795          .816          .836
INSURANC       .8            .88           .76           .84           .76           .72
COMODITY       .794          .794          .743          .769          .794          .82
TRANSP         .789          .842          .736          .684          .578          .526
MILITARY       .769          .807          .769          .807          .807          .769
HACKERS        .75           .75           .7            .7            .7            .65
INDEXES        .735          .767          .659          .589          .551          .4
INDMATER       .694          .75           .708          .694          .708          .68
HOSPITAL       .687          .687          .687          .75           .625          .562
REIT           .684          .784          .569          .492          .415          .361
INFRA          .666          .727          .696          .696          .696          .666
FIDSTKS        .621          .668          .579          .544          .514          .461
SP500          .588          .632          .536          .522          .477          .419
GREEN          .578          .578          .526          .526          .473          .421
BEVERAGE       .571          .571          .357          .428          .357          .214
HIGHPRIC       .567          .621          .512          .41           .407          .312
NIFTY          .565          .63           .543          .521          .543          .456
SP-100         .555          .588          .555          .555          .511          .466
SOFTWARE       .553          .571          .482          .446          .464          .428
NASD-100       .546          .597          .484          .474          .494          .412
DJI-13         .538          .615          .538          .538          .461          .461
DOWJONES       .533          .6            .533          .533          .466          .366
RETAIL         .531          .638          .553          .553          .531          .489
RUS-1000       .531          .572          .475          .475          .455          .44
==============================================================================================
COMPUTER       .5            .5            .45           .45           .4            .35
MARIJUAN       .5            .5            .25           .5            .25           0
===============================================================================================
BIOTECH        .484          .54           .42           .426          .426          .381
LOWPRICE       .48           .503          .475          .519          .526          .496
GAMING         .473          .526          .421          .421          .421          .421
GUNS           .461          .538          .384          .384          .307          .307
ELECTRON       .458          .563          .473          .503          .466          .353
CHEM           .456          .608          .478          .456          .478          .434
SEMI           .442          .578          .463          .515          .463          .347
JETS           .428          .428          .285          .214          .071          .071
ETFS           .4            .436          .272          .29           .309          .236
AUTO           .377          .433          .339          .377          .358          .377
FINANCE .329 .439 .378 .414 .365 .317 CHINA .3 .3 .24 .2 .28 .32 REGBANKS .28 .4 .28 .4 .24 .24 HOMEBLDG .166 .277 .166 .166 .111 .111 BIGBANKS .142 .142 .142 .142 .142 .142 BONDFUND .011 .011 0 0 0 .011 |
====================================================================================
Wednesday 5:15 AM PCT Futures: DJI -101
NASDAQ -66 Data
through 3/29/2022
| The Peerless S9 has failed to stop the DJI at its
falling 65-dma. That resistance has been convincingly surpassed and will likely act as support. Instead, the DJIA seems to be moving up to the resistance above created by its broadening tops. 1981 and 1986 show this has precedent as long as the key Closing Powers (as shown below) and the NYSE A/D Line keep rising. The absence of many MINCP stocks and the fact that new highs on NASDAQ and NYSE rose above their new lows for the first time in many weeks today offers additional hope to the bulls. So, stay long some of the now rising growth stocks, especially NVDA. Watch to see if SOXL can bullishly get past its falling 65-dma. But AAPL, has now risen 10 straight days. Avoid it. It is overbought. The beaten down bonds, likewise are due for a reversal. If you are a trader, take some profits in our bond short sales. This last recommendation stems from the breakout today in leading utilities and the reversal day shown in the 10-year and short-term rates. We are starting off with a lower opening. Let's see if Professionals come in again to support the market before much damage is done. |
||
|
Charts - 3/29/2022 2022 PEERLESS DJI, Signals, Indicators Daily DJI Volume 10-DayUp/Down Vol Stoch-20 Pct of All Stocks above 65-dma Inverted Traders Index Cum. Inverted Traders Index DJI-IPA DJI-OBV NASDAQ S&P OEX NYSE DJI-15 DJI-20 DJI-30 DIA QQQ SPY IWM TNA Short-Term Rates Ten Year Rates DOLLAR-UUP ALLSTOCKs recent 2006 vers-Peerless signals http://tigersoftware.com/NEWPEER/UPD80329.BMP MDY - http://www.tigersoftware.com/CHARTZ/MDY.GIF USO-CrudeOil DBO FAS GLD HD IBB JETS JNUG KOL NUGT OIH PALL RSX RETL SDS AGQ SLV SOXL TAN TECL TLT TMF TNA UGA China: YINN CHAU Commodities: CANE CORN DBC JJC, NIB CORN, CUT (paper) MOO, SOYB WEAT UUP (Dollar) LIT (Lithium) STOCKS: MRNA DIS GE PYPL GME ZOM XLE NRGU AAPL ADBE ALXN AMAT AMGN AMD AMZN AXP BA BABA BAC BIDU BLDP CAT CRM CVX CMG DE ENPH FB GILD GOOG GS HD IBM INTU JPM LRCX MRK MSFT NEM NFLX NKE NVDA PG PYPL REGN REV SO SQ QCOM QDEL TSLA TXN XOM V VRTX WFC WMT ZM Bullish MAXCPs http://www.tigersoftware.com/UPPING/3-29/BULLISH.htm Bearish MINCPs http://www.tigersoftware.com/DOWNING/3-29/BEARISH.htm |
|
There are three possible scenarios (shown as pink lines on right side of DJI chart below. As long as A/D line uptrend is not violated, the 65-dma should act as support.  |
 |
 |
 |
 |
 |
 |
 |
Table 1 QUICKSILVER on ETFS - 3/28/2022 Bullish = 6 - GLD OIL/OIH CPER CORN WEAT Bearish = 1 - RSX ETF CLOSE CHANGE PIVOT-PT 5-dma AROC CL-PWR CANDLE IP21 ITRS POWER INDEX ================================================================================================== DIA 352.97 3.48 343.41 69.5% Bullish BLUE .11 -- ---- --------------------------------------------------------------------------------------------- SPY 461.55 5.64 443.8 132.7% Bullish RED .175 .01 .185 --------------------------------------------------------------------------------------------- QQQ 371.19 6.28 351.83 198.4% Bullish BLUE .176 -.006 .17 --------------------------------------------------------------------------------------------- MDY 505.52 10.57 485.12 114% Bullish BLUE .131 .015 .146 --------------------------------------------------------------------------------------------- IWM 211.71 5.52 203.9 102.2% Bullish BLUE .114 .005 .119 --------------------------------------------------------------------------------------------- FAS 128.5 2.22 120.35 48.1% ------- RED .026 -.107 -.081 --------------------------------------------------------------------------------------------- RETL 24.12 2.55 21.17 358.6% Bullish BLUE .127 -.143 -.016 --------------------------------------------------------------------------------------------- SOXL 45.58 2.87 36.69 737.4% Bullish BLUE .154 -.276 -.122 --------------------------------------------------------------------------------------------- TECL 66.74 3.85 56.35 640% Bullish BLUE .17 -.082 .088 --------------------------------------------------------------------------------------------- IBB 132.71 3.64 128.37 39.4% Bullish BLUE .126 -.028 .098 --------------------------------------------------------------------------------------------- GLD 179.14 .08 181.81 -6.1% Bullish BLUE .285 .073 .358 --------------------------------------------------------------------------------------------- OIL 17.34 .55 18.24 -110.2% ------- BLUE .148 .201 .349 --------------------------------------------------------------------------------------------- OIH 284.79 3.7 282.09 130.3% Bullish BLUE .163 .265 .428 --------------------------------------------------------------------------------------------- CPER 28.92 .17 29.15 50.4% Bullish BLUE .347 .084 .431 --------------------------------------------------------------------------------------------- UUP 26.33 -.16 26.37 -1.9% ------- BLUE .039 .05 .089 --------------------------------------------------------------------------------------------- CORN 26.04 -.65 26.99 -145.4% Bullish BLUE .185 .21 .395 --------------------------------------------------------------------------------------------- WEAT 9.89 -.37 10.59 -380.4% Bullish BLUE .059 .402 .461 --------------------------------------------------------------------------------------------- YINN 5.23 .34 5.09 80.7% ------- RED .195 -.423 -.228 --------------------------------------------------------------------------------------------- RSX 5.65 0 5.65 0% Bullish ---- -.602 -.756 -1.358 |
 Table 2   Count of Stocks in Key Directories
           20220329
-------------------------------
NEWHIGHS       209
NEWLOWS        151
MAXCP          154
MINCP          18
TTTNH          49
TTTNL          13
CPCROSSA       88
CPCROSSD       21
ACCUMVER       8
HIGHIP21       20
HIUPPCT        62
VHIP21         49
LOWACCUM       235
REDSELL        119
AUGSELS7       7
TRAPDOOR       7
|
Table 3    RANKING OF KEY DIRECTORIES BASED PCT.OF STOCKS ABOVE 65-DMA
             3/29/22
 Bullish = 38
 Bearish = 11
---------------------------------------------------------------------------------------
Directory     Current       day-1         day-2         day-3         day-4         day-5
----------------------------------------------------------------------------------------
COAL           1             1             1             1             1             1
COPPER         1             .875          1             1             1             1
EDU            1             .833          .833          .666          .666          .833
GOLD           .913          .913          .934          .956          .956          .956
INSURANC       .88           .76           .84           .76           .72           .84
SOLAR          .875          .875          .812          .875          .875          .937
UTILITY        .871          .82           .794          .743          .743          .743
TRANSP         .842          .736          .684          .578          .526          .526
OILGAS         .838          .819          .866          .828          .828          .847
FOOD           .816          .775          .795          .816          .836          .836
MILITARY .807 .769 .807 .807 .769 .769 COMODITY .794 .743 .769 .794 .82 .82 REIT .784 .561 .5 .415 .361 .438 INDEXES .767 .659 .589 .551 .4 .545 HACKERS .75 .7 .7 .7 .65 .65 INDMATER .75 .708 .694 .708 .68 .652 INFRA .727 .696 .696 .696 .666 .696 HOSPITAL .687 .687 .75 .625 .562 .625 FIDSTKS .668 .579 .544 .514 .473 .514 RETAIL .638 .553 .553 .531 .489 .553 SP500 .632 .536 .522 .475 .427 .487 NIFTY .63 .543 .5 .543 .456 .5 HIGHPRIC .621 .512 .41 .407 .316 .443 DJI-13 .615 .538 .538 .461 .461 .461 CHEM .608 .478 .478 .456 .456 .413 DOWJONES .6 .533 .533 .466 .4 .433 NASD-100 .597 .484 .463 .494 .402 .463 SP-100 .588 .555 .555 .511 .477 .522 GREEN .578 .526 .526 .473 .421 .526 SEMI .578 .463 .515 .463 .347 .421 RUS-1000 .572 .475 .475 .455 .443 .468 BEVERAGE .571 .357 .428 .357 .285 .285 SOFTWARE .571 .482 .446 .464 .428 .482 ELECTRON .563 .473 .503 .466 .353 .443 BIOTECH .54 .42 .426 .426 .373 .412 GUNS .538 .384 .384 .307 .307 .384 GAMING .526 .421 .421 .421 .421 .473 LOWPRICE .506 .475 .516 .526 .503 .478 ============================================================================================== COMPUTER .5 .45 .45 .4 .35 .35 MARIJUAN .5 .25 .5 .25 0 0 FINANCE .439 .378 .414 .365 .317 .414 ETFS .436 .272 .29 .309 .254 .29 AUTO .433 .339 .377 .358 .377 .377 JETS .428 .285 .214 .071 .071 .071 REGBANKS .4 .28 .4 .24 .24 .32 CHINA .3 .24 .2 .28 .32 .3 HOMEBLDG .277 .166 .166 .111 .111 .222 BIGBANKS .142 .142 .142 .142 .142 .285 BONDFUND .011 0 0 0 .011 .011 |
==================================================================================
Tuesday 4:55 AM PCT Futures: DJI +136
NASDAQ +53 Data through 3/29/2022
| Professional buying
during the day and especially at the close keeps overcoming and dominating early selling in the key ETFs shown below as well as in AAPL, NVDA and other growth stocks like TSLA, AMZN, GOOG and MSFT, all of which have easily moved past the potential resistance of their 65-dma. At the same time, bond funds keep tumbling. They will likely go a lot lower. The explanation seems clear. Peace talks between Russia and Ukraine bring hope for an end to Russian brutality and aggression on its neighbor. Moreover, late and slow, the FED is steadily raising rates. With Inflation well above 8%, rates must go much higher. That keeps plenty of pressure on Bonds. But so slow is the FED to raise raise rates, investors need a lot more signs of an economic slowdown to worry about high PE growth stocks whose rises now seem destined to challenge their recent highs. Such advances are typical so long as the FED raises rates slowly and there is little that points to a recession. The Sell S9 signal might still work out. But we will need to see new Professional selling and a break in all the Closing Power uptrends. A 3% or 4% paper loss precedent on an S9 is a possibility if the Peerless key indicators bulge much higher. We do not want any part of that. (See the DJI charts of mid 1929 and mid 1987, for examples) A broad trading range can also make Sell S9s apprear prematurely. See the example of 1986 below. Prices then did not stop at the bands, they stopped only at the rising resistance line. See the first chart below. As I have said repeatedly, our bearish MINCPs, where we would normally look for short sales, consists almost entirely of bond funds.. Stick with these shorts here. Avoid others. As for longs, hold growth stocks like NVDA. Each day seems to bring another new institutional recommendation of NVDA. It shuld rise until there are serious signs of an oncoming recession. |
||
|
Charts - 3/28/2022 2022 PEERLESS DJI, Signals, Indicators Daily DJI Volume 10-DayUp/Down Vol Stoch-20 Pct of All Stocks above 65-dma Inverted Traders Index Cum. Inverted Traders Index DJI-IPA DJI-OBV NASDAQ S&P OEX NYSE DJI-15 DJI-20 DJI-30 DIA QQQ SPY IWM TNA Short-Term Rates Ten Year Rates DOLLAR-UUP ALLSTOCKs recent 2006 vers-Peerless signals http://tigersoftware.com/NEWPEER/UPD80328.BMP MDY - http://www.tigersoftware.com/CHARTZ/MDY.GIF USO-CrudeOil DBO FAS GLD HD IBB JETS JNUG KOL NUGT OIH PALL RSX RETL SDS AGQ SLV SOXL TAN TECL TLT TMF TNA UGA China: YINN CHAU Commodities: CANE CORN DBC JJC, NIB CORN, CUT (paper) MOO, SOYB WEAT UUP (Dollar) LIT (Lithium) STOCKS: MRNA DIS GE PYPL GME ZOM XLE NRGU AAPL ADBE ALXN AMAT AMGN AMD AMZN AXP BA BABA BAC BIDU BLDP CAT CRM CVX CMG DE ENPH FB GILD GOOG GS HD IBM INTU JPM LRCX MRK MSFT NEM NFLX NKE NVDA PG PYPL REGN REV SO SQ QCOM QDEL TSLA TXN XOM V VRTX WFC WMT ZM Bullish MAXCPs http://www.tigersoftware.com/UPPING/3-28/BULLISH.htm Bearish MINCPs http://www.tigersoftware.com/DOWNING/3-28/BEARISH.htm |
Compare DJI chart-formation of 1986 with 2022 DJIA 2021-2022 Upper band may not be able to stop present rally. It may have to rally to rising resistance-line.  |
 |
 |
 |
 |
 |
 |
 |
 |
    Table 1     QUICKSILVER on ETFS - 3/28/2022
   Bullish = 6 -  GLD   OIL/OIH  CPER  CORN  WEAT
   Bearish = 1 -   RSX
ETF CLOSE CHANGE PIVOT-PT 5-dma AROC CL-PWR CANDLE IP21 ITRS POWER INDEX ================================================================================================== DIA 349.49 .95 348.14 58.4% Bullish BLUE .138 == ======== --------------------------------------------------------------------------------------------- SPY 455.91 3.22 449.59 128.5% Bullish BLUE .177 .014 .191 --------------------------------------------------------------------------------------------- QQQ 364.91 5.56 356.96 208.5% Bullish BLUE .167 -.001 .166 --------------------------------------------------------------------------------------------- MDY 494.95 .75 494.31 37.6% Bullish BLUE .117 .006 .123 --------------------------------------------------------------------------------------------- IWM 206.19 .07 207.5 18.2% Bullish BLUE .098 -.004 .094 --------------------------------------------------------------------------------------------- FAS 126.28 -.95 127.3 196.3% ------- RED .049 -.128 -.079 --------------------------------------------------------------------------------------------- RETL 21.57 .68 22.57 85.9% Bullish BLUE .096 -.263 -.167 --------------------------------------------------------------------------------------------- SOXL 42.71 .7 39.59 465.2% Bullish BLUE .138 -.258 -.12 --------------------------------------------------------------------------------------------- TECL 62.89 2.31 59.07 530.8% Bullish BLUE .167 -.099 .068 --------------------------------------------------------------------------------------------- IBB 129.07 .91 131.69 -6.2% Bullish BLUE .099 -.033 .066 --------------------------------------------------------------------------------------------- GLD 179.06 -3.32 179.36 -44.4% Bullish RED .278 .085 .363 + --------------------------------------------------------------------------------------------- OIL 16.79 -1.12 17.73 -312.5% Bearish RED .099 .204 .303 + --------------------------------------------------------------------------------------------- OIH 281.09 -12.43 277.4 41.9% Bullish RED .141 .318 .459 + --------------------------------------------------------------------------------------------- CPER 28.75 .14 28.63 34.8% Bullish BLUE .351 .078 .429 + --------------------------------------------------------------------------------------------- UUP 26.49 .08 26.34 26.5% ------- RED -.013 .074 .061 --------------------------------------------------------------------------------------------- CORN 26.69 -.19 26.82 -11.2% Bullish BLUE .171 .273 .444 + --------------------------------------------------------------------------------------------- WEAT 10.26 -.35 10.69 -174.7% ------- ---- .059 .467 .526 + --------------------------------------------------------------------------------------------- YINN 4.89 .17 5.15 306.2% Bullish ---- .225 -.427 -.202 --------------------------------------------------------------------------------------------- RSX 5.65 0 5.65 0% Bullish ---- -.688 -.744 -1.432 - |
Tsble 2 Count of Stocks in Key Directories
20220328
-------------------------------
NEWHIGHS 140
NEWLOWS 301
MAXCP 91
MINCP 37
TTTNH 37
TTTNL 25
CPCROSSA 35
CPCROSSD 61
ACCUMVER 6
HIGHIP21 21
HIUPPCT 56
VHIP21 46
LOWACCUM 211
REDSELL 116
AUGSELS7 8
TRAPDOOR 6
|
 Table   3    RANKING OF KEY DIRECTORIES BASED PCT.OF STOCKS ABOVE 65-DMA
              3/28/22
 Bullish = 27
 Bearish = 22
---------------------------------------------------------------------------------------
Directory     Current       day-1         day-2         day-3         day-4         day-5
----------------------------------------------------------------------------------------
COAL           1             1             1             1             1             1
GOLD           .913          .934          .956          .956          .956          .956
COPPER         .875          1             1             1             1             1
SOLAR          .875          .812          .875          .875          .937          .812
EDU            .833          .833          .666          .666          .833          .666
UTILITY        .82           .794          .743          .743          .743          .769
OILGAS         .819          .866          .828          .828          .847          .847
FOOD           .775          .795          .816          .836          .836          .836
MILITARY       .769          .807          .807          .769          .769          .73
INSURANC       .76           .84           .76           .72           .84           .76
COMODITY .743 .769 .794 .82 .82 .82 TRANSP .736 .684 .578 .526 .526 .473 INDMATER .708 .694 .708 .68 .652 .666 HACKERS .7 .7 .7 .65 .65 .65 INFRA .696 .696 .696 .666 .696 .696 HOSPITAL .687 .75 .625 .562 .625 .75 INDEXES .659 .589 .551 .4 .529 .432 FIDSTKS .579 .544 .514 .473 .514 .473 REIT .561 .492 .423 .361 .438 .392 SP-100 .555 .555 .511 .477 .522 .488 RETAIL .553 .553 .531 .489 .553 .51
NIFTY .543 .5 .521 .456 .5 .369
DJI-13 .538 .538 .461 .461 .461 .384
SP500 .536 .522 .475 .425 .485 .453
DOWJONES .533 .533 .466 .4 .433 .4
=====
GREEN          .526          .526          .473          .421          .526          .473
HIGHPRIC       .512          .41           .407          .316          .432          .341
=============================================================================================
NASD-100       .484          .463          .484          .402          .453          .36
SOFTWARE       .482          .446          .464          .428          .482          .428
CHEM           .478          .478          .478          .434          .434          .369
LOWPRICE       .478          .516          .524          .503          .47           .427
RUS-1000       .475          .475          .455          .443          .46           .432
ELECTRON .473 .503 .466 .353 .436 .421 SEMI .463 .515 .463 .347 .421 .389 COMPUTER .45 .45 .4 .35 .35 .35 GAMING .421 .421 .421 .421 .473 .368 BIOTECH .42 .426 .426 .373 .406 .348 GUNS .384 .384 .307 .307 .384 .307 FINANCE .378 .414 .365 .317 .414 .353 BEVERAGE .357 .428 .357 .285 .285 .285 AUTO .339 .377 .358 .377 .377 .358 JETS .285 .214 .071 .071 .071 0 REGBANKS .28 .4 .24 .24 .32 .28 ETFS .272 .29 .309 .254 .309 .236 MARIJUAN .25 .5 .25 0 0 0 CHINA .24 .2 .28 .32 .3 .2 HOMEBLDG .166 .166 .111 .111 .222 .222 BIGBANKS .142 .142 .142 .142 .285 .142 BONDFUND 0 0 0 .011 .011 0 |
=====================================================================================
Monday 5:20 AM PCT Futures: DJI +56
NASDAQ +35 Data through 3/25/2022
|
Professionals Remain Steady Buyers. The S9 has tried its best to reverse the rally. It seem only able to send Bonds into a tailspin as interest rates rise and rise. But Professionals, as seen by our rising Closing Power in all the key ETFs, keep buying in pre-NYSE weakness and then steadily buying more during the day, mainly in blue chips, SPY and growth stocks like AAPL and NVDA. S9s can fail. We won't be selling short anything but bonds until the Closing Power for DIA, SPY and QQQclearly break their uptrneds. The NASDAQ has reached the resistance of its 65-dma but its Closing Power also is rising. QQQ has still not reached that target. So, higher prices are expected. And that could take the DJI well above its 65-dma and turn that key boundary into support. At that point, the broadening price pattern in the DJIA will take on more significance. Ten-year rates are still a percent or two below where they will compete with stocks for investments. And as long as the economic news is good and there is no recession, investment money may just keep flowing into blue chips and growth stocks to beat inflatioin rather than bonds, which seem a dismal choice now. Perhaps, many traders do not want to be unpatriotic and sell. In any case, we should watch AAPL now. Its Closing Power has risen nine straight days. A break is due. That should invite a wider reversal. And also watch UNH. It is the highest and most heavily weighted DJI-30 stock. I take NVDA to be the perfect growth stock now. As they used to say in the early 1970s, it is a "one-decision" stock. One buys it and then plans never to sell it. The collapse of 1973-1974 showed that this was a poorly planned strategy. |
||
|
Charts - 3/25/2022 2022 PEERLESS DJI, Signals, Indicators Daily DJI Volume 10-DayUp/Down Vol Stoch-20 Pct of All Stocks above 65-dma Inverted Traders Index Cum. Inverted Traders Index DJI-IPA DJI-OBV NASDAQ S&P OEX NYSE DJI-15 DJI-20 DJI-30 DIA QQQ SPY IWM TNA Short-Term Rates Ten Year Rates DOLLAR-UUP ALLSTOCKs recent 2006 vers-Peerless signals http://tigersoftware.com/NEWPEER/UPD80325.BMP MDY - http://www.tigersoftware.com/CHARTZ/MDY.GIF USO-CrudeOil DBO FAS GLD HD IBB JETS JNUG KOL NUGT OIH RSX RETL SDS AGQ SLV SOXL TAN TECL TLT TMF TNA UGA China: YINN CHAU Commodities: CANE CORN DBC JJC, NIB CORN, CUT (paper) MOO, SOYB WEAT UUP (Dollar) LIT (Lithium) STOCKS: MRNA DIS GE PYPL GME ZOM XLE NRGU AAPL ADBE ALXN AMAT AMGN AMD AMZN AXP BA BABA BAC BIDU BLDP CAT CRM CVX CMG DE ENPH FB GILD GOOG GS HD IBM INTU JPM LRCX MRK MSFT NEM NFLX NKE NVDA PG PYPL REGN SO SQ QCOM TSLA TXN XOM V VRTX WFC WMT ZM New ANET EXTR FTNT SCSC also AVYA FSLY RNG Bullish MAXCPs http://www.tigersoftware.com/UPPING/3-25/BULLISH.htm Bearish MINCPs http://www.tigersoftware.com/DOWNING/3-25/BEARISH.htm |
 |
 |
|
 |
 |
 |
 |
 |
 |
 |
 |
 |
Table 1 QUICKSILVER on ETFS - 3/25/2022 Bullish = 6 - GLD OIL/OIH CPER CORN WEAT Bearish = 1 - RSX ETF CLOSE CHANGE PIVOT-PT 5-dma AROC CL-PWR CANDLE IP21 ITRS POWER INDEX ================================================================================================== DIA 348.54 1.48 345.44 19.5% Bullish BLUE .173 ===== --------------------------------------------------------------------------------------------- SPY 452.69 2.2 444.39 91.5% Bullish BLUE .197 .001 .198 --------------------------------------------------------------------------------------------- QQQ 359.35 -.3 350.08 111% Bullish RED .177 -.033 .144 --------------------------------------------------------------------------------------------- MDY 494.2 3.48 491.26 16.5% Bullish BLUE .146 .009 .155 --------------------------------------------------------------------------------------------- IWM 206.12 .28 205.44 -27.9% ------- ---- .118 -.006 .112 --------------------------------------------------------------------------------------------- FAS 127.23 4.5 121.42 227.4% Bullish BLUE .069 -.127 -.058 --------------------------------------------------------------------------------------------- RETL 20.89 -.97 21.2 -395.3% Bullish RED .133 -.293 -.16 --------------------------------------------------------------------------------------------- SOXL 42.01 -.08 39 361.2% ------- RED .144 -.31 -.166 --------------------------------------------------------------------------------------------- TECL 60.58 -.16 56.66 316.7% Bullish RED .181 -.187 -.006 --------------------------------------------------------------------------------------------- IBB 128.16 -1.87 129.23 -108.8% ------- RED .133 -.057 .076 --------------------------------------------------------------------------------------------- GLD 182.38 -.75 180.67 85.2% Bullish BLUE .315 .108 .423 + --------------------------------------------------------------------------------------------- OIL 17.91 .11 17.91 228.1% Bullish BLUE .146 .28 .426 + --------------------------------------------------------------------------------------------- OIH 293.52 10.21 278.72 433.9% Bullish BLUE .168 .377 .545 + --------------------------------------------------------------------------------------------- CPER 28.61 -.12 28.55 -19.1% Bullish ---- .362 .067 .429 + --------------------------------------------------------------------------------------------- UUP 26.41 .01 26.35 30.4% Bullish ---- -.038 .078 .04 --------------------------------------------------------------------------------------------- CORN 26.88 .19 26.75 163.2% Bullish BLUE .128 .27 .398 + --------------------------------------------------------------------------------------------- WEAT 10.61 .18 10.63 296.2% ------- BLUE .039 .497 .536 + --------------------------------------------------------------------------------------------- YINN 4.72 -.22 4.59 -519.8% ------- BLUE .233 -.475 -.242 --------------------------------------------------------------------------------------------- RSX 5.65 0 5.65 0% Bullish ---- -.716 -.749 -1.465 - |
Table 2    Count of Stocks in Key Directories
           20220325
-------------------------------
NEWHIGHS       259
NEWLOWS        355
MAXCP          153
MINCP          50
TTTNH          78
TTTNL          32
CPCROSSA       117
CPCROSSD       116
ACCUMVER       5
HIGHIP21       23
HIUPPCT        42
VHIP21         45
LOWACCUM       196
REDSELL        109
AUGSELS7       6
TRAPDOOR       12
|
Form 3  RANKING OF KEY DIRECTORIES BASED PCT.OF STOCKS ABOVE 65-DMA
              3/25/22
  Bullish = 27
  Bearish = 22
---------------------------------------------------------------------------------------
Directory     Current       day-1         day-2         day-3         day-4         day-5
----------------------------------------------------------------------------------------
COAL           1             1             1             1             1             1
COPPER         1             1             1             1             1             1
GOLD           .934          .956          .956          .956          .956          .956
OILGAS         .866          .828          .828          .847          .857          .838
INSURANC       .84           .76           .72           .84           .76           .72
EDU            .833          .666          .666          .833          .666          .833
SOLAR          .812          .875          .875          .937          .812          .812
MILITARY       .807          .807          .769          .769          .73           .769
FOOD           .795          .816          .836          .836          .836          .836
UTILITY        .794          .743          .743          .743          .769          .743
COMODITY .769 .794 .82 .82 .82 .82 HOSPITAL .75 .625 .562 .625 .687 .75 HACKERS .7 .7 .65 .65 .65 .65 INFRA .696 .696 .666 .696 .696 .666 INDMATER .694 .708 .68 .652 .666 .652 TRANSP .684 .578 .526 .526 .473 .578 INDEXES .589 .551 .4 .529 .427 .443 SP-100 .555 .511 .477 .522 .488 .466 RETAIL .553 .531 .489 .553 .51 .553 FIDSTKS .544 .514 .473 .514 .479 .491 DJI-13 .538 .461 .461 .461 .384 .384
DOWJONES .533 .466 .4 .433 .4 .366
=====
GREEN .526 .473 .421 .526 .473 .473
SP500 .524 .474 .422 .48 .456 .476
LOWPRICE .519 .524 .501 .47 .43 .44
SEMI .515 .463 .347 .421 .378 .389 ELECTRON .503 .466 .353 .436 .421 .443 ================================================================================================ MARIJUAN .5 .25 0 0 0 0 NIFTY .5 .521 .434 .5 .369 .347 REIT .492 .415 .369 .438 .392 .469 CHEM .478 .478 .456 .413 .391 .413 RUS-1000 .475 .455 .443 .46 .43 .465 NASD-100 .463 .484 .391 .453 .36 .381 COMPUTER .45 .4 .35 .35 .35 .35 SOFTWARE .446 .464 .428 .482 .446 .41 BEVERAGE .428 .357 .285 .285 .285 .214 BIOTECH .426 .426 .373 .406 .348 .403 GAMING .421 .421 .421 .473 .368 .421 FINANCE .414 .365 .317 .414 .353 .378 HIGHPRIC .41 .407 .316 .432 .341 .378 REGBANKS .4 .24 .24 .32 .28 .28 GUNS .384 .307 .307 .384 .23 .307 AUTO .377 .358 .377 .377 .358 .377 ETFS .29 .309 .254 .309 .254 .254 JETS .214 .071 .071 .071 0 .214 CHINA .2 .28 .32 .3 .22 .16 HOMEBLDG .166 .111 .111 .222 .222 .333 BIGBANKS .142 .142 .142 .285 .142 .142 BONDFUND 0 0 .011 .011 0 .022 |
===================================================================================
Friday 5:40 AM PCT Futures: DJI
+92 NASDAQ +63 Data through 3/24/2022
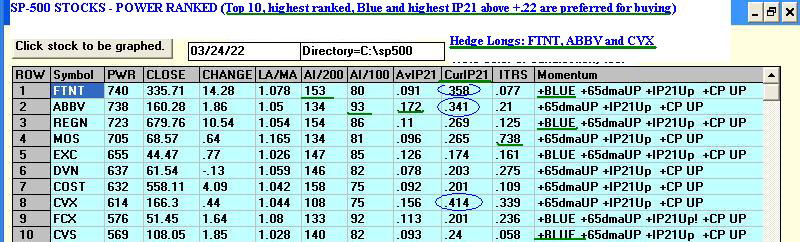
| Sell S9 - Seems unpatriotic.
Buy SOXL and hedge with top and bottom ranked SP-500 stocks using tables shown below. UNH's unusual weight in DJIA shows us how manipulated the DJIA is. This argues that the Closing Power is now more important than the NYSE A/D Line. The DJI has almost reached its 65-dma again. The chart of the 1977 bear market shown below tells us that the DJI could still slightly surpass its 65-dma even with the IP21-Accumulation Index positive and then we could still see a resumption of the bear market. If this history were to repeat, the DJI would soon drop below its 10%-down-from-the-peak level and oil and NASDAQ growth stocks would then be turning down. So, the next few trading days are significant. We do have a Sell S9. But the Closing Powers for the key ETFs keep rising even after up-openings. There are just too few Bearish MINCPs presently. Bonds make up most of that list. What is happening is that more and more investors including some who owned bonds are now considering growth stocks, like NVDA and AAPL, to be the best way to deal with Inflation, at least until interest rates rise much higher. And there is another factor supporting the market. That is the United States is now in a proxy war with Russia, with Ukraine being the proxy. While this is very dangerous, Wall Street is patriotic. It wants to support the war by not unpatriotically selling short. What to do? I would think that SOXL and other semi-conductors will play "catch-up" with NVDA. If today finishes strongly, Buy SOXL and the top SP-500 stocks shown below and to hedge, consider shorting the lowest Power Ranked, too. |
||
|
Charts - 3/24/2022 2022 PEERLESS DJI, Signals, Indicators Daily DJI Volume 10-DayUp/Down Vol Stoch-20 Pct of All Stocks above 65-dma Inverted Traders Index Cum. Inverted Traders Index DJI-IPA DJI-OBV NASDAQ S&P OEX NYSE DJI-15 DJI-20 DJI-30 DIA QQQ SPY IWM TNA Short-Term Rates Ten Year Rates DOLLAR-UUP ALLSTOCKs recent 2006 vers-Peerless signals http://tigersoftware.com/NEWPEER/UPD80324.BMP MDY - http://www.tigersoftware.com/CHARTZ/MDY.GIF USO-CrudeOil DBO FAS GLD HD IBB JETS JNUG KOL NUGT OIH RSX RETL SDS AGQ SLV SOXL TAN TECL TLT TMF TNA UGA China: YINN CHAU Commodities: CANE CORN DBC JJC, NIB CORN, CUT (paper) MOO, SOYB WEAT UUP (Dollar) LIT (Lithium) STOCKS: MRNA DIS GE PYPL GME ZOM XLE NRGU AAPL ADBE ALXN AMAT AMGN AMD AMZN AXP BA BABA BAC BIDU BLDP CAT CRM CVX CMG DE ENPH FB GILD GOOG GS HD IBM INTU JPM LRCX MRK MSFT NEM NFLX NKE NVDA PG PYPL REGN SO SQ QCOM TSLA TXN XOM V VRTX WFC WMT ZM New ANET EXTR FTNT SCSC also AVYA FSLY RNG Bullish MAXCPs http://www.tigersoftware.com/UPPING/3-24/BULLISH.htm Bearish MINCPs http://www.tigersoftware.com/DOWNING/3-24/BEARISH.htm |
 |
 |
|
One stock in DJI-30, UNH, is weighted as much as the 8 or 9 lowest priced DJI stocks. Each 10 points it rises contributes 67 points to the DJIA. It is now running in all-time high territory.   |
| The red 5-day
Stochastic Sell at the SP-500's 65-dma confronts a very high SPY IP21 and a number of stocks in its top 10 Power Ranked that look quite bullish. Hedging, we might but the best here and sell the weakest short. There was considerable difference in the performance today of the two groups. Time permitting, I will try to post the top 10 and bottom 10 Power Ranked several times a week.  |
 Bottom 10 Power Ranked of SP-500 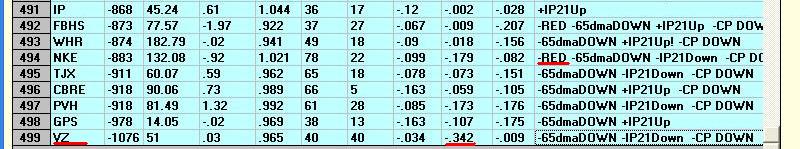 |
 |
 |
|
NVDA and AAPL are two premier growth stocks in the current era. Bonds may drop, but the tempatation is very strong to deal with inflation by buying the best growth stocks and hodling them tightly. SOXL would seem to have to follow NVDA's big rise today.  |
Semi-Conductors are likely to follow the lead of NVDA, TXN and
INTC. |
|
Rising Interest Rates' Trend makes Bond's future look bearish. Hedgers should be short some of the many bearish-looking bond funds shown in the Bearish MINCP lists.  |
Table 1 QUICKSILVER on ETFS - 3/24/2022 Bullish = 5 - GLD OIL/OIH CPER CORN WEAT Bearish = 1 - RSX ETF CLOSE CHANGE PIVOT-PT 5-dma AROC CL-PWR CANDLE IP21 ITRS POWER INDEX ================================================================================================== DIA 347.06 3.65 347.19 23.3% Bullish BLUE .242 ---- --------- --------------------------------------------------------------------------------------------- SPY 450.49 6.69 444.52 105.9% Bullish BLUE .245 .002 .247 --------------------------------------------------------------------------------------------- QQQ 359.65 7.82 351.49 216.7% Bullish BLUE .227 -.025 .202 --------------------------------------------------------------------------------------------- MDY 490.72 5.6 492.58 5.6% Bullish BLUE .153 .002 .155 --------------------------------------------------------------------------------------------- IWM 205.84 1.94 207.27 17.7% ------- BLUE .169 -.011 .158 --------------------------------------------------------------------------------------------- FAS 122.73 2.38 121.65 106.8% Bullish BLUE .115 -.152 -.037 --------------------------------------------------------------------------------------------- RETL 21.86 .69 22.62 2.3% Bullish BLUE .234 -.286 -.052 --------------------------------------------------------------------------------------------- SOXL 42.09 5.4 39.17 671.4% ------- BLUE .181 -.292 -.111 --------------------------------------------------------------------------------------------- TECL 60.74 4.39 56.91 622.6% Bullish BLUE .227 -.172 .055 --------------------------------------------------------------------------------------------- IBB 130.03 1.66 130.99 54.3% ------- BLUE .213 -.051 .162 --------------------------------------------------------------------------------------------- GLD 183.13 1.32 179.3 62.1% Bullish BLUE .25 .118 .368 +++ --------------------------------------------------------------------------------------------- OIL 17.8 -.44 17.1 256% Bearish RED .09 .286 .376 +++ --------------------------------------------------------------------------------------------- OIH 283.31 1.22 269.38 250.9% Bullish BLUE .149 .327 .476 +++ --------------------------------------------------------------------------------------------- CPER 28.73 -.42 28.72 24.4% Bullish RED .388 .106 .494 +++ --------------------------------------------------------------------------------------------- UUP 26.4 .03 26.25 34.2% Bearish ---- -.125 .074 -.051 --------------------------------------------------------------------------------------------- CORN 26.69 -.3 26.01 107.4% ------- RED .058 .263 .321 +++ --------------------------------------------------------------------------------------------- WEAT 10.43 -.16 9.99 91.1% Bearish ---- .011 .452 .463 +++ --------------------------------------------------------------------------------------------- YINN 4.94 -.15 5.24 396% ------- BLUE .241 -.416 -.175 --------------------------------------------------------------------------------------------- RSX 5.65 0 5.65 0% Bullish ---- -.515 -.744 -1.259 - |
Table 2    Count of Stocks in Key Directories
             20220324
-------------------------------
NEWHIGHS       172
NEWLOWS        201
MAXCP          84
MINCP          29
TTTNH          48
TTTNL          21
CPCROSSA       133
CPCROSSD       23
ACCUMVER       6
HIGHIP21       28
HIUPPCT        37
VHIP21         43
LOWACCUM       204
REDSELL        101
AUGSELS7       8
TRAPDOOR       4
|
 Table 3      RANKING OF KEY DIRECTORIES BASED PCT.OF STOCKS ABOVE 65-DMA
              3/24/22
 Bullish = 22
 Bearish = 29
---------------------------------------------------------------------------------------
Directory     Current       day-1         day-2         day-3         day-4         day-5
----------------------------------------------------------------------------------------
COAL           1             1             1             1             1             1
COPPER         1             1             1             1             1             1
GOLD           .956          .956          .956          .956          .956          .956
SOLAR          .875          .875          .937          .812          .812          .875
OILGAS         .828          .828          .847          .857          .838          .847
FOOD           .816          .836          .836          .836          .836          .816
MILITARY       .807          .769          .769          .73           .769          .769
COMODITY       .794          .82           .82           .82           .82           .794
INSURANC       .76           .72           .84           .76           .76           .76
UTILITY        .743          .743          .743          .769          .743          .769
INDMATER .708 .68 .652 .666 .652 .625 HACKERS .7 .65 .65 .65 .65 .5 INFRA .696 .666 .696 .696 .666 .696 EDU .666 .666 .833 .666 .833 .833 HOSPITAL .625 .562 .625 .687 .687 .687 TRANSP .578 .526 .526 .473 .578 .473 INDEXES .551 .4 .529 .427 .437 .416 RETAIL .531 .489 .553 .51 .553 .553 LOWPRICE .526 .501 .468 .43 .437 .384 NIFTY .521 .434 .478 .369 .347 .26 FIDSTKS .514 .473 .514 .479 .491 .437
SP-100 .511 .477 .522 .488 .477 .444
=========================================================================================
NASD-100 .484 .391 .443 .36 .381 .319
CHEM .478 .456 .434 .369 .434 .391
SP500 .474 .426 .482 .452 .476 .43
======
GREEN .473 .421 .526 .473 .473 .368
DOWJONES .466 .4 .433 .4 .366 .333
======
ELECTRON .466 .353 .436 .421 .436 .36
SOFTWARE .464 .428 .482 .446 .428 .339
SEMI .463 .347 .421 .378 .389 .315
DJI-13 .461 .461 .461 .384 .384 .384
RUS-1000 .455 .443 .46 .43 .458 .42
BIOTECH .426 .373 .406 .348 .398 .331
GAMING .421 .421 .473 .368 .421 .368
REIT .415 .361 .446 .392 .461 .461
HIGHPRIC .407 .316 .432 .341 .378 .305
COMPUTER .4 .35 .35 .35 .35 .2
FINANCE .365 .317 .414 .353 .39 .378
AUTO .358 .377 .377 .358 .377 .339
BEVERAGE .357 .285 .285 .285 .214 .214
ETFS .309 .254 .309 .254 .272 .254
GUNS .307 .307 .384 .23 .307 .23
CHINA .28 .32 .3 .22 .16 .14
MARIJUAN .25 0 0 0 0 0
REGBANKS .24 .24 .32 .28 .32 .32
BIGBANKS .142 .142 .285 .142 .142 .142
HOMEBLDG .111 .111 .222 .222 .277 .277
JETS .071 .071 .071 0 .214 .071
BONDFUND 0 .011 .011 0 .022 .011
|
===================================================================================
Thursday 5:17 AM PCT Futures: DJI +136
NASDAQ +86 Data through 3/23/2022
| The Sell S9 still needs to have the DIA's Closing
Power uptrend be violated before we will want to sell it short because of the Sell S9 and the fact that it has reached its falling 65-dma. The DJI seems to be carefully under the control of chartists who are rigging a potential 5-day head and shoulders pattern. It seems that the up-opening this morning is meant to bring the DJI back above 34700 where it may then be made to turn down again, thereby forming a new head/shoulders pattern. 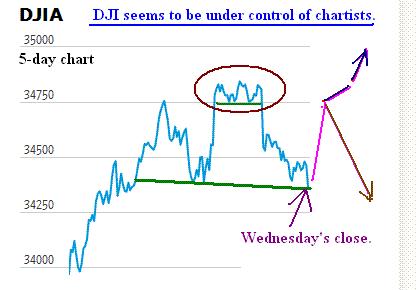 For now we need to see what happens on the present DJI rally back to its 65-dma. At the same, we will probably see QQQ and the NASDAQ reach the resistance of their 65-dma. This tight back-and-forth trading should be resolved in a few trading days. Ordinarily, we would simply suggest being long some of the bullish MAXCPs and short same of the bearish MINCPs. But the problem with that is that most of bearish MINCPs now are bond funds that keep getting clobbered but only by small daily percentages. So, we will just have to wait to see if the Sell S9 will be ratified by weakness from the DJI's Closing Power or whether prices will try again to get past the 65-dma resistance. One thing that stands out is that the OBV-Line for the DJI, SPY and QQQ are bearishly lagging the advance. Pre-market trading seems to have taken over. Still, without more volume during normal NYSE trading hours, any rally will likely be suspect and short-lived. |
||
|
Charts - 3/23/2022 2022 PEERLESS DJI, Signals, Indicators Daily DJI Volume 10-DayUp/Down Vol Stoch-20 Pct of All Stocks above 65-dma Inverted Traders Index Cum. Inverted Traders Index DJI-IPA DJI-OBV NASDAQ S&P OEX NYSE DJI-15 DJI-20 DJI-30 DIA QQQ SPY IWM TNA Short-Term Rates Ten Year Rates DOLLAR-UUP ALLSTOCKs recent 2006 vers-Peerless signals http://tigersoftware.com/NEWPEER/UPD80323.BMP MDY - http://www.tigersoftware.com/CHARTZ/MDY.GIF USO-CrudeOil DBO FAS GLD HD IBB JETS JNUG KOL NUGT OIH PALL RSX RETL SDS AGQ SLV SOXL TAN TECL TLT TMF TNA UGA China: YINN CHAU Commodities: CANE CORN DBC JJC, NIB CORN, CUT (paper) MOO, SOYB WEAT UUP (Dollar) LIT (Lithium) STOCKS: MRNA DIS GE PYPL GME ZOM XLE NRGU AAPL ADBE ALXN AMAT AMGN AMD AMZN AXP BA BABA BAC BIDU BLDP CAT CRM CVX CMG DE ENPH FB GILD GOOG GS HD IBM INTU JPM LRCX MRK MSFT NEM NFLX NKE NVDA PG PYPL REGN REV SO SQ QCOM QDEL TSLA TXN XOM V VRTX WFC WMT ZM Bullish MAXCPs http://www.tigersoftware.com/UPPING/3-23/BULLISH.htm Bearish MINCPs http://www.tigersoftware.com/DOWNING/3-23/BEARISH.htm |
 |
|||
 |
|||
 |
|||
 |
|||
 |
|||
 |
|||
|
==================================================================================
Wednesday 5:27 AM PCT Futures: DJI -128
NASDAQ -114 Data through 3/22/2022
| The operative Peerless Sell S9 looks more serious
today. But a lot will depend on whether Professiojnal buyers come in to rescue the market from a weak opening. All the key ETFs still show rising Closing Powers. The DJI has now reached its 65-dma resistance and our technical goal for the current rally. Interest rates jumped sharply Tuesday and Fed Chairman Powell acknowledged that he will probably have to raise rates a lot faster and further. This will be the only way to bring a halt to the inflationary binge. It may unavoidably bring about a recession. In other words, in his words, he can not guarantee a "soft landing" for the economy or the stock market.. The rally today felt like an advance that Professionals were using to sell short. Breadth was not as positive as Monday's was negative and some of the leading stocks (like REGN and ABBV) lost a little rather than participate in today's nominal advance. It also felt like sellers of bonds may have decided to purchase blue chips to meet their fiduciary investment requirements of being fully invested. The 10-year Treasury bond's current 2.4% interest rate still does not compete with growth stocks now that Inflation is running at 7.5%. Thus, growth stocks do have a special appeal in this environment. But a lot will depend on the strength of the Economy, nationally and globablly, in the coming months. A recession or worse would hit even growth stocks because of their high PEs. A Little History The 1953-1957 boom only ended when very low rates were raised to 4%. It seems that we could quite easily (technically speaking) now get another new 10% sell-off, such as occurred twice in 1956, before we get a rally to a peak that would finally start a bear market for the DJI-30. (The top in July 1957 brought a 20% decline in October). This might or might not produce another Sell S9. The "peace" talks between Russian and Ukraine could still bring a bullish ceasefire rally. I take that as the "wild card" in this market. But looking beyond that, American financial history since 1915 (when the FED became operational) just does not show Inflation being wrung out of the Economy without a sharp selll-off in stocks and/or a recession or worse: 1919-1921, 1937-1938, 1956-1957, 1969-1970, 1966, 1969-1970, 1973-1974, 1978-1982, 1987, 2000-2003 and 2018. Even with all the price controls of World War II, the post-war spending boom was followed by a 26% bear market in the second half of 1946. |
||
|
Charts - 3/22/2022 2022 PEERLESS DJI, Signals, Indicators Daily DJI Volume 10-DayUp/Down Vol Stoch-20 Pct of All Stocks above 65-dma Inverted Traders Index Cum. Inverted Traders Index DJI-IPA DJI-OBV NASDAQ S&P OEX NYSE DJI-15 DJI-20 DJI-30 DIA QQQ SPY IWM TNA Short-Term Rates Ten Year Rates DOLLAR-UUP ALLSTOCKs recent 2006 vers-Peerless signals http://tigersoftware.com/NEWPEER/UPD80322.BMP MDY - http://www.tigersoftware.com/CHARTZ/MDY.GIF USO-CrudeOil DBO FAS GLD HD IBB JETS JNUG KOL NUGT OIH PALL RSX RETL SDS AGQ SLV SOXL TAN TECL TLT TMF TNA UGA China: YINN CHAU Commodities: CANE CORN DBC JJC, NIB CORN, CUT (paper) MOO, SOYB WEAT UUP (Dollar) LIT (Lithium) STOCKS: MRNA DIS GE PYPL GME ZOM XLE NRGU AAPL ADBE ALXN AMAT AMGN AMD AMZN AXP BA BABA BAC BIDU BLDP CAT CRM CVX CMG DE ENPH FB GILD GOOG GS HD IBM INTU JPM LRCX MRK MSFT NEM NFLX NKE NVDA PG PYPL REGN REV SO SQ QCOM QDEL TSLA TXN XOM V VRTX WFC WMT ZM Bullish MAXCPs http://www.tigersoftware.com/UPPING/3-22/BULLISH.htm Bearish MINCPs http://www.tigersoftware.com/DOWNING/3-22/BEARISH.htm |
 |
 |
 |
 |
 |
 |
 |
 |
Table 1 QUICKSILVER on ETFS - 3/22/2022 Bullish = 6 - GLD OIL/OIH CPER CORN WEAT Bearish = 1 - RSX ETF CLOSE CHANGE PIVOT-PT 5-dma AROC CL-PWR CANDLE IP21 ITRS POWER INDEX ================================================================================================== DIA 348.14 2.7 341.36 174.1% Bullish BLUE .186 ---------------- --------------------------------------------------------------------------------------------- SPY 449.59 5.2 435.62 267.1% Bullish BLUE .18 .004 .184 --------------------------------------------------------------------------------------------- QQQ 356.96 6.88 340.32 420.1% Bullish BLUE .168 -.021 .147 --------------------------------------------------------------------------------------------- MDY 494.31 3.05 485.45 229.1% Bullish BLUE .111 .011 .122 --------------------------------------------------------------------------------------------- IWM 207.5 2.06 201.94 288.5% ------- BLUE .1 -.001 .099 --------------------------------------------------------------------------------------------- FAS 127.3 5.88 116.35 873.6% Bullish BLUE .081 -.11 -.029 --------------------------------------------------------------------------------------------- RETL 22.57 1.37 20.92 916.4% Bullish BLUE .094 -.27 -.176 --------------------------------------------------------------------------------------------- SOXL 39.59 .59 36.3 1104.2% ------- BLUE .11 -.298 -.188 --------------------------------------------------------------------------------------------- TECL 59.07 2.41 52.63 1044.7% Bullish BLUE .16 -.168 -.008 --------------------------------------------------------------------------------------------- IBB 131.69 2.46 125.97 415.1% ------- BLUE .156 -.024 .132 --------------------------------------------------------------------------------------------- GLD 179.36 -1.31 180.01 13.1% Bullish RED .23 .108 .338 --------------------------------------------------------------------------------------------- OIL 17.73 -.18 15.87 513.2% Bearish RED .066 .302 .368 --------------------------------------------------------------------------------------------- OIH 277.4 -1.32 257.3 279.1% Bullish RED .141 .348 .489 --------------------------------------------------------------------------------------------- CPER 28.63 .08 28.31 210.1% Bullish RED .352 .104 .456 --------------------------------------------------------------------------------------------- UUP 26.34 -.01 26.28 -24.7% Bullish ---- -.042 .066 .024 --------------------------------------------------------------------------------------------- CORN 26.82 .07 25.34 115% ------- ---- .131 .257 .388 --------------------------------------------------------------------------------------------- WEAT 10.69 .06 9.84 58.5% Bullish RED .064 .501 .565 --------------------------------------------------------------------------------------------- YINN 5.15 .56 5.12 2255.6% Bearish ---- .202 -.34 -.138 --------------------------------------------------------------------------------------------- RSX 5.65 0 5.65 0% Bullish ---- -.418 -.743 -1.161 |
 Table 2      Count of Stocks in Key Directories
              20220322
-------------------------------
NEWHIGHS       164
NEWLOWS        204
MAXCP          55
MINCP          23
TTTNH          33
TTTNL          12
CPCROSSA       85
CPCROSSD       38
ACCUMVER       3
HIGHIP21       16
HIUPPCT        29
VHIP21         43
LOWACCUM       214
REDSELL        126
AUGSELS7       13
TRAPDOOR       6
|
   Table 3    RANKING OF KEY DIRECTORIES BASED PCT.OF STOCKS ABOVE 65-DMA
              3/22/22
Bullish = 21
Bearish = 28
---------------------------------------------------------------------------------------
Directory     Current       day-1         day-2         day-3         day-4         day-5
----------------------------------------------------------------------------------------
COAL           1             1             1             1             1             1
COPPER         1             1             1             1             .875          .625
GOLD           .956          .956          .956          .956          .934          .891
SOLAR          .937          .812          .812          .875          .75           .5
OILGAS         .847          .857          .838          .847          .819          .78
INSURANC       .84           .76           .76           .76           .72           .56
FOOD           .836          .836          .836          .836          .816          .795
EDU            .833          .666          .833          .833          .833          .833
COMODITY       .82           .82           .82           .82           .794          .769
MILITARY       .769          .73           .769          .769          .769          .692
UTILITY .743 .769 .743 .769 .794 .717 INFRA .696 .696 .666 .696 .606 .545 INDMATER .652 .666 .652 .625 .597 .5 HACKERS .65 .65 .65 .5 .4 .35 HOSPITAL .625 .687 .687 .687 .687 .562 RETAIL .553 .51 .553 .553 .382 .34 INDEXES .529 .427 .437 .416 .41 .345 GREEN .526 .473 .473 .368 .315 .263 TRANSP .526 .473 .578 .473 .578 .263 SP-100 .522 .488 .477 .444 .4 .355 FIDSTKS .514 .479 .491 .443 .402 .319
===================================================================================================
SOFTWARE .482 .446 .428 .339 .303 .25
SP500 .482 .452 .474 .432 .388 .306
NIFTY .478 .347 .326 .26 .217 .173
GAMING .473 .368 .421 .368 .315 .21
LOWPRICE .47 .427 .435 .391 .33 .267
DJI-13 .461 .384 .384 .384 .384 .384
RUS-1000 .46 .43 .458 .42 .359 .291
NASD-100 .443 .35 .371 .319 .278 .206
REIT .438 .392 .469 .453 .369 .323
ELECTRON .436 .421 .436 .36 .278 .157
CHEM .434 .391 .434 .391 .434 .326
DOWJONES .433 .4 .366 .333 .333 .333
=====
HIGHPRIC .432 .341 .378 .305 .225 .167
SEMI .421 .378 .389 .315 .263 .147
FINANCE .414 .353 .39 .378 .414 .304
BIOTECH .406 .348 .398 .334 .261 .197
GUNS .384 .23 .307 .23 .307 .23
AUTO .377 .358 .377 .339 .264 .15
COMPUTER .35 .35 .35 .2 .15 .1
REGBANKS .32 .28 .32 .32 .52 .28
ETFS .309 .254 .272 .272 .254 .163
CHINA .3 .22 .16 .14 .16 .14
BEVERAGE .285 .285 .214 .214 .214 .142
BIGBANKS .285 .142 .142 .142 .142 0
HOMEBLDG .222 .222 .277 .277 .166 .111
JETS .071 0 .214 .071 .214 0
BONDFUND .011 0 .022 .011 0 0
MARIJUAN 0 0 0 0 0 0
|
====================================================================================
|
|||
 |
|||
 |
|||
 |
|||
 |
|||
 |
|||
 |
|||
 |
|||
 |
|||
 |
|||
 |
|||
 |
|||
Table 1 QUICKSILVER on ETFS - 3/21/2022 Bullish = 6 - GLD OIL/OIH CPER CORN WEAT Bearish = 2 - RETL, RSX ETF CLOSE CHANGE PIVOT-PT 5-dma AROC CL-PWR CANDLE IP21 ITRS POWER INDEX ================================================================================================== DIA 345.44 -1.75 336.19 226% Bullish RED .155 - ------- --------------------------------------------------------------------------------------------- SPY 444.39 -.13 426.17 316.4% Bullish RED .144 -.004 .14 --------------------------------------------------------------------------------------------- QQQ 350.08 -1.41 328.15 474.1% ------- RED .122 -.042 .08 --------------------------------------------------------------------------------------------- MDY 491.26 -1.32 472.03 272.3% Bullish RED .092 .005 .097 --------------------------------------------------------------------------------------------- IWM 205.44 -1.83 195.78 317.4% ------- RED .06 -.013 .047 --------------------------------------------------------------------------------------------- FAS 121.42 -.23 106.81 824% Bullish RED .063 -.118 -.055 --------------------------------------------------------------------------------------------- RETL 21.2 -1.42 18.71 976.9% Bullish RED .054 -.328 -.274 --------------------------------------------------------------------------------------------- SOXL 39 -.17 31.51 1613.4% ------- BLUE .118 -.358 -.24 --------------------------------------------------------------------------------------------- TECL 56.66 -.25 47.88 1292.1% ------- BLUE .13 -.215 -.085 --------------------------------------------------------------------------------------------- IBB 129.23 -1.76 121.13 384.4% ------- RED .117 -.046 .071 --------------------------------------------------------------------------------------------- GLD 180.67 1.37 178.89 -45.2% Bullish BLUE .238 .129 .367 --------------------------------------------------------------------------------------------- OIL 17.91 .81 16.01 384.8% Bearish BLUE .086 .319 .405 --------------------------------------------------------------------------------------------- OIH 278.72 9.34 262.47 85.5% Bullish BLUE .138 .38 .518 --------------------------------------------------------------------------------------------- CPER 28.55 -.17 27.44 202.9% Bullish RED .345 .12 .465 --------------------------------------------------------------------------------------------- UUP 26.35 .1 26.47 -28.5% Bullish BLUE -.042 .068 .026 --------------------------------------------------------------------------------------------- CORN 26.75 .74 26.22 144.6% ------- BLUE .119 .269 .388 --------------------------------------------------------------------------------------------- WEAT 10.63 .64 10.57 216.4% Bullish BLUE .056 .519 .575 --------------------------------------------------------------------------------------------- YINN 4.59 -.65 3.11 1713.1% Bearish RED .195 -.367 -.172 --------------------------------------------------------------------------------------------- RSX 5.65 0 5.65 0% Bullish ---- -.433 -.733 -1.166 |
|||
 Table 2      Count of Stocks in Key Directories
              20220321
-------------------------------
NEWHIGHS       185
NEWLOWS        187
MAXCP          94
MINCP          28
TTTNH          59
TTTNL          17
CPCROSSA       45
CPCROSSD       167
ACCUMVER       5
HIGHIP21       11
HIUPPCT        24
VHIP21         42
LOWACCUM       209
REDSELL        132
AUGSELS7       12
TRAPDOOR       20
|
|||
Table 3       RANKING OF KEY DIRECTORIES BASED PCT.OF STOCKS ABOVE 65-DMA
              3/21/22
 Bullish = 16
 Bearish = 33
---------------------------------------------------------------------------------------
Directory     Current       day-1         day-2         day-3         day-4         day-5
----------------------------------------------------------------------------------------
COAL           1             1             1             1             1             1
COPPER         1             1             1             .875          .625          .75
GOLD           .956          .956          .956          .934          .891          .913
OILGAS         .857          .838          .847          .819          .78           .79
FOOD           .836          .836          .836          .816          .795          .816
COMODITY       .82           .82           .82           .794          .769          .794
SOLAR          .812          .812          .875          .75           .5            .187
UTILITY        .769          .743          .769          .794          .717          .666
INSURANC       .76           .76           .76           .72           .56           .56
MILITARY       .73           .769          .769          .769          .692          .615
INFRA .696 .666 .696 .606 .545 .515 HOSPITAL .687 .687 .687 .687 .562 .562 EDU .666 .833 .833 .833 .833 .666 INDMATER .666 .652 .625 .597 .5 .527 HACKERS .65 .65 .5 .4 .35 .3 RETAIL .51 .553 .553 .382 .34 .319 ============================================================================================== SP-100 .488 .477 .444 .4 .355 .311 FIDSTKS .479 .491 .443 .402 .319 .278 GREEN .473 .473 .368 .315 .263 .21 TRANSP .473 .578 .473 .578 .263 .157 SP500 .452 .474 .432 .386 .308 .258 SOFTWARE .446 .428 .339 .303 .25 .232 LOWPRICE .43 .435 .389 .33 .269 .269 RUS-1000 .43 .458 .42 .359 .291 .278 INDEXES .427 .437 .416 .41 .345 .345 ELECTRON .421 .436 .36 .278 .157 .12 DOWJONES .4 .366 .333 .333 .333 .266 REIT .392 .461 .461 .369 .323 .292 CHEM .391 .434 .413 .413 .347 .369 DJI-13 .384 .384 .384 .384 .384 .384 SEMI .378 .389 .315 .263 .147 .084 GAMING .368 .421 .368 .315 .21 .157 AUTO .358 .377 .339 .264 .169 .15 FINANCE .353 .39 .378 .414 .292 .231 COMPUTER .35 .35 .2 .15 .1 .05 NASD-100 .35 .371 .309 .278 .206 .175 BIOTECH .348 .398 .334 .261 .197 .192 NIFTY .347 .326 .239 .217 .173 .173 HIGHPRIC .341 .378 .305 .225 .167 .12 BEVERAGE .285 .214 .214 .214 .142 .142 REGBANKS .28 .32 .32 .52 .28 .32 ETFS .254 .272 .272 .254 .2 .145 GUNS .23 .307 .23 .307 .23 .076 HOMEBLDG .222 .277 .277 .166 .111 .055 CHINA .22 .16 .14 .16 .14 .12 BIGBANKS .142 .142 .142 .142 0 0 BONDFUND 0 .022 .011 0 0 .011 JETS 0 .214 .071 .214 0 0 MARIJUAN 0 0 0 0 0 0 |
====================================================================================
Monday 3:15 AM PCT Futures DJI -122
NASDAQ - 61 Data thru 3-18
| Friday's rally took the DJI closer to the falling
65-dma and 200-dma targets and resistance-levels. Despite there being four straight days where the ratio of NYSE advancers to declines was more than 2:1, Peerless produced a classic Sell S9 because the DJI closed 3.4% over the 21-day ma with the P-Indicator a very negative. The P-Indicator was not just barely negative, it was a -98. In addition, the 21-dma is still falling and the V-I and OBVPct are quite negative. My experience teaches me not to over-think a Peerless Sell S9. A reversal down here would mean declining intermediate-term lows and highs. A retest of the lows would almost certainly then be in order. We certainly could go a 170 points higher and have the DJI tag its falling 65-dma, as shown below. But that is less than 1% ore. It would be at that point that the key Closing Powers would probably turn down. The failure to get past the 65-dma would be noted by many chartists and have a bearish effect on the market. After all, what more can the FED do? It can't lower rates. Some readers are more bullish than I am. But as the "keeper of the Peerless faith", I have to warn you about over-complicating the current S9. Do some profit-taking. But let's wait to short DIA The Closing Power could rise a few more days and there could be very good breadth if the Russians and Ukrainians agree to a cease fire. That could even bring a new Peerless Buy signal. In that case, traders would return to the issue of the FED's minimal response to inflation. They would likely focus on growth stocks that can show proits advancing more than 25% in 2022 over 2021 with rising PEs. NVDA remains my favorite. The older 2006 version of Peerless produced a Buy B12 as well as an S9/S13 today. Officially, conflicting signals cancel each other out. In addition, the P-Indicator is likely to rise this coming week because of the numbers being dropped of from amonth ago. (The P-I is the 21-day ma of daily NYSE advancers minus decliners..) When we specifically ask the question of the back-data to 1929 what is the effect of four straight 2:1 positive breadth days on the DJI when it closes >+2.6% over its 21-dma with the P-I negative, we find the odds are 4:2 that the DJI will continue to rally. But - and this is important - when we also add the condition that the P-Indicator must be below -50 on the "near S9", the DJI in both earlier cases sold off to the lower band and the most recent case was at the top at the end of December last year. See the new "near S9" study - http://www.tigersoftware.com/BreadthvsS9/INDEX.htm We can resolve the conflict in breadth indications by accepting Friday's Sell S9 if it is "clinched". In other words, accept it if there are 30 more NYSE decliners than advancers on Monday at the close. That will also give a chance for the DJI to reach our falling 200-day and 30-week moving targets as well as allow a new reversing Peerless Buy signal to appear, as occured in mid-1929 and -1987 (as I showed a couple of days ago). |
||
|
Charts - 3/18/2022 2022 PEERLESS DJI, Signals, Indicators Daily DJI Volume 10-DayUp/Down Vol Stoch-20 Pct of All Stocks above 65-dma Inverted Traders Index Cum. Inverted Traders Index DJI-IPA DJI-OBV NASDAQ S&P OEX NYSE DJI-15 DJI-20 DJI-30 DIA QQQ SPY IWM TNA Short-Term Rates Ten Year Rates DOLLAR-UUP ALLSTOCKs recent 2006 vers-Peerless signals http://tigersoftware.com/NEWPEER/UPD80318.BMP MDY - http://www.tigersoftware.com/CHARTZ/MDY.GIF USO-CrudeOil DBO FAS GLD HD IBB JETS JNUG KOL NUGT OIH PALL RSX RETL SDS AGQ SLV SOXL TAN TECL TLT TMF TNA UGA China: YINN CHAU Commodities: CANE CORN DBC JJC, NIB CORN, CUT (paper) MOO, SOYB WEAT UUP (Dollar) LIT (Lithium) STOCKS: MRNA DIS GE PYPL GME ZOM XLE NRGU AAPL ADBE ALXN AMAT AMGN AMD AMZN AXP BA BABA BAC BIDU BLDP CAT CRM CVX CMG DE ENPH FB GILD GOOG GS HD IBM INTU JPM LRCX MRK MSFT NEM NFLX NKE NVDA PG PYPL REGN REV SO SQ QCOM QDEL TSLA TXN XOM V VRTX WFC WMT ZM Bullish MAXCPs http://www.tigersoftware.com/UPPING/3-18/BULLISH.htm Bearish MINCPs http://www.tigersoftware.com/DOWNING/3-18/BEARISH.htm |
 |
  |
 |
 |
 |
 |
Table 1 QUICKSILVER on ETFS - 3/18/2022 Bullish = 6 - GLD OIL/OIH CPER CORN WEAT Bearish = 3 - RETL, RSX, SOXL ETF CLOSE CHANGE PIVOT-PT 5-dma AROC CL-PWR CANDLE IP21 ITRS POWER INDEX ================================================================================================== DIA 347.19 1.74 330.07 255% Bullish BLUE .137 0 ------ --------------------------------------------------------------------------------------------- SPY 444.52 3.45 417 285.6% ------- BLUE .1 -.005 .095 --------------------------------------------------------------------------------------------- QQQ 351.49 7.05 318.17 409.1% ------- BLUE .077 -.039 .038 --------------------------------------------------------------------------------------------- MDY 492.58 2.41 465.06 247.9% ------- BLUE .066 .013 .079 --------------------------------------------------------------------------------------------- IWM 207.27 2.16 192.71 265.6% ------- BLUE .04 0 .04 --------------------------------------------------------------------------------------------- FAS 121.65 1.53 102.71 978.9% Bearish BLUE .043 -.077 -.034 --------------------------------------------------------------------------------------------- RETL 22.62 .77 17.24 1243% ------- BLUE .04 -.274 -.234 --------------------------------------------------------------------------------------------- SOXL 39.17 2.22 27.91 1297.7% Bearish BLUE .065 -.342 -.277 --------------------------------------------------------------------------------------------- TECL 56.91 3.21 43.5 1106.3% Bearish BLUE .096 -.224 -.128 --------------------------------------------------------------------------------------------- IBB 130.99 2.37 119.6 419.7% ------- BLUE .108 -.034 .074 --------------------------------------------------------------------------------------------- GLD 179.3 -1.59 182.3 -159.6% ------- RED .247 .107 .354 --------------------------------------------------------------------------------------------- OIL 17.1 .2 16.64 -51.4% Bearish BLUE .09 .285 .375 --------------------------------------------------------------------------------------------- OIH 269.38 -.11 274.16 -331.7% Bullish BLUE .154 .373 .527 --------------------------------------------------------------------------------------------- CPER 28.72 .13 27.41 128.8% ------- BLUE .372 .122 .494 --------------------------------------------------------------------------------------------- UUP 26.25 .03 26.5 -49.2% Bullish RED -.071 .065 -.006 --------------------------------------------------------------------------------------------- CORN 26.01 -.11 26 -111.3% ------- RED .112 .238 .35 --------------------------------------------------------------------------------------------- WEAT 9.99 -.25 10.19 -175.8% ------- RED .039 .411 .45 --------------------------------------------------------------------------------------------- YINN 5.24 .69 3.14 1649.9% Bearish BLUE .186 -.247 -.061 --------------------------------------------------------------------------------------------- RSX 5.65 0 5.65 0% Bullish ---- -.431 -.729 -1.16 |
    Count of Stocks in Key Directories
          20220318
-------------------------------
NEWHIGHS       117
NEWLOWS        135
MAXCP          95
MINCP          17
TTTNH          62
TTTNL          19
CPCROSSA       102
CPCROSSD       40
ACCUMVER       4
HIGHIP21       20
HIUPPCT        19
VHIP21         40
LOWACCUM       275
REDSELL        137
AUGSELS7       9
TRAPDOOR       6
|
 Table 3      RANKING OF KEY DIRECTORIES BASED PCT.OF STOCKS ABOVE 65-DMA
              3/18/22
  Bullish = 17
  Bearish = 32
---------------------------------------------------------------------------------------
Directory     Current       day-1         day-2         day-3         day-4         day-5
----------------------------------------------------------------------------------------
COAL           1             1             1             1             1             1
COPPER         1             1             .875          .625          .75           .875
GOLD           .956          .956          .934          .891          .913          .978
OILGAS         .838          .847          .819          .78           .79           .866
FOOD           .836          .836          .816          .795          .816          .836
EDU            .833          .833          .833          .833          .666          .666
COMODITY       .82           .82           .794          .769          .794          .82
SOLAR          .812          .875          .75           .5            .187          .687
MILITARY       .769          .769          .769          .692          .615          .615
INSURANC       .76           .76           .72           .56           .56           .48
UTILITY .743 .769 .794 .717 .666 .666 HOSPITAL .687 .687 .687 .562 .562 .562 INFRA .666 .696 .606 .545 .515 .575 INDMATER .652 .625 .597 .5 .527 .555 HACKERS .65 .5 .4 .35 .3 .3 TRANSP .578 .473 .578 .263 .157 .315
RETAIL .553 .553 .382 .34 .319 .297
=================================================================================================
FIDSTKS .491 .443 .402 .319 .278 .278
SP-100 .477 .444 .4 .355 .322 .322
SP500 .474 .432 .386 .306 .264 .26
GREEN .473 .368 .315 .263 .21 .263
REIT .461 .453 .376 .323 .292 .361
RUS-1000 .458 .42 .359 .291 .275 .296
LOWPRICE .437 .389 .328 .269 .272 .3
ELECTRON .436 .36 .278 .157 .12 .18
CHEM .434 .413 .434 .326 .391 .304
INDEXES .432 .416 .41 .345 .345 .345
SOFTWARE .428 .339 .303 .25 .232 .267
GAMING .421 .368 .315 .21 .157 .21
BIOTECH .398 .334 .261 .197 .192 .22
FINANCE .39 .378 .414 .292 .243 .195
SEMI .389 .315 .263 .147 .084 .157
DJI-13 .384 .384 .384 .384 .384 .384
HIGHPRIC .378 .305 .225 .167 .12 .138
AUTO .377 .339 .264 .169 .132 .132
NASD-100 .371 .309 .268 .206 .175 .195
DOWJONES .366 .333 .333 .333 .3 .333
=====
COMPUTER .35 .2 .15 .1 .05 .05
NIFTY .326 .239 .195 .173 .173 .173
REGBANKS .32 .32 .52 .28 .32 .28
GUNS .307 .23 .307 .23 .076 .153
HOMEBLDG .277 .277 .166 .111 .055 .055
ETFS .272 .272 .254 .2 .163 .181
BEVERAGE .214 .214 .214 .142 .142 .142
JETS .214 .071 .214 0 0 0
CHINA .16 .14 .16 .14 .12 .2
BIGBANKS .142 .142 .142 0 0 0
BONDFUND .022 .011 0 0 .011 .011
MARIJUAN 0 0 0 0 0 0
|
====================================================================================
3-18-2022 Futures 5:30 AM PCT - DJIA
-181 NASDAQ -100 Data used through
3/17/2022
| The Buy B17 remains our operative Peerless signal.
Be careful, however, the P-Indicator is negative with the DJI 2.6% over the 21-day ma. Normally, this would give us a Sell S9. Let's see this morning if Professionals choose to boost the market before another weekend of war. The DJI rose again on excellent breadth. Advancers outpaced decliners by more than 3.5 to 1. The downtrend of the NYSE A/D Line was broken. and the IP21-Accumulation Index lept into positive territory. But new lows were still greater than new highs and the DJI is doing too much of the heavy-lifting of the market. New leadership is needed. Growth tech stocks must demonstrate their appeal now as ways to beat inflation. The current version of Peerless did not produce a Sell S9 today, but the 2006 version did. yield a new S9 because the P-Indicator is still negative with the DJI 2.6% over its 21-dma. Because of the way the P-I is calculated using a 21-day ma of NYSE daily advances minus declines, data a month ago is weighted just as much as the most recent data. Next week we will be dropping off very negative breadth data. So that will boost the P-I and very likely turn it positive. If that happens, I would think the DJI will be able to test its falling 65-dma. Usually this is strong resistance. A failure there would be the technical place to sell short DIA. More than that on this rally seems unlikely. The excellent breadth will likely not boost the market enough to take out the 65-dma on the first attempt. The rate of its decent is too steeply down. Moreover, the "near-S9", if that is what we choose to call the current negative P-I divergence, is historically more bearish than three good breadth days. See the study I did tonight of this. The odds are 5:2 that the DJI will drop to the lower band rather than rally much. See www.tigersoftware.com/breadth/BREADTH.htm There are very few MINCPs tonight even if we wanted to go short now. In addition, the next four weeks have a bullish seasonality. We should wait to see whether a number of key stocks can overcome the resistance of their 65-dma now. Failure of these rallies at their falling 65-dma will be taken as a bearish sign by traders that new leadership is not yet forthcoming. In that connection, see how AAL, ALK, AMP, ANET, AZO fare as well as AMZN, CMG, BIDU, NVDA, IWM and MDY shown below. |
||
|
Charts - 3/17/2022 2022 PEERLESS DJI, Signals, Indicators Daily DJI Volume 10-DayUp/Down Vol Stoch-20 Pct of All Stocks above 65-dma Inverted Traders Index Cum. Inverted Traders Index DJI-IPA DJI-OBV NASDAQ S&P OEX NYSE DJI-15 DJI-20 DJI-30 DIA QQQ SPY IWM TNA Short-Term Rates Ten Year Rates DOLLAR-UUP ALLSTOCKs recent 2006 vers-Peerless signals http://tigersoftware.com/NEWPEER/UPD80317.BMP MDY - http://www.tigersoftware.com/CHARTZ/MDY.GIF USO-CrudeOil DBO FAS GLD HD IBB JETS JNUG KOL NUGT OIH PALL RSX RETL SDS AGQ SLV SOXL TAN TECL TLT TMF TNA UGA China: YINN CHAU Commodities: CANE CORN DBC JJC, NIB CORN, CUT (paper) MOO, SOYB WEAT UUP (Dollar) LIT (Lithium) STOCKS: MRNA DIS GE PYPL GME ZOM XLE NRGU AAPL ADBE ALXN AMAT AMGN AMD AMZN AXP BA BABA BAC BIDU BLDP CAT CRM CVX CMG DE ENPH FB GILD GOOG GS HD IBM INTU JPM LRCX MRK MSFT NEM NFLX NKE NVDA PG PYPL REGN REV SO SQ QCOM QDEL TSLA TXN XOM V VRTX WFC WMT ZM Bullish MAXCPs http://www.tigersoftware.com/UPPING/3-17/BULLISH.htm Bearish MINCPs http://www.tigersoftware.com/DOWNING/3-17/BEARISH.htm |
 |
 |
SPY |
QQQ |
 |
 |
|
Watch to see if the following stocks can get past their falling 65-dma - key resistance. New leadershio is needed. |
 |
 |
 |
 |
 |
Table 1 QUICKSILVER on ETFS - 3/17/2022 Bullish = 6 - GLD OIL/OIH CPER CORN WEAT Bearish = 3 - RETL, RSX, SOXL ETF CLOSE CHANGE PIVOT-PT 5-dma AROC CL-PWR CANDLE IP21 ITRS POWER INDEX ================================================================================================== DIA 345.45 4.09 330.02 199.7% Bullish BLUE .117 ---- ------ --------------------------------------------------------------------------------------------- SPY 441.07 5.45 420.07 183.5% ------- BLUE .083 -.015 .068 --------------------------------------------------------------------------------------------- QQQ 344.44 4.12 324.4 200.5% Bearish BLUE .055 -.07 -.015 --------------------------------------------------------------------------------------------- MDY 490.17 4.72 468.96 172.1% ------- BLUE .051 .001 .052 --------------------------------------------------------------------------------------------- IWM 205.11 3.17 196.73 131.4% ------- BLUE .019 -.027 -.008 --------------------------------------------------------------------------------------------- FAS 120.12 3.77 100.26 846.5% ------- BLUE .032 -.105 -.073 --------------------------------------------------------------------------------------------- RETL 21.85 .93 17.82 661.9% ------- BLUE .017 -.35 -.333 - --------------------------------------------------------------------------------------------- SOXL 36.95 .65 30.69 659.7% Bearish BLUE .062 -.419 -.357 - --------------------------------------------------------------------------------------------- TECL 53.7 1.07 46.12 525.5% Bearish BLUE .08 -.314 -.234 --------------------------------------------------------------------------------------------- IBB 128.62 2.65 120.65 230.2% ------- BLUE .071 -.072 -.001 --------------------------------------------------------------------------------------------- GLD 180.89 .88 185.09 -150.9% Bullish RED .304 .128 .432 --------------------------------------------------------------------------------------------- OIL 16.9 1.03 17.27 39.4% Bearish BLUE .062 .276 .338 --------------------------------------------------------------------------------------------- OIH 269.49 12.19 287.3 -403.2% Bullish BLUE .137 .37 .507 --------------------------------------------------------------------------------------------- CPER 28.59 .28 28 59.2% Bullish BLUE .383 .11 .493 --------------------------------------------------------------------------------------------- UUP 26.22 -.06 26.51 -28.4% Bullish ---- -.053 .077 .024 --------------------------------------------------------------------------------------------- CORN 26.12 .78 26.59 -49.8% Bullish BLUE .111 .246 .357 --------------------------------------------------------------------------------------------- WEAT 10.24 .4 10.35 112.8% Bullish BLUE .049 .447 .496 --------------------------------------------------------------------------------------------- YINN 4.55 -.57 3.93 50.5% Bearish RED .131 -.361 -.23 --------------------------------------------------------------------------------------------- RSX 5.65 0 5.65 0% Bullish ---- -.407 -.727 -1.134 |
  Table 2  Count of Stocks in Key Directories
           20220317
-------------------------------
NEWHIGHS       109
NEWLOWS        179
MAXCP          86
MINCP          11
TTTNH          58
TTTNL          11
CPCROSSA       266
CPCROSSD       10
ACCUMVER       1
HIGHIP21       11
HIUPPCT        15
VHIP21         39
LOWACCUM       228
REDSELL        139
AUGSELS7       14
TRAPDOOR       11
|
 RANKING OF KEY DIRECTORIES BASED PCT.OF STOCKS ABOVE 65-DMA
               3/17/22
  Bullish = 15
  Bearish = 33
---------------------------------------------------------------------------------------
Directory     Current       day-1         day-2         day-3         day-4         day-5
----------------------------------------------------------------------------------------
COAL           1             1             1             1             1             1
COPPER         1             .875          .625          .75           .875          1
GOLD           .956          .934          .891          .913          .978          .978
SOLAR          .875          .75           .5            .187          .625          .812
OILGAS         .847          .819          .78           .79           .857          .866
FOOD           .836          .816          .795          .816          .836          .836
EDU            .833          .833          .833          .666          .666          .833
COMODITY       .82           .794          .769          .794          .82           .846
MILITARY       .769          .769          .692          .615          .615          .653
UTILITY        .769          .794          .717          .666          .666          .666
INSURANC .76 .72 .56 .56 .48 .36 INFRA .696 .606 .545 .515 .575 .636 HOSPITAL .687 .687 .562 .562 .562 .562 INDMATER .625 .597 .5 .527 .569 .555 RETAIL .553 .382 .34 .319 .297 .361 ================================================================================================= HACKERS .5 .4 .35 .3 .3 .5 ================================================================================================== TRANSP .473 .578 .263 .157 .315 .315 REIT .453 .369 .33 .292 .361 .407 SP-100 .444 .4 .355 .322 .322 .355 FIDSTKS .443 .402 .319 .278 .278 .307 SP500 .432 .386 .306 .262 .262 .28 RUS-1000 .42 .359 .291 .275 .293 .336 INDEXES .416 .41 .345 .345 .345 .351 CHEM .413 .434 .347 .369 .326 .304 LOWPRICE .391 .328 .267 .272 .297 .34 DJI-13 .384 .384 .384 .384 .384 .384 FINANCE .378 .414 .292 .243 .207 .195 GAMING .368 .315 .21 .157 .21 .21 GREEN .368 .315 .263 .21 .263 .263 ELECTRON .36 .278 .157 .12 .172 .255 AUTO .339 .264 .169 .132 .132 .207 SOFTWARE .339 .303 .25 .232 .267 .321 BIOTECH .334 .261 .197 .192 .217 .27 DOWJONES .333 .333 .333 .3 .333 .333 REGBANKS .32 .52 .28 .32 .28 .24 SEMI .315 .263 .147 .084 .147 .2 NASD-100 .309 .268 .195 .175 .195 .216 HIGHPRIC .305 .225 .167 .12 .138 .16 HOMEBLDG .277 .166 .111 .055 .055 .055 ETFS .272 .254 .2 .163 .2 .181 NIFTY .239 .195 .152 .173 .173 .173 GUNS .23 .307 .23 .076 .153 .153 BEVERAGE .214 .214 .142 .142 .142 .071 COMPUTER .2 .15 .1 .05 .05 .05 CHINA .148 .17 .148 .127 .212 .255 BIGBANKS .142 .142 0 0 0 0 JETS .071 .214 0 0 0 0 BONDFUND .011 0 0 .011 .011 .011 MARIJUAN 0 0 0 0 0 0 |
====================================================================================
3-17-2022 Futures 5:40 AM PCT - DJIA -115
NASDAQ -69 Data used through 3/16/2022
| "Paltry, puny, piddling and pathetic."
That's how I would describe Powell's war on what is now 10% inflation. The market understands this even though most of the financial commentators chose to laud the FED's leader. The fact is that it is the FED under law which regulates money supply. It is the FED that Congress has created and made specifically responsible for fighting inflation. Powell tells us he is planning 7 more 1/4% increases in the Federal Funds Rate, the percentage interest rate banks can borrow overnight. So, in two years, the FED will be up to 2%. Somehow, they have made the nation think that this action will fix 10% inflation. But, of course, it is not intended to seriously fight inflation. Rather, it is to help big banks' profits and to keep alive the Powell-created bull market, no matter what it does to the rate of inflation and how much it harms those living on mostly fixed incomes. If I am right, traders appreciate these numbers. There will be no recession. But there will be plenty of inflation. In the 1960s when the War in Vietnam started that era's inflationary binge, the place for investors to be was not Gold or Oil (that was tfor the 1970s and 1980), rather, it was growth stocks, especially computers. Then by 1968, it was low priced stocks, "the cats and dogs". If the same is true today, semi-conductors and artificial intelligence stocks like NVDA will be the best ways for investors to fight inflation. These have had a sell-off and they may make new highs again this Summer. Short sales will be particularly dangerous at times, as traders who owned YANG today found out. YANG is the 3x leveraged negative Chinese ETF.investors. See its chart below. At present, the DJI has stalled at 34000. The internals are certainly negatiive. But this could change if the NYSE A/D Line downtrend is violated. See below how in May-June 1929 and 1987, a new leg up in an over-extended market occurred when the FED turned soft on raising interest rates. The A/D Line broke its downtrend. Soon affterwards, the key Peerless indicators then surged and Peerless produced a reversing Buy B4. I would suggest covering those short sales whose Closing Power is not falling or when they break above their steep downtrends. See the examples shown with the Bearish MINCPs. |
||
|
Charts - 3/16/202 2022 PEERLESS DJI, Signals, Indicators Daily DJI Volume 10-DayUp/Down Vol Stoch-20 Pct of All Stocks above 65-dma Inverted Traders Index Cum. Inverted Traders Index DJI-IPA DJI-OBV NASDAQ S&P OEX NYSE DJI-15 DJI-20 DJI-30 DIA QQQ SPY IWM TNA Short-Term Rates Ten Year Rates DOLLAR-UUP ALLSTOCKs recent 2006 vers-Peerless signals http://tigersoftware.com/NEWPEER/UPD80316.BMP MDY - http://www.tigersoftware.com/CHARTZ/MDY.GIF USO-CrudeOil DBO FAS GLD HD IBB JETS JNUG KOL NUGT OIH PALL RSX RETL SDS AGQ SLV SOXL TAN TECL TLT TMF TNA UGA China: YINN CHAU Commodities: CANE CORN DBC JJC, NIB CORN, CUT (paper) MOO, SOYB WEAT UUP (Dollar) LIT (Lithium) STOCKS: MRNA DIS GE PYPL GME ZOM XLE NRGU AAPL ADBE ALXN AMAT AMGN AMD AMZN AXP BA BABA BAC BIDU BLDP CAT CRM CVX CMG DE ENPH FB GILD GOOG GS HD IBM INTU JPM LRCX MRK MSFT NEM NFLX NKE NVDA PG PYPL REGN REV SO SQ QCOM QDEL TSLA TXN XOM V VRTX WFC WMT ZM Bullish MAXCPs http://www.tigersoftware.com/UPPING/3-16/BULLISH.htm Bearish MINCPs http://www.tigersoftware.com/DOWNING/3-16/BEARISH.htm |
1929's Extra Summer Rally |
1987's Extra Summer Rally |
|
YANG's Crazy Day Today Shorts must not be lazy.    |
DJIA-30 |
DIA |
SPY |
QQQ |
TECL |
SOXL |
Table 1 QUICKSILVER on ETFS - 3/16/2022 Bullish = 6 - GLD OIL/OIH CPER CORN WEAT Bearish = 4 - RETL, RSX, SOXL, TECL ETF CLOSE CHANGE PIVOT-PT 5-dma AROC CL-PWR CANDLE IP21 ITRS POWER INDEX
==================================================================================================
DIA 341.36 5.17 332.11 119.8% ------- BLUE .1 ====== ====
---------------------------------------------------------------------------------------------
SPY 435.62 9.45 425.48 97% Bearish BLUE .075 -.022 .053
---------------------------------------------------------------------------------------------
QQQ 340.32 12.17 331.27 81.4% Bearish BLUE .046 -.086 -.04
---------------------------------------------------------------------------------------------
MDY 485.45 13.42 473.89 123.6% ------- BLUE .058 .002 .06
---------------------------------------------------------------------------------------------
IWM 201.94 6.16 199.92 42.1% ------- BLUE .018 -.037 -.019
---------------------------------------------------------------------------------------------
FAS 116.35 9.54 102.23 571.1% Bearish BLUE -.008 -.069 -.077
---------------------------------------------------------------------------------------------
RETL 20.92 2.21 19.36 421.7% Bearish BLUE .02 -.381 -.361 -
---------------------------------------------------------------------------------------------
SOXL 36.3 4.79 32.75 217.1% Bearish BLUE .061 -.43 -.369 -
---------------------------------------------------------------------------------------------
TECL 52.63 4.75 48.68 122% Bearish BLUE .069 -.34 -.271 -
---------------------------------------------------------------------------------------------
IBB 125.97 4.84 123 70.2% ------- BLUE .026 -.107 -.081
---------------------------------------------------------------------------------------------
GLD 180.01 1.12 186.4 -158.1% Bullish BLUE .335 .136 .471 +
---------------------------------------------------------------------------------------------
OIL 15.87 -.14 16.77 -278.5% Bearish RED .072 .222 .294 +
---------------------------------------------------------------------------------------------
OIH 257.3 -5.17 291.63 -388.1% Bullish RED .15 .371 .521 +
---------------------------------------------------------------------------------------------
CPER 28.31 .87 28.26 82.8% Bullish BLUE .393 .117 .51 +
---------------------------------------------------------------------------------------------
UUP 26.28 -.19 26.37 7.6% Bullish RED -.096 .086 -.01
---------------------------------------------------------------------------------------------
CORN 25.34 -.88 26.38 -93.5% Bearish RED .084 .245 .329 +
---------------------------------------------------------------------------------------------
WEAT 9.84 -.73 10.01 -252.5% ------- RED .026 .42 .446 +
---------------------------------------------------------------------------------------------
YINN 5.12 2.01 4.51 -100.6% Bearish BLUE .091 -.317 -.226
---------------------------------------------------------------------------------------------
RSX 5.65 0 5.65 0% Bullish ---- -.372 -.723 -1.095 -
|
 Table 2    Count of Stocks in Key Directories
            20220316
-------------------------------
NEWHIGHS       78
NEWLOWS        328
MAXCP          39
MINCP          17
TTTNH          27
TTTNL          31
CPCROSSA       289
CPCROSSD       29
ACCUMVER       2
HIGHIP21       13
HIUPPCT        11
VHIP21         42
LOWACCUM       245
REDSELL        134
AUGSELS7       13
TRAPDOOR       11
|
 RANKING OF KEY DIRECTORIES BASED PCT.OF STOCKS ABOVE 65-DMA
                            3/16/22
 Bullish = 16
 Bearish = 33
---------------------------------------------------------------------------------------
Directory     Current       day-1         day-2         day-3         day-4         day-5
----------------------------------------------------------------------------------------
COAL           1             1             1             1             1             1
GOLD           .934          .891          .913          .978          .978          .978
COPPER         .875          .625          .75           .875          1             .875
EDU            .833          .833          .666          .666          .833          .666
OILGAS         .819          .78           .79           .857          .866          .876
FOOD           .816          .795          .816          .836          .836          .836
COMODITY       .794          .769          .794          .82           .846          .82
UTILITY        .794          .717          .666          .666          .666          .641
MILITARY       .769          .692          .615          .615          .653          .653
SOLAR          .75           .5            .187          .625          .812          .875
INSURANC .72 .56 .56 .48 .36 .36 HOSPITAL .687 .562 .562 .562 .562 .625 INFRA .606 .545 .515 .575 .636 .636 INDMATER .597 .5 .527 .569 .555 .583 TRANSP .578 .263 .157 .315 .315 .315 REGBANKS .52 .28 .32 .28 .24 .24 ================================================================================================= CHEM .434 .347 .391 .304 .326 .282 FINANCE .414 .292 .243 .207 .182 .182 INDEXES .41 .345 .345 .345 .351 .356 FIDSTKS .402 .319 .278 .278 .301 .313 HACKERS .4 .35 .3 .3 .5 .55 SP-100 .4 .355 .322 .322 .355 .344 SP500 .386 .306 .262 .26 .282 .278 DJI-13 .384 .384 .384 .384 .384 .384 RETAIL .382 .34 .319 .297 .361 .319 REIT .369 .323 .3 .361 .407 .384 RUS-1000 .359 .291 .275 .293 .334 .321 DOWJONES .333 .333 .3 .333 .333 .3 LOWPRICE .33 .267 .269 .297 .335 .338 GAMING .315 .21 .157 .21 .21 .21 GREEN .315 .263 .21 .263 .263 .263 GUNS .307 .23 .076 .153 .153 .23 SOFTWARE .303 .25 .232 .267 .303 .303 ELECTRON .278 .157 .12 .172 .255 .233 NASD-100 .268 .195 .164 .195 .216 .195 BIOTECH .266 .203 .197 .222 .269 .274 AUTO .264 .169 .132 .132 .207 .226 SEMI .263 .147 .084 .147 .2 .189 ETFS .254 .2 .163 .2 .2 .218 HIGHPRIC .225 .167 .12 .138 .16 .16 BEVERAGE .214 .142 .142 .142 .071 .142 JETS .214 0 0 0 0 0 NIFTY .195 .152 .152 .173 .173 .173 HOMEBLDG .166 .111 .055 .055 .055 .055 CHINA .16 .14 .12 .2 .22 .24 COMPUTER .15 .1 .05 .05 .05 .05 BIGBANKS .142 0 0 0 0 0 BONDFUND 0 0 .011 .011 .011 .011 MARIJUAN 0 0 0 0 0 0 |
====================================================================================
3-16-2022 Futures 5:40 AM PCT - DJIA + 356 NASDAQ
+222 Data used through 3/15/2022
| The DJI is rising quickly back to 34000.
It is now above its 21-dma. Its internals remain quite negative. So a close near 34500 would mean it has reached the 2.5% upper band with the P-I, IP21 and V-I still negative. If this happens, we will get a Sell S9 and Sell S12. The Closing Powers for the key ETFs are failling. So, we may not reach that level. It will depend on the news of the war. The FED has already made known it wishes to avoid dropping the stock market rather than seriously fight inflation. Good news for the market is having its effect. The DJI is well above its 10%-down from the peak, thereby giving credence to the Buy B17 that we doubted. Meanwhile, the NASDAQ is recovering from being down 21%. It looks like Russia is pulling back some of its troops from the Ukraine. This makes it seem that they may be more eager to reach a peace settlement with Ukraine. At the same time, only a 1/4% increase in rates is expected, though no one seems to know which rates and to what level. Given the 10% annual rise in the Producer Price Index, reported Tuesday, Powell and Company will not have much effect on the rate of inflation or the CPI numbers immediately ahead or the national economy. Stocks, especially beaten-down NASDAQ stocks, like NVDA should do very well if the FED takes only "baby steps" against inflation. Listen to Powell tomorrow. He will again tell us that inflation is transient and a result of the Russian war and sanctions. Actually, inflation was seen as a growing problem throughout 2021. And a problem that the FED itself deliberately created to boost the stock market and hold up the economy during the Covid era. |
||
|
Charts - 3/15/202
2022 PEERLESS DJI, Signals, Indicators Daily DJI Volume 10-DayUp/Down Vol Stoch-20 Pct of All Stocks above 65-dma Inverted Traders Index Cum. Inverted Traders Index DJI-IPA DJI-OBV NASDAQ S&P OEX NYSE DJI-15 DJI-20 DJI-30 DIA QQQ SPY IWM TNA Short-Term Rates Ten Year Rates DOLLAR-UUP ALLSTOCKs recent 2006 vers-Peerless signals http://tigersoftware.com/NEWPEER/UPD80315.BMP MDY - http://www.tigersoftware.com/CHARTZ/MDY.GIF USO-CrudeOil DBO FAS GLD HD IBB JETS JNUG KOL NUGT OIH PALL RSX RETL SDS AGQ SLV SOXL TAN TECL TLT TMF TNA UGA China: YINN CHAU Commodities: CANE CORN DBC JJC, NIB CORN, CUT (paper) MOO, SOYB WEAT UUP (Dollar) LIT (Lithium) STOCKS: MRNA DIS GE PYPL GME ZOM XLE NRGU AAPL ADBE ALXN AMAT AMGN AMD AMZN AXP BA BABA BAC BIDU BLDP CAT CRM CVX CMG DE ENPH FB GILD GOOG GS HD IBM INTU JPM LRCX MRK MSFT NEM NFLX NKE NVDA PG PYPL REGN REV SO SQ QCOM QDEL TSLA TXN XOM V VRTX WFC WMT ZM Bullish MAXCPs http://www.tigersoftware.com/UPPING/3-15/BULLISH.htm Bearish MINCPs http://www.tigersoftware.com/DOWNING/3-15/BEARISH.htm |
|
Insurance make their profits by investing in the stock market and avoiding having to pay a higher than predicted number of claims. Market timing is also something they must do. Our Tiger Index of 25 Insurance stocks shows our buy and sell signals on the upward sloping regression channel of these insurance stocks. It missed only one top. That occurred in early November. The buys have been particularly good. It is on a Buy now.  |
 |
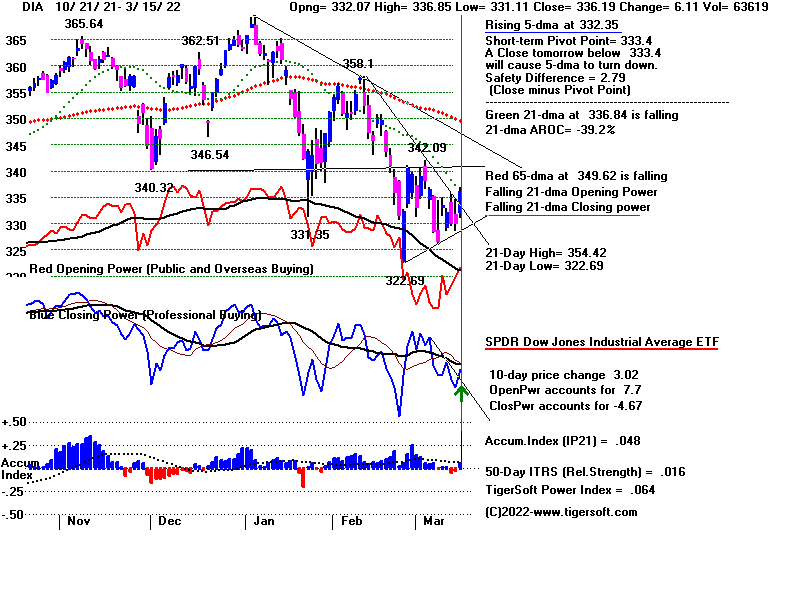 |
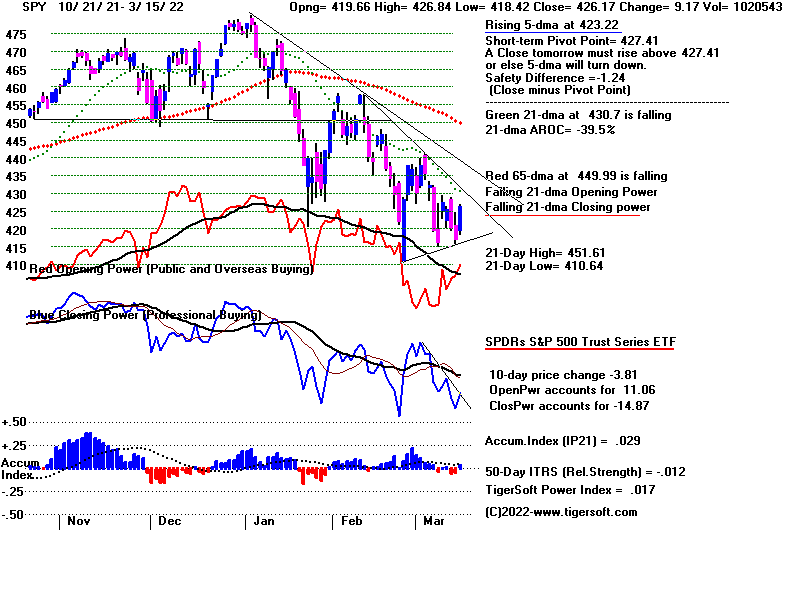 |
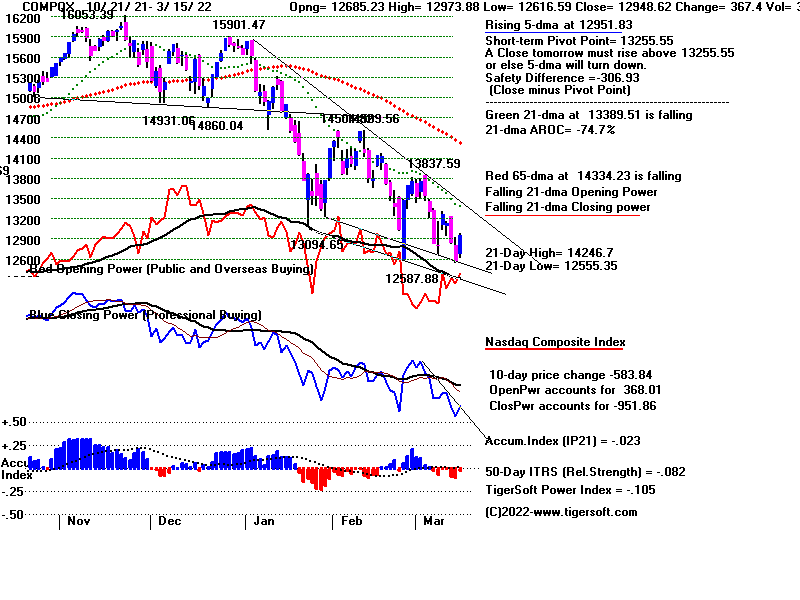 |
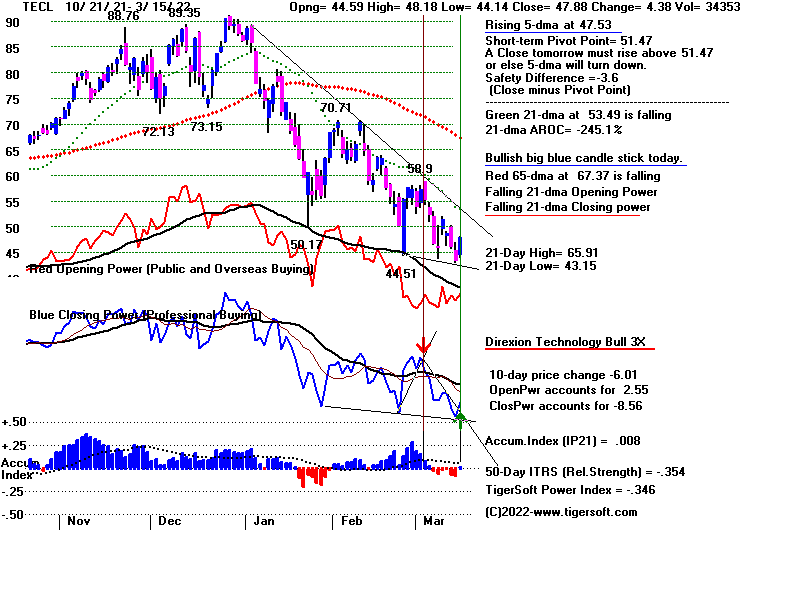 |
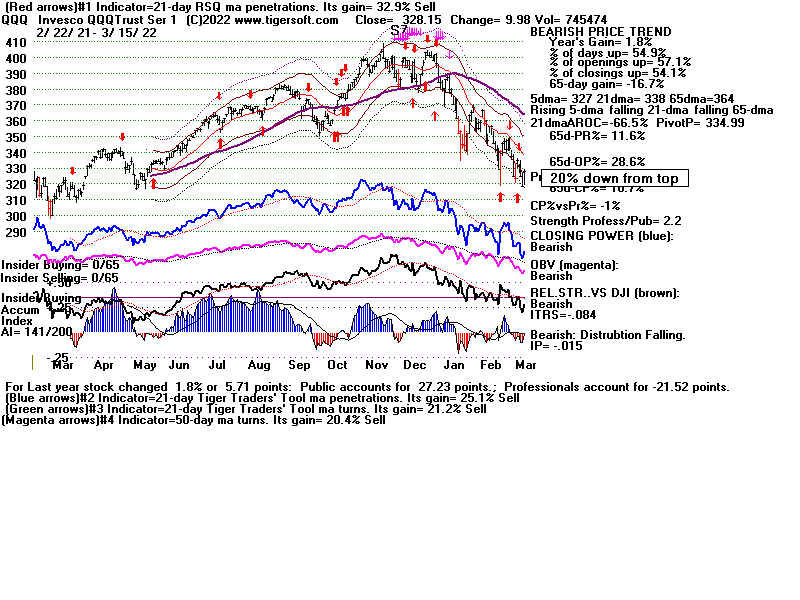 |
Highest Ranked QQQ stock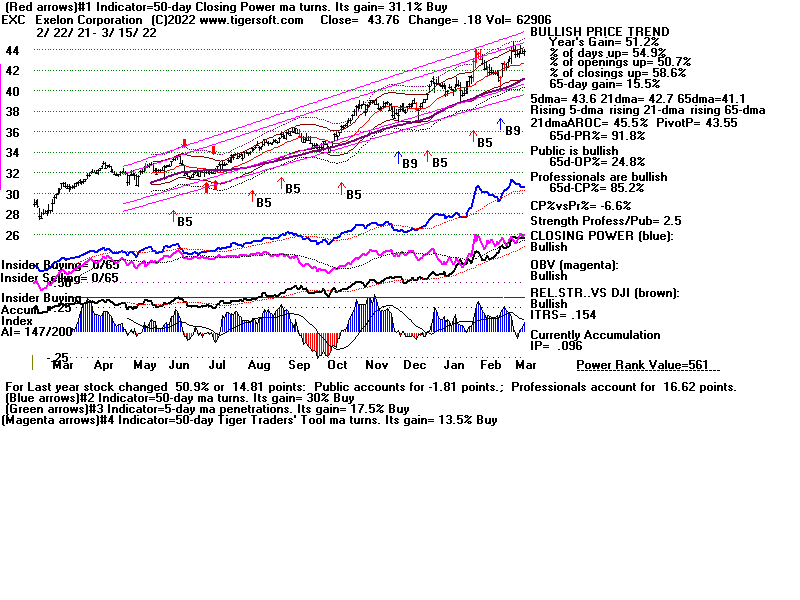 |
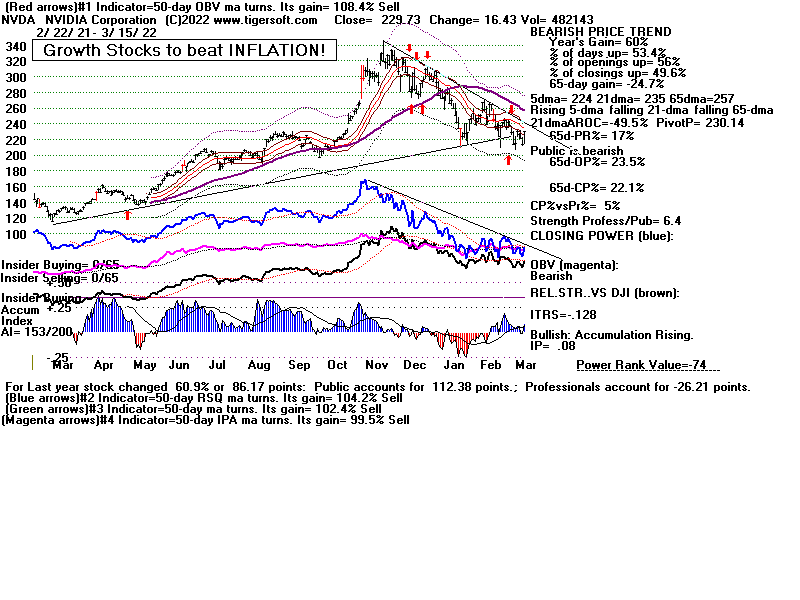 |
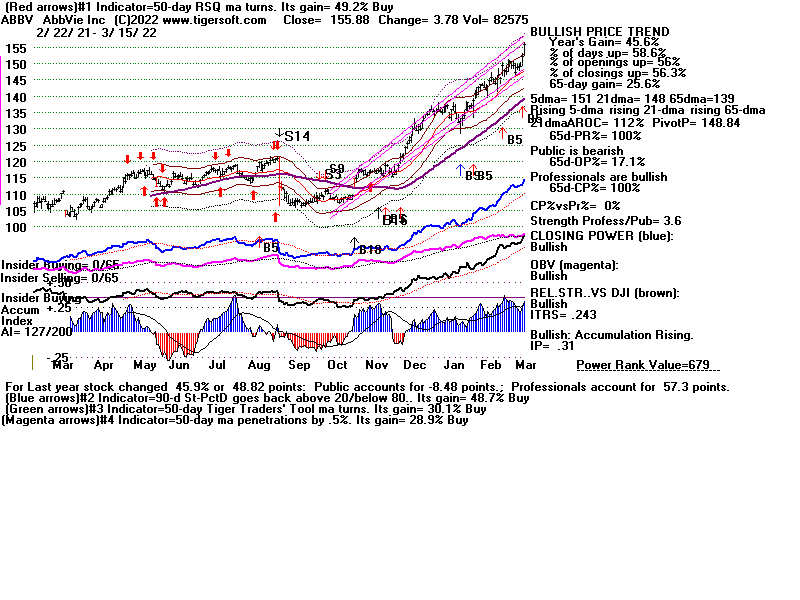 |
Table 1 QUICKSILVER on ETFS - 3/15/2022 Bullish = 6 - GLD OIL/OIH CPER CORN WEAT Bearish = 5 - RETL, RSX, SOXL, TECL, YINN ETF CLOSE CHANGE PIVOT-PT 5-dma AROC CL-PWR CANDLE IP21 ITRS POWER INDEX ================================================================================================== DIA 336.19 6.12 333.4 146.2% Bearish BLUE .048 ---- ------ --------------------------------------------------------------------------------------------- SPY 426.17 9.17 427.41 117.7% Bearish BLUE .029 -.028 .001 --------------------------------------------------------------------------------------------- QQQ 328.15 9.98 334.99 73.5% Bearish BLUE -.015 -.101 -.116 --------------------------------------------------------------------------------------------- MDY 472.03 6.97 473.81 120.9% ------- BLUE -.005 -.014 -.019 --------------------------------------------------------------------------------------------- IWM 195.78 3.07 200.28 25.1% Bearish BLUE -.044 -.045 -.089 --------------------------------------------------------------------------------------------- FAS 106.81 4.1 104.55 609.3% Bearish BLUE -.071 -.108 -.179 --------------------------------------------------------------------------------------------- RETL 18.71 1.47 19.36 111.3% Bearish BLUE -.055 -.412 -.467 --- --------------------------------------------------------------------------------------------- SOXL 31.51 3.6 34.93 55.6% Bearish BLUE .002 -.462 -.46 ---- --------------------------------------------------------------------------------------------- TECL 47.88 4.38 51.47 200.4% Bearish BLUE .008 -.37 -.362 --- --------------------------------------------------------------------------------------------- IBB 121.13 1.53 124.26 33.3% Bearish BLUE -.058 -.132 -.19 --------------------------------------------------------------------------------------------- GLD 178.89 -3.41 185.82 -338.8% Bullish RED .318 .121 .439 +++ --------------------------------------------------------------------------------------------- OIL 16.01 -.63 16.8 -774.7% Bearish RED .115 .256 .371 +++ --------------------------------------------------------------------------------------------- OIH 262.47 -11.69 278.95 -504.3% Bullish BLUE .157 .495 .652 +++ --------------------------------------------------------------------------------------------- CPER 27.44 .03 27.85 -254.6% ------- BLUE .235 .083 .318 +++ --------------------------------------------------------------------------------------------- UUP 26.47 -.03 26.24 -5.7% Bullish BLUE -.031 .107 .076 --------------------------------------------------------------------------------------------- CORN 26.22 .22 25.83 -9.5% Bullish BLUE .132 .292 .424 +++ --------------------------------------------------------------------------------------------- WEAT 10.57 .38 10.36 -259.5% Bullish BLUE .067 .505 .572 +++ --------------------------------------------------------------------------------------------- YINN 3.11 -.03 5.2 -2137.9% Bearish BLUE -.147 -.552 -.699 --- --------------------------------------------------------------------------------------------- RSX 5.65 0 5.65 0% Bullish ---- -.341 -.713 -1.054 --- |
 Table 2       Count of Stocks in Key Directories
              20220315
-------------------------------
NEWHIGHS       55
NEWLOWS        951
MAXCP          16
MINCP          325
TTTNH          28
TTTNL          145
CPCROSSA       27
CPCROSSD       171
ACCUMVER       7
HIGHIP21       14
HIUPPCT        7
VHIP21         42
LOWACCUM       230
REDSELL        122
AUGSELS7       8
TRAPDOOR       87
|
 Table 3    RANKING OF KEY DIRECTORIES BASED PCT.OF STOCKS ABOVE 65-DMA
              3/15/22
 Bullish = 12
 Bearish = 35
---------------------------------------------------------------------------------------
Directory     Current       day-1         day-2         day-3         day-4         day-5
----------------------------------------------------------------------------------------
COAL           1             1             1             1             1             1
GOLD           .891          .913          .978          .978          .978          1
EDU            .833          .666          .666          .833          .666          .5
FOOD           .795          .816          .836          .836          .836          .836
OILGAS         .78           .79           .857          .866          .876          .904
COMODITY       .769          .794          .82           .846          .82           .82
UTILITY        .717          .666          .666          .666          .641          .692
MILITARY       .692          .615          .615          .653          .653          .538
COPPER         .625          .75           .875          1             .875          .875
HOSPITAL       .562          .562          .562          .562          .625          .562
INSURANC .56 .56 .48 .36 .4 .28 INFRA .545 .515 .575 .636 .636 .515 ================================================================================================ INDMATER .5 .527 .569 .555 .583 .527 SOLAR .5 .187 .625 .812 .875 .875 ================================================================================================ DJI-13 .384 .384 .384 .384 .384 .307 SP-100 .355 .322 .322 .355 .344 .288 HACKERS .35 .3 .3 .5 .55 .35 CHEM .347 .391 .326 .304 .304 .217 INDEXES .345 .345 .345 .351 .356 .329 RETAIL .34 .319 .297 .361 .319 .234 DOWJONES .333 .3 .333 .333 .3 .2 REIT .323 .292 .369 .407 .384 .276 FIDSTKS .319 .278 .278 .301 .319 .266 SP500 .306 .262 .26 .28 .284 .248 FINANCE .292 .243 .207 .182 .182 .109 RUS-1000 .291 .275 .293 .334 .324 .275 REGBANKS .28 .32 .28 .24 .24 .16 LOWPRICE .269 .269 .295 .335 .338 .3 GREEN .263 .21 .263 .263 .263 .315 TRANSP .263 .157 .315 .315 .263 .157 SOFTWARE .25 .232 .267 .303 .303 .214 GUNS .23 .076 .153 .153 .23 .153 GAMING .21 .157 .21 .21 .21 .157 BIOTECH .203 .197 .222 .269 .274 .208 ETFS .2 .163 .2 .2 .236 .127 NASD-100 .195 .164 .185 .216 .206 .154 AUTO .169 .132 .132 .207 .226 .169 HIGHPRIC .167 .12 .138 .16 .163 .112 ELECTRON .157 .12 .172 .255 .225 .195 NIFTY .152 .152 .152 .173 .173 .152 SEMI .147 .084 .147 .2 .189 .178 BEVERAGE .142 .142 .142 .071 .142 .071 CHINA .14 .12 .2 .22 .24 .22 HOMEBLDG .111 .055 .055 .055 .055 .055 COMPUTER .1 .05 .05 .05 .05 .05 BIGBANKS 0 0 0 0 0 0 BONDFUND 0 .011 .011 .011 .011 .011 JETS 0 0 0 0 0 0 MARIJUAN 0 0 0 0 0 0 |
====================================================================================
3-15-2022 Futures 5:45 AM PCT - DJIA + 150 NASDAQ
+100 Data used through 3/12/2022
| Another
up opening is shaping up. Why would it fare better than Monday's? Today's 400+ point sell-off by the DJI after a seemingly strong opening is typical of a top or a bear market. Who is going to trust another big opening for a while? It can't be good that the NASDAQ's and QQQ's dropped below their 20%-down -from-their-peak level or that there were 1645 new lows by the NYSE and NASDAQ. 25% of all stocks made new lows today. Stealthy bear markets are the most deadly.. Historically, significant tops tend to occur when blue chips and commodities are the last groups still holding up. This was true, for example, at the start of 1973 and in mid-2008. About the time, the DJI forms a head and shoulders top or drops more than 10% below its peak, crude oil and commodities tend to top out, thus removing the remaining chairs in the "musical chairs" game on Wall Street. Below I show how we spotted the tops in Crude Oil and Chevron in 2008. On this basis, we have be sellers of Crude Oil but not yet Chevron. Draw steep price and Closing Power uptrends and sell if the IP21 is below its 21-dma. Might there be a general market rally? Sure...Putin might resign, I suppose. Powell might back away from raising rates much this week. But neither seems likely. So, any rally would likely be the type that occurs when the market gets relief that the "bad news" is finally out. But if that were developing, I would expect the Closing and Opening Powers for the major ETFs not to be both falling as they are now. Nor would we expect to see the NYSE A/D Line drop by another 1600 more today. And most likely we would not see 4 times more Bearish MINCPs than Bullish MAXCPs. From the point of view of Peerless, the odds are 75% that the DJI will fall significantly lower because of its drop below the 10%-down level with a V-Indicator reading well below -130. |
||
|
Charts - 3/14/202 2022 PEERLESS DJI, Signals, Indicators Daily DJI Volume 10-DayUp/Down Vol Stoch-20 Pct of All Stocks above 65-dma Inverted Traders Index Cum. Inverted Traders Index DJI-IPA DJI-OBV NASDAQ S&P OEX NYSE DJI-15 DJI-20 DJI-30 DIA QQQ SPY IWM TNA Short-Term Rates Ten Year Rates DOLLAR-UUP ALLSTOCKs recent 2006 vers-Peerless signals http://tigersoftware.com/NEWPEER/UPD80314.BMP MDY - http://www.tigersoftware.com/CHARTZ/MDY.GIF USO-CrudeOil DBO FAS GLD HD IBB JETS JNUG KOL NUGT OIH PALL RSX RETL SDS AGQ SLV SOXL TAN TECL TLT TMF TNA UGA China: YINN CHAU Commodities: CANE CORN DBC JJC, NIB CORN, CUT (paper) MOO, SOYB WEAT UUP (Dollar) LIT (Lithium) STOCKS: MRNA DIS GE PYPL GME ZOM XLE NRGU AAPL ADBE ALXN AMAT AMGN AMD AMZN AXP BA BABA BAC BIDU BLDP CAT CRM CVX CMG DE ENPH FB GILD GOOG GS HD IBM INTU JPM LRCX MRK MSFT NEM NFLX NKE NVDA PG PYPL REGN REV SO SQ QCOM QDEL TSLA TXN XOM V VRTX WFC WMT ZM Bullish MAXCPs http://www.tigersoftware.com/UPPING/3-14/BULLISH.htm Bearish MINCPs http://www.tigersoftware.com/DOWNING/3-14/BEARISH.htm |
DJI -2020 - Still
trying to maintain the appearance that all is OK in market
and what we are seeing
is merely an intermediate-term correction. Very
heavy Down V-I and
falling A/D line belie that illusion.
 BOTH DOWN - Bearishly, Opening AND Closi ng Power are falling.
Recognizing 2007 Top in Chevron 2022 Chevron  |
Recognizing 2007 Top in Crude Oil 2022 UCO  |
 |
 |
|
Watch Closing Power for AAPL to see if there is an important rebound.  |
|
Note the month-long purple Buy B7s. They are buys when stock rises above 65-dma. Closing Power is bullishly diverging from weak price-action. Professionals expect bullish news in future.  |
Table 1 QUICKSILVER on ETFS - 3/14/2022 Bullish = 6 - GLD OIL/OIH CPER CORN WEAT Bearish = 6 - FAS, RETL, RSX, SOXL, TECL, YINN ETF CLOSE CHANGE PIVOT-PT 5-dma AROC CL-PWR CANDLE IP21 ITRS POWER INDEX ================================================================================================== DIA 330.07 .05 326.53 24.2% Bearish RED -.028 0 -.028 --------------------------------------------------------------------------------------------- SPY 417 -3.07 416.25 -28.8% Bearish RED -.049 -.031 -.08 --------------------------------------------------------------------------------------------- QQQ 318.17 -6.23 323.35 -102.1% Bearish RED -.103 -.112 -.215 --------------------------------------------------------------------------------------------- MDY 465.06 -3.9 460.7 62.3% Bearish RED -.052 -.007 -.059 --------------------------------------------------------------------------------------------- IWM 192.71 -4.02 194.79 -25.6% Bearish RED -.105 -.042 -.147 --------------------------------------------------------------------------------------------- FAS 102.71 2.45 94.52 346.8% Bearish RED -.123 -.124 -.247 --------------------------------------------------------------------------------------------- RETL 17.24 -.58 18.3 10.9% Bearish RED -.107 -.442 -.549 --------------------------------------------------------------------------------------------- SOXL 27.91 -2.78 31.16 -262.4% Bearish RED -.074 -.498 -.572 --------------------------------------------------------------------------------------------- TECL 43.5 -2.62 45.99 -333.8% Bearish RED -.079 -.41 -.489 --------------------------------------------------------------------------------------------- IBB 119.6 -1.05 120.32 -41.9% Bearish RED -.12 -.129 -.249 --------------------------------------------------------------------------------------------- GLD 182.3 -2.79 191.51 -109.9% Bullish RED .37 .167 .537 --------------------------------------------------------------------------------------------- OIL 16.64 -.63 18.68 -511.6% Bearish RED .138 .305 .443 --------------------------------------------------------------------------------------------- OIH 274.16 -13.14 291.18 -145.6% Bullish RED .217 .58 .797 --------------------------------------------------------------------------------------------- CPER 27.41 -.59 28.87 -264.3% ------- RED .165 .118 .283 --------------------------------------------------------------------------------------------- UUP 26.5 -.01 26.5 -9.5% Bullish ---- .014 .123 .137 --------------------------------------------------------------------------------------------- CORN 26 -.59 26.27 -112% Bullish RED .133 .299 .432 --------------------------------------------------------------------------------------------- WEAT 10.19 -.16 11.11 -965.6% Bullish BLUE .066 .456 .522 --------------------------------------------------------------------------------------------- YINN 3.14 -.79 4.97 -2153.4% Bearish RED -.286 -.541 -.827 --------------------------------------------------------------------------------------------- RSX 5.65 0 5.65 0% Bullish ---- -.359 -.693 -1.052 |
 Table 2   Count of Stocks in Key Directories
           20220314
-------------------------------
NEWHIGHS       68
NEWLOWS        1645
MAXCP          16
MINCP          325
TTTNH          28
TTTNL          145
CPCROSSA       27
CPCROSSD       171
ACCUMVER       7
HIGHIP21       14
HIUPPCT        154
VHIP21         42
LOWACCUM       230
REDSELL        122
AUGSELS7       8
TRAPDOOR       87
|
 Table 3      RANKING OF KEY DIRECTORIES BASED PCT.OF STOCKS ABOVE 65-DMA
              3/14/22
 Bullish = 13
 Bearish = 36
---------------------------------------------------------------------------------------
Directory     Current       day-1         day-2         day-3         day-4         day-5
----------------------------------------------------------------------------------------
COAL           1             1             1             1             1             1
GOLD           .913          .978          .978          .978          1             .934
FOOD           .816          .836          .836          .836          .836          .816
COMODITY       .794          .82           .846          .82           .82           .82
OILGAS         .79           .857          .866          .876          .904          .819
COPPER         .75           .875          1             .875          .875          .875
EDU            .666          .666          .833          .666          .5            .5
UTILITY        .666          .666          .666          .641          .692          .717
MILITARY       .615          .615          .653          .653          .538          .653
HOSPITAL       .562          .562          .562          .625          .625          .5
INSURANC .56 .48 .36 .4 .28 .4 INDMATER .527 .569 .555 .583 .527 .541 INFRA .515 .575 .636 .636 .515 .515 ================================================================================================ CHEM .391 .326 .304 .304 .217 .217 DJI-13 .384 .384 .384 .384 .307 .307 INDEXES .351 .345 .351 .356 .329 .345 SP-100 .322 .322 .355 .344 .288 .355 REGBANKS .32 .28 .24 .24 .16 .16 RETAIL .319 .297 .361 .319 .234 .297 DOWJONES .3 .333 .333 .3 .2 .3 HACKERS .3 .3 .5 .55 .35 .4 REIT .292 .361 .415 .384 .284 .253 FIDSTKS .278 .278 .301 .319 .266 .301 RUS-1000 .275 .293 .334 .324 .278 .281 LOWPRICE .272 .295 .333 .338 .3 .282 SP500 .262 .26 .28 .282 .252 .292 FINANCE .243 .207 .182 .182 .109 .158 SOFTWARE .232 .267 .303 .303 .214 .214 GREEN .21 .263 .263 .263 .315 .21 BIOTECH .197 .222 .269 .274 .203 .195 SOLAR .187 .625 .812 .875 .875 .437 NASD-100 .164 .185 .206 .206 .154 .185 ETFS .163 .2 .2 .236 .145 .163 GAMING .157 .21 .21 .21 .157 .157 TRANSP .157 .315 .315 .263 .157 .263 NIFTY .152 .152 .152 .173 .152 .152 BEVERAGE .142 .142 .071 .142 .071 .142 AUTO .132 .132 .207 .226 .15 .132 CHINA .12 .2 .22 .24 .22 .2 ELECTRON .12 .172 .255 .225 .195 .127 HIGHPRIC .12 .138 .16 .163 .112 .145 SEMI .084 .147 .2 .189 .178 .115 GUNS .076 .153 .153 .23 .153 .153 HOMEBLDG .055 .055 .055 .055 .055 .055 COMPUTER .05 .05 .05 .05 .05 .05 BONDFUND .011 .011 .011 .011 .011 .011 BIGBANKS 0 0 0 0 0 0 JETS 0 0 0 0 0 0 MARIJUAN 0 0 0 0 0 0 |
====================================================================================
3-14-2022 Futures 5:00 AM PCT - DJIA + 340 NASDAQ
+69 Data used through
3/11/2022
|
Our Buy B17 Is Still Trying to Hold The DJI up even though it has dropped more than 10% from its high on very heavy Down Volume. Hedging is preferred to buying DIA. Why are the Futures up? Often their strength is misleading. Have Professionals gotten word that the FED will raise its key rates by the smallest amount possible this week when the FOMC meets? Is the up-coming Producer Price Index expected to halt its advancel? Could Ukraine be about to take the Prime Minister of Israel's advise and accept Putin's 4 terms for peace (neutralization of Ukraine, like Austria, acceptance of Crimea's joining Russia, independence for Donyetsk and Luhansk and a constitutional ban on neo-fascists). Or is the rally going to be another short-lived affair which again will be turned back down by big sellers even before it reaches its rapidly falling 21-dma (AROC is -.99 or -99%, annualized.)? Notice the role of NY Professionals and the Financial Press in supporting the key indexes so that the broad public does not lose confidence in the stock market and realize that most stocks are already in bear markets. The Closing Power's are falling but are far above their recent lows. Watch to see if Professionals are willing today to continue to buy after a very positive opening. The rapidly falling 21-dma and the DJI's price downtrend at 34000 would seem to be real problems for the rising DJI. Just as the last rally quickly failed, so might the current one. The internals on the DJI-30 are mostly quite negative, so any rally to the upper 2% band is apt to generate new Sells. The very weak OBV Line shows that there may not be much follow-through. Volume on up-days has consistently been below down-day volumes. See the table below showing declines by the DJI below its 10%-down-from-the-peak level since 1998 . In all these case our V-I was below -120, as is true now. 75% of these sell-off brought a significant additional decline. Note also the 7:1 ratio of new lows to new highs. Most of the general market is already in a bear market. For most investors, the DJI's strength still is quite mis-leading. Rates have to go up. How much and how fast? The FED will make that a little clearer this coming week. Right now the key ETF's Closing Powers are falling, as is the NYSDE A/D Line. We should stay hedged. The many bearish MINCPs are still falling dangerously. I doubt if the advances in commodities and oil are over. If we are to be guided by the 10% DJI breakdown with falling OBV and an V-I below -130, then we have to set aside the Buy B17s. |
||
|
Charts - 3/11/202 2022 PEERLESS DJI, Signals, Indicators Daily DJI Volume 10-DayUp/Down Vol Stoch-20 Pct of All Stocks above 65-dma Inverted Traders Index Cum. Inverted Traders Index DJI-IPA DJI-OBV NASDAQ S&P OEX NYSE DJI-15 DJI-20 DJI-30 DIA QQQ SPY IWM TNA Short-Term Rates Ten Year Rates DOLLAR-UUP ALLSTOCKs recent 2006 vers-Peerless signals http://tigersoftware.com/NEWPEER/UPD80311.BMP MDY - http://www.tigersoftware.com/CHARTZ/MDY.GIF USO-CrudeOil DBO FAS GLD HD IBB JETS JNUG KOL NUGT OIH PALL RSX RETL SDS AGQ SLV SOXL TAN TECL TLT TMF TNA UGA China: YINN CHAU Commodities: CANE CORN DBC JJC, NIB CORN, CUT (paper) MOO, SOYB WEAT UUP (Dollar) LIT (Lithium) STOCKS: MRNA DIS GE PYPL GME ZOM XLE NRGU AAPL ADBE ALXN AMAT AMGN AMD AMZN AXP BA BABA BAC BIDU BLDP CAT CRM CVX CMG DE ENPH FB GILD GOOG GS HD IBM INTU JPM LRCX MRK MSFT NEM NFLX NKE NVDA PG PYPL REGN REV SO SQ QCOM QDEL TSLA TXN XOM V VRTX WFC WMT ZM Bullish MAXCPs http://tigersoftware.com/UPPER/3-11/BULLISH.htm link corrected Bearish MINCPs http://tigersoftware.com/DOWNER/3-11/BEARISH.htm |
| What
happens to DJI-30 after it closes down more than 10% and the V-I is lower than -100? 9 declines 3 rallies 1 case dropped as not applying - 8/27/1998 - DJI immediately fell from 8166 to 7500 in 3 days. 19% down from peak la/ma= .951 21-dmaAROC=-1.034 P=-570 IP21=-.064 VI=-158 OPMA=-.145 ------------------------------------------------------------------------------------------- 10/15/1999 - Immediate Reversal. Bottom and bull market resumed. la/ma= .961 21-dmaAROC=-0.817 P= -446 IP21= -.098 VI=-146 OPMA=-.238 ---------------------------------------------------------------------------------------------------------------------------- 2/11/2000 - One day recover, then DJI fell from 10425 to 9800 (16.5%) from peak in two weeks. It then rallied back to 11400 after new B17. la/ma= .942 21-dmaAROC=-1.205 P= -243 IP21= -.181 VI=-138 OPMA=-.249 --------------------------------------------------------------------------------------------------------- 10/12/2000 - This was not a yearly high. Probably should not be counted. Bottom. DJI rallied 10% in a week. la/ma= .939 21-dmaAROC=-1.271 P= -433 IP21= -.133 VI= -221 OPMA=-.421 --------------------------------------------------------------------------------------------------------- 8/29/2001 - DJI immediately fell because of 9/11 from 10090.9 to 8236 on 9/21. la/ma= .975 21-dmaAROC=-.496 P= +67 IP21= -.054 VI=-154 OPMA=-.211 ---------------------------------------------------------------------------------------------------------- 6/12/2002 - After small 2-day recovery, DJI fell from 9503 to 7702 in a month, la/ma= .967 21-dmaAROC=-.587 P= -151 IP21= -.015 VI=-246 OPMA=-.139 -------------------------------------------------------------------------------------------------------------------------- 1/8/2008 - After small 2-day recovery, DJI fell 12589 to 11740 in two months, la/ma= .948 21-dmaAROC=-.921 P= -303 IP21= -.175 VI= -316 OPMA= +.114 ----------------------------------------------------------------------------------------------------- 6/25/2008 -. Bear market followed. la/ma= .965 21-dmaAROC= -.715 P= -357 IP21= -.144 VI= -238 OPMA= -.156 ----------------------------------------------------------------------------------------------------- 5/25/2010 - DJI immediately rallied to upper band. la/ma= .942 21-dmaAROC= -1.219 P= -612 IP21= -.032 VI= -523 OPMA= -.372 extreme ------------------------------------------------------------------------------------------------------ 8/4/2011 - DJI immediately fell from 11384 to 9700 in 3 days. la/ma= .920 21-dmaAROC= -1.19 P= -549 IP21= -.204 VI= -331 OPMA= -.430 ------------------------------------------------------------------------------------------------------ 2/8/2018 - DJI immediately rallied to upper band. la/ma= .927 21-dmaAROC= -0.703 P= -371 IP21= -.021 VI= -153 OPMA= + .041 ------------------------------------------------------------------------------------------------------ 12/14/2018 - DJI immediately fell from 24101 to 21792 in 5 days. la/ma= .898 21-dmaAROC= -1.304 P= -609 IP21= -.204 VI= -380 OPMA= - .277 ------------------------------------------------------------------------------------------------------ 2/28/2020 - Brief recovery, then extreme decline. la/ma= .898 21-dmaAROC= -1.221 P= -262 IP21= -.149 VI= -278 OPMA= - .239 |
| 3/7/2022 - Brief
recovery................................................ la/ma= .958 21-dmaAROC= -0.794 P= -292 IP21= -.018 VI= -177 OPMA= - .368 |
 |
 |
 |
 |
 |
Table 1 QUICKSILVER on ETFS - 3/11/2022 Bullish = 6 - GLD OIL/OIH CPER CORN WEAT Bearish = 6 - FAS, RETL, RSX, SOXL, TECL, YINN ETF CLOSE CHANGE PIVOT-PT 5-dma AROC CL-PWR CANDLE IP21 ITRS POWER INDEX ================================================================================================== DIA 330.02 -2.09 328.47 -97.3% Bearish RED -.046 ---- ------ --------------------------------------------------------------------------------------------- SPY 420.07 -5.41 419.43 -142.6% Bearish RED -.054 -.025 -.079 --------------------------------------------------------------------------------------------- QQQ 324.4 -6.87 324.86 -195.2% Bearish RED -.104 -.097 -.201 --------------------------------------------------------------------------------------------- MDY 468.96 -4.93 459.24 -87.7% Bearish RED -.068 0 -.068 --------------------------------------------------------------------------------------------- IWM 196.73 -3.19 193.72 -48.9% Bearish RED -.108 -.022 -.13 --------------------------------------------------------------------------------------------- FAS 100.26 -1.97 95.81 -394.8% Bearish RED -.118 -.147 -.265 --- --------------------------------------------------------------------------------------------- RETL 17.82 -1.54 17.2 -510.9% Bearish RED -.133 -.409 -.542 --- --------------------------------------------------------------------------------------------- SOXL 30.69 -2.06 29.58 -625% Bearish RED -.08 -.472 -.552 --- --------------------------------------------------------------------------------------------- TECL 46.12 -2.56 46.69 -639.2% Bearish RED -.067 -.388 -.455 --- --------------------------------------------------------------------------------------------- IBB 120.65 -2.35 120.62 -78.6% Bearish RED -.112 -.115 -.227 --------------------------------------------------------------------------------------------- GLD 185.09 -1.31 186.41 37.7% Bullish BLUE .364 .193 .557 +++ --------------------------------------------------------------------------------------------- OIL 17.27 .5 18.44 -222.5% Bearish BLUE .132 .352 .484 +++ --------------------------------------------------------------------------------------------- OIH 287.3 -4.33 282.5 461.2% Bullish BLUE .212 .645 .857 +++ --------------------------------------------------------------------------------------------- CPER 28 -.26 28.91 -330.3% ------- RED .172 .134 .306 ++++ --------------------------------------------------------------------------------------------- UUP 26.51 .14 26.55 28.4% Bullish BLUE -.01 .127 .117 --------------------------------------------------------------------------------------------- CORN 26.59 .21 26.59 85.7% Bullish BLUE .138 .306 .444 ++++ --------------------------------------------------------------------------------------------- WEAT 10.35 .34 12.28 -219.8% Bullish BLUE .091 .461 .552 ++++ --------------------------------------------------------------------------------------------- YINN 3.93 -.58 5.19 -1848.2% Bearish RED -.197 -.399 -.596 ---- --------------------------------------------------------------------------------------------- RSX 5.65 0 5.65 0% Bullish ---- -.366 -.69 -1.056 ---- |
Table 2    Count of Stocks in Key Directories
           20220311
-------------------------------
NEWHIGHS       109
NEWLOWS        782
MAXCP          59
MINCP          212
TTTNH          70
TTTNL          118
CPCROSSA       24
CPCROSSD       250
ACCUMVER       11
HIGHIP21       14
HIUPPCT        150
VHIP21         42
LOWACCUM       209
REDSELL        122
AUGSELS7       14
TRAPDOOR       54
|
Table 3       RANKING OF KEY DIRECTORIES BASED PCT.OF STOCKS ABOVE 65-DMA
              3/11/22
 Bullish = 13
 Bearish = 36
---------------------------------------------------------------------------------------
Directory     Current       day-1         day-2         day-3         day-4         day-5
----------------------------------------------------------------------------------------
COAL           1             1             1             1             1             1
GOLD           .978          .978          .978          1             .934          .913
COPPER         .875          1             .875          .875          .875          .875
OILGAS         .857          .866          .876          .904          .819          .857
FOOD           .836          .836          .836          .836          .816          .816
COMODITY       .82           .846          .82           .82           .82           .82
EDU            .666          .833          .666          .5            .5            .833
UTILITY        .666          .666          .641          .692          .717          .666
SOLAR          .625          .812          .875          .875          .437          .312
MILITARY       .615          .653          .653          .538          .653          .692
INFRA .575 .636 .636 .515 .515 .606
INDMATER .569 .555 .583 .527 .541 .611
HOSPITAL .562 .562 .625 .625 .5 .5
================================================================================================
INSURANC .48 .36 .4 .28 .4 .6
DJI-13 .384 .384 .384 .307 .307 .307
REIT .361 .407 .392 .284 .253 .361
INDEXES .345 .351 .356 .329 .345 .362
DOWJONES .333 .333 .3 .2 .3 .333
=====
CHEM .326 .304 .304 .217 .217 .369
SP-100 .322 .355 .344 .288 .355 .388
TRANSP .315 .315 .263 .157 .263 .368
HACKERS .3 .5 .55 .35 .4 .55
LOWPRICE .297 .333 .335 .3 .284 .312
RETAIL .297 .361 .319 .234 .297 .361
RUS-1000 .293 .334 .324 .278 .281 .311
REGBANKS .28 .24 .24 .16 .16 .2
FIDSTKS .278 .301 .319 .266 .301 .337
SOFTWARE .267 .303 .303 .214 .214 .285
GREEN .263 .263 .263 .315 .21 .21
SP500 .26 .28 .28 .252 .294 .354
=====
BIOTECH .222 .269 .274 .203 .192 .217
GAMING .21 .21 .21 .157 .157 .263
FINANCE .207 .182 .182 .109 .158 .243
CHINA .2 .22 .24 .22 .2 .2
ETFS .2 .2 .236 .145 .181 .218
NASD-100 .185 .206 .195 .154 .185 .185
ELECTRON .172 .255 .225 .195 .127 .15
GUNS .153 .153 .23 .153 .153 .23
NIFTY .152 .152 .152 .152 .152 .217
SEMI .147 .2 .189 .178 .115 .147
BEVERAGE .142 .071 .142 .071 .142 .142
HIGHPRIC .138 .16 .163 .112 .145 .181
AUTO .132 .207 .226 .15 .132 .169
HOMEBLDG .055 .055 .055 .055 .055 .166
COMPUTER .05 .05 .05 .05 .05 .1
BONDFUND .011 .011 .011 .011 .011 .022
BIGBANKS 0 0 0 0 0 0
JETS 0 0 0 0 0 .071
MARIJUAN 0 0 0 0 0 0
|
====================================================================================
Friday
10:30 AM PCT DJI
+ 72 NASDAQ -125 Data used
3-10-2022
| Sorry
about posting this so late. The DJI is still trying to hold up above the 10%-down-from the high peak, so that it will not have to be said that it is in "correction" territory. Meanwhile much of the rest of the overall market is in bear market territory, down more than 20% below its peak of the last 12 months. New Lows are more than 7x new highs and the percent of stocks above their 65-dma is about 30%, which is not good. Those stocks that are strong reflect the +7.9% CPI-Inflation we face. Next week, we get to see how much and to what level the FED will post key interest rates. We also see a normal hesitation to rise now because of the uncertainties in the Russian - Ukraine war. Our key charts show down-trending price-trends. With the declining NYSE A/D Line and the rapidly falling 21-day ma, there seems no reason to buy or further reduce our hedged positions. MINCP stocks are still falling by sizeable amounts. |
||
|
Charts - 3/10/202 2022 PEERLESS DJI, Signals, Indicators Daily DJI Volume 10-DayUp/Down Vol Stoch-20 Pct of All Stocks above 65-dma Inverted Traders Index Cum. Inverted Traders Index DJI-IPA DJI-OBV NASDAQ S&P OEX NYSE DJI-15 DJI-20 DJI-30 DIA QQQ SPY IWM TNA Short-Term Rates Ten Year Rates DOLLAR-UUP ALLSTOCKs recent 2006 vers-Peerless signals http://tigersoftware.com/NEWPEER/UPD80310.BMP MDY - http://www.tigersoftware.com/CHARTZ/MDY.GIF USO-CrudeOil DBO FAS GLD HD IBB JETS JNUG KOL NUGT OIH PALL RSX RETL SDS AGQ SLV SOXL TAN TECL TLT TMF TNA UGA China: YINN CHAU Commodities: CANE CORN DBC JJC, NIB CORN, CUT (paper) MOO, SOYB WEAT UUP (Dollar) LIT (Lithium) STOCKS: MRNA DIS GE PYPL GME ZOM XLE NRGU AAPL ADBE ALXN AMAT AMGN AMD AMZN AXP BA BABA BAC BIDU BLDP CAT CRM CVX CMG DE ENPH FB GILD GOOG GS HD IBM INTU JPM LRCX MRK MSFT NEM NFLX NKE NVDA PG PYPL REGN REV SO SQ QCOM QDEL TSLA TXN XOM V VRTX WFC WMT ZM Bullish MAXCPs http://tigersoftware.com/UPPER/3-10/BULLISH.htm Bearish MINCPs http://tigersoftware.com/DOWNER/3-10/BEARISH.htm |
 |
 |
 |
 |
Table 1 QUICKSILVER on ETFS - 3/10/2022 Bullish = 6 - GLD OIL/OIH CPER CORN WEAT Bearish = 6 - FAS, RETL, RSX, SOXL, TECL, YINN ETF CLOSE CHANGE PIVOT-PT 5-dma AROC CL-PWR CANDLE IP21 ITRS POWER INDEX ================================================================================================== DIA 332.11 -1.29 336.47 -90.5% ------- BLUE .007 --------------- --------------------------------------------------------------------------------------------- SPY 425.48 -1.93 432.17 -120% Bearish BLUE .004 -.02 -.016 --------------------------------------------------------------------------------------------- QQQ 331.27 -3.72 337.3 -165.2% Bearish BLUE -.039 -.088 -.127 --------------------------------------------------------------------------------------------- MDY 473.89 .08 477.19 -114.2% Bullish BLUE .025 .006 .031 --------------------------------------------------------------------------------------------- IWM 199.92 -.36 198.66 -48% ------- BLUE -.04 -.015 -.055 --------------------------------------------------------------------------------------------- FAS 102.23 -2.32 108.24 -618.5% Bearish BLUE -.099 -.141 -.24 --------------------------------------------------------------------------------------------- RETL 19.36 0 19.74 -436.6% Bearish BLUE -.014 -.363 -.377 -- --------------------------------------------------------------------------------------------- SOXL 32.75 -2.18 34.77 -714.3% Bearish RED -.017 -.448 -.465 --- --------------------------------------------------------------------------------------------- TECL 48.68 -2.79 52.39 -652.3% Bearish BLUE -.004 -.366 -.37 --- --------------------------------------------------------------------------------------------- IBB 123 -1.26 122.57 -58.8% Bearish BLUE -.023 -.104 -.127 --------------------------------------------------------------------------------------------- GLD 186.4 .58 183.68 150.8% Bullish RED .365 .193 .558 +++ --------------------------------------------------------------------------------------------- OIL 16.77 -.03 18.06 -42.2% Bearish RED .117 .318 .435 +++ --------------------------------------------------------------------------------------------- OIH 291.63 12.68 261.37 701.8% Bullish BLUE .234 .633 .867 +++ --------------------------------------------------------------------------------------------- CPER 28.26 .41 29.9 -162.4% Bullish RED .234 .133 .367 +++ --------------------------------------------------------------------------------------------- UUP 26.37 .13 26.36 39.8% ------- BLUE -.03 .111 .081 --------------------------------------------------------------------------------------------- CORN 26.38 .55 26.14 163% Bullish BLUE .137 .294 .431 +++ --------------------------------------------------------------------------------------------- WEAT 10.01 -.35 10.83 -493.8% ------- RED .071 .412 .483 +++ --------------------------------------------------------------------------------------------- YINN 4.51 -.69 5.83 -1602.3% Bearish RED -.096 -.352 -.448 --- --------------------------------------------------------------------------------------------- RSX 5.65 0 5.65 -123.3% Bullish ---- -.347 -.699 -1.046 --- |
Table 3     RANKING OF KEY DIRECTORIES BASED PCT.OF STOCKS ABOVE 65-DMA
              3/10/22
 Bullish = 13
 Bearish = 35
---------------------------------------------------------------------------------------
Directory     Current       day-1         day-2         day-3         day-4         day-5
----------------------------------------------------------------------------------------
COAL           1             1             1             1             1             1
COPPER         1             .875          .875          .875          .875          .875
GOLD           .978          .978          1             .934          .913          .913
OILGAS         .866          .876          .904          .819          .857          .838
COMODITY       .846          .82           .82           .82           .82           .794
FOOD           .836          .836          .836          .816          .816          .816
EDU            .833          .666          .5            .5            .833          .833
SOLAR          .812          .875          .875          .437          .312          .312
UTILITY        .666          .641          .692          .717          .666          .666
MILITARY       .653          .653          .538          .653          .692          .73
INFRA .636 .636 .515 .515 .606 .606 HOSPITAL .562 .625 .625 .5 .5 .562 INDMATER .555 .583 .527 .541 .611 .638 =============================================================================================== HACKERS .5 .55 .35 .4 .55 .7 =============================================================================================== EIT .407 .384 .292 .253 .376 .338 DJI-13 .384 .384 .307 .307 .307 .307 RETAIL .361 .319 .234 .297 .361 .404 INSURANC .36 .4 .28 .4 .6 .64 SP-100 .355 .344 .288 .355 .4 .4 INDEXES .351 .356 .329 .345 .362 .372 LOWPRICE .335 .335 .297 .284 .315 .32 RUS-1000 .334 .324 .278 .281 .316 .346 DOWJONES .333 .3 .2 .3 .333 .3 TRANSP .315 .263 .157 .263 .421 .315 CHEM .304 .304 .217 .217 .369 .369 SOFTWARE .303 .303 .214 .214 .285 .339 FIDSTKS .301 .319 .266 .301 .343 .396 SP500 .28 .28 .25 .294 .356 .362 BIOTECH .269 .274 .203 .192 .214 .244 GREEN .263 .263 .315 .21 .21 .263 ELECTRON .255 .225 .195 .127 .157 .248 REGBANKS .24 .24 .16 .16 .2 .48 CHINA .22 .24 .22 .2 .2 .24 GAMING .21 .21 .157 .157 .263 .473 AUTO .207 .226 .15 .132 .169 .188 NASD-100 .206 .195 .144 .185 .185 .226 ETFS .2 .236 .145 .181 .236 .254 SEMI .2 .189 .178 .115 .147 .221 FINANCE .182 .182 .109 .158 .243 .341 HIGHPRIC .16 .163 .112 .145 .178 .2 GUNS .153 .23 .153 .153 .23 .307 NIFTY .152 .152 .13 .152 .217 .282 BEVERAGE .071 .142 .071 .142 .142 .357 HOMEBLDG .055 .055 .055 .055 .166 .166 COMPUTER .05 .05 .05 .05 .1 .15 BONDFUND .011 .011 .011 .011 .022 .011 BIGBANKS 0 0 0 0 0 .142 JETS 0 0 0 0 .071 .214 MARIJUAN 0 0 0 0 0 0 |
====================================================================================
Thursday 5:45 AM Futures: DJI -357
NASDAQ-192 ..... Data used 3-9-2022 --
| The break in the
down-trending green Open Powers on our candle-stick charts served to release DIA, SPY, QQQ and the NASDAQ for a big 2%+ jump at Wednesday's opening. The spikes in our Support/Resistance indicators for oil, gold and commodities were the main warning that these could suffer their 10% declines today. But huge jumps (or declines) at the opening that are not followed through with by additional price movements are highly suspect. As you can see from the charts below, the intermediate-term trends of Closing Powers are still falling, as is the key NYSE A/D Line and the DJI could not even bring a follow-through up-opening this morning. There is too much fear that today's CPI number will bring a much bigger jump upwards in the current CPI. Last month's 7.5% number(pct. gain over last 12-months) will be replaced by a much higher number. It did not yet reflect the last month's sharp spike up in Oil or Grains. So, I fear we will see the CPI number will be higher this month. The CPI number that just came out today is 7.9%. It could have been worse. But CPI readings above 6% usually bring bear markets quite quickly because the FED must raise rates to make its bonds attractive and that drives the stock market down. It is this simple, historically. The FED at these times loses its ability to prop us stock prices even in the DJI. So, most likely, the DJI will need now to test its 20% down from its high level and we should stay hedged by shorting some more of our bearish MINCPs. Stay short them as long as their 21-day ma Closing Power trends are down. However, I would sell some of the positions in Gold, Oil and Commodities on a rebound. Let's now see how the markets react to the new CPI number... |
||
|
Charts - 3/9/202 2022 PEERLESS DJI, Signals, Indicators Daily DJI Volume 10-DayUp/Down Vol Stoch-20 Pct of All Stocks above 65-dma Inverted Traders Index Cum. Inverted Traders Index DJI-IPA DJI-OBV NASDAQ S&P OEX NYSE DJI-15 DJI-20 DJI-30 DIA QQQ SPY IWM TNA Short-Term Rates Ten Year Rates DOLLAR-UUP ALLSTOCKs recent 2006 vers-Peerless signals http://tigersoftware.com/NEWPEER/UPD80309.BMP MDY - http://www.tigersoftware.com/CHARTZ/MDY.GIF USO-CrudeOil DBO FAS GLD HD IBB JETS JNUG KOL NUGT OIH PALL RSX RETL SDS AGQ SLV SOXL TAN TECL TLT TMF TNA UGA China: YINN CHAU Commodities: CANE CORN DBC JJC, NIB CORN, CUT (paper) MOO, SOYB WEAT UUP (Dollar) LIT (Lithium) STOCKS: MRNA DIS GE PYPL GME ZOM XLE NRGU AAPL ADBE ALXN AMAT AMGN AMD AMZN AXP BA BABA BAC BIDU BLDP CAT CRM CVX CMG DE ENPH FB GILD GOOG GS HD IBM INTU JPM LRCX MRK MSFT NEM NFLX NKE NVDA PG PYPL REGN REV SO SQ QCOM QDEL TSLA TXN XOM V VRTX WFC WMT ZM Bullish MAXCPs http://tigersoftware.com/UPPER/3-09/BULLISH.htm Bearish MINCPs http://tigersoftware.com/DOWNER/3-09/BEARISH.htm |
Negative 21-dma momentum this low is bearish and suggests rallies will be turned back by falling 21-dma  |
 |
 |
 |
 |
| |
 |
|
 |
 |
 |
 |
 |
 |
Table 1 QUICKSILVER on ETFS - 3/9/2022 Bullish = 6 - GLD OIL/OIH CPER CORN WEAT Bearish = 6 - FAS, RETL, RSX, SOXL, TECL, YINN ETF CLOSE CHANGE PIVOT-PT 5-dma AROC CL-PWR CANDLE IP21 ITRS POWER INDEX ================================================================================================== DIA 333.4 6.87 338.13 -83.9% Bearish BLUE .012 ----- ------ --------------------------------------------------------------------------------------------- SPY 427.41 11.16 435.71 -122.3% Bearish BLUE .002 -.023 -.021 --------------------------------------------------------------------------------------------- QQQ 334.99 11.64 342.26 -182.5% Bearish BLUE -.036 -.088 -.124 --------------------------------------------------------------------------------------------- MDY 473.81 13.11 484.65 -158.1% ------- BLUE .026 0 .026 ------------------------------------------------------------------------------------- -------- IWM 200.28 5.49 201.82 -99.7% ------- BLUE -.039 -.025 -.064 --------------------------------------------------------------------------------------------- FAS 104.55 10.03 115.05 -555.3% Bearish BLUE -.092 -.13 -.222 --------------------------------------------------------------------------------------------- RETL 19.36 1.06 21.03 -627% Bearish ---- -.003 -.377 -.38 --- --------------------------------------------------------------------------------------------- SOXL 34.93 3.77 37.55 -749.2% Bearish BLUE -.015 -.44 -.455 --- --------------------------------------------------------------------------------------------- TECL 51.47 5.48 55.25 -572.4% Bearish BLUE -.016 -.35 -.366 --- --------------------------------------------------------------------------------------------- IBB 124.26 3.94 124.44 -73.7% Bearish BLUE -.033 -.108 -.141 --------------------------------------------------------------------------------------------- GLD 185.82 -5.69 180.8 165.1% Bullish RED .378 .178 .556 +++ --------------------------------------------------------------------------------------------- OIL 16.8 -1.88 16.92 25.3% Bearish RED .122 .318 .44 +++ --------------------------------------------------------------------------------------------- OIH 278.95 -12.23 253.25 487.7% Bullish RED .177 .553 .73 +++ --------------------------------------------------------------------------------------------- CPER 27.85 -1.02 29.2 -111.8% Bullish RED .26 .103 .363 +++ --------------------------------------------------------------------------------------------- UUP 26.24 -.26 26.16 34.2% ------- ---- -.061 .101 .04 --------------------------------------------------------------------------------------------- CORN 25.83 -.44 25.53 111.7% ------- RED .134 .241 .375 +++ --------------------------------------------------------------------------------------------- WEAT 10.36 -.75 11.11 341.3% Bullish RED .095 .422 .517 +++ --------------------------------------------------------------------------------------------- YINN 5.2 .23 6.27 -1343.9% Bearish BLUE -.024 -.296 -.32 --- --------------------------------------------------------------------------------------------- RSX 5.65 0 5.79 -1286.3% Bullish ---- -.331 -.706 -1.037 --- |
 Table 2  Count of Stocks in Key Directories
          20220309
-------------------------------
NEWHIGHS       57
NEWLOWS        264
MAXCP          41
MINCP          41
TTTNH          55
TTTNL          18
CPCROSSA       136
CPCROSSD       51
ACCUMVER       8
HIGHIP21       24
HIUPPCT        143
VHIP21         44
LOWACCUM       223
REDSELL        115
AUGSELS7       10
TRAPDOOR       26
|
 RANKING OF KEY DIRECTORIES BASED PCT.OF STOCKS ABOVE 65-DMA
               3/9/22
 Bullish = 14
 Bearish = 35
---------------------------------------------------------------------------------------
Directory     Current       day-1         day-2         day-3         day-4         day-5
----------------------------------------------------------------------------------------
COAL           1             1             1             1             1             1
GOLD           .978          1             .934          .913          .913          .913
OILGAS         .876          .904          .819          .857          .838          .876
COPPER         .875          .875          .875          .875          .875          .875
SOLAR          .875          .875          .437          .312          .312          .375
FOOD           .836          .836          .816          .816          .816          .816
COMODITY       .82           .82           .82           .82           .794          .794
EDU            .666          .5            .5            .833          .833          .666
MILITARY       .653          .538          .653          .692          .73           .807
UTILITY        .641          .692          .717          .666          .666          .512
INFRA .636 .515 .515 .606 .606 .636 HOSPITAL .625 .625 .5 .5 .562 .562 INDMATER .583 .527 .541 .611 .638 .583 HACKERS .55 .35 .4 .55 .7 .7 ================================================================================================= INSURANC .4 .28 .4 .6 .64 .68 DJI-13 .384 .307 .307 .307 .307 .23 REIT .384 .284 .261 .376 .346 .361 INDEXES .356 .329 .345 .362 .372 .372 SP-100 .344 .288 .355 .4 .411 .4 LOWPRICE .338 .297 .282 .315 .32 .33 RUS-1000 .324 .278 .281 .316 .344 .359 FIDSTKS .319 .266 .301 .343 .396 .408 RETAIL .319 .234 .297 .361 .404 .446 CHEM .304 .217 .217 .369 .369 .434 SOFTWARE .303 .214 .214 .285 .339 .321 DOWJONES .3 .2 .3 .333 .3 .266 SP500 .28 .25 .292 .356 .366 .368 BIOTECH .274 .203 .192 .214 .241 .271 GREEN .263 .315 .21 .21 .263 .315 TRANSP .263 .157 .263 .421 .315 .315 CHINA .24 .22 .2 .2 .24 .26 REGBANKS .24 .16 .16 .2 .48 .52 ETFS .236 .145 .181 .236 .272 .272 GUNS .23 .153 .153 .23 .307 .307 AUTO .226 .15 .132 .169 .188 .207 ELECTRON .225 .195 .127 .157 .248 .278 GAMING .21 .157 .157 .263 .473 .473 NASD-100 .195 .144 .175 .185 .226 .247 SEMI .189 .178 .115 .147 .221 .263 FINANCE .182 .109 .158 .243 .341 .365 HIGHPRIC .163 .112 .145 .178 .2 .218 NIFTY .152 .13 .13 .217 .282 .282 BEVERAGE .142 .071 .142 .142 .357 .357 HOMEBLDG .055 .055 .055 .166 .166 .166 COMPUTER .05 .05 .05 .1 .15 .1 BONDFUND .011 .011 .011 .022 .011 .011 BIGBANKS 0 0 0 0 .142 .142 JETS 0 0 0 .071 .214 .285 MARIJUAN 0 0 0 0 0 0 |
====================================================================================
Wednesday 5:45 AM Futures: DJI +534 NASDAQ+200 .....
Data used 3-8-2021 --
|
Something bullish is on the way. A truce? At this point, the DJI is back
slightly above the 33120 -10%-down-from-its-peak level. Another rally to the DJI's falling 21-day ma seems likely. The 500-point DJI jump is accompanied by a 200-point NASDAQ gain before the opening as traders protect that average from falling below its 20%-down from the highs level. The big jump today was not a complete surprise. There were some noticeable non-confirmations by the P-I and IP21 of the DJI's low on Tuesday. You should also have noticed that there were 95 more up than down on the NYSE despite the DJI sell-off and the ratio of Up Volume to Down Volume was very bullish. Up Volume was 340 million shares above Down Volume. We can see below from the 2010 Peerless chart of the DJI that such bullish non- confirmations in May and again in June and July each brought quick recoveries of about half of what had been lost in the aftermath of the British Petroleum spillage in the Gulf. There are no new Buy signals here, but the judged Sell S10 is voided, since these signals, to be valid, bring sraight-away vertical sell-offs. Assuming the DJI can close above 33120, expect the rally to continue to the DJI's falling 21-day ma resistance, before another decline starts. Even if a truce were to be declared in the fighting, the rising interest rates and inflation would pose a continuing barrier for the bulls now. The uptrends in Gold, Oil and Commodites are still in place. So, my suggestion here is to just hold them and remain hedged with some Bearish MINCPs. Big movements before the opening cannot be trusted. |
||
|
Charts - 3/8/202 2022 PEERLESS DJI, Signals, Indicators Daily DJI Volume 10-DayUp/Down Vol Stoch-20 Pct of All Stocks above 65-dma Inverted Traders Index Cum. Inverted Traders Index DJI-IPA DJI-OBV NASDAQ S&P OEX NYSE DJI-15 DJI-20 DJI-30 DIA QQQ SPY IWM TNA Short-Term Rates Ten Year Rates DOLLAR-UUP ALLSTOCKs recent 2006 vers-Peerless signals http://tigersoftware.com/NEWPEER/UPD80308.BMP MDY - http://www.tigersoftware.com/CHARTZ/MDY.GIF USO-CrudeOil DBO FAS GLD HD IBB JETS JNUG KOL NUGT OIH PALL RSX RETL SDS AGQ SLV SOXL TAN TECL TLT TMF TNA UGA China: YINN CHAU Commodities: CANE CORN DBC JJC, NIB CORN, CUT (paper) MOO, SOYB WEAT UUP (Dollar) LIT (Lithium) STOCKS: MRNA DIS GE PYPL GME ZOM XLE NRGU AAPL ADBE ALXN AMAT AMGN AMD AMZN AXP BA BABA BAC BIDU BLDP CAT CRM CVX CMG DE ENPH FB GILD GOOG GS HD IBM INTU JPM LRCX MRK MSFT NEM NFLX NKE NVDA PG PYPL REGN REV SO SQ QCOM QDEL TSLA TXN XOM V VRTX WFC WMT ZM Bullish MAXCPs http://tigersoftware.com/UPPER/3-08/BULLISH.htm Bearish MINCPs http://tigersoftware.com/DOWNER/3-08/BEARISH.htm |
History - 2010 |
| Current Charts and Tables |
 |
 |
 |
 |
 |
 |
 |
 |
 |
 |
Table 1 QUICKSILVER on ETFS - 3/8/2022 Bullish = 6 - GLD OIL/OIH CPER CORN WEAT Bearish = 6 - FAS, RETL, RSX, SOXL, TECL, YINN ETF CLOSE CHANGE PIVOT-PT 5-dma AROC CL-PWR CANDLE IP21 ITRS POWER INDEX ================================================================================================== DIA 326.53 -1.94 339 -98.9% Bearish RED -.001 ----------- --------------------------------------------------------------------------------------------- SPY 416.25 -3.18 437.89 -159.3% Bearish RED -.029 -.024 -.053 --------------------------------------------------------------------------------------------- QQQ 323.35 -1.51 347.22 -267.8% Bearish RED -.081 -.094 -.175 --------------------------------------------------------------------------------------------- MDY 460.7 1.46 488.8 -162.1% ------- BLUE -.004 -.004 -.008 --------------------------------------------------------------------------------------------- IWM 194.79 1.07 204.24 -117.7% ------- BLUE -.067 -.031 -.098 --------------------------------------------------------------------------------------------- FAS 94.52 -1.29 116.32 -609.4% Bearish RED -.101 -.175 -.276 -- --------------------------------------------------------------------------------------------- RETL 18.3 1.1 21.82 -349.3% Bearish BLUE .013 -.38 -.367 -- --------------------------------------------------------------------------------------------- SOXL 31.16 1.58 40.12 -758.7% Bearish BLUE -.053 -.446 -.499 -- --------------------------------------------------------------------------------------------- TECL 45.99 -.7 57.37 -743.6% Bearish RED -.06 -.368 -.428 -- --------------------------------------------------------------------------------------------- IBB 120.32 -.3 126.07 -205.1% Bearish BLUE -.062 -.131 -.193 --------------------------------------------------------------------------------------------- GLD 191.51 5.1 179.73 271% Bullish BLUE .422 .225 .647 ++ --------------------------------------------------------------------------------------------- OIL 18.68 .24 16.71 697.3% Bullish RED .13 .5 .63 ++ --------------------------------------------------------------------------------------------- OIH 291.18 8.68 252.79 965.8% Bullish BLUE .195 .648 .843 ++ --------------------------------------------------------------------------------------------- CPER 28.87 -.04 28.5 181.9% Bullish BLUE .314 .167 .481 ++ --------------------------------------------------------------------------------------------- UUP 26.5 -.05 26.06 80% ------- ---- -.055 .121 .066 --------------------------------------------------------------------------------------------- CORN 26.27 -.32 25.25 123.9% Bullish BLUE .159 .283 .442 ++ --------------------------------------------------------------------------------------------- WEAT 11.11 -1.17 9.61 798.3% Bullish RED .096 .518 .614 ++ --------------------------------------------------------------------------------------------- YINN 4.97 -.22 6.76 -1551.4% Bearish RED -.079 -.316 -.395 -- --------------------------------------------------------------------------------------------- RSX 5.65 0 7.19 -2005.2% Bullish ---- -.329 -.692 -1.021 -- |
 Table 2    Count of Stocks in Key Directories
               20220308
-------------------------------
NEWHIGHS       160
NEWLOWS        1292
MAXCP          25
MINCP          121
TTTNH          48
TTTNL          61
CPCROSSA       77
CPCROSSD       104
ACCUMVER       5
HIGHIP21       29
HIUPPCT        140
VHIP21         47
LOWACCUM       250
REDSELL        120
AUGSELS7       15
TRAPDOOR       7
|
 Table 3   RANKING OF KEY DIRECTORIES BASED PCT.OF STOCKS ABOVE 65-DMA
              3/8/22
 Bullish = 12
 Bearish = 36
---------------------------------------------------------------------------------------
Directory     Current       day-1         day-2         day-3         day-4         day-5
----------------------------------------------------------------------------------------
COAL           1             1             1             1             1             1
GOLD           1             .934          .913          .913          .913          .913
OILGAS         .904          .819          .857          .838          .876          .847
COPPER         .875          .875          .875          .875          .875          .875
SOLAR          .875          .437          .312          .312          .375          .5
FOOD           .836          .816          .816          .816          .816          .795
COMODITY       .82           .82           .82           .794          .794          .769
UTILITY        .692          .717          .666          .666          .512          .435
HOSPITAL       .625          .5            .5            .562          .562          .562
MILITARY       .538          .653          .692          .73           .807          .73
INDMATER .527 .541 .611 .638 .583 .527 INFRA .515 .515 .606 .606 .636 .515 ================================================================================================== EDU .5 .5 .833 .833 .666 .666 ================================================================================================== HACKERS .35 .4 .55 .7 .7 .5 INDEXES .329 .345 .362 .372 .372 .329 GREEN .315 .21 .21 .263 .315 .21 DJI-13 .307 .307 .307 .307 .23 .23 LOWPRICE .3 .282 .312 .32 .333 .307 SP-100 .288 .355 .4 .411 .4 .266 REIT .284 .253 .384 .346 .353 .223 INSURANC .28 .4 .6 .64 .68 .44 RUS-1000 .278 .281 .316 .344 .356 .268 FIDSTKS .266 .301 .343 .396 .408 .313 SP500 .25 .292 .354 .366 .368 .272 RETAIL .234 .297 .361 .404 .446 .191 CHINA .22 .2 .2 .24 .26 .3 CHEM .217 .217 .369 .369 .413 .217 SOFTWARE .214 .214 .285 .339 .321 .25 BIOTECH .203 .192 .214 .241 .269 .228 DOWJONES .2 .3 .333 .3 .266 .233 ELECTRON .195 .127 .157 .248 .255 .187 SEMI .178 .115 .147 .221 .242 .189 REGBANKS .16 .16 .2 .48 .56 .16 GAMING .157 .157 .263 .473 .473 .315 TRANSP .157 .263 .421 .315 .315 .21 GUNS .153 .153 .23 .307 .307 .23 AUTO .15 .132 .169 .188 .207 .132 ETFS .145 .181 .236 .272 .29 .2 NASD-100 .144 .175 .175 .226 .247 .164 NIFTY .13 .13 .195 .282 .282 .239 HIGHPRIC .112 .145 .178 .2 .218 .167 FINANCE .109 .158 .243 .341 .365 .182 BEVERAGE .071 .142 .142 .357 .357 .285 HOMEBLDG .055 .055 .166 .166 .166 .055 COMPUTER .05 .05 .1 .15 .1 .05 BONDFUND .011 .011 .022 .011 .011 .011 BIGBANKS 0 0 0 .142 .142 0 JETS 0 0 .071 .214 .285 .142 MARIJUAN 0 0 0 0 0 0 |
====================================================================================
Tuesday 6:00 AM Futures: DJI +24 NASDAQ-10 ..... Data used 3-7-2021 --
| The Peerless B17
has failed to hold the DJI above the well-tested support at 33000, which also represents the bottom of a zone of support at the ten-pct. down from its peak level. Many times this zone of support beween 8% and 10% below the DJI's peak turns declines back upwards. But Monday, 33000 was decisively closed below. As we see just below, since 1966 the odds are about 2:1 of a significant further decline. The odds are even higher when the V-I is below -100, but there was not time to show this. There is still a chance of a rally back above 33000, but we need another buy signal or, perhaps, a break in the downtrending A/D Line to become bullish enough to do more buying or even close out some of short positions. In regards to the shorts, note how a very low AI/100 seems to be a very good way to pick out good shorts. For now, I would not take profits in any of the long positions in commodities or oil. The forces driving up interest rates will make it very hard for the FED now to prop up the market. Without their support, a much deep decline in the key indexes seems inevitable. |
||
| What
happens when DJI falls more than 10% from its high? 1966 - 2021 20 Bearish outcomes 10 Bullish Outcomes 5/6/1966 - side wise for 6 weeks, then bear mkt. 2/9/1968 - 3.5% decline over 6 weeks, then strong advance. 6/16/1969 - year-long bear market followed immediately. 8/3/1971 - DJI soon rallied from 840 to 920 top. 3/21/1973 - DJI rallied to upper band, then long bear market. 10/1/1975 - This was bottom. Bull mkt resumed. 5/24/1977 - Small rally (3%) then bear market resumed. 10/27/1978 - DJI rallied from 790 to 830 and built base. 11/17/1979 - This was low. 110-pt. rally began in a month. 3/17/1980 - DJI fell from 790 to 750 low over next week. 8/24/1981 - DJI fell from 900 to 820 over next three weeks. 2/9/1984 - DJI fell from 1153 to 1130 over next week and broke lower after 3 months. 10/14/1987 - DJI fell sharply from 2412 to 1740 in 3 days. 8/16/1990 - DJI fell from 2681 to 2370 in two months. 3/31/1994 - Bottom. DJI rallied from 3580 to 3820 over next two months. 10/27/1997 - Bottom. DJI rallied 8/27/1998 - DJI fell from 8165 to 7500 in two days, then based and began bull mkt. Bottom was 20% below peak. 10/15/1999 - Bottom and bull market resumed, 2/11/2000 - DJI fell from 10425 to 9800 in two weeks but then rallied back to 11400 after new B17. 10/12/2000 - Bottom. DJI rallied 10% in a week. 3/13/2001 - DJI immediately fell 8/30/2001 - DJI immediately fell 6/12/2002 - DJI immediately fell 1/8/2008 - DJI immediately fell 6/26/2008 - DJI went sidewise for 6 weeks. Bear market followed. 5/25/2010 - DJI immediately rallied 8/4/2011 - DJI immediately fell 2/8/2018 - DJI immediately fell 12/17/2018 - DJI immediately fell 2/28/2020 - Two day rally, then extreme decline. |
||
|
Charts - 3/7/202 2022 PEERLESS DJI, Signals, Indicators Daily DJI Volume 10-DayUp/Down Vol Stoch-20 Pct of All Stocks above 65-dma Inverted Traders Index Cum. Inverted Traders Index DJI-IPA DJI-OBV NASDAQ S&P OEX NYSE DJI-15 DJI-20 DJI-30 DIA QQQ SPY IWM TNA Short-Term Rates Ten Year Rates DOLLAR-UUP ALLSTOCKs recent 2006 vers-Peerless signals http://tigersoftware.com/NEWPEER/UPD80307.BMP MDY - http://www.tigersoftware.com/CHARTZ/MDY.GIF USO-CrudeOil DBO FAS GLD HD IBB JETS JNUG KOL NUGT OIH PALL RSX RETL SDS AGQ SLV SOXL TAN TECL TLT TMF TNA UGA China: YINN CHAU Commodities: CANE CORN DBC JJC, NIB CORN, CUT (paper) MOO, SOYB WEAT UUP (Dollar) LIT (Lithium) STOCKS: MRNA DIS GE PYPL GME ZOM XLE NRGU AAPL ADBE ALXN AMAT AMGN AMD AMZN AXP BA BABA BAC BIDU BLDP CAT CRM CVX CMG DE ENPH FB GILD GOOG GS HD IBM INTU JPM LRCX MRK MSFT NEM NFLX NKE NVDA PG PYPL REGN REV SO SQ QCOM QDEL TSLA TXN XOM V VRTX WFC WMT ZM Bullish MAXCPs http://tigersoftware.com/UPPER/3-07/BULLISH.htm Bearish MINCPs http://tigersoftware.com/DOWNER/3-07/BEARISH.htm |
 |
 |
 |
 |
 |
 |
 |
 |
Table 1 QUICKSILVER on ETFS - 3/4/2022 Bullish = 5 - GLD OIL/OIH CPER CORN WEAT Bearish = 5 - RETL, RSX, SOXL, TECL, YINN ETF CLOSE CHANGE PIVOT-PT 5-dma AROC CL-PWR CANDLE IP21 ITRS POWER INDEX ================================================================================================== DIA 328.47 -8 333.16 -161.2% Bearish RED .054 0 .054 --------------------------------------------------------------------------------------------- SPY 419.43 -12.74 429.98 -197.9% Bearish RED .028 -.022 .006 --------------------------------------------------------------------------------------------- QQQ 324.86 -12.44 341.49 -319.8% Bearish RED -.033 -.094 -.127 --------------------------------------------------------------------------------------------- MDY 459.24 -17.95 476.17 -271.5% ------- RED .028 -.011 .017 --------------------------------------------------------------------------------------------- IWM 193.72 -4.94 199.49 -238.2% ------- RED -.017 -.04 -.057 --------------------------------------------------------------------------------------------- FAS 95.81 -12.43 107.76 -1095% Bearish RED -.041 -.161 -.202 --------------------------------------------------------------------------------------------- RETL 17.2 -2.54 19.69 -989.6% Bearish RED .062 -.41 -.348 Bearish --------------------------------------------------------------------------------------------- SOXL 29.58 -5.19 36.58 -1503.7% Bearish RED -.033 -.467 -.5 Bearish --------------------------------------------------------------------------------------------- TECL 46.69 -5.7 53.89 -963% Bearish RED -.028 -.361 -.389 Bearish --------------------------------------------------------------------------------------------- IBB 120.62 -1.95 125.4 -218.2% Bearish RED -.025 -.135 -.16 --------------------------------------------------------------------------------------------- GLD 186.41 2.73 181.62 222% Bullish BLUE .445 .187 .632 Bullish --------------------------------------------------------------------------------------------- OIH 282.5 21.13 241.3 683.3% Bullish BLUE .253 .592 .845 Bullish --------------------------------------------------------------------------------------------- CPER 28.91 -.99 27.82 264.3% Bullish ---- .317 .16 .477 Bullish --------------------------------------------------------------------------------------------- UUP 26.55 .19 26.08 128.3% ------- BLUE -.109 .112 .003 --------------------------------------------------------------------------------------------- CORN 26.59 .45 25.63 395.3% Bullish BLUE .142 .295 .437 Bullish --------------------------------------------------------------------------------------------- WEAT 12.28 1.45 9.41 1726.9% Bullish BLUE .095 .663 .758 Bullish --------------------------------------------------------------------------------------------- YINN 5.19 -.64 6.89 -1331.1% Bearish RED -.045 -.298 -.343 Bearish --------------------------------------------------------------------------------------------- RSX 5.65 0 8.26 -3444.6% Bullish ---- -.323 -.704 -1.027 Bearish |
 Table 2   Count of Stocks in Key Directories
          20220307
-------------------------------
NEWHIGHS       261
NEWLOWS        1289
MAXCP          96
MINCP          269
TTTNH          85
TTTNL          179
CPCROSSA       37
CPCROSSD       369
ACCUMVER       11
HIGHIP21       42
HIUPPCT        137
VHIP21         47
LOWACCUM       239
REDSELL        123
AUGSELS7       16
TRAPDOOR       104
|
 RANKING OF KEY DIRECTORIES BASED PCT.OF STOCKS ABOVE 65-DMA
               3/7/22
 Bullish = 10
 Bearish = 37
---------------------------------------------------------------------------------------
Directory     Current       day-1         day-2         day-3         day-4         day-5
----------------------------------------------------------------------------------------
COAL           1             1             1             1             1             1
GOLD           .934          .913          .913          .913          .913          .782
COPPER         .875          .875          .875          .875          .875          .875
COMODITY       .82           .82           .794          .794          .769          .769
OILGAS         .819          .857          .838          .876          .847          .838
FOOD .816 .816 .816 .816 .795 .775 UTILITY .717 .666 .666 .512 .435 .435 MILITARY .653 .692 .73 .807 .73 .807 INDMATER .541 .611 .638 .583 .541 .527 INFRA .515 .606 .606 .636 .515 .575 =============================================================================================== EDU .5 .833 .833 .666 .666 .666 HOSPITAL .5 .5 .562 .562 .562 .562 =============================================================================================== SOLAR .437 .312 .312 .375 .5 .375 INSURANC .4 .6 .64 .68 .44 .72 HACKERS .368 .526 .684 .684 .473 .631 SP-100 .355 .4 .411 .4 .277 .4 INDEXES .345 .362 .372 .372 .329 .362 DJI-13 .307 .307 .307 .23 .23 .23 FIDSTKS .301 .343 .396 .408 .319 .449 DOWJONES .3 .333 .3 .266 .233 .3 RETAIL .297 .361 .404 .446 .212 .255 SP500 .292 .354 .364 .368 .272 .36 LOWPRICE .284 .312 .318 .333 .307 .297 RUS-1000 .281 .316 .344 .356 .27 .326 TRANSP .263 .421 .315 .315 .21 .526 REIT .253 .376 .353 .353 .238 .276 CHEM .217 .369 .369 .413 .217 .347 SOFTWARE .214 .285 .339 .321 .25 .303 GREEN .21 .21 .263 .315 .21 .21 CHINA .2 .2 .24 .26 .3 .28 BIOTECH .192 .214 .241 .269 .222 .217 ETFS .181 .236 .272 .29 .218 .254 NASD-100 .175 .175 .216 .247 .164 .216 REGBANKS .16 .2 .48 .56 .2 .56 FINANCE .158 .243 .341 .365 .195 .512 GAMING .157 .263 .473 .473 .315 .526 GUNS .153 .23 .307 .307 .23 .23 HIGHPRIC .145 .178 .2 .218 .163 .196 BEVERAGE .142 .142 .357 .357 .285 .357 AUTO .132 .169 .188 .207 .132 .169 NIFTY .13 .195 .26 .282 .239 .282 ELECTRON .127 .157 .248 .255 .187 .248 SEMI .115 .147 .221 .242 .189 .221 HOMEBLDG .055 .166 .166 .166 .055 .055 COMPUTER .05 .1 .15 .1 .05 .15 BONDFUND .011 .022 .011 .011 .011 .011 BIGBANKS 0 0 .142 .142 0 .285 JETS 0 .071 .214 .285 .142 .642 MARIJUAN 0 0 0 0 0 0 |
===================================================================================
Monday
5:00 AM Futures: DJI -238 NASDAQ -100 ..... Data used 3-4-2021 --
| The now
active Buy B17 reminds us that rallies can occur after very scary declines end. But that will be asking a lot now. Being hedged is much safer and will let you sleep a lot easier. There's no denying the potential weakness in the market now. When I began writing this at 3:00 AM - PCT, the DJI was down almost 600 and well below the well-tested horizontal support at 33100, 10% down from its highs. A close below 33000 would have to be judged a Sell S10. The round number of 30000 has additional psychological significance. The DJI has fought hard to hold up, but the technical and fundamental stresses on it are probably just too great. Even if Putin were stop his Russian invasion of the Ukraine, the next CPI number will be much higher than its last number, 7.1% for the year. Crude Oil, Commodities, Precious Metals...they are all zooming up now. As a result, the FED will have no choice but to withdraw its artificial support for the market via very low short-term rates. For a while, traders may assume buying the DJI in here will again work out. But without FED support, such buying will be risky except for the most nimble. All this drama comes with the DJI very elevated and especially vulnerable because of how far behind the "inflation curve" the FED is. My historical studies of what moves the DJI shows clearly that the market just cannot escape the negative effects of a big rise in interest rates. (Use Google. Find the TigerSoft charts of 1920-1921, 1919-1933, 1937-1938, 1957, 1966, 1969-1970, 1973-1974, 1977, 1987, 2000- 2003, 2007-2009, 2018...) Apart from price controls, which have been used in war-time and by Nixon in 1971 when he took the dollar off of Gold, there is no other choice, short of nationalization. (This was ruled unconsititutional when Truman attempted it of steel during the Korean War and allowed when Wilson did it of railroads in 1917.) It is the speed of the decline that I worry about when it comes. Traders now have numerous leveraged negative ETFs to buy without the need for up-ticks. A decline to a point 20% below the DJI's recent highs seems a "given" once 33000 is closed below, considering just how over-extended the DJI is compared to the rest of the market. If Professionals, as judged by our Closing Powers, switch to shorting the market instead of buying it, the scene on Wall Street will get particularly ugly and frightening. True, we still have a Buy B17, but volatility is too high for most of us. And unless Professionals keep supporting the market at 33000, our bold B17 may well be blown away this week or next. This why we have warned about the need to be short some of our bearish MINCPs and long long Crude Oil and Commodities. As long as their price and Closing uptrends are in place, stay with these hedges. The next big decline will probably bring to an end the long bullish period -1982 to 2022. If we are lucky, it will not be replaced by something resembling the 1930s. Instead, we will revisit the 1970s. This was when Peerless did especially well. |
||
|
Charts - 3/4/202 2022 PEERLESS DJI, Signals, Indicators Daily DJI Volume 10-DayUp/Down Vol Stoch-20 Pct of All Stocks above 65-dma Inverted Traders Index Cum. Inverted Traders Index DJI-IPA DJI-OBV NASDAQ S&P OEX NYSE DJI-15 DJI-20 DJI-30 DIA QQQ SPY IWM TNA Short-Term Rates Ten Year Rates DOLLAR-UUP ALLSTOCKs recent 2006 vers-Peerless signals http://tigersoftware.com/NEWPEER/UPD80304.BMP MDY - http://www.tigersoftware.com/CHARTZ/MDY.GIF USO-CrudeOil DBO FAS GLD HD IBB JETS JNUG KOL NUGT OIH PALL RSX RETL SDS AGQ SLV SOXL TAN TECL TLT TMF TNA UGA China: YINN CHAU Commodities: CANE CORN DBC JJC, NIB CORN, CUT (paper) MOO, SOYB WEAT UUP (Dollar) LIT (Lithium) STOCKS: MRNA DIS GE PYPL GME ZOM XLE NRGU AAPL ADBE ALXN AMAT AMGN AMD AMZN AXP BA BABA BAC BIDU BLDP CAT CRM CVX CMG DE ENPH FB GILD GOOG GS HD IBM INTU JPM LRCX MRK MSFT NEM NFLX NKE NVDA PG PYPL REGN REV SO SQ QCOM QDEL TSLA TXN XOM V VRTX WFC WMT ZM Bullish MAXCPs http://tigersoftware.com/UPPER/3-04/BULLISH.htm Bearish MINCPs http://tigersoftware.com/DOWNER/3-04/BEARISH.htm |
|
The sanctions against Russia are putting pressure on Putin to end his attack. If peace were imminent, I would think RSX would be rallying. RSX is a measure of how likely peace now seems.  --------------------------------------------------------------------------------------------------------------------------- DJI-33000 must be considered important support. The next support is down at 32000. The V-I score of -.171 shows that heavy bg-money selling continues. DIA's chart shows Professionals, presumably with the encouragement of the FE, are still propping up the DJI-30, but seem to have given up on the QQQ, TECL and SOXL.  |
|
Openings have been very weak because of overseas selling. Can NY Professionals hold the DJI up? So far, CP has held up..  |
 |
 |
 |
 |
|
A US embargo on Russian oil has a dangerous precedent. The stopping of exports of Oil is what drove the Japanese to accack the US at Pearl Harbor. If Russia cannot sell its oil, it may become desperate. But Putin seems willing for Russia to try economic independence (Autarchy). Oil spiked up sharply between the Fall of 1973 and April 1974 because of OPEC. Let us watch to see what OPEC does in our era. .  |
|
The supply of commodities is extremely inelastic. Ukraine is normally a bread-basket for many Europeons. Watch to see if bread's price goes up as a result in America. Food commodities do periodicallt spike upwards very dramatically. Stay long the steep uptrend in prices.  |
|
How will the FED deal with the next CPI report? Recently, they are delaying raising rates.  |
|
PYPL is used a lot by Russian businesses in taking orders from US. With PYPL ending operations in Russia, their earnings will be hit significantly.  |
|
Among our Bearish MINCPs are stocks whose current Accumulation Index has been negative for at least 100 trading days. This is quie bearish. Insiders show no interest in supporting their stock. These usually make very good short-sales, especially when their current IP21 (AI) is below its 21-dma and its Closing Power is in a downtrend.  |
 |
 |
 |
Table 1 QUICKSILVER on ETFS - 3/4/2022 Bullish = 5 - GLD OIL/OIH CPER CORN WEAT Bearish = 3 - RETL, RSX, SOXL, TECL ETF CLOSE CHANGE PIVOT-PT 5-dma AROC CL-PWR CANDLE IP21 ITRS POWER INDEX ================================================================================================== DIA 336.47 -1.66 339.34 -60.2% ------- BLUE .046 ---- ------- --------------------------------------------------------------------------------------------- SPY 432.17 -3.54 436.63 -64.1% ------- BLUE .046 -.015 .031 --------------------------------------------------------------------------------------------- QQQ 337.3 -4.96 346.8 -122.9% Bearish RED -.023 -.081 -.104 --------------------------------------------------------------------------------------------- MDY 477.19 -7.46 485.44 -87.6% Bullish RED .033 .005 .038 --------------------------------------------------------------------------------------------- IWM 198.66 -3.16 203.32 -94.9% ------- RED -.005 -.038 -.043 --------------------------------------------------------------------------------------------- FAS 108.24 -6.81 120.69 -706.9% ------- RED .009 -.075 -.066 --------------------------------------------------------------------------------------------- RETL 19.74 -1.29 21.3 -394.3% Bearish RED .055 -.361 -.306 Bearish --------------------------------------------------------------------------------------------- SOXL 34.77 -2.78 41.01 -889.4% Bearish RED -.009 -.4 -.409 Bearish --------------------------------------------------------------------------------------------- TECL 52.39 -2.86 57.33 -467.2% Bearish RED .018 -.297 -.279 Bearish --------------------------------------------------------------------------------------------- IBB 122.57 -1.87 126.07 -148% Bearish RED -.037 -.152 -.189 --------------------------------------------------------------------------------------------- GLD 183.68 2.88 178.38 198.7% ------- BLUE .424 .152 .576 Bullish --------------------------------------------------------------------------------------------- OIH 261.37 8.12 248.15 382.1% Bullish BLUE .222 .456 .678 Bullish --------------------------------------------------------------------------------------------- CPER 29.9 .7 27.4 438.2% Bullish BLUE .26 .178 .438 Bullish --------------------------------------------------------------------------------------------- UUP 26.36 .2 25.88 100% Bearish RED -.117 .072 -.045 --------------------------------------------------------------------------------------------- CORN 26.14 .61 24.58 554.8% ------- RED .04 .257 .297 Bullish --------------------------------------------------------------------------------------------- WEAT 10.83 -.28 8.84 1444.4% Bullish RED -.042 .477 .435 Bullish --------------------------------------------------------------------------------------------- YINN 5.83 -.44 6.93 -977.7% ------- RED .025 -.254 -.229 --------------------------------------------------------------------------------------------- RSX 5.65 -.14 10.85 -5216% Bearish BLUE -.32 -.731 -1.051 Bearish |
Table 2 Count of Stocks in Key Directories
20220304
-------------------------------
NEWHIGHS 201
NEWLOWS 814
MAXCP 171
MINCP 88
TTTNH 87
TTTNL 78
CPCROSSA 52
CPCROSSD 122
ACCUMVER 6
HIGHIP21 33
HIUPPCT 132
VHIP21 47
LOWACCUM 213
REDSELL 125
AUGSELS7 14
TRAPDOOR 26
|
 Table 3   RANKING OF KEY DIRECTORIES BASED PCT.OF STOCKS ABOVE 65-DMA
 Bullish = 13
 Bearish = 35
              3/4/22
---------------------------------------------------------------------------------------
Directory     Current       day-1         day-2         day-3         day-4         day-5
----------------------------------------------------------------------------------------
COAL           1             1             1             1             1             1
GOLD           .913          .913          .913          .913          .782          .76
COPPER         .875          .875          .875          .875          .875          .875
OILGAS         .857          .838          .876          .847          .838          .819
EDU            .833          .833          .666          .666          .666          .666
COMODITY       .82           .794          .794          .769          .769          .794
FOOD           .816          .816          .816          .795          .775          .795
MILITARY       .692          .73           .807          .73           .807          .73
UTILITY        .666          .666          .512          .435          .435          .435
INDMATER       .611          .638          .583          .541          .527          .513
INFRA .606 .606 .636 .515 .545 .515 INSURANC .6 .64 .68 .44 .72 .76 HACKERS .526 .684 .684 .473 .631 .578 =============================================================================================== HOSPITAL .5 .562 .562 .562 .562 .625 =============================================================================================== TRANSP .421 .315 .315 .21 .473 .421 SP-100 .4 .411 .4 .277 .4 .422 REIT .376 .346 .361 .238 .276 .315 CHEM .369 .369 .413 .217 .347 .347 INDEXES .362 .372 .372 .329 .362 .356 RETAIL .361 .404 .446 .212 .255 .297 SP500 .354 .364 .366 .272 .358 .388 FIDSTKS .343 .396 .408 .319 .449 .473 DOWJONES .333 .3 .266 .233 .3 .366 RUS-1000 .316 .344 .356 .27 .326 .329 LOWPRICE .315 .318 .33 .307 .3 .262 SOLAR .312 .312 .375 .5 .375 .125 DJI-13 .307 .307 .23 .23 .23 .23 SOFTWARE .285 .339 .321 .25 .303 .267 GAMING .263 .473 .473 .315 .526 .578 FINANCE .243 .341 .365 .195 .512 .597 ETFS .236 .272 .29 .218 .272 .29 GUNS .23 .307 .307 .23 .23 .307 BIOTECH .214 .241 .269 .222 .214 .208 GREEN .21 .263 .315 .21 .21 .105 CHINA .2 .24 .26 .3 .28 .24 REGBANKS .2 .48 .56 .2 .52 .48 NIFTY .195 .26 .26 .239 .282 .282 HIGHPRIC .178 .2 .218 .163 .196 .185 NASD-100 .175 .216 .237 .164 .206 .206 AUTO .169 .188 .207 .132 .169 .132 HOMEBLDG .166 .166 .166 .055 .055 .111 ELECTRON .157 .248 .255 .187 .24 .255 SEMI .147 .221 .242 .189 .21 .252 BEVERAGE .142 .357 .357 .285 .357 .428 COMPUTER .1 .15 .1 .05 .15 .1 JETS .071 .214 .285 .142 .571 .714 BONDFUND .022 .011 .011 .011 .011 0 BIGBANKS 0 .142 .142 0 .285 .285 MARIJUAN 0 0 0 0 0 0 |
====================================================================================
5:15 AM 3/4/2022 DJI -197 NASDAQ -60 Data used 3-3-2021 --
| The NASDAQ's recent lows look like they may
again be challenged. Given how far the DJI has risen under near ideal circumstances and falling interest rates since August 1982 (877 - 37800), hedging has to be advised even with Peerless on a Buy B17. The DJI will be showing remarkable strength if it can be propped up much longer without dropping below 33000, a little more than 10% down from the peak. The broader market is much weaker. There were 3x more new lows than new highs. A weaker than expected Jobs report this morning will be scary because traders should see that the FED's raising rates when unemployment is rising is reminiscent of mid 1929. A better than expected Jobs report, on the other hand, will invite the Fed to risk raising rates even faster. Technically, the market conspicuously failed to build on yesterday's rally. There were 500 more down than up Thirsday and our key ETFs' Closing Powers instead of breaking out, broke down below their rising uptrends. Powell's praise of former Fed Chairman Paul Volcker for his successful conquering the inflation of the 1970s and early 1980s - which also saw super high oil prices - scared traders. Powell talks of a 1/2% rate hike in March, presumably to 2%, as though he is another Volcker in the making. Powell also spoke of the Russian invasion of the Ukraine making inflation much worse. He also said that he would seek to be gentle with the tightening so as not to cause 10% as Volcker did. But the Fear of Inflation and much higher interest rates makes it very difficult for Professionals in NY to want to hold up the DJI at this time. American financial history shows war, inflation and 6% rates led to a particularly deep decline in stocks in 1920-1921. Only after inflation was beaten with 10%-15% unemployment in 1921, did the booming 1920s begin. Stocks rose in the 1920s because inflation was low, Labor was silenced, taxes went down, Goverment regulation from the war years was halted and oil and coal prices fell year after year. This was an ideal time to be a long-term investor. "Buy and holders" profited in the 1980s for the basically the same reasons that they did so well in the 1920s. Inflation fell, the Dollar was strong, and de-regulation was promoted as union membership fell sharply. In fact, a second decade of steady stock growth occurred in the 1990s. But as in 1928-1929, the years 1999-2000 saw speculation go wild. This finally brought about deliberate Federal Reserve raising of rates. As a result the speculative bubble abruptly burst in 2000. In a similar way, Powell's FED has created a wild uptrend in stocks in 2021- early 2022, just as they did in 1927-1929. Only when it was obvious that there was too much debt, speculation and inflation have they changed courses. Now, in raising rates, Powell risks another decline from a record high diving board. This does not appear to be good time to be a long term investor. Hedging by shorting our bearish MINCPs that break price support and show heavy red distribution is a good way to make money even as the market as measured by the DJI tries to hold up. The Inflation has made Wheat and Crude Oil particularly bullish just as they were in late 1972-1974. Look also for Bullish MAXCP stocks that show intense Accumulation well above +.375. Our 2006 study of explosive super stocks established that having an IP21 score above +.45 and high volume on a breakout often led to the biggest gainers over the for next year. |
||
|
Charts - 3/3/202 2022 PEERLESS DJI, Signals, Indicators Daily DJI Volume 10-DayUp/Down Vol Stoch-20 Pct of All Stocks above 65-dma Inverted Traders Index Cum. Inverted Traders Index DJI-IPA DJI-OBV NASDAQ S&P OEX NYSE DJI-15 DJI-20 DJI-30 DIA QQQ SPY IWM TNA Short-Term Rates Ten Year Rates DOLLAR-UUP ALLSTOCKs recent 2006 vers-Peerless signals http://tigersoftware.com/NEWPEER/UPD80303.BMP MDY - http://www.tigersoftware.com/CHARTZ/MDY.GIF USO-CrudeOil DBO FAS GLD HD IBB JETS JNUG KOL NUGT OIH PALL RSX RETL SDS AGQ SLV SOXL TAN TECL TLT TMF TNA UGA China: YINN CHAU Commodities: CANE CORN DBC JJC, NIB CORN, CUT (paper) MOO, SOYB WEAT UUP (Dollar) LIT (Lithium) STOCKS: MRNA DIS GE PYPL GME ZOM XLE NRGU AAPL ADBE ALXN AMAT AMGN AMD AMZN AXP BA BABA BAC BIDU BLDP CAT CRM CVX CMG DE ENPH FB GILD GOOG GS HD IBM INTU JPM LRCX MRK MSFT NEM NFLX NKE NVDA PG PYPL REGN REV SO SQ QCOM QDEL TSLA TXN XOM V VRTX WFC WMT ZM Bullish MAXCPs http://tigersoftware.com/UPPER/3-03/BULLISH.htm Bearish MINCPs http://tigersoftware.com/DOWNER/3-03/BEARISH.htm |
|
Count of Operative RED Optimized Buys and Sells Group Buy Sells New Buys New Sells ========================================================== Dow Jones-30 18 10 1 1 SP-500 (499) 294 182 10 13 NASDAQ-100(97) 53 39 0 5 TIGER HL STKS (124) 64 49 1 10 |
 |
 |
 |
 |
 |
 |
 |
 |
 |
Table 1 QUICKSILVER on ETFS - 3/2/2022 Bullish = 5 - GLD OIL/OIH CPER CORN WEAT Bearish = 3 - RETL, RSX, SOXL ETF CLOSE CHANGE PIVOT-PT 5-dma AROC CL-PWR CANDLE IP21 ITRS POWER INDEX ================================================================================================== DIA 338.13 -.87 340.54 85.9% ------- RED .051 ----- ----- --------------------------------------------------------------------------------------------- SPY 435.71 -2.18 437.75 85.3% Bullish RED .053 -.01 .043 --------------------------------------------------------------------------------------------- QQQ 342.26 -4.96 345.77 25.7% Bearish RED .01 -.069 -.059 --------------------------------------------------------------------------------------------- MDY 484.65 -4.15 485.67 128% Bullish RED .037 .025 .062 --------------------------------------------------------------------------------------------- IWM 201.82 -2.42 202.5 93.8% ------- RED -.006 -.017 -.023 --------------------------------------------------------------------------------------------- FAS 115.05 -1.27 124.77 33.8% ------- RED -.007 .015 .008 --------------------------------------------------------------------------------------------- RETL 21.03 -.79 21.4 165% Bearish RED .033 -.284 -.251 Bearish --------------------------------------------------------------------------------------------- SOXL 37.55 -2.57 41.78 -299.6% ------- RED .046 -.316 -.27 Bearish --------------------------------------------------------------------------------------------- TECL 55.25 -2.12 57.65 -4.4% Bearish RED .076 -.23 -.154 --------------------------------------------------------------------------------------------- IBB 124.44 -1.63 126.29 -6% Bearish RED -.012 -.155 -.167 --------------------------------------------------------------------------------------------- GLD 180.8 1.07 176.55 102.4% ------- BLUE .399 .114 .513 Bullish --------------------------------------------------------------------------------------------- OIL 16.92 .21 15.72 345.4% ------- BLUE .062 .368 .43 Bullish --------------------------------------------------------------------------------------------- CPER 29.2 .7 27.44 317.5% Bullish BLUE .281 .144 .425 Bullish --------------------------------------------------------------------------------------------- UUP 26.16 .1 25.84 36.6% Bearish ---- -.085 .043 -.042 --------------------------------------------------------------------------------------------- CORN 25.53 .28 23.38 208.8% ------- BLUE .128 .219 .347 Bullish --------------------------------------------------------------------------------------------- WEAT 11.11 1.5 8.11 1272.3% Bullish BLUE .218 .523 .741 Bullish --------------------------------------------------------------------------------------------- YINN 6.27 -.49 7.16 -567.5% Bearish RED .053 -.154 -.101 --------------------------------------------------------------------------------------------- RSX 5.79 -1.4 15.6 -4189.2% Bearish RED -.337 -.745 -1.082 Bearish |
Table 2    Count of Stocks in Key Directories
           20220303
-------------------------------
NEWHIGHS       153
NEWLOWS        440
MAXCP          82
MINCP          44
TTTNH          47
TTTNL          29
CPCROSSA       24
CPCROSSD       262
ACCUMVER       7
HIGHIP21       23
HIUPPCT        127
VHIP21         42
LOWACCUM       213
REDSELL        126
AUGSELS7       17
TRAPDOOR       32
|
 RANKING OF KEY DIRECTORIES BASED PCT.OF STOCKS ABOVE 65-DMA
              3/3/22
Bullish = 14
Bearish = 35
---------------------------------------------------------------------------------------
Directory     Current       day-1         day-2         day-3         day-4         day-5
----------------------------------------------------------------------------------------
COAL           1             1             1             1             1             1
GOLD           .913          .913          .913          .782          .76           .739
COPPER         .875          .875          .875          .875          .875          .875
OILGAS         .838          .876          .847          .838          .819          .771
EDU            .833          .666          .666          .666          .666          .5
FOOD           .816          .816          .795          .775          .795          .795
COMODITY       .794          .794          .769          .769          .794          .769
MILITARY       .73           .807          .73           .807          .73           .653
HACKERS        .684          .684          .473          .631          .578          .368
UTILITY        .666          .512          .435          .435          .435          .256
INSURANC .64 .68 .44 .72 .76 .44 INDMATER .638 .583 .541 .527 .513 .43 INFRA .606 .636 .515 .545 .545 .424 HOSPITAL .562 .562 .562 .562 .625 .5 ============================================================================================== REGBANKS .48 .56 .2 .52 .48 .12 GAMING .473 .473 .315 .526 .578 .473 SP-100 .411 .4 .277 .4 .422 .333 RETAIL .404 .446 .212 .255 .276 .17 FIDSTKS .396 .408 .319 .449 .479 .36 INDEXES .372 .372 .329 .362 .356 .318 CHEM .369 .413 .217 .347 .347 .239 SP500 .364 .366 .27 .358 .39 .27 BEVERAGE .357 .357 .285 .357 .428 .285 REIT .346 .353 .246 .276 .307 .2 RUS-1000 .344 .356 .27 .326 .326 .253 FINANCE .341 .365 .195 .512 .585 .378 SOFTWARE .339 .321 .25 .303 .267 .25 LOWPRICE .32 .33 .305 .3 .264 .254 TRANSP .315 .315 .21 .473 .473 .368 SOLAR .312 .375 .5 .375 .125 .062 DJI-13 .307 .23 .23 .23 .23 .076 GUNS .307 .307 .23 .23 .307 .153 DOWJONES .3 .266 .233 .3 .366 .266 ETFS .272 .29 .218 .272 .29 .2 GREEN .263 .315 .21 .21 .105 .105 NIFTY .26 .26 .217 .282 .282 .217 ELECTRON .248 .255 .187 .24 .263 .157 BIOTECH .241 .269 .222 .214 .206 .184 CHINA .24 .26 .3 .28 .24 .24 SEMI .221 .242 .189 .21 .252 .168 NASD-100 .216 .237 .154 .206 .216 .154 JETS .214 .285 .142 .571 .714 .642 HIGHPRIC .2 .218 .163 .196 .185 .127 AUTO .188 .207 .132 .169 .132 .132 HOMEBLDG .166 .166 .055 .055 .055 .055 COMPUTER .15 .1 .05 .15 .1 .05 BIGBANKS .142 .142 0 .285 .285 .285 BONDFUND .011 .011 .011 .011 0 0 MARIJUAN 0 0 0 0 0 0 |
=====================================================================================
5:45 AM 3/3/2022 DJI +79 NASDAQ +5 Data used 3-2-2021 ---
|
The DJI is rallying this morning because it sees higher profits
ahead in the Labor Department's announcement about Productivity and Labor costs this morning. "Nonfarm business sector labor productivity increased 6.6 percent in the fourth quarter of 2021, the U.S. Bureau of Labor Statistics reported today, as output increased 9.1 percent and hours worked increased 2.4 percent." With Peerless operating a Buy B19-B17 and lots of overhead resistance, the DJI will be doing well to gain another 1000 points. And if it does, the risk seems high that the P-I will still be negative and we will then get a Sell S9. Stay hedged, long the Bullish MAXCPs and short a few of the worst-performing MINCPs. The DJI's recovery of 570 points today almost exactly reversed the previous day's sell-off, except that breadth was better and trends up of Crude Oil and Wheat and down by the Russian ETF, RSX, extended sharply. Russia and Putin have become even more economically isolated. Overseas selling from the Russian attack on Ukraine continues and drives up Grains, Oil and Gas. Chevron is the big winner in the DJI-30. But the overhead supply of stock should limit the advance now for most stocks, even the blue chips and tech stocks. Our Buy B17 would ordinarily bring a rally to the upper band and March is usually an up-month in the 4-year Presidential cycle with the next ten trading days averaging a one percent advance since 1966 and rising 71% of the time. Watch the NYSE A/D Line today. The rally up from the Buy B17 and the 10%-down-from-the- peak level needs more of a boost, either technically or from the Jobs' Report this morning. Fed Chairman Powell said he favored a 1/4% rate hike this month. That sounds very small compared to the 10% CPI number that may come out in two weeks because of the war. The peace talks will continue between Russia and the Ukraine. Russia could still stop its war suddenly. As one ex-CIA observer noted, the longer the war continues, the deeper will the hole be that Putin has dug for himself. |
||
|
Charts - 3/2/202 2022 PEERLESS DJI, Signals, Indicators Daily DJI Volume 10-DayUp/Down Vol Stoch-20 Pct of All Stocks above 65-dma Inverted Traders Index Cum. Inverted Traders Index DJI-IPA DJI-OBV NASDAQ S&P OEX NYSE DJI-15 DJI-20 DJI-30 DIA QQQ SPY IWM TNA Short-Term Rates Ten Year Rates DOLLAR-UUP ALLSTOCKs recent 2006 vers-Peerless signals http://tigersoftware.com/NEWPEER/UPD80302.BMP MDY - http://www.tigersoftware.com/CHARTZ/MDY.GIF USO-CrudeOil DBO FAS GLD HD IBB JETS JNUG KOL NUGT OIH PALL RSX RETL SDS AGQ SLV SOXL TAN TECL TLT TMF TNA UGA China: YINN CHAU Commodities: CANE CORN DBC JJC, NIB CORN, CUT (paper) MOO, SOYB WEAT UUP (Dollar) LIT (Lithium) STOCKS: MRNA DIS GE PYPL GME ZOM XLE NRGU AAPL ADBE ALXN AMAT AMGN AMD AMZN AXP BA BABA BAC BIDU BLDP CAT CRM CVX CMG DE ENPH FB GILD GOOG GS HD IBM INTU JPM LRCX MRK MSFT NEM NFLX NKE NVDA PG PYPL REGN REV SO SQ QCOM QDEL TSLA TXN XOM V VRTX WFC WMT ZM Bullish MAXCPs http://tigersoftware.com/UPPER/3-02/BULLISH.htm Bearish MINCPs http://tigersoftware.com/DOWNER/3-02/BEARISH.htm |
The 2006 version of Tiger gives users a way to get a count of the
number of stocks in a directory that have red Buy-arrows and Sell-arrows
based on the optimized best trading system for both Buys and Sells from
ampng 60 different trading systems.  I want to start providing those
nightly counts for the DJI-30, SP-500, NASDAQ-100 and our Tiger Hotline
stocks.  This may tell us when an intermediate term move has ended or
is about to.  More research will be needed before we can reach firm
conclusions.  As we know, stocks are unequally weighted in the creation
of the indexes and breakouts and breakdowns do not immediately shift
the basis of the best system from stochastics to trending best systems,
so I would expect a lag in the results here when there is a breakout
of breakdown in the indexes.
Tiger Users, to get these results, change to the desired assumed Tiger
Directory using Peercomm + Select Folder. Then from Peercomm click
Older Charting + Runs/Setups from 2006 Tiger Menu + Runs/Setups (upper left)
+ Run Best Indicators All Stocks + OK. When finished at older Tiger Menu,
click Tiger Selections + #1 Indicators' Results/Status + Scroll down
to see the data shown below and the status for each stock.
Count of Operative RED Optimized Buys and Sells
Group Buy Sells New Buys New Sells ========================================================== Dow Jones-30 16 12 2 0 SP-500 (499) 281 181 31 6 NASDAQ-100(97) 56 35 5 1 TIGER HL STKS (124) 71 48 5 0 |
Peerless Buy B19/B17 are operative for DJIA |
 |
 |
 |
 |
 |
 |
 |
 |
Table 1 QUICKSILVER on ETFS - 3/2/2022 Bullish = 5 - GLD OIH CPER CORN WEAT Bearish = 1 - RSX ETF CLOSE CHANGE PIVOT-PT 5-dma AROC CL-PWR CANDLE IP21 ITRS POWER INDEX ================================================================================================== DIA 339 5.84 332.34 111.5% Bullish BLUE .116 0 .116 --------------------------------------------------------------------------------------------- SPY 437.89 7.91 428.3 185% Bullish BLUE .109 -.006 .103 --------------------------------------------------------------------------------------------- QQQ 347.22 5.73 340.49 261.2% Bullish BLUE .071 -.057 .014 --------------------------------------------------------------------------------------------- MDY 488.8 12.63 472.32 245% Bullish BLUE .087 .027 .114 --------------------------------------------------------------------------------------------- IWM 204.24 4.75 198.04 282.5% Bullish BLUE .063 -.009 .054 --------------------------------------------------------------------------------------------- FAS 116.32 8.56 114.26 -63.2% Bullish BLUE .029 -.023 .006 --------------------------------------------------------------------------------------------- RETL 21.82 2.13 20.34 894.1% Bearish BLUE .078 -.298 -.22 --------------------------------------------------------------------------------------------- SOXL 40.12 3.54 39.94 539.1% Bullish BLUE .117 -.278 -.161 --------------------------------------------------------------------------------------------- TECL 57.37 3.48 55.3 646.8% Bullish BLUE .153 -.219 -.066 --------------------------------------------------------------------------------------------- IBB 126.07 .67 124.59 183.1% ------- BLUE .078 -.142 -.064 --------------------------------------------------------------------------------------------- GLD 179.73 -1.89 177.14 40.4% ------- RED .374 .112 .486 Bullish --------------------------------------------------------------------------------------------- OIH 252.79 11.49 236.95 310.4% Bullish BLUE .188 .424 .612 Bullish --------------------------------------------------------------------------------------------- CPER 28.5 .68 27.44 251.4% Bullish BLUE .194 .131 .325 Bullish --------------------------------------------------------------------------------------------- UUP 26.06 -.02 25.97 57.9% Bearish RED -.137 .047 -.09 --------------------------------------------------------------------------------------------- CORN 25.25 -.38 24.5 185.8% ------- RED .237 .215 .452 Bullish --------------------------------------------------------------------------------------------- WEAT 9.61 .2 8.83 682.2% Bullish RED .158 .335 .493 Bullish --------------------------------------------------------------------------------------------- YINN 6.76 -.13 7.06 -340.1% Bullish RED .13 -.14 -.01 --------------------------------------------------------------------------------------------- RSX 7.19 -1.07 15.39 -4278.8% Bearish RED -.308 -.697 -1.005 Bearish |
  Table 2  Count of Stocks in Key Directories
             20220302
-------------------------------
NEWHIGHS       204
NEWLOWS        314
MAXCP          99
MINCP          13
TTTNH          64
TTTNL          5
CPCROSSA       233
CPCROSSD       49
ACCUMVER       5
HIGHIP21       25
HIUPPCT        123
VHIP21         41
LOWACCUM       220
REDSELL        126
AUGSELS7       18
TRAPDOOR       8
|
Table 3    RANKING OF KEY DIRECTORIES BASED PCT.OF STOCKS ABOVE 65-DMA
              3/2/22
 Bullish = 15
 Bearish = 34
---------------------------------------------------------------------------------------
Directory     Current       day-1         day-2         day-3         day-4         day-5
----------------------------------------------------------------------------------------
COAL           1             1             1             1             1             1
GOLD           .913          .913          .782          .76           .739          .847
OILGAS         .876          .847          .838          .819          .771          .704
COPPER         .875          .875          .875          .875          .875          .875
FOOD           .816          .795          .775          .795          .795          .795
MILITARY       .807          .73           .807          .73           .615          .615
COMODITY       .794          .769          .769          .794          .769          .769
HACKERS        .684          .473          .631          .578          .368          .263
INSURANC       .68           .44           .72           .76           .44           .52
EDU            .666          .666          .666          .666          .5            .5
INFRA .636 .515 .545 .545 .424 .363 INDMATER .583 .541 .527 .513 .444 .444 HOSPITAL .562 .562 .562 .625 .5 .437 REGBANKS .56 .2 .52 .48 .12 .4 UTILITY .512 .435 .435 .435 .282 .256 ============================================================================================= GAMING .473 .315 .526 .578 .473 .315 RETAIL .446 .212 .255 .276 .148 .127 CHEM .413 .217 .347 .347 .239 .347 FIDSTKS .408 .319 .449 .479 .36 .343 SP-100 .4 .277 .4 .422 .333 .344 SOLAR .375 .5 .375 .125 0 0 INDEXES .372 .329 .362 .356 .318 .318 SP500 .366 .27 .356 .39 .278 .286 BEVERAGE .357 .285 .357 .428 .285 .428 RUS-1000 .356 .27 .326 .326 .25 .22 REIT .353 .238 .284 .307 .2 .169 FINANCE .352 .204 .534 .579 .352 .511 LOWPRICE .333 .305 .297 .264 .254 .211 SOFTWARE .321 .25 .303 .267 .25 .16 GREEN .315 .21 .21 .105 .105 .105 TRANSP .315 .21 .473 .473 .368 .263 GUNS .307 .23 .23 .307 .076 .076 ETFS .29 .218 .272 .29 .2 .236 JETS .285 .142 .571 .714 .642 .5 BIOTECH .269 .222 .214 .206 .178 .134 DOWJONES .266 .233 .3 .366 .266 .233 CHINA .26 .3 .28 .24 .24 .24 NIFTY .26 .217 .26 .282 .217 .195 ELECTRON .255 .187 .24 .263 .165 .105 SEMI .242 .189 .21 .252 .168 .084 NASD-100 .237 .154 .195 .216 .154 .154 DJI-13 .23 .23 .23 .23 .076 .076 HIGHPRIC .218 .163 .196 .185 .123 .09 AUTO .207 .132 .169 .132 .132 .132 HOMEBLDG .166 .055 .055 .055 .055 0 BIGBANKS .142 0 .285 .285 .285 .285 COMPUTER .1 .05 .15 .1 .05 .05 BONDFUND .011 .011 .011 0 0 0 MARIJUAN 0 0 0 0 0 0 |
====================================================================================
6:00 PM 3/2/2022 DJI +141 NASDAQ+33 Data used 3-1-2021 ---
New Buy B17 today ...
See http://www.tigersoft.com/PeerInst-2012-2013/--Buy-B17.htm
See the track record below for the nineteen February and March Buy B17s.
All proved profitable. The median gain was 7.3%. Only one third generated
a paper loss of more than 1%.
The gains of these B17s when the DJI was 10% to 11% down from its
peaks were +.118 (1968), +7.3% (1978), +3.6% (1984), +9.5% (2010),
+10.6% (2016), showing a median gain of 8%+. That should give us
more confidence in here.
| The DJI is now
sitting on its 10%-down-from-its-peak level and its Accumulation Index is a +.073. It is about 4% below its 21-dma. In addition, its V-I Indicator has improved to -118. The new Buy B17 calls our attention to the still positive IP21 (Accum. Index) and the fact that that the DJI is oversold. Expect another rebound. The falling 21-day ma will be short-term resistance but we will not get a reversing Sell signal until the DJI gets to its 2.4% upper band, at least. The market expects Fed Chairman Powell to say that he will be slow to raise interest rates because of all the economuc uncertainties caused by the Russian attack on the Ukraine. Watch to see how he handles questions about the rate of Inflation. Orthodox economic thinking calls for a series of rate hikes to cool off the economy. President Biden has said that he will take the spigots off the emergency reserve of Oil to stop Crude Oil's runaway swing upwards in prices. The DJI's bobbing up and down at this level shows that Professionals and the Federal Reserve are trying to prevent a bigger sell-off. Bank stocks were particularly weak again today. That indicates how vervous they are when Biden and the Europeon Union impose restrictions on Russia and its banking system. Cover more of the MINCP short sales. The bullish MAXCPs tell us we should be long: oil stocks, gold, silver as well as commodities, especially WEAT. NVDA remains the strongest high tech stock I would want to play long now.... |
||
|
Charts - 3/2/202 2022 PEERLESS DJI, Signals, Indicators Daily DJI Volume 10-DayUp/Down Vol Stoch-20 Pct of All Stocks above 65-dma Inverted Traders Index Cum. Inverted Traders Index DJI-IPA DJI-OBV NASDAQ S&P OEX NYSE DJI-15 DJI-20 DJI-30 DIA QQQ SPY IWM TNA Short-Term Rates Ten Year Rates DOLLAR-UUP ALLSTOCKs recent 2006 vers-Peerless signals http://tigersoftware.com/NEWPEER/UPD80301.BMP MDY - http://www.tigersoftware.com/CHARTZ/MDY.GIF USO-CrudeOil DBO FAS GLD HD IBB JETS JNUG KOL NUGT OIH PALL RSX RETL SDS AGQ SLV SOXL TAN TECL TLT TMF TNA UGA China: YINN CHAU Commodities: CANE CORN DBC JJC, NIB CORN, CUT (paper) MOO, SOYB WEAT UUP (Dollar) LIT (Lithium) STOCKS: MRNA DIS GE PYPL GME ZOM XLE NRGU AAPL ADBE ALXN AMAT AMGN AMD AMZN AXP BA BABA BAC BIDU BLDP CAT CRM CVX CMG DE ENPH FB GILD GOOG GS HD IBM INTU JPM LRCX MRK MSFT NEM NFLX NKE NVDA PG PYPL REGN REV SO SQ QCOM QDEL TSLA TXN XOM V VRTX WFC WMT ZM Bullish MAXCPs http://tigersoftware.com/UPPER/3-01/BULLISH.htm Bearish MINCPs http://tigersoftware.com/DOWNER/3-01/BEARISH.htm |
          19 PAST Buy B17s in Feb and March: 1929-present.
               Median Gain = +7.3%
19310313      B17            178.9     .049                  -.007        ./.
  25% down from recent highs  IP21= -.17
--------------------------------------------------------------------
19480316      B17            165.4     .168 x     perfect       0
  12% down from recent highs. IP21= -.105
--------------------------------------------------------------------
19600303      B17            612.0     .021       607.1      -.008        3/9
12% down from recent highs.  IP21 = -.073
--------------------------------------------------------------------
19680304      B17            830.56    .111 x     825.13     -.0065       3/21
10% down from recent highs.  IP21 = -.081
-------------------------------------------------------------------------------
19680321      B17            825.13    .118 x     perfect     0
Bear Market: 10% down from recent highs.  IP21 = -.088
-------------------------------------------------------------------------------
19690225      B17            899.8     .056       perfect     0
8% down from recent highs.   IP21 =-.008
-------------------------------------------------------------------------------
19730321      B17            938.37    .031       922.71     -.0166       3/23
11% down from recent highs.  IP21 =-.041
-------------------------------------------------------------------------------
19770209      B17            933.84    .033       931.52     -.0024       2/11
8% down from recent highs.   IP21 =-.072
-------------------------------------------------------------------------------
19790207      B17            816.01    .073 m     807       -.011        ./.
10% down from recent highs.  IP21 =-.023
-------------------------------------------------------------------------------
19810202      B17            932.25    .079 x     931.57     -.0007       2/13
6.5% down from recent highs. IP21 =-.005
-------------------------------------------------------------------------------
19820222      B17            811.26    .027       795.47      -.0194       3/8
20% down from recent highs.  IP21 =-.057
-------------------------------------------------------------------------------
19840307      B17           1143.63    .036       1139.76    -.0033       3/9
10% down from recent highs.  IP21 =-.021
-------------------------------------------------------------------------------
19880325      B17           1978.95    .056       1978.12    -.0004       3/30
31% down from recent highs.  IP21 = +.071
-------------------------------------------------------------------------------
20000309      B17          10010.73    .111 x     9811.24   -.0199       3/14
3o% down from recent highs.  IP21 =
-------------------------------------------------------------------------------
20030311      B17           7524.06    .303 x                 none      0
20% down from recent highs.   IP21 =+.146
-------------------------------------------------------------------------------
20100209      B17          10058.64    .095 x                 none      0
11% down from recent highs. IP21 = -.042
-------------------------------------------------------------------------------
20150310      B17          17662.94    .037       17635.3   -.0015      3/11
4% down from recent highs.  IP21= +.126
-------------------------------------------------------------------------------
20160211      B17          16093.51    .156 x               perfect      0
11% down from recent highs.  IP21= +.126
-------------------------------------------------------------------------------
20200327      B17          21636.78   +.083 x     21052.53  -.03
30% down from peak.          IP21= -.026
 ------------------------------------------------------------------------------ ---------
---------------------------------------------------
 Past B17s:   N=19   All got gains.    median = 7.3%         13/19 showed paper loss
                                                            but only in 5/19 cases was
                                                            the paper loss over 1%.
20220301      B17          33294.95
10% down from recent high.  IP21 = +.077
|
 |
 |
 |
 |
 |
 |
 |
Table 1 QUICKSILVER on ETFS - 3/1/2022 Bullish = 5 - GLD OIH CPER CORN WEAT Bearish = 1 - RSX ETF CLOSE CHANGE PIVOT-PT 5-dma AROC CL-PWR CANDLE IP21 ITRS POWER INDEX ================================================================================================== DIA 333.16 -6.18 331.52 -42.4% Bullish RED .143 0 .143 --------------------------------------------------------------------------------------------- SPY 429.98 -6.65 421.95 4.8% Bullish RED .137 -.005 .132 --------------------------------------------------------------------------------------------- QQQ 341.49 -5.31 329.42 50.1% Bullish RED .092 -.044 .048 --------------------------------------------------------------------------------------------- MDY 476.17 -9.27 465.43 29.2% Bullish RED .095 .028 .123 --------------------------------------------------------------------------------------------- IWM 199.49 -3.83 192.98 71.2% Bullish RED .108 .009 .117 --------------------------------------------------------------------------------------------- FAS 107.76 -12.93 117.8 -661.2% Bullish RED .024 -.113 -.089 --------------------------------------------------------------------------------------------- RETL 19.69 -1.61 18.21 17.3% ------- RED .098 -.321 -.223 --------------------------------------------------------------------------------------------- SOXL 36.58 -4.43 35.91 -257.3% Bullish RED .132 -.309 -.177 --------------------------------------------------------------------------------------------- TECL 53.89 -3.44 50.27 -40% Bullish RED .179 -.247 -.068 --------------------------------------------------------------------------------------------- IBB 125.4 -.67 121.5 49.8% ------- RED .127 -.093 .034 --------------------------------------------------------------------------------------------- GLD 181.62 3.24 178.29 116.3% ------- BLUE .416 .153 .569 Bullish --------------------------------------------------------------------------------------------- OIH 241.3 -6.85 237.81 95% Bullish RED .166 .371 .537 Bullish --------------------------------------------------------------------------------------------- CPER 27.82 .42 27.12 63.9% Bullish ---- .205 .135 .34 Bullish --------------------------------------------------------------------------------------------- UUP 26.08 .2 25.76 67.7% Bearish BLUE -.143 .087 -.056 --------------------------------------------------------------------------------------------- CORN 25.63 1.05 24.34 293.4% Bullish BLUE .235 .261 .496 Bullish --------------------------------------------------------------------------------------------- WEAT 9.41 .57 8.42 756% Bullish BLUE .26 .345 .605 Bullish --------------------------------------------------------------------------------------------- YINN 6.89 -.04 7.24 -424.9% Bullish ---- .176 -.122 .054 --------------------------------------------------------------------------------------------- RSX 8.26 -2.59 19.02 -3883.1% Bearish RED -.243 -.628 -.871 Bearish |
Table 2    Count of Stocks in Key Directories
          20220301
-------------------------------
NEWHIGHS       176
NEWLOWS        362
MAXCP          56
MINCP          37
TTTNH          48
TTTNL          38
CPCROSSA       64
CPCROSSD       190
ACCUMVER       7
HIGHIP21       25
HIUPPCT        119
VHIP21         45
LOWACCUM       224
REDSELL        122
AUGSELS7       18
TRAPDOOR       33
|
 RANKING OF KEY DIRECTORIES BASED PCT.OF STOCKS ABOVE 65-DMA
              3/1/22
 Bullish =11
 Bearish =37
---------------------------------------------------------------------------------------
Directory     Current       day-1         day-2         day-3         day-4         day-5
----------------------------------------------------------------------------------------
COAL           1             1             1             1             1             1
GOLD           .913          .782          .76           .739          .847          .739
COPPER         .875          .875          .875          .875          .875          .875
OILGAS         .847          .838          .819          .771          .704          .733
FOOD           .795          .775          .795          .795          .795          .795
COMODITY .769 .769 .794 .769 .769 .769 MILITARY .73 .807 .73 .615 .576 .653 EDU .666 .666 .666 .5 .5 .333 HOSPITAL .562 .562 .625 .5 .437 .562 INDMATER .541 .527 .513 .444 .444 .444 INFRA .515 .545 .545 .424 .363 .393 =============================================================================================== SOLAR .5 .375 .125 0 0 0 =============================================================================================== HACKERS .473 .631 .578 .368 .21 .315 INSURANC .44 .72 .76 .44 .56 .68 UTILITY .435 .435 .435 .282 .256 .358 INDEXES .329 .362 .356 .318 .318 .351 FIDSTKS .319 .449 .479 .36 .343 .431 FINANCE .315 .446 .476 .357 .339 .428 GAMING .315 .526 .578 .473 .315 .315 LOWPRICE .307 .297 .262 .254 .213 .236 CHINA .3 .28 .24 .24 .24 .28 BEVERAGE .285 .357 .428 .285 .428 .5 SP-100 .277 .4 .422 .333 .344 .388 RUS-1000 .27 .326 .326 .25 .222 .26 SP500 .27 .356 .388 .278 .288 .338 SOFTWARE .25 .303 .267 .25 .16 .178 REIT .238 .276 .315 .2 .176 .215 DOWJONES .233 .3 .366 .266 .233 .3 DJI-13 .23 .23 .23 .076 .076 .153 GUNS .23 .23 .307 .076 .076 .076 BIOTECH .222 .214 .206 .178 .134 .164 ETFS .218 .272 .29 .2 .254 .254 CHEM .217 .347 .347 .239 .347 .304 NIFTY .217 .26 .26 .217 .195 .282 RETAIL .212 .255 .276 .148 .127 .148 GREEN .21 .21 .105 .105 .105 .105 TRANSP .21 .473 .473 .368 .263 .421 REGBANKS .2 .52 .48 .12 .4 .48 SEMI .189 .21 .252 .168 .084 .105 ELECTRON .187 .24 .263 .165 .105 .157 HIGHPRIC .163 .196 .185 .123 .09 .109 NASD-100 .154 .195 .206 .154 .154 .206 JETS .142 .571 .714 .642 .5 .714 AUTO .132 .169 .132 .132 .132 .113 HOMEBLDG .055 .055 .055 .055 0 0 COMPUTER .05 .15 .1 .05 .05 .1 BONDFUND .011 .011 0 0 0 0 BIGBANKS 0 .285 .285 .285 .285 .285 MARIJUAN 0 0 0 0 0 0 |
====================================================================================
Tuesday 6:00 PM 3/1/2022 DJI -272
NASDAQ-120 Data used 2-28-2021 ---
| The cease-fire/peace
talks do not mean peace anytime soon. The costs of the fighting in Ukraine will go far beyond Ukraine and Russia. The market is also coming to grips with the reality that Putin seems to think he cannot stop his attack without failing his objectives. This adds to the dangers that the war will spread. The DJI is again selling off more than 1% before the opening. The selling pressure comes presumably mostly from Europe where the Russo-Ukraine war is felt more than in America, so far. As such, we have our own battle, the one between Tiger's Opening and Closing Powers. Will NY Professionals continue to be able to prop up the DJI, SPY, NASDAQ and QQQ with strong closes? This is asking a lot since the rising oil, gas and commodity prices we see now because of the war in the Ukraine are bound to make this month's CPI number jump much higher. And this will put a lot of pressure on the FED to raise rates faster than they earlier planned. The war is also putting big pressure on American corporations to curb their operations in Russia. This the big banks are loathe to do. I take that to be the reason that Goldman Sachs and J.P. Morgan were the biggest decliners on the DJI-30 today. We are long NVDA and some Oil and Commodity ETFs from the Bullish MAXCPs and short some of the Bearish MINCPs of late. We should probably now wait to see if the Professionals will continue to try to turn the DJI back upwards after another weak opening this morning. A DJI close below 33000 would be dangerous as it would invite selling a week opening. The DJI may need to test this level before rallying to the upper band in keeping with the Buy B19. . Watch our Closing Powers. Professionals need to remain bullish. They would only do this, I would bet, if they know that FED Chairman Powell will resist all pressures on the FED to curb inflation by raising rates faster than by minimal small steps upward in rates. We will listen closely to his discussions his week with Congress. At the end of the week, the Jobs' Report looms important, too. |
||
|
Charts - 2/25/202 2022 PEERLESS DJI, Signals, Indicators Daily DJI Volume 10-DayUp/Down Vol Stoch-20 Pct of All Stocks above 65-dma Inverted Traders Index Cum. Inverted Traders Index DJI-IPA DJI-OBV NASDAQ S&P OEX NYSE DJI-15 DJI-20 DJI-30 DIA QQQ SPY IWM TNA Short-Term Rates Ten Year Rates DOLLAR-UUP ALLSTOCKs recent 2006 vers-Peerless signals http://tigersoftware.com/NEWPEER/UPD80228.BMP MDY - http://www.tigersoftware.com/CHARTZ/MDY.GIF USO-CrudeOil DBO FAS GLD HD IBB JETS JNUG KOL NUGT OIH PALL RSX RETL SDS AGQ SLV SOXL TAN TECL TLT TMF TNA UGA China: YINN CHAU Commodities: CANE CORN DBC JJC, NIB CORN, CUT (paper) MOO, SOYB WEAT UUP (Dollar) LIT (Lithium) STOCKS: MRNA DIS GE PYPL GME ZOM XLE NRGU AAPL ADBE ALXN AMAT AMGN AMD AMZN AXP BA BABA BAC BIDU BLDP CAT CRM CVX CMG DE ENPH FB GILD GOOG GS HD IBM INTU JPM LRCX MRK MSFT NEM NFLX NKE NVDA PG PYPL REGN REV SO SQ QCOM QDEL TSLA TXN XOM V VRTX WFC WMT ZM Bullish MAXCPs http://tigersoftware.com/UPPER/3-01/BULLISH.htm Bearish MINCPs http://tigersoftware.com/DOWNER/3-01/BEARISH.htm |
|
DJI is struggling to stay above 33000 and key 10% down-from-peak level.  |
|
Rising Closing Power shows Professionals want to see the DJI and DIA rally. But weak openings show the selling forces overseas are quite powerful.  |
 |
 |
|
 |
|
Rising Commodity and Oil Prices are bound to make CPI numbers jump higher this month. This, in turn, will pressure FED to raise interest rates.  
|
Table 1 QUICKSILVER on ETFS - 2/28/2022 Bullish = 5 - GLD OIH CPER CORN WEAT Bearish = 1 - RSX ETF CLOSE CHANGE PIVOT-PT 5-dma AROC CL-PWR CANDLE IP21 ITRS POWER INDEX ================================================================================================== DIA 339.34 -1.2 336.01 -24.4% Bullish BLUE .242 0 .242 --------------------------------------------------------------------------------------------- SPY 436.63 -1.12 429.57 27.9% Bullish BLUE .22 -.015 .205 --------------------------------------------------------------------------------------------- QQQ 346.8 1.03 338.08 78% Bullish BLUE .168 -.07 .098 --------------------------------------------------------------------------------------------- MDY 485.44 -.23 473.39 56% Bullish BLUE .193 .018 .211 --------------------------------------------------------------------------------------------- IWM 203.32 .82 196.66 97.3% Bullish BLUE .21 -.009 .201 --------------------------------------------------------------------------------------------- FAS 120.69 -4.08 123.66 -221.3% Bullish BLUE .142 -.005 .137 --------------------------------------------------------------------------------------------- RETL 21.3 -.1 19.62 -211.3% ------- BLUE .161 -.344 -.183 --------------------------------------------------------------------------------------------- SOXL 41.01 -.77 38.61 176.1% Bullish BLUE .213 -.341 -.128 --------------------------------------------------------------------------------------------- TECL 57.33 -.32 54.33 134.4% Bullish BLUE .283 -.281 .002 --------------------------------------------------------------------------------------------- IBB 126.07 -.22 124.16 41.4% ------- BLUE .211 -.113 .098 --------------------------------------------------------------------------------------------- GLD 178.38 1.83 177.49 35.5% ------- RED .374 .13 .504 BULLISH --------------------------------------------------------------------------------------------- OIH 248.15 5.7 236.73 170.4% Bullish BLUE .213 .397 .61 BULLISH --------------------------------------------------------------------------------------------- CPER 27.4 -.04 27.47 -29.2% Bullish ---- .234 .111 .345 BULLISH --------------------------------------------------------------------------------------------- UUP 25.88 .04 25.73 31% Bearish ---- -.152 .058 -.094 --------------------------------------------------------------------------------------------- CORN 24.58 1.2 24.21 202% Bullish BLUE .189 .204 .393 BULLISH --------------------------------------------------------------------------------------------- WEAT 8.84 .73 8.13 716.9% Bullish BLUE .25 .268 .518 BULLISH --------------------------------------------------------------------------------------------- YINN 6.93 -.23 7.5 -808.8% Bullish BLUE .247 -.124 .123 --------------------------------------------------------------------------------------------- RSX 10.85 -4.75 20.97 -3236.7% Bearish RED -.143 -.545 -.688 BEARISH |
TABLE 2       Count of Stocks in Key Directories
            20220228
-------------------------------
NEWHIGHS       130
NEWLOWS        189
MAXCP          116
MINCP          14
TTTNH          73
TTTNL          10
CPCROSSA       192
CPCROSSD       20
ACCUMVER       4
HIGHIP21       32
HIUPPCT        115
VHIP21         44
LOWACCUM       239
REDSELL        119
AUGSELS7       19
TRAPDOOR       12
|
Table 3       RANKING OF KEY DIRECTORIES BASED PCT.OF STOCKS ABOVE 65-DMA
              2/28/22
 Bullish = 16
 Bearish = 33
---------------------------------------------------------------------------------------
Directory     Current       day-1         day-2         day-3         day-4         day-5
----------------------------------------------------------------------------------------
COAL           1             1             1             1             1             1
COPPER         .875          .875          .875          .875          .875          .875
OILGAS         .838          .819          .771          .704          .733          .761
MILITARY       .807          .73           .615          .576          .653          .615
GOLD           .782          .76           .739          .847          .739          .804
FOOD           .775          .795          .795          .795          .795          .836
COMODITY       .769          .794          .769          .769          .769          .82
INSURANC       .72           .76           .44           .56           .68           .68
EDU            .666          .666          .5            .5            .333          .333
HACKERS        .631          .578          .368          .21           .263          .263
JETS .571 .714 .642 .5 .714 .785 HOSPITAL .562 .625 .5 .437 .562 .562 INFRA .545 .545 .424 .363 .393 .424 INDMATER .527 .513 .444 .444 .444 .486 GAMING .526 .578 .473 .315 .315 .421 REGBANKS .52 .48 .12 .4 .48 .44 ================================================================================================ TRANSP .473 .473 .368 .263 .421 .421 FIDSTKS .449 .479 .36 .343 .431 .467 FINANCE .446 .476 .357 .339 .428 .464 UTILITY .435 .435 .282 .256 .358 .384 SP-100 .4 .422 .333 .344 .388 .4 SOLAR .375 .125 0 0 0 0 INDEXES .362 .356 .318 .318 .351 .378 BEVERAGE .357 .428 .285 .428 .5 .428 SP500 .356 .388 .276 .288 .338 .372 CHEM .347 .347 .239 .347 .282 .369 RUS-1000 .326 .326 .25 .222 .265 .303 SOFTWARE .303 .267 .25 .16 .178 .16 DOWJONES .3 .366 .266 .233 .3 .333 LOWPRICE .3 .262 .251 .213 .239 .256 BIGBANKS .285 .285 .285 .285 .285 .428 CHINA .28 .24 .24 .24 .28 .32 REIT .276 .307 .207 .176 .215 .261 ETFS .272 .29 .2 .254 .272 .345 NIFTY .26 .26 .195 .195 .282 .304 RETAIL .255 .276 .148 .127 .148 .234 ELECTRON .24 .263 .165 .105 .157 .195 DJI-13 .23 .23 .076 .076 .153 .153 GUNS .23 .307 .076 .076 .076 .076 BIOTECH .214 .206 .178 .134 .162 .167 GREEN .21 .105 .105 .105 .105 .105 SEMI .21 .252 .168 .084 .105 .157 HIGHPRIC .196 .185 .123 .09 .109 .112 NASD-100 .195 .206 .144 .154 .206 .216 AUTO .169 .132 .132 .132 .113 .169 COMPUTER .15 .1 .05 .05 .05 .25 HOMEBLDG .055 .055 .055 0 0 0 BONDFUND .011 0 0 0 0 0 MARIJUAN 0 0 0 0 0 0 |
====================================================================================
Monday 5:40 PM 2/28/2022 DJI -399
NASDAQ-175 Data used 2-25-2021 ---
| News that Russia
and Ukraine would engage in peace talks came out on RT.com before the opening on Friday. As much as anything, it was that news that sent the DJI up sharply. Friday there were 4 times more NYSE advancers than decliners (2760 to 590). This was a substantial reversal from the very negative ratios on the way down. It produced a new and reversing Buy B19. Such B19s (see further below) average gains of 5% but also produce paper losses from 2% to 4.5% in almost half the cases. So, the sell-off that is shaping up for the opening must be considered a normal pull-back and may be a buying opportunity as long as the DJI stays above 33000. The Closing Powers for the key ETFs have broken their downtrends. This suggests that Professionals, taken as whole, are willing to hold the market up while the Public and overseas investors are heavy sellers at the opening. Unless Russia's Putin has lost his mind, he must see that his attack on the Ukraine is hurting his objectives of keeping NATO away from his borders as well as hurting Russia economically. But we will see. The Soviet Union put down five rebellions in Europe under Krushchev and Brezhnev between 1953 and 1968. In each case, the US markets seemed to pay very little attention to these events in East Germany Poland, Hungary and Czechoslavakia. Only the two-week Soviet attack on Hungarian "freedome fighters" in November 1956 seemed to hold the DJI back for two weeks at the lower band. See the 1956 DJI chart below. The market is probably more concerned about where Oil Prices are heading if Russian oil is held back and how Fed Chaiman will answer Congressional questions about Inflation and Unemployment later this week in Congress. Cover more of the Bearish MINCPs on weakness this morning and let's hold back big buying until we see if the DJI will stay above 33000 on a closing basis. |
||
|
Charts - 2/25/202 2022 PEERLESS DJI, Signals, Indicators Daily DJI Volume 10-DayUp/Down Vol Stoch-20 Pct of All Stocks above 65-dma Inverted Traders Index Cum. Inverted Traders Index DJI-IPA DJI-OBV NASDAQ S&P OEX NYSE DJI-15 DJI-20 DJI-30 DIA QQQ SPY IWM TNA Short-Term Rates Ten Year Rates DOLLAR-UUP ALLSTOCKs recent 2006 vers-Peerless signals http://tigersoftware.com/NEWPEER/UPD80225.BMP MDY - http://www.tigersoftware.com/CHARTZ/MDY.GIF USO-CrudeOil DBO FAS GLD HD IBB JETS JNUG KOL NUGT OIH PALL RSX RETL SDS AGQ SLV SOXL TAN TECL TLT TMF TNA UGA China: YINN CHAU Commodities: CANE CORN DBC JJC, NIB CORN, CUT (paper) MOO, SOYB WEAT UUP (Dollar) LIT (Lithium) STOCKS: MRNA DIS GE PYPL GME ZOM XLE NRGU AAPL ADBE ALXN AMAT AMGN AMD AMZN AXP BA BABA BAC BIDU BLDP CAT CRM CVX CMG DE ENPH FB GILD GOOG GS HD IBM INTU JPM LRCX MRK MSFT NEM NFLX NKE NVDA PG PYPL REGN REV SO SQ QCOM QDEL TSLA TXN XOM V VRTX WFC WMT ZM Bullish MAXCPs http://tigersoftware.com/UPPER/2-25/BULLISH.htm Bearish MINCPs http://tigersoftware.com/DOWNER/2-25/BEARISH.htm |
|
B19 - Two day and three day Reversal Days B19s are much more complicated. You would need to have the VB3 code on an XP to delve into it properly. But the basic idea is a reversal and strong advance on last day. The breadth ratio was clearly great Friday just as it was very bad on the way down on Wednesday. ( The best way to see if we get this signal before the close is to dummy in data near the close into C:\peerless\data.txt and run Peerless. A rally to the 21-dma and then the upper band is likely. But a re-test of the lows is also a scenario that can happens with B19. The Track Record is good in past B19s. There are a half a dozen different types or cases of B19s. The B19 we got today met two major sets of conditions which have occurred many times in the past. Case A Past Cases of B19 DJI Gain Paper Loss 19300506 B19 268.8 .023 none 0 19380928 B19 133.7 .178 none 0 19940405 B19 3675.4 .016 3598.71 -.0208 4/20 20100527 B19 10259 .015 9816.49 -.0431 6/7 20180326 B19 24203 .024 23644.19 -.0030 4/2 --------------------------------------------------------------------------------------- 2/25/2022 B19 Median Gain = 1.6% Median Paper Loss = 2.8% 31 Case B Past Cases of B19 DJI Gain Paper Loss 19290327 B19 303.2 .029 299.1 -.0135 4/9 19380915 B19 136.2 .156 129.9 -.0462 9/26 19410220 B19 119.9 .067 115.3 -.0383 5/1 19460221 B19 195.6 .086 115.3 -.049 2/26 19470421 B19 169.5 .090 163.6 -.0348 5/19 19550315 B19 399.3 .173 none 0 19560529 B19 477.7 .091 475.3 -.005 6/8 19590210 B19 582.7 .116 none 0 19660830 B19 775.72 .039 774.88 -.001 9/8 19670411 B19 847.66 .031 none 0 19670411 B19 847.66 .031 none 0 19741007 B19 607.56 .076 none 0 19800328 B19 777.65 .268 759.13 -.0238 4/21 19800930 B19 932.42 .058 none 0 19870415 B19 2282.95 .026 2230.54 -.0229 4/27 19940405 B19 3675.41 .016 3598.71 -.0208 4/20 20020806 B19 8274.09 .05 none 0 20040312 B19 10240.08 .031 10048.2 -.0187 3/24 20050421 B19 10218.6 .133 10070.3 -.0145 4/28 20070306 B19 12207.6 .138 none 0 20071123 B19 12799.0 .064 12743.4 -.0043 11/26 20100602 B19 10249.6 .016 9816.49 -.0422 6/7 20110317 B19 11774.59 .088 none 0 20120411 B19 12805.39 .037 none 0 20130625 B19 14760.31 .047 none 0 20130822 B19 14963.74 .015 14776.1 -.0125 8/27 20150908 B19 16492.68 .074 16001.8 -.0213 9/28 20160628 B19 17409.72 .053 none 0 20180326 B19 24202.60 .024 23644.19 -.0030 4/2 20200629 B19 25595.80 .041 none 0 20211202 B19 34639.79 .053 none 0 ---------------------------------------------------------------------------------- Median Gain = 5.3% 16 of 31 showed a paper loss of less than 1%. But 14/31 showed no paper loss When there was a paper loss, the worst case was 4.9%. There were 3 instances of a paper loss of more than 4% amd 9 cases of a paper loss of more than 2% 20220325 B19 34058.75 -------------------------------------------- --------------------------------------------------------------------------------------------------------------------------- ---------------------------------------------------------------------------------------------------------------------------
1956 Case - Fed's Raising Rates, not Soviet
Suppression
|
 |
 |
 |
 |
  |
 |
 |
 |
 |
Table 1 QUICKSILVER on ETFS - 2/25/2022 Bullish = 4 - GLD OIH Bearish = 3 - RETL RSX ETF CLOSE CHANGE PIVOT-PT 5-dma AROC CL-PWR CANDLE IP21 ITRS POWER INDEX ================================================================================================== DIA 340.54 8.2 340.98 -46.6% Bullish BLUE .151 ---- ---- --------------------------------------------------------------------------------------------- SPY 437.75 9.45 434.23 8% Bullish BLUE .147 -.011 .136 --------------------------------------------------------------------------------------------- QQQ 345.77 5.28 341.51 4.7% Bullish BLUE .096 -.065 .031 --------------------------------------------------------------------------------------------- MDY 485.67 13.35 480.12 38.6% Bullish BLUE .1 nn .015 .115 --------------------------------------------------------------------------------------------- IWM 202.5 4.46 199.47 32.9% Bullish BLUE .129 -.011 .118 --------------------------------------------------------------------------------------------- FAS 124.77 10.51 126.06 -69.1% Bullish BLUE .092 .022 .114 --------------------------------------------------------------------------------------------- RETL 21.4 1.06 22.16 -325% ------- BLUE .103 -.34 n -.237 Bearish --------------------------------------------------------------------------------------------- SOXL 41.78 1.84 39.63 116.7% Bullish BLUE .145 -.277 -.132 --------------------------------------------------------------------------------------------- TECL 57.65 2.35 55.86 1.8% Bullish BLUE .211 -.237 -.026 --------------------------------------------------------------------------------------------- IBB 126.29 1.7 125.04 11.7% ------- BLUE .139 -.106 .033 --------------------------------------------------------------------------------------------- GLD 176.55 -.59 177.12 -19.7% ------- BLUE .304 .111 .415 Bullish --------------------------------------------------------------------------------------------- OIH 242.45 5.5 240.01 -66.4% Bullish BLUE .144 .351 .495 Bullidh --------------------------------------------------------------------------------------------- CPER 27.44 0 27.56 -3.6% Bullish BLUE .131 .099 .23 --------------------------------------------------------------------------------------------- UUP 25.84 -.13 25.72 36.9% Bearish RED -.104 .042 -.062 --------------------------------------------------------------------------------------------- CORN 23.38 -1.12 23.61 -4.2% Bearish RED .118 .131 .249 --------------------------------------------------------------------------------------------- WEAT 8.11 -.72 7.66 257.8% Bullish RED .118 .117 .235 --------------------------------------------------------------------------------------------- YINN 7.16 .1 8.13 -1120.3% Bullish BLUE .185 -.181 .004 --------------------------------------------------------------------------------------------- RSX 15.6 .21 23.02 -2091.1% Bearish RED -.021 -.377 -.398 Bearish |
 Table 2   Count of Stocks in Key Directories
          20220225
-------------------------------
NEWHIGHS       91
NEWLOWS        208
MAXCP          75
MINCP          12
TTTNH          51
TTTNL          9
CPCROSSA       510
CPCROSSD       28
ACCUMVER       3
HIGHIP21       19
HIUPPCT        111
VHIP21         44
LOWACCUM       232
REDSELL        141
AUGSELS7       13
TRAPDOOR       14
|
Table 3       RANKING OF KEY DIRECTORIES BASED PCT.OF STOCKS ABOVE 65-DMA
              2/25/22
 Bullish = 15
 Bearish = 34
---------------------------------------------------------------------------------------
Directory     Current       day-1         day-2         day-3         day-4         day-5
----------------------------------------------------------------------------------------
COAL           1             1             1             1             1             1
COPPER         .875          .875          .875          .875          .875          .875
OILGAS         .819          .771          .704          .733          .761          .809
FOOD           .795          .795          .795          .795          .836          .836
COMODITY       .794          .769          .769          .769          .82           .82
GOLD           .76           .739          .847          .739          .804          .826
INSURANC       .76           .44           .56           .68           .68           .68
MILITARY       .73           .615          .576          .653          .615          .653
JETS           .714          .642          .5            .714          .785          .785
EDU            .666          .5            .5            .333          .333          .5
HOSPITAL .625 .5 .437 .562 .562 .625 GAMING .578 .473 .315 .315 .421 .578 HACKERS .578 .368 .21 .263 .263 .315 INFRA .545 .424 .363 .393 .424 .424 INDMATER .513 .444 .444 .444 .5 .527 ================================================================================================ REGBANKS .48 .12 .4 .48 .44 .44 FIDSTKS .479 .36 .343 .431 .473 .491 FINANCE .476 .357 .339 .428 .47 .488 TRANSP .473 .368 .263 .421 .421 .421 UTILITY .435 .282 .256 .358 .358 .358 BEVERAGE .428 .285 .428 .5 .428 .428 SP-100 .422 .333 .344 .388 .411 .433 SP500 .388 .276 .286 .338 .374 .382 DOWJONES .366 .266 .233 .3 .366 .366 INDEXES .356 .318 .318 .351 .383 .416 CHEM .347 .239 .347 .282 .369 .413 RUS-1000 .326 .25 .222 .265 .301 .313 GUNS .307 .076 .076 .076 .076 .076 REIT .307 .2 .184 .215 .261 .3 ETFS .29 .2 .254 .272 .363 .418 BIGBANKS .285 .285 .285 .285 .428 .428 RETAIL .276 .148 .127 .148 .234 .212 SOFTWARE .267 .25 .16 .178 .16 .214 LOWPRICE .264 .251 .211 .239 .259 .267 ELECTRON .263 .165 .105 .157 .195 .233 NIFTY .26 .195 .173 .282 .304 .304 SEMI .252 .168 .084 .105 .157 .178 CHINA .24 .24 .24 .28 .32 .3 DJI-13 .23 .076 .076 .153 .23 .23 BIOTECH .206 .178 .134 .162 .167 .189 NASD-100 .206 .144 .144 .206 .226 .237 HIGHPRIC .185 .123 .09 .109 .116 .127 AUTO .132 .132 .132 .113 .169 .169 SOLAR .125 0 0 0 0 0 GREEN .105 .105 .105 .105 .105 .157 COMPUTER .1 .05 .05 .05 .25 .25 HOMEBLDG .055 .055 0 0 0 0 BONDFUND 0 0 0 0 0 0 MARIJUAN 0 0 0 0 0 0 |
====================================================================================
6:30 Friday AM PCT
Both Russia and Ukraine are ready to talk about neutralization as a condition
of peace according to report in RT.com.
https://www.rt.com/russia/550617-response-to-negotiations-ukraine/
4:30 AM Friday - DJI -222 NASDAQ-70 Data used 2-24-2021 ---
| We have no new Peerless Buy Signal
but a 4% Short-term recovery in the DJI could be shaping up. The DJI is 4.2% below its falling 21-dma. A short-term rally without a new Peerless Buy signal would likely take the DJI back only to that moving average, not unlike the last DJI rally did. The market seems now to have built into it a three-months' long Russian occupation of the Ukraine. It is hoping for no wider or longer war. A brief rally would also be in keeping with seasonal bullishness for the next four weeks. What about today's oversold recovery? By now, we are getting used to seeing 800-point reversal-rallies. This is mainly the result of the FED's back-stopping the key indexes starting in late March 2020. These rallies make it hard for the Public to participate. And they do usually go back to the upper band. Peace in the Ukraine would also do that. A further big drop in short-term interest rates should also send the key indexes, if not the broad market, back up. Today, those short-term rates fell by -.57%, all the way back to 2.83%. The FED is very intent on preventing the Public from seeing how weak the real stock market is. The Wall Street press never highlights the 5:1, 10:1, 20:1, and now 40:1 ratio of new lows new highs. Peerless still has not given us a reversing Buy, mainly because the V-Indicator is so negative. Even a short-term Buy based on the Stochastic K-Line crossing back above the Pct-D is in doubt because the DJI at this writing is under 33,000 and the 10%-down-from-its-peak level. Our Closing Powers rose a long ways today, but they did not quite break their downtrends for DIA, SPY, and QQQ. So, we still need to see the DJI close clearly back above 33,000 after a weak opening to get a short-term Buy. And as I said (or warned above), even then, any DJI rally will face lots of resistance at its quickly falling 21-dma. The uncertainties of the war in Ukraine justify continued caution. But cover some of your bearish MINCPs on early weakness today. Take profits in UCO and the Oil ETFs. But hold long the commodity ETFs. Once again, short-term traders might go long NVDA if we see a strong close today above 33,000 on the DJI. Putin's Motivation? Dangerously Unclear. Putin's attack on Ukraine is very dangerous and the market is recogizing this more and. No one knows where the attack will lead. War brings unforeseen consequences. And making matters worse, Putin's motivations are unclear. What is obvious is his growing hostility towards the US. On the surface, the Russian attack on the Ukraine seems mad. It will only bring more hostility and isolation down on Putin personally. Apparently, he does not care. He believes his purpose is to bring about a self-sufficient Russia that looks inward and does not need the West, which he believes will rotten, weaken and collapse in time, all from its own contradictions. In particular, he does not trust American leaders. They lie and lie about not menacing Russia, but the NATO bases keep getting closer and closer despite promises in 1991 that NATO would not expand eastward. In his mind, Putin is again back in World War II. He must destroy the far-right SS admirers in the Ukraine who played were principal participants in the overthrowing of the the elected pro-Russian Ukrainian President in February 2014. Without American backing for the coup, Ukraine would still be a Russian ally and not seeking to join NATO Above all, he believes he must prevent the Ukraine from providing more forward-placed NATO bases right on their 1424 mile border with Russia. The NY Times writes that the man has been isolated more and more since Covid and has become obessessed with righting historical wrongs and slights he attributes to the U.S., in particular. He sees the Ukraine as a "pupper-state" made in the US and sustained by the U.S. Accordingly he has warned the American President that Russia has nuclear weapons with delivery systems that in some cases are superior to those the Americans have. "Do not interfere". Or you may experience a war like you have never known in your history, he said yesterday. | https://www.nytimes.com/2022/02/24/world/europe/putin-russia-ukraine.html?campaign_id=2&emc=edit_th_20220225&instance_id=54219&nl=todaysheadlines®i_id=58223894&segment_id=83894&user_id=ebc2a133c7a3b83a9a92049aae5a2e03 |
||
|
Charts - 2/24/2022 2022 PEERLESS DJI, Signals, Indicators Daily DJI Volume 10-DayUp/Down Vol Stoch-20 Pct of All Stocks above 65-dma Inverted Traders Index Cum. Inverted Traders Index DJI-IPA DJI-OBV NASDAQ S&P OEX NYSE DJI-15 DJI-20 DJI-30 DIA QQQ SPY IWM TNA Short-Term Rates Ten Year Rates DOLLAR-UUP ALLSTOCKs recent 2006 vers-Peerless signals http://tigersoftware.com/NEWPEER/UPD80224.BMP MDY - http://www.tigersoftware.com/CHARTZ/MDY.GIF USO-CrudeOil DBO FAS GLD HD IBB JETS JNUG KOL NUGT OIH PALL RSX RETL SDS AGQ SLV SOXL TAN TECL TLT TMF TNA UGA China: YINN CHAU Commodities: CANE CORN DBC JJC, NIB CORN, CUT (paper) MOO, SOYB WEAT UUP (Dollar) LIT (Lithium) STOCKS: MRNA DIS GE PYPL GME ZOM XLE NRGU AAPL ADBE ALXN AMAT AMGN AMD AMZN AXP BA BABA BAC BIDU BLDP CAT CRM CVX CMG DE ENPH FB GILD GOOG GS HD IBM INTU JPM LRCX MRK MSFT NEM NFLX NKE NVDA PG PYPL REGN REV SO SQ QCOM QDEL TSLA TXN XOM V VRTX WFC WMT ZM Bullish MAXCPs http://tigersoftware.com/UPPER/2-24/BULLISH.htm Bearish MINCPs http://tigersoftware.com/DOWNER/2-24/BEARISH.htm |
|
 |
 |
 |
 |
 |
 |
 |
Table 1 QUICKSILVER on ETFS - 2/24/2022 Bullish = 4 - GLD CORN OIH WEAT Bearish = 3 - RETL RSX ETF CLOSE CHANGE PIVOT-PT 5-dma AROC CL-PWR CANDLE IP21 ITRS POWER INDEX ================================================================================================== DIA 332.34 .82 343.68 -254.6% ------- BLUE .052 --- ---- --------------------------------------------------------------------------------------------- SPY 428.3 6.35 437.06 -210.9% ------- BLUE .07 -.013 .057 --------------------------------------------------------------------------------------------- QQQ 340.49 11.07 345.45 -227.3% ------- BLUE .008 -.063 -.055 --------------------------------------------------------------------------------------------- MDY 472.32 6.89 482.01 -213.5% Bullish BLUE -.012 .01 -.002 --------------------------------------------------------------------------------------------- IWM 198.04 5.06 201.2 -211.9% Bullish BLUE .039 -.014 .025 --------------------------------------------------------------------------------------------- FAS 114.26 -3.54 126.45 -902.1% ------- BLUE .028 -.018 .01 --------------------------------------------------------------------------------------------- RETL 20.34 2.13 22.74 -1003.4% Bearish BLUE .024 -.346 -.322 Bearish --------------------------------------------------------------------------------------------- SOXL 39.94 4.03 40.87 -765.7% Bullish BLUE .078 -.29b -.212 --------------------------------------------------------------------------------------------- TECL 55.3 5.03 57.63 -709% Bullish BLUE .124 -.275 -.151 --------------------------------------------------------------------------------------------- IBB 124.59 3.09 126 -212.3% ------- BLUE .043 -.097 -.054 --------------------------------------------------------------------------------------------- GLD 177.14 -1.15 177.25 64.4% ------- RED .23 .13 .36 Bullish --------------------------------------------------------------------------------------------- OIH 236.95 -.86 245.63 -239.7% Bullish RED .098 .324 .422 Bullish --------------------------------------------------------------------------------------------- CPER 27.44 .32 27.46 -36.4% ------- BLUE .072 .118 .19 --------------------------------------------------------------------------------------------- UUP 25.97 .21 25.65 64.2% Bearish RED -.049 .075 .026 --------------------------------------------------------------------------------------------- CORN 24.5 .16 23.4 250.3% Bullish RED .185 .216 .401 Bullish --------------------------------------------------------------------------------------------- WEAT 8.83 .41 7.69 837.4% Bullish RED .241 .233 .474 Bullish --------------------------------------------------------------------------------------------- YINN 7.06 -.18 8.9 -1242% ------- BLUE .061 -.172 -.111 --------------------------------------------------------------------------------------------- RSX 15.39 -3.63 24.18 -2242.9% ------- BLUE .037 -.354 -.317 Bearish |
Table 2    Count of Stocks in Key Directories
           20220224
-------------------------------
NEWHIGHS       51
NEWLOWS        2136  40:1 ratio
MAXCP          34
MINCP          18
TTTNH          41
TTTNL          40
CPCROSSA       677
CPCROSSD       64
ACCUMVER       4
HIGHIP21       13
HIUPPCT        107
VHIP21         45
LOWACCUM       261
REDSELL        151
AUGSELS7       15
TRAPDOOR       20
|
Table 3     RANKING OF KEY DIRECTORIES BASED PCT.OF STOCKS ABOVE 65-DMA
              2/24/22
 Bullish = 8
 Bearish = 39
---------------------------------------------------------------------------------------
Directory     Current       day-1         day-2         day-3         day-4         day-5
----------------------------------------------------------------------------------------
COAL           1             1             1             1             1             1
COPPER         .875          .875          .875          .875          .875          .875
FOOD           .795          .795          .795          .836          .836          .816
OILGAS         .771          .704          .733          .761          .8            .828
COMODITY       .769          .769          .769          .82           .82           .794
GOLD           .739          .847          .739          .804          .826          .782
JETS           .642          .5            .714          .785          .785          .785
MILITARY       .615          .576          .653          .615          .653          .73
===============================================================================================
EDU            .5            .5            .333          .333          .5            .166
HOSPITAL       .5            .437          .562          .562          .625          .687
===============================================================================================
GAMING         .473          .315          .315          .421          .526          .631
INDMATER       .444          .444          .444          .5            .527          .569
INSURANC       .44           .56           .68           .68           .68           .68
INFRA          .424          .363          .393          .424          .424          .484
HACKERS        .368          .21           .263          .263          .315          .421
TRANSP         .368          .263          .421          .421          .421          .526
FIDSTKS        .36           .343          .431          .473          .491          .556
FINANCE        .357          .339          .428          .47           .488          .553
SP-100         .333          .344          .388          .411          .433          .544
INDEXES        .318          .318          .351          .383          .41           .427
BEVERAGE       .285          .428          .5            .428          .428          .428
BIGBANKS       .285          .285          .285          .428          .428          .714
UTILITY        .282          .256          .358          .358          .358          .256
SP500          .276          .286          .336          .374          .38           .438
DOWJONES       .266          .233          .3            .366          .366          .466
LOWPRICE       .254          .211          .236          .259          .269          .297
RUS-1000       .25           .222          .265          .301          .313          .349
SOFTWARE       .25           .16           .178          .16           .214          .303
CHINA          .24           .24           .28           .32           .28           .32
CHEM           .239          .347          .282          .369          .413          .478
ETFS           .2            .254          .272          .363          .4            .454
REIT           .2            .176          .223          .261          .3            .307
NIFTY          .195          .173          .26           .304          .304          .326
BIOTECH        .178          .134          .162          .167          .186          .228
SEMI           .168          .084          .105          .157          .178          .284
ELECTRON       .165          .105          .157          .195          .233          .285
RETAIL         .148          .127          .148          .234          .212          .212
NASD-100       .144          .144          .195          .226          .237          .278
AUTO           .132          .132          .113          .169          .169          .245
HIGHPRIC       .123          .09           .109          .116          .116          .192
REGBANKS       .12           .4            .48           .44           .44           .64
GREEN          .105          .105          .105          .105          .157          .157
DJI-13         .076          .076          .153          .23           .23           .461
GUNS           .076          .076          .076          .076          .076          .153
HOMEBLDG       .055          0             0             0             0             .055
COMPUTER       .05           .05           .05           .25           .25           .45
BONDFUND       0             0             0             0             0             0
MARIJUAN       0             0             0             0             0             0
SOLAR          0             0             0             0             0             0
|
===================================================================================
4:30 AM Thursday - DJI -861 NASDAQ-428 Data used 2-23-2021 ---
| How Can the Russian Invasion of
Ukraine not Spread? What will NATO do? So many bad possibilities, no one wants to be the optimist and Buy. The DJI now has a technical target down 20% from its 38000 high, near 30000. Operative Peerless Signal remains the Sell S16. There was no Buy, even short-term for traders. The weak closing Wednesday cafter the up-opening should have made that clear. ---------------------------------------------------------------------------------- President Biden warned everyone that Russia was about to attack the Ukraine. Putin did not intend to simply protect the two breakaway Republics from the Ukraine, the American intelligence sources said. They proved correct. And once again N.Y. Professionals knew best. Today (Wednesday) they quickly dismissed an early DJI rally and sold heavily all day long. Our downtrending Closing Powers were our first warning. The second was the steadily deeply red (negative) readings from our V-Indicator. This we said overwhelms and negates a positive Accumulation Index. One historic market top after another has shown this pattern. (See for yourself if you have our software. Draw the Peerless charts for 1972-1973, 2000, 2001, 2002 and 2002-2003 and look at the V-Indicator.) The third warning was the series of bottoms about 8% down from the DJI's highs, all nicely lined up and beckoning for a breakdown. For me, most convincing warning was the 10:1 to 15:1 to 20:1 ratio of new lows to new highs. This meant more and more stress was being put on the blue-chip DJI average to hold up appearances of a safe market for the broad public. And without the Fed to support the market with give-away loans to Wall Street anymore, the stress was just too much. Making a negative and bearish prognosis almost inevitable was not Putin's paranoia (NATO does surround Russia), but the ultimate bearishness of 10% Inflation on rates. The FED cannot artificially hold the market up anymore and any correction has to be deep now. The DJI will now almost certainly close down more than 10% from its highs. This is tecnically important. It will set up a minimum DJI target 20% down from its peak. In addition, the breakdown below well-tested support should make us not trust Stochastic Buy signals now or even the Inverted Traders Index. It will be best for us to await Peerless Buys and then watch the downtrending Closing Powers and believe the Buy signal only once the Closing Powers'd downtrends are broken. In other words, Professionals will probably again be the first to know when we can buy safely. The steady weakness in DIA after its up-opening should have prevented us from buying DIA on Wednesday. The K-Line certainly did not turn up. But our long positions in commodities and Crude Oil stocks rose and should keep rising. So, hold those long. And continue to hold some of the many bearish MINCPs as short sales. It is likely that DIA will go considerably lower. The sell-off will now most likely focus on those "secure": blue chips that have avoided being hit hard to date. As for shorting, DIA or buying the inverted bearish ETFS, the volatility is so high now, shorting them will be, as they say, like getting aboard a fast moving train. The real danger is now that Professionals will aggressively buy leveraged short ETS and the "tail will wag the dog". this is their buying will work to drag down the major market ETFs very dramatically, just as their buying always seemed to come in and support the market from April 2020 to December 2021. The FED needs to police how all the money they loaned out is now being used, but, of course, they won't. |
||
|
Charts - 2/23/2022
2022 PEERLESS DJI, Signals, Indicators Daily DJI Volume 10-DayUp/Down Vol Stoch-20 Pct of All Stocks above 65-dma Inverted Traders Index Cum. Inverted Traders Index DJI-IPA DJI-OBV NASDAQ S&P OEX NYSE DJI-15 DJI-20 DJI-30 DIA QQQ SPY IWM TNA Short-Term Rates Ten Year Rates DOLLAR-UUP ALLSTOCKs recent 2006 vers-Peerless signals http://tigersoftware.com/NEWPEER/UPD80223.BMP MDY - http://www.tigersoftware.com/CHARTZ/MDY.GIF USO-CrudeOil DBO FAS GLD HD IBB JETS JNUG KOL NUGT OIH PALL RSX RETL SDS AGQ SLV SOXL TAN TECL TLT TMF TNA UGA China: YINN CHAU Commodities: CANE CORN DBC JJC, NIB CORN, CUT (paper) MOO, SOYB WEAT UUP (Dollar) LIT (Lithium) STOCKS: MRNA DIS GE PYPL GME ZOM XLE NRGU AAPL ADBE ALXN AMAT AMGN AMD AMZN AXP BA BABA BAC BIDU BLDP CAT CRM CVX CMG DE ENPH FB GILD GOOG GS HD IBM INTU JPM LRCX MRK MSFT NEM NFLX NKE NVDA PG PYPL REGN REV SO SQ QCOM QDEL TSLA TXN XOM V VRTX WFC WMT ZM Bullish MAXCPs http://tigersoftware.com/UPPER/2-23/BULLISH.htm Bearish MINCPs http://tigersoftware.com/DOWNER/2-23/BEARISH.htm |
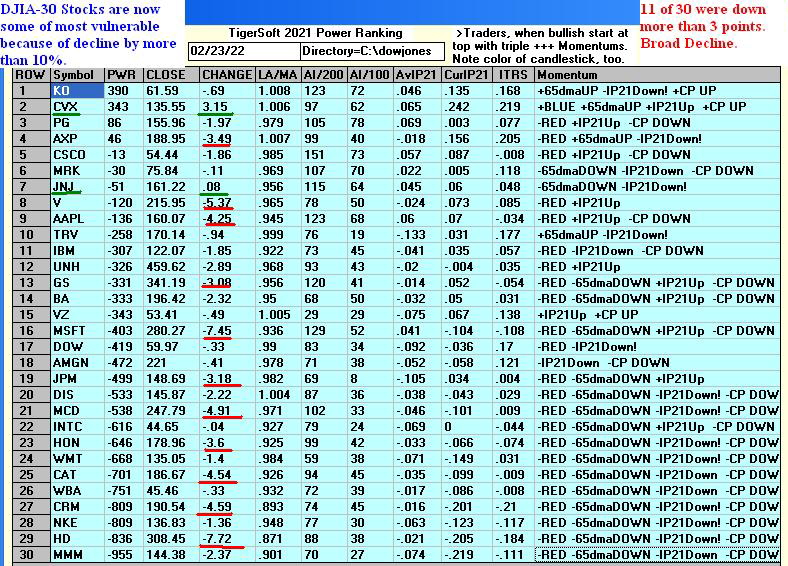 |
 |
 |
 |
 |
 |
 |
 |
 |
Commodities look bullish   |
Table 1 QUICKSILVER on ETFS - 2/23/2022 Bullish = 4 - GLD CORN OIH WEAT Bearish = 3 - RETL SOXL TECL ETF CLOSE CHANGE PIVOT-PT 5-dma AROC CL-PWR CANDLE IP21 ITRS POWER INDEX ================================================================================================== DIA 331.52 -4.49 349.67 -271.7% Bearish RED .025 --- ----- --------------------------------------------------------------------------------------------- SPY 421.95 -7.62 446.6 -275.2% Bearish RED .002 -.024 -.022 --------------------------------------------------------------------------------------------- QQQ 329.42 -8.66 356.04 -384.4% Bearish RED -.081 -.093 -.174 --------------------------------------------------------------------------------------------- MDY 465.43 -7.96 492.76 -267.3% ------- RED -.05 -.003 -.053 --------------------------------------------------------------------------------------------- IWM 192.98 -3.68 206.49 -323.8% ------- RED -.003 -.043 -.046 --------------------------------------------------------------------------------------------- FAS 117.8 -5.86 137.03 -706.1% Bearish RED -.026 -.013 -.039 --------------------------------------------------------------------------------------------- RETL 18.21 -1.41 24.65 -1599.5% Bearish RED -.044 -.445 -.489 Bearish --------------------------------------------------------------------------------------------- SOXL 35.91 -2.7 46.1 -1195.4% Bearish RED -.024 -.389 -.413 Bearish --------------------------------------------------------------------------------------------- TECL 50.27 -4.06 63.28 -1125.1% Bearish RED .027 -.352 -.325 Bearish --------------------------------------------------------------------------------------------- IBB 121.5 -2.66 129.91 -333.8% Bearish RED -.029 -.095 -.124 --------------------------------------------------------------------------------------------- GLD 178.29 .8 174.86 148% Bullish BLUE .316 .15 .466 Bullish --------------------------------------------------------------------------------------------- OIH 237.81 1.08 248.54 -105.2% Bullish RED .128 .285 .413 Bullish --------------------------------------------------------------------------------------------- CPER 27.12 -.35 27.64 -92.6% ------- RED .017 .114 .131 --------------------------------------------------------------------------------------------- UUP 25.76 .03 25.64 13.6% ------- BLUE -.005 .08 .075 --------------------------------------------------------------------------------------------- CORN 24.34 .13 23.31 272.1% Bullish BLUE .292 .207 .499 Bullish --------------------------------------------------------------------------------------------- WEAT 8.42 .29 7.51 597.6% Bullish BLUE .409 .195 .604 Bullish --------------------------------------------------------------------------------------------- YINN 7.24 -.26 9.09 -992.9% ------- RED -.035 -.181 -.216 --------------------------------------------------------------------------------------------- RSX 19.02 -1.95 25.5 -1293.8% Bearish RED .042 -.242 -.2 |
 Table 2  Count of Stocks in Key Directories
          20220223
-------------------------------
NEWHIGHS       51
NEWLOWS        1116
MAXCP          12
MINCP          400
TTTNH          23
TTTNL          189
CPCROSSA       14
CPCROSSD       244
ACCUMVER       4
HIGHIP21       11
HIUPPCT        102
VHIP21         45
LOWACCUM       238
REDSELL        151
AUGSELS7       12
TRAPDOOR       33
|
Table 3  RANKING OF KEY DIRECTORIES BASED PCT.OF STOCKS ABOVE 65-DMA
              2/23/22
 Bullish = 8
 Bearish = 39
---------------------------------------------------------------------------------------
Directory     Current       day-1         day-2         day-3         day-4         day-5
----------------------------------------------------------------------------------------
COAL           1             1             1             1             1             1
COPPER         .875          .875          .875          .875          .875          .875
GOLD           .847          .739          .804          .826          .782          .673
FOOD           .795          .795          .836          .836          .816          .816
COMODITY       .769          .769          .82           .82           .794          .794
OILGAS .704 .733 .761 .8 .828 .79 MILITARY .576 .653 .615 .653 .692 .653 INSURANC .56 .68 .68 .68 .68 .64 ================================================================================================ EDU .5 .333 .333 .5 .166 .166 JETS .5 .714 .785 .785 .785 .785 ================================================================================================ INDMATER .444 .444 .5 .527 .555 .569 HOSPITAL .437 .562 .562 .625 .687 .625 BEVERAGE .428 .5 .428 .428 .428 .428 REGBANKS .4 .48 .44 .44 .64 .64 INFRA .363 .393 .424 .424 .484 .484 CHEM .347 .282 .369 .413 .434 .5 SP-100 .344 .388 .411 .433 .544 .544 FIDSTKS .343 .431 .473 .491 .556 .562 FINANCE .339 .428 .47 .488 .553 .559 INDEXES .318 .351 .383 .41 .432 .41 GAMING .315 .315 .421 .526 .631 .684 SP500 .286 .336 .372 .38 .438 .432 BIGBANKS .285 .285 .428 .428 .714 .714 TRANSP .263 .421 .421 .421 .526 .421 UTILITY .256 .358 .358 .358 .256 .23 ETFS .254 .272 .363 .4 .472 .454 CHINA .24 .28 .32 .28 .32 .28 DOWJONES .233 .3 .366 .366 .466 .466 RUS-1000 .222 .265 .301 .313 .341 .316 LOWPRICE .213 .234 .256 .269 .297 .277 HACKERS .21 .263 .263 .315 .421 .421 REIT .176 .215 .269 .3 .3 .215 NIFTY .173 .26 .282 .304 .326 .347 SOFTWARE .16 .178 .16 .214 .303 .321 NASD-100 .144 .195 .216 .237 .278 .309 BIOTECH .134 .162 .167 .186 .222 .233 AUTO .132 .113 .169 .169 .245 .207 RETAIL .127 .148 .234 .212 .212 .255 ELECTRON .105 .157 .195 .233 .285 .248 GREEN .105 .105 .105 .157 .157 .157 HIGHPRIC .09 .109 .116 .116 .192 .178 SEMI .084 .105 .157 .178 .284 .263 DJI-13 .076 .153 .23 .23 .461 .538 GUNS .076 .076 .076 .076 .076 .153 COMPUTER .05 .05 .25 .25 .4 .35 BONDFUND 0 0 0 0 0 0 HOMEBLDG 0 0 0 0 .055 0 MARIJUAN 0 0 0 0 0 0 SOLAR 0 0 0 0 0 0 |
====================================================================================
5:45 AM Wednesday - DJI + 245 NASDAQ +165 Data used 2-22-2021 ----
| Half of the DJI's 500 point decline today owed to just two of
its stocks (BA and HD). That makes the decline suspect as it pulls back closer and closer to what is often a very good spot to buy in some international crises that are about to end. President Zelenskyy ("Green" in Ukrainian) has asked for a peace conference. The former actor and comedian would appear to not want war with Russia which is led by the 25-year veteran President. Zelenskyy's peace overtures are bullish and should bring a cautious rally. Biden has imposed sanctions, but as of this writing there is no fighting in the Ukraine or the Donbas. Still, Peerless does not want to give a Buy signal, unless we trust the 2006 version of Peerless that was tested only for the period 1965-2006, not the full 1928-2022 period that the current Peerless has used for back-testing. The DJI's positive Accumulation and P-Indicator non-confirmation of the new low give a Buy B8 using Windows-2006, but these are not enough for the 2022 version of Peerless. The deeply negative V-Indicator readings and the now falling 65-dma count for more and offset the positive Accumulation Index level in the DJI. But I think we can expect the Stochastic-20 red K-Line to give a short-term judged Buy today. That will still depend on there being a strong closing for the DJI. We can get a short-term judged Buy without a new Peerless signal. This can occur only if the DJI does not retreat back more than 10% from its high, 33000. To get the short-term Buy, we will need to see the DJI's red 20-day Stochastic K-Line turn up from near its 10% level or below that. Ideally, it will then surpass its blue Pct-D. See the DJI chart below. And to be safe, DIA's Closing Power must rise above its downtrend. So, for now stay hedged: long the Oil and Commodity ETFs shown among the Bullish MAXCPs and short some of the many bearish MINCPs. The ratio of new lows to new highs remains well over 10:1. Only a few groups have more than 50% of their stocks above the 65-dma. Buy DIA if you are willing to sell it on a DJI close below 33000. |
||
|
Charts - 2/22/2022
2022 PEERLESS DJI, Signals, Indicators Daily DJI Volume 10-DayUp/Down Vol Stoch-20 Pct of All Stocks above 65-dma Inverted Traders Index Cum. Inverted Traders Index DJI-IPA DJI-OBV NASDAQ S&P OEX NYSE DJI-15 DJI-20 DJI-30 DIA QQQ SPY IWM TNA Short-Term Rates Ten Year Rates DOLLAR-UUP ALLSTOCKs recent 2006 vers-Peerless signals http://tigersoftware.com/NEWPEER/UPD80222.BMP MDY - http://www.tigersoftware.com/CHARTZ/MDY.GIF USO-CrudeOil DBO FAS GLD HD IBB JETS JNUG KOL NUGT OIH PALL RSX RETL SDS AGQ SLV SOXL TAN TECL TLT TMF TNA UGA China: YINN CHAU Commodities: CANE CORN DBC JJC, NIB CORN, CUT (paper) MOO, SOYB WEAT UUP (Dollar) LIT (Lithium) STOCKS: MRNA DIS GE PYPL GME ZOM XLE NRGU AAPL ADBE ALXN AMAT AMGN AMD AMZN AXP BA BABA BAC BIDU BLDP CAT CRM CVX CMG DE ENPH FB GILD GOOG GS HD IBM INTU JPM LRCX MRK MSFT NEM NFLX NKE NVDA PG PYPL REGN REV SO SQ QCOM QDEL TSLA TXN XOM V VRTX WFC WMT ZM Bullish MAXCPs http://tigersoftware.com/UPPER/2-22/BULLISH.htm Bearish MINCPs http://tigersoftware.com/DOWNER/2-22/BEARISH.htm |
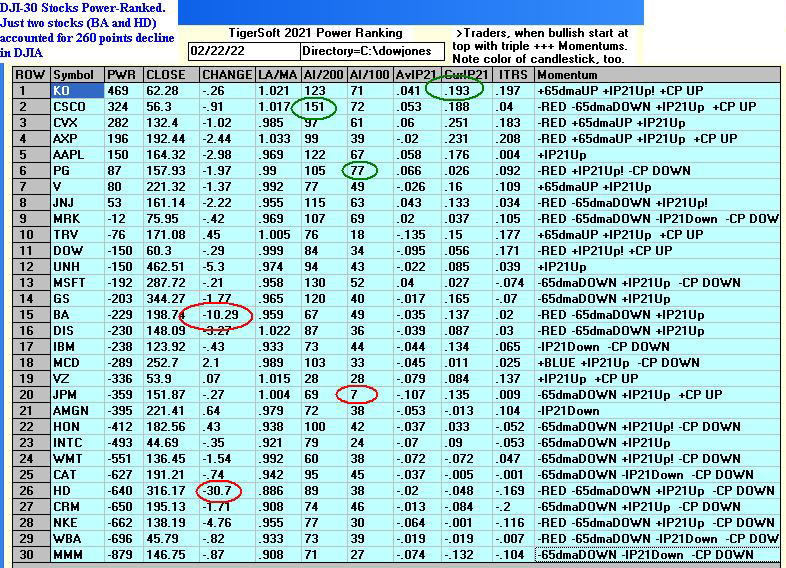 |
  |
 |
 |
 |
 |
Table 1 QUICKSILVER on ETFS - 2/22/2022 Bullish = 4 - GLD CORN OIH WEAT Bearish = 2 - RETL SOXL ETF CLOSE CHANGE PIVOT-PT 5-dma AROC CL-PWR CANDLE IP21 ITRS POWER INDEX ================================================================================================== DIA 336.01 -4.97 350.22 -142.7% ------- RED .185 ----- ----- --------------------------------------------------------------------------------------------- SPY 429.57 -4.66 446.1 -107.2% Bearish RED .131 -.017 .114 --------------------------------------------------------------------------------------------- QQQ 338.08 -3.43 356.13 -134.7% Bearish RED .064 -.08 -.016 --------------------------------------------------------------------------------------------- MDY 473.39 -6.73 491.3 -77% Bullish RED .116 -.004 .112 --------------------------------------------------------------------------------------------- IWM 196.66 -2.81 206.06 -99.1% Bullish RED .105 -.046 .059 --------------------------------------------------------------------------------------------- FAS 123.66 -2.4 136.14 -273.8% Bullish RED .121 .018 .139 --------------------------------------------------------------------------------------------- RETL 19.62 -2.54 25.55 -762.7% Bearish RED .102 -.429 -.327 Bearish --------------------------------------------------------------------------------------------- SOXL 38.61 -1.02 46.01 -115.5% Bullish BLUE .093 -.352 -.259 Bearish --------------------------------------------------------------------------------------------- TECL 54.33 -1.53 63.53 -388.4% Bearish BLUE .182 -.286 -.104 --------------------------------------------------------------------------------------------- IBB 124.16 -.88 129.98 -137.8% ------- BLUE .088 -.108 -.02 --------------------------------------------------------------------------------------------- GLD 177.49 .37 173.08 78.4% Bullish RED .323 .132 .455 Bullish --------------------------------------------------------------------------------------------- OIH 236.73 -3.28 242.92 -53.8% Bullish RED .198 .285 .483 Bullish --------------------------------------------------------------------------------------------- CPER 27.47 -.09 27.63 14.5% Bullish RED .124 .107 .231 --------------------------------------------------------------------------------------------- UUP 25.73 .01 25.69 -11.7% ------- ---- -.043 .059 .016 --------------------------------------------------------------------------------------------- CORN 24.21 .6 23.06 117.5% Bullish BLUE .293 .181 .474 Bullish --------------------------------------------------------------------------------------------- WEAT 8.13 .47 7.5 275.8% Bullish BLUE .362 .147 .509 Bullish --------------------------------------------------------------------------------------------- YINN 7.5 -.63 8.93 -590.9% ------- RED .058 -.173 -.115 --------------------------------------------------------------------------------------------- RSX 20.97 -2.05 25.17 -581.5% ------- BLUE .174 -.194 -.02 |
 Table 2   Count of Stocks in Key Directories
           20220222
-------------------------------
NEWHIGHS       61
NEWLOWS        997
MAXCP          14
MINCP          155
TTTNH          28
TTTNL          79
CPCROSSA       53
CPCROSSD       50
ACCUMVER       2
HIGHIP21       15
HIUPPCT        97
VHIP21         48
LOWACCUM       220
REDSELL        149
AUGSELS7       9
TRAPDOOR       23
|
Table 3   RANKING OF KEY DIRECTORIES BASED PCT.OF STOCKS ABOVE 65-DMA
              2/22/22
  Bullish = 10
  Bearish = 38
---------------------------------------------------------------------------------------
Directory     Current       day-1         day-2         day-3         day-4         day-5
----------------------------------------------------------------------------------------
COAL           1             1             1             1             1             1
COPPER         .875          .875          .875          .875          .875          .875
FOOD           .795          .836          .836          .816          .816          .816
COMODITY       .769          .82           .82           .794          .794          .794
GOLD           .739          .804          .826          .782          .63           .695
OILGAS .733 .761 .8 .828 .79 .78 JETS .714 .785 .785 .785 .785 .714 INSURANC .68 .68 .68 .68 .64 .6 MILITARY .653 .615 .653 .692 .653 .615 HOSPITAL .562 .562 .625 .687 .625 .312 =============================================================================================== BEVERAGE .5 .428 .428 .428 .428 .285 =============================================================================================== REGBANKS .48 .44 .44 .64 .64 .52 INDMATER .444 .5 .527 .555 .569 .5 FIDSTKS .431 .473 .491 .556 .568 .485 FINANCE .428 .47 .488 .553 .565 .482 TRANSP .421 .421 .421 .526 .421 .368 INFRA .393 .424 .424 .484 .454 .393 SP-100 .388 .411 .433 .544 .555 .488 UTILITY .358 .358 .358 .256 .23 .282 INDEXES .351 .383 .41 .432 .416 .394 SP500 .336 .372 .378 .438 .43 .364 EDU .333 .333 .5 .166 .166 .166 GAMING .315 .421 .526 .631 .684 .473 DOWJONES .3 .366 .366 .466 .5 .4 BIGBANKS .285 .428 .428 .714 .714 .714 CHEM .282 .369 .413 .434 .5 .369 CHINA .28 .32 .28 .32 .26 .26 ETFS .272 .363 .4 .472 .454 .29 RUS-1000 .265 .301 .313 .341 .313 .255 HACKERS .263 .263 .315 .421 .421 .263 NIFTY .26 .282 .282 .326 .347 .282 LOWPRICE .236 .254 .267 .297 .282 .231 REIT .215 .261 .307 .3 .215 .176 NASD-100 .195 .216 .226 .278 .309 .226 SOFTWARE .178 .16 .214 .303 .321 .303 BIOTECH .162 .167 .186 .222 .228 .17 ELECTRON .157 .195 .233 .285 .248 .12 DJI-13 .153 .23 .23 .461 .538 .384 RETAIL .148 .234 .212 .212 .234 .17 AUTO .113 .169 .169 .245 .207 .094 HIGHPRIC .109 .116 .116 .192 .178 .116 GREEN .105 .105 .157 .157 .157 .157 SEMI .105 .157 .178 .284 .263 .094 GUNS .076 .076 .076 .076 .153 .153 COMPUTER .05 .25 .25 .4 .35 .25 BONDFUND 0 0 0 0 0 0 HOMEBLDG 0 0 0 .055 0 0 MARIJUAN 0 0 0 0 0 0 SOLAR 0 0 0 0 0 0 |
====================================================================================
5:45 AM Tuesday - DJI - 116 NASDAQ -145 Data used 2-18-2021 ----
| The operative Peerless signal remains a Sell S16.
But we could get a buy signal, Buy B2 or B17, if the DJI stabalizes about 3% below the lower band. The IP21-Accumulation Index is positive at this stage. The old 2006 Peerless has rendered a Buy B8. And a peaceful settlement of the Ukraine stand-off would likely be very bullish based on what happened when there was no war in 1937 with NAZI Germany over the Sudetenland or with the USSR over the Soviet missles place in Cuba in 1962 to deter another American invasion of the island. In both cases, the level of fear reached panic-selling proportions as the crises unfolded and the DJI dropped to a point exactly 10% down from a recent peak. When the crises ended there was a vacuum of sell orders just over head. When Prime Minister Chamberlain avoided war with Nazi Germany over the Sudetenland in Czechoslovakia, the DJI rose nearly 20% after retreating to the 10%-down from the recent peak level. And when President Kenedy avoided war with the USSR over the Cuban missiles in Cuba in the Fall of 1962, it began a three year bull market. Today the DJI was down more than 500 points before the opening, but now it has rallied to only -100. The hope on Wall Street is that the Ukraine will not challenge the independence of the two separtist, mostly Russian speaking, regions in southeastern Ukraine (The Donbas). The Russians have positioned an over-whelming amount of fire-power all around Ukraine to discourage any attack on the two breakaway regions. Now it depends on what Ukraine chooses to do. If the Ukraine attacks these two Donbas regions that have declared independence and now signed defense treaties with Russia, all bets are off. So, the uncertainty about what Ukraine will do remains unresolved. That should hold back the market somewhat unless Wall Street insiders get the word that the independent regions around Donyetsk and Luhansk are safe from a Ukrainian attack. Once it is clear that Ukraine will not attack them, a very strong rally will have probably already have started. On this basis, I would buy DIA if its Closing Power downtrend is broken even if we do not get a new Peerless buy signal. The rally will likely go at least back to the upper 2.5% band. The recovery will go up even more if the FED backs away from sharply raising interest rates. Expect "peace" leaks. Before Chamberlain returned to London from Munich and announced that Britain would not go to war over the Sudetenland, there were numerous other signs and events that showed this would be so. We already have President Biden saying that US troops will not be used to fight for Ukraine. Putin is not so foolish as to go to war with NATO over the very poor Donbass area. But he also knows that the NATO nations also will not. If he attacks northern Ukraine, all bets will be off. He will use the troops to defend the two predominately Russian-speaking provinces. Will that fighting spread further. If it looks so, do not Buy. Watch the Professionals through the medium of our Closing Power. |
||
|
Charts - 2/18/2022 2022 PEERLESS DJI, Signals, Indicators Daily DJI Volume 10-DayUp/Down Vol Stoch-20 Pct of All Stocks above 65-dma Inverted Traders Index Cum. Inverted Traders Index DJI-IPA DJI-OBV NASDAQ S&P OEX NYSE DJI-15 DJI-20 DJI-30 DIA QQQ SPY IWM TNA Short-Term Rates Ten Year Rates DOLLAR-UUP ALLSTOCKs recent 2006 vers-Peerless signals http://tigersoftware.com/NEWPEER/UPD80218.BMP MDY - http://www.tigersoftware.com/CHARTZ/MDY.GIF USO-CrudeOil DBO FAS GLD HD IBB JETS JNUG KOL NUGT OIH PALL RSX RETL SDS AGQ SLV SOXL TAN TECL TLT TMF TNA UGA China: YINN CHAU Commodities: CANE CORN DBC JJC, NIB CORN, CUT (paper) MOO, SOYB WEAT UUP (Dollar) LIT (Lithium) STOCKS: MRNA DIS GE PYPL GME ZOM XLE NRGU AAPL ADBE ALXN AMAT AMGN AMD AMZN AXP BA BABA BAC BIDU BLDP CAT CRM CVX CMG DE ENPH FB GILD GOOG GS HD IBM INTU JPM LRCX MRK MSFT NEM NFLX NKE NVDA PG PYPL REGN REV SO SQ QCOM QDEL TSLA TXN XOM V VRTX WFC WMT ZM Bullish MAXCPs http://tigersoftware.com/UPPER/2-18/BULLISH.htm Bearish MINCPs http://tigersoftware.com/DOWNER/2-18/BEARISH.htm |
|
"Peace in Our Times?" A peaceful settlement of the Ukraine stand-off would likely be very bullish. The level of fear has caused a lot of panic-selling. But when that ends there will be a vacuum of sell orders just over head. 1938-1939  1961-1962  ===================================================================================  |
 |
 |
 |
 |
 |
 |
 |
 |
 |
 |
Table 1 QUICKSILVER on ETFS - 2/18/2022 Bullish = 3 - GLD CORN OIH Bearish = 2 - RETL SOXL ETF CLOSE CHANGE PIVOT-PT 5-dma AROC CL-PWR CANDLE IP21 ITRS POWER INDEX ================================================================================================== DIA 340.98 -2.7 345.89 -90.8% Bearish RED .118 0 ----- --------------------------------------------------------------------------------------------- SPY 434.23 -2.83 439.02 -70.5% Bearish RED .066 -.028 .038 --------------------------------------------------------------------------------------------- QQQ 341.51 -3.94 347.49 -79.2% Bearish RED .003 -.098 -.095 --------------------------------------------------------------------------------------------- MDY 480.12 -1.89 480.87 -23.9% Bullish RED .052 -.019 .033 --------------------------------------------------------------------------------------------- IWM 199.47 -1.73 200.68 -47% Bullish RED .028 -.068 -.04 --------------------------------------------------------------------------------------------- FAS 126.06 -.39 130.85 -344.7% Bullish RED .081 .009 .09 --------------------------------------------------------------------------------------------- RETL 22.16 -.58 23.23 -306.8% ------- RED .123 -.405 -.282 Bearish --------------------------------------------------------------------------------------------- SOXL 39.63 -1.24 39.59 10.6% ------- RED .06 -.392 -.332 Bearish --------------------------------------------------------------------------------------------- TECL 55.86 -1.77 58.98 -259.6% Bearish RED .132 -.306 -.174 --------------------------------------------------------------------------------------------- IBB 125.04 -.96 127.68 -195.4% ------- RED .056 -.134 -.078 --------------------------------------------------------------------------------------------- GLD 177.12 -.13 174.74 94.7% ------- BLUE .304 .109 .413 Bullish --------------------------------------------------------------------------------------------- OIH 240.01 -5.62 239.35 -112.5% Bullish RED .198 .278 .476 Bullish --------------------------------------------------------------------------------------------- CPER 27.56 .1 27.39 76.5% Bullish RED .063 .078 .141 --------------------------------------------------------------------------------------------- UUP 25.72 .07 25.79 0% Bearish ---- -.056 .048 -.008 --------------------------------------------------------------------------------------------- CORN 23.61 .21 23.66 25.7% Bullish BLUE .252 .142 .394 Bullish --------------------------------------------------------------------------------------------- WEAT 7.66 -.03 7.71 -32.8% Bullish RED .104 .051 .155 --------------------------------------------------------------------------------------------- YINN 8.13 -.77 8.53 -373% ------- RED .025 -.124 -.099 --------------------------------------------------------------------------------------------- RSX 23.02 -1.16 23.8 -39% Bearish RED .067 -.139 -.072 |
    Count of Stocks in Key Directories
          20220218
-------------------------------
NEWHIGHS       53
NEWLOWS        632 Beairsh >10:1
MAXCP          33
MINCP          103
TTTNH          45
TTTNL          73
CPCROSSA       61
CPCROSSD       95
ACCUMVER       1
HIGHIP21       14
HIUPPCT        91
VHIP21         47
LOWACCUM       220
REDSELL        163
AUGSELS7       5
TRAPDOOR       23
|
 RANKING OF KEY DIRECTORIES BASED PCT.OF STOCKS ABOVE 65-DMA
               2/18/22
 Bullish = 10
 Bearish = 38
---------------------------------------------------------------------------------------
Directory     Current       day-1         day-2         day-3         day-4         day-5
----------------------------------------------------------------------------------------
COAL           1             1             1             1             1             1
COPPER         .875          .875          .875          .875          .875          .875
FOOD           .836          .836          .816          .816          .816          .816
COMODITY       .82           .82           .794          .794          .794          .794
GOLD           .804          .826          .782          .63           .695          .565
JETS .785 .785 .785 .785 .714 .714 OILGAS .761 .8 .828 .79 .771 .79 INSURANC .68 .68 .68 .64 .6 .68 MILITARY .615 .653 .692 .653 .615 .615 HOSPITAL .562 .625 .687 .625 .312 .5 ============================================================================================= INDMATER .5 .527 .555 .569 .5 .472 ============================================================================================= FIDSTKS .473 .491 .556 .568 .491 .526 FINANCE .47 .488 .553 .565 .488 .523 REGBANKS .44 .44 .64 .64 .52 .56 BEVERAGE .428 .428 .428 .428 .285 .428 BIGBANKS .428 .428 .714 .714 .714 .714 INFRA .424 .424 .484 .454 .393 .424 GAMING .421 .526 .631 .684 .473 .473 TRANSP .421 .421 .526 .421 .368 .368 SP-100 .411 .433 .544 .555 .5 .511 INDEXES .383 .41 .432 .416 .394 .405 SP500 .372 .378 .436 .43 .366 .402 CHEM .369 .413 .434 .5 .369 .369 DOWJONES .366 .366 .466 .5 .433 .4 ETFS .363 .4 .472 .454 .309 .327 UTILITY .358 .358 .256 .23 .282 .512 EDU .333 .5 .166 .166 .166 .166 CHINA .32 .28 .32 .26 .26 .26 RUS-1000 .301 .313 .341 .313 .253 .263 NIFTY .282 .282 .304 .347 .282 .282 HACKERS .263 .315 .421 .421 .263 .21 REIT .261 .3 .307 .215 .176 .207 LOWPRICE .256 .264 .295 .282 .231 .254 COMPUTER .25 .25 .4 .35 .25 .35 RETAIL .234 .212 .212 .234 .17 .212 DJI-13 .23 .23 .461 .538 .384 .461 NASD-100 .216 .226 .268 .309 .226 .257 ELECTRON .195 .233 .285 .248 .12 .112 AUTO .169 .169 .245 .207 .094 .15 BIOTECH .167 .186 .222 .228 .17 .184 SOFTWARE .16 .214 .303 .321 .303 .232 SEMI .157 .178 .284 .263 .094 .073 HIGHPRIC .116 .116 .192 .178 .116 .138 GREEN .105 .157 .157 .157 .157 .157 GUNS .076 .076 .076 .153 .153 .153 BONDFUND 0 0 0 0 0 0 HOMEBLDG 0 0 .055 0 0 0 MARIJUAN 0 0 0 0 0 0 SOLAR 0 0 0 0 0 0 |
===================================================================================
Written 2/18/2022
Friday 6:00 AM PCT DJI Futures -11 NASDAQ Futures +21
| Critics
accuse the President of not being very smart or clever. But he IS President. And either he or one of his hand-picked advisors got him to say "Russia will attack Ukraine in three days". If they do attack, Biden is a wizzard and a "white knight" to his cold-warrior supporters and if Biden is wrong, he can say that he and NATO got Russia to "blink" and there was no invasion. Either way, he wins - pretty clever. Wall Street does not win, however. Traders will be reluctant to hold long positions this weekend, and if there is no attack as I would predict, then there can be another recovery from the DJI's 10% down support-level. It would seem a good time to be hedged as I have been suggesting, using our Tiger Power Ranker to be long and short: long the strongest Oil and Commodity MAXCPs that have a solid IP21 score and short the opposite among our Bearish MINCPs. That way we have a warm and snug weekend unlike the unlucky who live in the cold and dreary Donbas region that is being contested for.. |
||
|
Charts - 2/17/2022 2022 PEERLESS DJI, Signals, Indicators Daily DJI Volume 10-DayUp/Down Vol Stoch-20 Pct of All Stocks above 65-dma Inverted Traders Index Cum. Inverted Traders Index DJI-IPA DJI-OBV NASDAQ S&P OEX NYSE DJI-15 DJI-20 DJI-30 DIA QQQ SPY IWM TNA Short-Term Rates Ten Year Rates DOLLAR-UUP ALLSTOCKs recent 2006 vers-Peerless signals http://tigersoftware.com/NEWPEER/UPD80217.BMP MDY - http://www.tigersoftware.com/CHARTZ/MDY.GIF USO-CrudeOil DBO FAS GLD HD IBB JETS JNUG KOL NUGT OIH PALL RSX RETL SDS AGQ SLV SOXL TAN TECL TLT TMF TNA UGA China: YINN CHAU Commodities: CANE CORN DBC JJC, NIB CORN, CUT (paper) MOO, SOYB WEAT UUP (Dollar) LIT (Lithium) STOCKS: MRNA DIS GE PYPL GME ZOM XLE NRGU AAPL ADBE ALXN AMAT AMGN AMD AMZN AXP BA BABA BAC BIDU BLDP CAT CRM CVX CMG DE ENPH FB GILD GOOG GS HD IBM INTU JPM LRCX MRK MSFT NEM NFLX NKE NVDA PG PYPL REGN REV SO SQ QCOM QDEL TSLA TXN XOM V VRTX WFC WMT ZM Bullish MAXCPs http://tigersoftware.com/UPPER/2-17/BULLISH.htm Bearish MINCPs http://tigersoftware.com/DOWNER/2-17/BEARISH.htm |
|
The DJI needs to test the 10%-down from the peak support. The V-I is very low.  |
Closing Power for DIA bearishly broke its near-term rising support line. |
|
"Safe and respectable" MMM is leading the DJI-30 down. It has lowest 2021 Power-Ranking.  |
Bearishly SPY's Closing Power broke its near-term rising support-line. |
|
Bearishly QQQ's Closing Power broke its near-term rising support-line and could complete its own head/shoulders pattern.  |
 |
|
All the home-builders we follow are well below their 65-dma. MHO| is the lowest Power-Ranked.  |
|
Smaller oil stocks are gushing just as they did before the 1977, 1981 and 2008 bear markets. Being long the strongest and hiest ranked and short the weakest MINCPs is recommeded here.  |
Table 1 QUICKSILVER on ETFS - 2/16/2022 Bullish = 2 - OIH CORN OIH Bearish = 2 - RETL SOXL ETF CLOSE CHANGE PIVOT-PT 5-dma AROC CL-PWR CANDLE IP21 ITRS POWER INDEX ================================================================================================== DIA 343.68 -5.99 347.29 -127% Bearish RED .092 ---- ---- --------------------------------------------------------------------------------------------- SPY 437.06 -9.54 440.46 -138% Bearish RED .051 -.027 .024 --------------------------------------------------------------------------------------------- QQQ 345.45 -10.59 347.06 -183.8% Bearish RED -.021 -.092 -.113 --------------------------------------------------------------------------------------------- MDY 482.01 -10.75 482.44 -69.5% Bullish RED .033 -.019 .014 --------------------------------------------------------------------------------------------- IWM 201.2 -5.29 201.38 -55% Bullish RED .005 -.063 -.058 --------------------------------------------------------------------------------------------- FAS 126.45 -10.58 135.24 -593.2% Bullish RED .061 -.008 .053 --------------------------------------------------------------------------------------------- RETL 22.74 -1.91 23.63 -489% Bearish RED .093 -.41 -.317 Bearish --------------------------------------------------------------------------------------------- SOXL 40.87 -5.23 39.54 -637.5% Bearish RED .023 -.393 -.37 Bearish --------------------------------------------------------------------------------------------- TECL 57.63 -5.65 59 -587.7% Bearish RED .086 -.285 -.199 --------------------------------------------------------------------------------------------- IBB 126 -3.91 130.07 -223.3% Bearish RED .029 -.126 -.097 --------------------------------------------------------------------------------------------- GLD 177.25 2.39 173.81 192.9% Bullish BLUE .243 .102 .345 Bullish --------------------------------------------------------------------------------------------- OIH 245.63 -2.91 245.51 219.4% Bullish RED .165 .318 .483 Bullish --------------------------------------------------------------------------------------------- CPER 27.46 -.18 27.14 -125% Bullish RED .004 .076 .08 --------------------------------------------------------------------------------------------- UUP 25.65 .01 25.72 7.8% Bearish ---- -.041 .033 -.008 --------------------------------------------------------------------------------------------- CORN 23.4 .09 23.49 72.9% Bullish BLUE .221 .124 .345 Bullish --------------------------------------------------------------------------------------------- WEAT 7.69 .18 7.71 165% Bullish BLUE .193 .029 .222 --------------------------------------------------------------------------------------------- YINN 8.9 -.19 8.79 -207.4% ------- RED -.005 -.041 -.046 --------------------------------------------------------------------------------------------- RSX 24.18 -1.32 23.21 -189.3% Bearish RED .066 -.115 -.049 |
Table 2 Count of Stocks in Key Directories
20220217
-------------------------------
NEWHIGHS 57
NEWLOWS 490
MAXCP 34
MINCP 115
TTTNH 36
TTTNL 62
CPCROSSA 32
CPCROSSD 298
ACCUMVER 1
HIGHIP21 12
HIUPPCT 85
VHIP21 50
LOWACCUM 216
REDSELL 178
AUGSELS7 7
TRAPDOOR 16
|
Table 3 RANKING OF KEY DIRECTORIES BASED PCT.OF STOCKS ABOVE 65-DMA
2/17/22
Bullish = 12
Bearish = 36
---------------------------------------------------------------------------------------
Directory Current day-1 day-2 day-3 day-4 day-5
----------------------------------------------------------------------------------------
COAL 1 1 1 1 1 1
COPPER .875 .875 .875 .875 .875 .875
FOOD .836 .816 .816 .816 .795 .755
GOLD .826 .782 .63 .695 .543 .347
COMODITY .82 .794 .794 .794 .769 .743
OILGAS .8 .828 .79 .771 .79 .761 JETS .785 .785 .785 .714 .714 .785 INSURANC .68 .68 .64 .6 .68 .68 MILITARY .653 .692 .653 .615 .576 .538 HOSPITAL .625 .687 .625 .312 .437 .562 INDMATER .527 .555 .569 .5 .472 .513 GAMING .526 .631 .684 .473 .473 .684 ============================================================================================== EDU .5 .166 .166 .166 .166 .166 ============================================================================================== FIDSTKS .491 .556 .568 .491 .526 .562 FINANCE .488 .553 .565 .488 .523 .559 REGBANKS .44 .64 .64 .52 .56 .56 SP-100 .433 .544 .555 .5 .522 .544 BEVERAGE .428 .428 .428 .285 .428 .357 BIGBANKS .428 .714 .714 .714 .714 .714 INFRA .424 .484 .454 .393 .424 .545 TRANSP .421 .526 .421 .368 .368 .473 CHEM .413 .434 .5 .369 .369 .434 INDEXES .41 .432 .416 .394 .405 .34 ETFS .4 .472 .454 .309 .345 .454 SP500 .378 .436 .428 .366 .402 .432 DOWJONES .366 .466 .5 .433 .433 .5 UTILITY .358 .256 .23 .282 .512 .41 HACKERS .315 .421 .421 .263 .21 .421 RUS-1000 .313 .341 .313 .253 .26 .27 REIT .3 .3 .223 .176 .2 .2 NIFTY .282 .304 .326 .282 .304 .326 CHINA .28 .32 .26 .26 .26 .32 LOWPRICE .267 .292 .279 .231 .254 .236 COMPUTER .25 .4 .35 .25 .4 .45 ELECTRON .233 .285 .248 .12 .112 .172 DJI-13 .23 .461 .538 .384 .538 .538 NASD-100 .226 .268 .298 .226 .268 .288 SOFTWARE .214 .303 .321 .303 .232 .285 RETAIL .212 .212 .234 .17 .212 .191 BIOTECH .186 .222 .228 .17 .181 .195 SEMI .178 .284 .263 .094 .073 .168 AUTO .169 .245 .207 .094 .15 .169 GREEN .157 .157 .157 .157 .157 .157 HIGHPRIC .116 .192 .178 .116 .138 .156 GUNS .076 .076 .153 .153 .153 .076 BONDFUND 0 0 0 0 0 0 HOMEBLDG 0 .055 0 0 0 0 MARIJUAN 0 0 0 0 0 0 SOLAR 0 0 0 0 0 0 |
====================================================================================
Thursday 2-17 5:00 AM PST Futures DJIA= -91 NASDAQ
- 98 Data used 2-16
| Short-Term the
market seems trapped between its rising support and falling resistance lines. We still have an operative Peerless Sell S16 operating. There were more than 800 up than down on the NYSE today, so in that sense the rally continued. But respecting our operative Sell S16, the DJI could not get above its flat 200-day ma and the NASDAQ yawned at NVDA's 50% jump in earnings. Those companies that can pass along added Inflation costs by raising their own prices are the most likely to hold up until we see economic weakness from the inevitable rise in interest rates. Watch to see if NVDA can break its price downtrend. For now the DJI and the general market and tech ETFs shown below remain trapped between rising price and Closing Power uptrends and falling price and Closing Power downtrends. Bear markets do not start quickly and the DJI is still well above its 10% down-from-the-peak line, so rallies by QQQ, SOXL and TECL back to their recent highs still seem more likely than a sudden collapse. But the hedging with longs in Bullish MAXCPs and shorts in our Bearish MINCPS is recommended. Gold moved up more from its 65-dma. This is a result of the nearly 10%/yr inflation, judging from the rise in the Producer Price Index and the paltry response by the FED and Powell. A recession has already been baked into the market judging by the continuing dominance of new lows over new highs. (See Table 2) Inflation is self-spiraling just as deflation is. The longer the FED takes to raise rates, the higher inflation will become and deeper the resulting economic decline will be. No Multiple Sell S9s - Is That Bullish? But we can all hope we will not get a repeat of the 1970s. Multiple Peerless Sell S9s were the best warnng then, in 1981, in 1999-2000 and 2007-2008. We don't see that many now. What about the 2008 Crash? Oil declined a little today. In May-June 2008, at its peak, UCO (crude oil) broke its price CP uptrend-lines and formed a head/shoulders top. That did call the top in Crude Oil and started a severe general sell-off. Of course, in early 2008, financials had already topped out while they are presently still holding up. The 2000-2001 top shows similarities. The NASDAQ was going up wildly and interest rates began to be lifted in January 2000. In this case, the NASDAQ did not reach its peak until April, three months after the DJI did. The DJI chart then showed multiple Sell S9s and the best way to call the top in the still rising NASDAQ was noting when it violated its over-extended uptrendline. |
||
|
Charts - 2/16/2022 2022 PEERLESS DJI, Signals, Indicators Daily DJI Volume 10-DayUp/Down Vol Stoch-20 Pct of All Stocks above 65-dma Inverted Traders Index Cum. Inverted Traders Index DJI-IPA DJI-OBV NASDAQ S&P OEX NYSE DJI-15 DJI-20 DJI-30 DIA QQQ SPY IWM TNA Short-Term Rates Ten Year Rates DOLLAR-UUP ALLSTOCKs recent 2006 vers-Peerless signals http://tigersoftware.com/NEWPEER/UPD80216.BMP MDY - http://www.tigersoftware.com/CHARTZ/MDY.GIF USO-CrudeOil DBO FAS GLD HD IBB JETS JNUG KOL NUGT OIH PALL RSX RETL SDS AGQ SLV SOXL TAN TECL TLT TMF TNA UGA China: YINN CHAU Commodities: CANE CORN DBC JJC, NIB CORN, CUT (paper) MOO, SOYB WEAT UUP (Dollar) LIT (Lithium) STOCKS: MRNA DIS GE PYPL GME ZOM XLE NRGU AAPL ADBE ALXN AMAT AMGN AMD AMZN AXP BA BABA BAC BIDU BLDP CAT CRM CVX CMG DE ENPH FB GILD GOOG GS HD IBM INTU JPM LRCX MRK MSFT NEM NFLX NKE NVDA PG PYPL REGN REV SO SQ QCOM QDEL TSLA TXN XOM V VRTX WFC WMT ZM Bullish MAXCPs http://tigersoftware.com/UPPER/2-16/BULLISH.htm Bearish MINCPs http://tigersoftware.com/DOWNER/2-16/BEARISH.htm |
 |
 |
 |
|
A 50% rise in earnings today does not bring a further rise NVDA.  |
 |
 |
 |
 |
Table 1 QUICKSILVER on ETFS - 2/16/2022 Bullish = 2 - OIH CORN OIH Bearish = 2 - RETL ETF CLOSE CHANGE PIVOT-PT 5-dma AROC CL-PWR CANDLE IP21 ITRS POWER INDEX ================================================================================================== DIA 349.67 -.55 352.55 -114% Bearish BLUE .072 ---- ------ --------------------------------------------------------------------------------------------- SPY 446.6 .5 449.32 -122.5% Bearish BLUE .046 -.018 .028 --------------------------------------------------------------------------------------------- QQQ 356.04 -.09 358.43 -150.5% Bearish BLUE -.033 -.069 -.102 --------------------------------------------------------------------------------------------- MDY 492.76 1.46 488.78 -31.5% Bullish BLUE .028 -.011 .017 --------------------------------------------------------------------------------------------- IWM 206.49 .43 203.44 -2.9% Bullish BLUE -.017 -.048 -.065 --------------------------------------------------------------------------------------------- FAS 137.03 .89 142.63 -321.4% ------- BLUE .052 .095 .147 --------------------------------------------------------------------------------------------- RETL 24.65 -.9 25.13 -446.1% Bearish RED .087 -.356 -.269 Bearish --------------------------------------------------------------------------------------------- SOXL 46.1 .09 46.42 -552.6% Bearish BLUE .035 -.255 -.22 --------------------------------------------------------------------------------------------- TECL 63.28 -.25 64.91 -561.8% Bearish BLUE .074 -.172 -.098 --------------------------------------------------------------------------------------------- IBB 129.91 -.07 131.8 -198.2% Bearish BLUE .021 -.097 -.076 --------------------------------------------------------------------------------------------- GLD 174.86 1.78 170.56 105.7% Bullish BLUE .264 .061 .325 Bullish --------------------------------------------------------------------------------------------- OIH 248.54 5.62 235 277.1% Bullish BLUE .147 .344 .491 Bullish --------------------------------------------------------------------------------------------- CPER 27.64 .01 28.15 -111.9% Bullish BLUE -.06 .052 -.008 --------------------------------------------------------------------------------------------- UUP 25.64 -.05 25.61 13.6% Bearish ---- -.037 .002 -.035 --------------------------------------------------------------------------------------------- CORN 23.31 .25 23.06 6.4% Bullish BLUE .223 .092 .315 Bullish --------------------------------------------------------------------------------------------- WEAT 7.51 .01 7.44 -39.5% Bullish ---- .179 -.021 .158 --------------------------------------------------------------------------------------------- YINN 9.09 .16 9.27 -299% ------- BLUE .009 -.013 -.004 --------------------------------------------------------------------------------------------- RSX 25.5 .33 25.11 24.5% Bearish BLUE .095 -.083 .012 |
Table 2 Count of Stocks in Key Directories
20220216
-------------------------------
NEWHIGHS 111
NEWLOWS 400
MAXCP 48
MINCP 34
TTTNH 64
TTTNL 27
CPCROSSA 49
CPCROSSD 53
ACCUMVER 4
HIGHIP21 12
HIUPPCT 80
VHIP21 51
LOWACCUM 211
REDSELL 182
AUGSELS7 9
TRAPDOOR 16
|
RANKING OF KEY DIRECTORIES BASED PCT.OF STOCKS ABOVE 65-DMA
2/16/22
Bullish = 13
Bearish = 36
---------------------------------------------------------------------------------------
Directory Current day-1 day-2 day-3 day-4 day-5
----------------------------------------------------------------------------------------
COAL 1 1 1 1 1 1
COPPER .875 .875 .875 .875 .875 .875
OILGAS .828 .79 .771 .79 .752 .771
FOOD .816 .816 .816 .795 .755 .775
COMODITY .794 .794 .794 .769 .743 .743
JETS .785 .785 .714 .714 .785 .857 GOLD .782 .63 .695 .543 .347 .478 BIGBANKS .714 .714 .714 .714 .714 .714 MILITARY .692 .653 .615 .576 .538 .538 HOSPITAL .687 .625 .312 .437 .5 .437 INSURANC .68 .64 .6 .68 .68 .68 REGBANKS .64 .64 .52 .56 .56 .6 GAMING .631 .684 .473 .473 .631 .578 FIDSTKS .556 .568 .491 .526 .556 .627 INDMATER .555 .569 .5 .472 .513 .569 FINANCE .553 .565 .488 .523 .553 .625 SP-100 .544 .555 .5 .522 .544 .588 TRANSP .526 .421 .368 .368 .473 .473 =============================================================================================== INFRA .484 .454 .393 .424 .545 .545 ETFS .472 .454 .309 .345 .472 .545 DOWJONES .466 .5 .433 .433 .5 .533 DJI-13 .461 .538 .384 .538 .538 .615 SP500 .436 .428 .364 .402 .428 .507 CHEM .434 .5 .369 .369 .434 .413 INDEXES .432 .416 .394 .405 .34 .389 BEVERAGE .428 .428 .285 .428 .357 .5 HACKERS .421 .421 .263 .21 .421 .473 COMPUTER .4 .35 .25 .4 .45 .4 RUS-1000 .341 .313 .253 .26 .268 .306 CHINA .32 .26 .26 .26 .32 .32 NIFTY .304 .326 .26 .304 .347 .369 SOFTWARE .303 .321 .303 .232 .285 .321 REIT .3 .215 .184 .2 .192 .253 LOWPRICE .295 .277 .229 .254 .236 .239 ELECTRON .285 .248 .12 .112 .18 .233 SEMI .284 .263 .094 .073 .178 .252 NASD-100 .268 .298 .216 .268 .278 .35 UTILITY .256 .23 .282 .512 .41 .717 AUTO .245 .207 .094 .15 .169 .264 BIOTECH .222 .228 .17 .181 .189 .208 RETAIL .212 .234 .17 .212 .191 .212 HIGHPRIC .192 .178 .116 .138 .152 .218 EDU .166 .166 .166 .166 .166 .333 GREEN .157 .157 .157 .157 .157 .157 GUNS .076 .153 .153 .153 .076 .076 HOMEBLDG .055 0 0 0 0 .111 BONDFUND 0 0 0 0 0 0 MARIJUAN 0 0 0 0 0 0 SOLAR 0 0 0 0 0 0 |
====================================================================================
Written 5:20 PM PCT Futures DJI =-78
NASDAQ = -38 Data used 2/15/2022
Produce-Price Index rose 9.7 over last 12-months and Powell wants to keep rates
7% lower than that. Is he that powerful? He still has not been confirmed by
Senate
for his second term.
| The Peerless Sell S16 still
stands despite the DJI's 400-point jump at the opening today. A short-term rally to the recent recovery highs for DIA, SPY and QQQ is a possibility. But more than that seems doubtful. Look how negative most of the key values are on our DJI Chart. La/ma (Close/21-dma) = 1.002 21-dma is falling at a rate of -31.4% weak P-I (21-dma of adv-decl.) = -451 very low IP21 = +.01 VI = -162 very, very low OPMA = -.138 weak A DJI rally and a close 2.3% higher will almost certainly bring a Sell S9. So, the upside potential here is quite limited. If the rising Closing Powers and Price trends are broken, we will short more of the major market ETFs. Financial history books talk about FED Chairmen who get "behind the curve". Powell is doing everything he can to avoid facing up to the inflation that he himself caused by running stocks up as much as he has. One might think that Bond salesmen would rebel. Who would buy a bond these days with inflation so high? They might, however, be inclined to buy well-knwn inflation hedges like oil, commodites, gold and silver. And they may be inclined to buy super growth stocks like NVDA, whose earnings are expected to rise by 50% when they are reported today. With the chip shortage predicted to continue for another year and NVDA stock moving up bullishly from its rising 200-day ma, super earnings may send NVDA higher no matter what the DJI does. See its chart below. A strong closing would break its Closing Power downtrend and would make it a Buy based simply on its Closing Power and what Professionals are doing with it. |
||
|
Charts - 2/15/2022 2022 PEERLESS DJI, Signals, Indicators Daily DJI Volume 10-DayUp/Down Vol Stoch-20 Pct of All Stocks above 65-dma Inverted Traders Index Cum. Inverted Traders Index DJI-IPA DJI-OBV NASDAQ S&P OEX NYSE DJI-15 DJI-20 DJI-30 DIA QQQ SPY IWM TNA Short-Term Rates Ten Year Rates DOLLAR-UUP ALLSTOCKs recent 2006 vers-Peerless signals http://tigersoftware.com/NEWPEER/UPD80215.BMP MDY - http://www.tigersoftware.com/CHARTZ/MDY.GIF USO-CrudeOil DBO FAS GLD HD IBB JETS JNUG KOL NUGT OIH PALL RSX RETL SDS AGQ SLV SOXL TAN TECL TLT TMF TNA UGA China: YINN CHAU Commodities: CANE CORN DBC JJC, NIB CORN, CUT (paper) MOO, SOYB WEAT UUP (Dollar) LIT (Lithium) STOCKS: MRNA DIS GE PYPL GME ZOM XLE NRGU AAPL ADBE ALXN AMAT AMGN AMD AMZN AXP BA BABA BAC BIDU BLDP CAT CRM CVX CMG DE ENPH FB GILD GOOG GS HD IBM INTU JPM LRCX MRK MSFT NEM NFLX NKE NVDA PG PYPL REGN REV SO SQ QCOM QDEL TSLA TXN XOM V VRTX WFC WMT ZM Bullish MAXCPs http://tigersoftware.com/UPPER/2-15/BULLISH.htm Bearish MINCPs http://tigersoftware.com/DOWNER/2-15/BEARISH.htm |
 |
 |
 |
 |
 |
 |
 |
 |
Table 1 QUICKSILVER on ETFS - 2/15/2022 Bullish = 2 - OIH CORN Bearish = 2 - RETL SOXL ETF CLOSE CHANGE PIVOT-PT 5-dma AROC CL-PWR CANDLE IP21 ITRS POWER INDEX --------------------------------------------------------------------------------------------- DIA 350.22 4.33 357.67 -61.4% Bearish BLUE .058 --- ------ --------------------------------------------------------------------------------------------- SPY 446.1 7.08 457.54 -54.1% Bearish BLUE .01 -.028 -.018 --------------------------------------------------------------------------------------------- QQQ 356.13 8.64 366.73 -42% Bearish BLUE -.081 -.082 -.163 --------------------------------------------------------------------------------------------- MDY 491.3 10.43 495.83 42.7% ------- BLUE -.016 -.014 -.03 --------------------------------------------------------------------------------------------- IWM 206.06 5.38 206.61 81.3% ------- BLUE -.074 -.052 -.126 --------------------------------------------------------------------------------------------- FAS 136.14 5.29 145.91 -257.2% ------- BLUE .01 .109 .119 --------------------------------------------------------------------------------------------- RETL 25.55 2.32 26.87 52.4% Bearish BLUE .052 -.315 -.263 Bearish --------------------------------------------------------------------------------------------- SOXL 46.01 6.42 51.02 -66.1% Bearish BLUE -.026 -.28 -.306 Bearish --------------------------------------------------------------------------------------------- TECL 63.53 4.55 70.4 -198.1% Bearish BLUE .028 -.165 -.137 --------------------------------------------------------------------------------------------- IBB 129.98 2.3 135.1 -59.8% Bearish BLUE -.027 -.136 -.163 --------------------------------------------------------------------------------------------- GLD 173.08 -1.66 171.21 71.1% ------- ---- .204 .027 .231 --------------------------------------------------------------------------------------------- OIH 242.92 3.57 235.26 240.6% Bullish BLUE .118 .337 .455 Bullish --------------------------------------------------------------------------------------------- CPER 27.63 .24 28.26 61.5% Bullish ---- -.058 .048 -.01 --------------------------------------------------------------------------------------------- UUP 25.69 -.1 25.57 17.5% ------- ---- 0 -.015 -.015 --------------------------------------------------------------------------------------------- CORN 23.06 -.6 23.28 23.6% Bullish RED .22 .062 .282 Bullish --------------------------------------------------------------------------------------------- WEAT 7.5 -.21 7.57 -6.6% Bullish ---- .212 -.039 .173 --------------------------------------------------------------------------------------------- YINN 8.93 .4 9.63 -110.3% ------- BLUE .025 .006 .031 --------------------------------------------------------------------------------------------- RSX 25.17 1.37 25.38 81.8% Bearish BLUE .045 -.138 -.093 |
TABLE 2 Count of Stocks in Key Directories
20220215
-------------------------------
NEWHIGHS 86
NEWLOWS 372
MAXCP 34
MINCP 45
TTTNH 34
TTTNL 39
CPCROSSA 55
CPCROSSD 31
ACCUMVER 4
HIGHIP21 11
HIUPPCT 73
VHIP21 52
LOWACCUM 223
REDSELL 194
AUGSELS7 15
TRAPDOOR 6
|
Table 3 RANKING OF KEY DIRECTORIES BASED PCT.OF STOCKS ABOVE 65-DMA
2/15/22
Bullish = 18
Bearish = 29
--------------------------------------------------------------------------------------- Directory Current day-1 day-2 day-3 day-4 day-5 ---------------------------------------------------------------------------------------- COAL 1 1 1 1 1 1 COPPER .875 .875 .875 .875 .875 .875 FOOD .816 .816 .795 .755 .775 .734 COMODITY .794 .794 .769 .743 .743 .717 OILGAS .79 .771 .79 .752 .761 .723 JETS .785 .714 .714 .785 .857 .785 BIGBANKS .714 .714 .714 .714 .714 .714 GAMING .684 .473 .473 .631 .578 .473 MILITARY .653 .615 .576 .538 .538 .5 INSURANC .64 .6 .68 .68 .68 .72 REGBANKS .64 .52 .56 .56 .6 .72 GOLD .63 .695 .543 .347 .478 .456 HOSPITAL .625 .312 .437 .5 .437 .25 INDMATER .569 .5 .472 .513 .569 .513 FIDSTKS .568 .491 .526 .556 .627 .568 FINANCE .565 .488 .523 .553 .625 .565 SP-100 .555 .5 .522 .544 .588 .577 DJI-13 .538 .384 .538 .538 .615 .615 ============================================================================================= CHEM .5 .369 .369 .434 .413 .369 DOWJONES .5 .433 .433 .5 .5 .5 ============================================================================================= ETFS .454 .309 .345 .472 .545 .363 INFRA .454 .393 .424 .545 .545 .484 BEVERAGE .428 .285 .428 .357 .5 .5 SP500 .428 .364 .4 .428 .505 .448 HACKERS .421 .263 .21 .421 .473 .315 TRANSP .421 .368 .368 .473 .473 .473 INDEXES .416 .394 .405 .34 .389 .351 COMPUTER .35 .25 .4 .45 .4 .3 NIFTY .326 .26 .282 .347 .369 .304 SOFTWARE .321 .303 .232 .285 .321 .25 RUS-1000 .313 .253 .26 .268 .303 .255 NASD-100 .298 .216 .257 .278 .34 .298 LOWPRICE .279 .226 .251 .236 .241 .216 SEMI .263 .094 .073 .178 .231 .157 CHINA .26 .26 .26 .32 .32 .28 ELECTRON .248 .12 .112 .18 .218 .142 RETAIL .234 .17 .212 .191 .212 .191 UTILITY .23 .282 .512 .41 .717 .692 BIOTECH .228 .17 .181 .189 .206 .153 REIT .215 .176 .207 .192 .253 .176 AUTO .207 .094 .15 .169 .245 .188 HIGHPRIC .178 .116 .138 .152 .214 .156 EDU .166 .166 .166 .166 .333 .5 GREEN .157 .157 .157 .157 .157 .105 GUNS .153 .153 .153 .076 .076 .076 BONDFUND 0 0 0 0 0 0 HOMEBLDG 0 0 0 0 .111 0 MARIJUAN 0 0 0 0 0 0 SOLAR 0 0 0 0 0 0 |
====================================================================================
Written 5:37 PM PCT Futures DJI = +400
NASDAQ = +200 Data used 2/14/2022
|
Turnaround-Tuesday Our Peerless Sell S16 remains operative. But today brought two bullish pieces of news: 1) Russian troops are pulling back from the boundary with Ukraine and diplomatic negotations are resuming AND 2) various members of the FOMC have spoken out backing a slow-paced raising of interest rates, once a meeting and by the smallest percentage possible. This, of course, invites more inflation but it also places stock- holders ahead of bond-holders and should slow-down the sell-off in stocks. The rally is being credited to the Russian pulback, but it is the that is helping the most. I do not trust CNN's or Biden's fear-mongering, I admit. https://www.nytimes.com/2022/02/14/business/federal-reserve-rates-inflation.html?campaign_id=2&emc=edit_th_20220215&instance_id=53189&nl=todaysheadlines®i_id=58223894&segment_id=82763&user_id=ebc2a133c7a3b83a9a92049aae5a2e03 A rally back to the recent recovery highs is possible given the simultaneous bullish news items. At this writing, the DJI is up 400 an hour before the opening in New York. Such a big jump will make it harder for the Closing Powers to break their downtrends. We must see what Professionals will do with such a big up-opening. I would treat this as strictly a short-term bounce and be ready to go short more of our bearish MINCPs when either the minor price- uptrend-lines or Closing Power uptrend-lines shown in the charts below are broken below on this rally. Stay short recent bearish MINCPs and long oil stocks/ETFs and strong commodites, like SOYB, CORN and WHEAT. AAPL which is at its 65-dma is a key stock to watch now, as well as the very weak bondfunds. |
||
|
Charts - 2/14/2022 2022 PEERLESS DJI, Signals, Indicators Daily DJI Volume 10-DayUp/Down Vol Stoch-20 Pct of All Stocks above 65-dma Inverted Traders Index Cum. Inverted Traders Index DJI-IPA DJI-OBV NASDAQ S&P OEX NYSE DJI-15 DJI-20 DJI-30 DIA QQQ SPY IWM TNA Short-Term Rates Ten Year Rates DOLLAR-UUP ALLSTOCKs recent 2006 vers-Peerless signals http://tigersoft.com/NEWPEER/UPD80214.BMP MDY - http://www.tigersoftware.com/CHARTZ/MDY.GIF USO-CrudeOil DBO FAS GLD HD IBB JETS JNUG KOL NUGT OIH PALL RSX RETL SDS AGQ SLV SOXL TAN TECL TLT TMF TNA UGA China: YINN CHAU Commodities: CANE CORN DBC JJC, NIB CORN, CUT (paper) MOO, SOYB WEAT UUP (Dollar) LIT (Lithium) STOCKS: MRNA DIS GE PYPL GME ZOM XLE NRGU AAPL ADBE ALXN AMAT AMGN AMD AMZN AXP BA BABA BAC BIDU BLDP CAT CRM CVX CMG DE ENPH FB GILD GOOG GS HD IBM INTU JPM LRCX MRK MSFT NEM NFLX NKE NVDA PG PYPL REGN REV SO SQ QCOM QDEL TSLA TXN XOM V VRTX WFC WMT ZM Bullish MAXCPs http://tigersoftware.com/UPPER/2-14/BULLISH.htm Bearish MINCPs http://tigersoftware.com/DOWNER/2-14/BEARISH.htm |
 |
 |
 |
 |
 |
 |
 |
Table 1 QUICKSILVER on ETFS - 2/14/2022 Bullish = 2 - OIH CORN Bearish = 2 - RETL SOXL ETF CLOSE CHANGE PIVOT-PT 5-dma AROC CL-PWR CANDLE IP21 ITRS POWER INDEX --------------------------------------------------------------------------------------------- DIA 345.89 -1.4 354.54 -71% Bearish RED .068 --- ----- --------------------------------------------------------------------------------------------- COMPQX 13790.92 -.23 14194.46 -79.5% Bearish BLUE -.064 -.101 -.165 --------------------------------------------------------------------------------------------- SPY 439.02 -1.44 450.94 -91.7% Bearish RED .012 -.038 -.026 --------------------------------------------------------------------------------------------- QQQ 347.49 .43 359.12 -106.9% Bearish BLUE -.07 -.107 -.177 --------------------------------------------------------------------------------------------- MDY 480.87 -1.57 487.14 29.6% ------- RED -.024 -.036 -.06 --------------------------------------------------------------------------------------------- IWM 200.68 -.7 202.76 32.6% ------- RED -.056 -.082 -.138 --------------------------------------------------------------------------------------------- FAS 130.85 -4.39 143.32 -259.5% ------- RED .062 .028 .09 --------------------------------------------------------------------------------------------- RETL 23.23 -.4 25.29 -16.1% Bearish RED .025 -.402 -.377 Bearish --------------------------------------------------------------------------------------------- SOXL 39.59 .05 46.6 -420.7% Bearish RED -.041 -.372 -.413 Bearish --------------------------------------------------------------------------------------------- TECL 58.98 -.02 66.06 -360.3% Bearish BLUE .028 -.251 -.223 --------------------------------------------------------------------------------------------- IBB 127.68 -2.39 131.55 -150% Bearish RED -.004 -.154 -.158 --------------------------------------------------------------------------------------------- GLD 174.74 .93 170.63 135.2% Bullish BLUE .165 .06 .225 --------------------------------------------------------------------------------------------- OIH 239.35 -6.16 231.5 58.1% Bullish RED .106 .322 .428 Bulliah --------------------------------------------------------------------------------------------- CPER 27.39 .25 27.29 9% Bullish BLUE -.053 .047 -.006 --------------------------------------------------------------------------------------------- UUP 25.79 .07 25.6 44.9% ------- ---- .044 .002 .046 --------------------------------------------------------------------------------------------- CORN 23.66 .17 22.95 131.7% Bullish BLUE .275 .114 .389 Bulliah --------------------------------------------------------------------------------------------- WEAT 7.71 0 7.51 179.2% Bullish BLUE .236 -.011 .225 --------------------------------------------------------------------------------------------- YINN 8.53 -.26 9.13 -213.2% ------- RED .042 -.095 -.053 --------------------------------------------------------------------------------------------- RSX 23.8 .59 24.77 -26.6% Bearish RED .03 -.182 -.152 |
Table 2 Count of Stocks in Key Directories
20220214
-------------------------------
NEWHIGHS 62
NEWLOWS 886
MAXCP 11
MINCP 117
TTTNH 18
TTTNL 61
CPCROSSA 16
CPCROSSD 199
ACCUMVER 8
HIGHIP21 8
HIUPPCT 69
VHIP21 55
LOWACCUM 233
REDSELL 184
AUGSELS7 10
TRAPDOOR 12
|
RANKING OF KEY DIRECTORIES BASED PCT.OF STOCKS ABOVE 65-DMA
2/14/22
BULLISH = 11 BEARISH = 36 --------------------------------------------------------------------------------------- Directory Current day-1 day-2 day-3 day-4 day-5 ---------------------------------------------------------------------------------------- COAL 1 1 1 1 1 1 COPPER .875 .875 .875 .875 .875 .75 FOOD .816 .795 .755 .775 .734 .693 COMODITY .794 .769 .743 .743 .717 .666 OILGAS .771 .79 .752 .761 .723 .752 BIGBANKS .714 .714 .714 .714 .714 .714 JETS .714 .714 .785 .857 .785 .642 GOLD .695 .543 .347 .478 .456 .326 MILITARY .615 .576 .538 .538 .5 .346 INSURANC .6 .68 .68 .68 .72 .68 REGBANKS .52 .56 .56 .6 .72 .56 -------------------------------------------------------------------------------------------------- INDMATER .5 .472 .513 .569 .5 .416 SP-100 .5 .522 .544 .588 .577 .566 -------------------------------------------------------------------------------------------------- FIDSTKS .491 .526 .556 .627 .568 .514 FINANCE .488 .523 .553 .625 .565 .511 GAMING .473 .473 .631 .578 .473 .421 DOWJONES .433 .433 .5 .5 .5 .5 INDEXES .394 .405 .34 .389 .351 .356 INFRA .393 .424 .545 .545 .454 .424 DJI-13 .384 .538 .538 .615 .615 .615 CHEM .369 .369 .434 .413 .347 .304 TRANSP .368 .368 .473 .473 .473 .315 SP500 .364 .4 .428 .505 .448 .416 HOSPITAL .312 .437 .5 .437 .25 .187 ETFS .309 .345 .472 .545 .381 .236 SOFTWARE .303 .232 .285 .321 .25 .232 BEVERAGE .285 .428 .357 .5 .5 .285 UTILITY .282 .512 .41 .717 .666 .717 HACKERS .263 .21 .421 .473 .315 .315 CHINA .26 .26 .32 .32 .28 .2 NIFTY .26 .282 .347 .369 .304 .26 RUS-1000 .253 .26 .268 .303 .245 .197 COMPUTER .25 .4 .45 .4 .3 .25 LOWPRICE .229 .249 .234 .241 .208 .185 NASD-100 .216 .257 .278 .34 .298 .288 REIT .176 .2 .2 .253 .176 .138 BIOTECH .17 .181 .189 .206 .148 .134 RETAIL .17 .212 .191 .212 .191 .17 EDU .166 .166 .166 .333 .5 .5 GREEN .157 .157 .157 .157 .105 .052 GUNS .153 .153 .076 .076 .076 .076 ELECTRON .12 .112 .18 .218 .142 .075 HIGHPRIC .116 .138 .152 .214 .16 .116 AUTO .094 .15 .169 .245 .188 .132 SEMI .094 .073 .178 .231 .157 .052 BONDFUND 0 0 0 0 0 0 HOMEBLDG 0 0 0 .111 .055 .055 MARIJUAN 0 0 0 0 0 0 SOLAR 0 0 0 0 0 0 |
=====================================================================================
Written 5:45 PM PCT Futures DJI = -25 NASDAQ
=-25 Data used 2/11/2022
| Don't be fooled by a rally this week. Putin has
said only a fool would go to war with NATO. A cooling of international tensions and not a world war should be expected. The Donbass - Donetsk region in the Ukraine is largely settled by Russians. So, Putin is bound to try to get that area back just as he did the Crimea. But, an invasion that risks a broader war seems unlikely. Wall Street may rally on peace news. But the core economic problem remains. It is 7.5% inflation which is still rising. This is a war-time number. We are at war against covid, of course, but there is no way Biden, even if he wanted to, could get Congress to go along with price contols as were used by Wilson in World War I, Roosevelt in WWII, Truman in the Korean War or Nixon in the Vietnam War. Nor would they necessarily work to produce more housing or food or oil...Maing matters worse, higher interest rates are themselves inflationary. I say this because the FED raised rates ahead of rising CPI numbers in 1956-1957. There is just no palatable solution to 7.5% and rising CPI numbers. The boom and bust are part of the system. Only by causing a recession, history shows me, can the FED stop the pressures of inflation. And a recession means lower profits. If there is a solution and I am wrong, please share it here with others. So, the FED must raise rates until it hurts. When we understand how rising rates, as surely as the sun follows the moon in the skies, cause a bear market, we can see what's really going on now. I wish I could get my book done. But that is what happened over and over again, in 1906-1907, 1918-1921, 1966, 1968-1970, 1973-1974, 1976-1978, 1981-1982, 1987, 2000-2003 and 2018. Matching this bleak economic outlook is an increasingly bearish technical picture. The only real bright signs are the DJI still has not fallen 10% down from its peaks, the A/D Line has not been bearishly diverging for months, Oil and Commodities are still in bullish uptrends and Gold is just starting to advance. The Dollar has not turned down. But bearishly, Peerless is on a Sell S16 and came within 1/2% of giving a Sell S9. The Closing Powers we follow below have broken their short-term uptrends and are in declining modes, showing Professionals are bearish. Even the DJI has now fallen below its 65-day and 200-day ma and seems bound to have to test its 10% down support. The leaders of the bull market, TECL, SOXL and QQQ are now breaking down. I would expect them and the NASDAQ to go considerably lower. It's not too late to pick some shorts from our bearish MINCPs while staying long some commodities and oil stocks or ETFs. This is a winning hedge if we look back at 1972-1973, 1976-1977 and 2007-2008. |
||
|
Charts - 2/11/2022 2022 PEERLESS DJI, Signals, Indicators Daily DJI Volume 10-DayUp/Down Vol Stoch-20 Pct of All Stocks above 65-dma Inverted Traders Index Cum. Inverted Traders Index DJI-IPA DJI-OBV NASDAQ S&P OEX NYSE DJI-15 DJI-20 DJI-30 DIA QQQ SPY IWM TNA Short-Term Rates Ten Year Rates DOLLAR-UUP ALLSTOCKs recent 2006 vers-Peerless signals http://tigersoft.com/NEWPEER/UPD80211.BMP MDY - http://www.tigersoftware.com/CHARTZ/MDY.GIF USO-CrudeOil DBO FAS GLD HD IBB JETS JNUG KOL NUGT OIH PALL RSX RETL SDS AGQ SLV SOXL TAN TECL TLT TMF TNA UGA China: YINN CHAU Commodities: CANE CORN DBC JJC, NIB CORN, CUT (paper) MOO, SOYB WEAT UUP (Dollar) LIT (Lithium) STOCKS: MRNA DIS GE PYPL GME ZOM XLE NRGU AAPL ADBE ALXN AMAT AMGN AMD AMZN AXP BA BABA BAC BIDU BLDP CAT CRM CVX CMG DE ENPH FB GILD GOOG GS HD IBM INTU JPM LRCX MRK MSFT NEM NFLX NKE NVDA PG PYPL REGN REV SO SQ QCOM QDEL TSLA TXN XOM V VRTX WFC WMT ZM Bullish MAXCPs http://tigersoftware.com/UPPER/2-11/BULLISH.htm Bearish MINCPs http://tigersoftware.com/DOWNER/2-11/BEARISH.htm |
 |
 |
 |
 |
 |
 |
 |
 |
Table 1 QUICKSILVER on ETFS - 2/11/2022 Bullish = 2 - OIH CORN Bearish = 3 - RETL SOXL TECL ETF CLOSE CHANGE PIVOT-PT 5-dma AROC CL-PWR CANDLE IP21 ITRS POWER INDEX --------------------------------------------------------------------------------------------- --------------------------------------------------------------------------------------------- DIA 347.29 -5.26 350.9 -50.7% Bearish RED .041 --- ------- --------------------------------------------------------------------------------------------- SPY 440.46 -8.86 447.26 -91.4% Bearish RED -.02 -.042 -.062 --------------------------------------------------------------------------------------------- QQQ 347.06 -11.37 355.13 -152.3% Bearish RED -.103 -.124 -.227 --------------------------------------------------------------------------------------------- MDY 482.44 -6.34 477.99 45.7% Bearish RED -.036 -.027 -.063 --------------------------------------------------------------------------------------------- IWM 201.38 -2.06 199.36 74.2% ------- RED -.069 -.076 -.145 --------------------------------------------------------------------------------------------- FAS 135.24 -7.39 138.17 -73.2% ------- RED .05 .129 .179 --------------------------------------------------------------------------------------------- RETL 23.63 -1.5 23.31 131.5% Bearish RED .012 -.377 -.365 Bearish --------------------------------------------------------------------------------------------- SOXL 39.54 -6.88 43.41 -424.4% Bearish RED -.067 -.394 -.461 Bearish --------------------------------------------------------------------------------------------- TECL 59 -5.91 63.65 -454.5% Bearish RED -.007 -.253 -.26 Bearish --------------------------------------------------------------------------------------------- IBB 130.07 -1.73 131.64 -21.2% Bearish RED -.019 -.157 -.176 --------------------------------------------------------------------------------------------- GLD 173.81 3.25 170.11 145.4% Bullish BLUE .16 .026 .186 --------------------------------------------------------------------------------------------- OIH 245.51 10.51 236.6 236.8% Bullish BLUE .083 .383 .466 Bullish --------------------------------------------------------------------------------------------- CPER 27.14 -1.01 27.34 -56% ------- RED -.117 .037 -.08 --------------------------------------------------------------------------------------------- UUP 25.72 .11 25.56 33.2% ------- BLUE .117 -.022 .095 --------------------------------------------------------------------------------------------- CORN 23.49 .43 23.05 202.3% ------- BLUE .224 .095 .319 Bullish --------------------------------------------------------------------------------------------- WEAT 7.71 .27 7.44 220.9% Bullish BLUE .173 0 .173 --------------------------------------------------------------------------------------------- YINN 8.79 -.48 8.92 -146.7% ------- RED -.003 -.074 -.077 --------------------------------------------------------------------------------------------- RSX 23.21 -1.9 23.93 -170.4% Bearish RED -.03 -.208 -.238 |
Table 2 Count of Stocks in Key Directories
20220211
-------------------------------
NEWHIGHS 120
NEWLOWS 730
MAXCP 41
MINCP 61
TTTNH 63
TTTNL 59
CPCROSSA 40
CPCROSSD 391
ACCUMVER 4
HIGHIP21 7
HIUPPCT 62
VHIP21 57
LOWACCUM 227
REDSELL 178
AUGSELS7 14
TRAPDOOR 32
|
Table 3
RANKING OF KEY DIRECTORIES BASED PCT.OF STOCKS ABOVE 65-DMA
2/11/22
Bullish = 16
Bearish = 33
---------------------------------------------------------------------------------------
Directory Current day-1 day-2 day-3 day-4 day-5
----------------------------------------------------------------------------------------
COAL 1 1 1 1 1 1
COPPER .875 .875 .875 .875 .75 .75
FOOD .795 .755 .775 .734 .693 .551
OILGAS .79 .752 .761 .723 .752 .771
COMODITY .769 .743 .743 .717 .666 .512
BIGBANKS .714 .714 .714 .714 .714 .714 JETS .714 .785 .857 .785 .571 .428 INSURANC .68 .68 .68 .72 .68 .64 MILITARY .576 .538 .538 .5 .346 .23 REGBANKS .56 .56 .6 .72 .56 .56 GOLD .543 .347 .478 .456 .326 .152 DJI-13 .538 .538 .615 .615 .615 .538 FIDSTKS .526 .556 .627 .568 .52 .514 FINANCE .523 .553 .625 .565 .517 .511 SP-100 .522 .544 .588 .577 .566 .577 UTILITY .512 .41 .717 .666 .717 .641 ================================================================================================ GAMING .473 .631 .578 .473 .421 .368 INDMATER .472 .513 .569 .5 .416 .361 HOSPITAL .437 .5 .437 .25 .187 .187 DOWJONES .433 .5 .5 .5 .5 .466 BEVERAGE .428 .357 .5 .5 .357 .357 INFRA .424 .545 .545 .454 .424 .393 INDEXES .405 .34 .389 .351 .356 .34 COMPUTER .4 .45 .4 .3 .25 .25 SP500 .4 .428 .505 .448 .416 .418 CHEM .369 .434 .413 .347 .304 .282 TRANSP .368 .473 .473 .473 .315 .315 ETFS .345 .472 .545 .381 .254 .236 NIFTY .282 .347 .369 .304 .26 .282 CHINA .26 .32 .32 .28 .2 .2 RUS-1000 .26 .268 .303 .245 .2 .169 NASD-100 .257 .278 .34 .298 .288 .309 LOWPRICE .251 .231 .239 .208 .188 .16 SOFTWARE .232 .285 .321 .25 .232 .214 RETAIL .212 .191 .212 .191 .17 .17 HACKERS .21 .421 .473 .315 .315 .21 REIT .2 .192 .261 .176 .146 .123 BIOTECH .181 .189 .206 .148 .134 .129 EDU .166 .166 .333 .5 .5 .333 GREEN .157 .157 .157 .105 .052 .052 GUNS .153 .076 .076 .076 .076 .076 AUTO .15 .169 .245 .188 .132 .15 HIGHPRIC .138 .152 .214 .16 .12 .127 ELECTRON .112 .18 .218 .142 .067 .075 SEMI .073 .178 .231 .157 .042 .063 BONDFUND 0 0 0 0 0 0 HOMEBLDG 0 0 .111 .055 .055 .055 MARIJUAN 0 0 0 0 0 0 SOLAR 0 0 0 0 0 0 |
====================================================================================
| February 11 The 7.5%/yr CPI Inflation data was pretty grim. As we all knew, without the government telling us, prices for gas, homes, rent, food and most everything else is going up at the fastest rate in forty years. Most likely, the CPI 7.5% number for 12 months understates the reality. The FED has tried to downplay the reality for some time. They have told us to expect inflation to wane in a few months. But many in the FOMC that sets rates have called for four or more rate hikes in 2022. The news today shook up even the FED judging by the full one percent rise in just one day of short-term (1-3 months) rates which they have most control of. Yesterday, the DJI came within 1/2% of reaching the 2.4% upper band with the P-Indicator negative. That would have added a bearish Sell S9 to our Peerless chart. So, the upside is quite limited even if "turn around Tuesday' comes next week after the expected sell-off due to the Inflation numbers and the huge jump by 1% in short-term rates today.) The P-I is -142 and the V-I at -143 shows heavy big money selling. The 7.5% rate of inflation will demand higher rates. Interestingly,
rates were last this high back in 1981, which peaked in April and started a 16 month long
bear market. The DJI will hold up much better than he NASDAQ or QQQ.
|
====================================================================================
February 10: 5:50 AM DJI-118
NASDAQ -185 Date
used for 2/9/2022
|
On Wednesday, the
DJI rose above its 65-dma resistance. Ordinarily, this would set it up for a run to new highs or slightly above the highest closing. But it must do this alone. The NASDAQ and QQQ have only reached a 50% recovery-level of what they recently lost and the SP-500 is still below its 65-dma. Without a Peerless Buy signal, except from the Stochastic-20's K-Line turning up and above the blue S-20 Pct-D Line, we have had a fine V-shaped recovery. But instead of being bullish, the bounce probably has more to do with the DJI being "the best game in town" for big investors and traders who are avoiding bonds as being too high a risk play and who do not want to touch NASDAQ stocks because more and more of them are falling through trap-doors when they break well-tested support. Overhanging the market, as whole, is how serious Inflation numbers in the form of today's CPI will prove to be. "The all items index rose 7.5 percent for the 12 months ending January, the largest 12-month increase since the period ending February 1982. The all items less food and energy index rose 6.0 percent, the largest 12-month change since the period ending August 1982. The energy index rose 27.0 percent over the last year, and the food index increased 7.0 percent." The recent rally reflected hope and an expectation that the FED's reassurances about inflation soon moderating will be born out by the numbers. The CPI numbers out today discourage such faith in the FED, I would expect weakness until turnaround-Tuesday. Stay hedged. The recent rally also shows a growing belief that the DJI stocks are generally interest rate resistant and can relatively easily pass along their higher costs to their consumers, who are are much more their captives than they are for other smaller companies. |
||
|
Charts - 2/9/2022 2022 PEERLESS DJI, Signals, Indicators Daily DJI Volume 10-DayUp/Down Vol Stoch-20 Pct of All Stocks above 65-dma Inverted Traders Index Cum. Inverted Traders Index DJI-IPA DJI-OBV NASDAQ S&P OEX NYSE DJI-15 DJI-20 DJI-30 DIA QQQ SPY IWM TNA Short-Term Rates Ten Year Rates DOLLAR-UUP ALLSTOCKs recent 2006 vers-Peerless signals http://tigersoft.com/NEWPEER/UPD80208.BMP MDY - http://www.tigersoftware.com/CHARTZ/MDY.GIF USO-CrudeOil DBO FAS GLD HD IBB JETS JNUG KOL NUGT OIH PALL RSX RETL SDS AGQ SLV SOXL TAN TECL TLT TMF TNA UGA China: YINN CHAU Commodities: CANE CORN DBC JJC, NIB CORN, CUT (paper) MOO, SOYB WEAT UUP (Dollar) LIT (Lithium) STOCKS: MRNA DIS GE PYPL GME ZOM XLE NRGU AAPL ADBE ALXN AMAT AMGN AMD AMZN AXP BA BABA BAC BIDU BLDP CAT CRM CVX CMG DE ENPH FB GILD GOOG GS HD IBM INTU JPM LRCX MRK MSFT NEM NFLX NKE NVDA PG PYPL REGN REV SO SQ QCOM QDEL TSLA TXN XOM V VRTX WFC WMT ZM Bullish MAXCPs http://tigersoft.com/UPPER/2299/MAXCPs.htm Bearish MINCPs http://tigersoft.com/DOWNER/2299/MINCPS.htm |
 |
 |
 |
 |
 |
 |
 |
Table 1 QUICKSILVER on ETFS - 2/9/2022 Bullish = 2 - OIH CORN Bearish = 1 - RETL ETF CLOSE CHANGE PIVOT-PT 5-dma AROC CL-PWR CANDLE IP21 ITRS POWER INDEX --------------------------------------------------------------------------------------------- --------------------------------------------------------------------------------------------- DIA 357.67 3.13 350.98 23.3% Bullish BLUE .127 ---- ----- --------------------------------------------------------------------------------------------- SPY 457.54 6.6 446.6 2.1% ------- BLUE .081 -.034 .047 --------------------------------------------------------------------------------------------- QQQ 366.73 7.61 353.55 -24.5% ------- BLUE .004 -.101 -.097 --------------------------------------------------------------------------------------------- MDY 495.83 8.69 477.08 113.1% ------- BLUE .045 -.041 .004 --------------------------------------------------------------------------------------------- IWM 206.61 3.85 197.53 131.8% ------- BLUE -.007 -.091 -.098 --------------------------------------------------------------------------------------------- FAS 145.91 2.59 131 361.6% Bullish BLUE .141 .091 .232 --------------------------------------------------------------------------------------------- RETL 26.87 1.58 22.85 423.4% Bearish BLUE .096 -.414 -.318 Bearish --------------------------------------------------------------------------------------------- SOXL 51.02 4.42 42.63 186.3% Bearish BLUE .061 -.273 -.212 --------------------------------------------------------------------------------------------- TECL 70.4 4.34 64.23 0% ------- BLUE .087 -.163 -.076 --------------------------------------------------------------------------------------------- IBB 135.1 3.55 130.21 80.7% ------- BLUE .062 -.153 -.091 --------------------------------------------------------------------------------------------- GLD 171.21 .58 168.6 69.9% ------- BLUE .192 .009 .201 --------------------------------------------------------------------------------------------- OIH 235.26 3.76 229.72 56% Bullish BLUE .093 .263 .356 Bullish --------------------------------------------------------------------------------------------- CPER 28.26 .97 27.19 172% Bullish BLUE -.006 .046 .04 --------------------------------------------------------------------------------------------- UUP 25.57 -.03 25.57 -25.4% ------- ---- -.007 -.028 -.035 --------------------------------------------------------------------------------------------- CORN 23.28 .33 22.36 163.1% Bullish BLUE .321 .062 .383 Bullish --------------------------------------------------------------------------------------------- WEAT 7.57 .06 7.26 203.5% Bullish BLUE .173 -.06 .113 --------------------------------------------------------------------------------------------- YINN 9.63 .5 8.83 356.1% Bullish BLUE .134 -.007 .127 --------------------------------------------------------------------------------------------- RSX 25.38 .61 23.64 240.4% Bearish BLUE .124 -.123 .001 |
Table 2 Count of Stocks in Key Directories
20220209
-------------------------------
NEWHIGHS 154
NEWLOWS 295
MAXCP 49
MINCP 24
TTTNH 23
TTTNL 25
CPCROSSA 38
CPCROSSD 49
ACCUMVER 3
HIGHIP21 13
HIUPPCT 50
VHIP21 57
LOWACCUM 212
REDSELL 156
AUGSELS7 15
TRAPDOOR 8
|
Table 3 RANKING OF KEY DIRECTORIES BASED PCT.OF STOCKS ABOVE 65-DMA
2/9/22
Bullish = 20
Bearish = 27
---------------------------------------------------------------------------------------
Directory Current day-1 day-2 day-3 day-4 day-5
----------------------------------------------------------------------------------------
COAL 1 1 1 1 1 1
COPPER .875 .875 .75 .75 .75 .75
JETS .857 .785 .571 .428 .357 .428
FOOD .775 .734 .693 .551 .571 .612
OILGAS .761 .723 .752 .761 .761 .819
COMODITY .743 .717 .666 .512 .538 .589 UTILITY .717 .666 .717 .641 .692 .717 BIGBANKS .714 .714 .714 .714 .714 .714 INSURANC .68 .72 .68 .64 .64 .68 FIDSTKS .627 .568 .52 .508 .479 .556 FINANCE .625 .565 .517 .505 .476 .553 DJI-13 .615 .615 .615 .538 .538 .538 REGBANKS .6 .72 .56 .56 .4 .44 SP-100 .588 .577 .566 .566 .544 .611 GAMING .578 .473 .421 .368 .21 .21 INDMATER .569 .5 .416 .361 .361 .486 ETFS .545 .381 .254 .254 .254 .345 INFRA .545 .454 .424 .393 .393 .393 MILITARY .538 .5 .346 .23 .23 .269 SP500 .505 .448 .416 .418 .408 .46 =============================================================================================== BEVERAGE .5 .5 .357 .428 .5 .642 DOWJONES .5 .5 .5 .466 .466 .533 =============================================================================================== GOLD .478 .456 .326 .173 .13 .195 HACKERS .473 .315 .315 .21 .21 .263 TRANSP .473 .473 .315 .315 .263 .368 HOSPITAL .437 .25 .187 .187 .187 .187 CHEM .413 .347 .304 .282 .282 .369 COMPUTER .4 .3 .25 .25 .25 .3 INDEXES .389 .351 .356 .34 .356 .389 NIFTY .369 .304 .26 .26 .239 .304 NASD-100 .34 .298 .288 .298 .268 .329 EDU .333 .5 .5 .333 0 .333 SOFTWARE .321 .25 .232 .214 .214 .232 CHINA .32 .28 .2 .2 .22 .2 RUS-1000 .303 .245 .2 .169 .177 .23 REIT .253 .176 .153 .123 .161 .215 AUTO .245 .188 .132 .15 .132 .207 LOWPRICE .239 .203 .185 .16 .152 .165 SEMI .231 .157 .042 .063 .063 .105 ELECTRON .218 .142 .067 .075 .09 .127 HIGHPRIC .214 .16 .12 .123 .109 .16 RETAIL .212 .191 .17 .17 .127 .191 BIOTECH .206 .148 .134 .129 .109 .123 GREEN .157 .105 .052 .052 .052 .157 HOMEBLDG .111 .055 .055 .055 .055 .166 GUNS .076 .076 .076 .076 .076 .076 BONDFUND 0 0 0 0 0 0 MARIJUAN 0 0 0 0 0 0 SOLAR 0 0 0 0 0 0 |
====================================================================================
====================================================================================
February 9: 6:10 AM DJI+245
NASDAQ +187 Date used for 2/8/2022

| Without a Peerless buy signal, we have to
look for a significant top on this run. The internals point to the DJI doing too much of the work in keeping the appearance of the bull market alive. And within the DJI, too few stocks are giving the DJI much more apparent strength than the reality warrants A 2% rally from here will bring a Peerless Sell S9. But the DJI may be able to make a nominal new high as it did several times in 1980-1981. First, it must get past its 65-dma. That may be hard if the CPI numbers on the 10th of this month are well above 5%-6% from a year ago. The FED may not be able to maintain the market's recovery. We see nearly 500 new lows and the NASDAQ has been hit by a number of big declines in former favorites. The real damage of course is in bonds. The rate with which the short-term rates are rising has not yet been reflected in the longer bond yields. Partly, this is because conservative investors need a haven and long bonds are the last to be sold. As the risk of inflation grows, many will buy blue chips now. And what better haven then the big banks. The FED is still a master at protecting them. Draw the Closing Power trendlines on your charts and abide by them. Professionals will be first to know when longer bonds will be hit with serious selling. Stick with the oil and commodities long and the shorts in the bearish MINCPs and bonds. |
||
|
Charts - 2/8/2022 2022 PEERLESS DJI, Signals, Indicators Daily DJI Volume 10-DayUp/Down Vol Stoch-20 Pct of All Stocks above 65-dma Inverted Traders Index Cum. Inverted Traders Index DJI-IPA DJI-OBV NASDAQ S&P OEX NYSE DJI-15 DJI-20 DJI-30 DIA QQQ SPY IWM TNA Short-Term Rates Ten Year Rates DOLLAR-UUP ALLSTOCKs recent 2006 vers-Peerless signals http://tigersoft.com/NEWPEER/UPD80208.BMP MDY - http://www.tigersoftware.com/CHARTZ/MDY.GIF USO-CrudeOil DBO FAS GLD HD IBB JETS JNUG KOL NUGT OIH PALL RSX RETL SDS AGQ SLV SOXL TAN TECL TLT TMF TNA UGA China: YINN CHAU Commodities: CANE CORN DBC JJC, NIB CORN, CUT (paper) MOO, SOYB WEAT UUP (Dollar) LIT (Lithium) STOCKS: MRNA DIS GE PYPL GME ZOM XLE NRGU AAPL ADBE ALXN AMAT AMGN AMD AMZN AXP BA BABA BAC BIDU BLDP CAT CRM CVX CMG DE ENPH FB GILD GOOG GS HD IBM INTU JPM LRCX MRK MSFT NEM NFLX NKE NVDA PG PYPL REGN REV SO SQ QCOM QDEL TSLA TXN XOM V VRTX WFC WMT ZM Bullish MAXCPs http://tigersoft.com/UPPER/2-09/BULLISH.htm Bearish MINCPs http://tigersoft.com/DOWNER/2-09/MINCPS.htm Bearish BONDS http://tigersoft.com/DOWNER/2-09/BEARIBOND.htm |
A 600 point rally would take DJI close enough to upper band to produce a Sell S9.  |
| DIA shows a target-resistance
level of 356-357 but its Closing Power is still rising.  |
| Only 3 DJI-30 stocksaccounted for 200 points of today's big
gain. This makes the rally look rigged and somewhat suspect. But that's the way late-sage rallies are.  |
 |
 |
|
Beware of NASDAQ Trapdoor Stocks. Broken support levels should be taken very seriously. We must watch the "trapdoor" count in Table 2 below. |
 |
 |
 |
 |
Table 1 QUICKSILVER on ETFS - 2/7/2022 Bullish = 2 - OIH CORN Bearish = 1 - SOXL ETF CLOSE CHANGE PIVOT-PT 5-dma AROC CL-PWR CANDLE IP21 ITRS POWER INDEX --------------------------------------------------------------------------------------------- --------------------------------------------------------------------------------------------- DIA 354.54 3.64 356.03 8.5% ------- BLUE .146 --- . 146 --------------------------------------------------------------------------------------------- SPY 450.94 3.68 457.35 -22.3% ------- BLUE .096 -.033 .063 --------------------------------------------------------------------------------------------- QQQ 359.12 3.99 368.49 -88.9% Bearish BLUE .018 -.098 -.08 --------------------------------------------------------------------------------------------- MDY 487.14 9.15 484.95 23% ------- BLUE .073 -.054 .019 --------------------------------------------------------------------------------------------- IWM 202.76 3.4 201.34 -15% ------- BLUE .007 -.106 -.099 --------------------------------------------------------------------------------------------- FAS 143.32 5.15 135.99 368.1% ------- BLUE .162 .086 .248 --------------------------------------------------------------------------------------------- RETL 25.29 1.98 24.85 -371.7% Bearish BLUE .092 -.459 -.367 Bearish --------------------------------------------------------------------------------------------- SOXL 46.6 3.19 49.34 76.8% Bearish BLUE .05 -.256 -.206 --------------------------------------------------------------------------------------------- TECL 66.06 2.41 70.4 -202.5% ------- BLUE .099 -.154 -.055 --------------------------------------------------------------------------------------------- IBB 131.55 -.09 132.98 -102.3% Bearish BLUE .057 -.167 -.11 --------------------------------------------------------------------------------------------- GLD 170.63 .52 168.84 71% ------- BLUE .203 .007 .21 --------------------------------------------------------------------------------------------- OIH 231.5 -5.1 232.65 -78.3% ------- RED .108 .258 .366 Bullish --------------------------------------------------------------------------------------------- CPER 27.29 -.05 27.32 45.8% Bullish BLUE -.062 .023 -.039 --------------------------------------------------------------------------------------------- UUP 25.6 .04 25.7 -39% ------- ---- -.02 -.022 -.042 --------------------------------------------------------------------------------------------- CORN 22.95 -.1 22.54 13.2% ------- ---- .271 .033 .304 Bullish --------------------------------------------------------------------------------------------- WEAT 7.51 .07 7.27 81.7% ------- BLUE .15 -.081 .069 --------------------------------------------------------------------------------------------- YINN 9.13 .21 8.99 -38.9% Bullish BLUE .099 -.084 .015 --------------------------------------------------------------------------------------------- RSX 24.77 .84 24.22 110.3% Bearish BLUE .119 -.121 -.002 |
Table 2 Count of Stocks in Key Directories
20220208
-------------------------------
NEWHIGHS 129
NEWLOWS 491
MAXCP 46
MINCP 34
TTTNH 23
TTTNL 25
CPCROSSA 95
CPCROSSD 57
ACCUMVER 5
HIGHIP21 10
HIUPPCT 44
VHIP21 62
LOWACCUM 210
REDSELL 130
AUGSELS7 16
TRAPDOOR 9
|
TaBLE 3 - RANKING OF KEY DIRECTORIES BASED PCT.OF STOCKS ABOVE 65-DMA
2/8/22
BULLISH = 14
Bearish = 30
---------------------------------------------------------------------------------------
Directory Current day-1 day-2 day-3 day-4 day-5
----------------------------------------------------------------------------------------
COAL 1 1 1 1 1 1
COPPER .875 .75 .75 .75 .75 .75
JETS .785 .571 .428 .357 .428 .428
FOOD .734 .693 .551 .571 .612 .632
OILGAS .723 .752 .761 .761 .819 .8
INSURANC .72 .68 .64 .64 .68 .64 REGBANKS .72 .56 .56 .4 .44 .52 COMODITY .717 .666 .512 .538 .589 .615 BIGBANKS .714 .714 .714 .714 .714 .714 UTILITY .666 .717 .641 .692 .717 .641 DJI-13 .615 .615 .538 .538 .538 .538 SP-100 .577 .566 .566 .544 .6 .577 FIDSTKS .568 .52 .508 .479 .556 .55 FINANCE .565 .517 .505 .476 .553 .547 ============================================================================================== BEVERAGE .5 .357 .428 .5 .571 .428 DOWJONES .5 .5 .466 .466 .533 .5 EDU .5 .5 .333 0 .333 .333 INDMATER .5 .416 .361 .361 .472 .416 MILITARY .5 .346 .23 .23 .269 .307 =============================================================================================== GAMING .473 .421 .368 .21 .21 .21 TRANSP .473 .315 .315 .263 .368 .473 GOLD .456 .326 .173 .13 .195 .217 INFRA .454 .424 .393 .393 .393 .363 SP500 .448 .416 .418 .408 .458 .42 ETFS .381 .254 .254 .254 .363 .363 CHEM .347 .304 .282 .282 .347 .326 INDEXES .345 .356 .34 .356 .383 .335 HACKERS .315 .315 .21 .21 .263 .263 NIFTY .304 .26 .26 .239 .282 .239 COMPUTER .3 .25 .25 .25 .3 .3 NASD-100 .298 .288 .298 .268 .319 .257 CHINA .28 .2 .2 .22 .2 .24 HOSPITAL .25 .187 .187 .187 .187 .25 SOFTWARE .25 .232 .214 .214 .25 .214 RUS-1000 .245 .2 .169 .177 .217 .23 LOWPRICE .208 .183 .157 .152 .162 .165 RETAIL .191 .17 .17 .127 .191 .212 AUTO .188 .132 .15 .132 .188 .169 REIT .176 .146 .13 .161 .207 .192 HIGHPRIC .16 .12 .123 .109 .16 .127 SEMI .157 .042 .063 .063 .115 .115 BIOTECH .148 .134 .129 .109 .123 .137 ELECTRON .142 .067 .075 .09 .127 .12 GREEN .105 .052 .052 .052 .157 .105 GUNS .076 .076 .076 .076 .076 .076 HOMEBLDG .055 .055 .055 .055 .166 .111 BONDFUND 0 0 0 0 0 .011 MARIJUAN 0 0 0 0 0 0 SOLAR 0 0 0 0 0 0 |
===================================================================================
February 8: 6:00 AM DJI+30 NASDAQ -20 Date used for
2/7/2022
| Without a new
Peerless Buy signal, the market must be considered in a holding pattern waiting for something to send it upwards to tag the recent recovery highs (What would that be? Bullish earnings? New hiring data? a curtailment of war threats in the Ukraine?) or something to send the DJI and other indexes to new lows (another jump higher by interest rates or a bleak CPI report later this week?). Today, interest rates fell back and now the DJI wants to rally a little. But the QQQ is stubbornly refusing. The upside appears technically limited by the negative internals we see on on the DJI chart. The DJI's support 10% down-from the peak remains intact. But the 65-dma will probably stop any DJI rally for now. Historically, the 10%-down-from-the-peak level is very important. As long as it holds up, the odds favor a modest DJI recovery. The financials, AXP, GS and JPM in the DJI-30 should then rise. The period from 1953 to 1957 has some parallels with the present because it saw the FED raising interest rates in a bull market. In the earlier case, short-term rates had to rise from below 1% to 4% to finally send the DJI down 20% in mid-1957. Since short-term rates now are only at 2%, the argument here would seem to favor higher DJI prices and also more 10% DJI declines. There was one such decline in 1955 and two in 1956 and stiil the DJI held up. Unfortunately, our period has no massive Public Works bill like Eisenhower's Interstate Highway program and Inflation is now much higher. While we wait for the new CPI numbers and the next Jobs Report, hold long mostly oil stocks and commoditiy ETFs and hold short some of still plentiful bearish MINCPs. Soon enough there will be more excitement. Unfortunately, it may not be the excitement we all want. |
||
|
Charts - 2/7/2022 2022 PEERLESS DJI, Signals, Indicators Daily DJI Volume 10-DayUp/Down Vol Stoch-20 Pct of All Stocks above 65-dma Inverted Traders Index Cum. Inverted Traders Index DJI-IPA DJI-OBV NASDAQ S&P OEX NYSE COMPQX DJI-15 DJI-20 DJI-30 DIA QQQ SPY IWM TNA Short-Term Rates DOLLAR-UUP ALLSTOCKs recent 2006 vers-Peerless signals http://tigersoftware.com/NEWPEER/UPD80207.BMP MDY - http://www.tigersoftware.com/CHARTZ/MDY.GIF USO-CrudeOil DBO FAS GLD HD IBB JETS JNUG KOL NUGT OIH PALL RSX RETL SDS AGQ SLV SOXL TAN TECL TLT TMF TNA UGA (gasoline) USO (oil) and China YINN CHAU Commodities: CANE CORN DBC JJC, NIB CORN, CUT (paper) MOO, SOYB WEAT UUP (Dollar) LIT (Lithium) STOCKS: MRNA DIS GE PYPL GME ZOM XLE NRGU AAPL ADBE ALXN AMAT AMGN AMD AMZN AXP BA BABA BAC BIDU BLDP CAT CRM CVX CMG DE ENPH FB GILD GOOG GS HD IBM INTU JPM LRCX M MRK MSFT NEM NFLX NKE NKE NVDA PG PYPL REGN REV SO SQ QCOM QDEL TSLA TXN XOM V VRTX WFC WMT ZM Bullish MAXCPsv http://tigersoftware.com/UPPER/2-07/BULLISH.htm Bearish MINCPs http://tigersoftware.com/DOWNER/2-07/BEARISH.htm |
 |
 |
 |
 |
 |
 |
 |
 |
Table 1 QUICKSILVER on ETFS - 2/7/2022 Bullish = 2 - OIH CORN Bearish = 2 - RETL SOXL ETF CLOSE CHANGE PIVOT-PT 5-dma AROC CL-PWR CANDLE IP21 ITRS POWER INDEX --------------------------------------------------------------------------------------------- --------------------------------------------------------------------------------------------- DIA 350.9 .03 353.94 -2.6% Bearish RED .128 ---- ----- --------------------------------------------------------------------------------------------- SPY 447.26 -1.44 452.95 -29.4% Bearish RED .065 -.027 .038 --------------------------------------------------------------------------------------------- QQQ 355.13 -2.88 365.52 -109.5% Bearish RED -.023 -.089 -.112 --------------------------------------------------------------------------------------------- MDY 477.99 -.01 484.93 -21.3% Bearish RED .023 -.067 -.044 --------------------------------------------------------------------------------------------- IWM 199.36 .98 203.36 -46.9% ------- BLUE -.042 -.119 -.161 --------------------------------------------------------------------------------------------- FAS 138.17 .86 133.37 385% Bullish BLUE .175 -.017 .158 --------------------------------------------------------------------------------------------- RETL 23.31 .33 27.09 -553.2% Bearish BLUE .043 -.502 -.459 bearish --------------------------------------------------------------------------------------------- SOXL 43.41 -.05 45.91 -129.5% Bearish RED -.016 -.331 -.347 bearish --------------------------------------------------------------------------------------------- TECL 63.65 -1.35 68.75 -347.5% Bearish RED .067 -.211 -.144 --------------------------------------------------------------------------------------------- IBB 131.64 1.01 134.25 -8.3% ------- BLUE -.001 -.122 -.123 --------------------------------------------------------------------------------------------- GLD 170.11 1.25 168.23 59.9% ------- BLUE .204 .038 .242 --------------------------------------------------------------------------------------------- OIH 236.6 2.2 235.16 232.6% Bullish BLUE .144 .25 .394 bullish --------------------------------------------------------------------------------------------- CPER 27.34 -.11 27.04 155% Bullish BLUE -.037 .021 -.016 --------------------------------------------------------------------------------------------- UUP 25.56 .01 25.8 -60.3% Bearish ---- -.021 .004 -.017 --------------------------------------------------------------------------------------------- CORN 23.05 .49 22.89 97.4% Bullish BLUE .265 .087 .352 bullish --------------------------------------------------------------------------------------------- WEAT 7.44 .06 7.39 88.8% ------- ---- .141 -.067 .074 --------------------------------------------------------------------------------------------- YINN 8.92 -.14 9.2 -66.5% ------- ---- .079 -.146 -.067 --------------------------------------------------------------------------------------------- RSX 23.93 -.12 24.24 -8.3% Bearish ---- .069 -.151 -.082 |
Table 2 Count of Stocks in Key Directories
20220207
-------------------------------
NEWHIGHS 103
NEWLOWS 408
MAXCP 51
MINCP 51
TTTNH 27
TTTNL 44
CPCROSSA 55
CPCROSSD 63
ACCUMVER 6
HIGHIP21 11
HIUPPCT 38
VHIP21 65
LOWACCUM 208
REDSELL 135
AUGSELS7 15
TRAPDOOR 4
|
Table 3 RANKING OF KEY DIRECTORIES BASED PCT.OF STOCKS ABOVE 65-DMA
2/7/22
bullish = 15 bearish = 34 --------------------------------------------------------------------------------------- Directory Current day-1 day-2 day-3 day-4 day-5 ---------------------------------------------------------------------------------------- COAL 1 1 1 1 1 .833 OILGAS .752 .761 .761 .819 .8 .714 COPPER .75 .75 .75 .75 .75 .5 UTILITY .717 .641 .692 .717 .641 .717 BIGBANKS .714 .714 .714 .714 .714 .714 FOOD .693 .551 .571 .612 .612 .571 INSURANC .68 .64 .64 .68 .64 .64 COMODITY .666 .512 .538 .589 .589 .487 DJI-13 .615 .538 .538 .538 .538 .538 JETS .571 .428 .357 .428 .428 .428 SP-100 .566 .566 .544 .6 .588 .544 REGBANKS .56 .56 .4 .44 .52 .36 FIDSTKS .52 .508 .479 .556 .55 .467 FINANCE .517 .505 .476 .553 .547 .464 =============================================================================================== DOWJONES .5 .466 .466 .533 .5 .5 EDU .5 .333 0 .333 .333 .333 INFRA .424 .393 .393 .393 .363 .303 GAMING .421 .368 .21 .21 .21 .21 INDMATER .416 .361 .361 .472 .416 .305 SP500 .416 .418 .408 .458 .424 .388 BEVERAGE .357 .428 .5 .571 .428 .5 INDEXES .356 .34 .356 .383 .329 .313 MILITARY .346 .23 .23 .269 .307 .23 GOLD .326 .173 .13 .195 .217 .173 HACKERS .315 .21 .21 .263 .263 .21 TRANSP .315 .315 .263 .368 .473 .315 CHEM .304 .282 .282 .347 .347 .239 NASD-100 .288 .298 .268 .319 .257 .247 NIFTY .26 .26 .239 .282 .239 .239 ETFS .254 .254 .254 .363 .381 .218 COMPUTER .25 .25 .25 .3 .3 .4 SOFTWARE .232 .214 .214 .25 .214 .214 CHINA .2 .2 .22 .2 .24 .24 RUS-1000 .2 .169 .177 .217 .227 .187 HOSPITAL .187 .187 .187 .187 .25 .25 LOWPRICE .185 .155 .15 .162 .167 .139 RETAIL .17 .17 .127 .191 .212 .17 REIT .146 .123 .169 .207 .192 .192 BIOTECH .134 .129 .109 .123 .134 .12 AUTO .132 .15 .132 .188 .207 .132 HIGHPRIC .12 .123 .109 .16 .127 .105 GUNS .076 .076 .076 .076 .076 .076 ELECTRON .067 .075 .09 .127 .127 .112 HOMEBLDG .055 .055 .055 .166 .111 .055 GREEN .052 .052 .052 .157 .105 .105 SEMI .042 .063 .063 .115 .126 .126 BONDFUND 0 0 0 0 .011 0 MARIJUAN 0 0 0 0 0 0 SOLAR 0 0 0 0 0 0 |
-----------------------------------------------------------------------------------------------------------------------------------------------------
February 7: 6:00 AM DJI+57 NASDAQ +58 Date used for 2/4/2022
| Short-term, the
odds still favor more of a rally... up to the resistance levels shown in the charts below. But the signs of danger are everywhere, not least of which is that there were 5x more new lows than new highs on Friday. But is the FED losing control of rates? Short-term rates shot well above 2% on Friday and far above, the ten-year benchmark rate which they are bound to lift. Rates may go even higher this week, when the CPI numbers come out on the 10th. It does not feel like the 5% inflation rate we experienced in the 1970s when prices at the pump quadruped from October 1973 to March 1974 because of the OPEC Oil Embargo. Inflation now feels much higher if you are a renter and live on a fixed income when buying groceries and other necessities. Inflation feels then more like 8%-10%. If stocks can recover, because the economy stays strong, investors will buy them as they did in 1967 and 1968 because they are an inflation hedge. But if the DJI falters here and drops well below its 10%-down-from-the peak line, we would be in a dangerous situation. I fear the next support for the DJI then would be 19% down from the peak. As it is the DJI has run up to its key resistance at its 65-dma and to close the gap down. Now it is probling for support again. The tech ETFs managed a 50% recovery of what they lost, almost exactly, but now traders are bound to fear that the next CPI number will be much higher than the FED has forecast. With the Oil and Commodities leading the market now in Tables 1 and 3 below and in our list of Bullish Maxcps, we are clearly being reminded of 1973 (which led to a deep 23 month-long bear market). The way oil stocks rose in 2007-2008 until they got caught up in their own climactic gusher is also clearly a warning now. But big bank stocks are a lot stronger now. It is vital that AXP, JPM and GS now break down to new lows. The 1977 bear market saw the DJI slowly fall ahead of the rest of the market. That is the opposite of what we see now. What is clear is, first, that Peerless has not given an intermediate-term Buy signal to replace the Sell S16 and, second, that interest rates are rising very quickly. It is not an exaggeration to say that the Bond market could be approaching a panic state. See how our chart of all the Bond Funds is close to a free-fall. Why should we care about bond funds? Their rapid decline may mean bank and fund failures. This would create a crisis of confidence that spreads to all that Wall Street sells. Debt in the US is at record highs. If buyers of debt instruments demand rates that cover the rate of inflation and a much higher risk of insolvency, we are truly now in the "calm before the storm". What I worry most is that rogue professional traders will use all the leveraged negative (short) instruments out there to drive prices down, steadily down and down some more until there is a full-blown panic. So...We should be hedged with some of the many bearish MINCPs and sell out our short-term Buys if the DJI breaks below its 10% down support, holding long only Oil stocks and commodity ETFs. Look back at 1957, 1966, 1969, 1973, 1977, 1987 and 2007. It was only when the DJI finally dropped more than 10% down from its highs that it and prices for most other stocks began to really sag. In each of these seven cases, the FED had started raising rates for fear of Inflation. This 10%-down and sell-out rule is not perfect, however. In 1960 and in 2000, the DJI broke down more than 10% as rates were being raised, but then it rallied for a while before starting its bigger decline. |
||
|
Charts - 2/4/2022 2022 PEERLESS DJI, Signals, Indicators Daily DJI Volume 10-DayUp/Down Vol Stoch-20 Pct of All Stocks above 65-dma Inverted Traders Index Cum. Inverted Traders Index DJI-IPA DJI-OBV NASDAQ S&P OEX NYSE COMPQX DJI-15 DJI-20 DJI-30 DIA QQQ SPY IWM TNA Short-Term Rates DOLLAR-UUP ALLSTOCKs recent 2006 vers-Peerless signals http://tigersoftware.com/NEWPEER/UPD80204.BMP MDY - http://www.tigersoftware.com/CHARTZ/MDY.GIF USO-CrudeOil DBO FAS GLD HD IBB JETS JNUG KOL NUGT OIH PALL RSX RETL SDS AGQ SLV SOXL TAN TECL TLT TMF TNA UGA (gasoline) USO (oil) and China YINN CHAU Commodities: CANE CORN DBC JJC, NIB CORN, CUT (paper) MOO, SOYB WEAT UUP (Dollar) LIT (Lithium) STOCKS: MRNA DIS GE PYPL GME ZOM XLE NRGU AAPL ADBE ALXN AMAT AMGN AMD AMZN AXP BA BABA BAC BIDU BLDP CAT CRM CVX CMG DE ENPH FB GILD GOOG GS HD IBM INTU JPM LRCX M MRK MSFT NEM NFLX NKE NKE NVDA PG PYPL REGN REV SO SQ QCOM QDEL TSLA TXN XOM V VRTX WFC WMT ZM Bullish MAXCPsv http://tigersoftware.com/UPPER/2-04/BULLISH.htm Bearish MAXCPs http://tigersoftware.com/DOWNER/2-04/BEARISH.htm |
  |
 |
 |
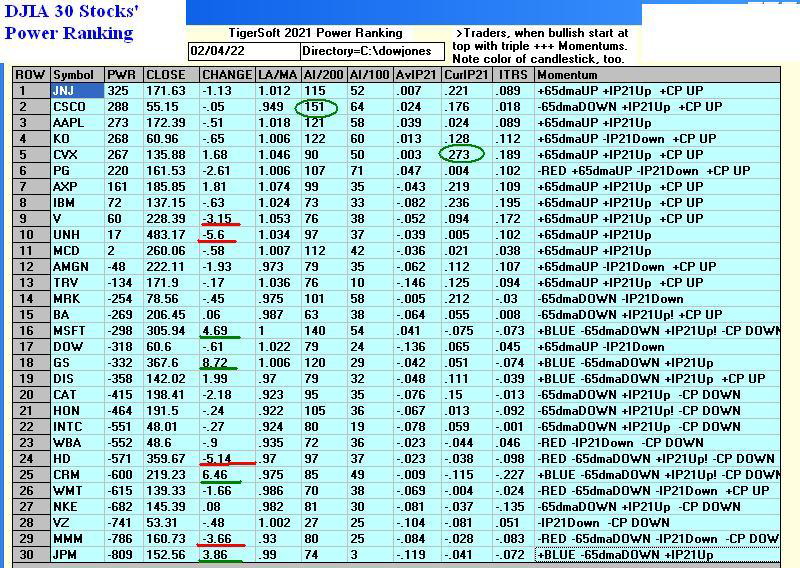 |
 |
 |
 |
 |
 |
 |
Table 1 QUICKSILVER on ETFS - 2/4//2022 Bullish = 2 - OIH CORN Bearish = 2 - RETL SOXL ETF CLOSE CHANGE PIVOT-PT 5-dma AROC CL-PWR CANDLE IP21 ITRS POWER INDEX --------------------------------------------------------------------------------------------- DIA 350.87 -.11 351.08 53.4% Bearish BLUE .113 ---- ----- --------------------------------------------------------------------------------------------- SPY 448.7 2.1 449.91 75% Bearish BLUE .077 -.022 .055 --------------------------------------------------------------------------------------------- QQQ 358.01 4.46 363.05 86.1% Bearish BLUE -.001 -.079 -.08 --------------------------------------------------------------------------------------------- MDY 478 .92 480.04 85.7% Bearish BLUE .045 -.067 -.022 --------------------------------------------------------------------------------------------- IWM 198.38 .85 201.24 78.4% Bearish BLUE -.03 -.122 -.152 --------------------------------------------------------------------------------------------- FAS 137.31 6.31 127.92 507.8% Bullish BLUE .215 -.027 .188 --------------------------------------------------------------------------------------------- RETL 22.98 .13 26.05 -76.5% Bearish RED .062 -.529 -.467 weak --------------------------------------------------------------------------------------------- SOXL 43.46 .83 44.58 571.6% Bearish BLUE .024 -.309 -.285 weak --------------------------------------------------------------------------------------------- TECL 65 .77 68.33 120.1% Bearish BLUE .068 -.178 -.11 --------------------------------------------------------------------------------------------- IBB 130.63 .42 131.86 101.2% ------- BLUE .013 -.126 -.113 --------------------------------------------------------------------------------------------- GLD 168.86 .26 168.09 52.3% ------- BLUE .145 .029 .174 --------------------------------------------------------------------------------------------- OIH 234.4 4.68 225.83 153.2% Bullish BLUE .144 .239 .383 strong --------------------------------------------------------------------------------------------- CPER 27.45 .26 26.5 195.2% ------- BLUE -.016 .037 .021 --------------------------------------------------------------------------------------------- UUP 25.55 -.02 25.87 -96.9% Bearish ---- -.005 .008 .003 --------------------------------------------------------------------------------------------- CORN 22.56 .2 22.61 -42% ------- BLUE .212 .056 .268 bullish --------------------------------------------------------------------------------------------- WEAT 7.38 .12 7.31 -129.1% ------- BLUE .126 -.092 .034 --------------------------------------------------------------------------------------------- YINN 9.06 .23 9.04 659.7% ------- BLUE .096 -.125 -.029 --------------------------------------------------------------------------------------------- RSX 24.05 .41 23.97 131.8% Bearish BLUE .096 -.164 -.068 |
Table 2 Count of Stocks in Key Directories
20220204
-------------------------------
NEWHIGHS 112
NEWLOWS 612
MAXCP 27
MINCP 64
TTTNH 28
TTTNL 74
CPCROSSA 97
CPCROSSD 69
ACCUMVER 5
HIGHIP21 8
HIUPPCT 33
VHIP21 68
LOWACCUM 211
REDSELL 139
AUGSELS7 16
TRAPDOOR 12
|
RANKING OF KEY DIRECTORIES BASED PCT.OF STOCKS ABOVE 65-DMA
2/4/22
Bullish = 13
Bearish = 36
---------------------------------------------------------------------------------------
Directory Current day-1 day-2 day-3 day-4 day-5
----------------------------------------------------------------------------------------
COAL 1 1 1 1 .833 1
OILGAS .761 .761 .819 .8 .714 .714
COPPER .75 .75 .75 .75 .5 .5
BIGBANKS .714 .714 .714 .714 .714 .571
UTILITY .641 .692 .717 .641 .717 .666
INSURANC .64 .64 .68 .64 .64 .48 SP-100 .566 .544 .6 .588 .544 .488 REGBANKS .56 .4 .44 .52 .36 .36 FOOD .551 .571 .612 .612 .571 .551 DJI-13 .538 .538 .538 .538 .538 .384 COMODITY .512 .538 .589 .589 .487 .461 FIDSTKS .508 .479 .556 .55 .467 .39 FINANCE .505 .476 .553 .547 .464 .386 ---------------------------------------------------------------------------------------------- DOWJONES .466 .466 .533 .5 .5 .466 BEVERAGE .428 .5 .571 .428 .5 .357 JETS .428 .357 .428 .428 .428 .214 SP500 .418 .408 .458 .424 .388 .348 INFRA .393 .393 .393 .363 .303 .212 GAMING .368 .21 .21 .21 .157 .157 INDMATER .361 .361 .472 .416 .319 .263 INDEXES .34 .356 .383 .329 .302 .286 EDU .333 0 .333 .333 .333 .166 TRANSP .315 .263 .368 .473 .315 .157 NASD-100 .298 .268 .319 .257 .237 .206 CHEM .282 .282 .347 .347 .26 .195 NIFTY .26 .239 .282 .239 .239 .173 ETFS .254 .254 .363 .381 .236 .145 COMPUTER .25 .25 .3 .3 .4 .25 MILITARY .23 .23 .269 .307 .23 .192 SOFTWARE .214 .214 .25 .214 .214 .196 HACKERS .21 .21 .263 .263 .21 .21 CHINA .2 .22 .2 .24 .24 .18 HOSPITAL .187 .187 .187 .25 .25 .187 GOLD .173 .13 .195 .217 .173 .108 RETAIL .17 .127 .191 .212 .17 .106 RUS-1000 .169 .177 .217 .227 .189 .144 LOWPRICE .157 .147 .16 .167 .137 .099 AUTO .15 .132 .188 .207 .15 .132 BIOTECH .129 .109 .123 .134 .115 .101 HIGHPRIC .123 .109 .16 .127 .109 .09 REIT .123 .161 .215 .192 .207 .123 GUNS .076 .076 .076 .076 .076 .076 ELECTRON .075 .09 .127 .127 .112 .082 SEMI .063 .063 .115 .126 .126 .052 HOMEBLDG .055 .055 .166 .111 .055 .055 GREEN .052 .052 .157 .105 .105 .105 BONDFUND 0 0 0 .011 0 0 MARIJUAN 0 0 0 0 0 0 SOLAR 0 0 0 0 0 0 |
====================================================================================
====================================================================================
February 3: 6:00 AM
DJI -180 NASDAQ -31
Date used for 2/3/2022
| I consider the Tiger programs to have rendered a short-term
buy by virtue of the DJI not having fallen more than 10% from its high and the oversold red Stochastic 20- K-line having crossed above the blue Pct-D (3-day ma of the K-Line. In addition, the I/MKDS -6-day ma has turned up from oversold status. And as I said, it's clear that a large faction on the FOMC that sets US interest rates is reluctant to rapidly raise rates, so that they may be able to hold the market up for more time than the many bears believe possible. And, of course, we know from Peerless history that it is quite to common for the DJIA to hold up 4-10 months after the first DJI new high is not confirmed by the NYSE A/D Line. The broadening DJI pattern also is consistent with the DJI even making a nominal new new high. 1981 is a fine example of this. Seasonality also supports a stance that is short-term bullish. Since 1966, 2nd years in the 4-year Presidential cycle have seen the DJI rally 71% of the time over the next 21-trading days after February 4th. That period has gained on average 2.1%. But the opening will be lower today. The Jobs Report today shows an increase in jobs by 414,000 last month. That is not a wildly high number. The next few months could see it slip into negative territory if the FED goes ahead with 4 rate hikes. It all depends on the rate of Inflation. If the coming CPI drops below 4%, that will buy the FED hawks some time. Is that likely? The signs of inflation are everywhere and crude oil could jump over $100/bar. So, new lows by the DJI and the SPY will be quite bearish. Drops by them below their 10%-down from the peak will deprive short-term traders of hope for more of a rally. The CPI number will be the key. (Due next on Feb. 10th) Productivity is increasing at a fast clip, but wages are going up still faster. Powell will fight to prevent higher wages and will support the hawks in the FOMC is wages rise too fast. Without a reversing Peerless Buy signal, we can only look for a rally by the SPY and DIA back to their falling 65-dma resistances and for them to close their recent gaps down. Similarly, the tech ETFs are most likely to reach their 50% recovery level. More than that can not be counted on. But the Stochastic-20's are still way below oversold status. So, we have more time to allow a good rally from here. Commodites and Oil are the strongest groups at present. we will want to watch FAS and the big banks. They tell us about what Professionals expect the FED to do. Being long the most bullish ETFs and short the most bearish, as ranked by the 2021 Tiger Power Rankers, gives you what I consider to be the best way to hedge now. Short-term traders should still look for a rally back to the levels just mentioned. |
||
| Charts - 2/3/2022 2022 PEERLESS DJI, Signals, Indicators Daily DJI Volume 10-DayUp/Down Vol Stoch-20 Pct of All Stocks above 65-dma Inverted Traders Index Cum. Inverted Traders Index DJI-IPA DJI-OBV NASDAQ S&P OEX NYSE COMPQX DJI-15 DJI-20 DJI-30 DIA QQQ SPY IWM TNA Short-Term Rates DOLLAR-UUP ALLSTOCKs recent 2006 vers-Peerless signals http://tigersoftware.com/NEWPEER/UPD80202.BMP MDY - http://www.tigersoftware.com/CHARTZ/MDY.GIF USO-CrudeOil DBO FAS GLD HD IBB JETS JNUG KOL NUGT OIH PALL RSX RETL SDS AGQ SLV SOXL TAN TECL TLT TMF TNA UGA (gasoline) USO (oil) and China YINN CHAU Commodities: CANE CORN DBC JJC, NIB CORN, CUT (paper) MOO, SOYB WEAT UUP (Dollar) LIT (Lithium) STOCKS: MRNA DIS GE PYPL GME ZOM XLE NRGU AAPL ADBE ALXN AMAT AMGN AMD AMZN AXP BA BABA BAC BIDU BLDP CAT CRM CVX CMG DE ENPH FB GILD GOOG GS HD IBM INTU JPM LRCX M MRK MSFT NEM NFLX NKE NKE NVDA PG PYPL REGN REV SO SQ QCOM QDEL TSLA TXN XOM V VRTX WFC WMT ZM Bullish MAXCPsv http://tigersoftware.com/UPPER/2-03/BULLISH.htm Bearish MAXCPs http://tigersoftware.com/DOWNER/2-03/BEARISH.htm |
 |
 |
 |
 |
 |
 |
 |
 |
Table 1 QUICKSILVER on ETFS - 2/3//2022 Bullish = 1 - OIH Bearish = 2 - RETL SOXL ETF CLOSE CHANGE PIVOT-PT 5-dma AROC CL-PWR CANDLE IP21 ITRS POWER INDEX --------------------------------------------------------------------------------------------- DIA 350.98 -5.05 347.11 134.7% Bearish RED .076 ---- ---- --------------------------------------------------------------------------------------------- SPY 446.6 -10.75 441.95 171.9% Bearish RED .037 -.03 .007 --------------------------------------------------------------------------------------------- QQQ 353.55 -14.94 351.8 173.9% Bearish RED -.05 -.1 -.15 --------------------------------------------------------------------------------------------- MDY 477.08 -7.87 469.78 173% Bearish RED -.003 -.075 -.078 --------------------------------------------------------------------------------------------- IWM 197.53 -3.81 195.25 151.4% Bearish RED -.078 -.133 -.211 --------------------------------------------------------------------------------------------- FAS 131 -4.99 124.06 464.9% Bearish RED .146 -.037 .109 --------------------------------------------------------------------------------------------- RETL 22.85 -2 23.36 24.2% Bearish RED -.006 -.556 -.562 - --------------------------------------------------------------------------------------------- SOXL 42.63 -6.71 38.41 730.4% Bearish RED -.026 -.334 -.36 - --------------------------------------------------------------------------------------------- TECL 64.23 -6.17 63.39 617.7% Bearish RED .02 -.199 -.179 --------------------------------------------------------------------------------------------- IBB 130.21 -2.77 127.97 250.9% Bearish RED -.039 -.138 -.177 --------------------------------------------------------------------------------------------- GLD 168.6 -.24 167.1 29.8% ------- BLUE .088 .014 .102 --------------------------------------------------------------------------------------------- OIH 229.72 -2.93 227.35 74.1% Bullish RED .086 .251 .337 + --------------------------------------------------------------------------------------------- CPER 27.19 -.13 26.4 50.3% Bearish ---- -.091 .032 -.059 --------------------------------------------------------------------------------------------- UUP 25.57 -.13 26.05 -94.6% ------- ---- .052 .003 .055 --------------------------------------------------------------------------------------------- CORN 22.36 -.18 22.75 -11% Bullish ---- .145 .05 .195 --------------------------------------------------------------------------------------------- WEAT 7.26 -.01 7.57 -115% ------- BLUE .086 -.102 -.016 --------------------------------------------------------------------------------------------- YINN 8.83 -.16 7.9 498.8% ------- BLUE .019 -.163 -.144 --------------------------------------------------------------------------------------------- RSX 23.64 -.58 23.42 86.1% Bearish RED .04 -.152 -.112 |
Table 2 Count of Stocks in Key Directories
20220203
-------------------------------
NEWHIGHS 94
NEWLOWS 386
MAXCP 35
MINCP 63
TTTNH 17
TTTNL 95
CPCROSSA 13
CPCROSSD 211
ACCUMVER 8
HIGHIP21 6
HIUPPCT 25
VHIP21 67
LOWACCUM 196
REDSELL 143
AUGSELS7 16
TRAPDOOR 24
|
RANKING OF KEY DIRECTORIES BASED PCT.OF STOCKS ABOVE 65-DMA Table 3 2/3/22 Bullish = 10 Bearish = 38 --------------------------------------------------------------------------------------- Directory Current day-1 day-2 day-3 day-4 day-5 ---------------------------------------------------------------------------------------- COAL 1 1 1 .833 1 1 OILGAS .761 .819 .8 .714 .723 .695 COPPER .75 .75 .75 .5 .5 .75 BIGBANKS .714 .714 .714 .714 .571 .428 UTILITY .692 .717 .641 .717 .666 .615 INSURANC .64 .68 .64 .64 .48 .44 FOOD .571 .612 .612 .571 .551 .551 SP-100 .544 .6 .588 .544 .488 .422 COMODITY .538 .589 .589 .487 .461 .512 DJI-13 .538 .538 .538 .538 .384 .384 BEVERAGE .5 .571 .428 .5 .428 .5 FIDSTKS .479 .556 .55 .467 .402 .325 FINANCE .476 .553 .547 .464 .398 .321 DOWJONES .466 .533 .5 .5 .466 .4 SP500 .408 .458 .424 .388 .352 .278 REGBANKS .4 .44 .52 .36 .36 .36 INFRA .393 .393 .363 .303 .212 .242 INDMATER .361 .472 .416 .319 .263 .305 JETS .357 .428 .428 .428 .214 .214 INDEXES .356 .383 .329 .302 .286 .243 CHEM .282 .347 .347 .26 .195 .195 NASD-100 .268 .319 .257 .237 .206 .144 TRANSP .263 .368 .473 .315 .157 .157 ETFS .254 .363 .381 .236 .163 .163 COMPUTER .25 .3 .3 .4 .25 .05 NIFTY .239 .282 .239 .239 .173 .086 MILITARY .23 .269 .307 .23 .192 .153 CHINA .22 .2 .24 .24 .18 .18 SOFTWARE .214 .25 .214 .214 .196 .178 GAMING .21 .21 .21 .157 .157 .157 HACKERS .21 .263 .263 .21 .21 .105 HOSPITAL .187 .187 .25 .25 .187 .187 RUS-1000 .177 .217 .227 .189 .156 .108 REIT .161 .207 .2 .207 .153 .069 LOWPRICE .15 .157 .165 .137 .101 .083 AUTO .132 .188 .207 .15 .132 .113 GOLD .13 .195 .217 .173 .108 .108 RETAIL .127 .191 .212 .17 .127 .127 BIOTECH .109 .123 .134 .115 .107 .082 HIGHPRIC .109 .16 .127 .109 .094 .065 ELECTRON .09 .127 .127 .112 .082 .075 GUNS .076 .076 .076 .076 .076 .076 SEMI .063 .115 .126 .126 .052 .052 HOMEBLDG .055 .166 .111 .055 .055 0 GREEN .052 .157 .105 .105 .105 .105 BONDFUND 0 0 .011 0 0 0 EDU 0 .333 .333 .333 .166 .166 MARIJUAN 0 0 0 0 0 0 SOLAR 0 0 0 0 0 0 |
====================================================================================
February 3: 6:40 AM
DJI - 309 NASDAQ - 345 Date
used for 2/2/2022
FACEBOOK Falls 25% at opening.
Support was quite limited once its 300-support level was violated. Its earnings'
miss
will worry other companies that depend upon a seemingly forever growing number of
social media customers, like Google. This will jolt a harsher view of the future
into
their investors' perspectives.
| The DJI is the leader now. It has rallied
back all the way to the resistance of its 65-dma and is now pulling back. The tech ETFs are considerably weaker. SPY again is trying to be the average of the two. For the last 12 months. the DJI has always been able to rally up enough so that its Stoch- astic 20 reaches the 80% level. If that is true here, it should mount another rally and get above its 65-day ma. QQQ needs to retreat and rally again to establish a Closing Power uptrendline. It will be hard for the DJI and the other ETFs to rally until the Jobs Report tomorrow is out of the way. Patience is needed now in what is the inevitable profit-taking after the recent bounce. Hold all current positions, long and short, while we wait to see if the NASDAQ and QQQ can turnaround on Friday. That short-term interest rates have fallen back below 2% will help. |
||
|
Charts - 2/2/2022 2022 PEERLESS DJI, Signals, Indicators Daily DJI Volume 10-DayUp/Down Vol Stoch-20 Pct of All Stocks above 65-dma Inverted Traders Index Cum. Inverted Traders Index DJI-IPA DJI-OBV NASDAQ S&P OEX NYSE COMPQX DJI-15 DJI-20 DJI-30 DIA QQQ SPY IWM TNA Short-Term Rates DOLLAR-UUP ALLSTOCKs recent 2006 vers-Peerless signals http://tigersoftware.com/NEWPEER/UPD80202.BMP MDY - http://www.tigersoftware.com/CHARTZ/MDY.GIF USO-CrudeOil DBO FAS GLD HD IBB JETS JNUG KOL NUGT OIH PALL RSX RETL SDS AGQ SLV SOXL TAN TECL TLT TMF TNA UGA (gasoline) USO (oil) and China YINN CHAU Commodities: CANE CORN DBC JJC, NIB CORN, CUT (paper) MOO, SOYB WEAT UUP (Dollar) LIT (Lithium) STOCKS: MRNA DIS GE PYPL GME ZOM XLE NRGU AAPL ADBE ALXN AMAT AMGN AMD AMZN AXP BA BABA BAC BIDU BLDP CAT CRM CVX CMG DE ENPH FB GILD GOOG GS HD IBM INTU JPM LRCX M MRK MSFT NEM NFLX NKE NKE NVDA PG PYPL REGN REV SO SQ QCOM QDEL TSLA TXN XOM V VRTX WFC WMT ZM Bullish MAXCPs http://tigersoftware.com/UPPER/2-02/BULLISH.htm Bearish MAXCPs http://tigersoftware.com/DOWNER/2-02/BEARISH.htm |
 |
 |
 |
 |
 |
 |
 |
Table 1 QUICKSILVER on ETFS - 2/2//2022 Bullish = 1 - OIH Bearish = 2 - RETL SOXL ETF CLOSE CHANGE PIVOT-PT 5-dma AROC CL-PWR CANDLE IP21 ITRS POWER INDEX --------------------------------------------------------------------------------------------- DIA 356.03 2.09 341.55 209.9% ------- BLUE .103 ---- ----- --------------------------------------------------------------------------------------------- SPY 457.35 4.4 431.24 271.2% Bearish BLUE .069 -.025 .044 --------------------------------------------------------------------------------------------- QQQ 368.49 2.97 341.1 338.6% Bearish RED -.024 -.088 -.112 --------------------------------------------------------------------------------------------- MDY 484.95 .02 460.61 181.3% Bearish RED .019 -.074 -.055 --------------------------------------------------------------------------------------------- IWM 201.34 -2.02 191.52 136% ------- RED -.054 -.135 -.189 --------------------------------------------------------------------------------------------- FAS 135.99 2.62 119.09 563.2% ------- BLUE .197 .024 .221 --------------------------------------------------------------------------------------------- RETL 24.85 -2.24 22.73 308% ------- RED .018 -.514 -.496 --------------------------------------------------------------------------------------------- SOXL 49.34 3.43 36.36 870.4% Bearish BLUE .02 -.281 -.261 --------------------------------------------------------------------------------------------- TECL 70.4 1.65 56.15 1047.4% Bearish BLUE .044 -.167 -.123 --------------------------------------------------------------------------------------------- IBB 132.98 -1.27 123.68 262.4% Bearish RED -.017 -.14 -.157 --------------------------------------------------------------------------------------------- GLD 168.84 .61 167.6 -28.2% ------- BLUE .075 -.022 .053 --------------------------------------------------------------------------------------------- OIL 15.16 .02 15.06 46.4% ------- ---- .008 .083 .091 --------------------------------------------------------------------------------------------- OIH 232.65 -2.51 226.32 48.7% Bullish RED .113 .266 .379 --------------------------------------------------------------------------------------------- CPER 27.32 .28 26.92 28% ------- ---- -.068 .02 -.048 --------------------------------------------------------------------------------------------- UUP 25.7 -.1 26.06 -27% ------- ---- .068 -.002 .066 --------------------------------------------------------------------------------------------- CORN 22.54 -.35 22.41 -6.6% Bullish RED .16 .053 .213 --------------------------------------------------------------------------------------------- WEAT 7.27 -.12 7.43 -221.2% ------- RED .161 -.093 .068 --------------------------------------------------------------------------------------------- YINN 8.99 -.21 7.97 335.1% Bearish RED .009 -.195 -.186 --------------------------------------------------------------------------------------------- RSX 24.22 -.02 23.23 479.3% Bearish RED .031 -.191 -.16 |
Table 2 Count of Stocks in Key Directories
20220202
-------------------------------
NEWHIGHS 132
NEWLOWS 169
MAXCP 54
MINCP 20
TTTNH 23
TTTNL 73
CPCROSSA 54
CPCROSSD 185
ACCUMVER 6
HIGHIP21 9
HIUPPCT 18
VHIP21 67
LOWACCUM 207
REDSELL 140
AUGSELS7 17
TRAPDOOR 20
|
Table 3 RANKING OF KEY DIRECTORIES BASED PCT.OF STOCKS ABOVE 65-DMA
2/2/22
Bullish = 14
Bearish = 35
---------------------------------------------------------------------------------------
Directory Current day-1 day-2 day-3 day-4 day-5
----------------------------------------------------------------------------------------
COAL 1 1 .833 1 1 1
OILGAS .819 .8 .714 .723 .695 .714
=====
COPPER .75 .75 .5 .5 .75 .75
BIGBANKS .714 .714 .714 .571 .428 .571
UTILITY .692 .641 .717 .666 .615 .564
INSURANC .68 .64 .64 .48 .4 .48 FOOD .612 .612 .571 .551 .551 .693 COMODITY .589 .589 .487 .461 .512 .641 SP-100 .588 .588 .544 .488 .433 .455 BEVERAGE .571 .428 .5 .428 .357 .5 FIDSTKS .55 .55 .467 .402 .331 .349
FINANCE .547 .547 .464 .398 .327 .345
DJI-13 .538 .538 .538 .384 .384 .384
DOWJONES .533 .5 .5 .466 .4 .366
==============================================================================================z
INDMATER .472 .416 .319 .263 .305 .333
SP500 .456 .424 .388 .352 .28 .302
REGBANKS .44 .52 .36 .36 .36 .48
JETS .428 .428 .428 .214 .214 .214
INFRA .393 .363 .303 .212 .242 .272
INDEXES .383 .329 .302 .286 .248 .286
TRANSP .368 .473 .315 .157 .157 .157
ETFS .363 .381 .236 .163 .181 .163
CHEM .347 .347 .26 .195 .195 .217
EDU .333 .333 .333 .166 .166 .166
NASD-100 .309 .257 .237 .206 .144 .164
=====
COMPUTER .3 .3 .4 .25 .1 .1
NIFTY .282 .239 .239 .173 .086 .152
MILITARY .269 .307 .23 .192 .153 .423
HACKERS .263 .263 .21 .21 .157 .21
SOFTWARE .25 .214 .214 .196 .178 .196
RUS-1000 .217 .227 .189 .156 .108 .136
GAMING .21 .21 .157 .157 .157 .157
REIT .207 .192 .215 .153 .069 .138
CHINA .2 .24 .24 .18 .18 .2
GOLD .195 .217 .173 .108 .108 .304
RETAIL .191 .212 .17 .127 .127 .127
AUTO .188 .207 .15 .132 .113 .113
HOSPITAL .187 .25 .25 .187 .187 .25
HOMEBLDG .166 .111 .055 .055 0 0
HIGHPRIC .16 .127 .109 .094 .065 .065
LOWPRICE .16 .162 .134 .101 .086 .109
GREEN .157 .105 .105 .105 .105 .105
ELECTRON .127 .127 .112 .082 .075 .12
BIOTECH .123 .134 .115 .107 .082 .098
SEMI .115 .126 .126 .052 .052 .094
=====
GUNS .076 .076 .076 .076 .076 .153
BONDFUND 0 .011 0 0 0 0
MARIJUAN 0 0 0 0 0 0
SOLAR 0 0 0 0 0 0
|
====================================================================================
February 2: 5:50 AM DJI +50 NASDAQ + 204 Data used for 2/1/2022
| A V-Bottom seems to be in place. Watch to
see how each of the leading recovery plays eats up the various points of resistance I have mentioned. What impresses me is how many bullish plays there are now. See the charts below. Clearly, the Fed has reassured many traders that they will not be abruptly raising rates. They may be misleading them, however. Watch the Closing Powers to be sure that the trend is now up again. Note how commodities and oil are rising. Clearly, traders here expect the FED not to be able to control inflation. But for now, we have lots of bullish advancers and the broadening patterns offer hope that the rally will last a while longer, with the DJI even making a new high, as shorts rush to cover. As mentioned previously, we can consider the operative Peerless signals to be a volitile and speculative traders' Buy based on the breaks in the Closing Power down-trends and the turn upwards by the Stochastic-K-Line above the Pct-D (20 days length), it having recovered from oversold status WITH the DJI not falling more than 10% below its peak. There are many past cases where the DJI holds up a lot longer than most stocks. So, we are not surprised by the DJI's leadership at this point, late in the market cycle. Short-covering rallies can be fierce. Use protective Buy stops with your shorts based on the down-trending Closing Power trends. There has been a sharp drop of Bearish MINCPs and new lows. Shorts are busy covering and with Biotechs bouncing up, our bearish choices are growing limited.. |
||
|
Charts - 2/1/2022 2022 PEERLESS DJI, Signals, Indicators Daily DJI Volume 10-DayUp/Down Vol Stoch-20 Pct of All Stocks above 65-dma Inverted Traders Index Cum. Inverted Traders Index DJI-IPA DJI-OBV NASDAQ S&P OEX NYSE COMPQX DJI-15 DJI-20 DJI-30 DIA QQQ SPY IWM TNA Short-Term Rates DOLLAR-UUP ALLSTOCKs recent 2006 vers-Peerless signals http://tigersoftware.com/NEWPEER/UPD80201.BMP MDY - http://www.tigersoftware.com/CHARTZ/MDY.GIF USO-CrudeOil DBO FAS GLD HD IBB JETS JNUG KOL NUGT OIH PALL RSX RETL SDS AGQ SLV SOXL TAN TECL TLT TMF TNA UGA (gasoline) USO (oil) and China YINN CHAU Commodities: CANE CORN DBC JJC, NIB CORN, CUT (paper) MOO, SOYB WEAT UUP (Dollar) LIT (Lithium) STOCKS: MRNA DIS GE PYPL GME ZOM XLE NRGU AAPL ADBE ALXN AMAT AMGN AMD AMZN AXP BA BABA BAC BIDU BLDP CAT CRM CVX CMG DE ENPH FB GILD GOOG GS HD IBM INTU JPM LRCX M MRK MSFT NEM NFLX NKE NKE NVDA PG PYPL REGN REV SO SQ QCOM QDEL TSLA TXN XOM V VRTX WFC WMT ZM Bullish MAXCPs http://tigersoftware.com/UPPER/2-01/BULLISH.htm Bearish MAXCPs http://tigersoftware.com/DOWNER/2-01/BEARISH.htm |
  |
 |
 |
 |
  |
 |
 |
 |
 |
 |
Table 1 QUICKSILVER on ETFS - 1/31//2022 Bullish = 2 - OIH CORN Bearish = 2 - RETL SOXL ETF CLOSE CHANGE PIVOT-PT 5-dma AROC CL-PWR CANDLE IP21 ITRS POWER INDEX ================================================================================================= DIA 353.94 2.86 341.46 159.2% ------- BLUE .102 ---- ---- --------------------------------------------------------------------------------------------- SPY 452.95 3.04 433.38 210.9% Bearish BLUE .062 -.021 .041 --------------------------------------------------------------------------------------------- QQQ 365.52 2.47 344.57 292.3% Bearish BLUE -.025 -.075 -.1 --------------------------------------------------------------------------------------------- MDY 484.93 4.89 467.81 129% Bearish BLUE .015 -.063 -.048 --------------------------------------------------------------------------------------------- IWM 203.36 2.12 195.97 115% Bearish BLUE -.041 -.119 -.16 --------------------------------------------------------------------------------------------- FAS 133.37 5.45 121.88 509.1% ------- BLUE .156 -.011 .145 --------------------------------------------------------------------------------------------- RETL 27.09 1.04 23.34 374.7% ------- BLUE .015 -.495 -.48 --------------------------------------------------------------------------------------------- SOXL 45.91 1.33 42.12 709.1% Bearish ---- -.009 -.31 -.319 --------------------------------------------------------------------------------------------- TECL 68.75 .42 57.25 1030.9% Bearish BLUE .043 -.152 -.109 --------------------------------------------------------------------------------------------- IBB 134.25 2.39 126.22 261.3% ------- BLUE .026 -.111 -.085 --------------------------------------------------------------------------------------------- GLD 168.23 .14 169.79 -128.7% ------- RED .044 -.018 .026 --------------------------------------------------------------------------------------------- OIH 235.16 9.33 230.42 125.5% Bullish BLUE .144 .226 .37 --------------------------------------------------------------------------------------------- CPER 27.04 .54 27.17 -26.1% ------- ---- -.04 .043 .003 --------------------------------------------------------------------------------------------- UUP 25.8 -.07 25.84 19.3% ------- ---- .144 .022 .166 --------------------------------------------------------------------------------------------- CORN 22.89 .28 22.57 108.7% Bullish BLUE .17 .085 .255 --------------------------------------------------------------------------------------------- WEAT 7.39 .08 7.6 -258.7% ------- ---- .163 -.06 .103 --------------------------------------------------------------------------------------------- YINN 9.2 .16 8.42 135.9% ------- BLUE .053 -.149 -.096 --------------------------------------------------------------------------------------------- RSX 24.24 .27 21.98 391.2% Bearish ---- .015 -.198 -.183 |
Table 2 Count of Stocks in Key Directories
20220201
-------------------------------
NEWHIGHS 120
NEWLOWS 171
MAXCP 41
MINCP 8
TTTNH 21
TTTNL 24
CPCROSSA 130
CPCROSSD 51
ACCUMVER 10
HIGHIP21 9
HIUPPCT 11
VHIP21 68
LOWACCUM 218
REDSELL 142
AUGSELS7 18
TRAPDOOR 7
|
Table 3 RANKING OF KEY DIRECTORIES BASED PCT.OF STOCKS ABOVE 65-DMA
2/1/22
Bullish = 13
Bearish = 35
---------------------------------------------------------------------------------------
Directory Current day-1 day-2 day-3 day-4 day-5
----------------------------------------------------------------------------------------
COAL 1 .833 1 1 1 .833
OILGAS .8 .714 .723 .695 .714 .704
COPPER .75 .5 .5 .75 .75 .75
BIGBANKS .714 .714 .571 .428 .428 .285
UTILITY .641 .717 .666 .615 .564 .589
INSURANC .64 .64 .48 .4 .48 .48 FOOD .612 .571 .551 .551 .693 .734 COMODITY .589 .487 .461 .512 .641 .692 SP-100 .588 .544 .488 .433 .444 .444 FIDSTKS .55 .467 .402 .331 .343 .378 FINANCE .547 .464 .398 .327 .339 .375 DJI-13 .538 .538 .384 .384 .384 .384 REGBANKS .52 .36 .36 .36 .48 .52 ================================================================================================== DOWJONES .5 .5 .466 .4 .366 .4 TRANSP .473 .315 .157 .157 .157 .157 BEVERAGE .428 .5 .428 .357 .5 .571 JETS .428 .428 .214 .214 .214 .214 SP500 .424 .388 .352 .28 .298 .33 INDMATER .416 .319 .263 .305 .333 .388 ETFS .381 .236 .163 .181 .181 .163 INFRA .363 .303 .212 .242 .272 .272 CHEM .347 .26 .195 .195 .217 .282 EDU .333 .333 .166 .166 .166 .166 INDEXES .329 .302 .286 .248 .275 .302 MILITARY .307 .23 .192 .153 .423 .461 COMPUTER .3 .4 .25 .1 .1 .05 HACKERS .263 .21 .21 .157 .21 .21 NASD-100 .257 .237 .206 .144 .164 .154 HOSPITAL .25 .25 .187 .187 .25 .25 CHINA .24 .24 .18 .18 .18 .16 NIFTY .239 .239 .173 .086 .152 .13 RUS-1000 .227 .189 .156 .108 .136 .156 GOLD .217 .173 .108 .108 .304 .478 SOFTWARE .214 .214 .196 .178 .196 .196 RETAIL .212 .17 .127 .127 .127 .148 GAMING .21 .157 .157 .157 .157 .157 AUTO .207 .15 .132 .113 .113 .113 REIT .192 .207 .161 .069 .13 .153 LOWPRICE .165 .132 .099 .086 .111 .119 BIOTECH .134 .115 .107 .082 .098 .093 ELECTRON .127 .112 .082 .075 .12 .082 HIGHPRIC .127 .109 .094 .065 .065 .072 SEMI .126 .126 .052 .052 .094 .073 HOMEBLDG .111 .055 .055 0 0 .111 GREEN .105 .105 .105 .105 .105 .105 GUNS .076 .076 .076 .076 .153 .153 BONDFUND .011 0 0 0 0 0 MARIJUAN 0 0 0 0 0 0 SOLAR 0 0 0 0 0 0 |
====================================================================================
====================================================================================
February 1: 6:00 AM DJI +11 NASDAQ + 19 Data used for 1/31/2022
On Monday, FED officials assured investors they do not believe their planned rate increases to start in March -. six weeks away - will hurt the economy. Strange - how else do they fight inflation except by slowing the economy down and causing more unemployment? They even floated a trial ballon of only a 1/4% rate hike at that point, thereby leaving the key lending rates well below 2%. This dovishness within the much more publicized hawkishness is what I contend has led to the rally first by the DJI and now the big tech stocks. Knowing that the FED was not serious about rapidly raising rates to fight inflation gave traders on the inside a big edge. It is they who bought unusually aggressively. Their buying has now caused our Closing Powers to break its downtrends for the key general market ETFs we follow. This predicts a continuation of the rally, possibly even up to new highs for the DJI. (Recall how often the DJI-30 is the last index historically to top out.) Even QQQ could go to new highs if the FED continues to be maximally responsive to Wall Street and the needs to keep the appearance of a bull market alive. Note QQQ's megaphone pattern. Its resistance line is rising and its support line is falling. All this depends on the FED continuing its sub rosa dovishness within an outward hawkish stance. I don't think Russia is unwise enough to go to war over the Donbass region in the Ukraine. So, I think the FED is the real force here. We don't know the Jobs numbers to come out on Friday or the next CPI numbers showing inflation. And it's also very hard to measure how much overhead resistance lies overhead for the rallying ETFs. Nor do we know where except at the 65-dma will the resistance be most intense. But we do know that if we had known that the FED would quickly "cave in" to the forces on Wall Street that do not want a sell-off, we would have trusted the bullishness of the huge reversal up by the DJI from its 10%-level. We did guess that Fed "doves" would continue their behind-the-scenes campaign to resist anything more than a small rate hike in March, not in February. Guessing how FED officials might sabotage an aggressive anti-Inflation stance, we would probably should have left QE-Infinity buys in place. Remember, you can never be too cynical when watching Wall Street and the FED. So, I would expect more of a rally, at least, until we see some new Professional bearishness and big red candle-sticks. My preference for buying would be MCD in the DJI (suitably defensive and abiding by its uptrending rising regression channel), NVDA because it found support at its key riging 200-day ma and QQQ because of its Closing Power downtrend- break and how its broadening top could allow it to break through the resistance overhead. |
||
|
Charts - 1/31/2022 2022 PEERLESS DJI, Signals, Indicators Daily DJI Volume 10-DayUp/Down Vol Stoch-20 Pct of All Stocks above 65-dma Inverted Traders Index Cum. Inverted Traders Index DJI-IPA DJI-OBV NASDAQ S&P OEX NYSE COMPQX DJI-15 DJI-20 DJI-30 DIA QQQ SPY IWM TNA Short-Term Rates DOLLAR-UUP ALLSTOCKs recent 2006 vers-Peerless signals http://tigersoftware.com/NEWPEER/UPD80128.BMP MDY - http://www.tigersoftware.com/CHARTZ/MDY.GIF USO-CrudeOil DBO FAS GLD HD IBB JETS JNUG KOL NUGT OIH PALL RSX RETL SDS AGQ SLV SOXL TAN TECL TLT TMF TNA UGA (gasoline) USO (oil) and China YINN CHAU Commodities: CANE CORN DBC JJC, NIB CORN, CUT (paper) MOO, SOYB WEAT UUP (Dollar) LIT (Lithium) STOCKS: MRNA DIS GE PYPL GME ZOM XLE NRGU AAPL ADBE ALXN AMAT AMGN AMD AMZN AXP BA BABA BAC BIDU BLDP CAT CRM CVX CMG DE ENPH FB GILD GOOG GS HD IBM INTU JPM LRCX M MRK MSFT NEM NFLX NKE NKE NVDA PG PYPL REGN REV SO SQ QCOM QDEL TSLA TXN XOM V VRTX WFC WMT ZM Bullish MAXCPs http://tigersoftware.com/UPPER/1-31/BULLISH.htm Bearish MAXCPs http://tigersoftware.com/DOWNER/1-31/BEARISH.htm |
 |
 |
 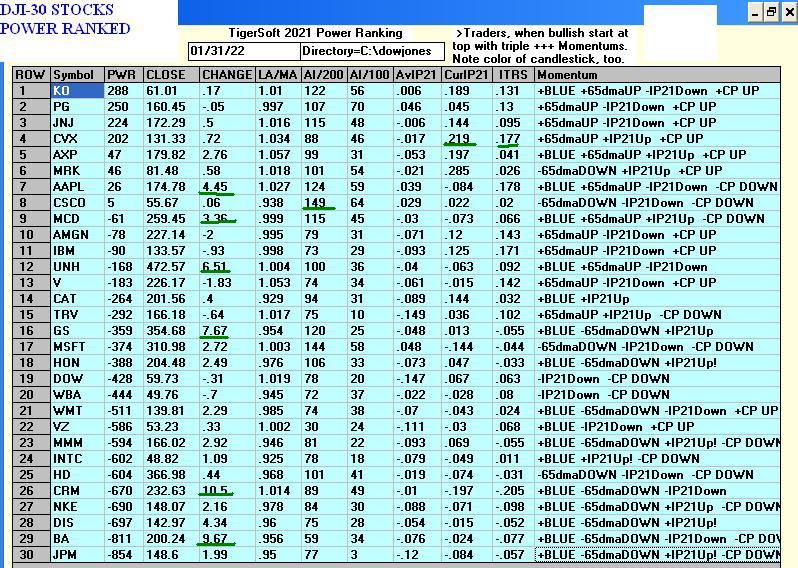 |
 |
  |
 |
 |
 |
Table 1 QUICKSILVER on ETFS - 1/31//2022 Bullish = 1 - OIH Bearish = 1 - RETL ETF CLOSE CHANGE PIVOT-PT 5-dma AROC CL-PWR CANDLE IP21 ITRS POWER INDEX ================================================================================================= DIA 351.08 3.97 342.96 105.9% Bearish BLUE .065 --- ------ --------------------------------------------------------------------------------------------- SPY 449.91 7.96 434.47 115.4% Bearish BLUE .008 -.015 -.007 --------------------------------------------------------------------------------------------- QQQ 363.05 11.25 345.11 140.4% Bearish BLUE -.069 -.063 -.132 --------------------------------------------------------------------------------------------- MDY 480.04 10.26 472.8 -13.6% Bearish BLUE -.02 -.064 -.084 --------------------------------------------------------------------------------------------- IWM 201.24 5.99 198.84 -7.4% Bearish BLUE -.104 -.122 -.226 --------------------------------------------------------------------------------------------- FAS 127.92 3.86 120.87 298% Bearish BLUE .127 -.054 .073 --------------------------------------------------------------------------------------------- RETL 26.05 2.69 25.28 -99% ------- BLUE -.041 -.477 -.518 --- --------------------------------------------------------------------------------------------- SOXL 44.58 6.17 40.19 -107.4% Bearish BLUE -.075 -.285 -.36 --------------------------------------------------------------------------------------------- TECL 68.33 4.94 56.32 666.7% Bearish BLUE -.016 -.124 -.14 --------------------------------------------------------------------------------------------- IBB 131.86 3.89 127.59 78.7% ------- BLUE -.053 -.12 -.173 --------------------------------------------------------------------------------------------- GLD 168.09 .99 172.58 -116% ------- BLUE .084 -.012 .072 --------------------------------------------------------------------------------------------- OIL 15.12 .07 14.91 120.3% ------- ---- -.047 .075 .028 --------------------------------------------------------------------------------------------- OIH 225.83 -1.52 229.44 182.6% Bullish BLUE .112 .159 .271 +++ --------------------------------------------------------------------------------------------- CPER 26.5 .1 27.18 -111.3% ------- BLUE -.044 .051 .007 --------------------------------------------------------------------------------------------- UUP 25.87 -.18 25.7 34.8% Bullish RED .204 .031 .235 --------------------------------------------------------------------------------------------- CORN 22.61 -.14 22.4 57.8% Bullish RED .13 .076 .206 --------------------------------------------------------------------------------------------- WEAT 7.31 -.26 7.78 -230% ------- RED .159 -.061 .098 --------------------------------------------------------------------------------------------- YINN 9.04 1.14 8.97 59.2% ------- BLUE 0 -.207 -.207 --------------------------------------------------------------------------------------------- RSX 23.97 .55 22.44 437.8% Bearish BLUE -.028 -.21 -.238 |
Table 2 Count of Stocks in Key Directories
20220131
-------------------------------
NEWHIGHS 60
NEWLOWS 340
MAXCP 15
MINCP 65
TTTNH 16
TTTNL 167
CPCROSSA 113
CPCROSSD 12
ACCUMVER 3
HIGHIP21 7
HIUPPCT 15
VHIP21 68
LOWACCUM 213
REDSELL 150
AUGSELS7 20
TRAPDOOR 7
|
Table 3 RANKING OF KEY DIRECTORIES BASED PCT.OF STOCKS ABOVE 65-DMA
1/31/22
Bullish = 8
Bearish = 38
---------------------------------------------------------------------------------------
Directory Current day-1 day-2 day-3 day-4 day-5
----------------------------------------------------------------------------------------
COAL .833 1 1 1 .833 .833
UTILITY .717 .666 .615 .564 .589 .564
BIGBANKS .714 .571 .428 .428 .285 .285
OILGAS .714 .723 .695 .714 .704 .638
INSURANC .64 .48 .4 .48 .48 .48
FOOD .571 .551 .551 .693 .734 .714 SP-100 .544 .488 .433 .444 .466 .444 DJI-13 .538 .384 .384 .384 .384 .307 ================================================================================================= BEVERAGE .5 .428 .357 .5 .571 .571 COPPER .5 .5 .75 .75 .875 .875 DOWJONES .5 .466 .4 .366 .4 .333 ================================================================================================= COMODITY .487 .461 .512 .641 .692 .666 FIDSTKS .467 .402 .331 .343 .384 .378 FINANCE .464 .398 .327 .339 .38 .375 JETS .428 .214 .214 .214 .214 .214 COMPUTER .4 .25 .1 .1 .05 .15 SP500 .388 .352 .28 .298 .332 .336 REGBANKS .36 .36 .36 .48 .52 .6 EDU .333 .166 .166 .166 .166 .166 INDMATER .319 .263 .305 .333 .388 .402 TRANSP .315 .157 .157 .157 .157 .21 INFRA .303 .212 .242 .272 .272 .272 INDEXES .302 .286 .248 .275 .297 .286 CHEM .26 .195 .195 .217 .282 .26 HOSPITAL .25 .187 .187 .25 .25 .25 CHINA .24 .18 .18 .18 .16 .18 NIFTY .239 .173 .086 .152 .13 .173 NASD-100 .237 .206 .144 .164 .154 .195 ETFS .236 .163 .181 .181 .181 .163 MILITARY .23 .192 .153 .423 .423 .461 SOFTWARE .214 .196 .178 .196 .196 .196 HACKERS .21 .21 .157 .21 .21 .21 REIT .207 .153 .076 .13 .153 .138 RUS-1000 .189 .156 .108 .136 .154 .146 GOLD .173 .108 .108 .304 .456 .391 RETAIL .17 .127 .127 .127 .148 .17 GAMING .157 .157 .157 .157 .157 .21 AUTO .15 .132 .113 .113 .113 .188 LOWPRICE .134 .096 .083 .111 .119 .096 SEMI .126 .052 .052 .094 .073 .126 BIOTECH .115 .107 .082 .098 .098 .098 ELECTRON .112 .082 .075 .12 .082 .097 HIGHPRIC .109 .094 .065 .065 .072 .087 GREEN .105 .105 .105 .105 .105 .157 GUNS .076 .076 .076 .153 .153 .076 HOMEBLDG .055 .055 0 0 .111 .111 BONDFUND 0 0 0 0 0 0 MARIJUAN 0 0 0 0 0 0 SOLAR 0 0 0 0 0 0 |
===================================================================================
===================================================================================
January 31: 5:50 AM DJI -
132 NASDAQ + 30 Data used for
1/28/2022
| Friday's 550+ point DJI rally took place when a
lot of traders in the East had left work fearing the coming blizzard. This was a perfect opportunity for the annonymous computer-trading "wranglers" sponsored by the FED to drive up stock prices in the DJIA-30 (not unlike cattle) to make the general market seem a lot stronger than it really is, especially diverting attention away from the fact that there were a whopping 1694 new lows on the NYSE and NASDAQ. Thus, the fact that the DJI is down 200 points at the opening is not a surprise. Our studies show that the DJI often finds support almost exactly 10% down from its high, as it did this time. But on its rally it then meets resistance and must re-trace a good portion of its first bounce. That resistance can come in at an earlier point of breakown, when 50% of the DJI's decline is recovered or at the DJI's 200-day ma which is where the current rally seems to have peaked. Interestingly, the SPY also declined 10% from its high but now is back to its 200-day ma. With the 65-dma falling, a decline this morning is again developing. We have seen a number of turn-arounds on Tuesday. But seasonally (taking the cases since 1966 of the second year in the 4-year Presidential cycle after January 30th) we discover that the next five days rallies only 35.7% of the time. but if we go out two weeks, the DJI rises 64.3% of the time. So a successful re-test of the recent lows may give us a good opportunity to buy. The lagging A/D line and weak techs will make the next rally narrow most likely. So, the number of good upside play may remain quite limited. We will concentrate on defensive stocks still in their rising regression channels (See most of the linked charts tonight) and commodities. . |
||
|
Charts - 1/28/2022 2022 PEERLESS DJI, Signals, Indicators Daily DJI Volume 10-DayUp/Down Vol Stoch-20 Pct of All Stocks above 65-dma Inverted Traders Index Cum. Inverted Traders Index DJI-IPA DJI-OBV NASDAQ S&P OEX NYSE COMPQX DJI-15 DJI-20 DJI-30 DIA QQQ SPY IWM TNA Short-Term Rates DOLLAR-UUP ALLSTOCKs recent 2006 vers-Peerless signals http://tigersoftware.com/NEWPEER/UPD80128.BMP MDY - http://www.tigersoftware.com/CHARTZ/MDY.GIF USO-CrudeOil DBO FAS GLD HD IBB JETS JNUG KOL NUGT OIH PALL RSX RETL SDS AGQ SLV SOXL TAN TECL TLT TMF TNA UGA (gasoline) USO (oil) and China YINN CHAU Commodities: CANE CORN DBC JJC, NIB CORN, CUT (paper) MOO, SOYB WEAT UUP (Dollar) LIT (Lithium) STOCKS: MRNA DIS GE PYPL GME ZOM XLE NRGU AAPL ADBE ALXN AMAT AMGN AMD AMZN AXP BA BABA BAC BIDU BLDP CAT CRM CVX CMG DE ENPH FB GILD GOOG GS HD IBM INTU JPM LRCX M MRK MSFT NEM NFLX NKE NKE NVDA PG PYPL REGN REV SO SQ QCOM QDEL TSLA TXN XOM V VRTX WFC WMT ZM Bullish MAXCPs http://tigersoftware.com/UPPER/1-28/BULLISH.htm Bearish MAXCPs http://tigersoftware.com/DOWNER/1-28/BEARISH.htm |
 |
 |
 |
 |
 |
 |
 |
Table 1 QUICKSILVER on ETFS - 1/28//2022 Bullish = 1 - Dollar Bearish = 5 - IWM, RETL, SOXL, TECL, YINN ETF CLOSE CHANGE PIVOT-PT 5-dma AROC CL-PWR CANDLE IP21 ITRS POWER INDEX ================================================================================================= DIA 347.11 5.56 343.81 69.5% Bearish BLUE .019 ----- ------ --------------------------------------------------------------------------------------------- SPY 441.95 10.71 439.84 45.6% Bearish BLUE -.065 -.017 -.082 --------------------------------------------------------------------------------------------- QQQ 351.8 10.7 353.3 1.6% Bearish BLUE -.126 -.074 -.2 --------------------------------------------------------------------------------------------- MDY 469.78 9.17 481.32 -26.8% Bearish BLUE -.086 -.074 -.16 --------------------------------------------------------------------------------------------- IWM 195.25 3.73 201.53 -44.2% Bearish BLUE -.18 -.142 -.322 --------------------------------------------------------------------------------------------- FAS 124.06 4.97 120.69 188.1% Bearish BLUE .073 -.093 -.02 --------------------------------------------------------------------------------------------- RETL 23.36 .63 26.53 166.1% ------- BLUE -.083 -.543 -.626 --------------------------------------------------------------------------------------------- SOXL 38.41 2.05 45.45 -637.5% Bearish BLUE -.153 -.378 -.531 --------------------------------------------------------------------------------------------- TECL 63.39 7.24 60.5 329.5% Bearish BLUE -.088 -.176 -.264 --------------------------------------------------------------------------------------------- IBB 127.97 4.29 129.86 -27.9% ------- BLUE -.108 -.128 -.236 --------------------------------------------------------------------------------------------- GLD 167.1 -.5 172.03 -116.9% ------- BLUE .077 .007 .084 --------------------------------------------------------------------------------------------- OIL 15.05 -.01 14.76 50.2% ------- RED -.111 .061 -.05 --------------------------------------------------------------------------------------------- OIH 227.35 1.03 217.57 310.8% Bullish BLUE .089 .141 .23 --------------------------------------------------------------------------------------------- CPER 26.4 -.52 27.1 -193.3% Bearish RED -.119 .035 -.084 --------------------------------------------------------------------------------------------- UUP 26.05 -.01 25.69 85.3% Bullish ---- .255 .053 .308 --------------------------------------------------------------------------------------------- CORN 22.75 .34 22.35 109.4% Bullish BLUE .128 .107 .235 --------------------------------------------------------------------------------------------- WEAT 7.57 .14 7.66 85.7% Bullish BLUE .21 .007 .217 --------------------------------------------------------------------------------------------- YINN 7.9 -.07 8.94 -841.5% Bearish BLUE -.014 -.309 -.323 --------------------------------------------------------------------------------------------- RSX 23.42 .19 21.99 91% Bearish ---- -.035 -.204 -.239 |
Table 2 Count of Stocks in Key Directories
20220128
-------------------------------
NEWHIGHS 30
NEWLOWS 1694
MAXCP 15
MINCP 66
TTTNH 16
TTTNL 167
CPCROSSA 113
CPCROSSD 12
ACCUMVER 3
HIGHIP21 7
HIUPPCT 10
VHIP21 68
LOWACCUM 213
REDSELL 150
AUGSELS7 20
TRAPDOOR 7
|
Table 3 RANKING OF KEY DIRECTORIES BASED PCT.OF STOCKS ABOVE 65-DMA
1/28/22
Bullish = 5
Bearish = 43
---------------------------------------------------------------------------------------
Directory Current day-1 day-2 day-3 day-4 day-5
----------------------------------------------------------------------------------------
COAL 1 1 1 .833 .833 .833
OILGAS .723 .695 .714 .704 .638 .628
UTILITY .666 .615 .564 .589 .564 .615
BIGBANKS .571 .428 .428 .285 .285 .285
FOOD .551 .551 .693 .734 .714 .734
===============================================================================================
COPPER .5 .75 .75 .875 .875 .875
===============================================================================================
SP-100 .488 .433 .444 .466 .444 .433
INSURANC .48 .4 .48 .48 .48 .36
DOWJONES .466 .4 .366 .4 .333 .366
COMODITY .461 .512 .641 .692 .666 .692
BEVERAGE .428 .357 .5 .571 .571 .642
FIDSTKS .402 .331 .343 .384 .372 .355
FINANCE .398 .327 .339 .38 .369 .351
DJI-13 .384 .384 .384 .384 .307 .307
REGBANKS .36 .36 .48 .52 .6 .44
SP500 .352 .28 .298 .332 .334 .328
INDEXES .286 .248 .275 .297 .286 .318
INDMATER .263 .305 .333 .388 .416 .361
COMPUTER .25 .1 .1 .05 .15 .15
JETS .214 .214 .214 .214 .214 .214
INFRA .212 .242 .272 .272 .272 .303
HACKERS .21 .157 .21 .21 .21 .21
NASD-100 .206 .144 .164 .154 .195 .206
SOFTWARE .196 .178 .196 .196 .196 .214
CHEM .195 .195 .217 .282 .26 .195
MILITARY .192 .153 .423 .423 .461 .423
HOSPITAL .187 .187 .25 .25 .25 .187
CHINA .18 .18 .18 .16 .2 .22
NIFTY .173 .086 .152 .13 .173 .195
EDU .166 .166 .166 .166 .166 .166
ETFS .163 .181 .181 .181 .181 .236
GAMING .157 .157 .157 .157 .21 .21
TRANSP .157 .157 .157 .157 .21 .21
RUS-1000 .156 .108 .136 .154 .144 .144
REIT .153 .069 .138 .153 .138 .13
AUTO .132 .113 .113 .113 .188 .169
RETAIL .127 .127 .127 .148 .17 .106
GOLD .108 .108 .304 .456 .391 .413
BIOTECH .107 .082 .098 .098 .098 .087
GREEN .105 .105 .105 .105 .157 .157
LOWPRICE .099 .081 .109 .119 .096 .119
HIGHPRIC .094 .065 .065 .072 .087 .087
ELECTRON .082 .075 .12 .082 .097 .097
GUNS .076 .076 .153 .153 .076 .076
HOMEBLDG .055 0 0 .111 .111 .055
SEMI .052 .052 .094 .073 .126 .094
BONDFUND 0 0 0 0 0 0
MARIJUAN 0 0 0 0 0 0
SOLAR 0 0 0 0 0 0
|
===================================================================================
January 28: 6:00 AM Futures - DJI -300
NASDAQ -100 Data used for 1/27/2022
| They key ETF's Closing Powers not only did not break their
downtrends to indicate a recovery, they broke down to new lows and their IP21s (Accum. Indexes) joined them at negative new lows. In the context of an over-speculated bubble market, rising interest rates and only oil stocks acting now as leaders, this is a dangerous market. The disparity or contradiction between the DJI-30 and most stocks is enormous. This is very often the technical basis for a bear market. And when the divergences reach the degree that they have now, a bear market even in the blue chips occurs. Gold and silver are no longer havens. Eventually the blue-chips share the fate of the "glamour" stocks, the tech leaders (SOXL, QQQ and TECL). And if oil breaks its price uptrend and the Accumulation Index for UCO should turn negative, what's left to hold the market up? The DJI-30 is late or last to top out in many market cycles. The A/D Line can go down for months, as in 1929 or 1972-1973 or 1999-2000, without the DJIA collapsing. But eventually, it cracks its major support and gives way. First, it retreats to its 10%-13.5% support, then to its 19%-20% down-support and then is falls through that last support and it, too, is hit by panic. That's where we are now. Watch to see if the DJI can still be shored up by the market makers who have that responsibility. The FED now has little lee-way. Short and stay short in the very weakest groups, Biotechs, Chinese stocks, IWM, low-price stocks and Bonds. Look for their representatives in the Bearish MINCPs. Holding long positions now is very risky. At the very least be hedged with shorts. |
||
|
Charts - 1/27/2022 2022 PEERLESS DJI, Signals, Indicators Daily DJI Volume 10-DayUp/Down Vol Stoch-20 Pct of All Stocks above 65-dma Inverted Traders Index Cum. Inverted Traders Index DJI-IPA DJI-OBV NASDAQ S&P OEX NYSE COMPQX DJI-15 DJI-20 DJI-30 DIA QQQ SPY IWM TNA Short-Term Rates DOLLAR-UUP ALLSTOCKs recent 2006 vers-Peerless signals http://tigersoftware.com/NEWPEER/UPD80127.BMP MDY - http://www.tigersoftware.com/CHARTZ/MDY.GIF USO-CrudeOil DBO FAS GLD HD IBB JETS JNUG KOL NUGT OIH PALL RSX RETL SDS AGQ SLV SOXL TAN TECL TLT TMF TNA UGA (gasoline) USO (oil) and China YINN CHAU Commodities: CANE CORN DBC JJC, NIB CORN, CUT (paper) MOO, SOYB WEAT UUP (Dollar) LIT (Lithium) STOCKS: MRNA DIS GE PYPL GME ZOM XLE NRGU AAPL ADBE ALXN AMAT AMGN AMD AMZN AXP BA BABA BAC BIDU BLDP CAT CRM CVX CMG DE ENPH FB GILD GOOG GS HD IBM INTU JPM LRCX M MRK MSFT NEM NFLX NKE NKE NVDA PG PYPL REGN REV SO SQ QCOM QDEL TSLA TXN XOM V VRTX WFC WMT ZM Bullish MAXCPs http://tigersoftware.com/UPPER/1-27/BULLISH.htm Bearish MAXCPs http://tigersoftware.com/DOWNER/1-27/BEARISH.htm |
 |
 |
 |
 |
 |
 |
 |
 |
 |
 |
Table 1 QUICKSILVER on ETFS - 1/26//2022 Bullish = 2 - Dollar Bearish = 7 - IWM, RETL, SOXL. TECL. IBB, YINN, Russia ETF CLOSE CHANGE PIVOT-PT 5-dma AROC CL-PWR CANDLE IP21 ITRS POWER INDEX ================================================================================================== DIA 341.55 .09 342.35 -84.1% Bearish RED -.038 --- ----- --------------------------------------------------------------------------------------------- SPY 431.24 -2.14 437.98 -176.9% Bearish RED -.133 -.023 -.156 --------------------------------------------------------------------------------------------- QQQ 341.1 -3.47 351.69 -293.5% Bearish RED -.186 -.081 -.267 --------------------------------------------------------------------------------------------- MDY 460.61 -7.2 472.3 -210.4% Bearish RED -.124 -.077 -.201 --------------------------------------------------------------------------------------------- IWM 191.52 -4.45 196.99 -232.1% Bearish RED -.249 -.143 -.392 --------------------------------------------------------------------------------------------- FAS 119.09 -2.79 119.53 -344% Bearish RED .022 -.116 -.094 --------------------------------------------------------------------------------------------- RETL 22.73 -.61 22.56 -177.2% ------- RED -.104 -.527 -.631 --------------------------------------------------------------------------------------------- SOXL 36.36 -5.76 43.71 -1107.1% Bearish RED -.236 -.37 -.606 --------------------------------------------------------------------------------------------- TECL 56.15 -1.1 59.57 -602% Bearish RED -.17 -.23 -.4 --------------------------------------------------------------------------------------------- IBB 123.68 -2.54 128.68 -271% Bearish RED -.16 -.138 -.298 --------------------------------------------------------------------------------------------- GLD 167.6 -2.19 171.09 -118.1% ------- RED .087 .017 .104 --------------------------------------------------------------------------------------------- OIH 226.32 -4.1 213.46 174.6% Bullish RED .064 .162 .226 --------------------------------------------------------------------------------------------- CPER 26.92 -.25 27.45 -120.9% ------- RED -.127 .054 -.073 --------------------------------------------------------------------------------------------- UUP 26.06 .22 25.61 73.9% ------- ---- .237 .071 .308 --------------------------------------------------------------------------------------------- CORN 22.41 -.16 22.26 78.4% Bullish RED .1 .098 .198 --------------------------------------------------------------------------------------------- WEAT 7.43 -.17 7.44 -59.2% Bullish RED .203 -.017 .186 --------------------------------------------------------------------------------------------- YINN 7.97 -.45 9.37 -1079.1% ------- RED -.046 -.268 -.314 --------------------------------------------------------------------------------------------- RSX 23.23 1.25 23.01 -70.8% Bearish RED -.076 -.204 -.28 |
Table 2 Count of Stocks in Key Directories
20220127
-------------------------------
NEWHIGHS 58
NEWLOWS 1372 bearish
MAXCP 10
MINCP 450 approx.
TTTNH 27
TTTNL 334
CPCROSSA 19
CPCROSSD 90
ACCUMVER 6
HIGHIP21 4
HIUPPCT 5
VHIP21 69
LOWACCUM 217
REDSELL 142
AUGSELS7 18
TRAPDOOR 29
|
Table 3 RANKING OF KEY DIRECTORIES BASED PCT.OF STOCKS ABOVE 65-DMA
1/27/22
Bullish = 6 Bearish = 43 --------------------------------------------------------------------------------------- Directory Current day-1 day-2 day-3 day-4 day-5 ---------------------------------------------------------------------------------------- COAL 1 1 .833 .833 .833 1 COPPER .75 .75 .875 .875 .875 .875 OILGAS .695 .714 .704 .638 .638 .742 UTILITY .615 .564 .589 .564 .641 .641 FOOD .551 .693 .734 .714 .734 .755 COMODITY .512 .641 .692 .666 .692 .717 ============================================================================================== SP-100 .433 .444 .466 .444 .444 .511 BIGBANKS .428 .428 .285 .285 .285 .285 DOWJONES .4 .366 .4 .333 .366 .5 INSURANC .4 .48 .48 .48 .32 .56 DJI-13 .384 .384 .384 .307 .307 .461 REGBANKS .36 .48 .52 .6 .44 .48 BEVERAGE .357 .5 .571 .571 .642 .571 FIDSTKS .331 .343 .384 .372 .36 .449 FINANCE .327 .339 .38 .369 .357 .446 INDMATER .305 .333 .388 .416 .361 .527 SP500 .28 .298 .332 .334 .33 .384 INDEXES .248 .275 .297 .286 .318 .356 INFRA .242 .272 .272 .272 .272 .303 JETS .214 .214 .214 .214 .214 .428 CHEM .195 .217 .282 .26 .217 .326 HOSPITAL .187 .25 .25 .25 .312 .312 ETFS .181 .181 .181 .181 .254 .363 CHINA .18 .18 .16 .2 .2 .32 SOFTWARE .178 .196 .196 .196 .214 .214 EDU .166 .166 .166 .166 .166 .166 GAMING .157 .157 .157 .21 .21 .21 HACKERS .157 .21 .21 .21 .21 .21 TRANSP .157 .157 .157 .21 .21 .315 MILITARY .153 .423 .423 .461 .384 .538 NASD-100 .144 .164 .154 .195 .216 .257 RETAIL .127 .127 .148 .17 .106 .106 AUTO .113 .113 .113 .188 .188 .188 GOLD .108 .304 .456 .391 .413 .521 RUS-1000 .108 .136 .154 .144 .144 .189 GREEN .105 .105 .105 .157 .157 .105 COMPUTER .1 .1 .05 .15 .2 .35 NIFTY .086 .152 .13 .173 .195 .282 LOWPRICE .083 .106 .117 .096 .122 .15 BIOTECH .082 .098 .098 .098 .09 .101 GUNS .076 .153 .153 .076 .076 .076 ELECTRON .075 .12 .082 .097 .097 .127 REIT .069 .13 .161 .138 .13 .176 HIGHPRIC .065 .065 .072 .087 .087 .116 SEMI .052 .094 .073 .126 .094 .147 BONDFUND 0 0 0 0 0 .011 HOMEBLDG 0 0 .111 .111 .055 .055 MARIJUAN 0 0 0 0 0 0 SOLAR 0 0 0 0 0 0 |
==================================================================================
==================================================================================
January 27: 6:00 AM Futures - DJI +87 NASDAQ +101
Data used for 1/26/2022
| Watch to see if the key Closing Powers break their
downtrends. The FED said next month that they will begin to raise rates. They could have begun this month, but Chairman Powell chose to wait. The medicine of low rates will feed the market awhile longer. The 10-year Bonds' rate hit almost 1.9% today. That is still very low historically. As if to show they were not ready to tighten, short term rates bullishly fell again. The trick here I believe is to understand that the FED is most interested in the big indexes, the DJI, SPY and QQQ. So, if their Closing Powers break their downtrends, these will go back up to a level achieving a 50% recovery of what they have just lost. That will bring somewhat more inflation. Oil stocks should be good performers in here. But Bonds and Biotechs will remain very weak. With our short sales, cover them if they break their Closing Power trends or they rise more than 10% on a closing basis above their lowest closings. The rally today before the opening reverses earlier weakness this morning... It will be important that the rally this morning not give way to another round of selling like we saw yesterday. 600-800 plus intra-day point swings are becoming something to be expected. Opinions about where the market are very widely different now and professionals and market-makers are taking advantage of this. The best way to trade in this environment is to be long the strongest and short the weakest. Only day traders should play the leveraged ETFs in my opinion at this stage. |
||
|
Charts - 1/26/2022 2022 PEERLESS DJI, Signals, Indicators Daily DJI Volume 10-DayUp/Down Vol Stoch-20 Pct of All Stocks above 65-dma Inverted Traders Index Cum. Inverted Traders Index DJI-IPA DJI-OBV NASDAQ S&P OEX NYSE COMPQX DJI-15 DJI-20 DJI-30 DIA QQQ SPY IWM TNA Short-Term Rates DOLLAR-UUP ALLSTOCKs recent 2006 vers-Peerless signals http://tigersoftware.com/NEWPEER/UPD80126.BMP MDY - http://www.tigersoftware.com/CHARTZ/MDY.GIF USO-CrudeOil DBO FAS GLD HD IBB JETS JNUG KOL NUGT OIH PALL RSX RETL SDS AGQ SLV SOXL TAN TECL TLT TMF TNA UGA (gasoline) USO (oil) and China YINN CHAU Commodities: CANE CORN DBC JJC, NIB CORN, CUT (paper) MOO, SOYB WEAT UUP (Dollar) LIT (Lithium) STOCKS: MRNA DIS GE PYPL GME ZOM XLE NRGU AAPL ADBE ALXN AMAT AMGN AMD AMZN AXP BA BABA BAC BIDU BLDP CAT CRM CVX CMG DE ENPH FB GILD GOOG GS HD IBM INTU JPM LRCX M MRK MSFT NEM NFLX NKE NKE NVDA PG PYPL REGN REV SO SQ QCOM QDEL TSLA TXN XOM V VRTX WFC WMT ZM Bullish MAXCPs http://tigersoftware.com/UPPER/1-26/BULLISH.htm Bearish MAXCPs http://tigersoftware.com/DOWNER/1-26/BEARISH.htm |
 |
 |
 |
 |
 |
 |
 |
 |
 |
 |
 |
| Tables |
Table 1 QUICKSILVER on ETFS - 1/26//2022 Bullish = 2 - Dollar Wheat Bearish = 4 - IWM, RETL, SOXL. TECL. IBB, YINN, Russia ETF CLOSE CHANGE PIVOT-PT 5-dma AROC CL-PWR CANDLE IP21 ITRS POWER INDEX ================================================================================================== DIA 341.46 -1.5 347.33 -128.7% Bearish RED -.001 ---- ---- --------------------------------------------------------------------------------------------- SPY 433.38 -1.09 446.75 -207.7% Bearish RED -.099 -.018 -.117 --------------------------------------------------------------------------------------------- QQQ 344.57 -.54 361.72 -308% Bearish RED -.158 -.072 -.23 --------------------------------------------------------------------------------------------- MDY 467.81 -4.99 480.6 -223.7% Bearish RED -.089 -.061 -.15 --------------------------------------------------------------------------------------------- IWM 195.97 -2.87 200.75 -211.5% Bearish RED -.225 -.127 -.352 --------------------------------------------------------------------------------------------- FAS 121.88 1.01 127.49 -336.1% Bearish RED .033 -.097 -.064 --------------------------------------------------------------------------------------------- RETL 23.34 -1.94 23.59 -593.6% ------- RED -.105 -.51 -.615 --------------------------------------------------------------------------------------------- SOXL 42.12 1.93 45.99 -961.7% Bearish RED -.185 -.28 -.465 --------------------------------------------------------------------------------------------- TECL 57.25 .93 63.3 -710.8% Bearish RED -.153 -.218 -.371 --------------------------------------------------------------------------------------------- IBB 126.22 -1.37 130.65 -216.2% Bearish RED -.132 -.126 -.258 --------------------------------------------------------------------------------------------- GLD 169.79 -2.79 171.65 -66.6% ------- RED .125 .028 .153 --------------------------------------------------------------------------------------------- OIL 15.02 .11 14.86 43.7% Bullish ---- -.082 .073 -.009 --------------------------------------------------------------------------------------------- OIH 230.42 .98 218.57 203.8% Bullish RED .09 .171 .261 --------------------------------------------------------------------------------------------- CPER 27.17 -.01 27.58 14.7% ------- RED -.123 .054 -.069 --------------------------------------------------------------------------------------------- UUP 25.84 .14 25.68 46.8% Bullish BLUE .192 .068 .26 --------------------------------------------------------------------------------------------- CORN 22.57 .17 22.06 85.4% Bullish BLUE .108 .103 .211 --------------------------------------------------------------------------------------------- WEAT 7.6 -.18 7.52 6.6% Bullish RED .22 .012 .232 --------------------------------------------------------------------------------------------- YINN 8.42 -.55 9.94 -377.6% ------- RED -.027 -.243 -.27 --------------------------------------------------------------------------------------------- RSX 21.98 -.46 23.55 -417.8% Bearish RED -.078 -.242 -.32 |
Table 3 Count of Stocks in Key Directories
20220126
-------------------------------
NEWHIGHS 78
NEWLOWS 565
MAXCP 6
MINCP 246
TTTNH 25
TTTNL 279
CPCROSSA 10
CPCROSSD 191
ACCUMVER 7
HIGHIP21 3
HIUPPCT 29
VHIP21 71
LOWACCUM 224
REDSELL 119
AUGSELS7 21
TRAPDOOR 8
|
Table 3 RANKING OF KEY DIRECTORIES BASED PCT.OF STOCKS ABOVE 65-DMA
1/26/22
Bullish = 5
Bearish = 43
---------------------------------------------------------------------------------------
Directory Current day-1 day-2 day-3 day-4 day-5
----------------------------------------------------------------------------------------
COAL 1 .833 .833 .833 1 1
COPPER .75 .875 .875 .875 .875 .875
OILGAS .714 .704 .638 .638 .723 .78
FOOD .693 .734 .714 .734 .734 .816
COMODITY .641 .692 .666 .692 .692 .794
UTILITY .564 .589 .564 .641 .641 .641
==============================================================================================
BEVERAGE .5 .571 .571 .642 .571 .642
==============================================================================================
INSURANC .48 .48 .48 .32 .56 .6
REGBANKS .48 .52 .6 .44 .48 .72
SP-100 .444 .466 .444 .444 .511 .6
BIGBANKS .428 .285 .285 .285 .285 .428
MILITARY .423 .423 .461 .384 .538 .653
DJI-13 .384 .384 .307 .307 .461 .615
DOWJONES .366 .4 .333 .366 .5 .6
FIDSTKS .343 .384 .372 .36 .449 .508
FINANCE .339 .38 .369 .357 .446 .505
INDMATER .333 .388 .416 .361 .513 .597
GOLD .304 .456 .391 .413 .521 .76
SP500 .298 .332 .334 .33 .384 .456
INDEXES .281 .297 .286 .318 .367 .372
INFRA .272 .272 .272 .272 .303 .393
HOSPITAL .25 .25 .25 .312 .312 .312
CHEM .217 .282 .26 .217 .304 .434
JETS .214 .214 .214 .214 .428 .357
HACKERS .21 .21 .21 .21 .21 .21
SOFTWARE .196 .196 .196 .214 .214 .25
ETFS .181 .181 .181 .254 .345 .327
CHINA .18 .16 .2 .2 .3 .26
EDU .166 .166 .166 .166 .166 .166
NASD-100 .164 .154 .195 .216 .268 .309
GAMING .157 .157 .21 .21 .21 .21
TRANSP .157 .157 .21 .21 .315 .263
GUNS .153 .153 .076 .076 .076 .23
NIFTY .152 .13 .173 .195 .282 .304
RUS-1000 .136 .154 .144 .144 .192 .235
REIT .13 .153 .146 .13 .2 .3
RETAIL .127 .148 .17 .106 .106 .148
ELECTRON .12 .082 .097 .097 .127 .172
AUTO .113 .113 .188 .188 .188 .283
LOWPRICE .109 .114 .094 .122 .15 .175
GREEN .105 .105 .157 .157 .105 .21
COMPUTER .1 .05 .15 .2 .35 .4
BIOTECH .098 .098 .098 .09 .104 .12
SEMI .094 .073 .126 .094 .147 .189
HIGHPRIC .065 .072 .087 .087 .116 .141
BONDFUND 0 0 0 0 .011 .022
HOMEBLDG 0 .111 .111 .055 .055 .166
MARIJUAN 0 0 0 0 0 .25
SOLAR 0 0 0 0 0 0
|
====================================================================================
====================================================================================
January 25: 6:00 AM Futures - DJI +370 NASDAQ +300
Data used for 1/25/2022
| The FED may be ready to announce a reversal away from a set
of tighter money policies. The leak about this to well-financed Professionals on Wall Street would account for the big jumps in our Closing Power in the last few days and the +400 point jump today before the Opening. The Powell crew at the FED turned on a dime on December 26th in 2018 after President Trump turned up the heat on them. This time around, I suspect that Wall Street's "cry-baby" routine was enough to get the FED to promise that they would moderate their plans for higher interest rates and a big reduction in their very bloated collection of debt intruments. If they do turn away from a tighter monetary policy to fight 7% inflation, it will be very inflationary and stocks should soar. It will make Powell seem timid and unwilling to tolerate even a 10% decline in the DJIA. Volatile tech growth stocks will quickly get the same message. If this is so, we will turn back on our QE-Infinity signals. So, today as the FED's Open Market Committee meets, we will eagerly await its outcome and how Professionals and our Closing Power behave. The key Closing Powers we watch each night are sitting on their downtrends and bear watching. If they do break above their downtrends, look for rallies by DIA, SPY, QQQ, TECL and SOXL. If the FED simply says inflation is retreating now, they may go all the way back to their 50% retracement levels and the points of recent breakdown. Instead of going long SOXL or QQQ, I would prefer to buy more Oil stocks that show high AI/200, AI/100 and IP21 scores. Buy the top ranked MAXCPs and the oil stocks whose graphs are shown just below. As for our short positions, we will cover them when their Closing Power downtrends are broken or they close more than 10% above their lows. |
||
|
Charts - 1/25/2022 2022 PEERLESS DJI, Signals, Indicators Daily DJI Volume 10-DayUp/Down Vol Stoch-20 Pct of All Stocks above 65-dma Inverted Traders Index Cum. Inverted Traders Index DJI-IPA DJI-OBV NASDAQ S&P OEX NYSE COMPQX DJI-15 DJI-20 DJI-30 DIA QQQ SPY IWM TNA Short-Term Rates DOLLAR-UUP ALLSTOCKs recent 2006 vers-Peerless signals http://tigersoftware.com/NEWPEER/UPD80126.BMP MDY - http://www.tigersoftware.com/CHARTZ/MDY.GIF USO-CrudeOil DBO FAS GLD HD IBB JETS JNUG KOL NUGT OIH PALL RSX RETL SDS AGQ SLV SOXL TAN TECL TLT TMF TNA UGA (gasoline) USO (oil) and China YINN CHAU Commodities: CANE CORN DBC JJC, NIB CORN, CUT (paper) MOO, SOYB WEAT UUP (Dollar) LIT (Lithium) STOCKS: MRNA DIS GE PYPL GME ZOM XLE NRGU AAPL ADBE ALXN AMAT AMGN AMD AMZN AXP BA BABA BAC BIDU BLDP CAT CRM CVX CMG DE ENPH FB GILD GOOG GS HD IBM INTU JPM LRCX M MRK MSFT NEM NFLX NKE NKE NVDA PG PYPL REGN REV SO SQ QCOM QDEL TSLA TXN XOM V VRTX WFC WMT ZM Bullish MAXCPs http://tigersoftware.com/UPPER/1-25/BULLISH.htm Bearish MAXCPs http://tigersoftware.com/DOWNER/1-25/BEARISH.htm |
|
POWELL shifts easily from Tight to almost "FREE Money". He does what he is told by the President and Wall Street. Inflation-fighting is not a priority. December 2018. Note how quickly market recovers to new highs.  |
| Current KEY CHARTS |
 |
 |
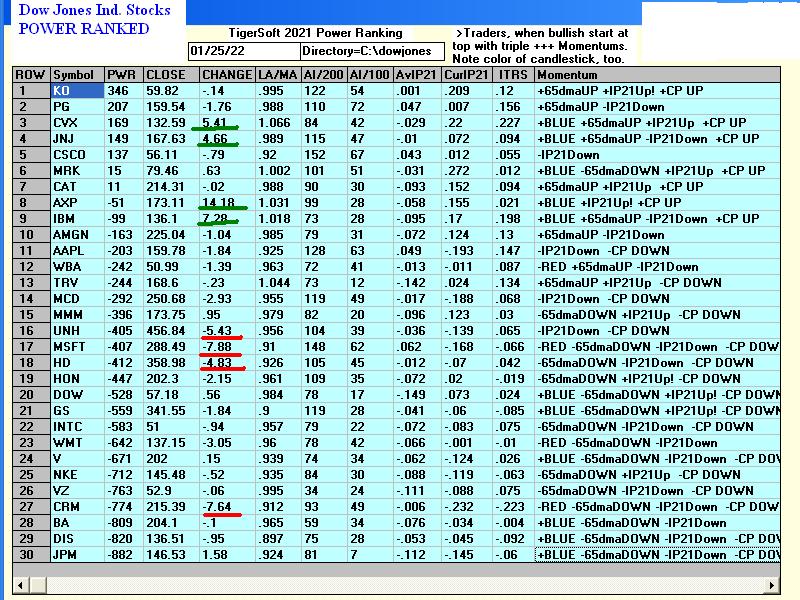 |
 |
 |
 |
 |
| |
| 3 Attractive Oil Stocks |
 |
 |
Table 1 QUICKSILVER on ETFS - 1/25//2022 Bullish = 2 - GLD Wheat Bearish = 4 - IWM, RETL, SOXL. TECL. Russia ETF CLOSE CHANGE PIVOT-PT 5-dma AROC CL-PWR CANDLE IP21 ITRS POWER INDEX ================================================================================================= DIA 342.96 -.85 350.35 -156.7% Bearish BLUE .057 0 ------ --------------------------------------------------------------------------------------------- COMPQX 13539.3 -315.83 14340.26 -342.5% Bearish RED -.141 -.092 -.233 --------------------------------------------------------------------------------------------- SPY 434.47 -5.37 451.75 -246.6% Bearish BLUE -.044 -.017 -.061 --------------------------------------------------------------------------------------------- QQQ 345.11 -8.19 366.48 -352.6% Bearish RED -.099 -.071 -.17 --------------------------------------------------------------------------------------------- MDY 472.8 -8.52 489.25 -238.5% Bearish RED -.031 -.057 -.088 --------------------------------------------------------------------------------------------- IWM 198.84 -2.69 204.45 -222.2% Bearish BLUE -.167 -.123 -.29 --------------------------------------------------------------------------------------------- FAS 120.87 .18 130.2 -639% Bearish BLUE .063 -.107 -.044 --------------------------------------------------------------------------------------------- RETL 25.28 -1.25 26.29 -310% ------- BLUE -.05 -.471 -.521 --------------------------------------------------------------------------------------------- SOXL 40.19 -5.26 50.82 -1631.5% Bearish RED -.127 -.302 -.429 --------------------------------------------------------------------------------------------- TECL 56.32 -4.18 65.94 -980% Bearish RED -.086 -.214 -.3 --------------------------------------------------------------------------------------------- IBB 127.59 -2.27 131.83 -224.2% Bearish RED -.103 -.122 -.225 --------------------------------------------------------------------------------------------- GLD 172.58 .55 172.08 93.1% ------- BLUE .224 .037 .261 --------------------------------------------------------------------------------------------- OIL 14.91 .15 14.89 13.5% Bullish BLUE -.019 .053 .034 --------------------------------------------------------------------------------------------- OIH 229.44 11.87 221.45 99% Bullish BLUE .129 .142 .271 --------------------------------------------------------------------------------------------- CPER 27.18 .08 27.09 62.5% Bullish BLUE -.078 .056 -.022 --------------------------------------------------------------------------------------------- UUP 25.7 .01 25.6 7.8% ------- RED .118 .053 .171 --------------------------------------------------------------------------------------------- CORN 22.4 .05 22.19 126.5% Bullish ---- .118 .099 .217 --------------------------------------------------------------------------------------------- WEAT 7.78 .12 7.59 286.2% Bullish ---- .232 .029 .261 --------------------------------------------------------------------------------------------- YINN 8.97 .03 9.12 -16.2% Bullish BLUE .019 -.203 -.184 --------------------------------------------------------------------------------------------- RSX 22.44 .45 23.9 -110.5% ------- BLUE -.011 -.254 -.265 |
Table 2 Count of Stocks in Key Directories
20220125
-------------------------------
NEWHIGHS 43
NEWLOWS 440 Still 10:1 - bearish ratio
MAXCP 31
MINCP 45
TTTNH 24
TTTNL 91
CPCROSSA 176
CPCROSSD 31
ACCUMVER 6
HIGHIP21 10
HIUPPCT 23
VHIP21 71
LOWACCUM 221
REDSELL 382
AUGSELS7 14
TRAPDOOR 3
|
Table 3 RANKING OF KEY DIRECTORIES BASED PCT.OF STOCKS ABOVE 65-DMA
1/25/22
Bullish = 8 Bearish = 41 --------------------------------------------------------------------------------------- Directory Current day-1 day-2 day-3 day-4 day-5 ---------------------------------------------------------------------------------------- COPPER .875 .875 .875 .875 .875 .875 COAL .833 .833 .833 1 1 1 FOOD .734 .714 .734 .734 .836 .714 OILGAS .704 .638 .638 .723 .78 .8 COMODITY .692 .666 .692 .692 .82 .692 UTILITY .589 .564 .641 .641 .641 .589 BEVERAGE .571 .571 .642 .571 .642 .714 REGBANKS .52 .6 .44 .48 .72 .92 ====================================================================================================== INSURANC .48 .48 .32 .56 .6 .76 SP-100 .466 .444 .444 .511 .6 .633 GOLD .456 .391 .413 .521 .76 .26 MILITARY .423 .461 .384 .538 .653 .73 DOWJONES .4 .333 .366 .5 .6 .6 INDMATER .388 .416 .361 .513 .597 .583 DJI-13 .384 .307 .307 .461 .615 .615 FIDSTKS .384 .372 .36 .449 .502 .585 FINANCE .38 .369 .357 .446 .5 .583 SP500 .332 .334 .33 .384 .458 .517 INDEXES .297 .286 .318 .367 .372 .394 BIGBANKS .285 .285 .285 .285 .428 .428 CHEM .282 .26 .217 .304 .434 .543 INFRA .272 .272 .272 .303 .393 .484 HOSPITAL .25 .25 .312 .312 .312 .375 JETS .214 .214 .214 .428 .357 .5 HACKERS .21 .21 .21 .21 .21 .263 SOFTWARE .196 .196 .214 .214 .25 .25 ETFS .181 .181 .254 .345 .345 .29 EDU .166 .166 .166 .166 .166 .166 CHINA .16 .2 .2 .3 .26 .28 GAMING .157 .21 .21 .21 .21 .157 TRANSP .157 .21 .21 .315 .263 .315 NASD-100 .154 .195 .216 .268 .309 .371 RUS-1000 .154 .144 .144 .192 .23 .268 GUNS .153 .076 .076 .076 .23 .384 REIT .153 .138 .138 .2 .3 .438 RETAIL .148 .17 .106 .106 .148 .148 NIFTY .13 .173 .195 .282 .326 .369 LOWPRICE .117 .091 .119 .15 .17 .16 AUTO .113 .188 .188 .188 .283 .339 HOMEBLDG .111 .111 .055 .055 .166 .277 GREEN .105 .157 .157 .105 .21 .21 BIOTECH .098 .098 .09 .104 .115 .118 ELECTRON .082 .097 .097 .127 .172 .308 SEMI .073 .126 .094 .147 .189 .315 HIGHPRIC .072 .087 .087 .116 .141 .16 COMPUTER .05 .15 .2 .35 .4 .5 BONDFUND 0 0 0 .011 .022 .022 MARIJUAN 0 0 0 0 .25 .25 SOLAR 0 0 0 0 0 0 |
====================================================================================
January 25: 5:30 AM Futures - DJI -
272 NASDAQ -295 Data used for 1/24/2022
| The operative Peerless Signal remains a Sell S16. The key index and major market ETFs all show falling Closing Powers. This means that Professionals remain preponderately bearish despite whatever spooked the wild short-covering rally today. The DJI itself was inordinately influenced by Home Depot's 14.71 point gain. So, it probably had to do with a bullish "leak" from the FED. Notice that short-term interest and 10-year rates have not risen in the last three trading days. I found 17 previous occurrences where the DJI's hypothetical low was 3.7% or more below the previous day's close and the DJI still managed to close up for the day like today. Half of these occured in the 1930s. These are almost all late in a bear market phenomenon. In five cases the DJI rose in the two-four weeks afterward but in twelve cases the DJI fell significantly to new lows. From this, I would suggest the odds are 70.6% than the DJI will make more new lows within the next month 10% or more down from the recent highs. Bullish news, like Neville Chamberlain's returning to England after meeting Hitler and saying that "there will be peace in our times" rather than war over Czechoslavakia brought about a wild reversal up in 1938. But most of the time, the reversal up gives way to a decline to a new low below the reversay's low. We see this in 1929, 1962, 1987 and 2020, for example. See these charts here. http://www.tigersoftware.com/BEARISH/BIGRDS.htm So stay short the bearish MINCPs. Be careful with your longs. Limit your potential losses here by watching for Closing Power uptrends. |
||
|
Charts - 1/24/2022 2022 PEERLESS DJI, Signals, Indicators Daily DJI Volume 10-DayUp/Down Vol Stoch-20 Pct of All Stocks above 65-dma Inverted Traders Index Cum. Inverted Traders Index DJI-IPA DJI-OBV NASDAQ S&P OEX NYSE COMPQX DJI-15 DJI-20 DJI-30 DIA QQQ SPY IWM TNA Short-Term Rates DOLLAR-UUP ALLSTOCKs recent 2006 vers-Peerless signals http://tigersoftware.com/NEWPEER/UPD80124.BMP MDY - http://www.tigersoftware.com/CHARTZ/MDY.GIF USO-CrudeOil DBO FAS GLD HD IBB JETS JNUG KOL NUGT OIH PALL RSX RETL SDS AGQ SLV SOXL TAN TECL TLT TMF TNA UGA (gasoline) USO (oil) and China YINN CHAU Commodities: CANE CORN DBC JJC, NIB CORN, CUT (paper) MOO, SOYB WEAT UUP (Dollar) LIT (Lithium) STOCKS: MRNA DIS GE PYPL GME ZOM XLE NRGU AAPL ADBE ALXN AMAT AMGN AMD AMZN AXP BA BABA BAC BIDU BLDP CAT CRM CVX CMG DE ENPH FB GILD GOOG GS HD IBM INTU JPM LRCX M MRK MSFT NEM NFLX NKE NKE NVDA PG PYPL REGN REV SO SQ QCOM QDEL TSLA TXN XOM V VRTX WFC WMT ZM Bullish MAXCPs http://tigersoftware.com/UPPER/1-24/BULLISH.htm Bearish MAXCPs http://tigersoftware.com/DOWNER/1-24/BEARISH.htm |
 |
 |
 |
 |
 |
 |
 |
 |
 |
 |
 |
 |
 |
Table 1 QUICKSILVER on ETFS - 1/24//2022 Bullish = 3 - GLD Wheat CORN Bearish = 4 - IWM, RETL, SOXL. Russia ETF CLOSE CHANGE PIVOT-PT 5-dma AROC CL-PWR CANDLE IP21 ITRS POWER INDEX
=================================================================================================
DIA 343.81 1.46 353.85 -218.6% Bearish BLUE .008 ---- -----
---------------------------------------------------------------------------------------------
SPY 439.84 1.86 456.49 -275.5% Bearish BLUE -.058 -.003 -.061
---------------------------------------------------------------------------------------------
QQQ 353.3 1.61 370.55 -364.8% Bearish BLUE -.078 -.045 -.123
---------------------------------------------------------------------------------------------
MDY 481.32 9.02 495.88 -259.6% Bearish BLUE -.029 -.034 -.063
---------------------------------------------------------------------------------------------
IWM 201.53 4.54 207.83 -311.9% Bearish BLUE -.181 -.103 -.284
---------------------------------------------------------------------------------------------
FAS 120.69 1.16 137.1 -986.2% Bearish BLUE .01 -.1 -.09
---------------------------------------------------------------------------------------------
RETL 26.53 3.97 26.84 -429.7% ------- BLUE -.033 -.426 -.459
---------------------------------------------------------------------------------------------
SOXL 45.45 1.74 55.98 -1822.9% Bearish BLUE -.084 -.168 -.252
---------------------------------------------------------------------------------------------
TECL 60.5 .93 68.79 -1026.5% Bearish BLUE -.072 -.144 -.216
---------------------------------------------------------------------------------------------
IBB 129.86 1.18 133.46 -342.5% Bearish BLUE -.075 -.106 -.181
---------------------------------------------------------------------------------------------
GLD 172.03 .94 169.39 69.1% ------- BLUE .241 .041 .282
---------------------------------------------------------------------------------------------
OIL 14.76 -.14 14.87 37.1% Bullish ---- -.038 .044 .006
---------------------------------------------------------------------------------------------
OIH 217.57 4.11 225.1 -240.3% Bullish BLUE .063 .085 .148
---------------------------------------------------------------------------------------------
CPER 27.1 -.35 26.84 0% ------- BLUE -.062 .08 .018
---------------------------------------------------------------------------------------------
UUP 25.69 .08 25.66 37.1% ------- ---- .08 .056 .136
---------------------------------------------------------------------------------------------
CORN 22.35 .09 21.84 118% Bullish BLUE .259 .094 .353
---------------------------------------------------------------------------------------------
WEAT 7.66 .22 7.35 351% Bullish BLUE .294 .027 .321
---------------------------------------------------------------------------------------------
YINN 8.94 -.43 9 -219.1% ------- ---- .032 -.119 -.087
---------------------------------------------------------------------------------------------
RSX 21.99 -1.02 22.95 -608.7% Bearish BLUE -.085 -.259 -.344
|
Table 2 Count of Stocks in Key Directories
20220124
-------------------------------
NEWHIGHS 25
NEWLOWS 2547
MAXCP 10
MINCP 66
TTTNH 20
TTTNL 207
CPCROSSA 286
CPCROSSD 11
ACCUMVER 7
HIGHIP21 9
HIUPPCT 17
VHIP21 71
LOWACCUM 247
REDSELL 252
AUGSELS7 15
TRAPDOOR 10
|
Tabke 3 RANKING OF KEY DIRECTORIES BASED PCT.OF STOCKS ABOVE 65-DMA
1/24/22
Bullish = 8 Bearish = 41 --------------------------------------------------------------------------------------- Directory Current day-1 day-2 day-3 day-4 day-5 ---------------------------------------------------------------------------------------- COPPER .875 .875 .875 .875 .625 .875 COAL .833 .833 1 1 1 1 FOOD .714 .734 .734 .836 .734 .673 COMODITY .666 .692 .692 .82 .641 .666 OILGAS .638 .638 .723 .78 .8 .828 REGBANKS .6 .44 .48 .72 .92 .92 BEVERAGE .571 .642 .571 .642 .714 .785 UTILITY .564 .641 .641 .641 .589 .641 ================================================================================================= INSURANC .48 .32 .56 .6 .76 .92 MILITARY .461 .384 .538 .653 .73 .769 SP-100 .444 .444 .511 .6 .633 .733 INDMATER .416 .361 .513 .597 .555 .694 GOLD .391 .413 .521 .76 .239 .347 FIDSTKS .372 .36 .449 .502 .585 .662 FINANCE .369 .357 .446 .5 .583 .66 SP500 .334 .33 .384 .458 .517 .603 DOWJONES .333 .366 .5 .6 .6 .733 DJI-13 .307 .307 .461 .615 .615 .769 INDEXES .286 .318 .367 .372 .394 .502 BIGBANKS .285 .285 .285 .428 .428 .571 INFRA .272 .272 .303 .393 .484 .606 CHEM .26 .217 .304 .434 .521 .586 HOSPITAL .25 .312 .312 .312 .375 .687 JETS .214 .214 .428 .357 .5 .857 GAMING .21 .21 .21 .21 .157 .052 HACKERS .21 .21 .21 .21 .263 .315 TRANSP .21 .21 .315 .263 .315 .684 CHINA .2 .2 .3 .26 .26 .28 SOFTWARE .196 .214 .214 .25 .25 .321 NASD-100 .195 .216 .268 .309 .371 .443 AUTO .188 .188 .188 .283 .339 .49 ETFS .181 .254 .345 .345 .309 .509 NIFTY .173 .195 .282 .326 .369 .391 RETAIL .17 .106 .106 .148 .148 .234 EDU .166 .166 .166 .166 .166 .333 GREEN .157 .157 .105 .21 .21 .157 COMPUTER .15 .2 .35 .4 .5 .55 RUS-1000 .144 .144 .192 .23 .27 .341 REIT .138 .13 .207 .3 .438 .584 SEMI .126 .094 .147 .189 .315 .463 HOMEBLDG .111 .055 .055 .166 .277 .5 BIOTECH .098 .09 .104 .115 .118 .156 ELECTRON .097 .097 .127 .172 .308 .428 LOWPRICE .094 .117 .147 .17 .16 .183 HIGHPRIC .087 .087 .116 .141 .16 .247 GUNS .076 .076 .076 .23 .384 .384 BONDFUND 0 0 .011 .022 .022 .045 MARIJUAN 0 0 0 .25 .25 .25 SOLAR 0 0 0 0 0 0 |
 Status and Count of Optimized Red Signals
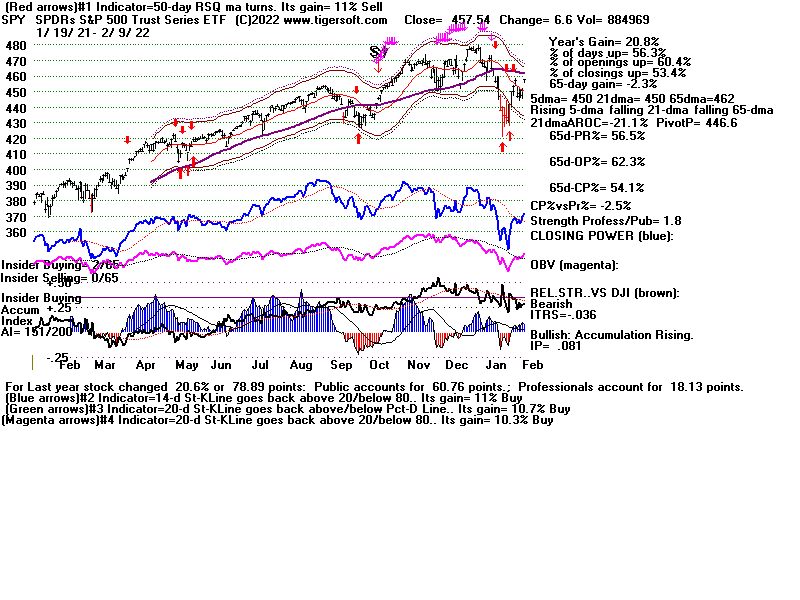
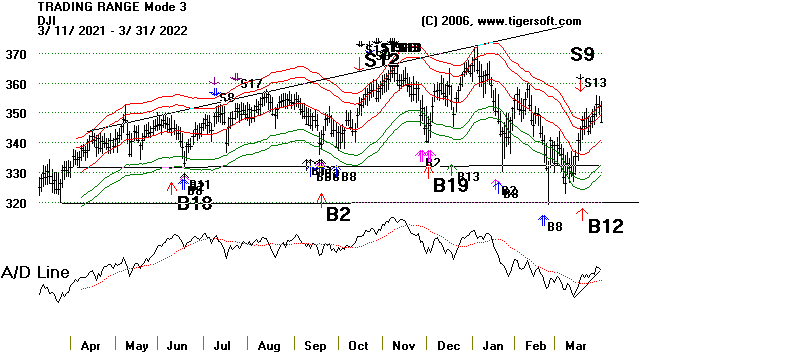
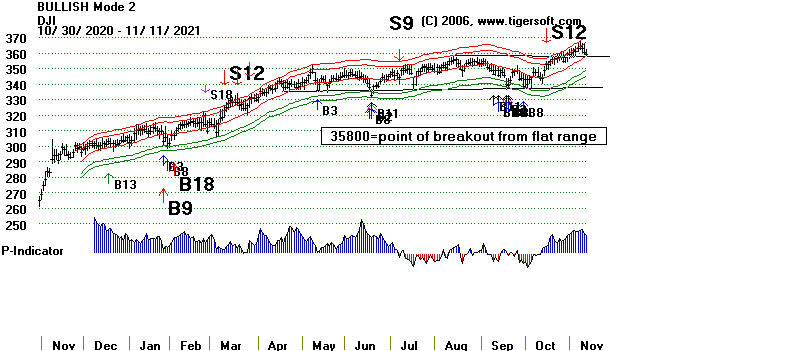
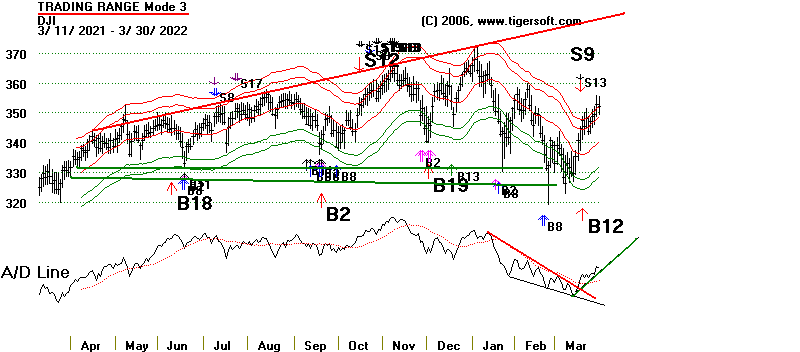
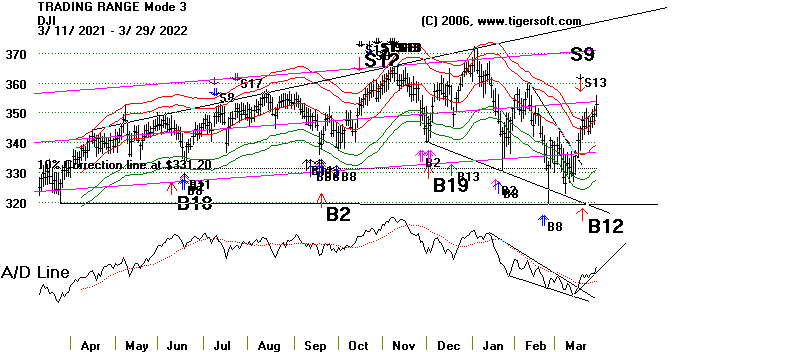
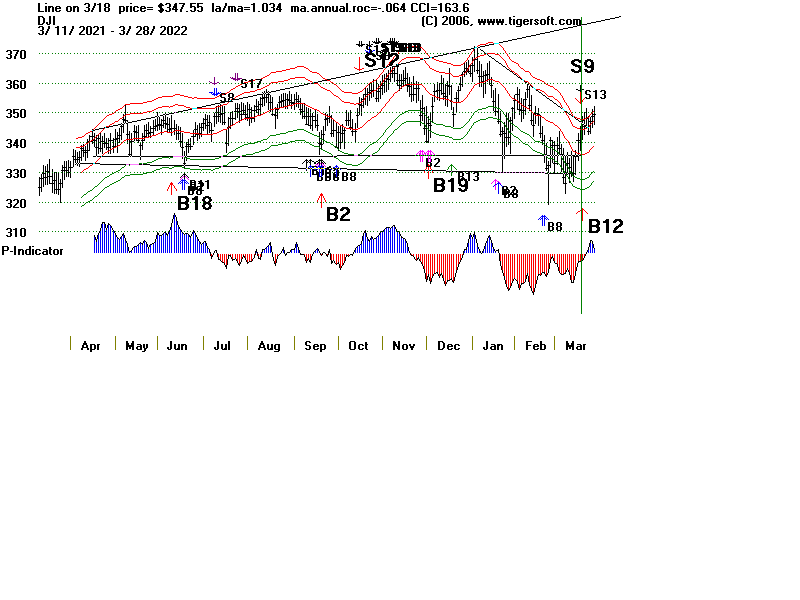
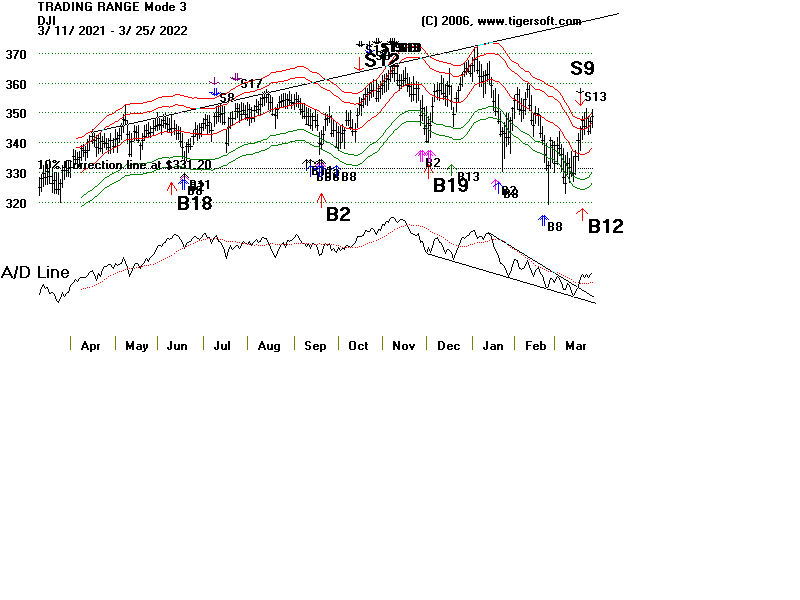
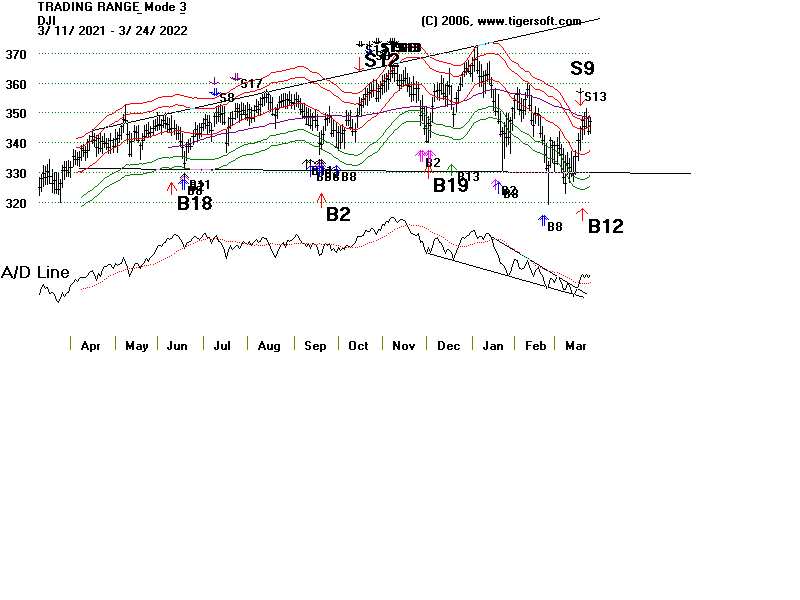
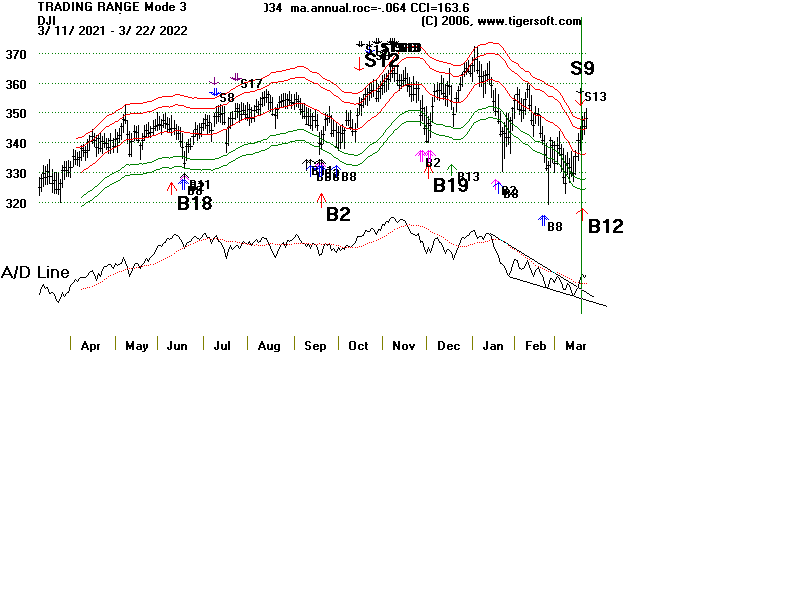
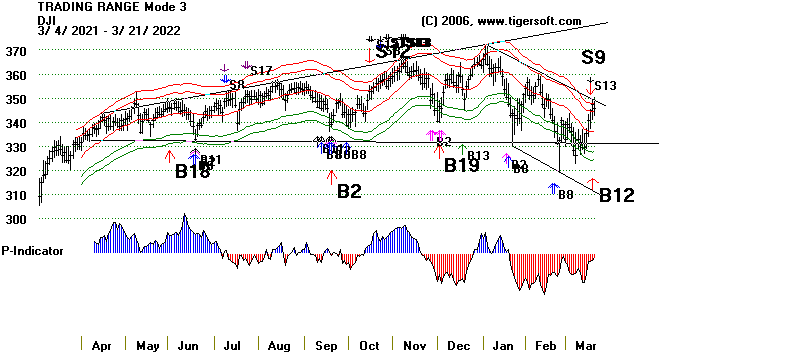
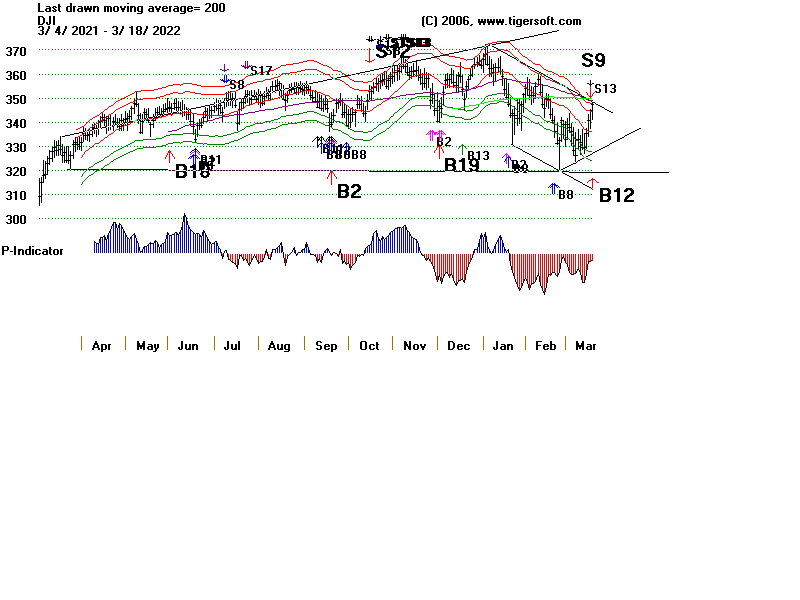
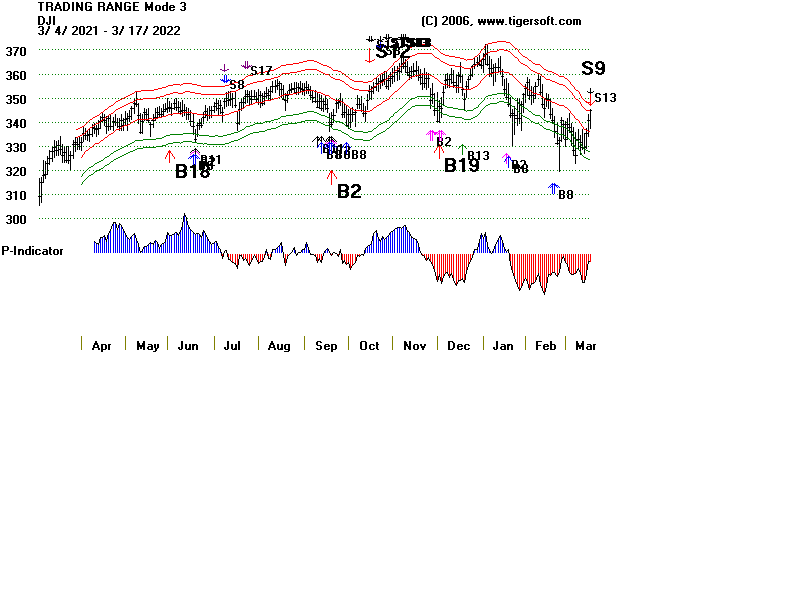
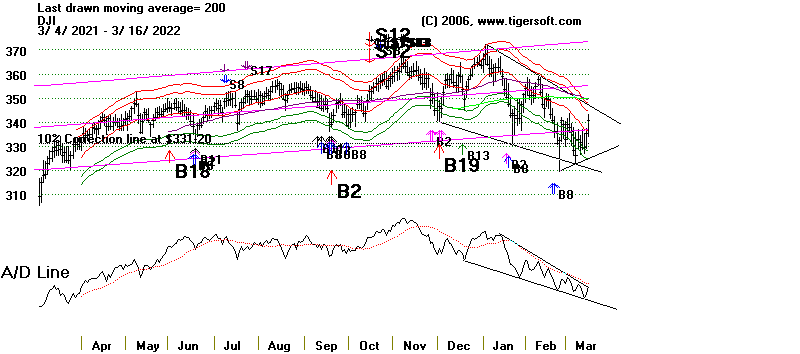
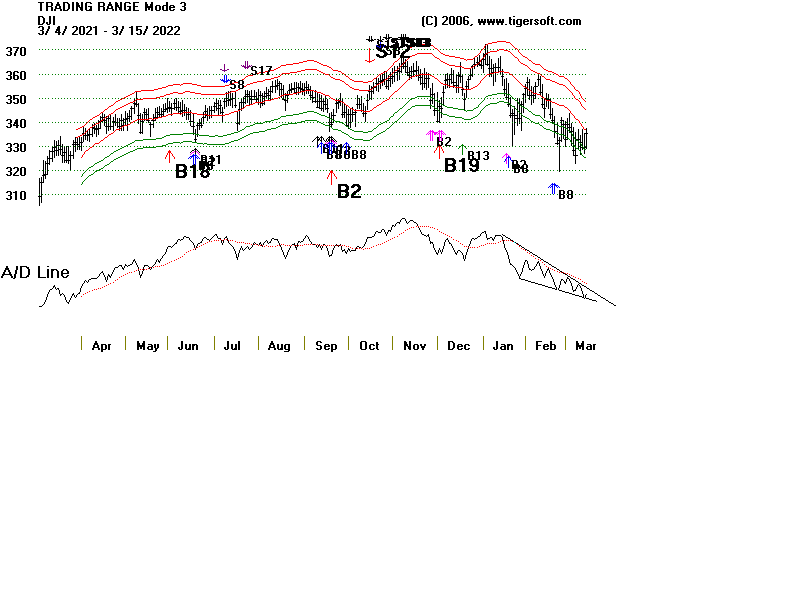
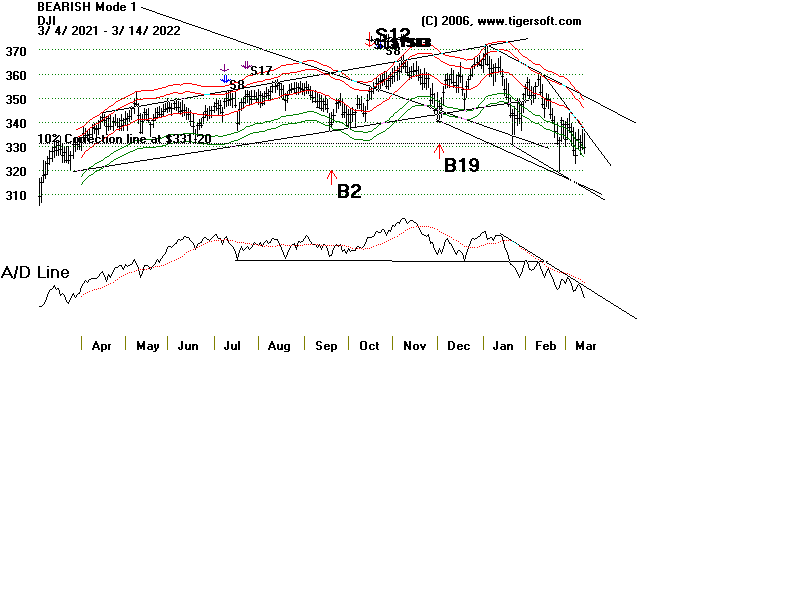
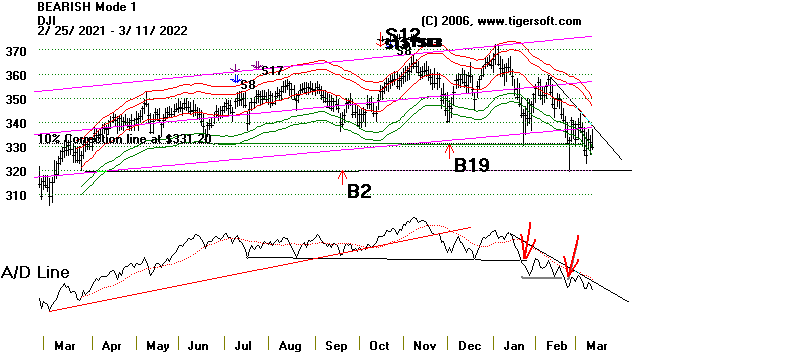
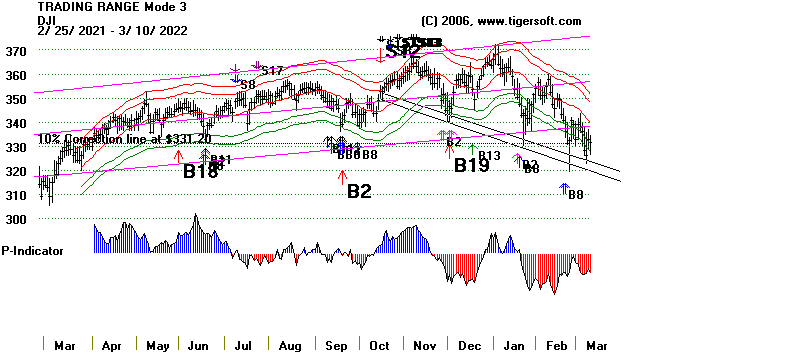
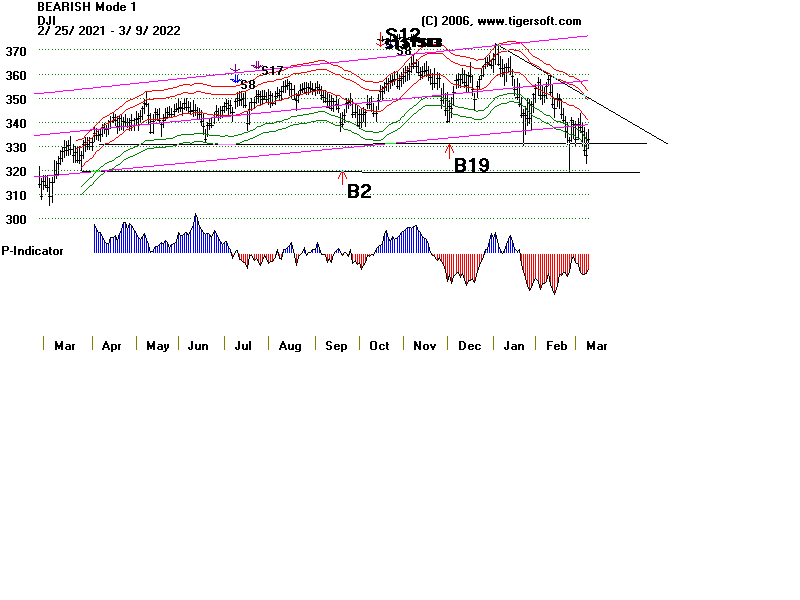
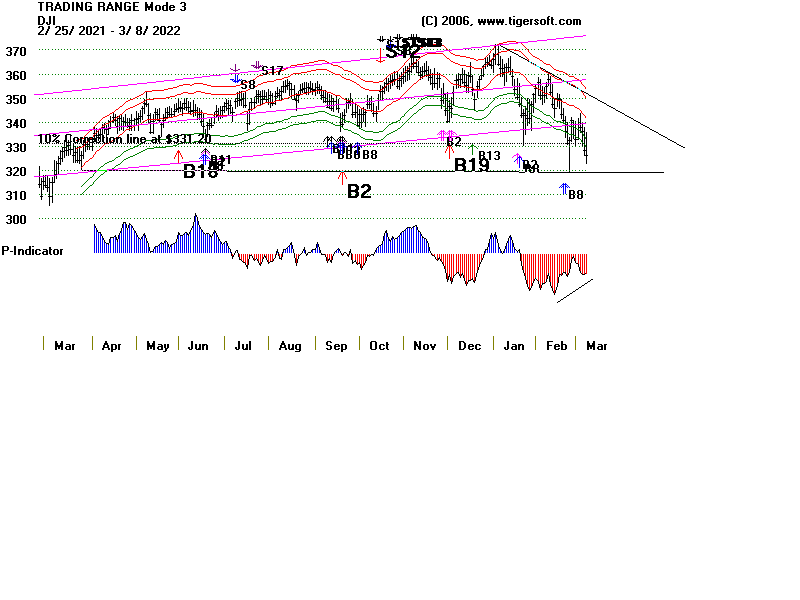
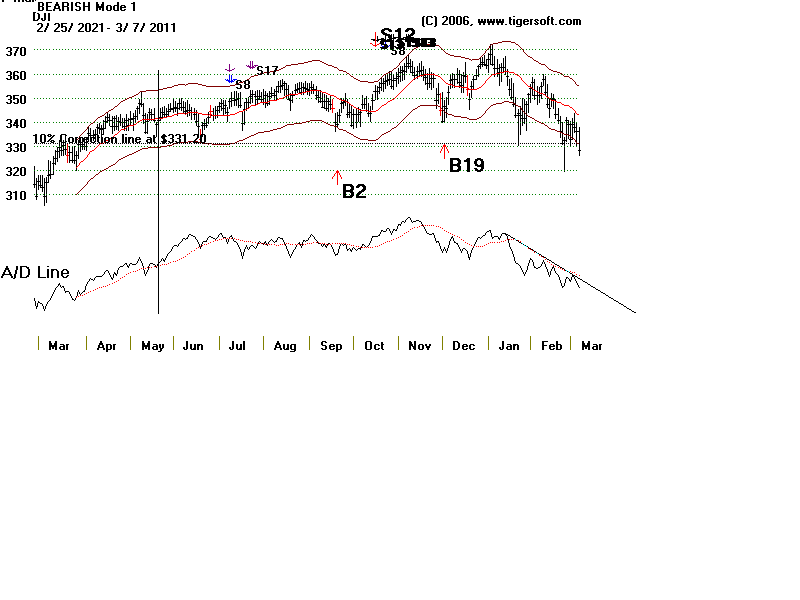
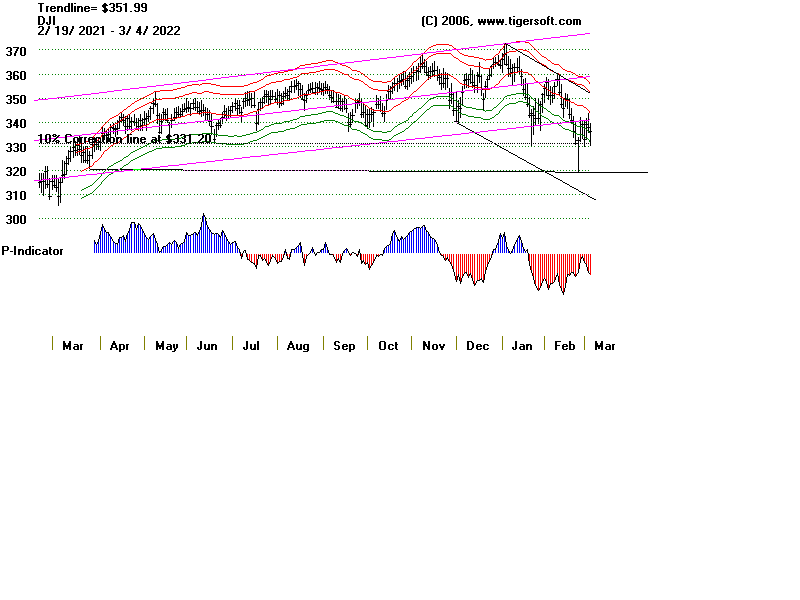
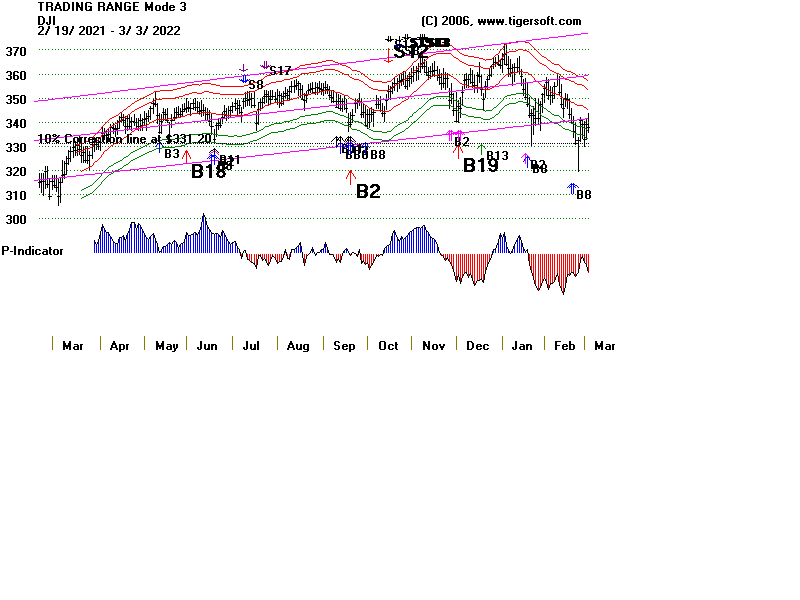
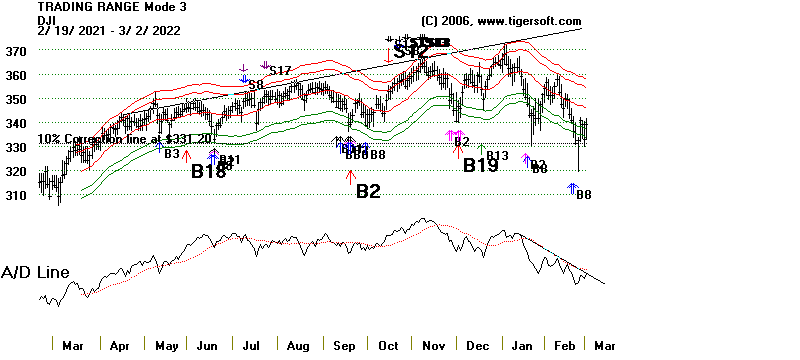
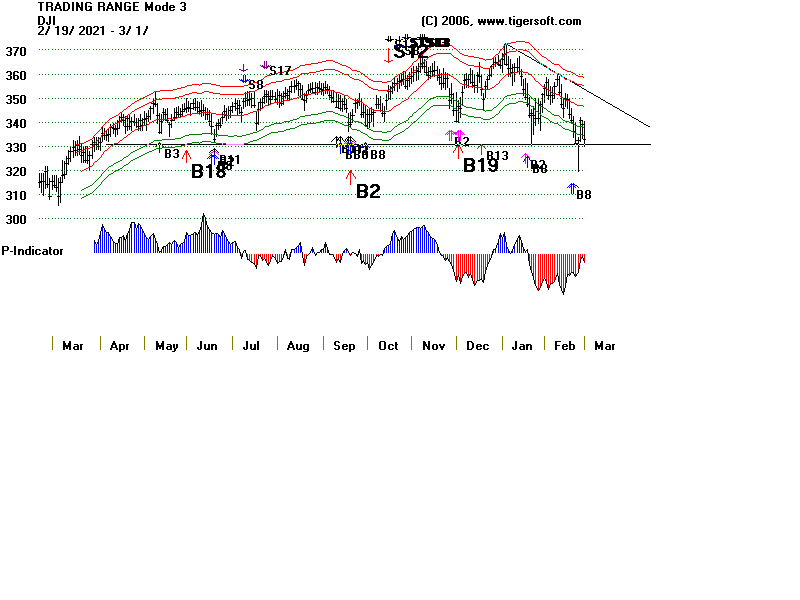
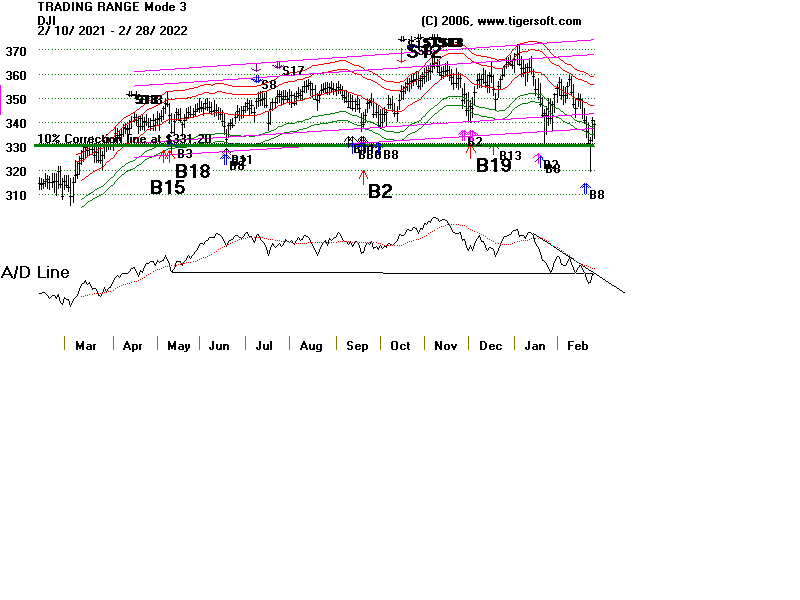
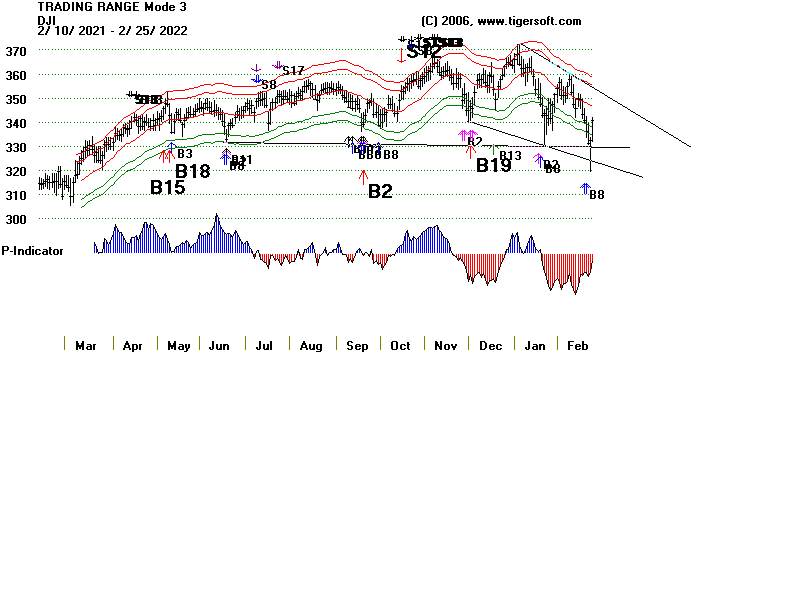
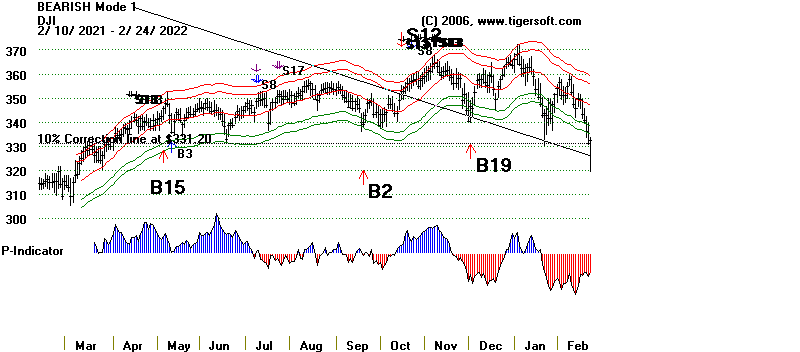
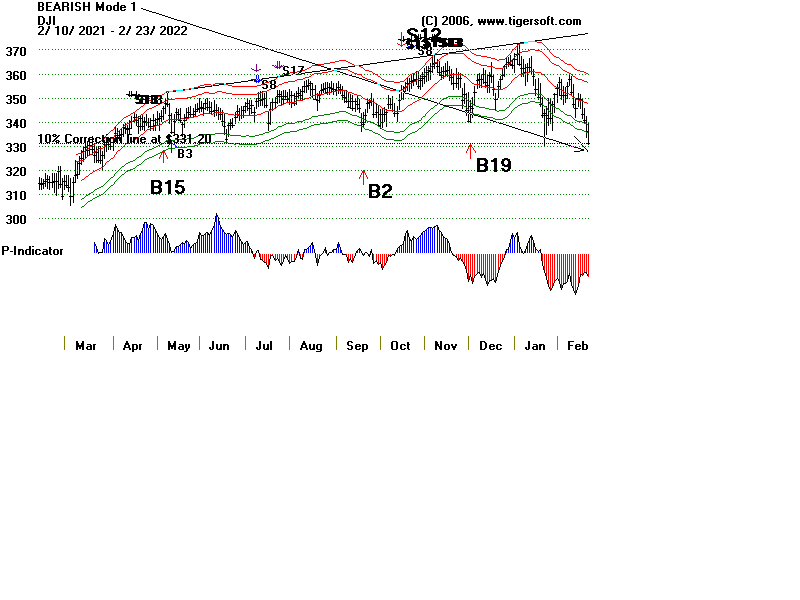
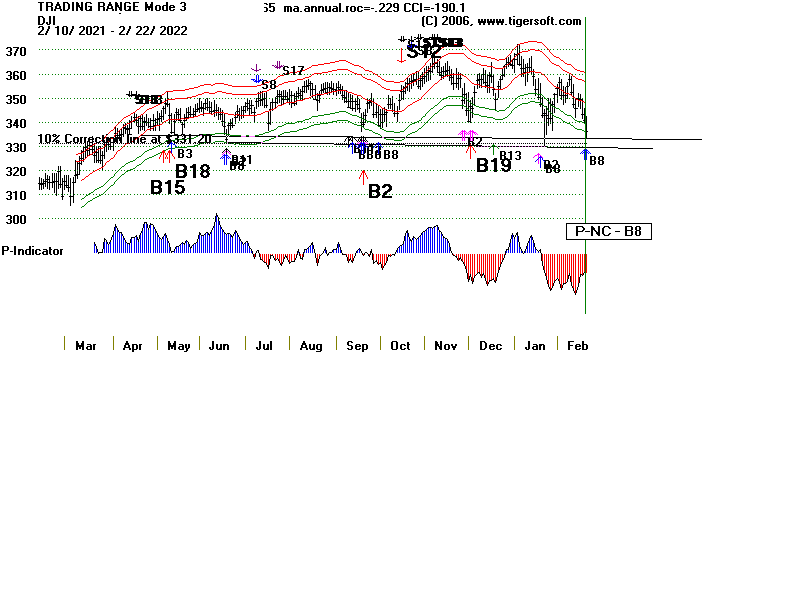
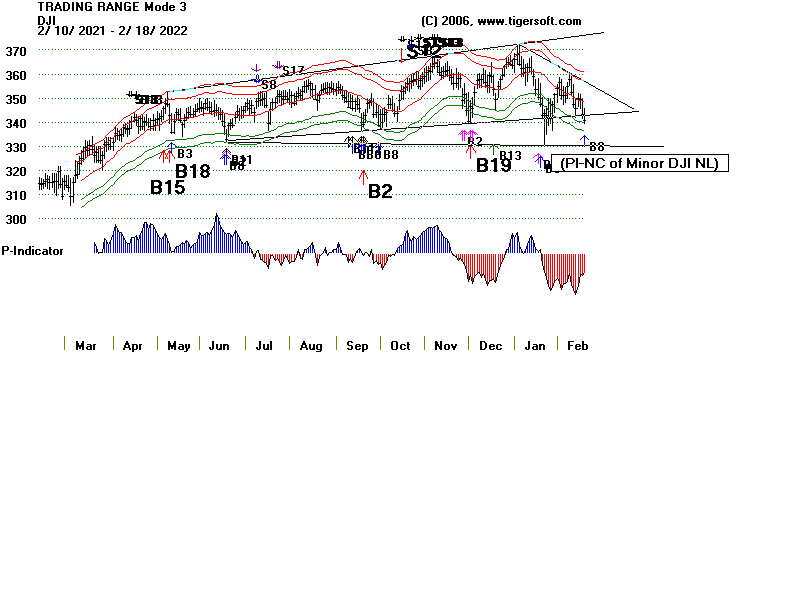
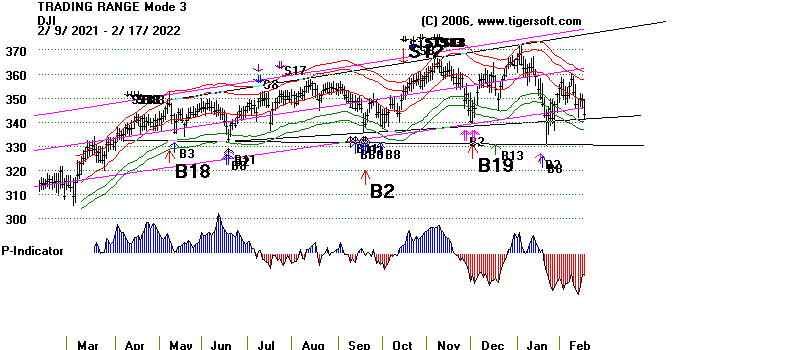
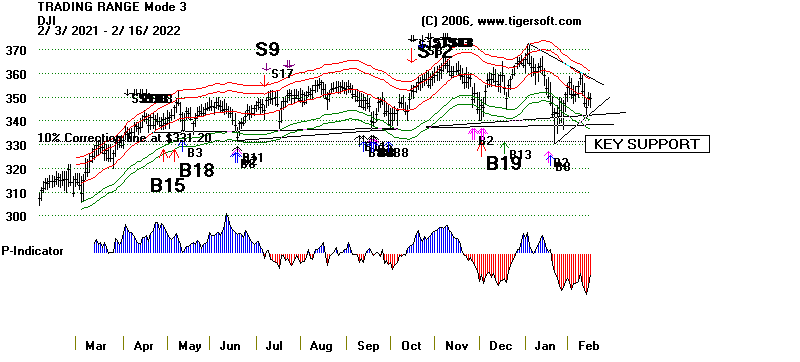
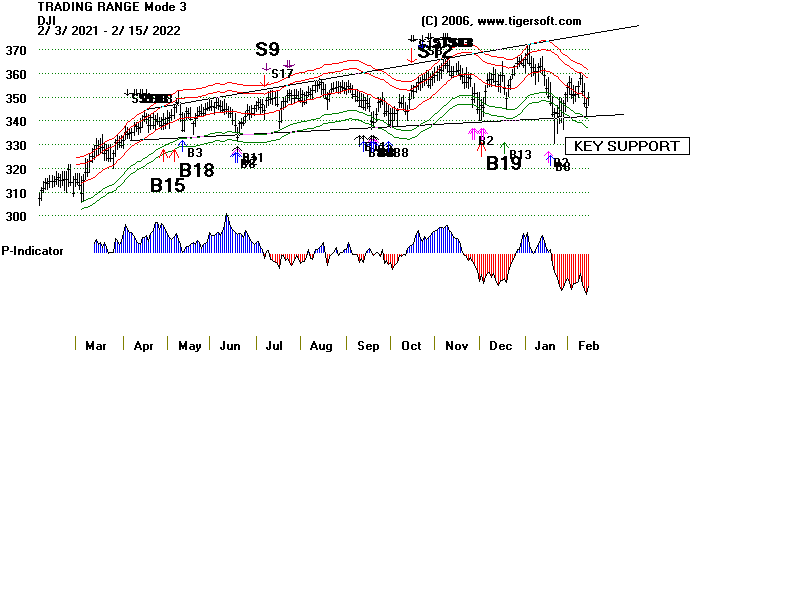
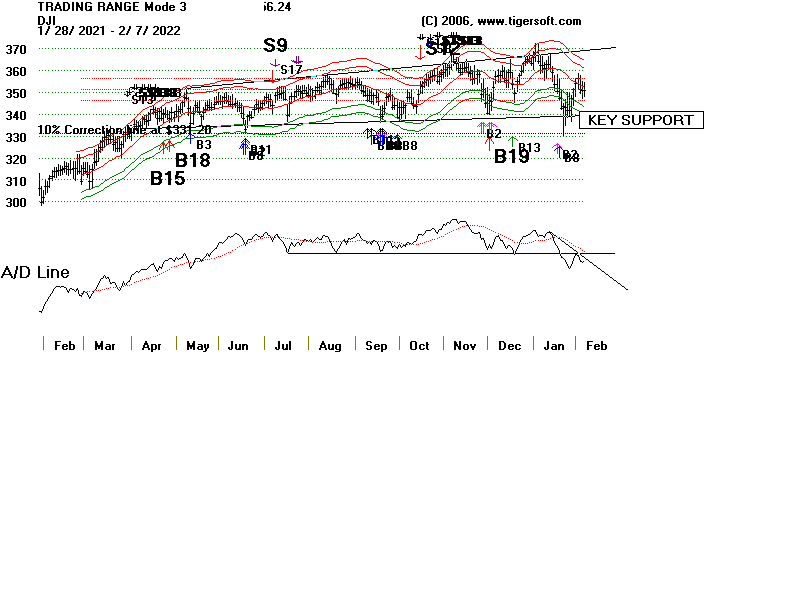
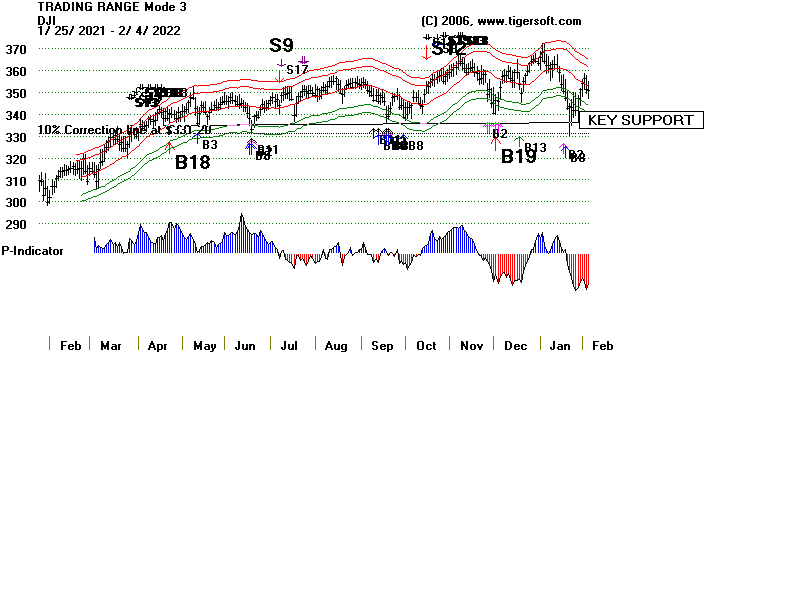
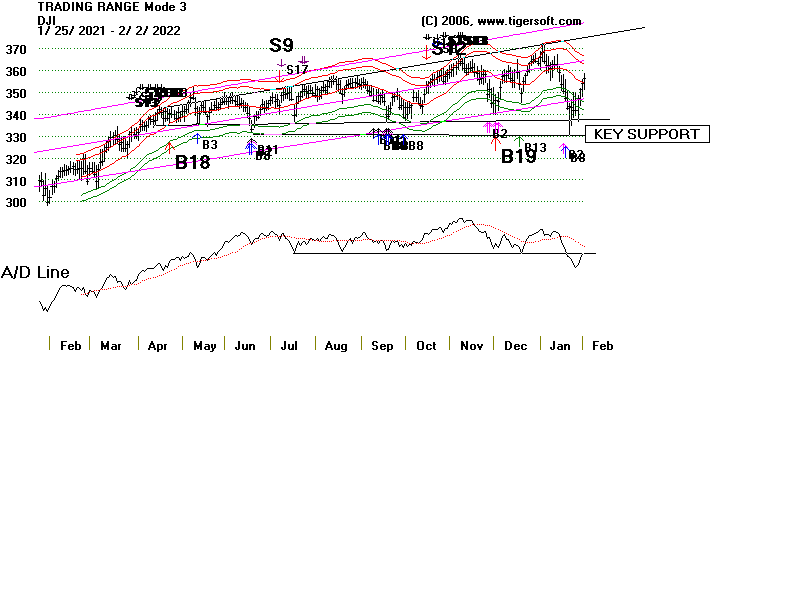
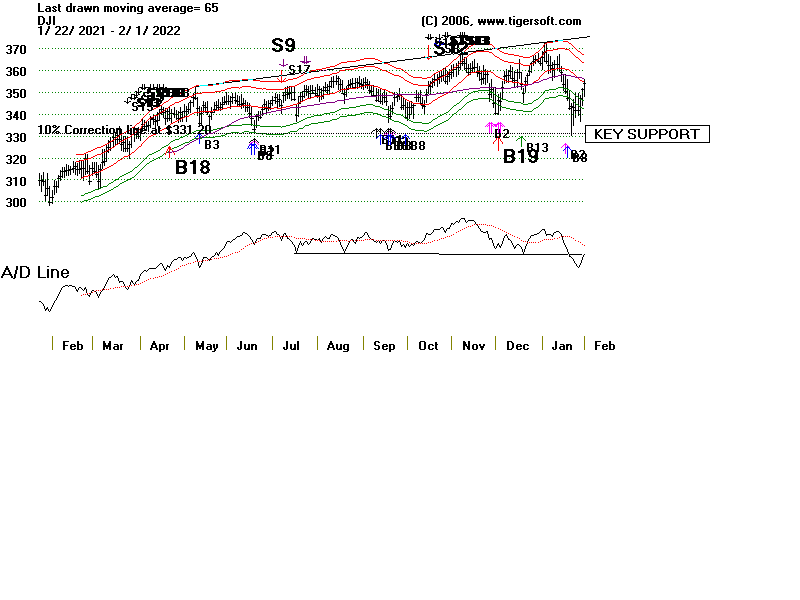
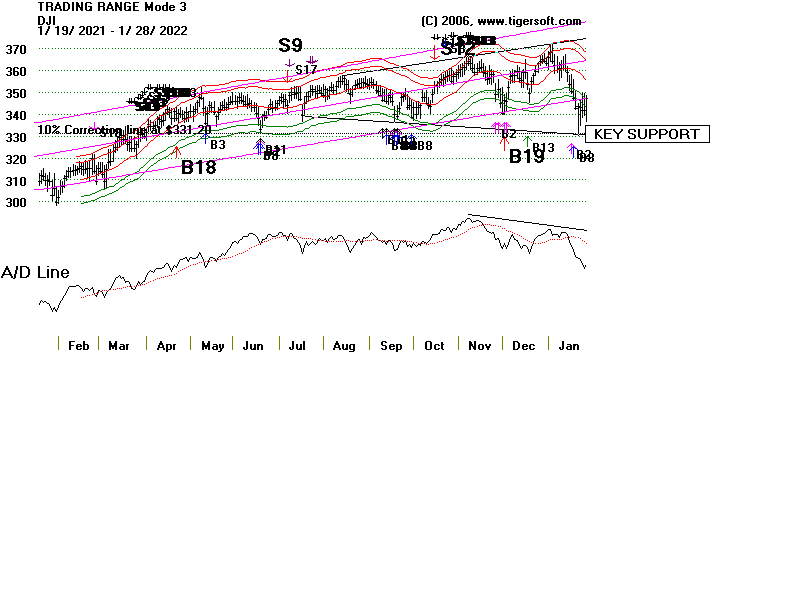
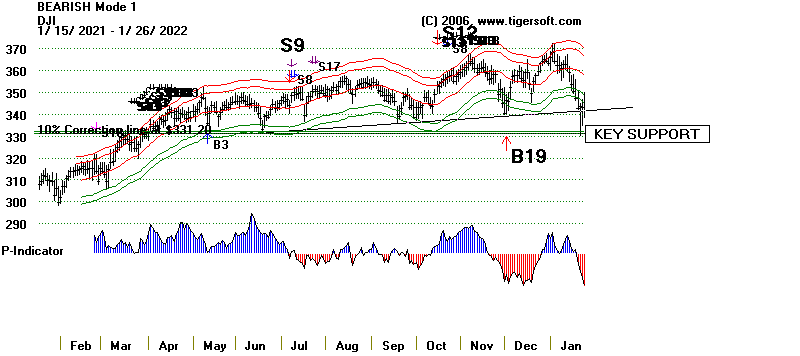
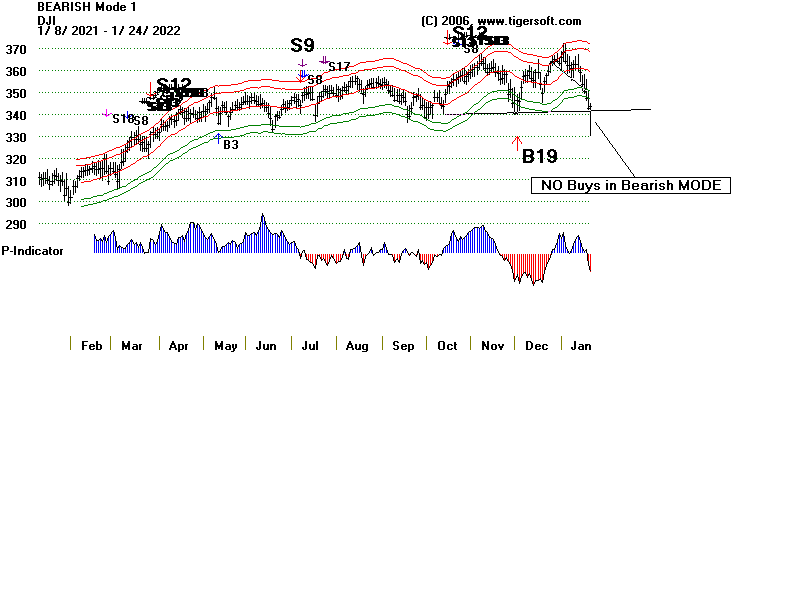