BEARISH HEAD AND
SHOULDERS PRICE PATTERNS
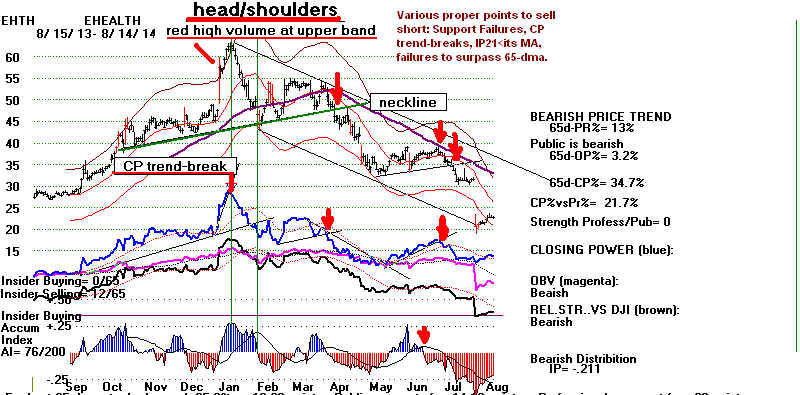
Recognizing head/shoulders patterns and
learning how
to play them is a key part of making successful short sale
trades. First, recognize the pattern. After the first
decline,
there is often a weak rally back to the 65-dma. When prices
turn back down from it, sell short again when the IP21 drops
below its 21-dma or the Closing Power breaks its minor uptrend.
You can also wait for prices to break their minor support.
This decline will often test the bottom of the developing down-
trend channel. EHTH below shows these developments in
a
a still uptrending general market. Properly taken short
sales
can be quite profitable even in what is a bull market for the DJI
or SP-500.
Recognizing
Head/Shoulder Tops.
Our software does not automatically spot head/shoulders tops.
You will need to
be able to spot them
yourself. Look at the charts in this section. See the variations
on this theme that they
provide. This will help you gain the necessary confidence
to recognize and trade them.
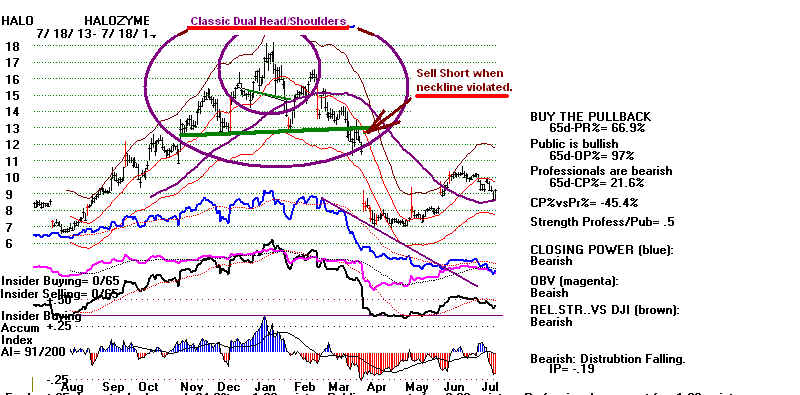
Neckline and 65-dma Violations Ordinarily Complete The Pattern
A close below the
neckline and also the 65-dma completes the pattern and
increases the chances
for a significant decline. Quite a few head/shoulders
patterns turn back up
from the 65-dma if the Accumulation is high
or there is no major
Peerless sell at the same time.
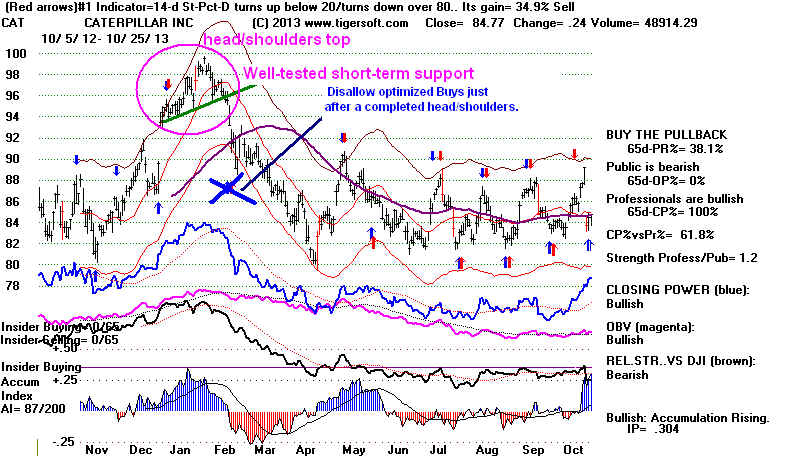
In bear markets when
the DJI declines more than 20%, having a high
Accumulation Index will
not save a stock with a clear head/shoulders
pattern from falling
dramatically. Examples in 1987: AVP, BMS and CAT
and in 1990: AET, BA,
IPG, JCC, NSM and PEP. When there have
not been multiple
Peerless Sells and a support failure, avoid shorting
stocks that show high
Accumulation.
(See http://www.tigersoft.com/KSS-ShortSaleBook/1987-HS/index.html
and www.tigersoft.com/KSS-ShortSaleBook/1990-HS/index.html )
Sample head/shoulders:
What Accentuates the Bearishness in A H/S
Pattern
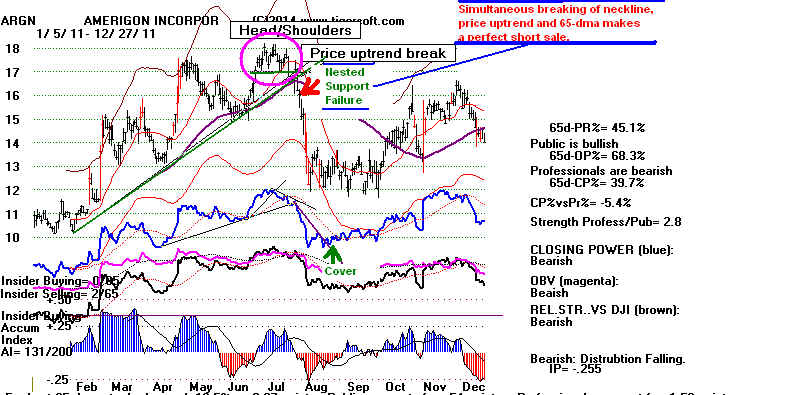
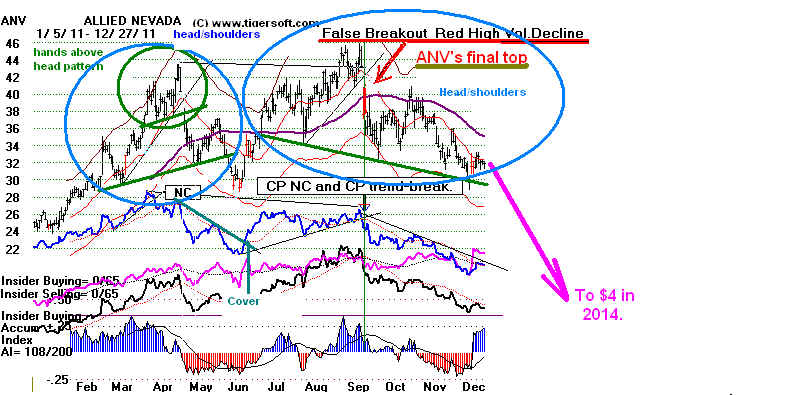
Head/shoulders are more
likely to bring short sales profits if there has
been an earlier H/S
pattern in the year. This increases the bearish potential.
It shows more
distribution. Avoid big losses with a H/S pattern by
vowing
to cover if the stock
closes back above the 65-dma and the Closing Power
is no longer in a
downtrend. When Red Distribution is still very
apparent,
use a close by the
stock above the previous right shoulder's apex to close
out short positions.
See ANV below in June 2011.
Downside Potential
Classic technical
analysis says the height ot the price pattern from its
apex down to the
neckline gives a point-count that should be applied from where
the neckline is finally
broken. This calculates the so called "minumum
downside price
objective" for a completed H/S pattern.
In a "normal" intermediate-term
decline by the DJI of 8%-13.5%,
it is amazing how often
this is exactly how far prices do drop before
turning back up.
Consider 1988, a year when declines by the DJI
did not exceded 12%.
Examples where post-H/S
decline fell just to minimum downside objective:
1988 AA, CLX,
CPB, DD, DOW, DUK, FDX, HAL, HUM, JCP. KMB,
NOC, NUE, R, RRD, SUN
(n=16)
Contrary examples where
the post H/S decline fell significantly below the
minimum downside
objective:
1988: AAPL, BHI, HRL,
PPL, RSH, SHW (n=6)
Examples where
the post H/S decline failed to fulfill minimum downside objective
1988: BA, MMM,
MWV, UTX (n=4)
(See http://www.tigersoft.com/KSS-ShortSaleBook/1988-HS/index.htm
)
Understand that in a serious DJI decline,
prices will mostly drop far below
minimum downside
objective. See
1987: AA, CAT, CI,
DIS, F, GD, HES, HON, HUM. IFF, JWN, K, KO,
LNC, LOW, LUV, MAT,
MHP, MKC, MO, MRK, MUR, NTRS, NYT,
RRD, RSH, S,
SIAL, SNA, TAP, TMO, TXN, USB, UTX, WAG, X (n=36)
in 1987, prices only
fulfilled their downside objective in two cases:
CLX, PEN
(See http://www.tigersoft.com/KSS-ShortSaleBook/1987-HS/index.html
)
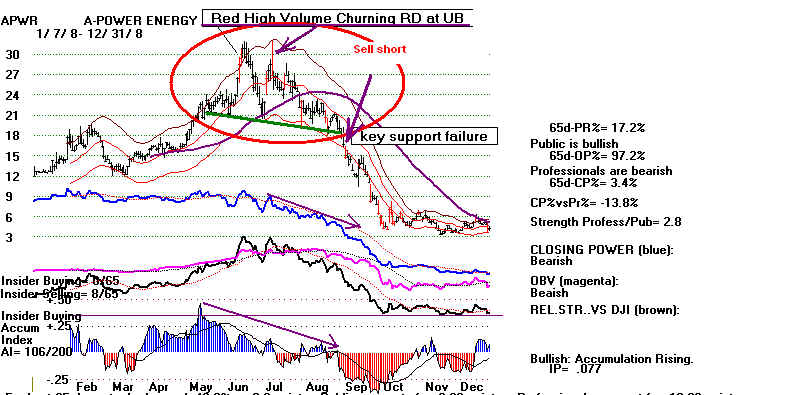
Markedly lower Accumulation on the right
shoulder adds to the bearishness,
as does a price gap
down on red high volume when the neckline is broken.
Most of the significant
H/S patterns are built over a 3-week to 6 month
time interval.
But be aware of the "mighty mouse" miniature patterns
that last only 10 or 12
days and the weekly head/shoulders patterns that
can last longer than 30
weeks to complete.
Earlier head/shoulders patterns in the
same year, definitely ripen a
stock for an even
bigger decline. The same thing is true when a larger
head/shoulders pattern
has imbedded smaller patterns built into
its formation.
See the 1987 H/S
patterns for many examples of both
of these phenomenona.
When Peerless gives a
Sell and the DJI declines, stocks with H/S
patterns normally go
down much more quickly than other stocks
once the neckline is
broken. I have studied the H/S patterns in SP-500
stocks from 1987 to
2012. Any glance at this many H/S patterns should
convince you about the
reliability of usefulness as bearish signs
to sell short.
A
Multi-Varied Pattern
As you can see from
these many examples, perfect symmetry between
the right and left
shoulder is relatively rare. And does not matter much.
The same is true
whether the neckline slopes moderately up or down.
More important is the
amount of red Distribution on the right shoulder.
Its presence confirms
the pattern's bearishness from the point of view of
insiders and their
friends. Very Blue Accumulation Index readings will not
prevent a H/S shoulder
from bringing a significant decline in a weak
general market, but
will help hold the stock up if the general market
is not weak.
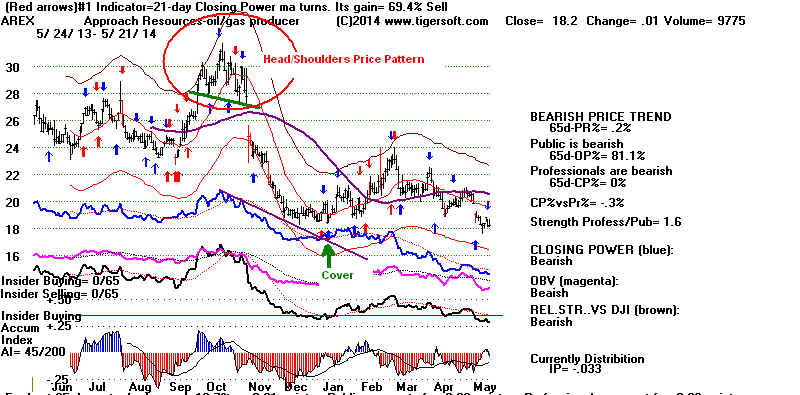
Often the H/S price
pattern forms way above the 65-dma. When this
happens, the decline
often stops at the rising 65-dma. The 65-dma
often acts as support
even after a H/S pattern's decline has been
violated. For
this reason, it is usually best to not consider a H/S price
pattern completed until
the 65-dma is closed below.
When prices do break the neckline and the
65-dma, they usually
fall quickly.
However, in perhaps 35% of the cases there is a
"pullback"
back up to the broken neckline or 65-dm before the
decline resumes in
earnest. We like to short these as soon as
the Closing Power hooks
back down when prices have failed at
the 65-dma.
H/S patterns can occur in any general market environment. They can
cap a long bull market
or occur on a brief rally in the middle of a
bear market. Head/shoulders often appear with
the DJI, SPY, NASDAQ, NYSE
and OEX. When
prices rupture the neckline, they produce very tradeable declines.
All the averages
produced compact H/S patterns right before the
mini-crash of 2010.
Many traders come to rely on them, perhaps, too much.
Stocks and general
markets can also decline without their appearance.
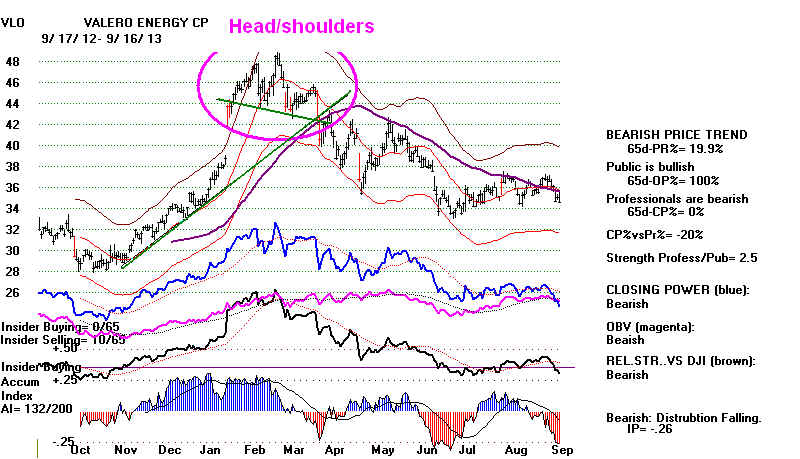
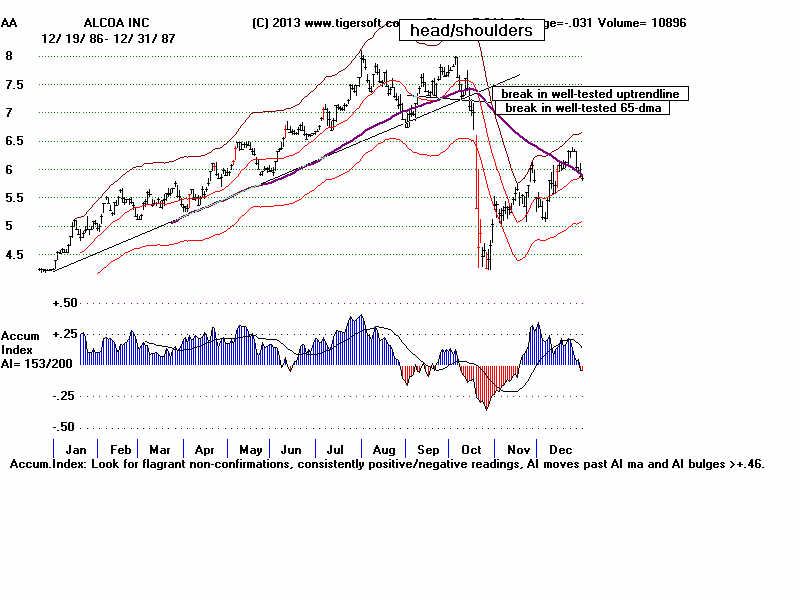
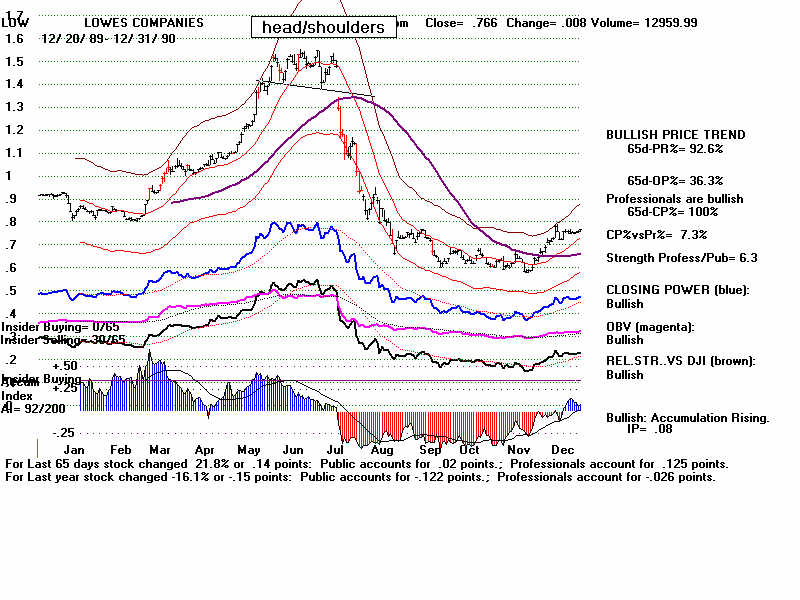
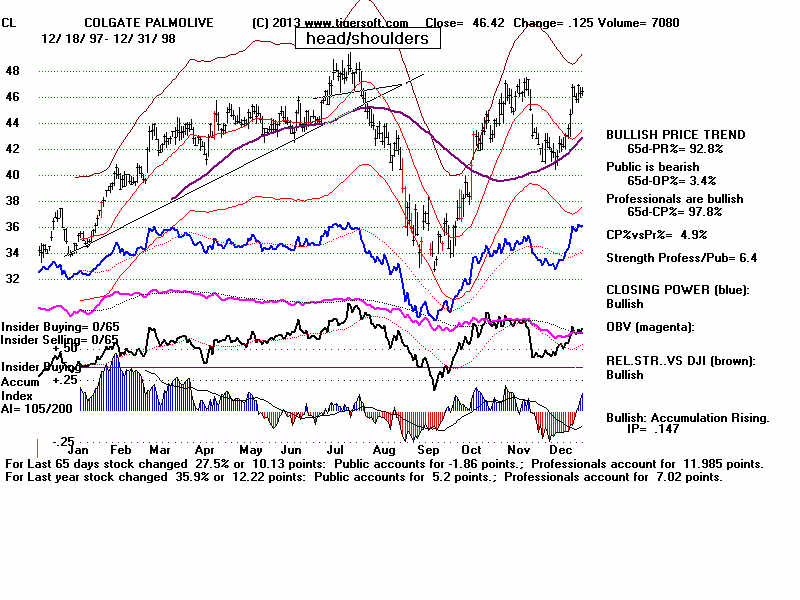
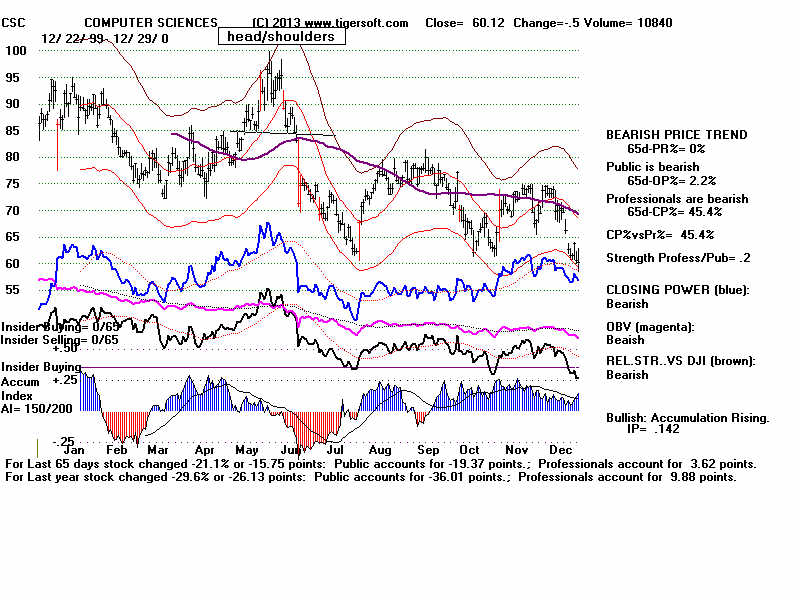
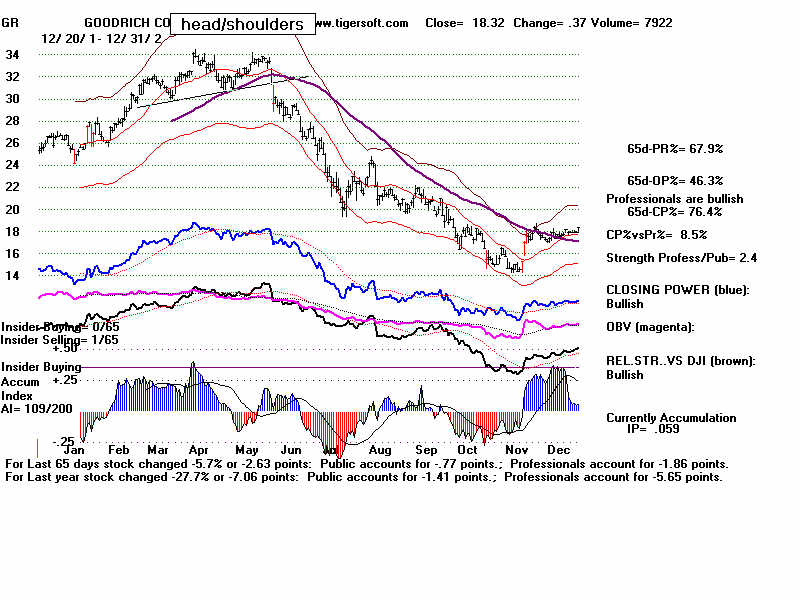
. Compare the outcome of the completed
head/shoulders pattern
in VLO (below) during
the 2013 bull market with head/shoulders patterns
at the start of general
bear markets in 1987(AA),
1990(LOW), 1998 (CL),
2000 (CSC), 2002 (GR) and 2008
(HOT).
It is a fact that these
patterns cannot be searched for by the computer,
except to examine one
by all the stocks that have just violated their 21-day
or 65-dma. Then
note the ones that have just completed a head/shoulders pattern.
While this sometimes
making a short sale a day or two after the neckline has
been violated, the
Power Ranker lets you easily find the weakest of these,
those with the lowest
IP21 score and those with the bearish "Both Down"
condition (both Opening
and Closing Power are falling.)
Examples
See DJIA Head/shoulders
patterns
SPY Head/shoulders
patterns
a
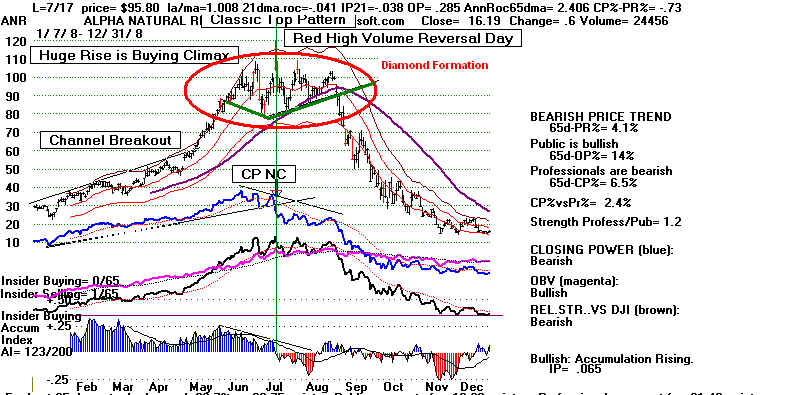
Diamond Top Patterns and Hands-above-the-Head Patterns are really variations
of the classic Head/Shoulders pattern.
The same rules apply.